Chesterfield, MO Map & Demographics
Chesterfield Map
Chesterfield Overview
$75,489
PER CAPITA INCOME
$175,592
AVG FAMILY INCOME
$137,052
AVG HOUSEHOLD INCOME
44.8%
WAGE / INCOME GAP [ % ]
55.2¢/ $1
WAGE / INCOME GAP [ $ ]
$11,720
FAMILY INCOME DEFICIT
0.46
INEQUALITY / GINI INDEX
49,645
TOTAL POPULATION
24,012
MALE POPULATION
25,633
FEMALE POPULATION
93.68
MALES / 100 FEMALES
106.75
FEMALES / 100 MALES
47.1
MEDIAN AGE
2.9
AVG FAMILY SIZE
2.4
AVG HOUSEHOLD SIZE
25,598
LABOR FORCE [ PEOPLE ]
62.6%
PERCENT IN LABOR FORCE
3.1%
UNEMPLOYMENT RATE
Income in Chesterfield
Income Overview in Chesterfield
Per Capita Income in Chesterfield is $75,489, while median incomes of families and households are $175,592 and $137,052 respectively.
| Characteristic | Number | Measure |
| Per Capita Income | 49,645 | $75,489 |
| Median Family Income | 14,379 | $175,592 |
| Mean Family Income | 14,379 | $221,483 |
| Median Household Income | 20,447 | $137,052 |
| Mean Household Income | 20,447 | $182,069 |
| Income Deficit | 14,379 | $11,720 |
| Wage / Income Gap (%) | 49,645 | 44.75% |
| Wage / Income Gap ($) | 49,645 | 55.25¢ per $1 |
| Gini / Inequality Index | 49,645 | 0.46 |
Earnings by Sex in Chesterfield
Average Earnings in Chesterfield are $77,183, $103,684 for men and $57,282 for women, a difference of 44.8%.
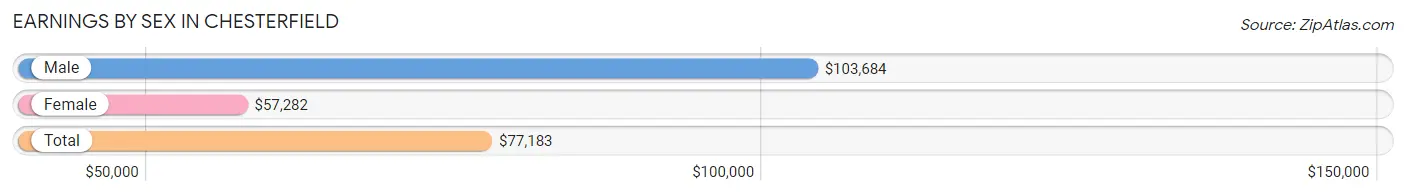
| Sex | Number | Average Earnings |
| Male | 14,895 (55.6%) | $103,684 |
| Female | 11,881 (44.4%) | $57,282 |
| Total | 26,776 (100.0%) | $77,183 |
Earnings by Sex by Income Bracket in Chesterfield
The most common earnings brackets in Chesterfield are $100,000+ for men (7,699 | 51.7%) and $100,000+ for women (3,116 | 26.2%).
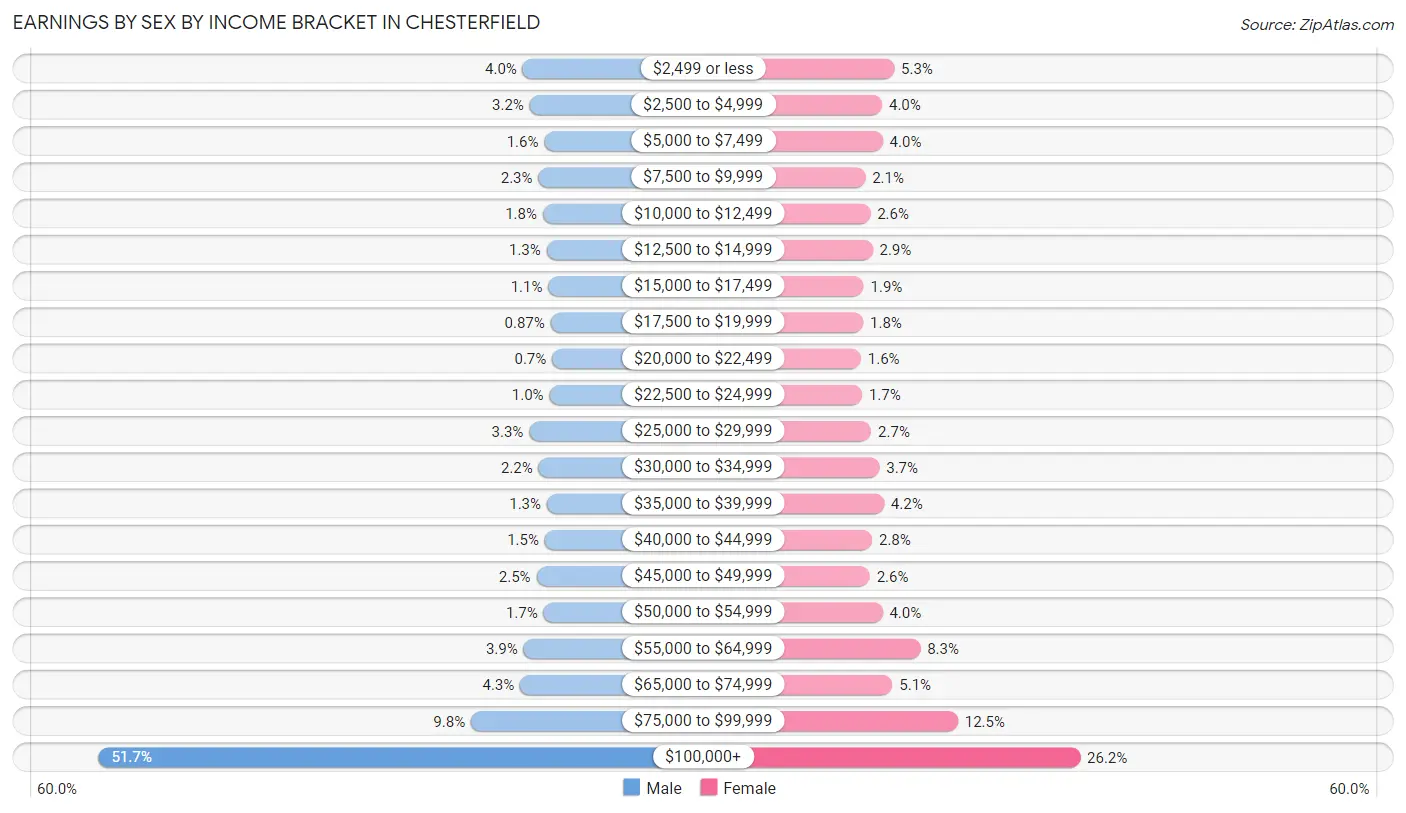
| Income | Male | Female |
| $2,499 or less | 597 (4.0%) | 632 (5.3%) |
| $2,500 to $4,999 | 479 (3.2%) | 471 (4.0%) |
| $5,000 to $7,499 | 236 (1.6%) | 479 (4.0%) |
| $7,500 to $9,999 | 335 (2.2%) | 246 (2.1%) |
| $10,000 to $12,499 | 261 (1.8%) | 313 (2.6%) |
| $12,500 to $14,999 | 197 (1.3%) | 343 (2.9%) |
| $15,000 to $17,499 | 169 (1.1%) | 225 (1.9%) |
| $17,500 to $19,999 | 130 (0.9%) | 218 (1.8%) |
| $20,000 to $22,499 | 104 (0.7%) | 188 (1.6%) |
| $22,500 to $24,999 | 149 (1.0%) | 203 (1.7%) |
| $25,000 to $29,999 | 488 (3.3%) | 325 (2.7%) |
| $30,000 to $34,999 | 332 (2.2%) | 434 (3.6%) |
| $35,000 to $39,999 | 192 (1.3%) | 496 (4.2%) |
| $40,000 to $44,999 | 227 (1.5%) | 338 (2.8%) |
| $45,000 to $49,999 | 367 (2.5%) | 306 (2.6%) |
| $50,000 to $54,999 | 248 (1.7%) | 477 (4.0%) |
| $55,000 to $64,999 | 583 (3.9%) | 980 (8.3%) |
| $65,000 to $74,999 | 640 (4.3%) | 608 (5.1%) |
| $75,000 to $99,999 | 1,462 (9.8%) | 1,483 (12.5%) |
| $100,000+ | 7,699 (51.7%) | 3,116 (26.2%) |
| Total | 14,895 (100.0%) | 11,881 (100.0%) |
Earnings by Sex by Educational Attainment in Chesterfield
Average earnings in Chesterfield are $114,518 for men and $65,496 for women, a difference of 42.8%. Men with an educational attainment of graduate degree enjoy the highest average annual earnings of $142,556, while those with high school diploma education earn the least with $33,523. Women with an educational attainment of graduate degree earn the most with the average annual earnings of $90,875, while those with less than high school education have the smallest earnings of $21,409.
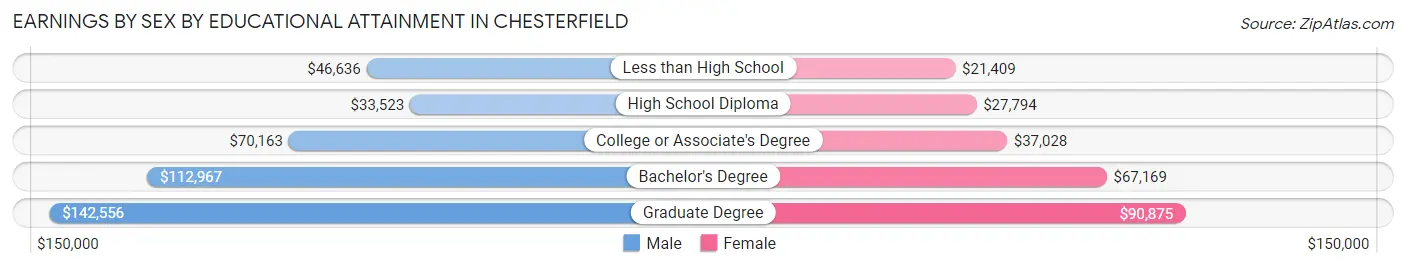
| Educational Attainment | Male Income | Female Income |
| Less than High School | $46,636 | $21,409 |
| High School Diploma | $33,523 | $27,794 |
| College or Associate's Degree | $70,163 | $37,028 |
| Bachelor's Degree | $112,967 | $67,169 |
| Graduate Degree | $142,556 | $90,875 |
| Total | $114,518 | $65,496 |
Family Income in Chesterfield
Family Income Brackets in Chesterfield
According to the Chesterfield family income data, there are 6,097 families falling into the $200,000+ income range, which is the most common income bracket and makes up 42.4% of all families. Conversely, the $10,000 to $14,999 income bracket is the least frequent group with only 72 families (0.5%) belonging to this category.
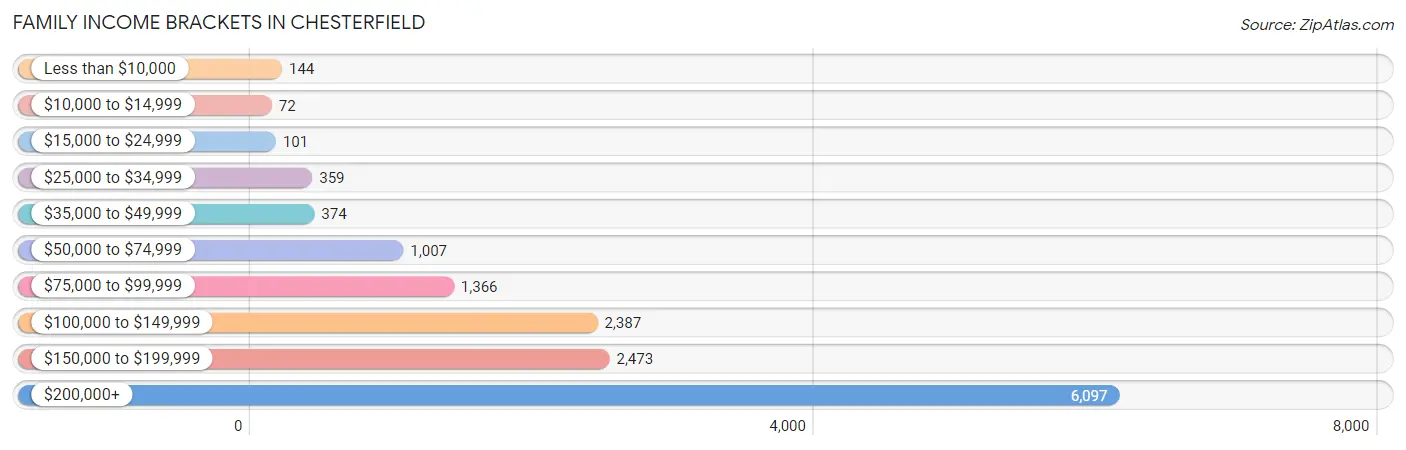
| Income Bracket | # Families | % Families |
| Less than $10,000 | 144 | 1.0% |
| $10,000 to $14,999 | 72 | 0.5% |
| $15,000 to $24,999 | 101 | 0.7% |
| $25,000 to $34,999 | 359 | 2.5% |
| $35,000 to $49,999 | 374 | 2.6% |
| $50,000 to $74,999 | 1,007 | 7.0% |
| $75,000 to $99,999 | 1,366 | 9.5% |
| $100,000 to $149,999 | 2,387 | 16.6% |
| $150,000 to $199,999 | 2,473 | 17.2% |
| $200,000+ | 6,097 | 42.4% |
Family Income by Famaliy Size in Chesterfield
6-person families (153 | 1.1%) account for the highest median family income in Chesterfield with $250,001 per family, while 2-person families (7,329 | 51.0%) have the highest median income of $69,746 per family member.
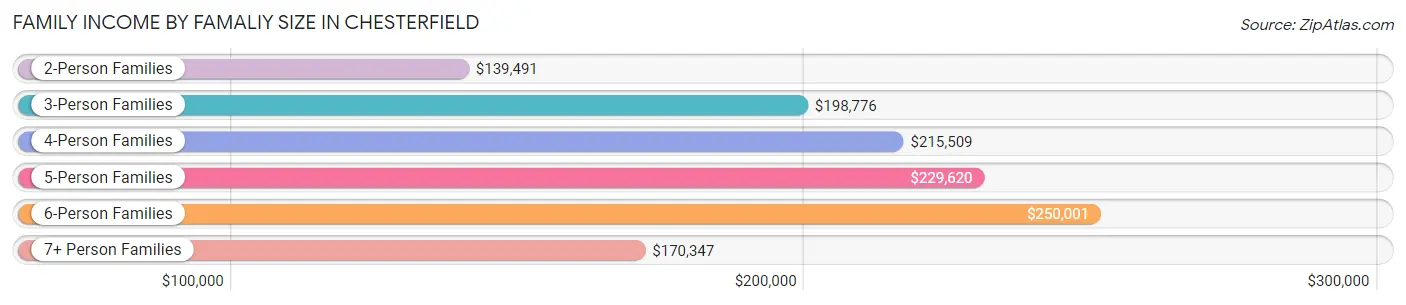
| Income Bracket | # Families | Median Income |
| 2-Person Families | 7,329 (51.0%) | $139,491 |
| 3-Person Families | 3,026 (21.0%) | $198,776 |
| 4-Person Families | 3,006 (20.9%) | $215,509 |
| 5-Person Families | 783 (5.4%) | $229,620 |
| 6-Person Families | 153 (1.1%) | $250,001 |
| 7+ Person Families | 82 (0.6%) | $170,347 |
| Total | 14,379 (100.0%) | $175,592 |
Family Income by Number of Earners in Chesterfield
The median family income in Chesterfield is $175,592, with families comprising 3+ earners (1,406) having the highest median family income of $238,819, while families with no earners (2,062) have the lowest median family income of $96,703, accounting for 9.8% and 14.3% of families, respectively.
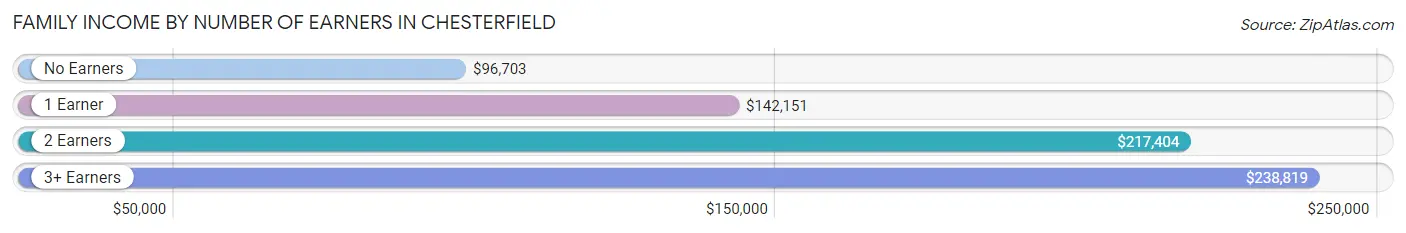
| Number of Earners | # Families | Median Income |
| No Earners | 2,062 (14.3%) | $96,703 |
| 1 Earner | 4,318 (30.0%) | $142,151 |
| 2 Earners | 6,593 (45.9%) | $217,404 |
| 3+ Earners | 1,406 (9.8%) | $238,819 |
| Total | 14,379 (100.0%) | $175,592 |
Household Income in Chesterfield
Household Income Brackets in Chesterfield
With 6,482 households falling in the category, the $200,000+ income range is the most frequent in Chesterfield, accounting for 31.7% of all households. In contrast, only 348 households (1.7%) fall into the $10,000 to $14,999 income bracket, making it the least populous group.
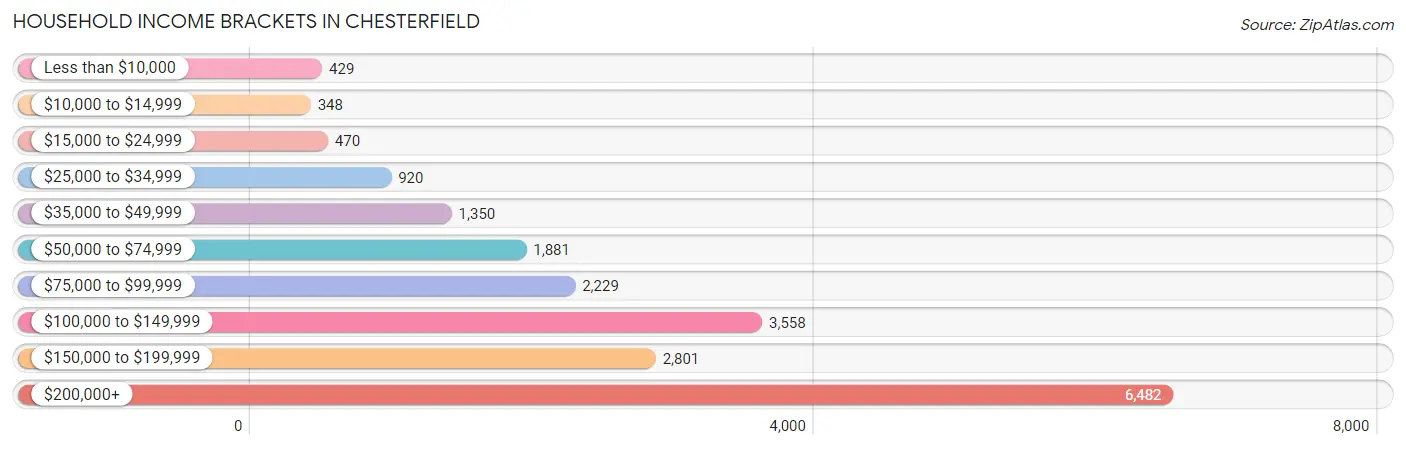
| Income Bracket | # Households | % Households |
| Less than $10,000 | 429 | 2.1% |
| $10,000 to $14,999 | 348 | 1.7% |
| $15,000 to $24,999 | 470 | 2.3% |
| $25,000 to $34,999 | 920 | 4.5% |
| $35,000 to $49,999 | 1,350 | 6.6% |
| $50,000 to $74,999 | 1,881 | 9.2% |
| $75,000 to $99,999 | 2,229 | 10.9% |
| $100,000 to $149,999 | 3,558 | 17.4% |
| $150,000 to $199,999 | 2,801 | 13.7% |
| $200,000+ | 6,482 | 31.7% |
Household Income by Householder Age in Chesterfield
The median household income in Chesterfield is $137,052, with the highest median household income of $187,173 found in the 45 to 64 years age bracket for the primary householder. A total of 7,629 households (37.3%) fall into this category. Meanwhile, the 15 to 24 years age bracket for the primary householder has the lowest median household income of $44,457, with 678 households (3.3%) in this group.
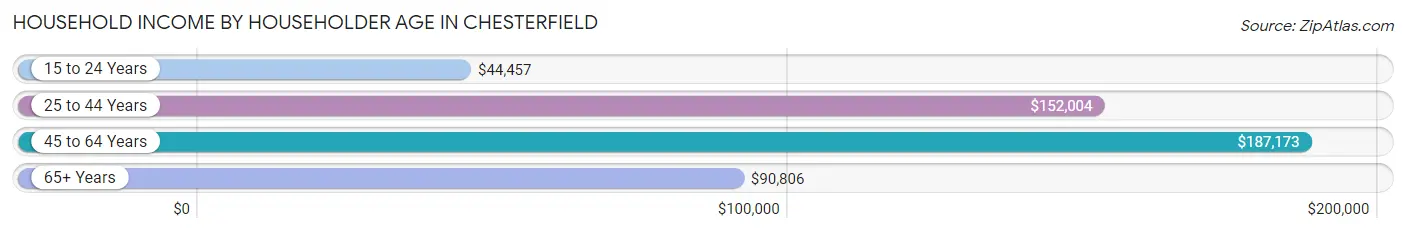
| Income Bracket | # Households | Median Income |
| 15 to 24 Years | 678 (3.3%) | $44,457 |
| 25 to 44 Years | 4,872 (23.8%) | $152,004 |
| 45 to 64 Years | 7,629 (37.3%) | $187,173 |
| 65+ Years | 7,268 (35.5%) | $90,806 |
| Total | 20,447 (100.0%) | $137,052 |
Poverty in Chesterfield
Income Below Poverty by Sex and Age in Chesterfield
With 3.6% poverty level for males and 4.2% for females among the residents of Chesterfield, 15 year old males and 18 to 24 year old females are the most vulnerable to poverty, with 43 males (13.4%) and 260 females (18.5%) in their respective age groups living below the poverty level.
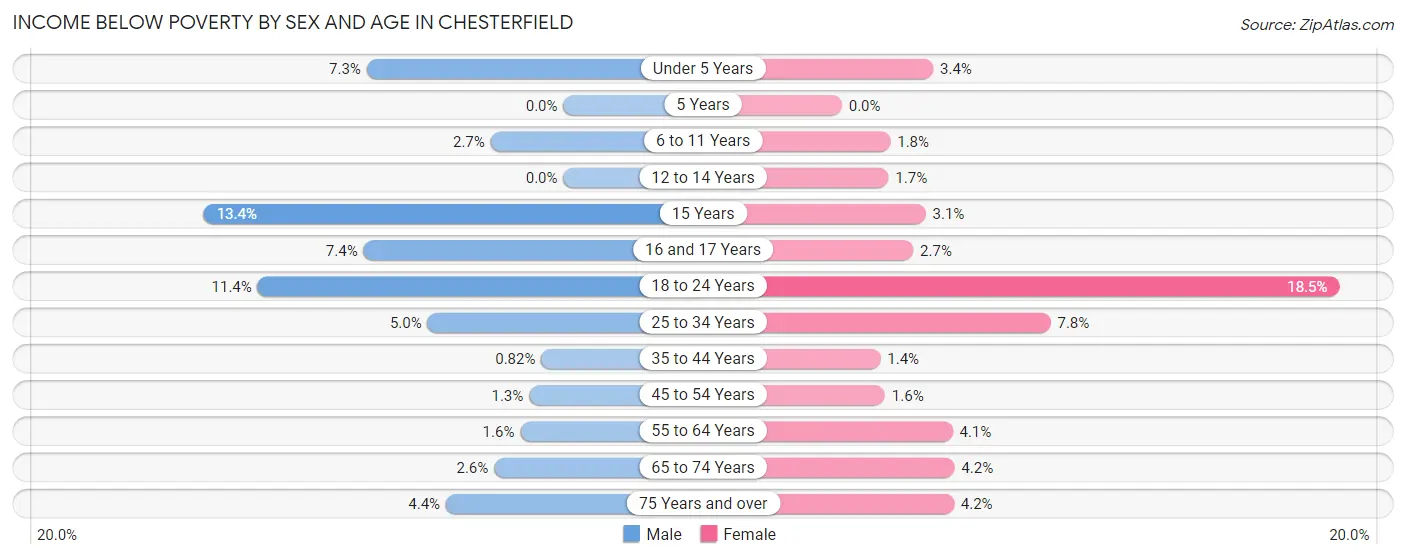
| Age Bracket | Male | Female |
| Under 5 Years | 101 (7.3%) | 42 (3.4%) |
| 5 Years | 0 (0.0%) | 0 (0.0%) |
| 6 to 11 Years | 41 (2.7%) | 32 (1.8%) |
| 12 to 14 Years | 0 (0.0%) | 17 (1.7%) |
| 15 Years | 43 (13.4%) | 8 (3.1%) |
| 16 and 17 Years | 75 (7.4%) | 17 (2.6%) |
| 18 to 24 Years | 213 (11.4%) | 260 (18.5%) |
| 25 to 34 Years | 92 (5.0%) | 169 (7.7%) |
| 35 to 44 Years | 26 (0.8%) | 40 (1.4%) |
| 45 to 54 Years | 42 (1.3%) | 57 (1.6%) |
| 55 to 64 Years | 57 (1.6%) | 146 (4.1%) |
| 65 to 74 Years | 73 (2.6%) | 140 (4.2%) |
| 75 Years and over | 85 (4.4%) | 129 (4.2%) |
| Total | 848 (3.6%) | 1,057 (4.2%) |
Income Above Poverty by Sex and Age in Chesterfield
According to the poverty statistics in Chesterfield, males aged 5 years and females aged 5 years are the age groups that are most secure financially, with 100.0% of males and 100.0% of females in these age groups living above the poverty line.
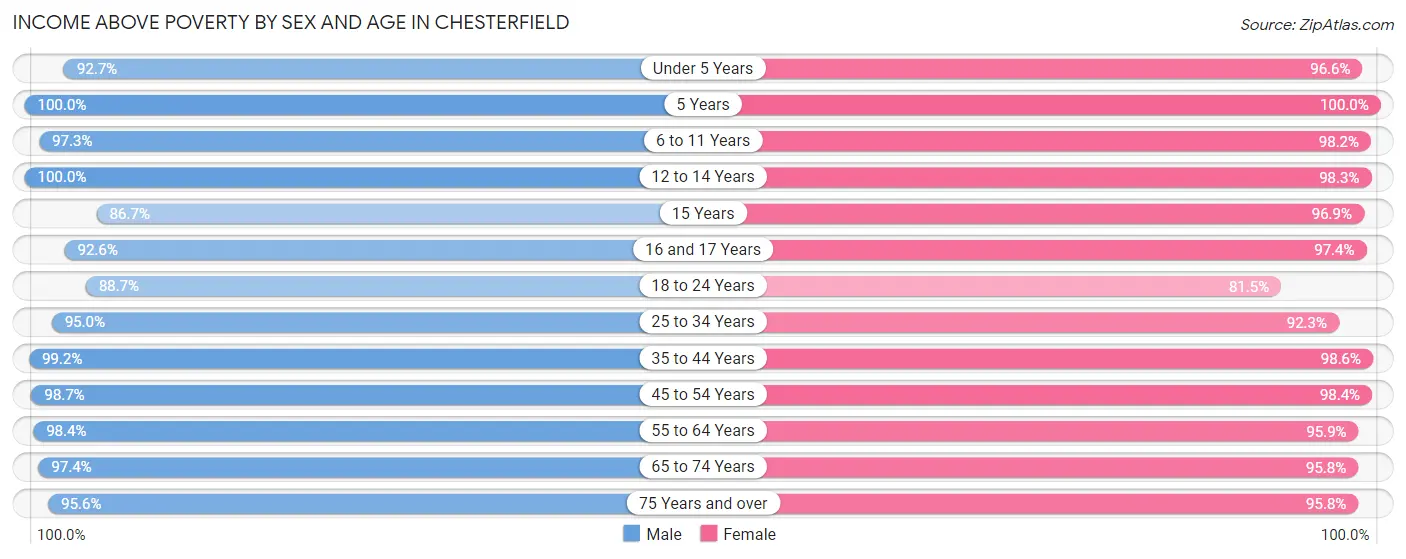
| Age Bracket | Male | Female |
| Under 5 Years | 1,283 (92.7%) | 1,197 (96.6%) |
| 5 Years | 170 (100.0%) | 198 (100.0%) |
| 6 to 11 Years | 1,477 (97.3%) | 1,750 (98.2%) |
| 12 to 14 Years | 811 (100.0%) | 966 (98.3%) |
| 15 Years | 279 (86.7%) | 249 (96.9%) |
| 16 and 17 Years | 936 (92.6%) | 624 (97.4%) |
| 18 to 24 Years | 1,663 (88.6%) | 1,148 (81.5%) |
| 25 to 34 Years | 1,735 (95.0%) | 2,012 (92.2%) |
| 35 to 44 Years | 3,131 (99.2%) | 2,752 (98.6%) |
| 45 to 54 Years | 3,275 (98.7%) | 3,499 (98.4%) |
| 55 to 64 Years | 3,499 (98.4%) | 3,403 (95.9%) |
| 65 to 74 Years | 2,763 (97.4%) | 3,209 (95.8%) |
| 75 Years and over | 1,865 (95.6%) | 2,975 (95.8%) |
| Total | 22,887 (96.4%) | 23,982 (95.8%) |
Income Below Poverty Among Married-Couple Families in Chesterfield
The poverty statistics for married-couple families in Chesterfield show that 1.8% or 229 of the total 12,849 families live below the poverty line. Families with 3 or 4 children have the highest poverty rate of 4.2%, comprising of 27 families. On the other hand, families with 5 or more children have the lowest poverty rate of 0.0%, which includes 0 families.
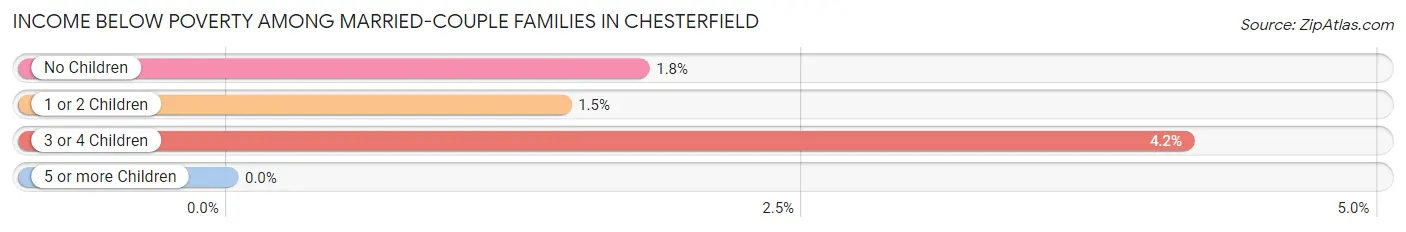
| Children | Above Poverty | Below Poverty |
| No Children | 7,647 (98.2%) | 139 (1.8%) |
| 1 or 2 Children | 4,287 (98.6%) | 63 (1.5%) |
| 3 or 4 Children | 622 (95.8%) | 27 (4.2%) |
| 5 or more Children | 64 (100.0%) | 0 (0.0%) |
| Total | 12,620 (98.2%) | 229 (1.8%) |
Income Below Poverty Among Single-Parent Households in Chesterfield
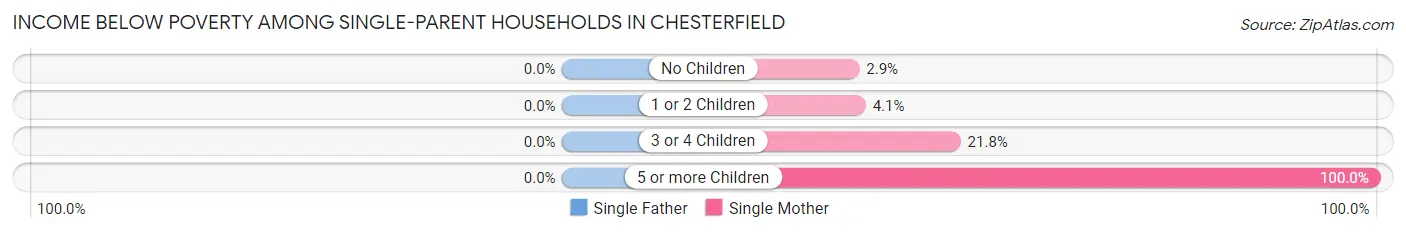
| Children | Single Father | Single Mother |
| No Children | 0 (0.0%) | 13 (2.9%) |
| 1 or 2 Children | 0 (0.0%) | 24 (4.1%) |
| 3 or 4 Children | 0 (0.0%) | 17 (21.8%) |
| 5 or more Children | 0 (0.0%) | 8 (100.0%) |
| Total | 0 (0.0%) | 62 (5.6%) |
Income Below Poverty Among Married-Couple vs Single-Parent Households in Chesterfield
The poverty data for Chesterfield shows that 229 of the married-couple family households (1.8%) and 62 of the single-parent households (4.1%) are living below the poverty level. Within the married-couple family households, those with 3 or 4 children have the highest poverty rate, with 27 households (4.2%) falling below the poverty line. Among the single-parent households, those with 5 or more children have the highest poverty rate, with 8 household (100.0%) living below poverty.
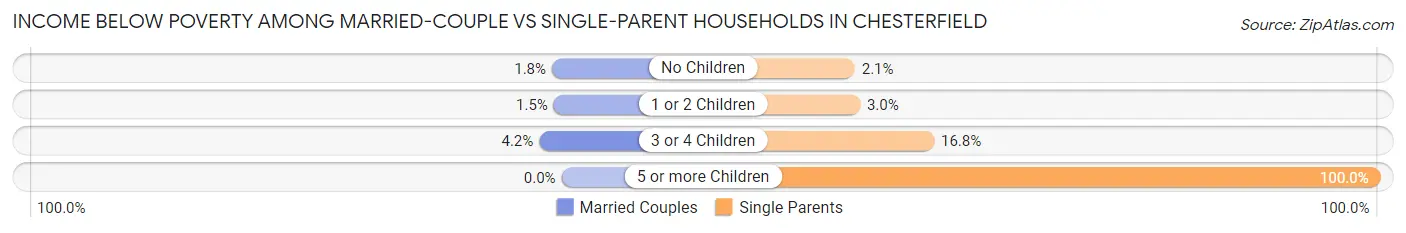
| Children | Married-Couple Families | Single-Parent Households |
| No Children | 139 (1.8%) | 13 (2.1%) |
| 1 or 2 Children | 63 (1.5%) | 24 (3.0%) |
| 3 or 4 Children | 27 (4.2%) | 17 (16.8%) |
| 5 or more Children | 0 (0.0%) | 8 (100.0%) |
| Total | 229 (1.8%) | 62 (4.1%) |
Race in Chesterfield
The most populous races in Chesterfield are White / Caucasian (37,667 | 75.9%), Asian (6,518 | 13.1%), and Two or more Races (3,472 | 7.0%).
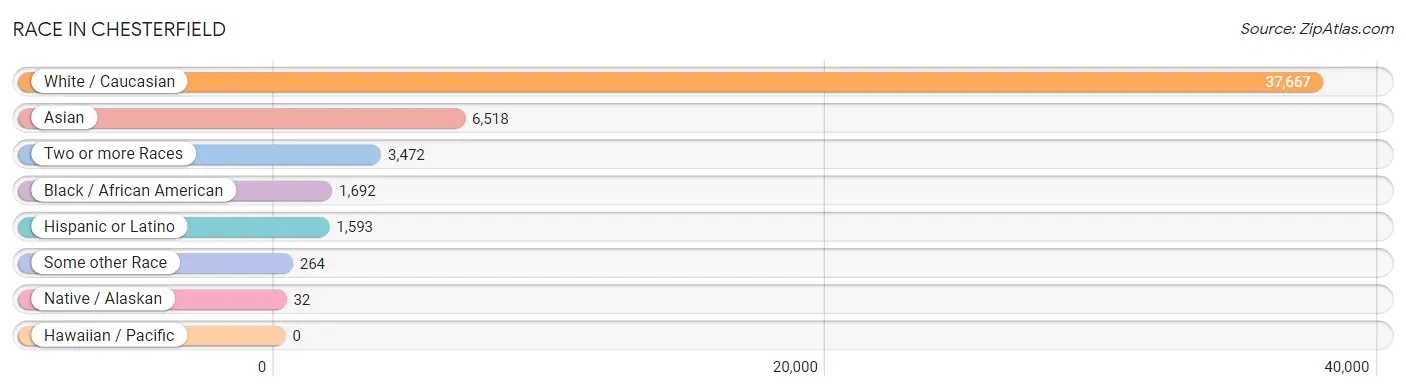
| Race | # Population | % Population |
| Asian | 6,518 | 13.1% |
| Black / African American | 1,692 | 3.4% |
| Hawaiian / Pacific | 0 | 0.0% |
| Hispanic or Latino | 1,593 | 3.2% |
| Native / Alaskan | 32 | 0.1% |
| White / Caucasian | 37,667 | 75.9% |
| Two or more Races | 3,472 | 7.0% |
| Some other Race | 264 | 0.5% |
| Total | 49,645 | 100.0% |
Ancestry in Chesterfield
The most populous ancestries reported in Chesterfield are German (11,893 | 24.0%), Irish (6,491 | 13.1%), English (5,467 | 11.0%), Thai (4,167 | 8.4%), and American (2,324 | 4.7%), together accounting for 61.1% of all Chesterfield residents.
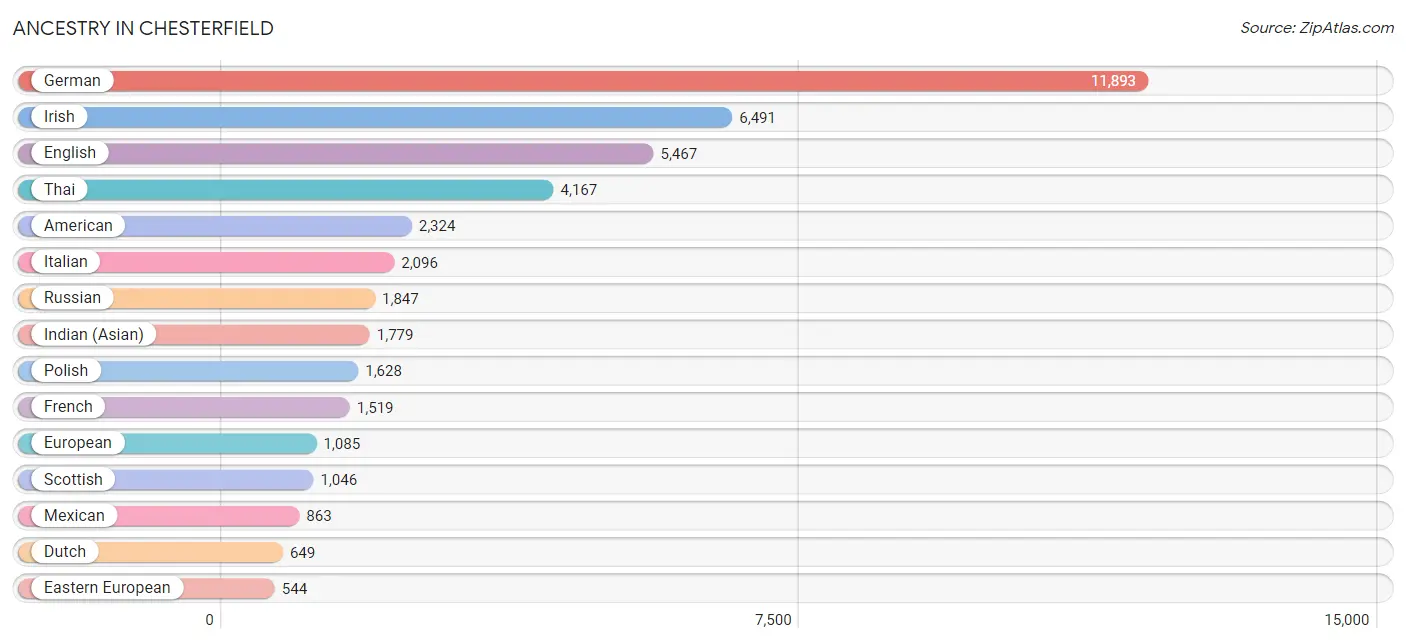
| Ancestry | # Population | % Population |
| African | 88 | 0.2% |
| Albanian | 53 | 0.1% |
| American | 2,324 | 4.7% |
| Arab | 239 | 0.5% |
| Argentinean | 50 | 0.1% |
| Armenian | 108 | 0.2% |
| Australian | 90 | 0.2% |
| Austrian | 257 | 0.5% |
| Belgian | 42 | 0.1% |
| Bhutanese | 246 | 0.5% |
| Brazilian | 122 | 0.3% |
| British | 526 | 1.1% |
| Bulgarian | 8 | 0.0% |
| Burmese | 543 | 1.1% |
| Canadian | 123 | 0.3% |
| Central American | 72 | 0.2% |
| Cherokee | 109 | 0.2% |
| Chippewa | 5 | 0.0% |
| Choctaw | 7 | 0.0% |
| Colombian | 146 | 0.3% |
| Cree | 5 | 0.0% |
| Creek | 6 | 0.0% |
| Croatian | 88 | 0.2% |
| Cuban | 74 | 0.2% |
| Czech | 246 | 0.5% |
| Czechoslovakian | 22 | 0.0% |
| Danish | 41 | 0.1% |
| Dominican | 23 | 0.1% |
| Dutch | 649 | 1.3% |
| Eastern European | 544 | 1.1% |
| Ecuadorian | 20 | 0.0% |
| English | 5,467 | 11.0% |
| European | 1,085 | 2.2% |
| Filipino | 93 | 0.2% |
| Finnish | 19 | 0.0% |
| French | 1,519 | 3.1% |
| French Canadian | 68 | 0.1% |
| German | 11,893 | 24.0% |
| Greek | 206 | 0.4% |
| Honduran | 10 | 0.0% |
| Hungarian | 326 | 0.7% |
| Indian (Asian) | 1,779 | 3.6% |
| Iranian | 208 | 0.4% |
| Irish | 6,491 | 13.1% |
| Iroquois | 8 | 0.0% |
| Israeli | 18 | 0.0% |
| Italian | 2,096 | 4.2% |
| Kenyan | 68 | 0.1% |
| Korean | 289 | 0.6% |
| Laotian | 32 | 0.1% |
| Latvian | 22 | 0.0% |
| Lebanese | 137 | 0.3% |
| Lithuanian | 73 | 0.2% |
| Luxembourger | 29 | 0.1% |
| Macedonian | 30 | 0.1% |
| Mexican | 863 | 1.7% |
| Mexican American Indian | 171 | 0.3% |
| Northern European | 277 | 0.6% |
| Norwegian | 263 | 0.5% |
| Osage | 4 | 0.0% |
| Pakistani | 17 | 0.0% |
| Paraguayan | 4 | 0.0% |
| Peruvian | 17 | 0.0% |
| Polish | 1,628 | 3.3% |
| Portuguese | 69 | 0.1% |
| Puerto Rican | 116 | 0.2% |
| Romanian | 71 | 0.1% |
| Russian | 1,847 | 3.7% |
| Salvadoran | 62 | 0.1% |
| Scandinavian | 36 | 0.1% |
| Scotch-Irish | 342 | 0.7% |
| Scottish | 1,046 | 2.1% |
| Serbian | 21 | 0.0% |
| Slovak | 72 | 0.2% |
| Slovene | 12 | 0.0% |
| South African | 13 | 0.0% |
| South American | 366 | 0.7% |
| South American Indian | 74 | 0.2% |
| Spanish | 35 | 0.1% |
| Sri Lankan | 64 | 0.1% |
| Subsaharan African | 179 | 0.4% |
| Swedish | 392 | 0.8% |
| Swiss | 291 | 0.6% |
| Syrian | 64 | 0.1% |
| Thai | 4,167 | 8.4% |
| Turkish | 158 | 0.3% |
| Ukrainian | 90 | 0.2% |
| Venezuelan | 129 | 0.3% |
| Vietnamese | 71 | 0.1% |
| Welsh | 391 | 0.8% |
| Yugoslavian | 48 | 0.1% | View All 91 Rows |
Immigrants in Chesterfield
The most numerous immigrant groups reported in Chesterfield came from Asia (5,160 | 10.4%), South Central Asia (3,121 | 6.3%), India (2,792 | 5.6%), Europe (1,818 | 3.7%), and Eastern Asia (1,643 | 3.3%), together accounting for 29.3% of all Chesterfield residents.
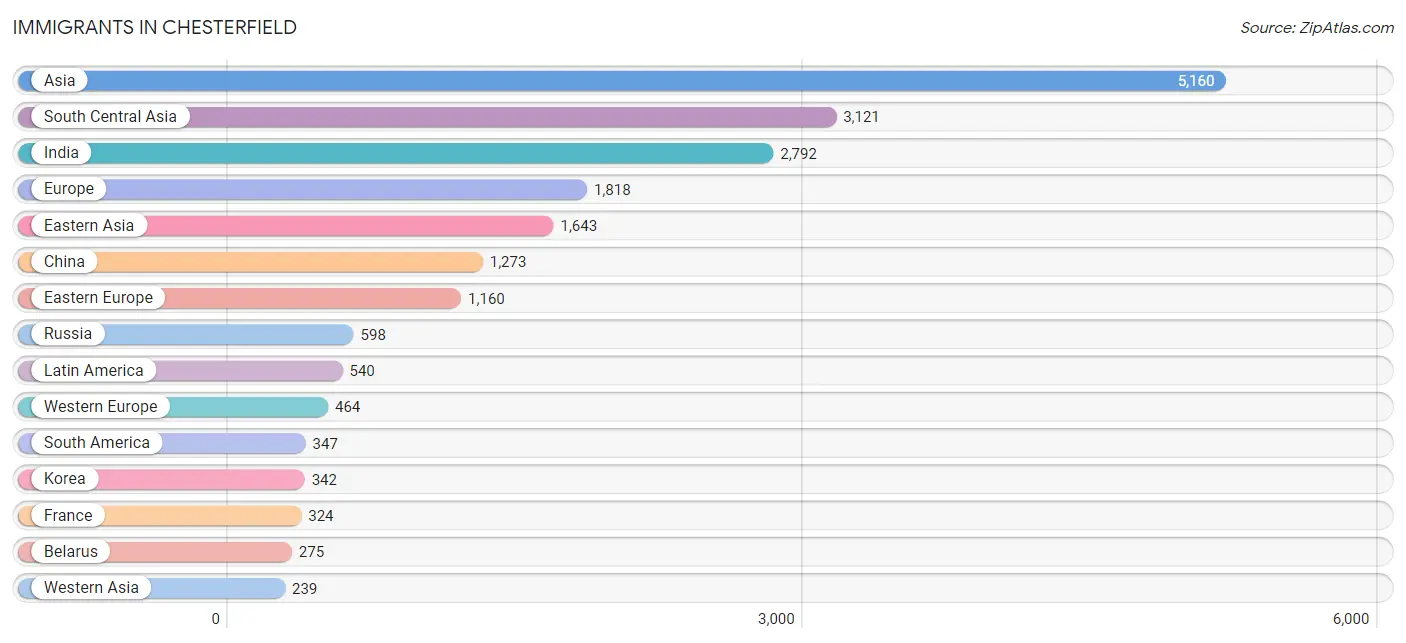
| Immigration Origin | # Population | % Population |
| Africa | 100 | 0.2% |
| Albania | 35 | 0.1% |
| Argentina | 32 | 0.1% |
| Asia | 5,160 | 10.4% |
| Australia | 90 | 0.2% |
| Bangladesh | 40 | 0.1% |
| Belarus | 275 | 0.5% |
| Bosnia and Herzegovina | 16 | 0.0% |
| Brazil | 153 | 0.3% |
| Bulgaria | 15 | 0.0% |
| Canada | 231 | 0.5% |
| Caribbean | 42 | 0.1% |
| Central America | 151 | 0.3% |
| China | 1,273 | 2.6% |
| Colombia | 88 | 0.2% |
| Czechoslovakia | 32 | 0.1% |
| Eastern Africa | 60 | 0.1% |
| Eastern Asia | 1,643 | 3.3% |
| Eastern Europe | 1,160 | 2.3% |
| Ecuador | 8 | 0.0% |
| England | 78 | 0.2% |
| Europe | 1,818 | 3.7% |
| France | 324 | 0.6% |
| Germany | 78 | 0.2% |
| Greece | 9 | 0.0% |
| Hong Kong | 88 | 0.2% |
| India | 2,792 | 5.6% |
| Iran | 162 | 0.3% |
| Israel | 6 | 0.0% |
| Italy | 12 | 0.0% |
| Japan | 28 | 0.1% |
| Korea | 342 | 0.7% |
| Latin America | 540 | 1.1% |
| Latvia | 11 | 0.0% |
| Lebanon | 13 | 0.0% |
| Malaysia | 32 | 0.1% |
| Mexico | 151 | 0.3% |
| Middle Africa | 14 | 0.0% |
| Netherlands | 20 | 0.0% |
| Northern Europe | 146 | 0.3% |
| Oceania | 90 | 0.2% |
| Pakistan | 57 | 0.1% |
| Peru | 17 | 0.0% |
| Philippines | 46 | 0.1% |
| Poland | 18 | 0.0% |
| Romania | 19 | 0.0% |
| Russia | 598 | 1.2% |
| Saudi Arabia | 16 | 0.0% |
| Scotland | 39 | 0.1% |
| South Africa | 26 | 0.1% |
| South America | 347 | 0.7% |
| South Central Asia | 3,121 | 6.3% |
| South Eastern Asia | 157 | 0.3% |
| Southern Europe | 48 | 0.1% |
| Spain | 27 | 0.1% |
| Sri Lanka | 44 | 0.1% |
| Switzerland | 42 | 0.1% |
| Syria | 54 | 0.1% |
| Taiwan | 151 | 0.3% |
| Thailand | 17 | 0.0% |
| Trinidad and Tobago | 42 | 0.1% |
| Turkey | 64 | 0.1% |
| Ukraine | 13 | 0.0% |
| Uzbekistan | 8 | 0.0% |
| Venezuela | 49 | 0.1% |
| Vietnam | 62 | 0.1% |
| Western Asia | 239 | 0.5% |
| Western Europe | 464 | 0.9% |
| Zaire | 14 | 0.0% |
| Zimbabwe | 60 | 0.1% | View All 70 Rows |
Sex and Age in Chesterfield
Sex and Age in Chesterfield
The most populous age groups in Chesterfield are 15 to 19 Years (1,913 | 8.0%) for men and 45 to 49 Years (1,916 | 7.5%) for women.
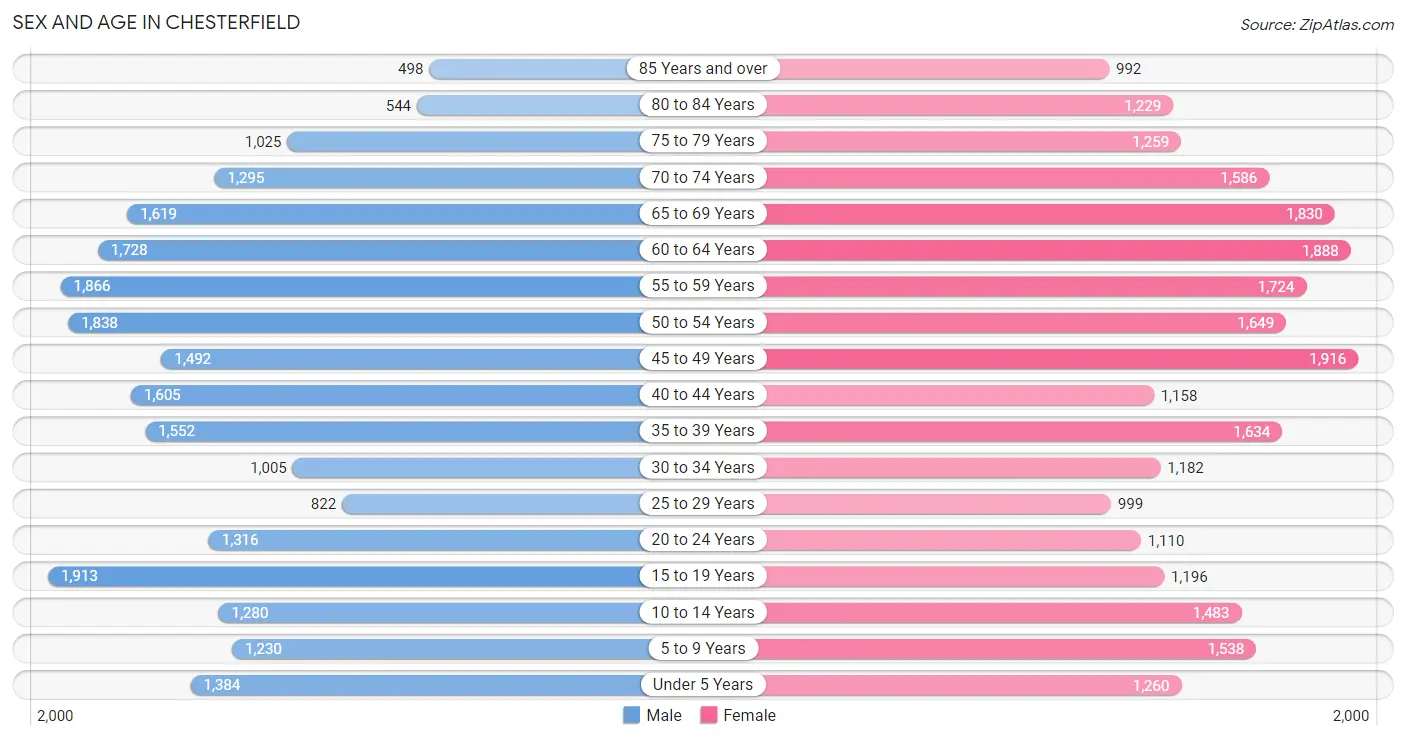
| Age Bracket | Male | Female |
| Under 5 Years | 1,384 (5.8%) | 1,260 (4.9%) |
| 5 to 9 Years | 1,230 (5.1%) | 1,538 (6.0%) |
| 10 to 14 Years | 1,280 (5.3%) | 1,483 (5.8%) |
| 15 to 19 Years | 1,913 (8.0%) | 1,196 (4.7%) |
| 20 to 24 Years | 1,316 (5.5%) | 1,110 (4.3%) |
| 25 to 29 Years | 822 (3.4%) | 999 (3.9%) |
| 30 to 34 Years | 1,005 (4.2%) | 1,182 (4.6%) |
| 35 to 39 Years | 1,552 (6.5%) | 1,634 (6.4%) |
| 40 to 44 Years | 1,605 (6.7%) | 1,158 (4.5%) |
| 45 to 49 Years | 1,492 (6.2%) | 1,916 (7.5%) |
| 50 to 54 Years | 1,838 (7.6%) | 1,649 (6.4%) |
| 55 to 59 Years | 1,866 (7.8%) | 1,724 (6.7%) |
| 60 to 64 Years | 1,728 (7.2%) | 1,888 (7.4%) |
| 65 to 69 Years | 1,619 (6.7%) | 1,830 (7.1%) |
| 70 to 74 Years | 1,295 (5.4%) | 1,586 (6.2%) |
| 75 to 79 Years | 1,025 (4.3%) | 1,259 (4.9%) |
| 80 to 84 Years | 544 (2.3%) | 1,229 (4.8%) |
| 85 Years and over | 498 (2.1%) | 992 (3.9%) |
| Total | 24,012 (100.0%) | 25,633 (100.0%) |
Families and Households in Chesterfield
Median Family Size in Chesterfield
The median family size in Chesterfield is 2.89 persons per family, with married-couple families (12,849 | 89.4%) accounting for the largest median family size of 2.92 persons per family. On the other hand, single female/mother families (1,115 | 7.7%) represent the smallest median family size with 2.60 persons per family.
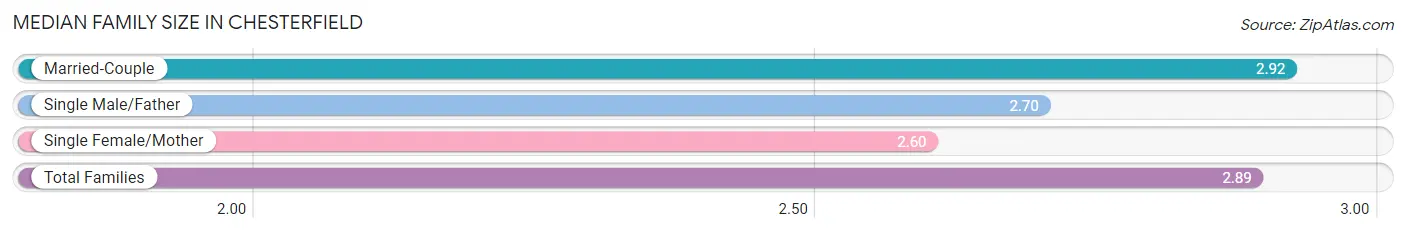
| Family Type | # Families | Family Size |
| Married-Couple | 12,849 (89.4%) | 2.92 |
| Single Male/Father | 415 (2.9%) | 2.70 |
| Single Female/Mother | 1,115 (7.7%) | 2.60 |
| Total Families | 14,379 (100.0%) | 2.89 |
Median Household Size in Chesterfield
The median household size in Chesterfield is 2.39 persons per household, with married-couple households (12,849 | 62.8%) accounting for the largest median household size of 2.93 persons per household. non-family households (6,068 | 29.7%) represent the smallest median household size with 1.15 persons per household.
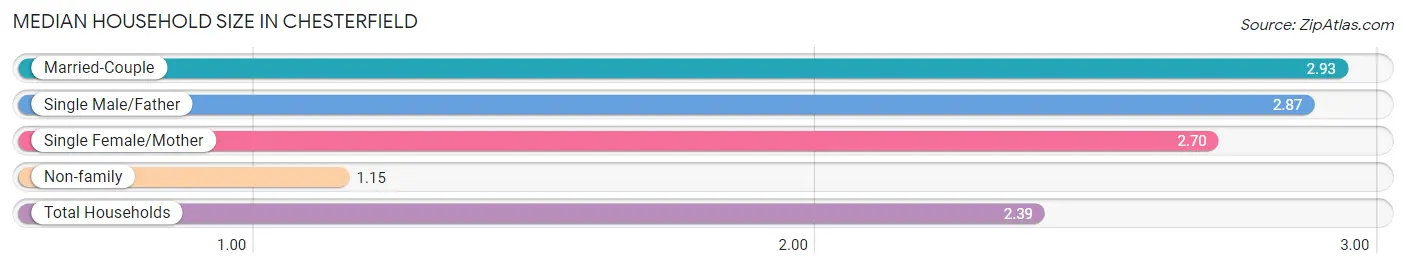
| Household Type | # Households | Household Size |
| Married-Couple | 12,849 (62.8%) | 2.93 |
| Single Male/Father | 415 (2.0%) | 2.87 |
| Single Female/Mother | 1,115 (5.4%) | 2.70 |
| Non-family | 6,068 (29.7%) | 1.15 |
| Total Households | 20,447 (100.0%) | 2.39 |
Household Size by Marriage Status in Chesterfield
Out of a total of 20,447 households in Chesterfield, 14,379 (70.3%) are family households, while 6,068 (29.7%) are nonfamily households. The most numerous type of family households are 2-person households, comprising 7,148, and the most common type of nonfamily households are 1-person households, comprising 5,270.
| Household Size | Family Households | Nonfamily Households |
| 1-Person Households | - | 5,270 (25.8%) |
| 2-Person Households | 7,148 (35.0%) | 716 (3.5%) |
| 3-Person Households | 3,115 (15.2%) | 71 (0.4%) |
| 4-Person Households | 3,061 (15.0%) | 11 (0.1%) |
| 5-Person Households | 783 (3.8%) | 0 (0.0%) |
| 6-Person Households | 162 (0.8%) | 0 (0.0%) |
| 7+ Person Households | 110 (0.5%) | 0 (0.0%) |
| Total | 14,379 (70.3%) | 6,068 (29.7%) |
Female Fertility in Chesterfield
Fertility by Age in Chesterfield
Average fertility rate in Chesterfield is 65.0 births per 1,000 women. Women in the age bracket of 20 to 34 years have the highest fertility rate with 146.0 births per 1,000 women. Women in the age bracket of 20 to 34 years acount for 76.9% of all women with births.
| Age Bracket | Women with Births | Births / 1,000 Women |
| 15 to 19 years | 0 (0.0%) | 0.0 |
| 20 to 34 years | 482 (76.9%) | 146.0 |
| 35 to 50 years | 145 (23.1%) | 28.0 |
| Total | 627 (100.0%) | 65.0 |
Fertility by Age by Marriage Status in Chesterfield
| Age Bracket | Married | Unmarried |
| 15 to 19 years | 0 (0.0%) | 0 (0.0%) |
| 20 to 34 years | 482 (100.0%) | 0 (0.0%) |
| 35 to 50 years | 145 (100.0%) | 0 (0.0%) |
| Total | 627 (100.0%) | 0 (0.0%) |
Fertility by Education in Chesterfield
| Educational Attainment | Women with Births | Births / 1,000 Women |
| Less than High School | 0 (0.0%) | 0.0 |
| High School Diploma | 143 (22.8%) | 260.0 |
| College or Associate's Degree | 99 (15.8%) | 90.0 |
| Bachelor's Degree | 185 (29.5%) | 52.0 |
| Graduate Degree | 200 (31.9%) | 62.0 |
| Total | 627 (100.0%) | 65.0 |
Fertility by Education by Marriage Status in Chesterfield
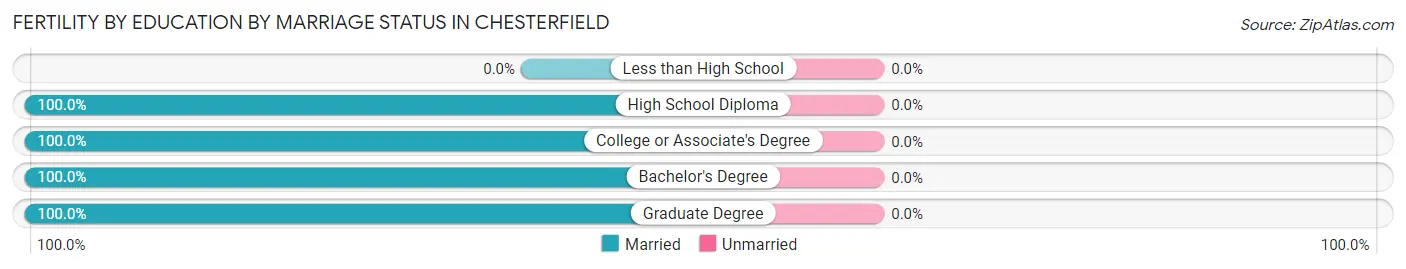
| Educational Attainment | Married | Unmarried |
| Less than High School | 0 (0.0%) | 0 (0.0%) |
| High School Diploma | 143 (100.0%) | 0 (0.0%) |
| College or Associate's Degree | 99 (100.0%) | 0 (0.0%) |
| Bachelor's Degree | 185 (100.0%) | 0 (0.0%) |
| Graduate Degree | 200 (100.0%) | 0 (0.0%) |
| Total | 627 (100.0%) | 0 (0.0%) |
Employment Characteristics in Chesterfield
Employment by Class of Employer in Chesterfield
Among the 24,463 employed individuals in Chesterfield, private company employees (16,645 | 68.0%), not-for-profit organizations (3,203 | 13.1%), and self-employed (incorporated) (1,911 | 7.8%) make up the most common classes of employment.
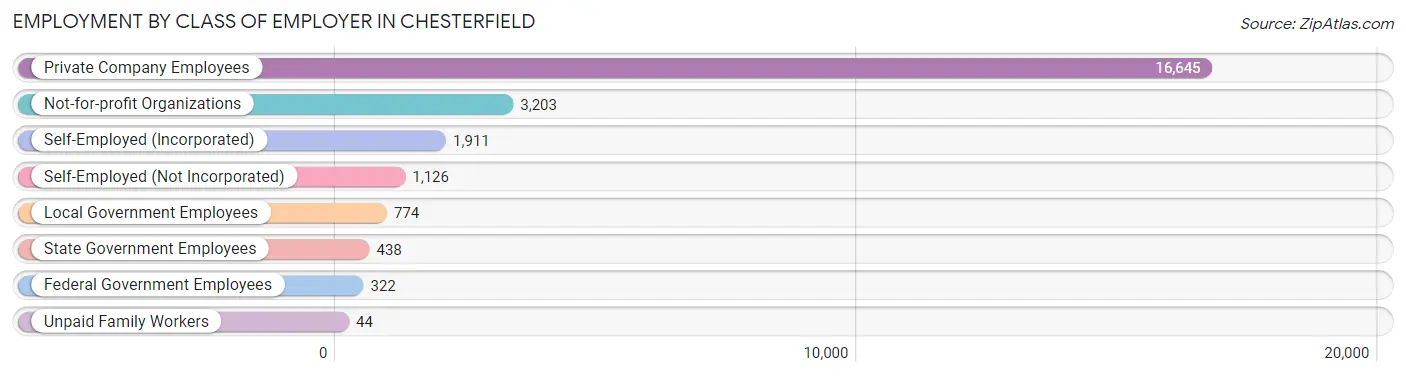
| Employer Class | # Employees | % Employees |
| Private Company Employees | 16,645 | 68.0% |
| Self-Employed (Incorporated) | 1,911 | 7.8% |
| Self-Employed (Not Incorporated) | 1,126 | 4.6% |
| Not-for-profit Organizations | 3,203 | 13.1% |
| Local Government Employees | 774 | 3.2% |
| State Government Employees | 438 | 1.8% |
| Federal Government Employees | 322 | 1.3% |
| Unpaid Family Workers | 44 | 0.2% |
| Total | 24,463 | 100.0% |
Employment Status by Age in Chesterfield
According to the labor force statistics for Chesterfield, out of the total population over 16 years of age (40,891), 62.6% or 25,598 individuals are in the labor force, with 3.1% or 794 of them unemployed. The age group with the highest labor force participation rate is 30 to 34 years, with 92.4% or 2,021 individuals in the labor force. Within the labor force, the 75 years and over age range has the highest percentage of unemployed individuals, with 7.8% or 42 of them being unemployed.
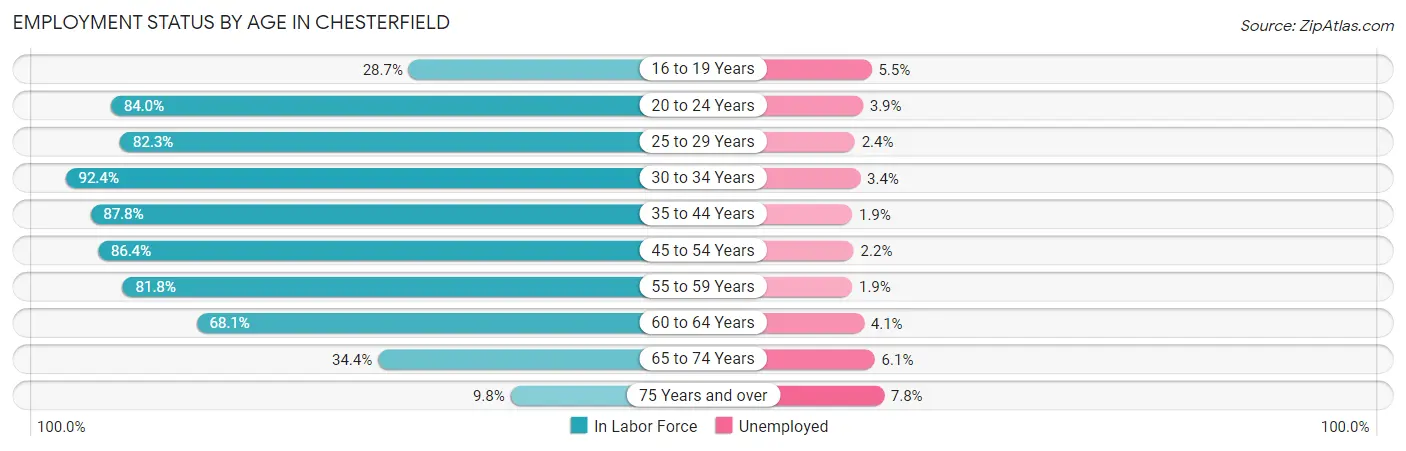
| Age Bracket | In Labor Force | Unemployed |
| 16 to 19 Years | 726 (28.7%) | 40 (5.5%) |
| 20 to 24 Years | 2,038 (84.0%) | 79 (3.9%) |
| 25 to 29 Years | 1,499 (82.3%) | 36 (2.4%) |
| 30 to 34 Years | 2,021 (92.4%) | 69 (3.4%) |
| 35 to 44 Years | 5,223 (87.8%) | 99 (1.9%) |
| 45 to 54 Years | 5,957 (86.4%) | 131 (2.2%) |
| 55 to 59 Years | 2,937 (81.8%) | 56 (1.9%) |
| 60 to 64 Years | 2,462 (68.1%) | 101 (4.1%) |
| 65 to 74 Years | 2,178 (34.4%) | 133 (6.1%) |
| 75 Years and over | 544 (9.8%) | 42 (7.8%) |
| Total | 25,598 (62.6%) | 794 (3.1%) |
Employment Status by Educational Attainment in Chesterfield
According to labor force statistics for Chesterfield, 83.6% of individuals (20,112) out of the total population between 25 and 64 years of age (24,058) are in the labor force, with 2.4% or 483 of them being unemployed. The group with the highest labor force participation rate are those with the educational attainment of bachelor's degree or higher, with 86.5% or 16,708 individuals in the labor force. Within the labor force, individuals with high school diploma education have the highest percentage of unemployment, with 3.7% or 26 of them being unemployed.
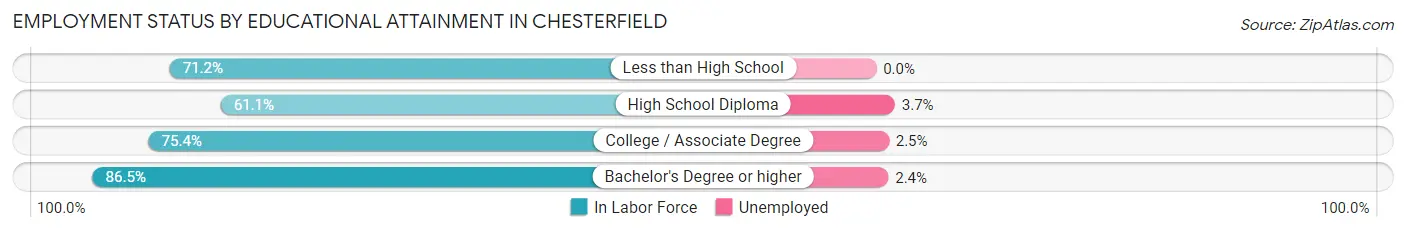
| Educational Attainment | In Labor Force | Unemployed |
| Less than High School | 329 (71.2%) | 0 (0.0%) |
| High School Diploma | 711 (61.1%) | 43 (3.7%) |
| College / Associate Degree | 2,350 (75.4%) | 78 (2.5%) |
| Bachelor's Degree or higher | 16,708 (86.5%) | 464 (2.4%) |
| Total | 20,112 (83.6%) | 577 (2.4%) |
Employment Occupations by Sex in Chesterfield
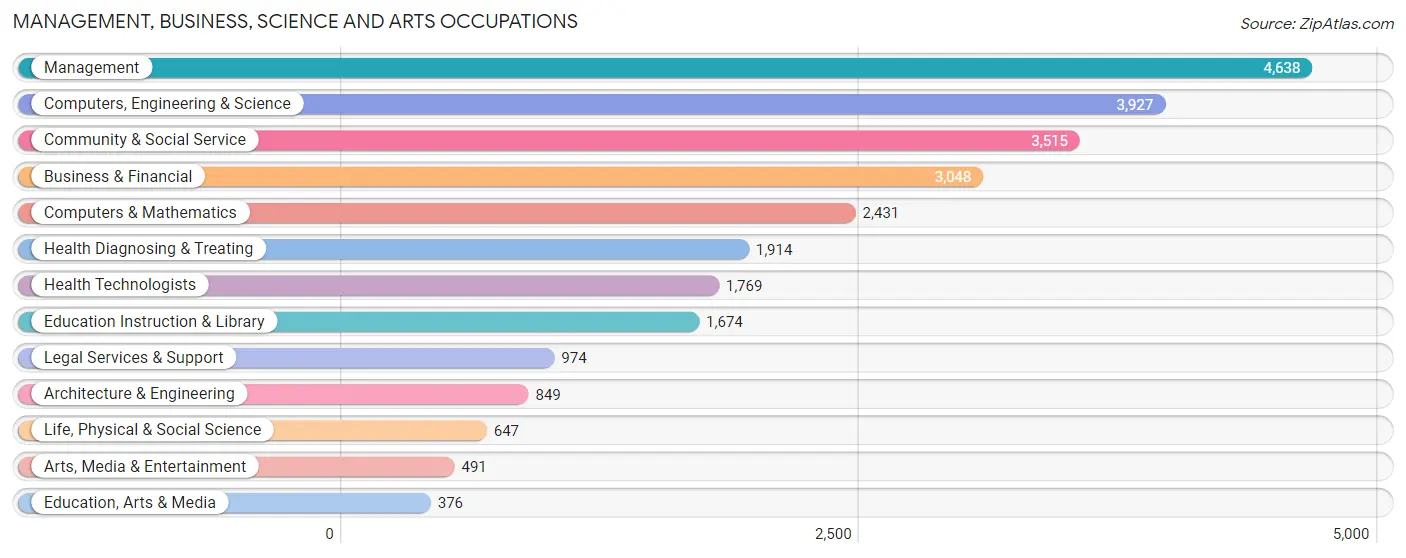
Management, Business, Science and Arts Occupations
The most common Management, Business, Science and Arts occupations in Chesterfield are Management (4,638 | 18.7%), Computers, Engineering & Science (3,927 | 15.8%), Community & Social Service (3,515 | 14.2%), Business & Financial (3,048 | 12.3%), and Computers & Mathematics (2,431 | 9.8%).
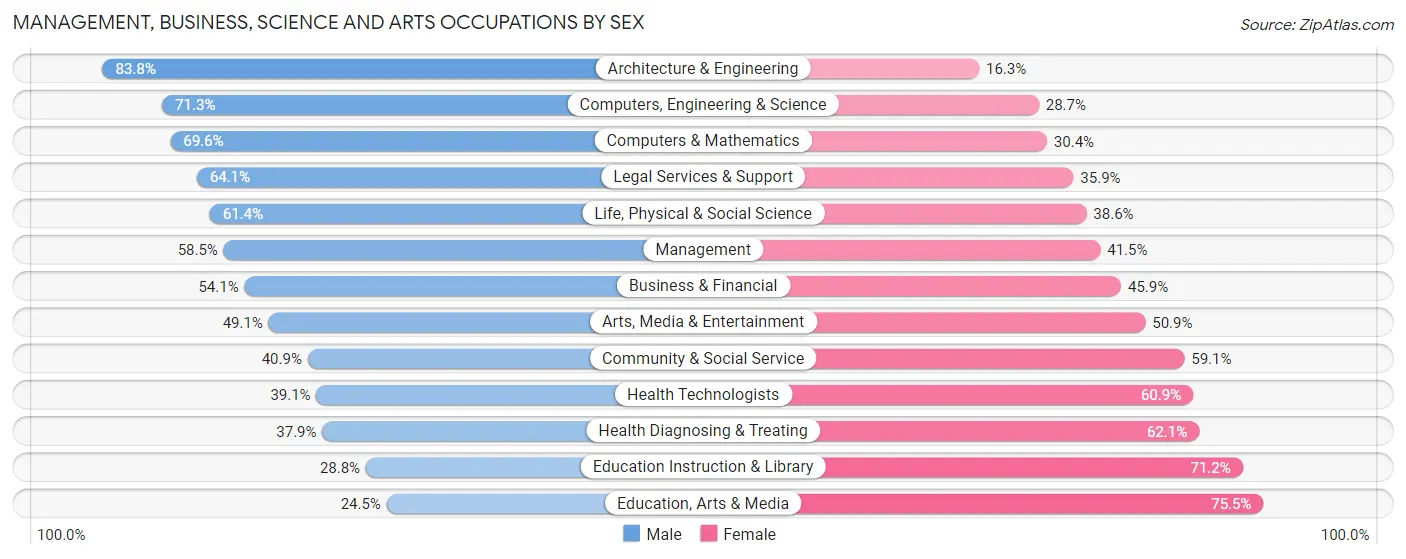
Management, Business, Science and Arts Occupations by Sex
Within the Management, Business, Science and Arts occupations in Chesterfield, the most male-oriented occupations are Architecture & Engineering (83.8%), Computers, Engineering & Science (71.3%), and Computers & Mathematics (69.6%), while the most female-oriented occupations are Education, Arts & Media (75.5%), Education Instruction & Library (71.2%), and Health Diagnosing & Treating (62.1%).
| Occupation | Male | Female |
| Management | 2,712 (58.5%) | 1,926 (41.5%) |
| Business & Financial | 1,650 (54.1%) | 1,398 (45.9%) |
| Computers, Engineering & Science | 2,800 (71.3%) | 1,127 (28.7%) |
| Computers & Mathematics | 1,692 (69.6%) | 739 (30.4%) |
| Architecture & Engineering | 711 (83.8%) | 138 (16.3%) |
| Life, Physical & Social Science | 397 (61.4%) | 250 (38.6%) |
| Community & Social Service | 1,439 (40.9%) | 2,076 (59.1%) |
| Education, Arts & Media | 92 (24.5%) | 284 (75.5%) |
| Legal Services & Support | 624 (64.1%) | 350 (35.9%) |
| Education Instruction & Library | 482 (28.8%) | 1,192 (71.2%) |
| Arts, Media & Entertainment | 241 (49.1%) | 250 (50.9%) |
| Health Diagnosing & Treating | 725 (37.9%) | 1,189 (62.1%) |
| Health Technologists | 692 (39.1%) | 1,077 (60.9%) |
| Total (Category) | 9,326 (54.7%) | 7,716 (45.3%) |
| Total (Overall) | 13,724 (55.4%) | 11,064 (44.6%) |
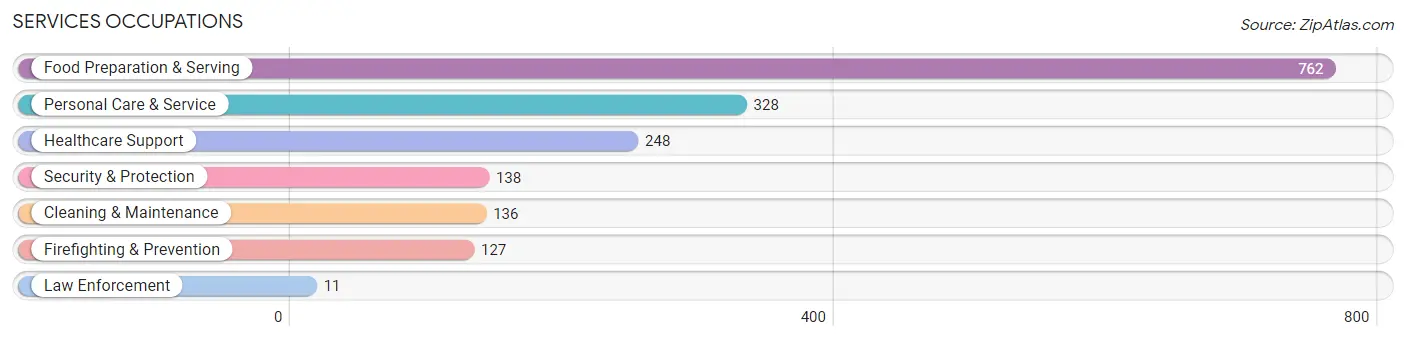
Services Occupations
The most common Services occupations in Chesterfield are Food Preparation & Serving (762 | 3.1%), Personal Care & Service (328 | 1.3%), Healthcare Support (248 | 1.0%), Security & Protection (138 | 0.6%), and Cleaning & Maintenance (136 | 0.5%).
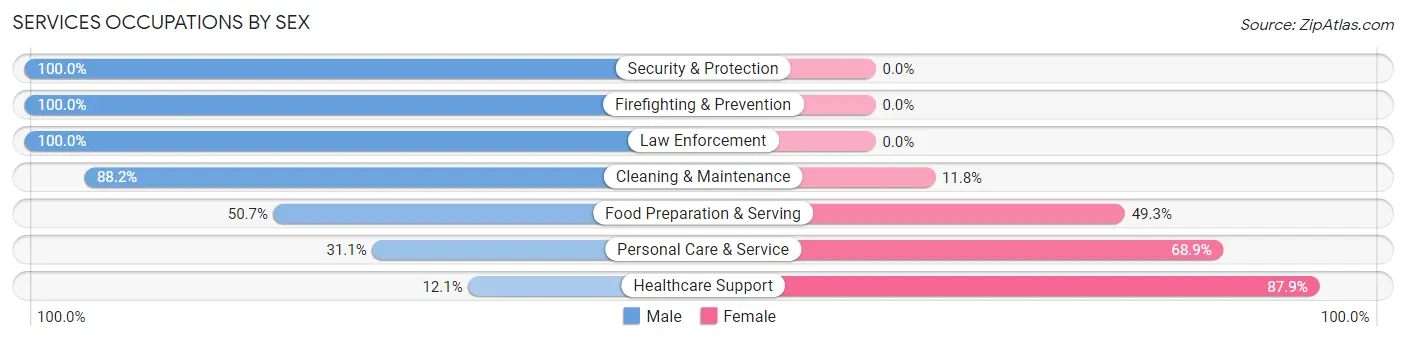
Services Occupations by Sex
Within the Services occupations in Chesterfield, the most male-oriented occupations are Security & Protection (100.0%), Firefighting & Prevention (100.0%), and Law Enforcement (100.0%), while the most female-oriented occupations are Healthcare Support (87.9%), Personal Care & Service (68.9%), and Food Preparation & Serving (49.3%).
| Occupation | Male | Female |
| Healthcare Support | 30 (12.1%) | 218 (87.9%) |
| Security & Protection | 138 (100.0%) | 0 (0.0%) |
| Firefighting & Prevention | 127 (100.0%) | 0 (0.0%) |
| Law Enforcement | 11 (100.0%) | 0 (0.0%) |
| Food Preparation & Serving | 386 (50.7%) | 376 (49.3%) |
| Cleaning & Maintenance | 120 (88.2%) | 16 (11.8%) |
| Personal Care & Service | 102 (31.1%) | 226 (68.9%) |
| Total (Category) | 776 (48.1%) | 836 (51.9%) |
| Total (Overall) | 13,724 (55.4%) | 11,064 (44.6%) |
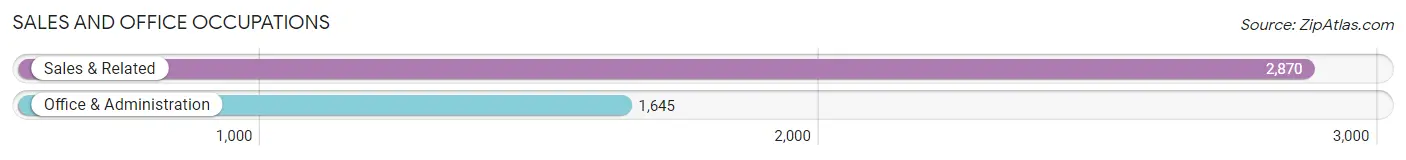
Sales and Office Occupations
The most common Sales and Office occupations in Chesterfield are Sales & Related (2,870 | 11.6%), and Office & Administration (1,645 | 6.6%).
Sales and Office Occupations by Sex
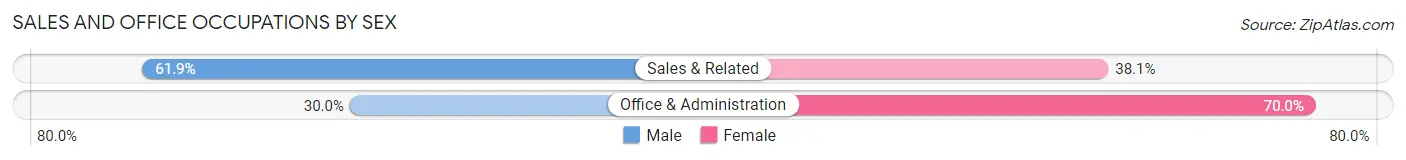
| Occupation | Male | Female |
| Sales & Related | 1,776 (61.9%) | 1,094 (38.1%) |
| Office & Administration | 493 (30.0%) | 1,152 (70.0%) |
| Total (Category) | 2,269 (50.2%) | 2,246 (49.7%) |
| Total (Overall) | 13,724 (55.4%) | 11,064 (44.6%) |
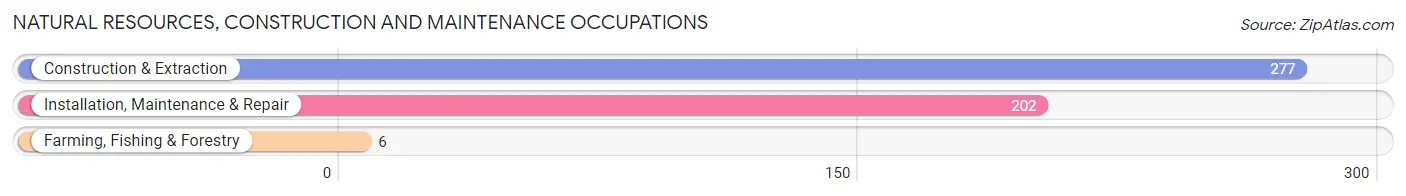
Natural Resources, Construction and Maintenance Occupations
The most common Natural Resources, Construction and Maintenance occupations in Chesterfield are Construction & Extraction (277 | 1.1%), Installation, Maintenance & Repair (202 | 0.8%), and Farming, Fishing & Forestry (6 | 0.0%).
Natural Resources, Construction and Maintenance Occupations by Sex
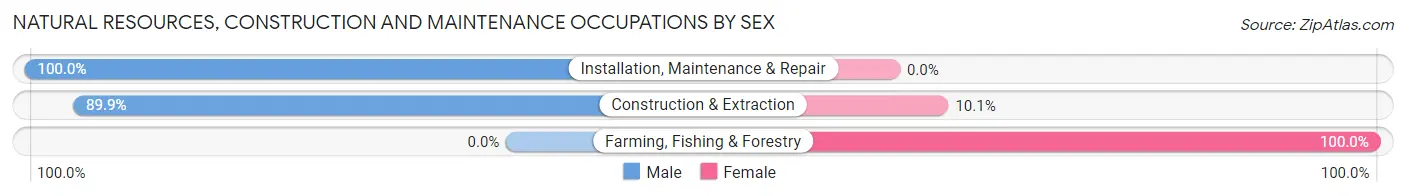
| Occupation | Male | Female |
| Farming, Fishing & Forestry | 0 (0.0%) | 6 (100.0%) |
| Construction & Extraction | 249 (89.9%) | 28 (10.1%) |
| Installation, Maintenance & Repair | 202 (100.0%) | 0 (0.0%) |
| Total (Category) | 451 (93.0%) | 34 (7.0%) |
| Total (Overall) | 13,724 (55.4%) | 11,064 (44.6%) |
Production, Transportation and Moving Occupations
The most common Production, Transportation and Moving occupations in Chesterfield are Production (474 | 1.9%), Transportation (371 | 1.5%), and Material Moving (289 | 1.2%).
Production, Transportation and Moving Occupations by Sex
| Occupation | Male | Female |
| Production | 365 (77.0%) | 109 (23.0%) |
| Transportation | 340 (91.6%) | 31 (8.4%) |
| Material Moving | 197 (68.2%) | 92 (31.8%) |
| Total (Category) | 902 (79.5%) | 232 (20.5%) |
| Total (Overall) | 13,724 (55.4%) | 11,064 (44.6%) |
Employment Industries by Sex in Chesterfield
Employment Industries in Chesterfield
The major employment industries in Chesterfield include Professional & Scientific (4,412 | 17.8%), Health Care & Social Assistance (3,321 | 13.4%), Manufacturing (3,012 | 12.1%), Educational Services (2,460 | 9.9%), and Finance & Insurance (2,330 | 9.4%).
Employment Industries by Sex in Chesterfield
The Chesterfield industries that see more men than women are Enterprise Management (100.0%), Utilities (78.9%), and Construction (74.2%), whereas the industries that tend to have a higher number of women are Educational Services (68.5%), Health Care & Social Assistance (64.3%), and Public Administration (60.5%).
| Industry | Male | Female |
| Agriculture, Fishing & Hunting | 95 (58.3%) | 68 (41.7%) |
| Mining, Quarrying, & Extraction | 44 (63.8%) | 25 (36.2%) |
| Construction | 630 (74.2%) | 219 (25.8%) |
| Manufacturing | 1,944 (64.5%) | 1,068 (35.5%) |
| Wholesale Trade | 325 (40.5%) | 477 (59.5%) |
| Retail Trade | 946 (52.3%) | 861 (47.6%) |
| Transportation & Warehousing | 479 (69.8%) | 207 (30.2%) |
| Utilities | 101 (78.9%) | 27 (21.1%) |
| Information | 613 (67.4%) | 297 (32.6%) |
| Finance & Insurance | 1,546 (66.3%) | 784 (33.7%) |
| Real Estate, Rental & Leasing | 391 (62.2%) | 238 (37.8%) |
| Professional & Scientific | 2,985 (67.7%) | 1,427 (32.3%) |
| Enterprise Management | 108 (100.0%) | 0 (0.0%) |
| Administrative & Support | 445 (56.2%) | 347 (43.8%) |
| Educational Services | 775 (31.5%) | 1,685 (68.5%) |
| Health Care & Social Assistance | 1,187 (35.7%) | 2,134 (64.3%) |
| Arts, Entertainment & Recreation | 347 (74.2%) | 121 (25.9%) |
| Accommodation & Food Services | 352 (40.6%) | 516 (59.5%) |
| Public Administration | 64 (39.5%) | 98 (60.5%) |
| Total | 13,724 (55.4%) | 11,064 (44.6%) |
Education in Chesterfield
School Enrollment in Chesterfield
The most common levels of schooling among the 11,561 students in Chesterfield are high school (3,370 | 29.1%), elementary school (2,204 | 19.1%), and middle school (1,866 | 16.1%).
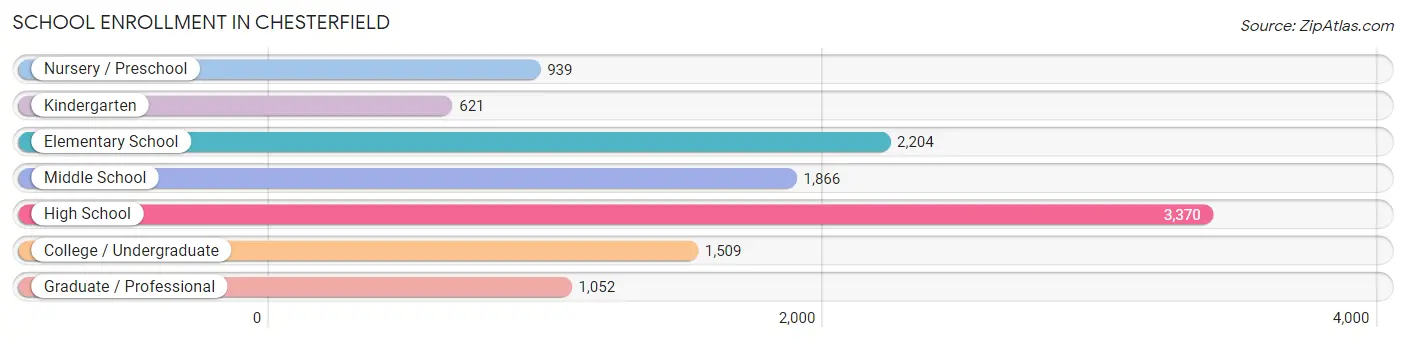
| School Level | # Students | % Students |
| Nursery / Preschool | 939 | 8.1% |
| Kindergarten | 621 | 5.4% |
| Elementary School | 2,204 | 19.1% |
| Middle School | 1,866 | 16.1% |
| High School | 3,370 | 29.1% |
| College / Undergraduate | 1,509 | 13.1% |
| Graduate / Professional | 1,052 | 9.1% |
| Total | 11,561 | 100.0% |
School Enrollment by Age by Funding Source in Chesterfield
Out of a total of 11,561 students who are enrolled in schools in Chesterfield, 3,515 (30.4%) attend a private institution, while the remaining 8,046 (69.6%) are enrolled in public schools. The age group of 3 to 4 year olds has the highest likelihood of being enrolled in private schools, with 464 (65.6% in the age bracket) enrolled. Conversely, the age group of 10 to 14 year olds has the lowest likelihood of being enrolled in a private school, with 2,292 (84.8% in the age bracket) attending a public institution.
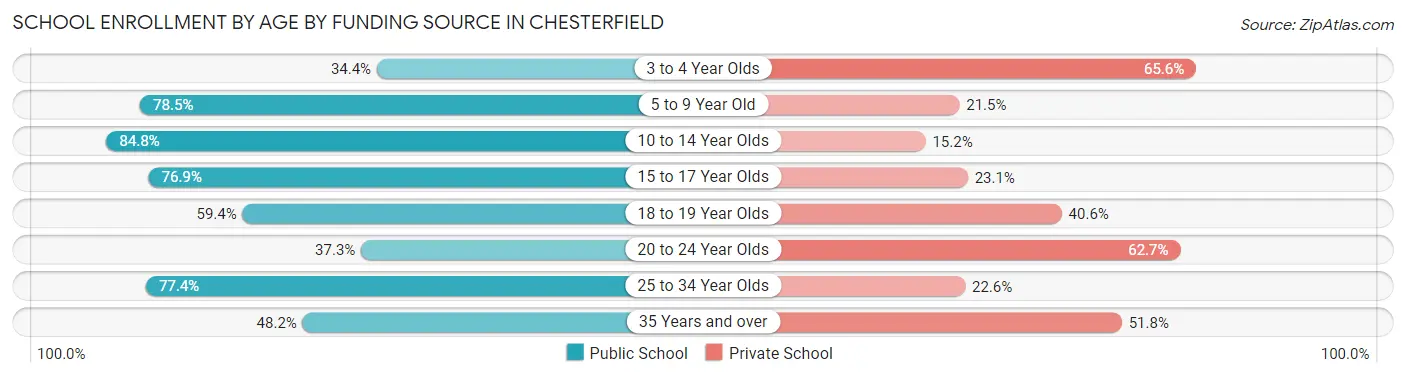
| Age Bracket | Public School | Private School |
| 3 to 4 Year Olds | 243 (34.4%) | 464 (65.6%) |
| 5 to 9 Year Old | 2,140 (78.5%) | 587 (21.5%) |
| 10 to 14 Year Olds | 2,292 (84.8%) | 412 (15.2%) |
| 15 to 17 Year Olds | 1,708 (76.9%) | 513 (23.1%) |
| 18 to 19 Year Olds | 477 (59.4%) | 326 (40.6%) |
| 20 to 24 Year Olds | 453 (37.3%) | 761 (62.7%) |
| 25 to 34 Year Olds | 421 (77.4%) | 123 (22.6%) |
| 35 Years and over | 309 (48.2%) | 332 (51.8%) |
| Total | 8,046 (69.6%) | 3,515 (30.4%) |
Educational Attainment by Field of Study in Chesterfield
Business (6,538 | 23.6%), engineering (3,304 | 11.9%), education (2,974 | 10.7%), science & technology (2,410 | 8.7%), and social sciences (1,834 | 6.6%) are the most common fields of study among 27,676 individuals in Chesterfield who have obtained a bachelor's degree or higher.
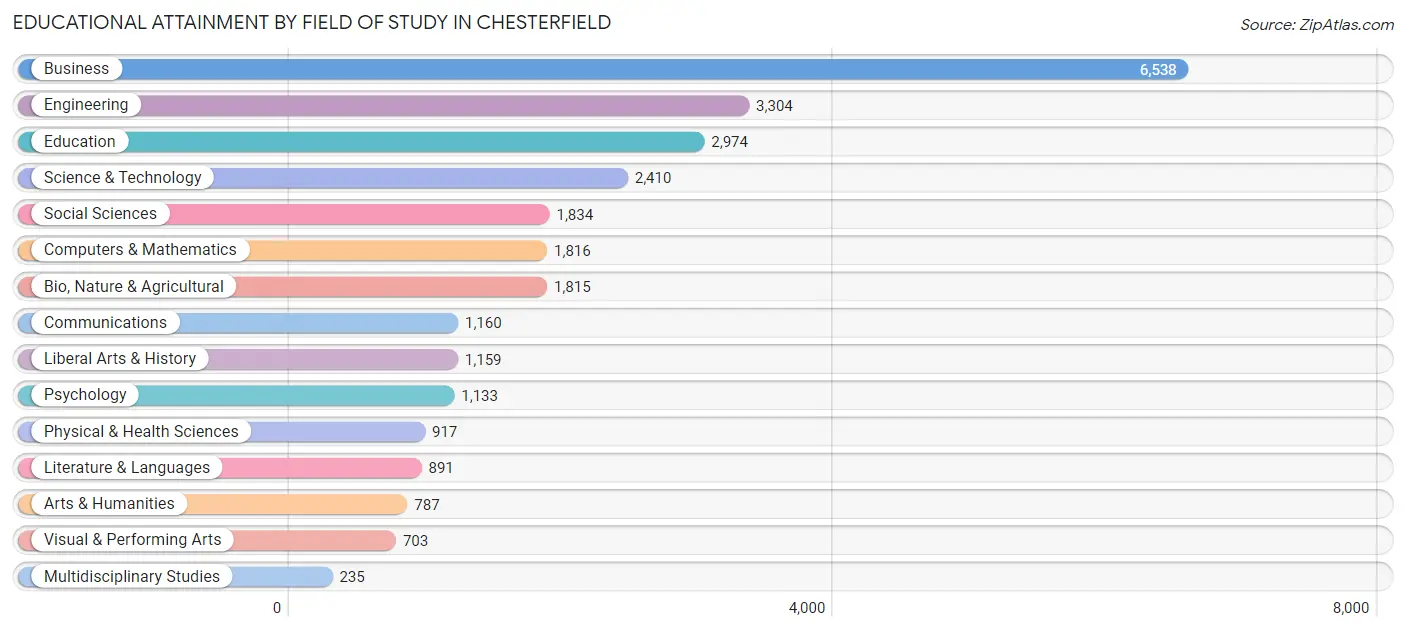
| Field of Study | # Graduates | % Graduates |
| Computers & Mathematics | 1,816 | 6.6% |
| Bio, Nature & Agricultural | 1,815 | 6.6% |
| Physical & Health Sciences | 917 | 3.3% |
| Psychology | 1,133 | 4.1% |
| Social Sciences | 1,834 | 6.6% |
| Engineering | 3,304 | 11.9% |
| Multidisciplinary Studies | 235 | 0.9% |
| Science & Technology | 2,410 | 8.7% |
| Business | 6,538 | 23.6% |
| Education | 2,974 | 10.7% |
| Literature & Languages | 891 | 3.2% |
| Liberal Arts & History | 1,159 | 4.2% |
| Visual & Performing Arts | 703 | 2.5% |
| Communications | 1,160 | 4.2% |
| Arts & Humanities | 787 | 2.8% |
| Total | 27,676 | 100.0% |
Transportation & Commute in Chesterfield
Vehicle Availability by Sex in Chesterfield
The most prevalent vehicle ownership categories in Chesterfield are males with 2 vehicles (7,252, accounting for 53.0%) and females with 2 vehicles (5,712, making up 67.2%).
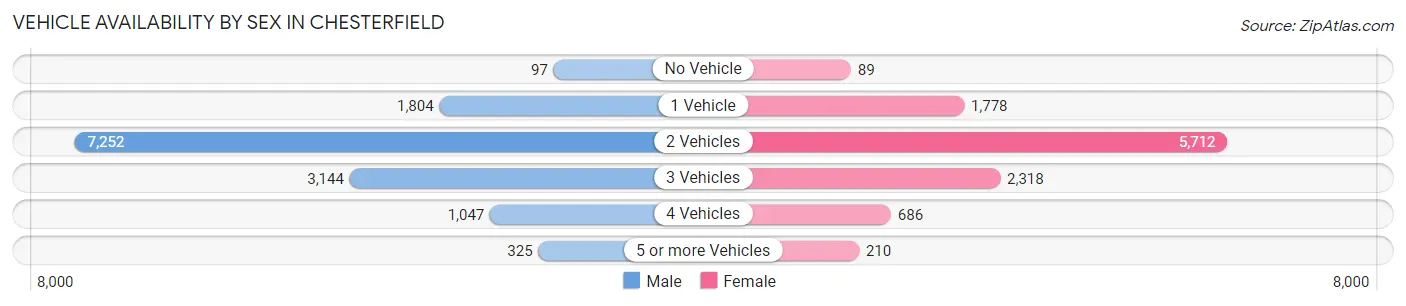
| Vehicles Available | Male | Female |
| No Vehicle | 97 (0.7%) | 89 (0.8%) |
| 1 Vehicle | 1,804 (13.2%) | 1,778 (16.5%) |
| 2 Vehicles | 7,252 (53.0%) | 5,712 (52.9%) |
| 3 Vehicles | 3,144 (23.0%) | 2,318 (21.5%) |
| 4 Vehicles | 1,047 (7.7%) | 686 (6.4%) |
| 5 or more Vehicles | 325 (2.4%) | 210 (1.9%) |
| Total | 13,669 (100.0%) | 10,793 (100.0%) |
Commute Time in Chesterfield
The most frequently occuring commute durations in Chesterfield are 20 to 24 minutes (3,893 commuters, 19.9%), 15 to 19 minutes (3,200 commuters, 16.4%), and 10 to 14 minutes (3,018 commuters, 15.4%).
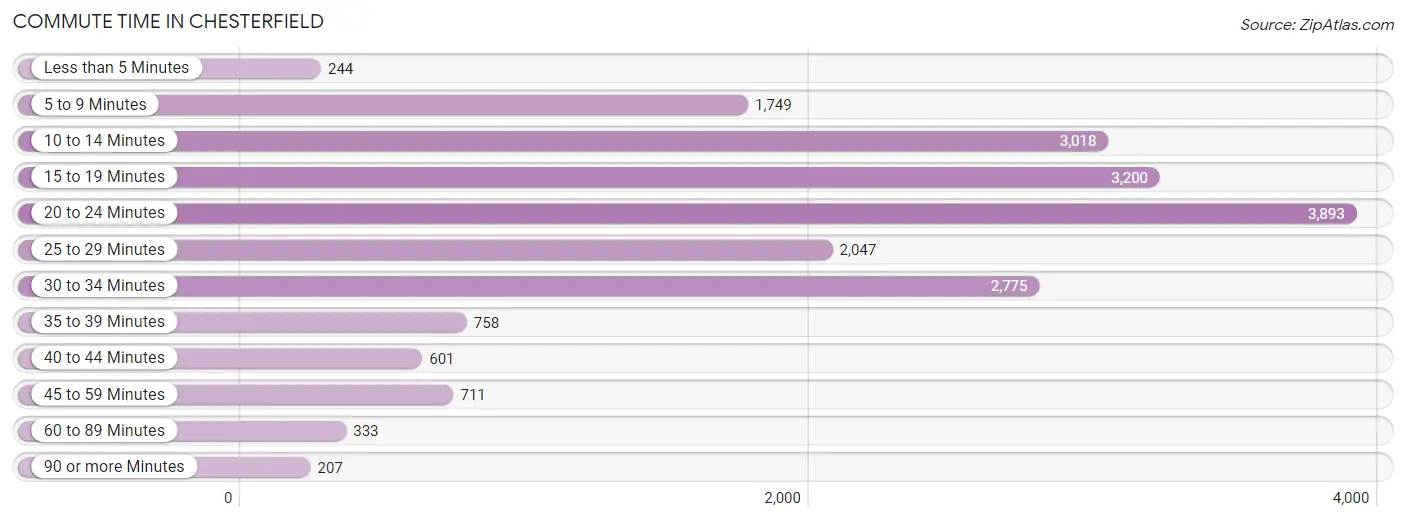
| Commute Time | # Commuters | % Commuters |
| Less than 5 Minutes | 244 | 1.3% |
| 5 to 9 Minutes | 1,749 | 8.9% |
| 10 to 14 Minutes | 3,018 | 15.4% |
| 15 to 19 Minutes | 3,200 | 16.4% |
| 20 to 24 Minutes | 3,893 | 19.9% |
| 25 to 29 Minutes | 2,047 | 10.5% |
| 30 to 34 Minutes | 2,775 | 14.2% |
| 35 to 39 Minutes | 758 | 3.9% |
| 40 to 44 Minutes | 601 | 3.1% |
| 45 to 59 Minutes | 711 | 3.6% |
| 60 to 89 Minutes | 333 | 1.7% |
| 90 or more Minutes | 207 | 1.1% |
Commute Time by Sex in Chesterfield
The most common commute times in Chesterfield are 20 to 24 minutes (2,389 commuters, 21.6%) for males and 15 to 19 minutes (1,785 commuters, 21.0%) for females.
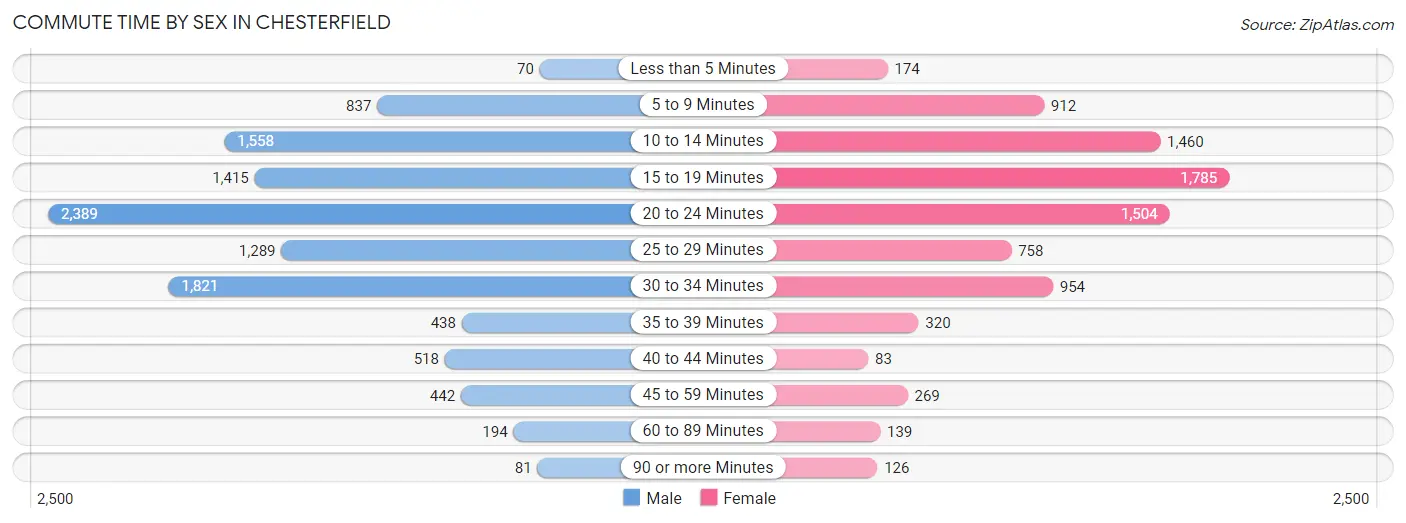
| Commute Time | Male | Female |
| Less than 5 Minutes | 70 (0.6%) | 174 (2.1%) |
| 5 to 9 Minutes | 837 (7.6%) | 912 (10.7%) |
| 10 to 14 Minutes | 1,558 (14.1%) | 1,460 (17.2%) |
| 15 to 19 Minutes | 1,415 (12.8%) | 1,785 (21.0%) |
| 20 to 24 Minutes | 2,389 (21.6%) | 1,504 (17.7%) |
| 25 to 29 Minutes | 1,289 (11.7%) | 758 (8.9%) |
| 30 to 34 Minutes | 1,821 (16.5%) | 954 (11.2%) |
| 35 to 39 Minutes | 438 (4.0%) | 320 (3.8%) |
| 40 to 44 Minutes | 518 (4.7%) | 83 (1.0%) |
| 45 to 59 Minutes | 442 (4.0%) | 269 (3.2%) |
| 60 to 89 Minutes | 194 (1.8%) | 139 (1.6%) |
| 90 or more Minutes | 81 (0.7%) | 126 (1.5%) |
Time of Departure to Work by Sex in Chesterfield
The most frequent times of departure to work in Chesterfield are 8:00 AM to 8:29 AM (2,068, 18.7%) for males and 7:30 AM to 7:59 AM (1,495, 17.6%) for females.
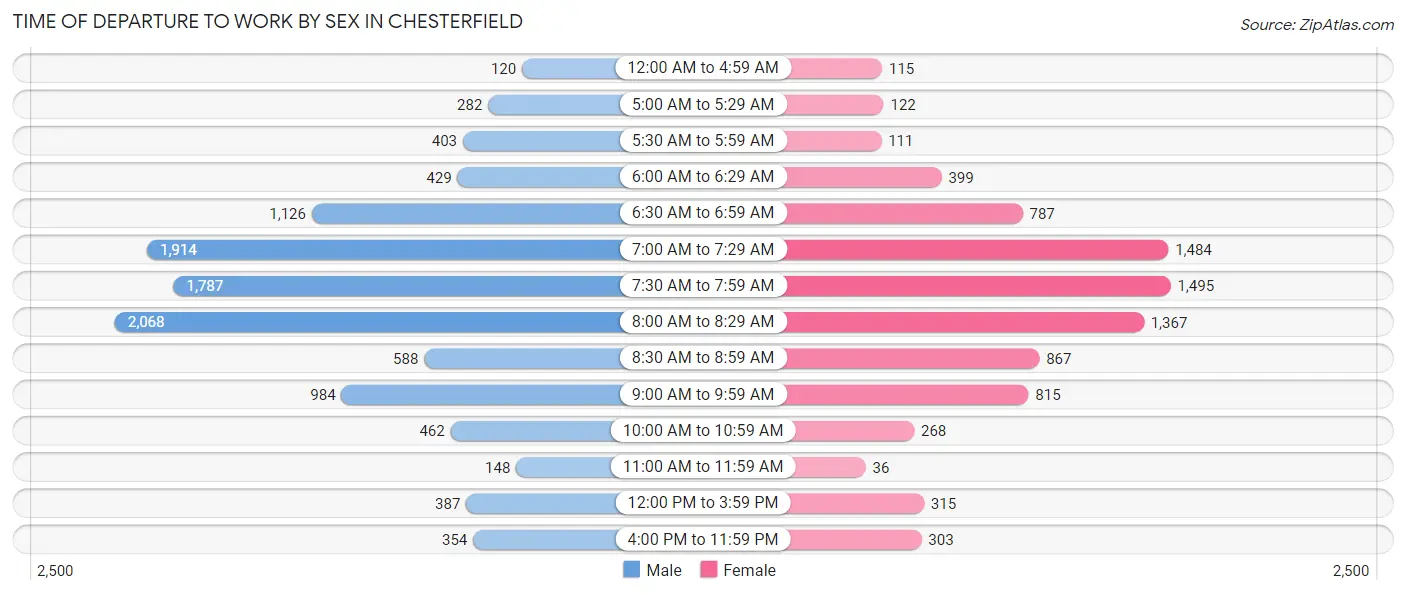
| Time of Departure | Male | Female |
| 12:00 AM to 4:59 AM | 120 (1.1%) | 115 (1.4%) |
| 5:00 AM to 5:29 AM | 282 (2.5%) | 122 (1.4%) |
| 5:30 AM to 5:59 AM | 403 (3.6%) | 111 (1.3%) |
| 6:00 AM to 6:29 AM | 429 (3.9%) | 399 (4.7%) |
| 6:30 AM to 6:59 AM | 1,126 (10.2%) | 787 (9.3%) |
| 7:00 AM to 7:29 AM | 1,914 (17.3%) | 1,484 (17.5%) |
| 7:30 AM to 7:59 AM | 1,787 (16.2%) | 1,495 (17.6%) |
| 8:00 AM to 8:29 AM | 2,068 (18.7%) | 1,367 (16.1%) |
| 8:30 AM to 8:59 AM | 588 (5.3%) | 867 (10.2%) |
| 9:00 AM to 9:59 AM | 984 (8.9%) | 815 (9.6%) |
| 10:00 AM to 10:59 AM | 462 (4.2%) | 268 (3.2%) |
| 11:00 AM to 11:59 AM | 148 (1.3%) | 36 (0.4%) |
| 12:00 PM to 3:59 PM | 387 (3.5%) | 315 (3.7%) |
| 4:00 PM to 11:59 PM | 354 (3.2%) | 303 (3.6%) |
| Total | 11,052 (100.0%) | 8,484 (100.0%) |
Housing Occupancy in Chesterfield
Occupancy by Ownership in Chesterfield
Of the total 20,447 dwellings in Chesterfield, owner-occupied units account for 16,247 (79.5%), while renter-occupied units make up 4,200 (20.5%).
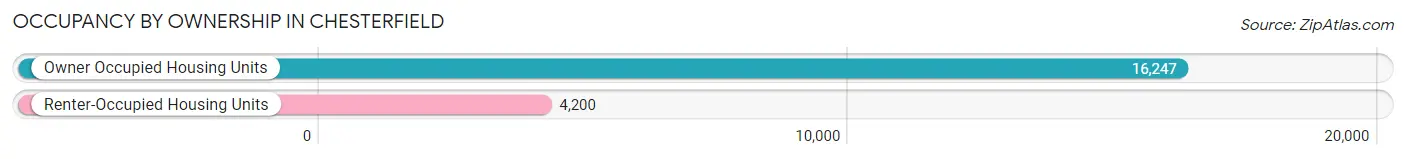
| Occupancy | # Housing Units | % Housing Units |
| Owner Occupied Housing Units | 16,247 | 79.5% |
| Renter-Occupied Housing Units | 4,200 | 20.5% |
| Total Occupied Housing Units | 20,447 | 100.0% |
Occupancy by Household Size in Chesterfield
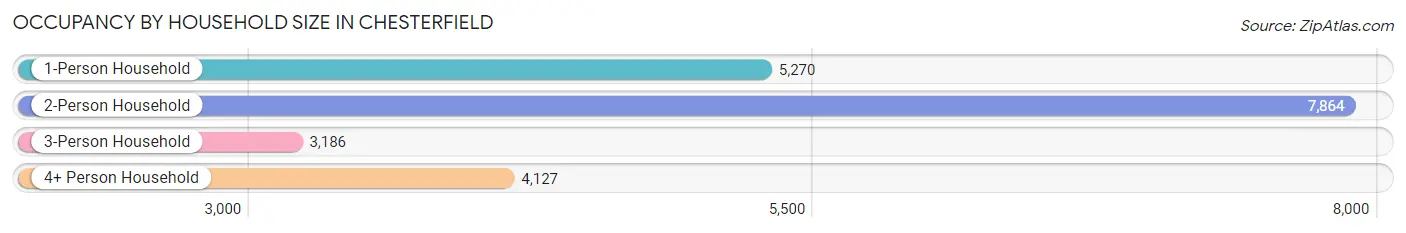
| Household Size | # Housing Units | % Housing Units |
| 1-Person Household | 5,270 | 25.8% |
| 2-Person Household | 7,864 | 38.5% |
| 3-Person Household | 3,186 | 15.6% |
| 4+ Person Household | 4,127 | 20.2% |
| Total Housing Units | 20,447 | 100.0% |
Occupancy by Ownership by Household Size in Chesterfield
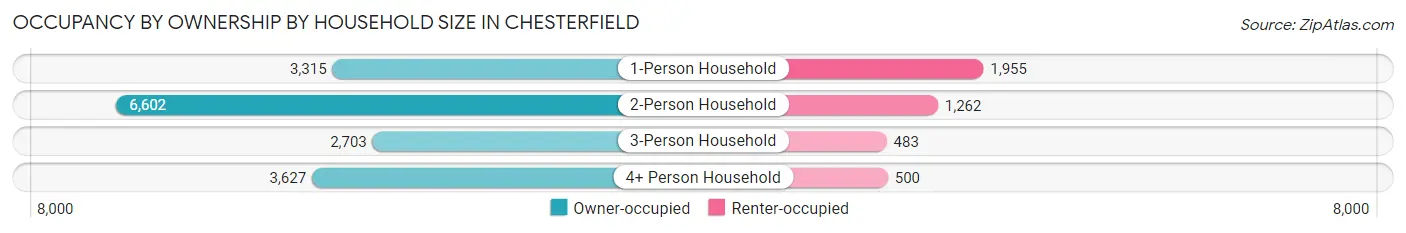
| Household Size | Owner-occupied | Renter-occupied |
| 1-Person Household | 3,315 (62.9%) | 1,955 (37.1%) |
| 2-Person Household | 6,602 (84.0%) | 1,262 (16.1%) |
| 3-Person Household | 2,703 (84.8%) | 483 (15.2%) |
| 4+ Person Household | 3,627 (87.9%) | 500 (12.1%) |
| Total Housing Units | 16,247 (79.5%) | 4,200 (20.5%) |
Occupancy by Educational Attainment in Chesterfield
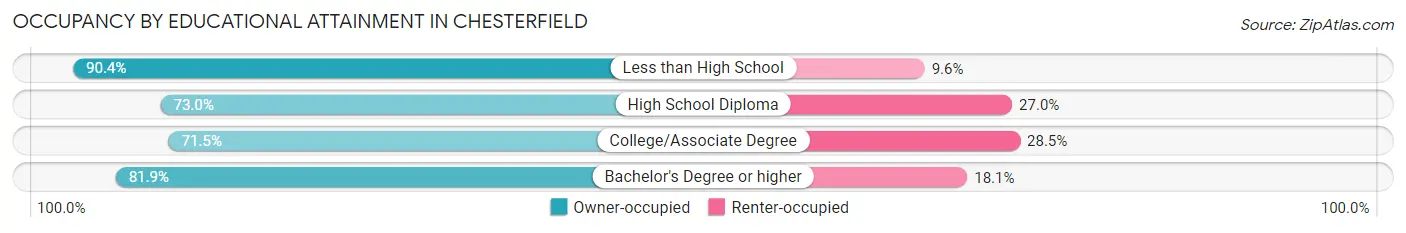
| Household Size | Owner-occupied | Renter-occupied |
| Less than High School | 216 (90.4%) | 23 (9.6%) |
| High School Diploma | 997 (73.0%) | 368 (27.0%) |
| College/Associate Degree | 2,757 (71.5%) | 1,101 (28.5%) |
| Bachelor's Degree or higher | 12,277 (81.9%) | 2,708 (18.1%) |
Occupancy by Age of Householder in Chesterfield
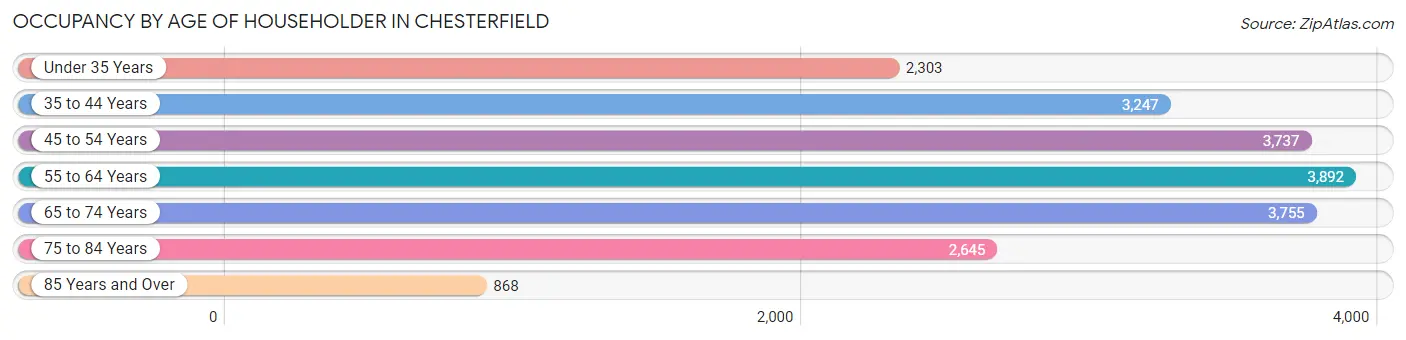
| Age Bracket | # Households | % Households |
| Under 35 Years | 2,303 | 11.3% |
| 35 to 44 Years | 3,247 | 15.9% |
| 45 to 54 Years | 3,737 | 18.3% |
| 55 to 64 Years | 3,892 | 19.0% |
| 65 to 74 Years | 3,755 | 18.4% |
| 75 to 84 Years | 2,645 | 12.9% |
| 85 Years and Over | 868 | 4.3% |
| Total | 20,447 | 100.0% |
Housing Finances in Chesterfield
Median Income by Occupancy in Chesterfield
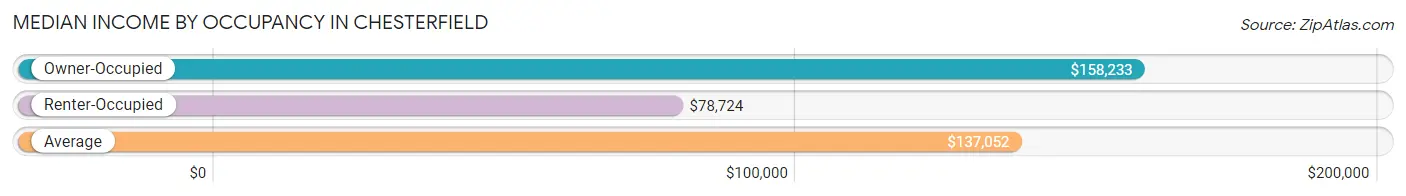
| Occupancy Type | # Households | Median Income |
| Owner-Occupied | 16,247 (79.5%) | $158,233 |
| Renter-Occupied | 4,200 (20.5%) | $78,724 |
| Average | 20,447 (100.0%) | $137,052 |
Occupancy by Householder Income Bracket in Chesterfield
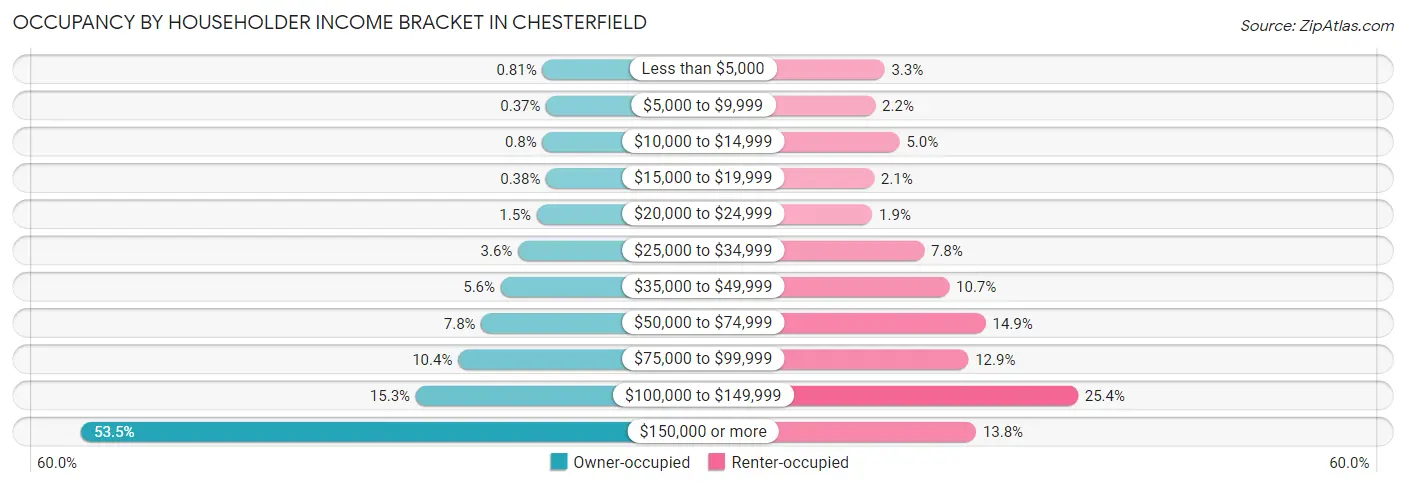
| Income Bracket | Owner-occupied | Renter-occupied |
| Less than $5,000 | 131 (0.8%) | 139 (3.3%) |
| $5,000 to $9,999 | 60 (0.4%) | 94 (2.2%) |
| $10,000 to $14,999 | 130 (0.8%) | 211 (5.0%) |
| $15,000 to $19,999 | 61 (0.4%) | 88 (2.1%) |
| $20,000 to $24,999 | 236 (1.5%) | 80 (1.9%) |
| $25,000 to $34,999 | 583 (3.6%) | 329 (7.8%) |
| $35,000 to $49,999 | 905 (5.6%) | 449 (10.7%) |
| $50,000 to $74,999 | 1,266 (7.8%) | 624 (14.9%) |
| $75,000 to $99,999 | 1,696 (10.4%) | 541 (12.9%) |
| $100,000 to $149,999 | 2,482 (15.3%) | 1,067 (25.4%) |
| $150,000 or more | 8,697 (53.5%) | 578 (13.8%) |
| Total | 16,247 (100.0%) | 4,200 (100.0%) |
Monthly Housing Cost Tiers in Chesterfield
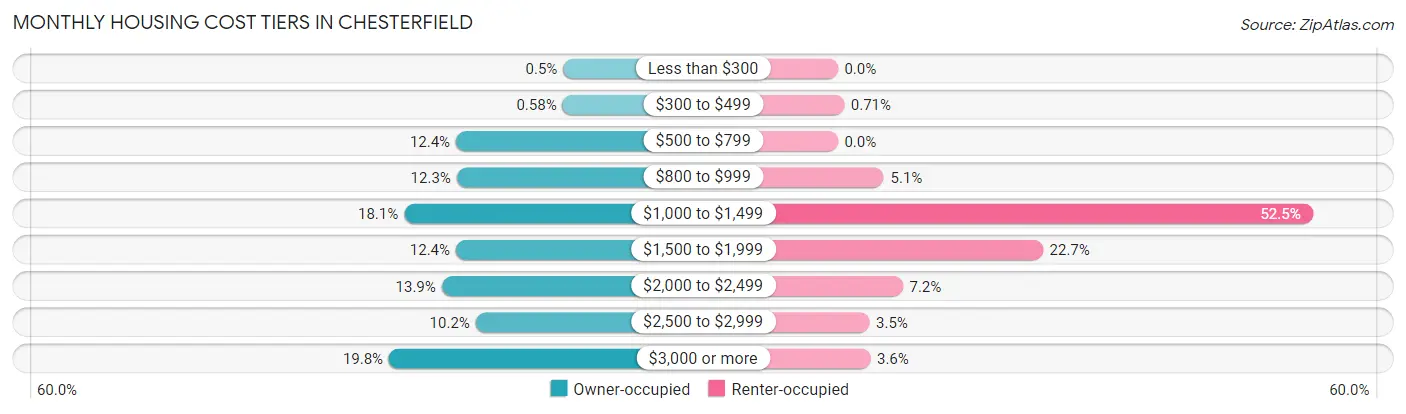
| Monthly Cost | Owner-occupied | Renter-occupied |
| Less than $300 | 81 (0.5%) | 0 (0.0%) |
| $300 to $499 | 95 (0.6%) | 30 (0.7%) |
| $500 to $799 | 2,007 (12.3%) | 0 (0.0%) |
| $800 to $999 | 1,994 (12.3%) | 214 (5.1%) |
| $1,000 to $1,499 | 2,937 (18.1%) | 2,204 (52.5%) |
| $1,500 to $1,999 | 2,008 (12.4%) | 952 (22.7%) |
| $2,000 to $2,499 | 2,264 (13.9%) | 302 (7.2%) |
| $2,500 to $2,999 | 1,652 (10.2%) | 147 (3.5%) |
| $3,000 or more | 3,209 (19.8%) | 151 (3.6%) |
| Total | 16,247 (100.0%) | 4,200 (100.0%) |
Physical Housing Characteristics in Chesterfield
Housing Structures in Chesterfield
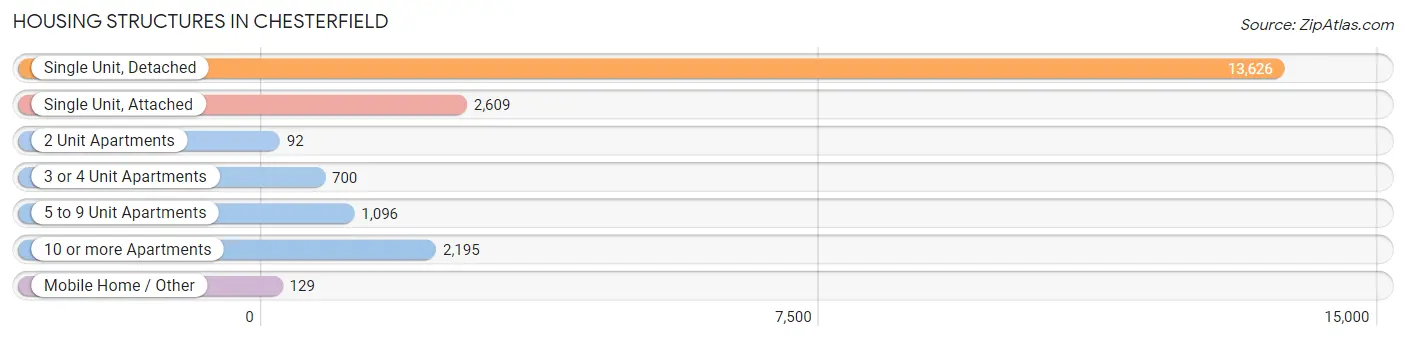
| Structure Type | # Housing Units | % Housing Units |
| Single Unit, Detached | 13,626 | 66.6% |
| Single Unit, Attached | 2,609 | 12.8% |
| 2 Unit Apartments | 92 | 0.4% |
| 3 or 4 Unit Apartments | 700 | 3.4% |
| 5 to 9 Unit Apartments | 1,096 | 5.4% |
| 10 or more Apartments | 2,195 | 10.7% |
| Mobile Home / Other | 129 | 0.6% |
| Total | 20,447 | 100.0% |
Housing Structures by Occupancy in Chesterfield
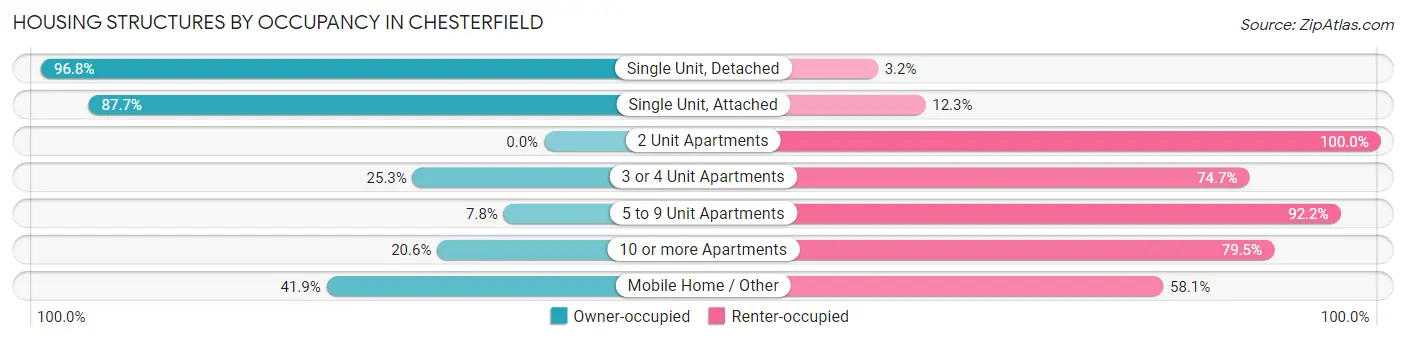
| Structure Type | Owner-occupied | Renter-occupied |
| Single Unit, Detached | 13,193 (96.8%) | 433 (3.2%) |
| Single Unit, Attached | 2,287 (87.7%) | 322 (12.3%) |
| 2 Unit Apartments | 0 (0.0%) | 92 (100.0%) |
| 3 or 4 Unit Apartments | 177 (25.3%) | 523 (74.7%) |
| 5 to 9 Unit Apartments | 85 (7.8%) | 1,011 (92.2%) |
| 10 or more Apartments | 451 (20.5%) | 1,744 (79.4%) |
| Mobile Home / Other | 54 (41.9%) | 75 (58.1%) |
| Total | 16,247 (79.5%) | 4,200 (20.5%) |
Housing Structures by Number of Rooms in Chesterfield
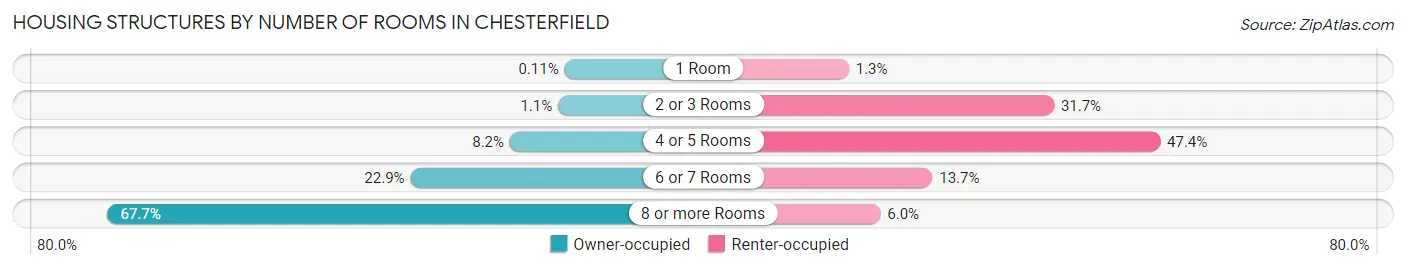
| Number of Rooms | Owner-occupied | Renter-occupied |
| 1 Room | 18 (0.1%) | 55 (1.3%) |
| 2 or 3 Rooms | 173 (1.1%) | 1,330 (31.7%) |
| 4 or 5 Rooms | 1,331 (8.2%) | 1,990 (47.4%) |
| 6 or 7 Rooms | 3,723 (22.9%) | 574 (13.7%) |
| 8 or more Rooms | 11,002 (67.7%) | 251 (6.0%) |
| Total | 16,247 (100.0%) | 4,200 (100.0%) |
Housing Structure by Heating Type in Chesterfield
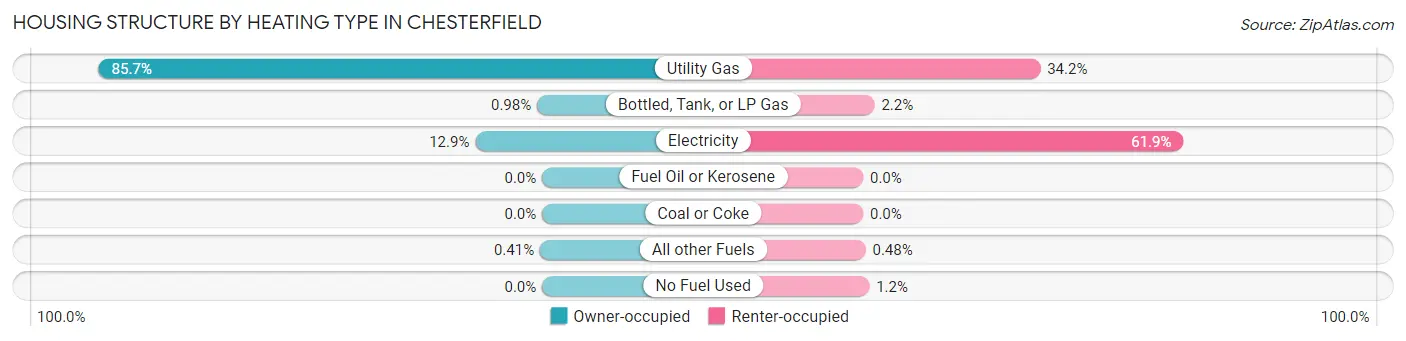
| Heating Type | Owner-occupied | Renter-occupied |
| Utility Gas | 13,922 (85.7%) | 1,438 (34.2%) |
| Bottled, Tank, or LP Gas | 160 (1.0%) | 93 (2.2%) |
| Electricity | 2,099 (12.9%) | 2,599 (61.9%) |
| Fuel Oil or Kerosene | 0 (0.0%) | 0 (0.0%) |
| Coal or Coke | 0 (0.0%) | 0 (0.0%) |
| All other Fuels | 66 (0.4%) | 20 (0.5%) |
| No Fuel Used | 0 (0.0%) | 50 (1.2%) |
| Total | 16,247 (100.0%) | 4,200 (100.0%) |
Household Vehicle Usage in Chesterfield
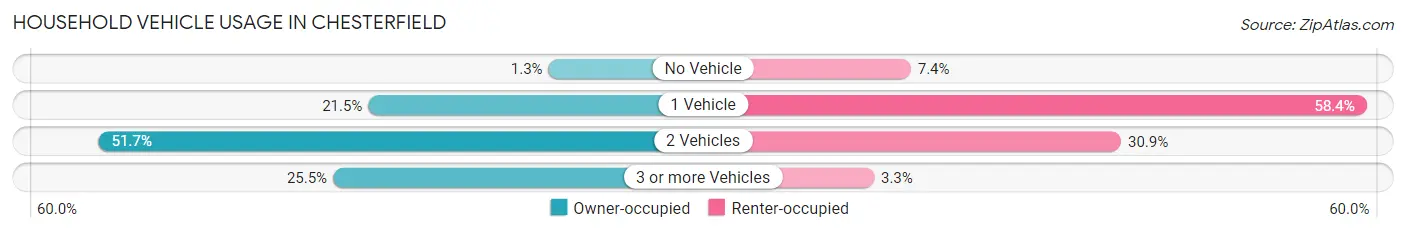
| Vehicles per Household | Owner-occupied | Renter-occupied |
| No Vehicle | 214 (1.3%) | 310 (7.4%) |
| 1 Vehicle | 3,495 (21.5%) | 2,454 (58.4%) |
| 2 Vehicles | 8,401 (51.7%) | 1,299 (30.9%) |
| 3 or more Vehicles | 4,137 (25.5%) | 137 (3.3%) |
| Total | 16,247 (100.0%) | 4,200 (100.0%) |
Real Estate & Mortgages in Chesterfield
Real Estate and Mortgage Overview in Chesterfield
| Characteristic | Without Mortgage | With Mortgage |
| Housing Units | 6,479 | 9,768 |
| Median Property Value | $415,700 | $452,400 |
| Median Household Income | $116,162 | $6,140 |
| Monthly Housing Costs | $894 | $3,115 |
| Real Estate Taxes | $5,305 | $166 |
Property Value by Mortgage Status in Chesterfield
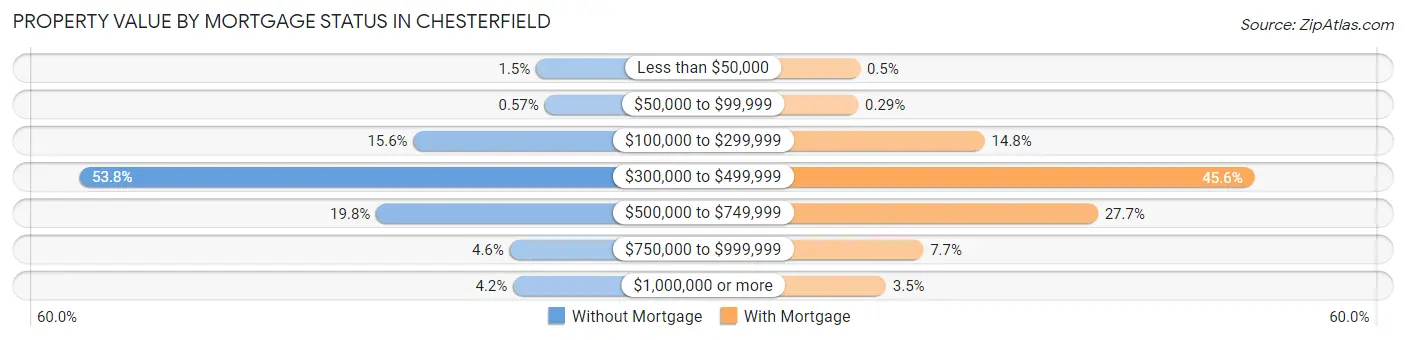
| Property Value | Without Mortgage | With Mortgage |
| Less than $50,000 | 100 (1.5%) | 49 (0.5%) |
| $50,000 to $99,999 | 37 (0.6%) | 28 (0.3%) |
| $100,000 to $299,999 | 1,008 (15.6%) | 1,441 (14.7%) |
| $300,000 to $499,999 | 3,484 (53.8%) | 4,453 (45.6%) |
| $500,000 to $749,999 | 1,284 (19.8%) | 2,704 (27.7%) |
| $750,000 to $999,999 | 296 (4.6%) | 755 (7.7%) |
| $1,000,000 or more | 270 (4.2%) | 338 (3.5%) |
| Total | 6,479 (100.0%) | 9,768 (100.0%) |
Household Income by Mortgage Status in Chesterfield
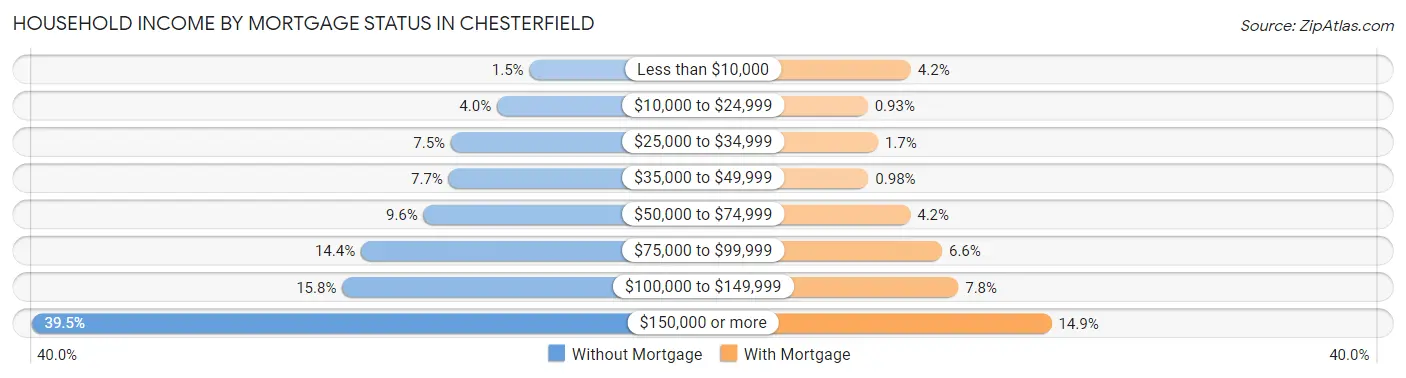
| Household Income | Without Mortgage | With Mortgage |
| Less than $10,000 | 100 (1.5%) | 412 (4.2%) |
| $10,000 to $24,999 | 260 (4.0%) | 91 (0.9%) |
| $25,000 to $34,999 | 487 (7.5%) | 167 (1.7%) |
| $35,000 to $49,999 | 498 (7.7%) | 96 (1.0%) |
| $50,000 to $74,999 | 622 (9.6%) | 407 (4.2%) |
| $75,000 to $99,999 | 931 (14.4%) | 644 (6.6%) |
| $100,000 to $149,999 | 1,024 (15.8%) | 765 (7.8%) |
| $150,000 or more | 2,557 (39.5%) | 1,458 (14.9%) |
| Total | 6,479 (100.0%) | 9,768 (100.0%) |
Property Value to Household Income Ratio in Chesterfield
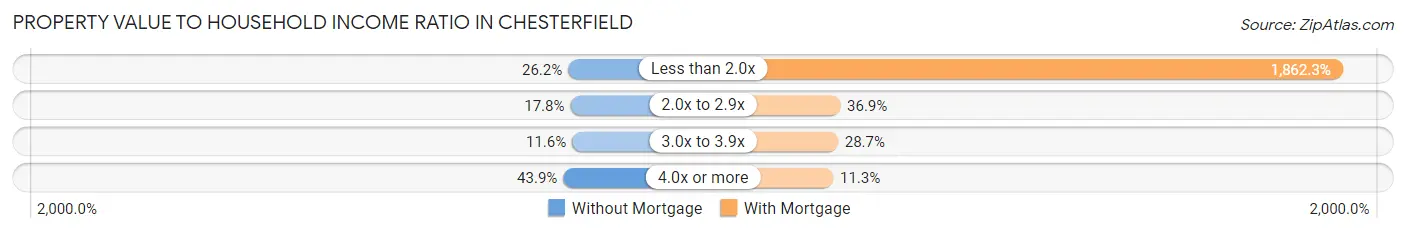
| Value-to-Income Ratio | Without Mortgage | With Mortgage |
| Less than 2.0x | 1,696 (26.2%) | 181,905 (1,862.2%) |
| 2.0x to 2.9x | 1,154 (17.8%) | 3,605 (36.9%) |
| 3.0x to 3.9x | 752 (11.6%) | 2,803 (28.7%) |
| 4.0x or more | 2,843 (43.9%) | 1,105 (11.3%) |
| Total | 6,479 (100.0%) | 9,768 (100.0%) |
Real Estate Taxes by Mortgage Status in Chesterfield
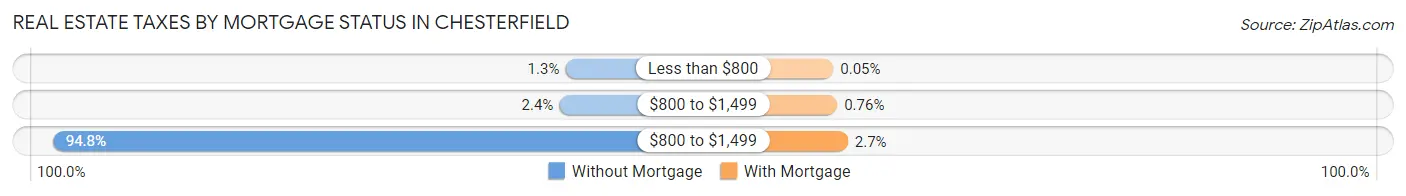
| Property Taxes | Without Mortgage | With Mortgage |
| Less than $800 | 81 (1.3%) | 5 (0.1%) |
| $800 to $1,499 | 153 (2.4%) | 74 (0.8%) |
| $800 to $1,499 | 6,145 (94.8%) | 265 (2.7%) |
| Total | 6,479 (100.0%) | 9,768 (100.0%) |
Health & Disability in Chesterfield
Health Insurance Coverage by Age in Chesterfield
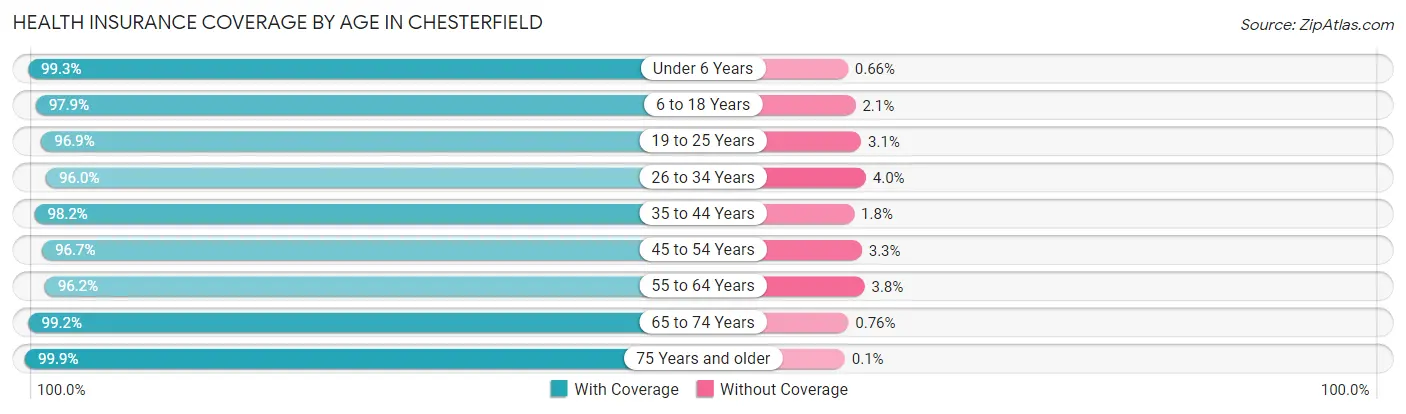
| Age Bracket | With Coverage | Without Coverage |
| Under 6 Years | 2,992 (99.3%) | 20 (0.7%) |
| 6 to 18 Years | 7,808 (97.9%) | 166 (2.1%) |
| 19 to 25 Years | 2,909 (96.9%) | 94 (3.1%) |
| 26 to 34 Years | 3,577 (96.0%) | 150 (4.0%) |
| 35 to 44 Years | 5,827 (98.2%) | 109 (1.8%) |
| 45 to 54 Years | 6,649 (96.7%) | 224 (3.3%) |
| 55 to 64 Years | 6,837 (96.2%) | 268 (3.8%) |
| 65 to 74 Years | 6,138 (99.2%) | 47 (0.8%) |
| 75 Years and older | 5,049 (99.9%) | 5 (0.1%) |
| Total | 47,786 (97.8%) | 1,083 (2.2%) |
Health Insurance Coverage by Citizenship Status in Chesterfield
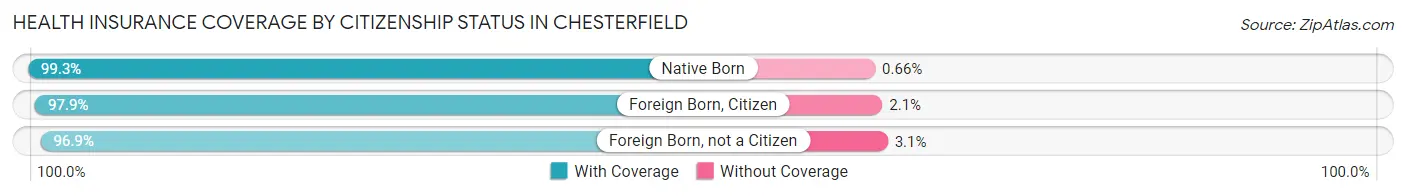
| Citizenship Status | With Coverage | Without Coverage |
| Native Born | 2,992 (99.3%) | 20 (0.7%) |
| Foreign Born, Citizen | 7,808 (97.9%) | 166 (2.1%) |
| Foreign Born, not a Citizen | 2,909 (96.9%) | 94 (3.1%) |
Health Insurance Coverage by Household Income in Chesterfield
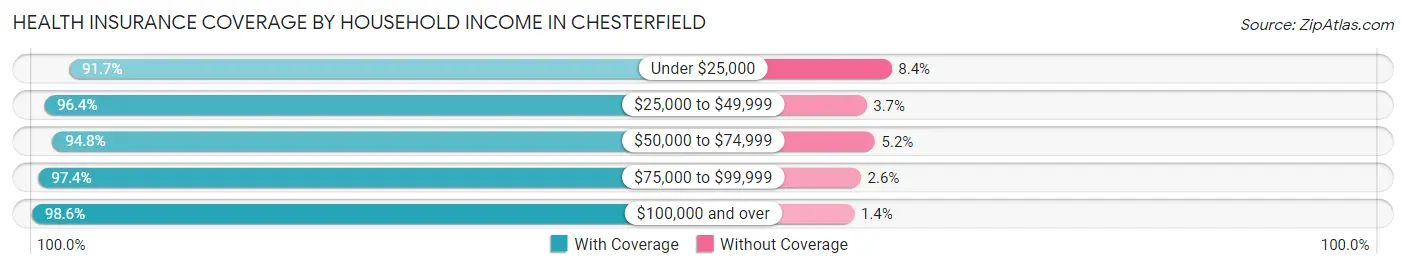
| Household Income | With Coverage | Without Coverage |
| Under $25,000 | 1,757 (91.6%) | 160 (8.4%) |
| $25,000 to $49,999 | 3,429 (96.4%) | 130 (3.6%) |
| $50,000 to $74,999 | 3,131 (94.8%) | 172 (5.2%) |
| $75,000 to $99,999 | 4,057 (97.4%) | 108 (2.6%) |
| $100,000 and over | 35,388 (98.6%) | 488 (1.4%) |
Public vs Private Health Insurance Coverage by Age in Chesterfield
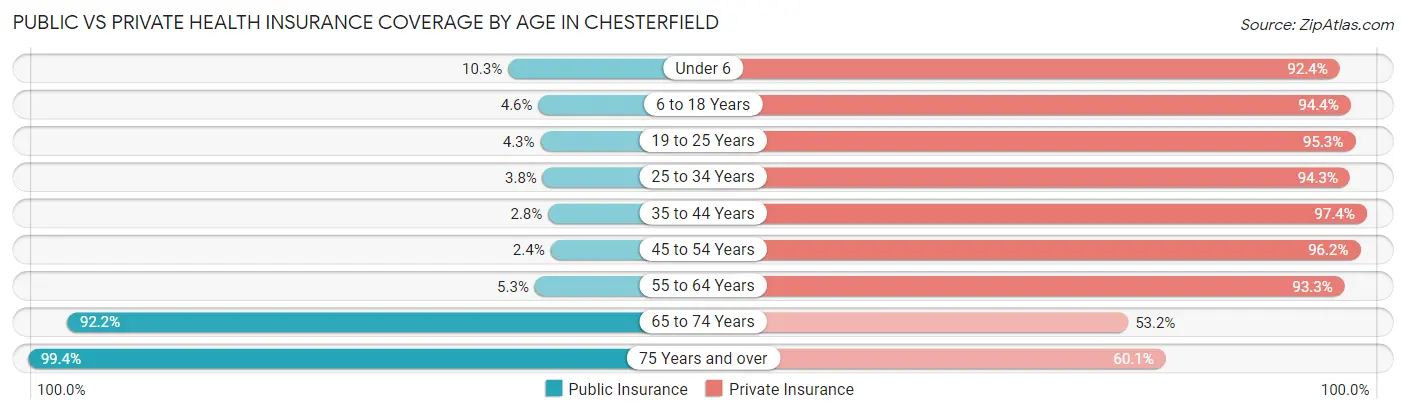
| Age Bracket | Public Insurance | Private Insurance |
| Under 6 | 309 (10.3%) | 2,783 (92.4%) |
| 6 to 18 Years | 370 (4.6%) | 7,531 (94.4%) |
| 19 to 25 Years | 128 (4.3%) | 2,861 (95.3%) |
| 25 to 34 Years | 143 (3.8%) | 3,514 (94.3%) |
| 35 to 44 Years | 168 (2.8%) | 5,782 (97.4%) |
| 45 to 54 Years | 164 (2.4%) | 6,613 (96.2%) |
| 55 to 64 Years | 377 (5.3%) | 6,630 (93.3%) |
| 65 to 74 Years | 5,700 (92.2%) | 3,288 (53.2%) |
| 75 Years and over | 5,024 (99.4%) | 3,038 (60.1%) |
| Total | 12,383 (25.3%) | 42,040 (86.0%) |
Disability Status by Sex by Age in Chesterfield
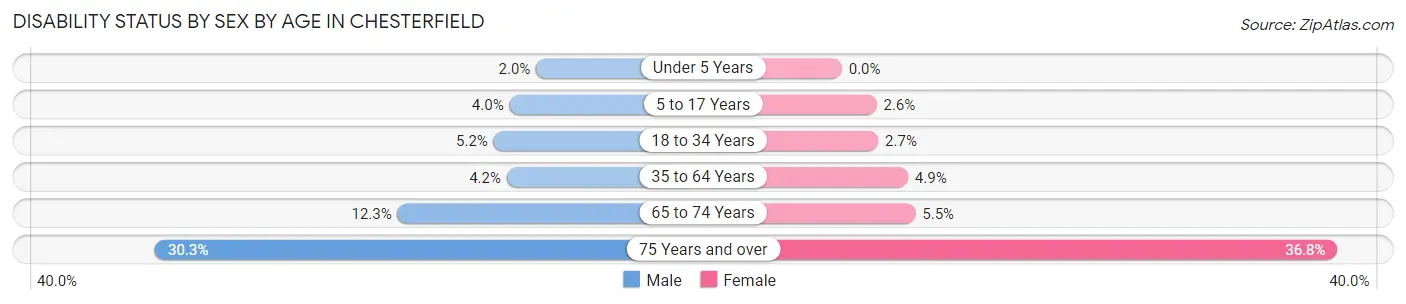
| Age Bracket | Male | Female |
| Under 5 Years | 28 (2.0%) | 0 (0.0%) |
| 5 to 17 Years | 154 (4.0%) | 101 (2.6%) |
| 18 to 34 Years | 192 (5.2%) | 97 (2.7%) |
| 35 to 64 Years | 421 (4.2%) | 486 (4.9%) |
| 65 to 74 Years | 349 (12.3%) | 183 (5.5%) |
| 75 Years and over | 591 (30.3%) | 1,142 (36.8%) |
Disability Class by Sex by Age in Chesterfield
Disability Class: Hearing Difficulty
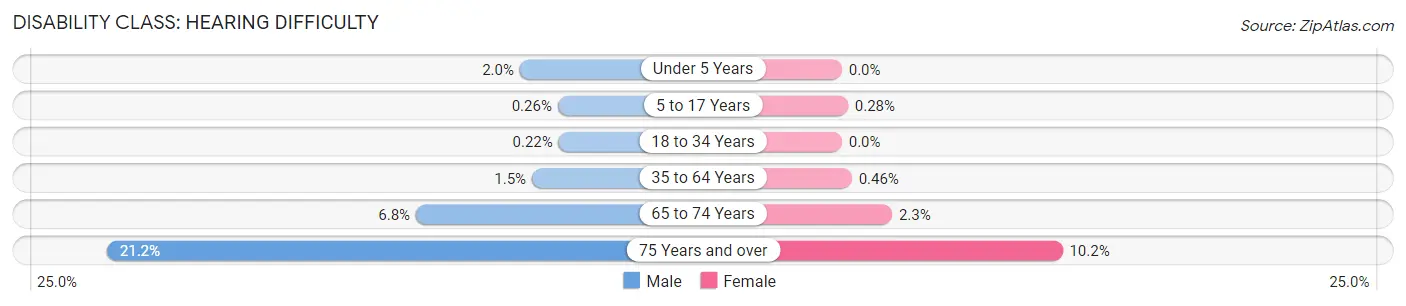
| Age Bracket | Male | Female |
| Under 5 Years | 28 (2.0%) | 0 (0.0%) |
| 5 to 17 Years | 10 (0.3%) | 11 (0.3%) |
| 18 to 34 Years | 8 (0.2%) | 0 (0.0%) |
| 35 to 64 Years | 146 (1.5%) | 46 (0.5%) |
| 65 to 74 Years | 194 (6.8%) | 78 (2.3%) |
| 75 Years and over | 413 (21.2%) | 318 (10.2%) |
Disability Class: Vision Difficulty
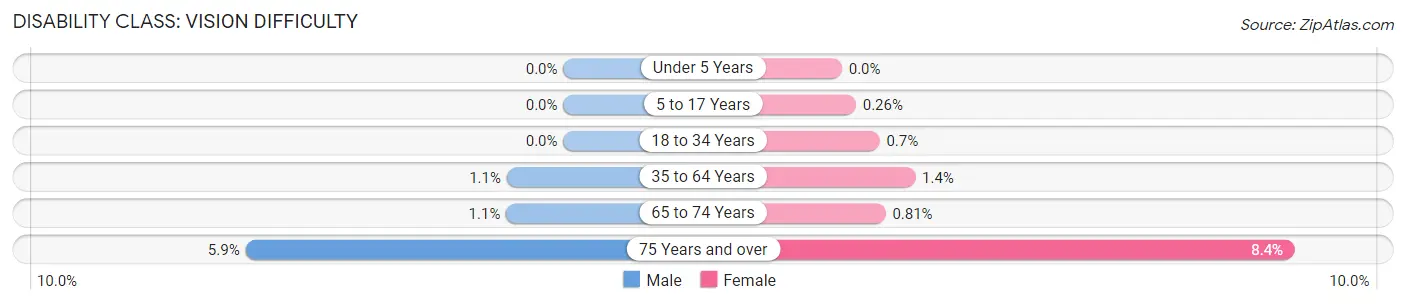
| Age Bracket | Male | Female |
| Under 5 Years | 0 (0.0%) | 0 (0.0%) |
| 5 to 17 Years | 0 (0.0%) | 10 (0.3%) |
| 18 to 34 Years | 0 (0.0%) | 25 (0.7%) |
| 35 to 64 Years | 105 (1.1%) | 135 (1.4%) |
| 65 to 74 Years | 30 (1.1%) | 27 (0.8%) |
| 75 Years and over | 115 (5.9%) | 261 (8.4%) |
Disability Class: Cognitive Difficulty
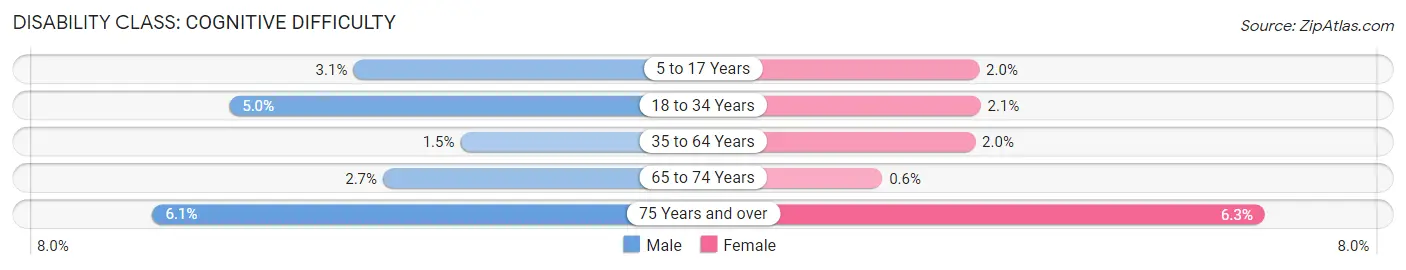
| Age Bracket | Male | Female |
| 5 to 17 Years | 120 (3.1%) | 80 (2.0%) |
| 18 to 34 Years | 184 (5.0%) | 74 (2.1%) |
| 35 to 64 Years | 153 (1.5%) | 196 (2.0%) |
| 65 to 74 Years | 76 (2.7%) | 20 (0.6%) |
| 75 Years and over | 119 (6.1%) | 195 (6.3%) |
Disability Class: Ambulatory Difficulty
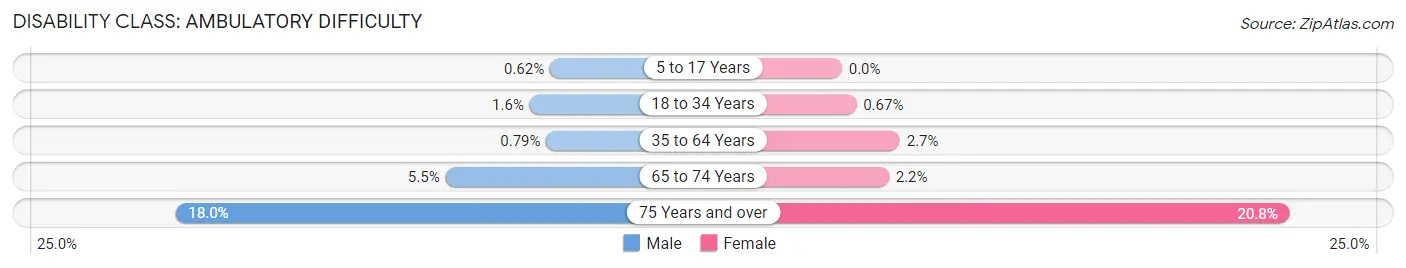
| Age Bracket | Male | Female |
| 5 to 17 Years | 24 (0.6%) | 0 (0.0%) |
| 18 to 34 Years | 58 (1.6%) | 24 (0.7%) |
| 35 to 64 Years | 79 (0.8%) | 266 (2.7%) |
| 65 to 74 Years | 155 (5.5%) | 73 (2.2%) |
| 75 Years and over | 351 (18.0%) | 645 (20.8%) |
Disability Class: Self-Care Difficulty
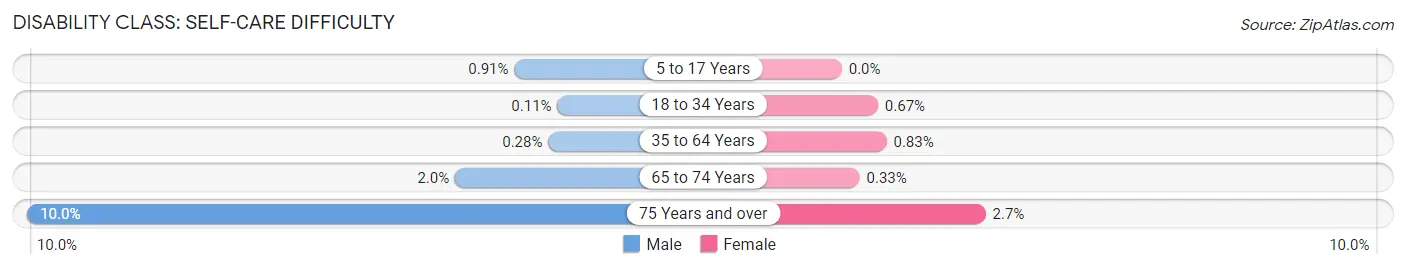
| Age Bracket | Male | Female |
| 5 to 17 Years | 35 (0.9%) | 0 (0.0%) |
| 18 to 34 Years | 4 (0.1%) | 24 (0.7%) |
| 35 to 64 Years | 28 (0.3%) | 82 (0.8%) |
| 65 to 74 Years | 57 (2.0%) | 11 (0.3%) |
| 75 Years and over | 194 (10.0%) | 83 (2.7%) |
Technology Access in Chesterfield
Computing Device Access in Chesterfield
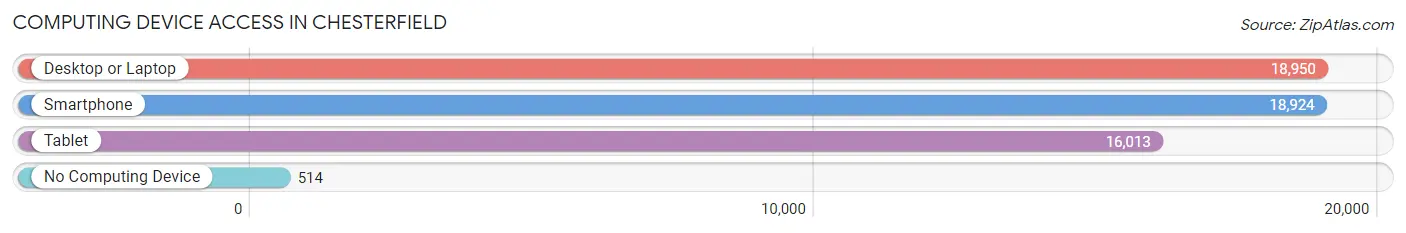
| Device Type | # Households | % Households |
| Desktop or Laptop | 18,950 | 92.7% |
| Smartphone | 18,924 | 92.5% |
| Tablet | 16,013 | 78.3% |
| No Computing Device | 514 | 2.5% |
| Total | 20,447 | 100.0% |
Internet Access in Chesterfield
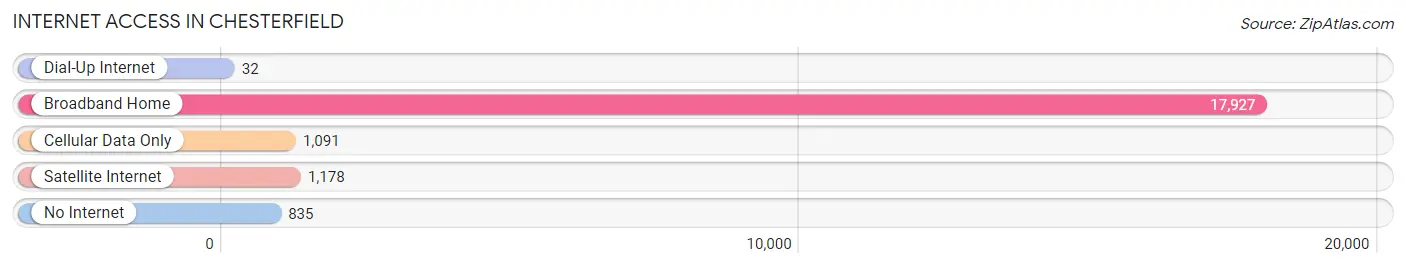
| Internet Type | # Households | % Households |
| Dial-Up Internet | 32 | 0.2% |
| Broadband Home | 17,927 | 87.7% |
| Cellular Data Only | 1,091 | 5.3% |
| Satellite Internet | 1,178 | 5.8% |
| No Internet | 835 | 4.1% |
| Total | 20,447 | 100.0% |
Chesterfield Summary
Chesterfield, Missouri is a city located in St. Louis County, Missouri, United States. It is a suburb of St. Louis and is part of the Greater St. Louis metropolitan area. The population was 47,484 at the 2010 census, making it the largest city in St. Louis County.
Geography
Chesterfield is located at 38°40'25" North, 90°33'45" West (38.673611, -90.562500). According to the United States Census Bureau, the city has a total area of 24.2 square miles (62.7 km2), of which 24.1 square miles (62.4 km2) is land and 0.1 square miles (0.3 km2) is water.
Chesterfield is located in the Missouri River Valley, and is bordered by the Missouri River to the north, the City of St. Louis to the east, the City of Wildwood to the south, and the City of Ballwin to the west.
History
Chesterfield was first settled in the early 1800s by a group of French-Canadian fur traders. The area was originally known as Gumbo Flats, due to the abundance of gumbo mud in the area. The name was changed to Chesterfield in 1837, after the town of Chesterfield, England.
The city was incorporated in 1988, and has since grown to become one of the largest cities in St. Louis County.
Economy
Chesterfield is home to a variety of businesses, including retail, manufacturing, and technology. The city is home to several large employers, including Express Scripts, Boeing, and Monsanto.
Chesterfield is also home to a number of shopping centers, including the Chesterfield Mall, which is the largest mall in St. Louis County.
Demographics
As of the 2010 census, there were 47,484 people, 18,845 households, and 13,845 families residing in the city. The population density was 1,967.2 people per square mile (759.7/km2). There were 19,845 housing units at an average density of 817.3 per square mile (315.7/km2). The racial makeup of the city was 87.2% White, 5.2% African American, 0.2% Native American, 4.3% Asian, 0.1% Pacific Islander, 1.2% from other races, and 2.0% from two or more races. Hispanic or Latino of any race were 3.3% of the population.
The median income for a household in the city was $76,837, and the median income for a family was $90,945. Males had a median income of $63,945 versus $45,945 for females. The per capita income for the city was $37,945. About 2.7% of families and 4.2% of the population were below the poverty line, including 4.7% of those under age 18 and 4.2% of those age 65 or over.
Chesterfield is a diverse city, with a variety of cultures and backgrounds represented. The city is home to a large Jewish population, as well as a growing Muslim population. The city also has a large Asian population, with the largest groups being Chinese, Indian, and Korean.
Common Questions
What is Per Capita Income in Chesterfield?
Per Capita income in Chesterfield is $75,489.
What is the Median Family Income in Chesterfield?
Median Family Income in Chesterfield is $175,592.
What is the Median Household income in Chesterfield?
Median Household Income in Chesterfield is $137,052.
What is Income or Wage Gap in Chesterfield?
Income or Wage Gap in Chesterfield is 44.8%.
Women in Chesterfield earn 55.2 cents for every dollar earned by a man.
What is Family Income Deficit in Chesterfield?
Family Income Deficit in Chesterfield is $11,720.
Families that are below poverty line in Chesterfield earn $11,720 less on average than the poverty threshold level.
What is Inequality or Gini Index in Chesterfield?
Inequality or Gini Index in Chesterfield is 0.46.
What is the Total Population of Chesterfield?
Total Population of Chesterfield is 49,645.
What is the Total Male Population of Chesterfield?
Total Male Population of Chesterfield is 24,012.
What is the Total Female Population of Chesterfield?
Total Female Population of Chesterfield is 25,633.
What is the Ratio of Males per 100 Females in Chesterfield?
There are 93.68 Males per 100 Females in Chesterfield.
What is the Ratio of Females per 100 Males in Chesterfield?
There are 106.75 Females per 100 Males in Chesterfield.
What is the Median Population Age in Chesterfield?
Median Population Age in Chesterfield is 47.1 Years.
What is the Average Family Size in Chesterfield
Average Family Size in Chesterfield is 2.9 People.
What is the Average Household Size in Chesterfield
Average Household Size in Chesterfield is 2.4 People.
How Large is the Labor Force in Chesterfield?
There are 25,598 People in the Labor Forcein in Chesterfield.
What is the Percentage of People in the Labor Force in Chesterfield?
62.6% of People are in the Labor Force in Chesterfield.
What is the Unemployment Rate in Chesterfield?
Unemployment Rate in Chesterfield is 3.1%.