Ballwin, MO Map & Demographics
Ballwin Map
Ballwin Overview
$55,277
PER CAPITA INCOME
$145,252
AVG FAMILY INCOME
$118,647
AVG HOUSEHOLD INCOME
46.0%
WAGE / INCOME GAP [ % ]
54.0¢/ $1
WAGE / INCOME GAP [ $ ]
0.42
INEQUALITY / GINI INDEX
30,948
TOTAL POPULATION
15,235
MALE POPULATION
15,713
FEMALE POPULATION
96.96
MALES / 100 FEMALES
103.14
FEMALES / 100 MALES
42.0
MEDIAN AGE
3.1
AVG FAMILY SIZE
2.6
AVG HOUSEHOLD SIZE
16,480
LABOR FORCE [ PEOPLE ]
66.3%
PERCENT IN LABOR FORCE
2.2%
UNEMPLOYMENT RATE
Ballwin Area Codes
Income in Ballwin
Income Overview in Ballwin
Per Capita Income in Ballwin is $55,277, while median incomes of families and households are $145,252 and $118,647 respectively.
| Characteristic | Number | Measure |
| Per Capita Income | 30,948 | $55,277 |
| Median Family Income | 8,607 | $145,252 |
| Mean Family Income | 8,607 | $168,529 |
| Median Household Income | 11,973 | $118,647 |
| Mean Household Income | 11,973 | $140,901 |
| Income Deficit | 8,607 | $0 |
| Wage / Income Gap (%) | 30,948 | 46.03% |
| Wage / Income Gap ($) | 30,948 | 53.97¢ per $1 |
| Gini / Inequality Index | 30,948 | 0.42 |
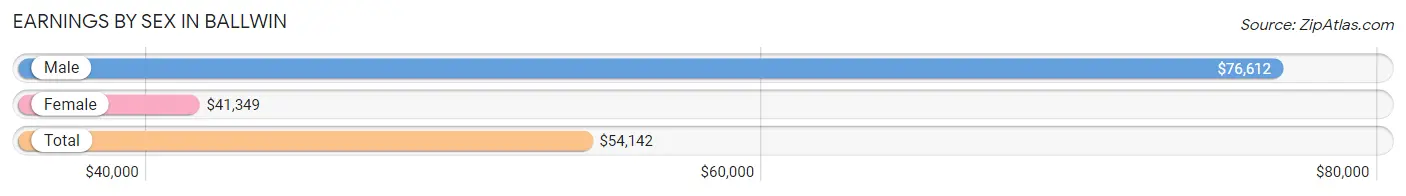
Earnings by Sex in Ballwin
Average Earnings in Ballwin are $54,142, $76,612 for men and $41,349 for women, a difference of 46.0%.
| Sex | Number | Average Earnings |
| Male | 9,279 (51.2%) | $76,612 |
| Female | 8,833 (48.8%) | $41,349 |
| Total | 18,112 (100.0%) | $54,142 |
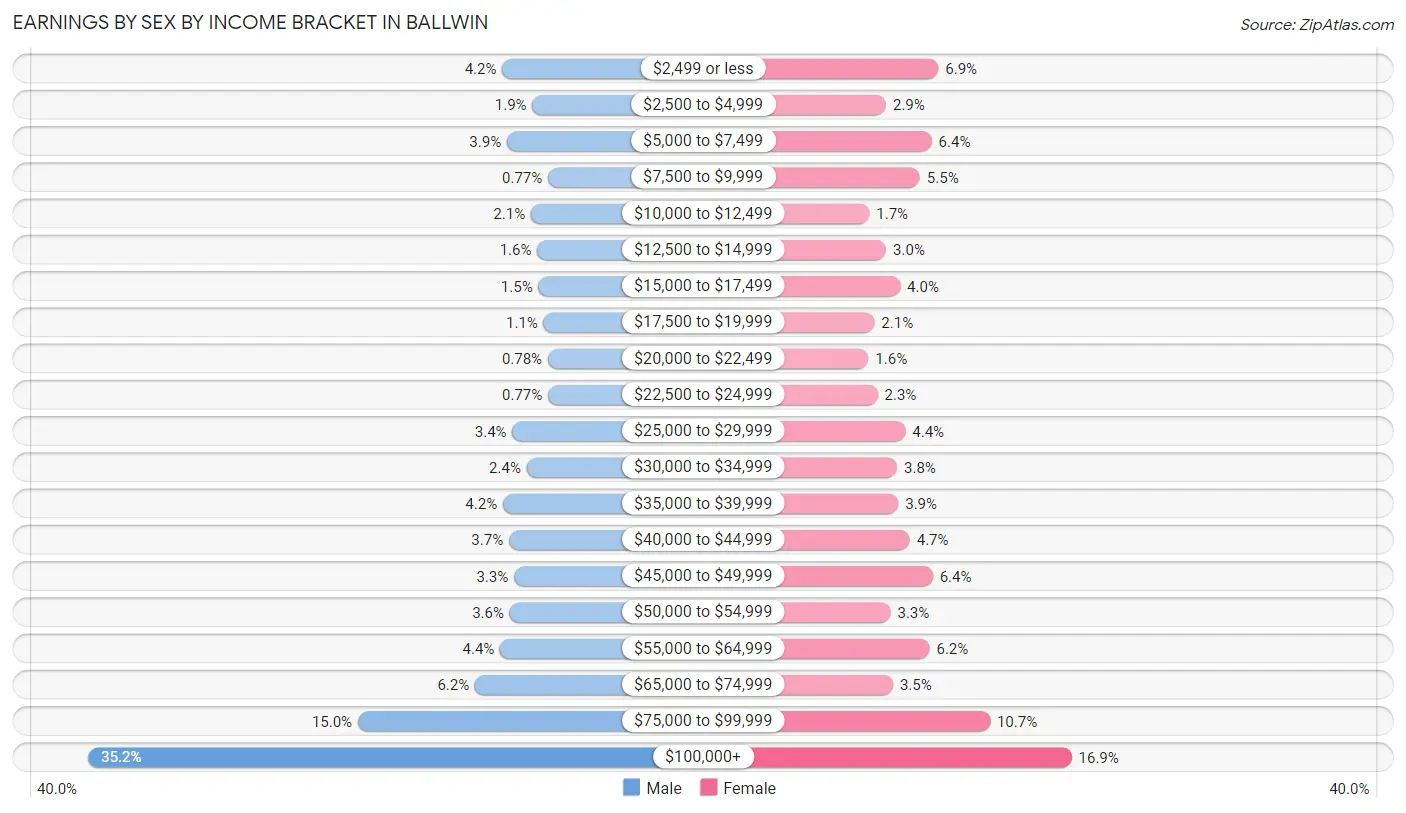
Earnings by Sex by Income Bracket in Ballwin
The most common earnings brackets in Ballwin are $100,000+ for men (3,270 | 35.2%) and $100,000+ for women (1,488 | 16.9%).
| Income | Male | Female |
| $2,499 or less | 390 (4.2%) | 606 (6.9%) |
| $2,500 to $4,999 | 180 (1.9%) | 260 (2.9%) |
| $5,000 to $7,499 | 357 (3.8%) | 562 (6.4%) |
| $7,500 to $9,999 | 71 (0.8%) | 484 (5.5%) |
| $10,000 to $12,499 | 190 (2.1%) | 149 (1.7%) |
| $12,500 to $14,999 | 147 (1.6%) | 261 (2.9%) |
| $15,000 to $17,499 | 138 (1.5%) | 353 (4.0%) |
| $17,500 to $19,999 | 102 (1.1%) | 183 (2.1%) |
| $20,000 to $22,499 | 72 (0.8%) | 143 (1.6%) |
| $22,500 to $24,999 | 71 (0.8%) | 204 (2.3%) |
| $25,000 to $29,999 | 319 (3.4%) | 388 (4.4%) |
| $30,000 to $34,999 | 220 (2.4%) | 333 (3.8%) |
| $35,000 to $39,999 | 385 (4.2%) | 341 (3.9%) |
| $40,000 to $44,999 | 343 (3.7%) | 417 (4.7%) |
| $45,000 to $49,999 | 308 (3.3%) | 569 (6.4%) |
| $50,000 to $54,999 | 338 (3.6%) | 290 (3.3%) |
| $55,000 to $64,999 | 405 (4.4%) | 548 (6.2%) |
| $65,000 to $74,999 | 579 (6.2%) | 306 (3.5%) |
| $75,000 to $99,999 | 1,394 (15.0%) | 948 (10.7%) |
| $100,000+ | 3,270 (35.2%) | 1,488 (16.9%) |
| Total | 9,279 (100.0%) | 8,833 (100.0%) |
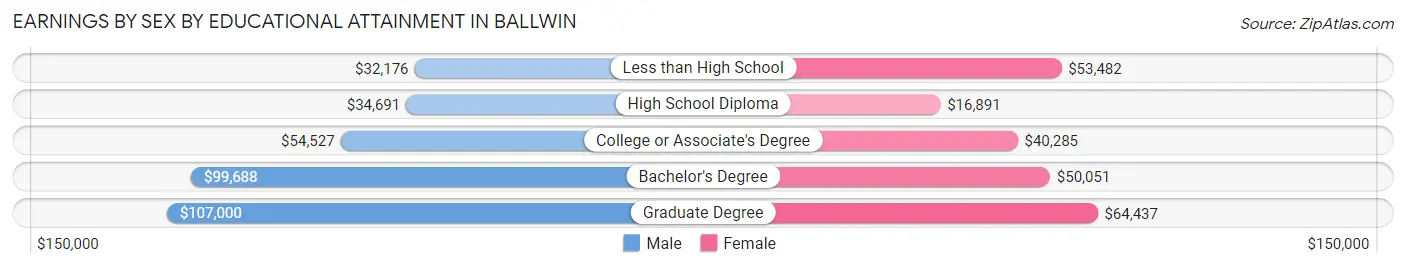
Earnings by Sex by Educational Attainment in Ballwin
Average earnings in Ballwin are $84,388 for men and $47,792 for women, a difference of 43.4%. Men with an educational attainment of graduate degree enjoy the highest average annual earnings of $107,000, while those with less than high school education earn the least with $32,176. Women with an educational attainment of graduate degree earn the most with the average annual earnings of $64,437, while those with high school diploma education have the smallest earnings of $16,891.
| Educational Attainment | Male Income | Female Income |
| Less than High School | $32,176 | $53,482 |
| High School Diploma | $34,691 | $16,891 |
| College or Associate's Degree | $54,527 | $40,285 |
| Bachelor's Degree | $99,688 | $50,051 |
| Graduate Degree | $107,000 | $64,437 |
| Total | $84,388 | $47,792 |
Family Income in Ballwin
Family Income Brackets in Ballwin
According to the Ballwin family income data, there are 2,436 families falling into the $200,000+ income range, which is the most common income bracket and makes up 28.3% of all families. Conversely, the less than $10,000 income bracket is the least frequent group with only 9 families (0.1%) belonging to this category.
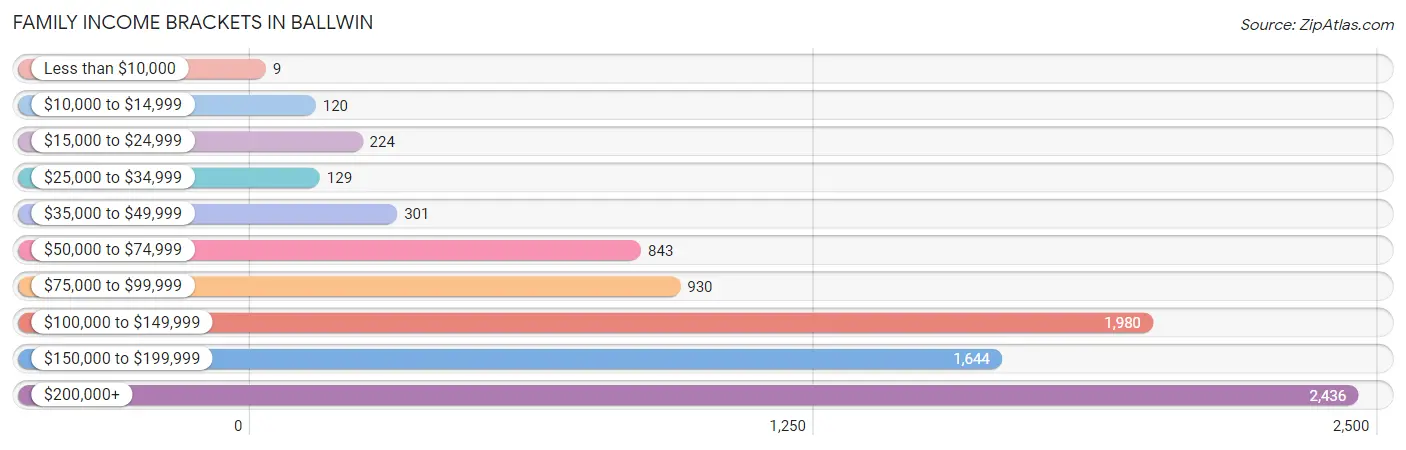
| Income Bracket | # Families | % Families |
| Less than $10,000 | 9 | 0.1% |
| $10,000 to $14,999 | 120 | 1.4% |
| $15,000 to $24,999 | 224 | 2.6% |
| $25,000 to $34,999 | 129 | 1.5% |
| $35,000 to $49,999 | 301 | 3.5% |
| $50,000 to $74,999 | 843 | 9.8% |
| $75,000 to $99,999 | 930 | 10.8% |
| $100,000 to $149,999 | 1,980 | 23.0% |
| $150,000 to $199,999 | 1,644 | 19.1% |
| $200,000+ | 2,436 | 28.3% |
Family Income by Famaliy Size in Ballwin
6-person families (161 | 1.9%) account for the highest median family income in Ballwin with $171,250 per family, while 2-person families (3,620 | 42.1%) have the highest median income of $62,768 per family member.
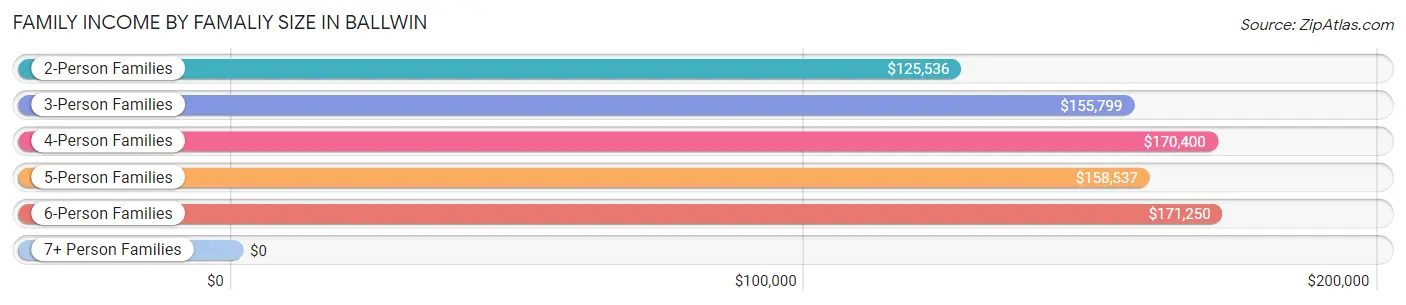
| Income Bracket | # Families | Median Income |
| 2-Person Families | 3,620 (42.1%) | $125,536 |
| 3-Person Families | 2,008 (23.3%) | $155,799 |
| 4-Person Families | 2,254 (26.2%) | $170,400 |
| 5-Person Families | 564 (6.6%) | $158,537 |
| 6-Person Families | 161 (1.9%) | $171,250 |
| 7+ Person Families | 0 (0.0%) | $0 |
| Total | 8,607 (100.0%) | $145,252 |
Family Income by Number of Earners in Ballwin
The median family income in Ballwin is $145,252, with families comprising 3+ earners (1,434) having the highest median family income of $213,824, while families with no earners (979) have the lowest median family income of $89,509, accounting for 16.7% and 11.4% of families, respectively.
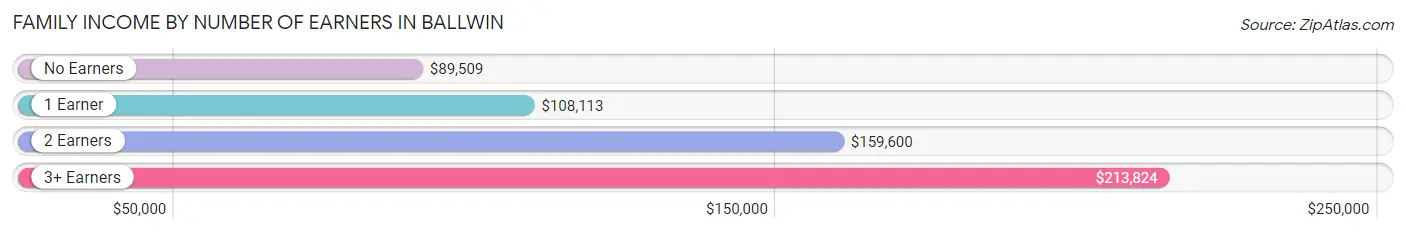
| Number of Earners | # Families | Median Income |
| No Earners | 979 (11.4%) | $89,509 |
| 1 Earner | 2,014 (23.4%) | $108,113 |
| 2 Earners | 4,180 (48.6%) | $159,600 |
| 3+ Earners | 1,434 (16.7%) | $213,824 |
| Total | 8,607 (100.0%) | $145,252 |
Household Income in Ballwin
Household Income Brackets in Ballwin
With 2,526 households falling in the category, the $200,000+ income range is the most frequent in Ballwin, accounting for 21.1% of all households. In contrast, only 132 households (1.1%) fall into the less than $10,000 income bracket, making it the least populous group.
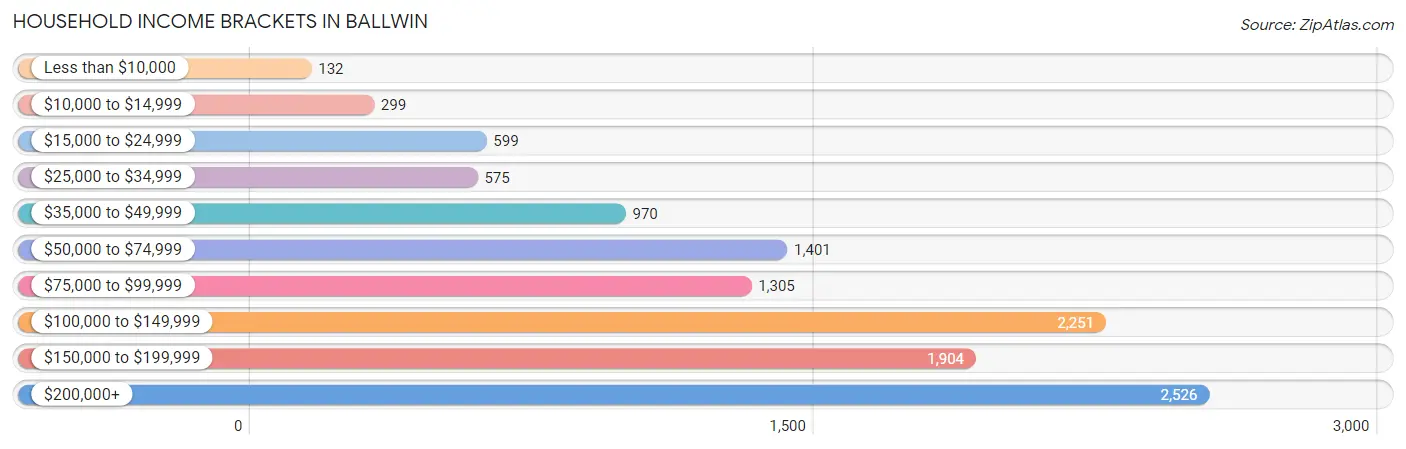
| Income Bracket | # Households | % Households |
| Less than $10,000 | 132 | 1.1% |
| $10,000 to $14,999 | 299 | 2.5% |
| $15,000 to $24,999 | 599 | 5.0% |
| $25,000 to $34,999 | 575 | 4.8% |
| $35,000 to $49,999 | 970 | 8.1% |
| $50,000 to $74,999 | 1,401 | 11.7% |
| $75,000 to $99,999 | 1,305 | 10.9% |
| $100,000 to $149,999 | 2,251 | 18.8% |
| $150,000 to $199,999 | 1,904 | 15.9% |
| $200,000+ | 2,526 | 21.1% |
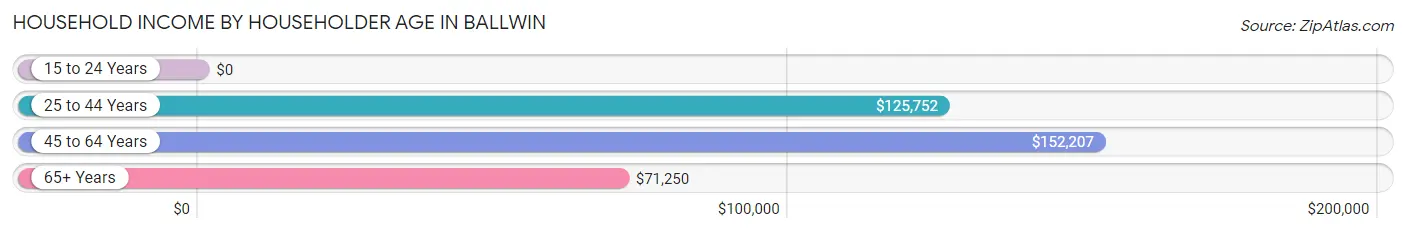
Household Income by Householder Age in Ballwin
The median household income in Ballwin is $118,647, with the highest median household income of $152,207 found in the 45 to 64 years age bracket for the primary householder. A total of 4,639 households (38.8%) fall into this category. Meanwhile, the 15 to 24 years age bracket for the primary householder has the lowest median household income of $0, with 249 households (2.1%) in this group.
| Income Bracket | # Households | Median Income |
| 15 to 24 Years | 249 (2.1%) | $0 |
| 25 to 44 Years | 3,169 (26.5%) | $125,752 |
| 45 to 64 Years | 4,639 (38.8%) | $152,207 |
| 65+ Years | 3,916 (32.7%) | $71,250 |
| Total | 11,973 (100.0%) | $118,647 |
Poverty in Ballwin
Income Below Poverty by Sex and Age in Ballwin
With 6.6% poverty level for males and 4.0% for females among the residents of Ballwin, 15 year old males and 15 year old females are the most vulnerable to poverty, with 46 males (23.2%) and 33 females (10.7%) in their respective age groups living below the poverty level.
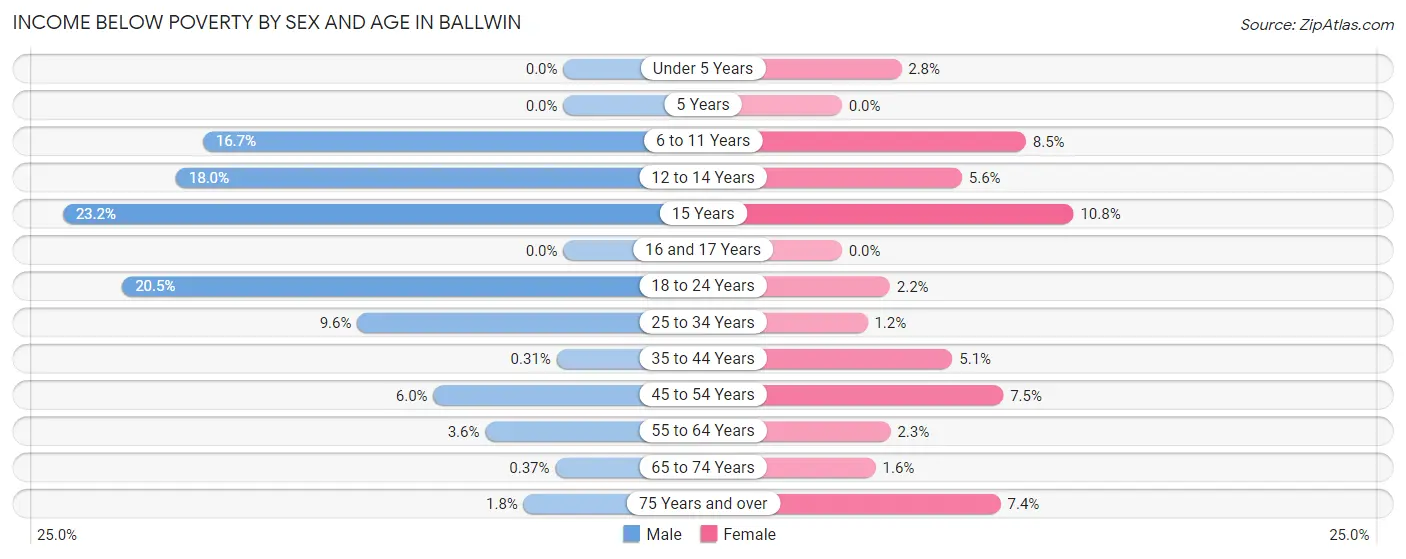
| Age Bracket | Male | Female |
| Under 5 Years | 0 (0.0%) | 28 (2.8%) |
| 5 Years | 0 (0.0%) | 0 (0.0%) |
| 6 to 11 Years | 179 (16.7%) | 80 (8.5%) |
| 12 to 14 Years | 121 (18.0%) | 25 (5.6%) |
| 15 Years | 46 (23.2%) | 33 (10.7%) |
| 16 and 17 Years | 0 (0.0%) | 0 (0.0%) |
| 18 to 24 Years | 262 (20.5%) | 23 (2.2%) |
| 25 to 34 Years | 164 (9.6%) | 23 (1.2%) |
| 35 to 44 Years | 6 (0.3%) | 90 (5.1%) |
| 45 to 54 Years | 124 (6.0%) | 137 (7.5%) |
| 55 to 64 Years | 78 (3.6%) | 54 (2.3%) |
| 65 to 74 Years | 6 (0.4%) | 30 (1.6%) |
| 75 Years and over | 17 (1.8%) | 106 (7.4%) |
| Total | 1,003 (6.6%) | 629 (4.0%) |
Income Above Poverty by Sex and Age in Ballwin
According to the poverty statistics in Ballwin, males aged under 5 years and females aged 5 years are the age groups that are most secure financially, with 100.0% of males and 100.0% of females in these age groups living above the poverty line.
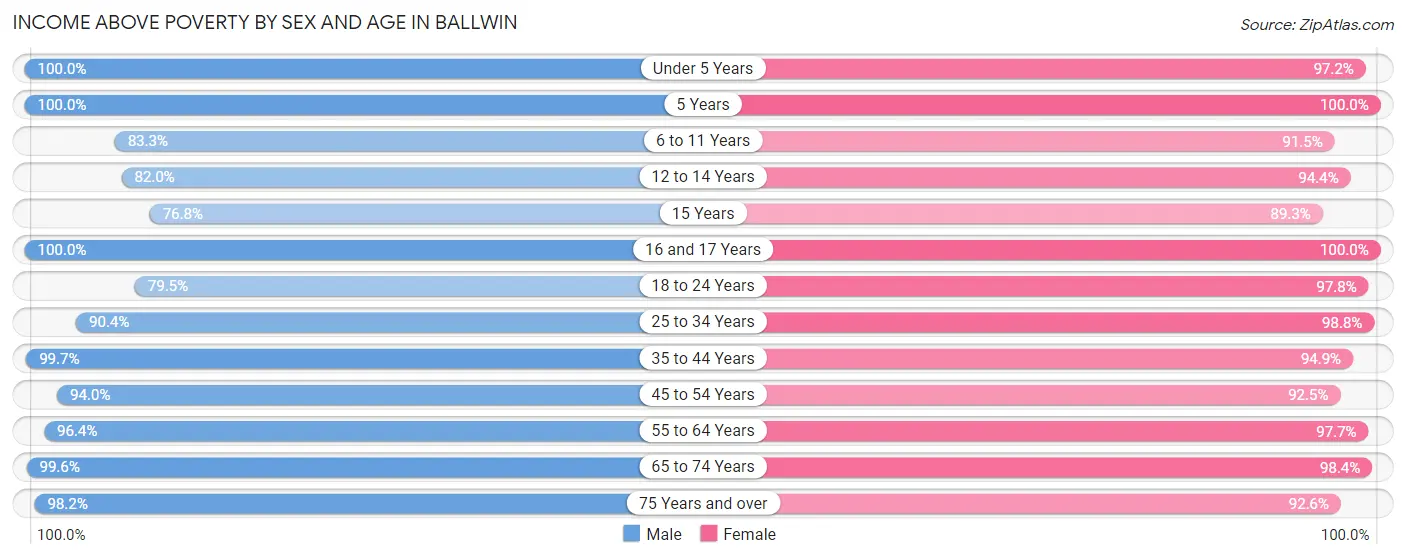
| Age Bracket | Male | Female |
| Under 5 Years | 995 (100.0%) | 987 (97.2%) |
| 5 Years | 244 (100.0%) | 137 (100.0%) |
| 6 to 11 Years | 891 (83.3%) | 857 (91.5%) |
| 12 to 14 Years | 552 (82.0%) | 424 (94.4%) |
| 15 Years | 152 (76.8%) | 274 (89.2%) |
| 16 and 17 Years | 282 (100.0%) | 559 (100.0%) |
| 18 to 24 Years | 1,018 (79.5%) | 1,007 (97.8%) |
| 25 to 34 Years | 1,551 (90.4%) | 1,914 (98.8%) |
| 35 to 44 Years | 1,957 (99.7%) | 1,664 (94.9%) |
| 45 to 54 Years | 1,933 (94.0%) | 1,693 (92.5%) |
| 55 to 64 Years | 2,074 (96.4%) | 2,338 (97.7%) |
| 65 to 74 Years | 1,630 (99.6%) | 1,875 (98.4%) |
| 75 Years and over | 909 (98.2%) | 1,333 (92.6%) |
| Total | 14,188 (93.4%) | 15,062 (96.0%) |
Income Below Poverty Among Married-Couple Families in Ballwin
The poverty statistics for married-couple families in Ballwin show that 1.6% or 123 of the total 7,575 families live below the poverty line. Families with 3 or 4 children have the highest poverty rate of 3.7%, comprising of 15 families. On the other hand, families with no children have the lowest poverty rate of 0.6%, which includes 27 families.
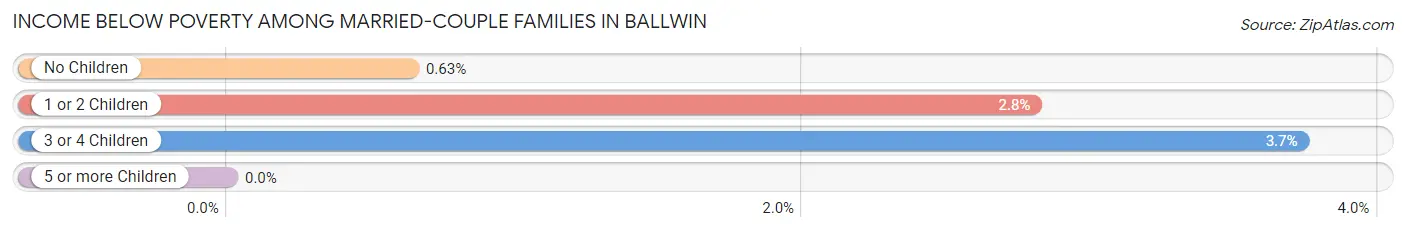
| Children | Above Poverty | Below Poverty |
| No Children | 4,253 (99.4%) | 27 (0.6%) |
| 1 or 2 Children | 2,812 (97.2%) | 81 (2.8%) |
| 3 or 4 Children | 387 (96.3%) | 15 (3.7%) |
| 5 or more Children | 0 (0.0%) | 0 (0.0%) |
| Total | 7,452 (98.4%) | 123 (1.6%) |
Income Below Poverty Among Single-Parent Households in Ballwin
According to the poverty data in Ballwin, 10.8% or 20 single-father households and 16.1% or 136 single-mother households are living below the poverty line. Among single-father households, those with 1 or 2 children have the highest poverty rate, with 16 households (19.1%) experiencing poverty. Likewise, among single-mother households, those with 3 or 4 children have the highest poverty rate, with 57 households (46.3%) falling below the poverty line.
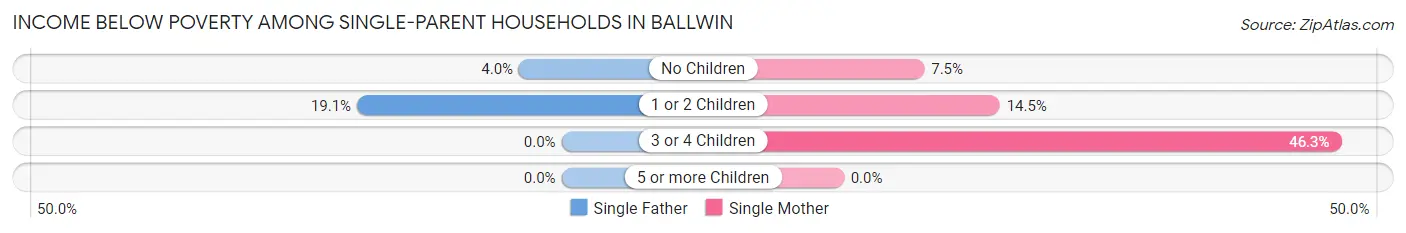
| Children | Single Father | Single Mother |
| No Children | 4 (4.0%) | 28 (7.5%) |
| 1 or 2 Children | 16 (19.1%) | 51 (14.5%) |
| 3 or 4 Children | 0 (0.0%) | 57 (46.3%) |
| 5 or more Children | 0 (0.0%) | 0 (0.0%) |
| Total | 20 (10.8%) | 136 (16.1%) |
Income Below Poverty Among Married-Couple vs Single-Parent Households in Ballwin
The poverty data for Ballwin shows that 123 of the married-couple family households (1.6%) and 156 of the single-parent households (15.1%) are living below the poverty level. Within the married-couple family households, those with 3 or 4 children have the highest poverty rate, with 15 households (3.7%) falling below the poverty line. Among the single-parent households, those with 3 or 4 children have the highest poverty rate, with 57 household (46.3%) living below poverty.
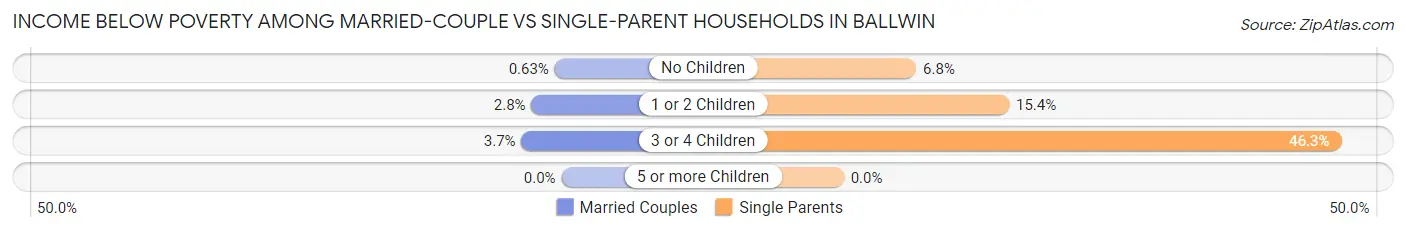
| Children | Married-Couple Families | Single-Parent Households |
| No Children | 27 (0.6%) | 32 (6.8%) |
| 1 or 2 Children | 81 (2.8%) | 67 (15.4%) |
| 3 or 4 Children | 15 (3.7%) | 57 (46.3%) |
| 5 or more Children | 0 (0.0%) | 0 (0.0%) |
| Total | 123 (1.6%) | 156 (15.1%) |
Race in Ballwin
The most populous races in Ballwin are White / Caucasian (24,961 | 80.6%), Asian (2,582 | 8.3%), and Two or more Races (2,525 | 8.2%).
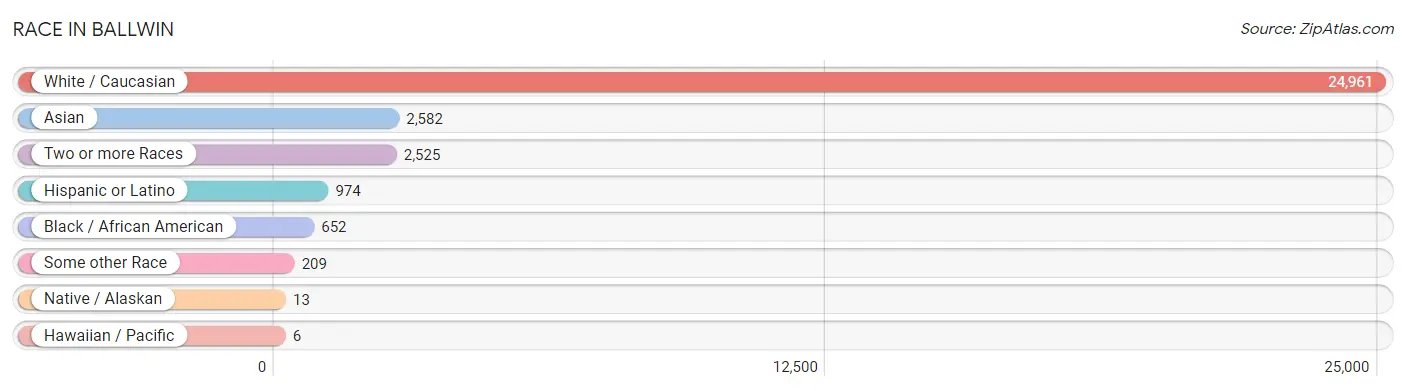
| Race | # Population | % Population |
| Asian | 2,582 | 8.3% |
| Black / African American | 652 | 2.1% |
| Hawaiian / Pacific | 6 | 0.0% |
| Hispanic or Latino | 974 | 3.2% |
| Native / Alaskan | 13 | 0.0% |
| White / Caucasian | 24,961 | 80.6% |
| Two or more Races | 2,525 | 8.2% |
| Some other Race | 209 | 0.7% |
| Total | 30,948 | 100.0% |
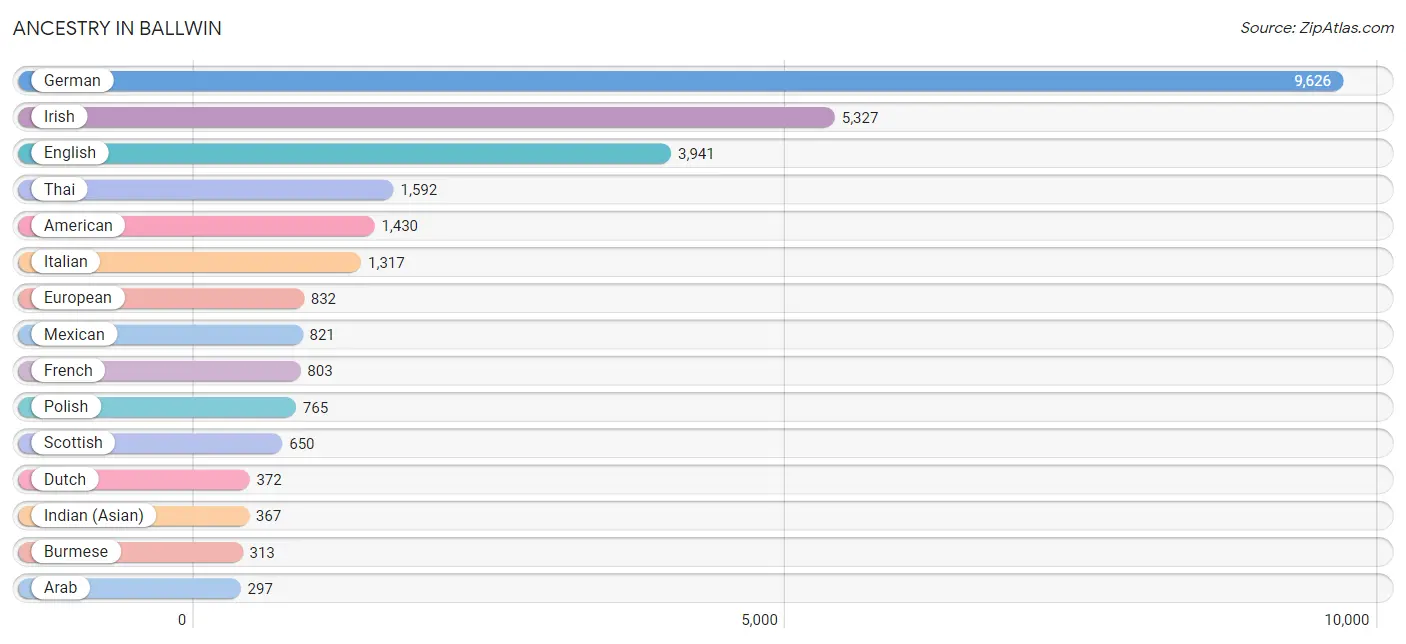
Ancestry in Ballwin
The most populous ancestries reported in Ballwin are German (9,626 | 31.1%), Irish (5,327 | 17.2%), English (3,941 | 12.7%), Thai (1,592 | 5.1%), and American (1,430 | 4.6%), together accounting for 70.8% of all Ballwin residents.
| Ancestry | # Population | % Population |
| American | 1,430 | 4.6% |
| Arab | 297 | 1.0% |
| Arapaho | 5 | 0.0% |
| Armenian | 61 | 0.2% |
| Austrian | 70 | 0.2% |
| Belgian | 23 | 0.1% |
| Bhutanese | 33 | 0.1% |
| Blackfeet | 1 | 0.0% |
| British | 102 | 0.3% |
| Bulgarian | 141 | 0.5% |
| Burmese | 313 | 1.0% |
| Cambodian | 51 | 0.2% |
| Canadian | 12 | 0.0% |
| Central American | 37 | 0.1% |
| Cherokee | 49 | 0.2% |
| Chickasaw | 13 | 0.0% |
| Colombian | 9 | 0.0% |
| Costa Rican | 26 | 0.1% |
| Croatian | 32 | 0.1% |
| Cuban | 28 | 0.1% |
| Czech | 248 | 0.8% |
| Czechoslovakian | 68 | 0.2% |
| Danish | 119 | 0.4% |
| Dutch | 372 | 1.2% |
| Eastern European | 36 | 0.1% |
| English | 3,941 | 12.7% |
| European | 832 | 2.7% |
| Filipino | 62 | 0.2% |
| French | 803 | 2.6% |
| French Canadian | 46 | 0.2% |
| German | 9,626 | 31.1% |
| Greek | 271 | 0.9% |
| Guatemalan | 11 | 0.0% |
| Hungarian | 175 | 0.6% |
| Indian (Asian) | 367 | 1.2% |
| Irish | 5,327 | 17.2% |
| Italian | 1,317 | 4.3% |
| Jamaican | 23 | 0.1% |
| Japanese | 12 | 0.0% |
| Korean | 266 | 0.9% |
| Latvian | 11 | 0.0% |
| Lebanese | 7 | 0.0% |
| Lithuanian | 15 | 0.1% |
| Malaysian | 12 | 0.0% |
| Mexican | 821 | 2.6% |
| Northern European | 44 | 0.1% |
| Norwegian | 213 | 0.7% |
| Pakistani | 19 | 0.1% |
| Pennsylvania German | 19 | 0.1% |
| Polish | 765 | 2.5% |
| Portuguese | 56 | 0.2% |
| Puerto Rican | 47 | 0.2% |
| Romanian | 13 | 0.0% |
| Russian | 194 | 0.6% |
| Samoan | 16 | 0.1% |
| Scandinavian | 29 | 0.1% |
| Scotch-Irish | 149 | 0.5% |
| Scottish | 650 | 2.1% |
| Serbian | 37 | 0.1% |
| Slavic | 31 | 0.1% |
| Slovak | 86 | 0.3% |
| Slovene | 16 | 0.1% |
| South American | 9 | 0.0% |
| South American Indian | 3 | 0.0% |
| Spanish | 32 | 0.1% |
| Sri Lankan | 75 | 0.2% |
| Swedish | 273 | 0.9% |
| Swiss | 21 | 0.1% |
| Syrian | 55 | 0.2% |
| Thai | 1,592 | 5.1% |
| Ukrainian | 107 | 0.4% |
| Welsh | 116 | 0.4% |
| Yugoslavian | 18 | 0.1% | View All 73 Rows |
Immigrants in Ballwin
The most numerous immigrant groups reported in Ballwin came from Asia (1,976 | 6.4%), South Central Asia (1,129 | 3.6%), India (1,091 | 3.5%), Eastern Asia (631 | 2.0%), and Korea (334 | 1.1%), together accounting for 16.7% of all Ballwin residents.
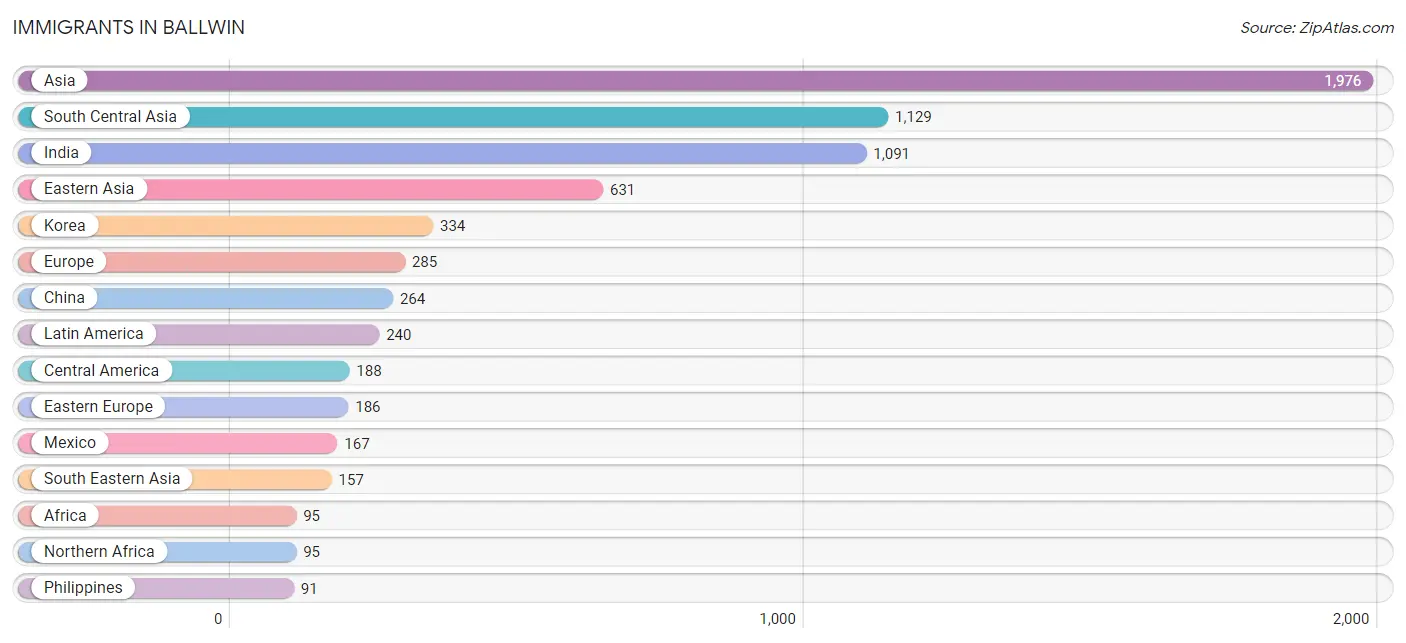
| Immigration Origin | # Population | % Population |
| Africa | 95 | 0.3% |
| Asia | 1,976 | 6.4% |
| Bangladesh | 4 | 0.0% |
| Belarus | 42 | 0.1% |
| Bosnia and Herzegovina | 18 | 0.1% |
| Bulgaria | 84 | 0.3% |
| Cambodia | 12 | 0.0% |
| Canada | 13 | 0.0% |
| Caribbean | 40 | 0.1% |
| Central America | 188 | 0.6% |
| China | 264 | 0.9% |
| Colombia | 9 | 0.0% |
| Costa Rica | 10 | 0.0% |
| Cuba | 28 | 0.1% |
| Eastern Asia | 631 | 2.0% |
| Eastern Europe | 186 | 0.6% |
| Europe | 285 | 0.9% |
| France | 15 | 0.1% |
| Germany | 45 | 0.2% |
| Greece | 12 | 0.0% |
| Guatemala | 11 | 0.0% |
| Hong Kong | 51 | 0.2% |
| India | 1,091 | 3.5% |
| Jamaica | 12 | 0.0% |
| Korea | 334 | 1.1% |
| Latin America | 240 | 0.8% |
| Lebanon | 31 | 0.1% |
| Lithuania | 14 | 0.1% |
| Mexico | 167 | 0.5% |
| Northern Africa | 95 | 0.3% |
| Northern Europe | 27 | 0.1% |
| Pakistan | 34 | 0.1% |
| Peru | 3 | 0.0% |
| Philippines | 91 | 0.3% |
| Russia | 14 | 0.1% |
| South America | 12 | 0.0% |
| South Central Asia | 1,129 | 3.6% |
| South Eastern Asia | 157 | 0.5% |
| Southern Europe | 12 | 0.0% |
| Syria | 28 | 0.1% |
| Taiwan | 13 | 0.0% |
| Thailand | 19 | 0.1% |
| Ukraine | 14 | 0.1% |
| Vietnam | 35 | 0.1% |
| Western Asia | 59 | 0.2% |
| Western Europe | 60 | 0.2% | View All 46 Rows |
Sex and Age in Ballwin
Sex and Age in Ballwin
The most populous age groups in Ballwin are 60 to 64 Years (1,217 | 8.0%) for men and 30 to 34 Years (1,327 | 8.5%) for women.
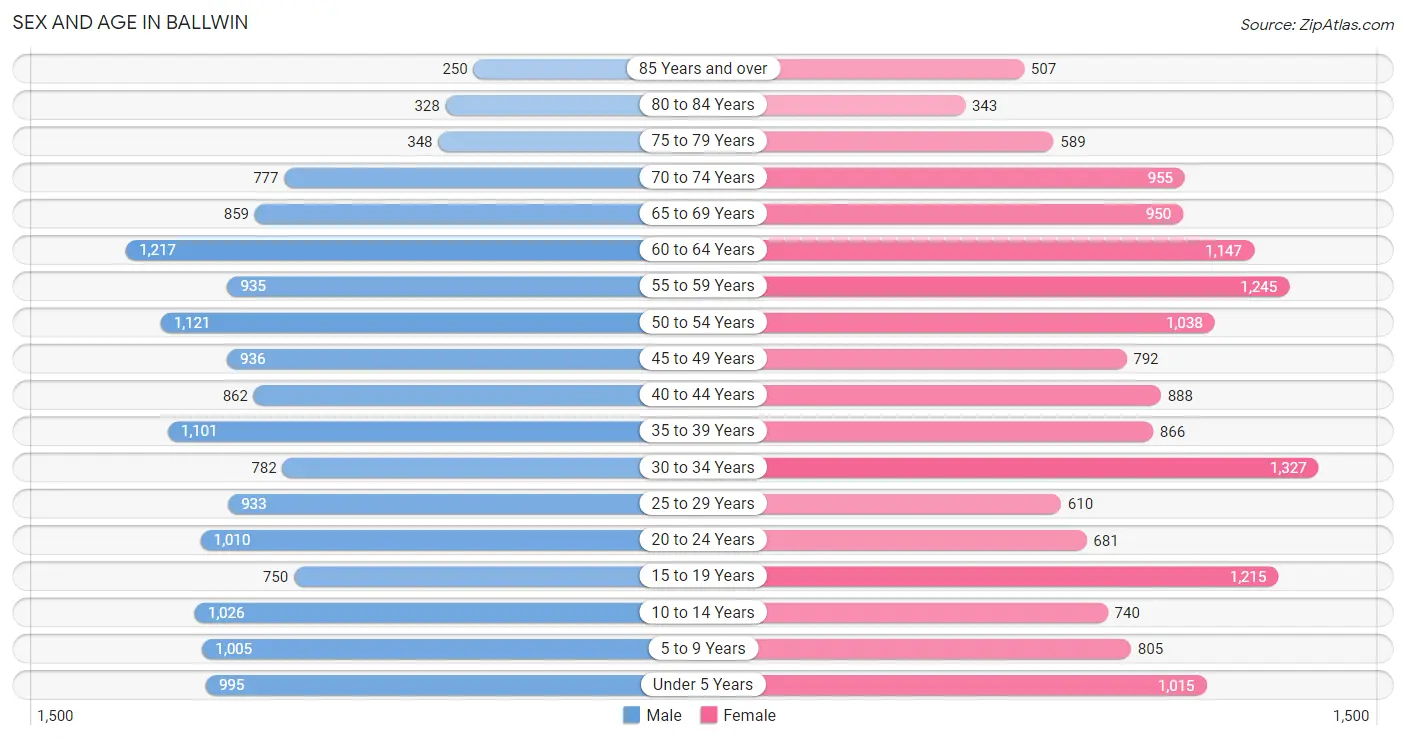
| Age Bracket | Male | Female |
| Under 5 Years | 995 (6.5%) | 1,015 (6.5%) |
| 5 to 9 Years | 1,005 (6.6%) | 805 (5.1%) |
| 10 to 14 Years | 1,026 (6.7%) | 740 (4.7%) |
| 15 to 19 Years | 750 (4.9%) | 1,215 (7.7%) |
| 20 to 24 Years | 1,010 (6.6%) | 681 (4.3%) |
| 25 to 29 Years | 933 (6.1%) | 610 (3.9%) |
| 30 to 34 Years | 782 (5.1%) | 1,327 (8.5%) |
| 35 to 39 Years | 1,101 (7.2%) | 866 (5.5%) |
| 40 to 44 Years | 862 (5.7%) | 888 (5.7%) |
| 45 to 49 Years | 936 (6.1%) | 792 (5.0%) |
| 50 to 54 Years | 1,121 (7.4%) | 1,038 (6.6%) |
| 55 to 59 Years | 935 (6.1%) | 1,245 (7.9%) |
| 60 to 64 Years | 1,217 (8.0%) | 1,147 (7.3%) |
| 65 to 69 Years | 859 (5.6%) | 950 (6.0%) |
| 70 to 74 Years | 777 (5.1%) | 955 (6.1%) |
| 75 to 79 Years | 348 (2.3%) | 589 (3.7%) |
| 80 to 84 Years | 328 (2.1%) | 343 (2.2%) |
| 85 Years and over | 250 (1.6%) | 507 (3.2%) |
| Total | 15,235 (100.0%) | 15,713 (100.0%) |
Families and Households in Ballwin
Median Family Size in Ballwin
The median family size in Ballwin is 3.10 persons per family, with single female/mother families (847 | 9.8%) accounting for the largest median family size of 3.2 persons per family. On the other hand, single male/father families (185 | 2.1%) represent the smallest median family size with 2.64 persons per family.
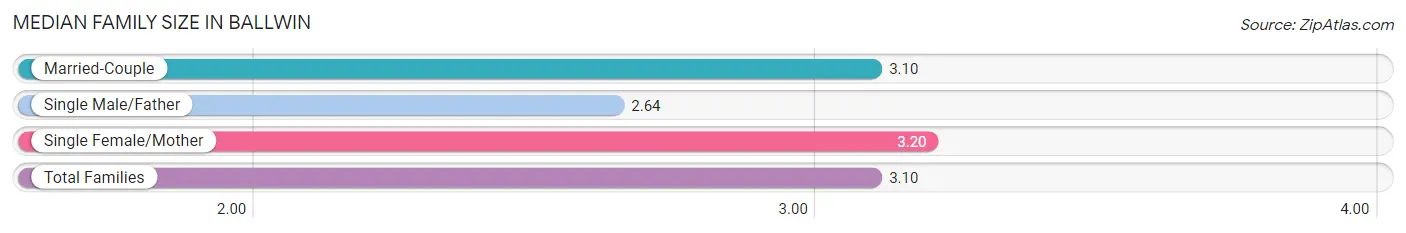
| Family Type | # Families | Family Size |
| Married-Couple | 7,575 (88.0%) | 3.10 |
| Single Male/Father | 185 (2.1%) | 2.64 |
| Single Female/Mother | 847 (9.8%) | 3.20 |
| Total Families | 8,607 (100.0%) | 3.10 |
Median Household Size in Ballwin
The median household size in Ballwin is 2.58 persons per household, with single female/mother households (847 | 7.1%) accounting for the largest median household size of 3.34 persons per household. non-family households (3,366 | 28.1%) represent the smallest median household size with 1.20 persons per household.
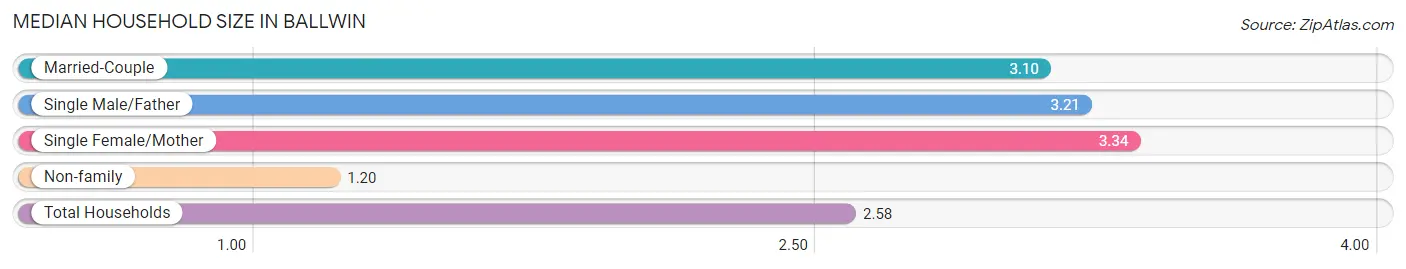
| Household Type | # Households | Household Size |
| Married-Couple | 7,575 (63.3%) | 3.10 |
| Single Male/Father | 185 (1.5%) | 3.21 |
| Single Female/Mother | 847 (7.1%) | 3.34 |
| Non-family | 3,366 (28.1%) | 1.20 |
| Total Households | 11,973 (100.0%) | 2.58 |
Household Size by Marriage Status in Ballwin
Out of a total of 11,973 households in Ballwin, 8,607 (71.9%) are family households, while 3,366 (28.1%) are nonfamily households. The most numerous type of family households are 2-person households, comprising 3,564, and the most common type of nonfamily households are 1-person households, comprising 2,832.
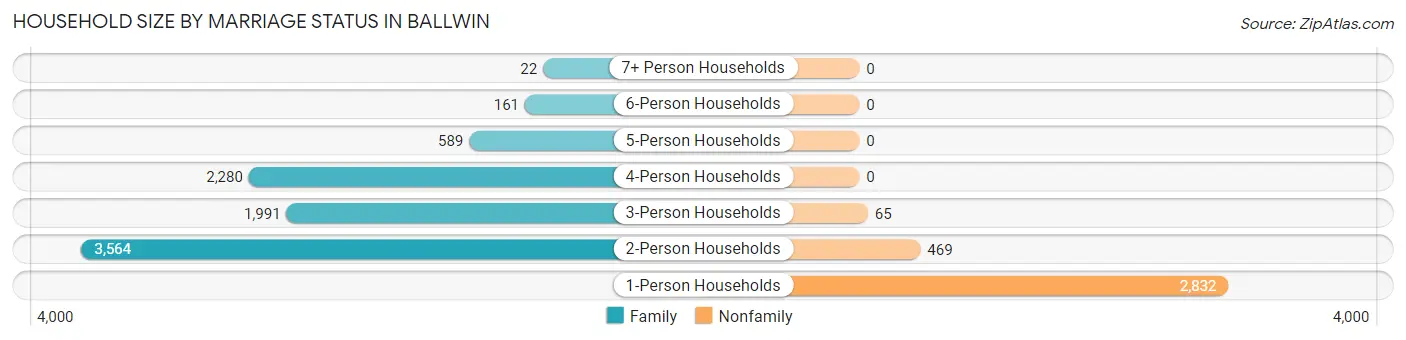
| Household Size | Family Households | Nonfamily Households |
| 1-Person Households | - | 2,832 (23.6%) |
| 2-Person Households | 3,564 (29.8%) | 469 (3.9%) |
| 3-Person Households | 1,991 (16.6%) | 65 (0.5%) |
| 4-Person Households | 2,280 (19.0%) | 0 (0.0%) |
| 5-Person Households | 589 (4.9%) | 0 (0.0%) |
| 6-Person Households | 161 (1.3%) | 0 (0.0%) |
| 7+ Person Households | 22 (0.2%) | 0 (0.0%) |
| Total | 8,607 (71.9%) | 3,366 (28.1%) |
Female Fertility in Ballwin
Fertility by Age in Ballwin
Average fertility rate in Ballwin is 61.0 births per 1,000 women. Women in the age bracket of 20 to 34 years have the highest fertility rate with 148.0 births per 1,000 women. Women in the age bracket of 20 to 34 years acount for 96.5% of all women with births.
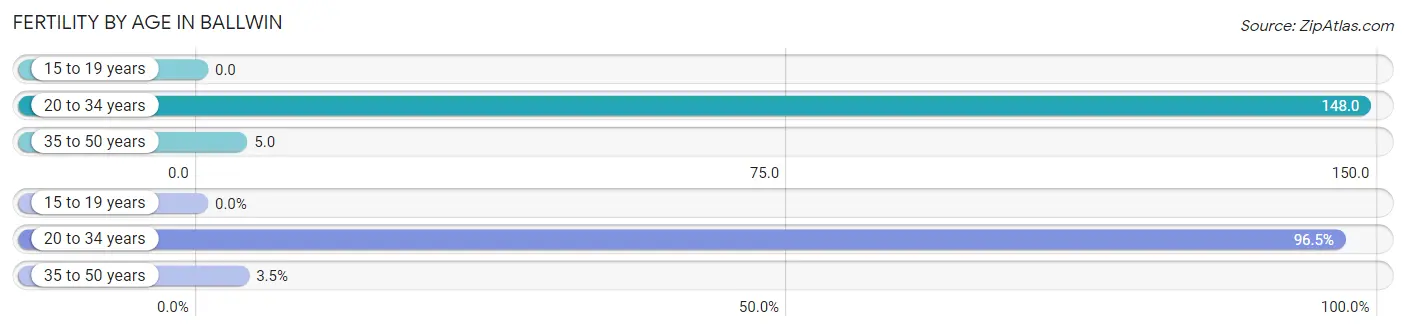
| Age Bracket | Women with Births | Births / 1,000 Women |
| 15 to 19 years | 0 (0.0%) | 0.0 |
| 20 to 34 years | 387 (96.5%) | 148.0 |
| 35 to 50 years | 14 (3.5%) | 5.0 |
| Total | 401 (100.0%) | 61.0 |
Fertility by Age by Marriage Status in Ballwin
82.3% of women with births (401) in Ballwin are married. The highest percentage of unmarried women with births falls into 35 to 50 years age bracket with 100.0% of them unmarried at the time of birth, while the lowest percentage of unmarried women with births belong to 20 to 34 years age bracket with 14.7% of them unmarried.
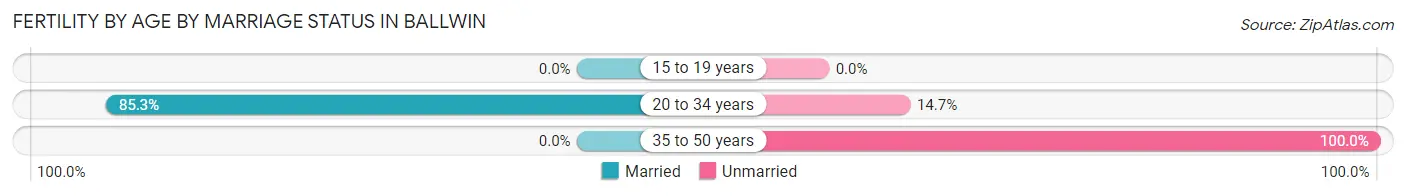
| Age Bracket | Married | Unmarried |
| 15 to 19 years | 0 (0.0%) | 0 (0.0%) |
| 20 to 34 years | 330 (85.3%) | 57 (14.7%) |
| 35 to 50 years | 0 (0.0%) | 14 (100.0%) |
| Total | 330 (82.3%) | 71 (17.7%) |
Fertility by Education in Ballwin
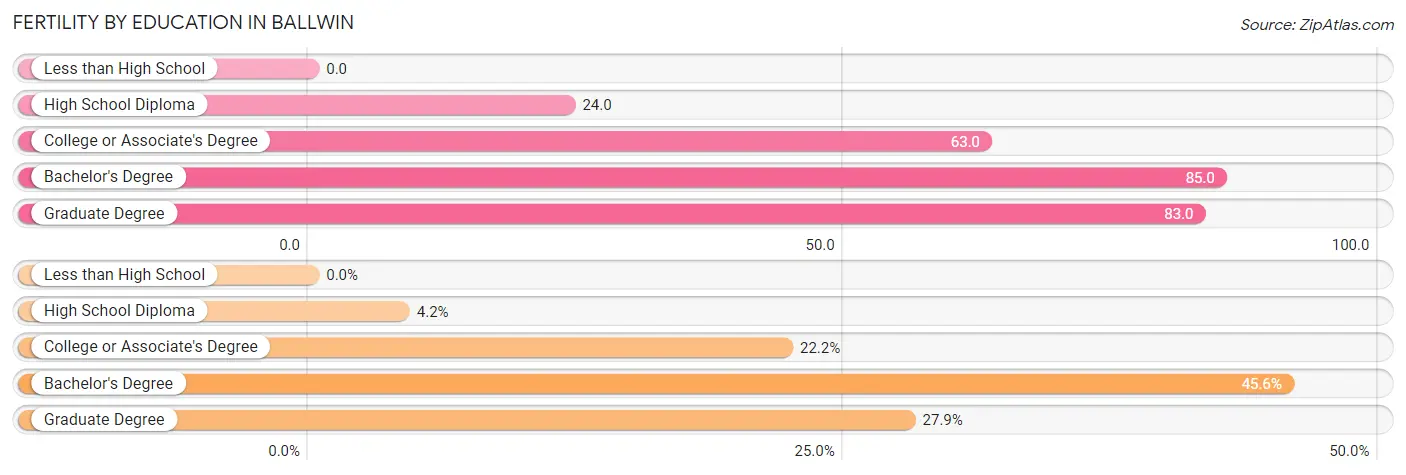
| Educational Attainment | Women with Births | Births / 1,000 Women |
| Less than High School | 0 (0.0%) | 0.0 |
| High School Diploma | 17 (4.2%) | 24.0 |
| College or Associate's Degree | 89 (22.2%) | 63.0 |
| Bachelor's Degree | 183 (45.6%) | 85.0 |
| Graduate Degree | 112 (27.9%) | 83.0 |
| Total | 401 (100.0%) | 61.0 |
Fertility by Education by Marriage Status in Ballwin
17.7% of women with births in Ballwin are unmarried. Women with the educational attainment of graduate degree are most likely to be married with 100.0% of them married at childbirth, while women with the educational attainment of high school diploma are least likely to be married with 100.0% of them unmarried at childbirth.
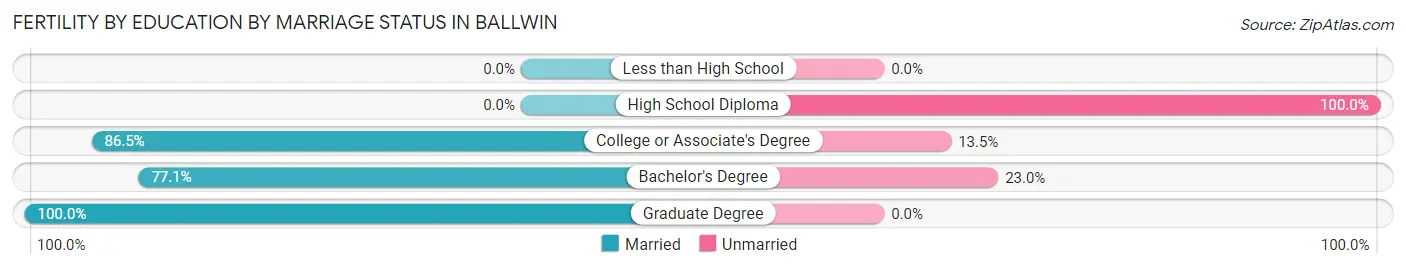
| Educational Attainment | Married | Unmarried |
| Less than High School | 0 (0.0%) | 0 (0.0%) |
| High School Diploma | 0 (0.0%) | 17 (100.0%) |
| College or Associate's Degree | 77 (86.5%) | 12 (13.5%) |
| Bachelor's Degree | 141 (77.0%) | 42 (23.0%) |
| Graduate Degree | 112 (100.0%) | 0 (0.0%) |
| Total | 330 (82.3%) | 71 (17.7%) |
Employment Characteristics in Ballwin
Employment by Class of Employer in Ballwin
Among the 15,753 employed individuals in Ballwin, private company employees (11,286 | 71.6%), not-for-profit organizations (2,103 | 13.4%), and local government employees (810 | 5.1%) make up the most common classes of employment.
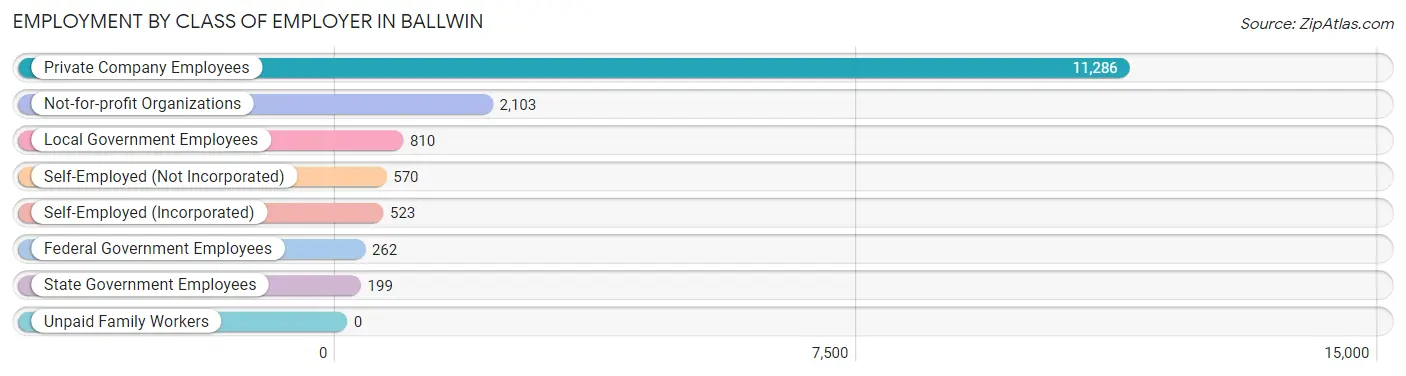
| Employer Class | # Employees | % Employees |
| Private Company Employees | 11,286 | 71.6% |
| Self-Employed (Incorporated) | 523 | 3.3% |
| Self-Employed (Not Incorporated) | 570 | 3.6% |
| Not-for-profit Organizations | 2,103 | 13.4% |
| Local Government Employees | 810 | 5.1% |
| State Government Employees | 199 | 1.3% |
| Federal Government Employees | 262 | 1.7% |
| Unpaid Family Workers | 0 | 0.0% |
| Total | 15,753 | 100.0% |
Employment Status by Age in Ballwin
According to the labor force statistics for Ballwin, out of the total population over 16 years of age (24,857), 66.3% or 16,480 individuals are in the labor force, with 2.2% or 363 of them unemployed. The age group with the highest labor force participation rate is 45 to 54 years, with 91.7% or 3,564 individuals in the labor force. Within the labor force, the 30 to 34 years age range has the highest percentage of unemployed individuals, with 8.0% or 147 of them being unemployed.
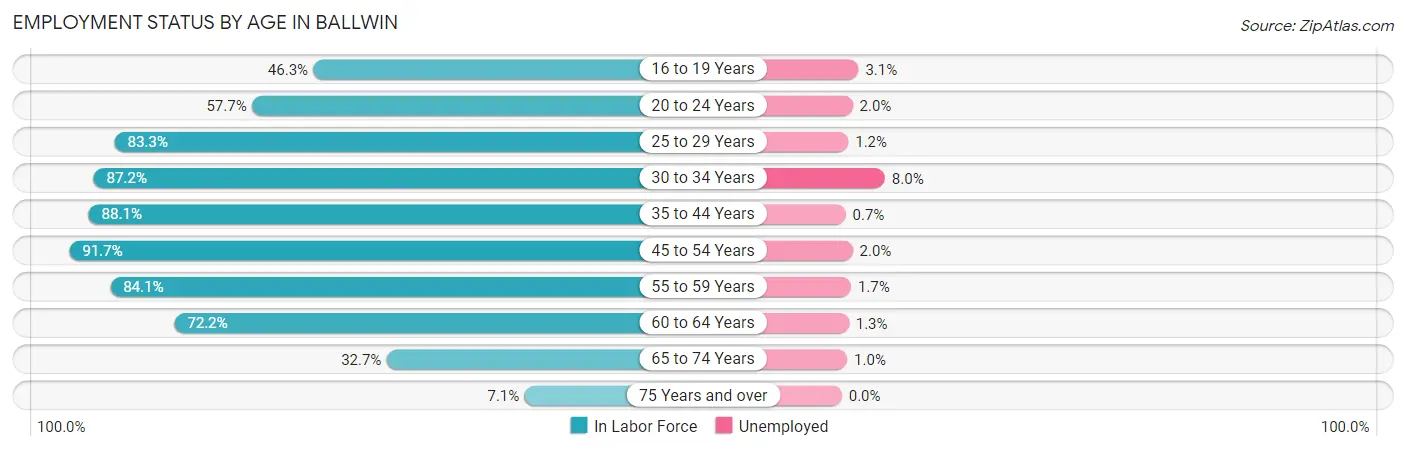
| Age Bracket | In Labor Force | Unemployed |
| 16 to 19 Years | 676 (46.3%) | 21 (3.1%) |
| 20 to 24 Years | 976 (57.7%) | 20 (2.0%) |
| 25 to 29 Years | 1,285 (83.3%) | 15 (1.2%) |
| 30 to 34 Years | 1,839 (87.2%) | 147 (8.0%) |
| 35 to 44 Years | 3,275 (88.1%) | 23 (0.7%) |
| 45 to 54 Years | 3,564 (91.7%) | 71 (2.0%) |
| 55 to 59 Years | 1,833 (84.1%) | 31 (1.7%) |
| 60 to 64 Years | 1,707 (72.2%) | 22 (1.3%) |
| 65 to 74 Years | 1,158 (32.7%) | 12 (1.0%) |
| 75 Years and over | 168 (7.1%) | 0 (0.0%) |
| Total | 16,480 (66.3%) | 363 (2.2%) |
Employment Status by Educational Attainment in Ballwin
According to labor force statistics for Ballwin, 85.5% of individuals (13,509) out of the total population between 25 and 64 years of age (15,800) are in the labor force, with 2.3% or 311 of them being unemployed. The group with the highest labor force participation rate are those with the educational attainment of bachelor's degree or higher, with 87.2% or 9,344 individuals in the labor force. Within the labor force, individuals with less than high school education have the highest percentage of unemployment, with 17.5% or 20 of them being unemployed.
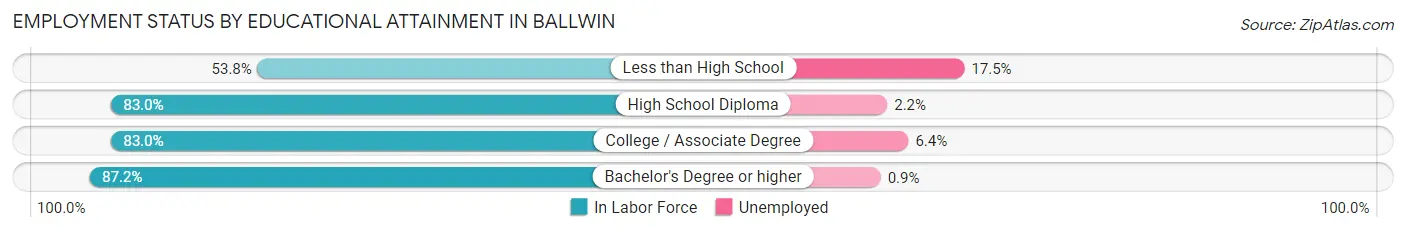
| Educational Attainment | In Labor Force | Unemployed |
| Less than High School | 114 (53.8%) | 37 (17.5%) |
| High School Diploma | 1,198 (83.0%) | 32 (2.2%) |
| College / Associate Degree | 2,846 (83.0%) | 219 (6.4%) |
| Bachelor's Degree or higher | 9,344 (87.2%) | 96 (0.9%) |
| Total | 13,509 (85.5%) | 363 (2.3%) |
Employment Occupations by Sex in Ballwin
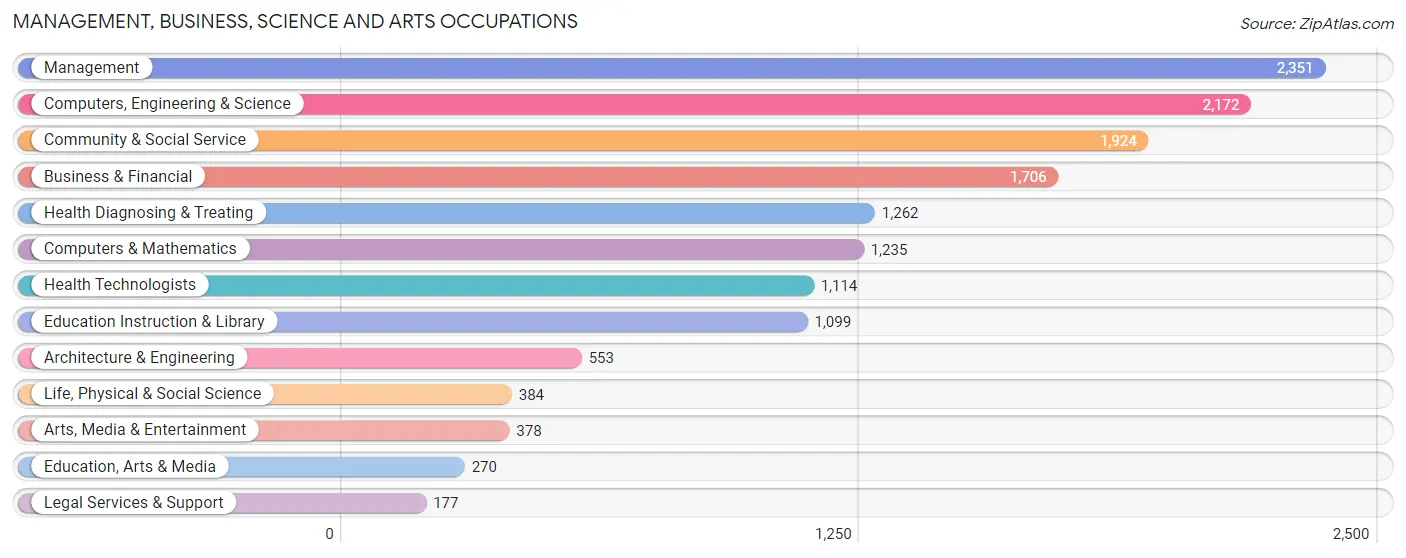
Management, Business, Science and Arts Occupations
The most common Management, Business, Science and Arts occupations in Ballwin are Management (2,351 | 14.6%), Computers, Engineering & Science (2,172 | 13.5%), Community & Social Service (1,924 | 11.9%), Business & Financial (1,706 | 10.6%), and Health Diagnosing & Treating (1,262 | 7.8%).
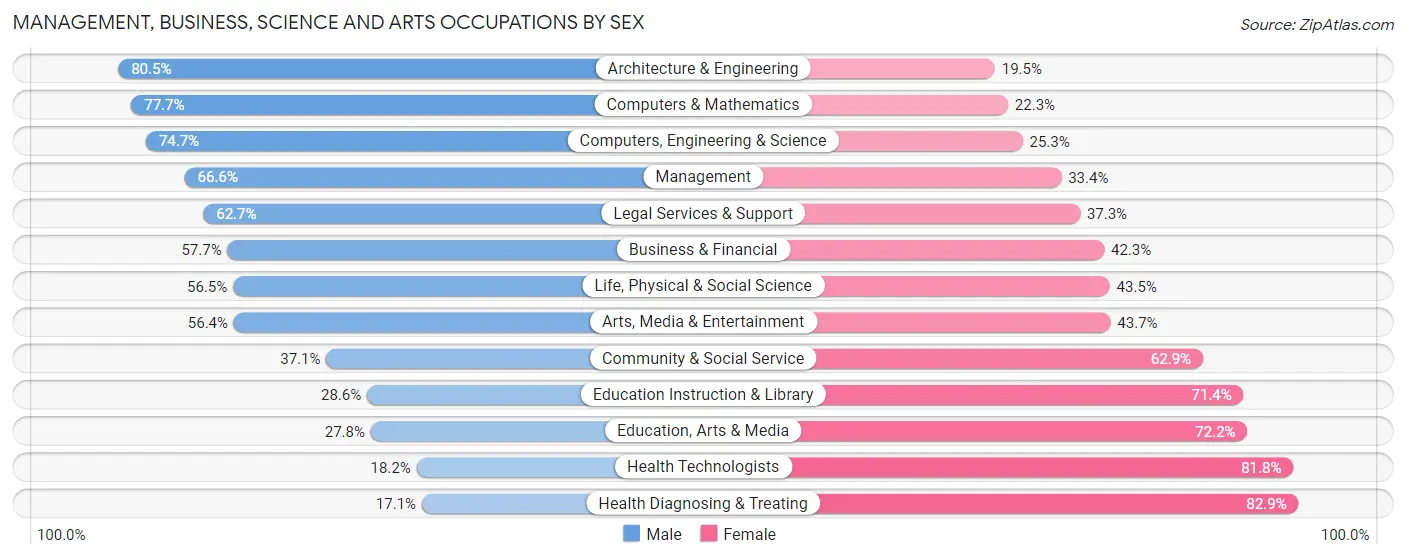
Management, Business, Science and Arts Occupations by Sex
Within the Management, Business, Science and Arts occupations in Ballwin, the most male-oriented occupations are Architecture & Engineering (80.5%), Computers & Mathematics (77.7%), and Computers, Engineering & Science (74.7%), while the most female-oriented occupations are Health Diagnosing & Treating (82.9%), Health Technologists (81.8%), and Education, Arts & Media (72.2%).
| Occupation | Male | Female |
| Management | 1,566 (66.6%) | 785 (33.4%) |
| Business & Financial | 984 (57.7%) | 722 (42.3%) |
| Computers, Engineering & Science | 1,622 (74.7%) | 550 (25.3%) |
| Computers & Mathematics | 960 (77.7%) | 275 (22.3%) |
| Architecture & Engineering | 445 (80.5%) | 108 (19.5%) |
| Life, Physical & Social Science | 217 (56.5%) | 167 (43.5%) |
| Community & Social Service | 713 (37.1%) | 1,211 (62.9%) |
| Education, Arts & Media | 75 (27.8%) | 195 (72.2%) |
| Legal Services & Support | 111 (62.7%) | 66 (37.3%) |
| Education Instruction & Library | 314 (28.6%) | 785 (71.4%) |
| Arts, Media & Entertainment | 213 (56.4%) | 165 (43.6%) |
| Health Diagnosing & Treating | 216 (17.1%) | 1,046 (82.9%) |
| Health Technologists | 203 (18.2%) | 911 (81.8%) |
| Total (Category) | 5,101 (54.2%) | 4,314 (45.8%) |
| Total (Overall) | 8,536 (53.0%) | 7,582 (47.0%) |
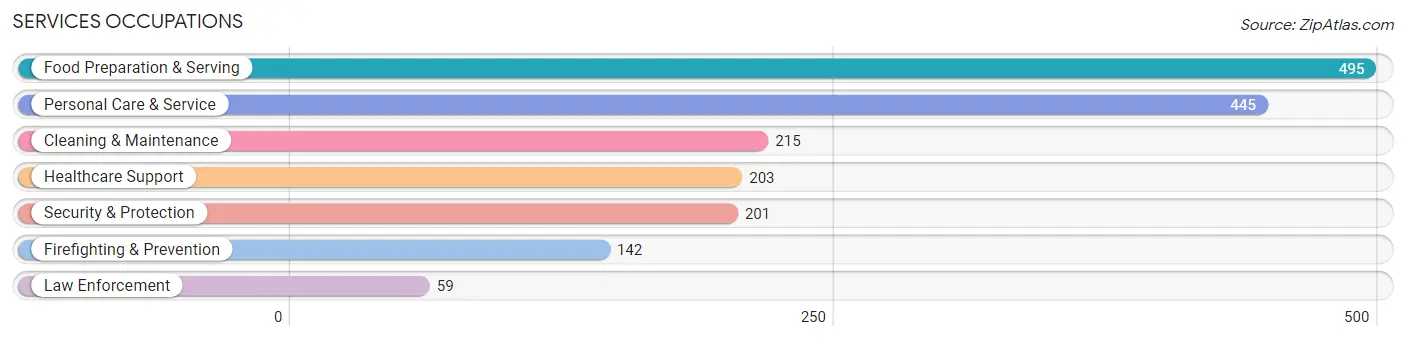
Services Occupations
The most common Services occupations in Ballwin are Food Preparation & Serving (495 | 3.1%), Personal Care & Service (445 | 2.8%), Cleaning & Maintenance (215 | 1.3%), Healthcare Support (203 | 1.3%), and Security & Protection (201 | 1.3%).
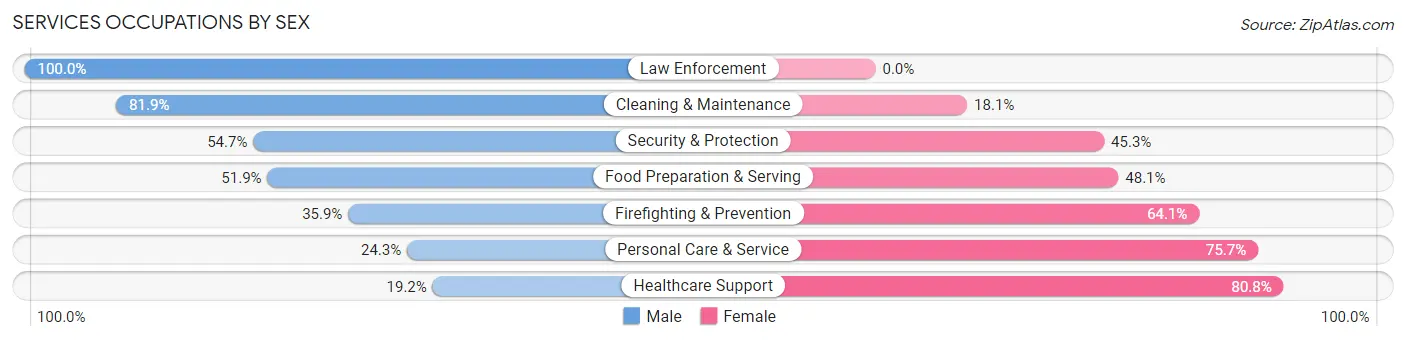
Services Occupations by Sex
Within the Services occupations in Ballwin, the most male-oriented occupations are Law Enforcement (100.0%), Cleaning & Maintenance (81.9%), and Security & Protection (54.7%), while the most female-oriented occupations are Healthcare Support (80.8%), Personal Care & Service (75.7%), and Firefighting & Prevention (64.1%).
| Occupation | Male | Female |
| Healthcare Support | 39 (19.2%) | 164 (80.8%) |
| Security & Protection | 110 (54.7%) | 91 (45.3%) |
| Firefighting & Prevention | 51 (35.9%) | 91 (64.1%) |
| Law Enforcement | 59 (100.0%) | 0 (0.0%) |
| Food Preparation & Serving | 257 (51.9%) | 238 (48.1%) |
| Cleaning & Maintenance | 176 (81.9%) | 39 (18.1%) |
| Personal Care & Service | 108 (24.3%) | 337 (75.7%) |
| Total (Category) | 690 (44.3%) | 869 (55.7%) |
| Total (Overall) | 8,536 (53.0%) | 7,582 (47.0%) |
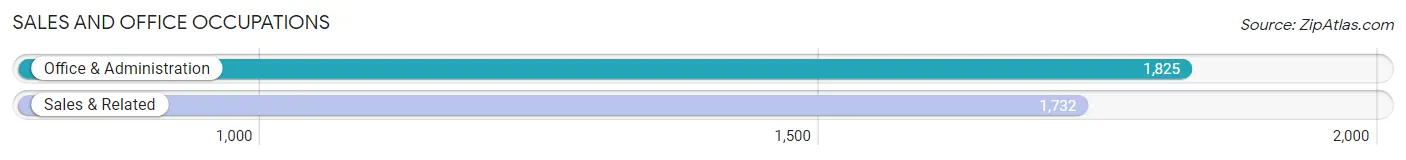
Sales and Office Occupations
The most common Sales and Office occupations in Ballwin are Office & Administration (1,825 | 11.3%), and Sales & Related (1,732 | 10.7%).
Sales and Office Occupations by Sex
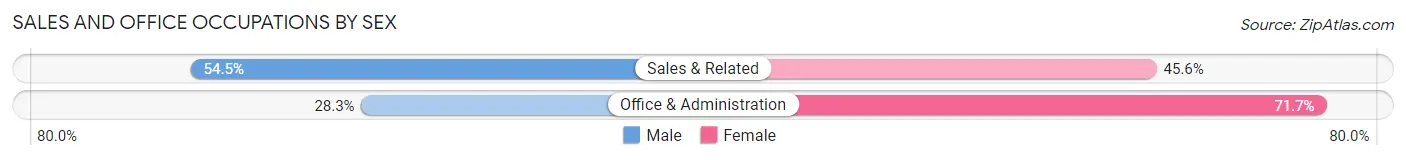
| Occupation | Male | Female |
| Sales & Related | 943 (54.4%) | 789 (45.6%) |
| Office & Administration | 517 (28.3%) | 1,308 (71.7%) |
| Total (Category) | 1,460 (41.0%) | 2,097 (59.0%) |
| Total (Overall) | 8,536 (53.0%) | 7,582 (47.0%) |
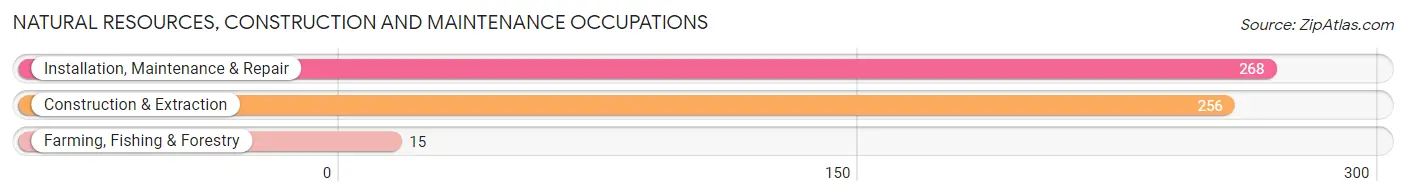
Natural Resources, Construction and Maintenance Occupations
The most common Natural Resources, Construction and Maintenance occupations in Ballwin are Installation, Maintenance & Repair (268 | 1.7%), Construction & Extraction (256 | 1.6%), and Farming, Fishing & Forestry (15 | 0.1%).
Natural Resources, Construction and Maintenance Occupations by Sex
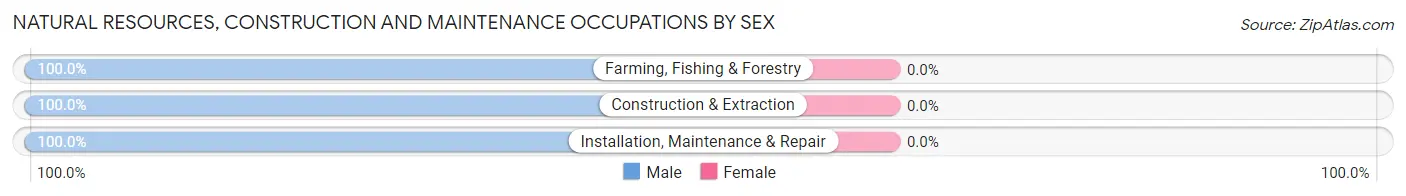
| Occupation | Male | Female |
| Farming, Fishing & Forestry | 15 (100.0%) | 0 (0.0%) |
| Construction & Extraction | 256 (100.0%) | 0 (0.0%) |
| Installation, Maintenance & Repair | 268 (100.0%) | 0 (0.0%) |
| Total (Category) | 539 (100.0%) | 0 (0.0%) |
| Total (Overall) | 8,536 (53.0%) | 7,582 (47.0%) |
Production, Transportation and Moving Occupations
The most common Production, Transportation and Moving occupations in Ballwin are Material Moving (429 | 2.7%), Production (370 | 2.3%), and Transportation (249 | 1.5%).
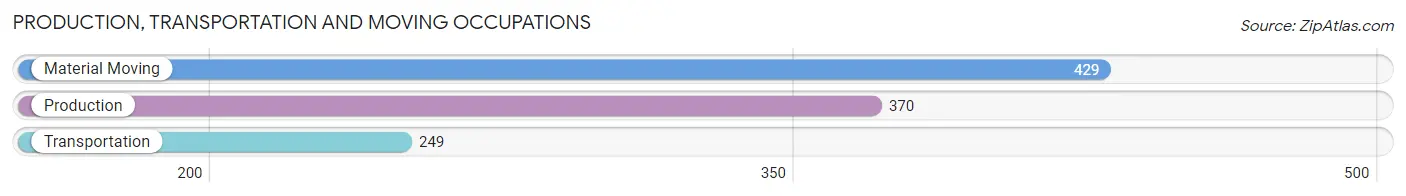
Production, Transportation and Moving Occupations by Sex
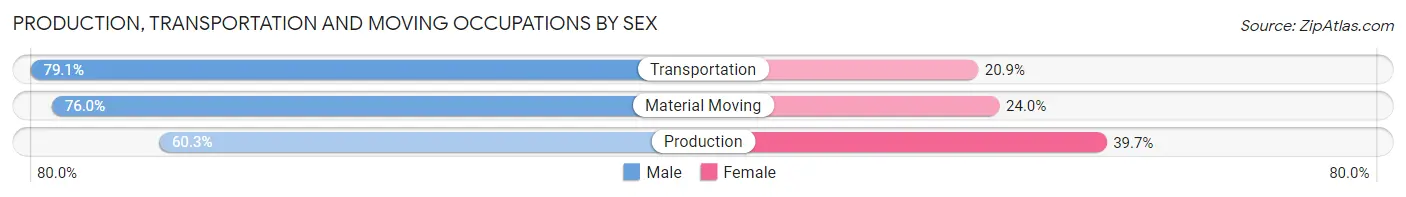
| Occupation | Male | Female |
| Production | 223 (60.3%) | 147 (39.7%) |
| Transportation | 197 (79.1%) | 52 (20.9%) |
| Material Moving | 326 (76.0%) | 103 (24.0%) |
| Total (Category) | 746 (71.2%) | 302 (28.8%) |
| Total (Overall) | 8,536 (53.0%) | 7,582 (47.0%) |
Employment Industries by Sex in Ballwin
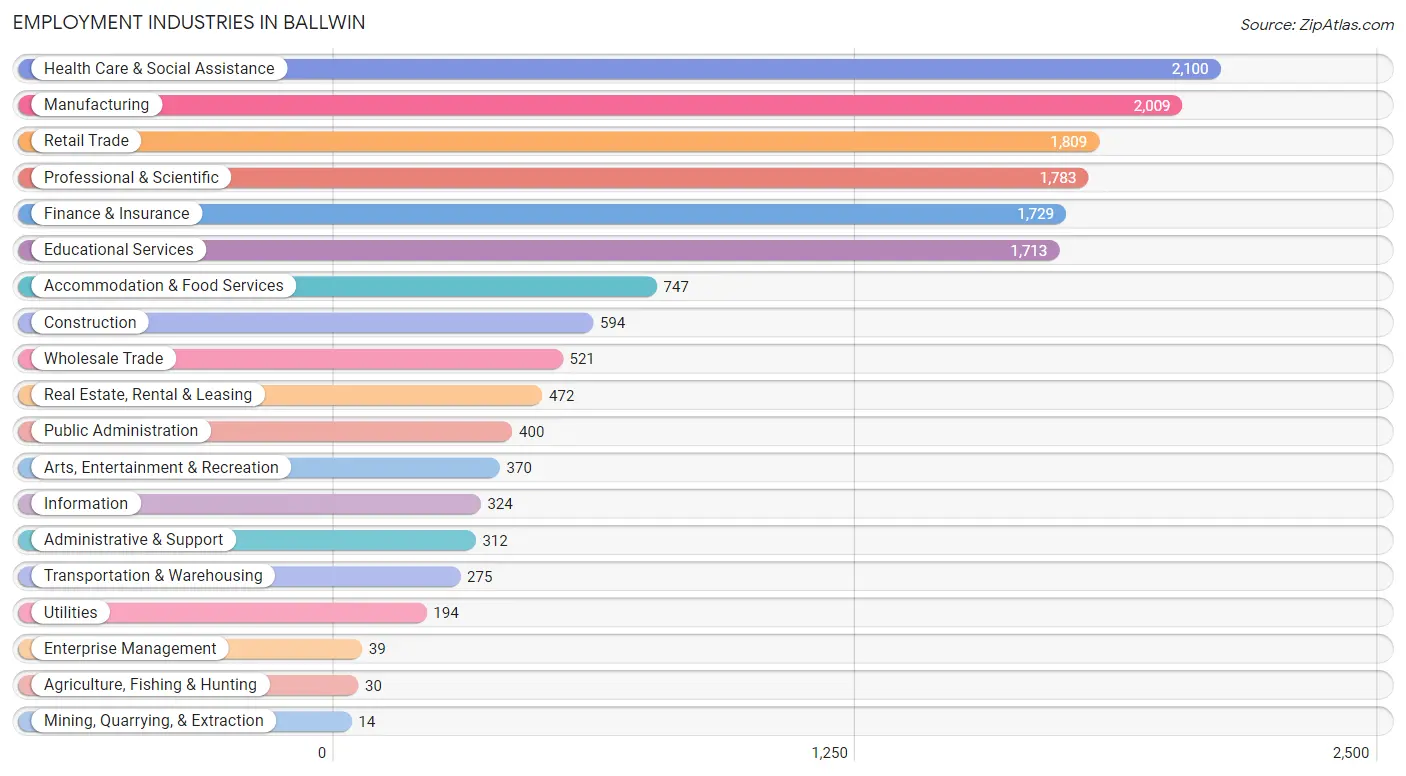
Employment Industries in Ballwin
The major employment industries in Ballwin include Health Care & Social Assistance (2,100 | 13.0%), Manufacturing (2,009 | 12.5%), Retail Trade (1,809 | 11.2%), Professional & Scientific (1,783 | 11.1%), and Finance & Insurance (1,729 | 10.7%).
Employment Industries by Sex in Ballwin
The Ballwin industries that see more men than women are Agriculture, Fishing & Hunting (100.0%), Enterprise Management (100.0%), and Utilities (85.1%), whereas the industries that tend to have a higher number of women are Mining, Quarrying, & Extraction (100.0%), Health Care & Social Assistance (83.1%), and Real Estate, Rental & Leasing (70.6%).
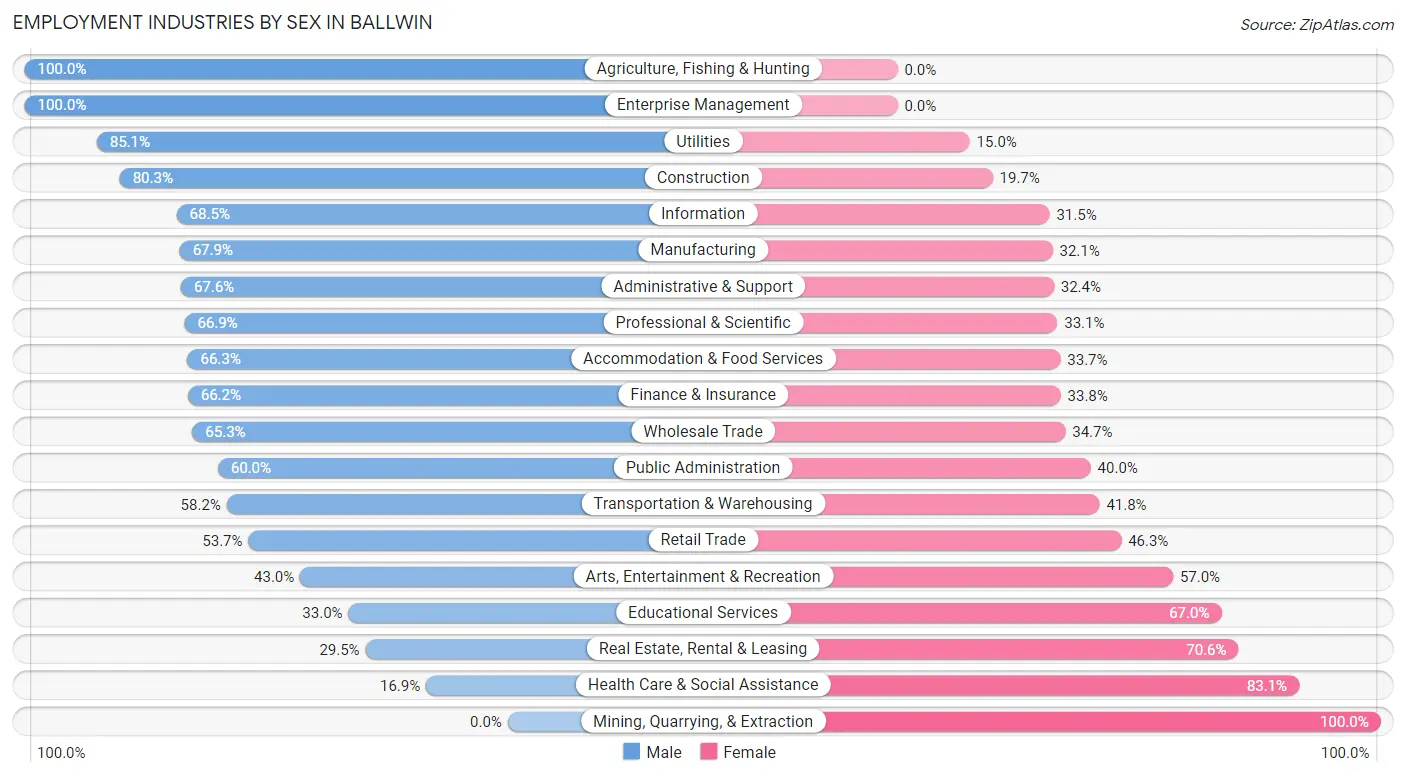
| Industry | Male | Female |
| Agriculture, Fishing & Hunting | 30 (100.0%) | 0 (0.0%) |
| Mining, Quarrying, & Extraction | 0 (0.0%) | 14 (100.0%) |
| Construction | 477 (80.3%) | 117 (19.7%) |
| Manufacturing | 1,364 (67.9%) | 645 (32.1%) |
| Wholesale Trade | 340 (65.3%) | 181 (34.7%) |
| Retail Trade | 971 (53.7%) | 838 (46.3%) |
| Transportation & Warehousing | 160 (58.2%) | 115 (41.8%) |
| Utilities | 165 (85.1%) | 29 (14.9%) |
| Information | 222 (68.5%) | 102 (31.5%) |
| Finance & Insurance | 1,145 (66.2%) | 584 (33.8%) |
| Real Estate, Rental & Leasing | 139 (29.4%) | 333 (70.6%) |
| Professional & Scientific | 1,193 (66.9%) | 590 (33.1%) |
| Enterprise Management | 39 (100.0%) | 0 (0.0%) |
| Administrative & Support | 211 (67.6%) | 101 (32.4%) |
| Educational Services | 565 (33.0%) | 1,148 (67.0%) |
| Health Care & Social Assistance | 355 (16.9%) | 1,745 (83.1%) |
| Arts, Entertainment & Recreation | 159 (43.0%) | 211 (57.0%) |
| Accommodation & Food Services | 495 (66.3%) | 252 (33.7%) |
| Public Administration | 240 (60.0%) | 160 (40.0%) |
| Total | 8,536 (53.0%) | 7,582 (47.0%) |
Education in Ballwin
School Enrollment in Ballwin
The most common levels of schooling among the 7,781 students in Ballwin are middle school (1,536 | 19.7%), high school (1,532 | 19.7%), and elementary school (1,428 | 18.3%).
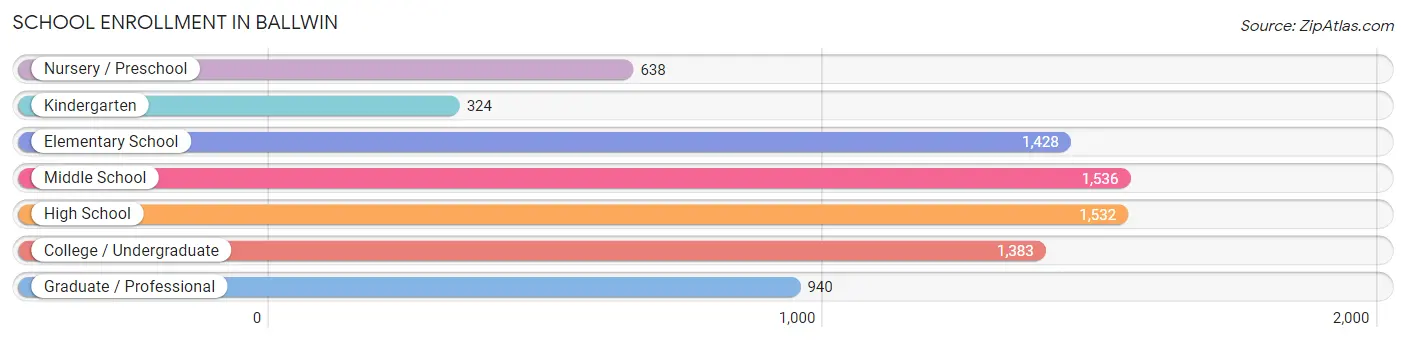
| School Level | # Students | % Students |
| Nursery / Preschool | 638 | 8.2% |
| Kindergarten | 324 | 4.2% |
| Elementary School | 1,428 | 18.3% |
| Middle School | 1,536 | 19.7% |
| High School | 1,532 | 19.7% |
| College / Undergraduate | 1,383 | 17.8% |
| Graduate / Professional | 940 | 12.1% |
| Total | 7,781 | 100.0% |
School Enrollment by Age by Funding Source in Ballwin
Out of a total of 7,781 students who are enrolled in schools in Ballwin, 2,218 (28.5%) attend a private institution, while the remaining 5,563 (71.5%) are enrolled in public schools. The age group of 35 years and over has the highest likelihood of being enrolled in private schools, with 361 (69.7% in the age bracket) enrolled. Conversely, the age group of 10 to 14 year olds has the lowest likelihood of being enrolled in a private school, with 1,573 (89.1% in the age bracket) attending a public institution.
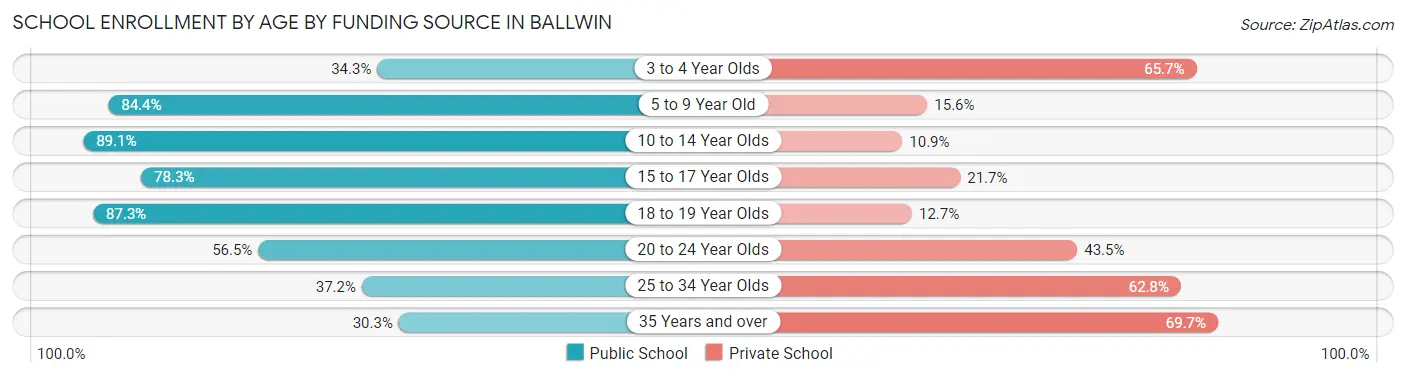
| Age Bracket | Public School | Private School |
| 3 to 4 Year Olds | 150 (34.3%) | 287 (65.7%) |
| 5 to 9 Year Old | 1,516 (84.4%) | 280 (15.6%) |
| 10 to 14 Year Olds | 1,573 (89.1%) | 193 (10.9%) |
| 15 to 17 Year Olds | 1,013 (78.3%) | 281 (21.7%) |
| 18 to 19 Year Olds | 425 (87.3%) | 62 (12.7%) |
| 20 to 24 Year Olds | 531 (56.5%) | 409 (43.5%) |
| 25 to 34 Year Olds | 202 (37.2%) | 341 (62.8%) |
| 35 Years and over | 157 (30.3%) | 361 (69.7%) |
| Total | 5,563 (71.5%) | 2,218 (28.5%) |
Educational Attainment by Field of Study in Ballwin
Business (4,062 | 27.0%), science & technology (1,683 | 11.2%), education (1,617 | 10.7%), engineering (1,430 | 9.5%), and bio, nature & agricultural (920 | 6.1%) are the most common fields of study among 15,053 individuals in Ballwin who have obtained a bachelor's degree or higher.
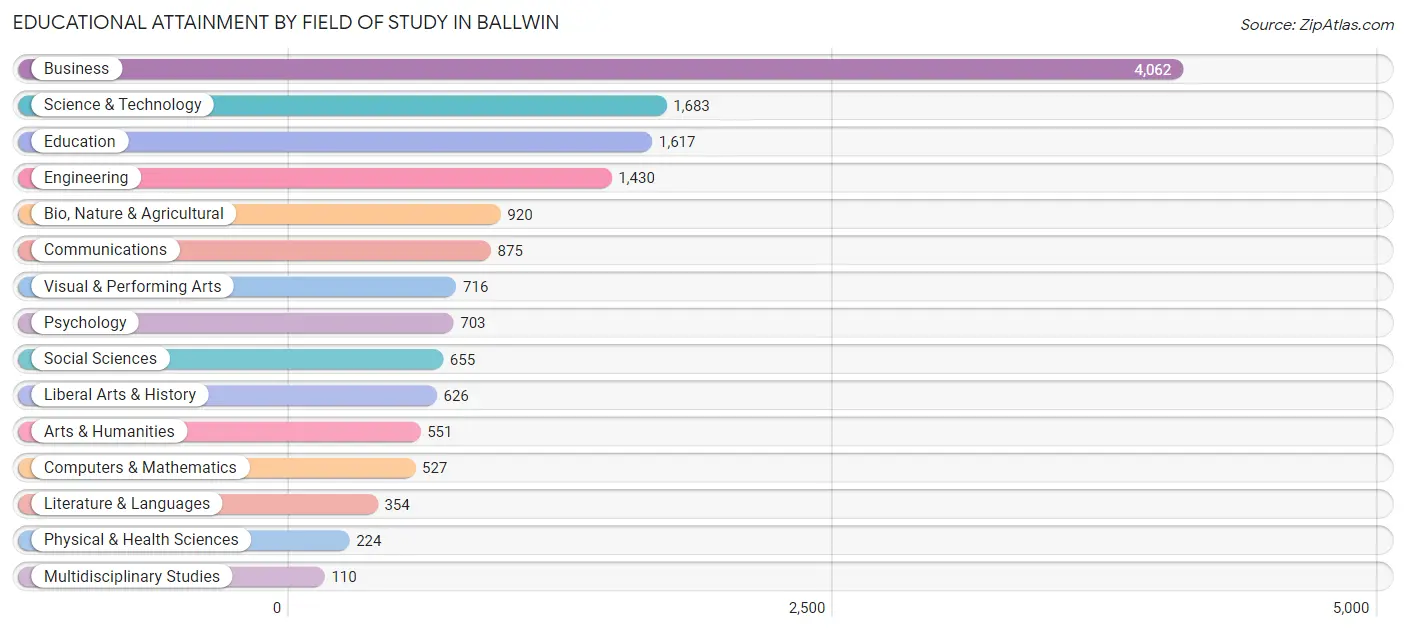
| Field of Study | # Graduates | % Graduates |
| Computers & Mathematics | 527 | 3.5% |
| Bio, Nature & Agricultural | 920 | 6.1% |
| Physical & Health Sciences | 224 | 1.5% |
| Psychology | 703 | 4.7% |
| Social Sciences | 655 | 4.3% |
| Engineering | 1,430 | 9.5% |
| Multidisciplinary Studies | 110 | 0.7% |
| Science & Technology | 1,683 | 11.2% |
| Business | 4,062 | 27.0% |
| Education | 1,617 | 10.7% |
| Literature & Languages | 354 | 2.4% |
| Liberal Arts & History | 626 | 4.2% |
| Visual & Performing Arts | 716 | 4.8% |
| Communications | 875 | 5.8% |
| Arts & Humanities | 551 | 3.7% |
| Total | 15,053 | 100.0% |
Transportation & Commute in Ballwin
Vehicle Availability by Sex in Ballwin
The most prevalent vehicle ownership categories in Ballwin are males with 2 vehicles (4,442, accounting for 52.4%) and females with 2 vehicles (3,517, making up 61.1%).
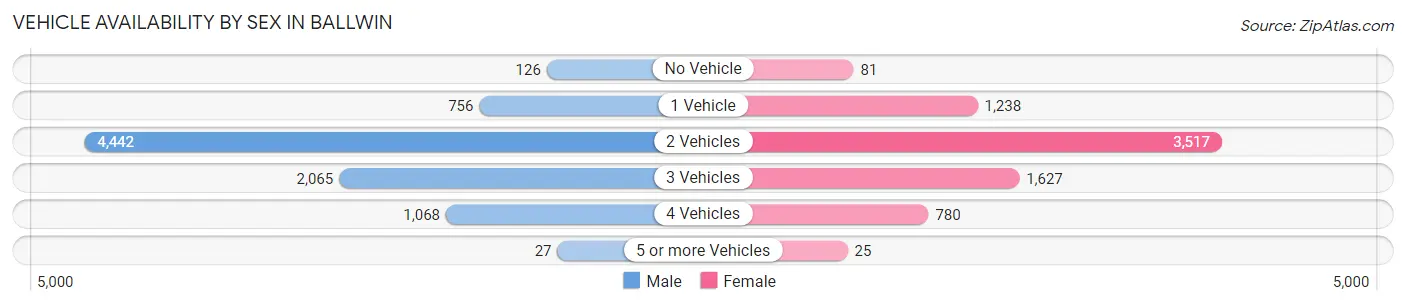
| Vehicles Available | Male | Female |
| No Vehicle | 126 (1.5%) | 81 (1.1%) |
| 1 Vehicle | 756 (8.9%) | 1,238 (17.0%) |
| 2 Vehicles | 4,442 (52.4%) | 3,517 (48.4%) |
| 3 Vehicles | 2,065 (24.3%) | 1,627 (22.4%) |
| 4 Vehicles | 1,068 (12.6%) | 780 (10.7%) |
| 5 or more Vehicles | 27 (0.3%) | 25 (0.3%) |
| Total | 8,484 (100.0%) | 7,268 (100.0%) |
Commute Time in Ballwin
The most frequently occuring commute durations in Ballwin are 20 to 24 minutes (2,500 commuters, 19.5%), 30 to 34 minutes (2,038 commuters, 15.9%), and 15 to 19 minutes (1,934 commuters, 15.1%).
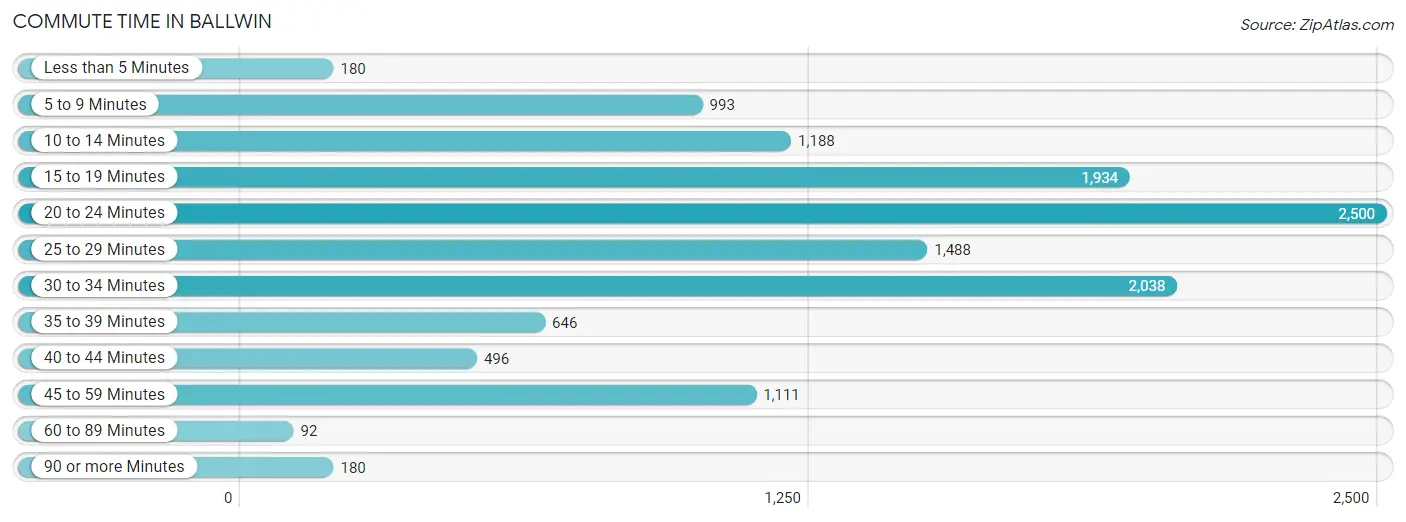
| Commute Time | # Commuters | % Commuters |
| Less than 5 Minutes | 180 | 1.4% |
| 5 to 9 Minutes | 993 | 7.7% |
| 10 to 14 Minutes | 1,188 | 9.2% |
| 15 to 19 Minutes | 1,934 | 15.1% |
| 20 to 24 Minutes | 2,500 | 19.5% |
| 25 to 29 Minutes | 1,488 | 11.6% |
| 30 to 34 Minutes | 2,038 | 15.9% |
| 35 to 39 Minutes | 646 | 5.0% |
| 40 to 44 Minutes | 496 | 3.9% |
| 45 to 59 Minutes | 1,111 | 8.6% |
| 60 to 89 Minutes | 92 | 0.7% |
| 90 or more Minutes | 180 | 1.4% |
Commute Time by Sex in Ballwin
The most common commute times in Ballwin are 30 to 34 minutes (1,314 commuters, 18.5%) for males and 20 to 24 minutes (1,217 commuters, 21.1%) for females.
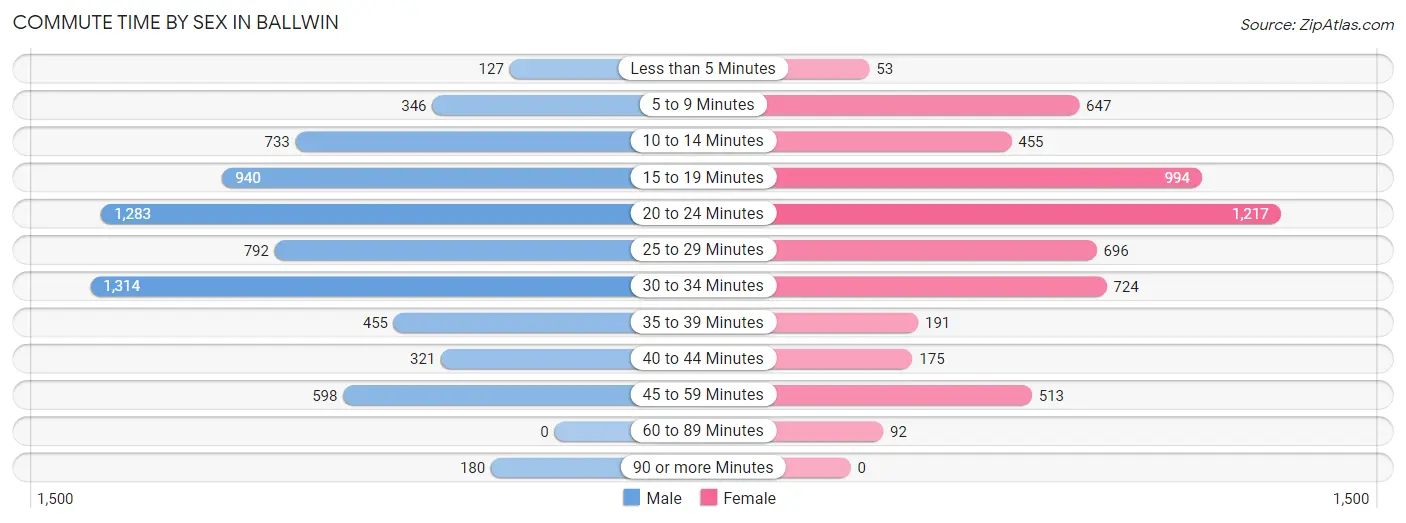
| Commute Time | Male | Female |
| Less than 5 Minutes | 127 (1.8%) | 53 (0.9%) |
| 5 to 9 Minutes | 346 (4.9%) | 647 (11.2%) |
| 10 to 14 Minutes | 733 (10.3%) | 455 (7.9%) |
| 15 to 19 Minutes | 940 (13.3%) | 994 (17.3%) |
| 20 to 24 Minutes | 1,283 (18.1%) | 1,217 (21.1%) |
| 25 to 29 Minutes | 792 (11.2%) | 696 (12.1%) |
| 30 to 34 Minutes | 1,314 (18.5%) | 724 (12.6%) |
| 35 to 39 Minutes | 455 (6.4%) | 191 (3.3%) |
| 40 to 44 Minutes | 321 (4.5%) | 175 (3.0%) |
| 45 to 59 Minutes | 598 (8.4%) | 513 (8.9%) |
| 60 to 89 Minutes | 0 (0.0%) | 92 (1.6%) |
| 90 or more Minutes | 180 (2.5%) | 0 (0.0%) |
Time of Departure to Work by Sex in Ballwin
The most frequent times of departure to work in Ballwin are 7:00 AM to 7:29 AM (1,344, 19.0%) for males and 7:00 AM to 7:29 AM (1,128, 19.6%) for females.
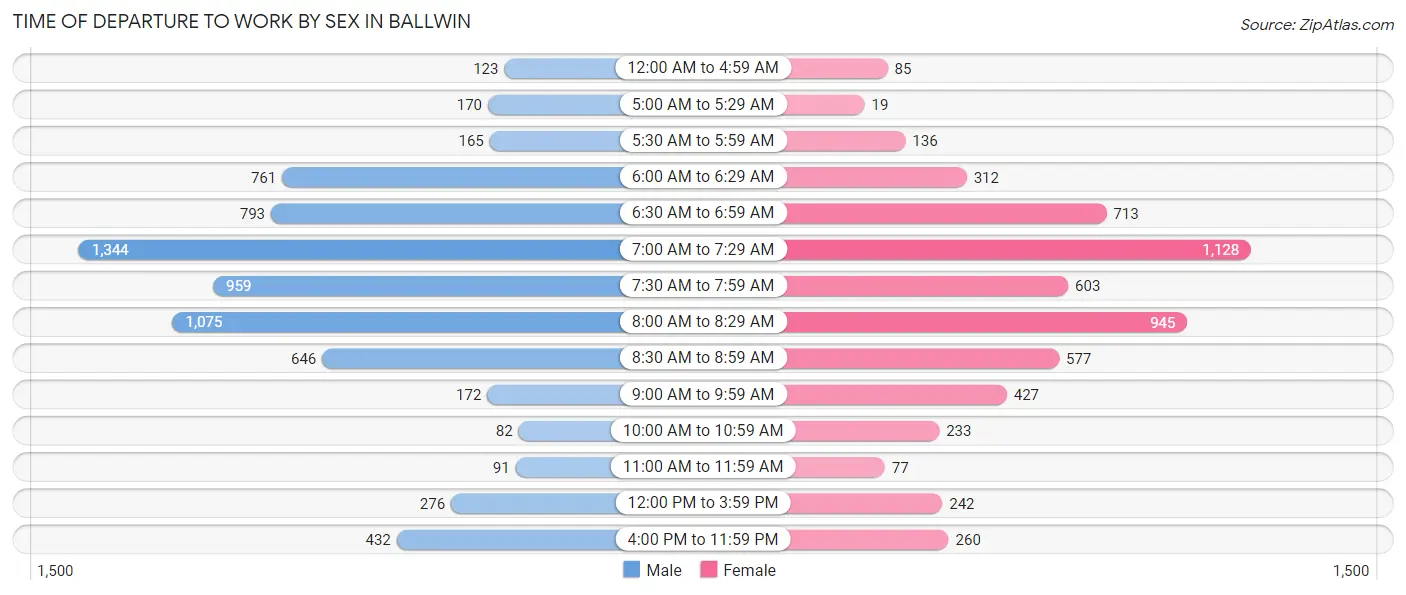
| Time of Departure | Male | Female |
| 12:00 AM to 4:59 AM | 123 (1.7%) | 85 (1.5%) |
| 5:00 AM to 5:29 AM | 170 (2.4%) | 19 (0.3%) |
| 5:30 AM to 5:59 AM | 165 (2.3%) | 136 (2.4%) |
| 6:00 AM to 6:29 AM | 761 (10.7%) | 312 (5.4%) |
| 6:30 AM to 6:59 AM | 793 (11.2%) | 713 (12.4%) |
| 7:00 AM to 7:29 AM | 1,344 (19.0%) | 1,128 (19.6%) |
| 7:30 AM to 7:59 AM | 959 (13.5%) | 603 (10.5%) |
| 8:00 AM to 8:29 AM | 1,075 (15.2%) | 945 (16.4%) |
| 8:30 AM to 8:59 AM | 646 (9.1%) | 577 (10.0%) |
| 9:00 AM to 9:59 AM | 172 (2.4%) | 427 (7.4%) |
| 10:00 AM to 10:59 AM | 82 (1.2%) | 233 (4.1%) |
| 11:00 AM to 11:59 AM | 91 (1.3%) | 77 (1.3%) |
| 12:00 PM to 3:59 PM | 276 (3.9%) | 242 (4.2%) |
| 4:00 PM to 11:59 PM | 432 (6.1%) | 260 (4.5%) |
| Total | 7,089 (100.0%) | 5,757 (100.0%) |
Housing Occupancy in Ballwin
Occupancy by Ownership in Ballwin
Of the total 11,973 dwellings in Ballwin, owner-occupied units account for 10,044 (83.9%), while renter-occupied units make up 1,929 (16.1%).
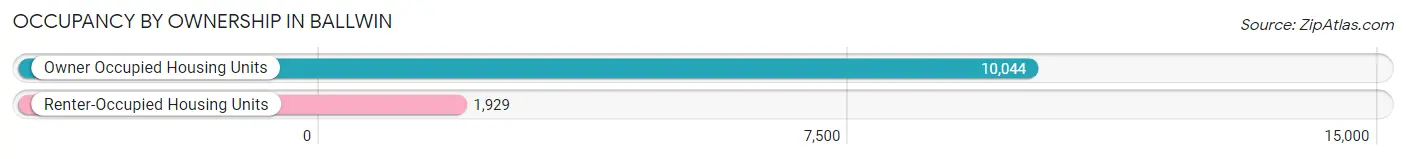
| Occupancy | # Housing Units | % Housing Units |
| Owner Occupied Housing Units | 10,044 | 83.9% |
| Renter-Occupied Housing Units | 1,929 | 16.1% |
| Total Occupied Housing Units | 11,973 | 100.0% |
Occupancy by Household Size in Ballwin
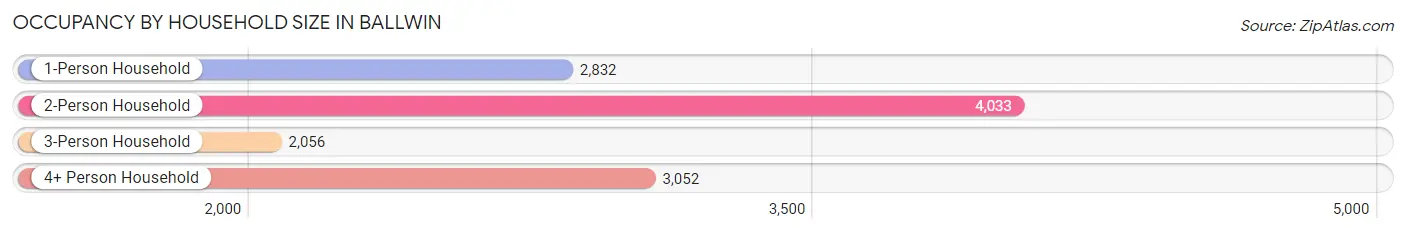
| Household Size | # Housing Units | % Housing Units |
| 1-Person Household | 2,832 | 23.6% |
| 2-Person Household | 4,033 | 33.7% |
| 3-Person Household | 2,056 | 17.2% |
| 4+ Person Household | 3,052 | 25.5% |
| Total Housing Units | 11,973 | 100.0% |
Occupancy by Ownership by Household Size in Ballwin
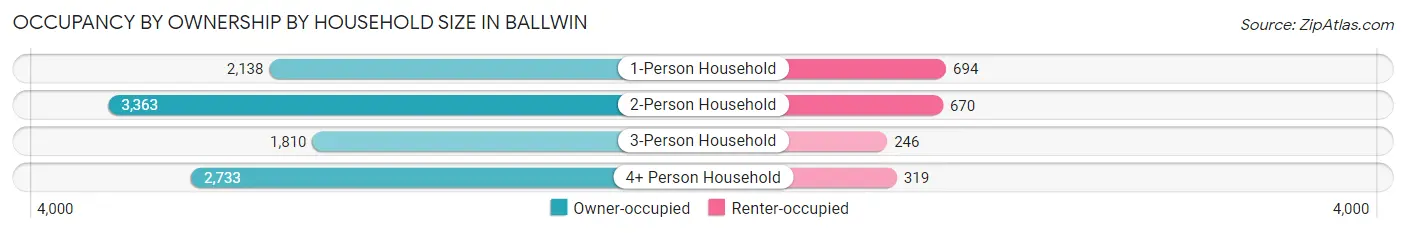
| Household Size | Owner-occupied | Renter-occupied |
| 1-Person Household | 2,138 (75.5%) | 694 (24.5%) |
| 2-Person Household | 3,363 (83.4%) | 670 (16.6%) |
| 3-Person Household | 1,810 (88.0%) | 246 (12.0%) |
| 4+ Person Household | 2,733 (89.5%) | 319 (10.4%) |
| Total Housing Units | 10,044 (83.9%) | 1,929 (16.1%) |
Occupancy by Educational Attainment in Ballwin
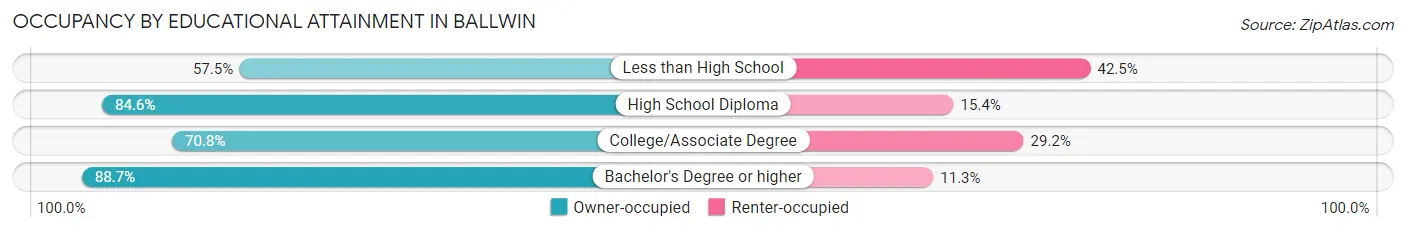
| Household Size | Owner-occupied | Renter-occupied |
| Less than High School | 119 (57.5%) | 88 (42.5%) |
| High School Diploma | 975 (84.6%) | 177 (15.4%) |
| College/Associate Degree | 1,820 (70.8%) | 752 (29.2%) |
| Bachelor's Degree or higher | 7,130 (88.7%) | 912 (11.3%) |
Occupancy by Age of Householder in Ballwin
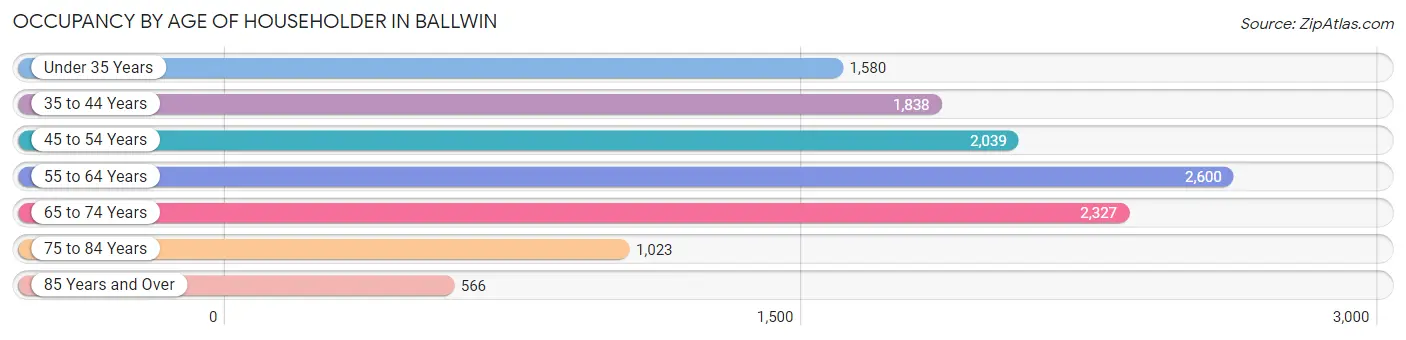
| Age Bracket | # Households | % Households |
| Under 35 Years | 1,580 | 13.2% |
| 35 to 44 Years | 1,838 | 15.3% |
| 45 to 54 Years | 2,039 | 17.0% |
| 55 to 64 Years | 2,600 | 21.7% |
| 65 to 74 Years | 2,327 | 19.4% |
| 75 to 84 Years | 1,023 | 8.5% |
| 85 Years and Over | 566 | 4.7% |
| Total | 11,973 | 100.0% |
Housing Finances in Ballwin
Median Income by Occupancy in Ballwin
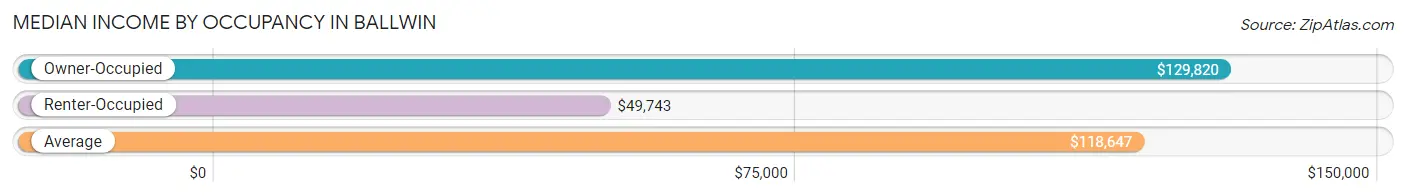
| Occupancy Type | # Households | Median Income |
| Owner-Occupied | 10,044 (83.9%) | $129,820 |
| Renter-Occupied | 1,929 (16.1%) | $49,743 |
| Average | 11,973 (100.0%) | $118,647 |
Occupancy by Householder Income Bracket in Ballwin
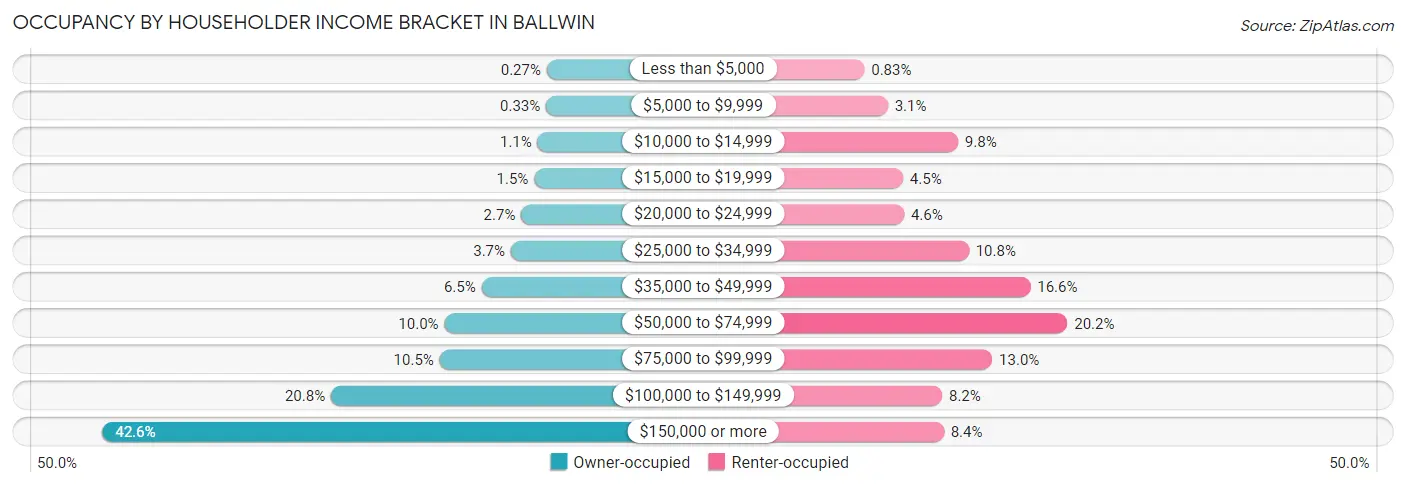
| Income Bracket | Owner-occupied | Renter-occupied |
| Less than $5,000 | 27 (0.3%) | 16 (0.8%) |
| $5,000 to $9,999 | 33 (0.3%) | 59 (3.1%) |
| $10,000 to $14,999 | 115 (1.1%) | 188 (9.8%) |
| $15,000 to $19,999 | 148 (1.5%) | 87 (4.5%) |
| $20,000 to $24,999 | 271 (2.7%) | 89 (4.6%) |
| $25,000 to $34,999 | 371 (3.7%) | 208 (10.8%) |
| $35,000 to $49,999 | 651 (6.5%) | 321 (16.6%) |
| $50,000 to $74,999 | 1,006 (10.0%) | 389 (20.2%) |
| $75,000 to $99,999 | 1,052 (10.5%) | 251 (13.0%) |
| $100,000 to $149,999 | 2,091 (20.8%) | 159 (8.2%) |
| $150,000 or more | 4,279 (42.6%) | 162 (8.4%) |
| Total | 10,044 (100.0%) | 1,929 (100.0%) |
Monthly Housing Cost Tiers in Ballwin
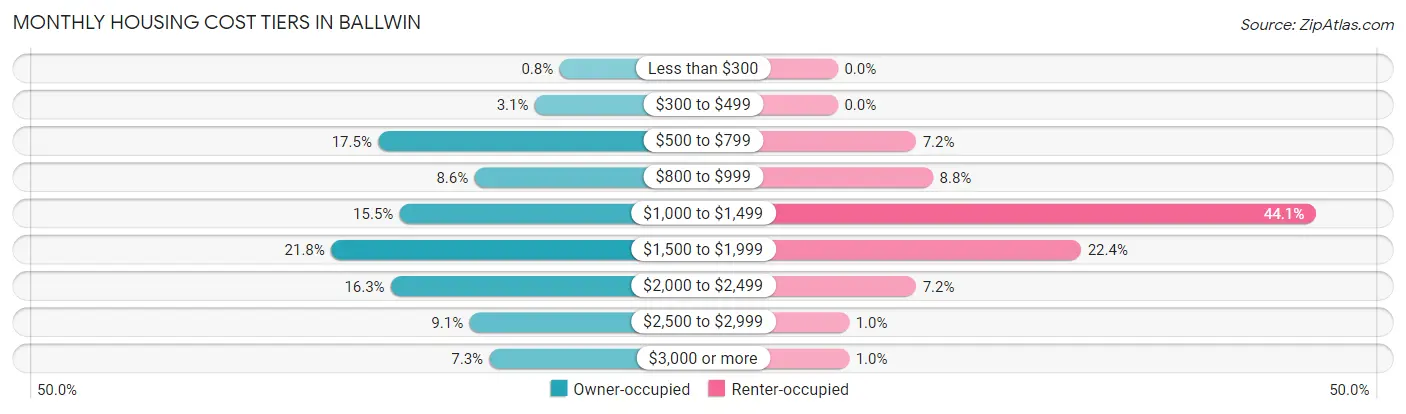
| Monthly Cost | Owner-occupied | Renter-occupied |
| Less than $300 | 80 (0.8%) | 0 (0.0%) |
| $300 to $499 | 309 (3.1%) | 0 (0.0%) |
| $500 to $799 | 1,757 (17.5%) | 139 (7.2%) |
| $800 to $999 | 866 (8.6%) | 169 (8.8%) |
| $1,000 to $1,499 | 1,559 (15.5%) | 850 (44.1%) |
| $1,500 to $1,999 | 2,193 (21.8%) | 432 (22.4%) |
| $2,000 to $2,499 | 1,639 (16.3%) | 139 (7.2%) |
| $2,500 to $2,999 | 913 (9.1%) | 20 (1.0%) |
| $3,000 or more | 728 (7.2%) | 20 (1.0%) |
| Total | 10,044 (100.0%) | 1,929 (100.0%) |
Physical Housing Characteristics in Ballwin
Housing Structures in Ballwin
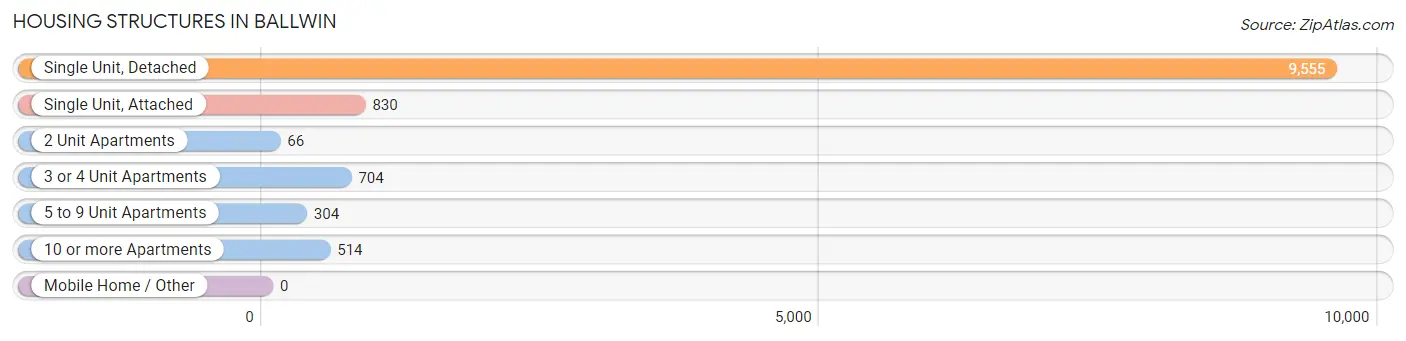
| Structure Type | # Housing Units | % Housing Units |
| Single Unit, Detached | 9,555 | 79.8% |
| Single Unit, Attached | 830 | 6.9% |
| 2 Unit Apartments | 66 | 0.5% |
| 3 or 4 Unit Apartments | 704 | 5.9% |
| 5 to 9 Unit Apartments | 304 | 2.5% |
| 10 or more Apartments | 514 | 4.3% |
| Mobile Home / Other | 0 | 0.0% |
| Total | 11,973 | 100.0% |
Housing Structures by Occupancy in Ballwin
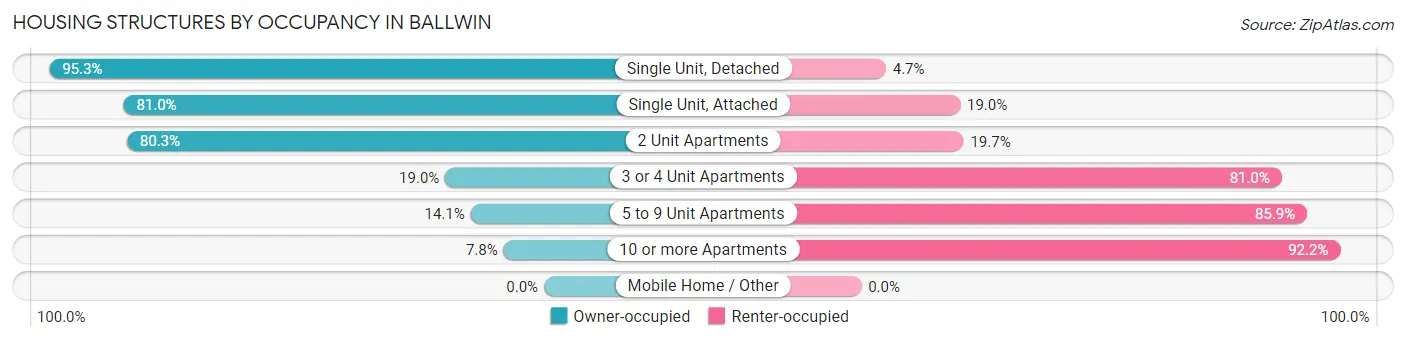
| Structure Type | Owner-occupied | Renter-occupied |
| Single Unit, Detached | 9,102 (95.3%) | 453 (4.7%) |
| Single Unit, Attached | 672 (81.0%) | 158 (19.0%) |
| 2 Unit Apartments | 53 (80.3%) | 13 (19.7%) |
| 3 or 4 Unit Apartments | 134 (19.0%) | 570 (81.0%) |
| 5 to 9 Unit Apartments | 43 (14.1%) | 261 (85.9%) |
| 10 or more Apartments | 40 (7.8%) | 474 (92.2%) |
| Mobile Home / Other | 0 (0.0%) | 0 (0.0%) |
| Total | 10,044 (83.9%) | 1,929 (16.1%) |
Housing Structures by Number of Rooms in Ballwin
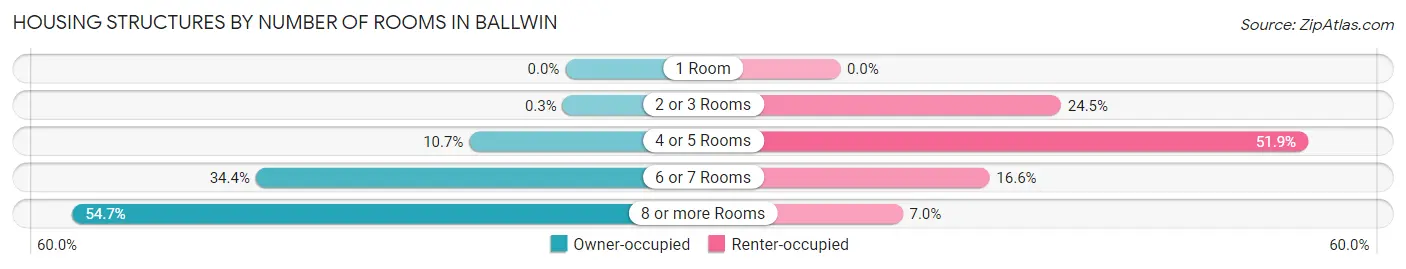
| Number of Rooms | Owner-occupied | Renter-occupied |
| 1 Room | 0 (0.0%) | 0 (0.0%) |
| 2 or 3 Rooms | 30 (0.3%) | 473 (24.5%) |
| 4 or 5 Rooms | 1,071 (10.7%) | 1,002 (51.9%) |
| 6 or 7 Rooms | 3,450 (34.4%) | 320 (16.6%) |
| 8 or more Rooms | 5,493 (54.7%) | 134 (7.0%) |
| Total | 10,044 (100.0%) | 1,929 (100.0%) |
Housing Structure by Heating Type in Ballwin
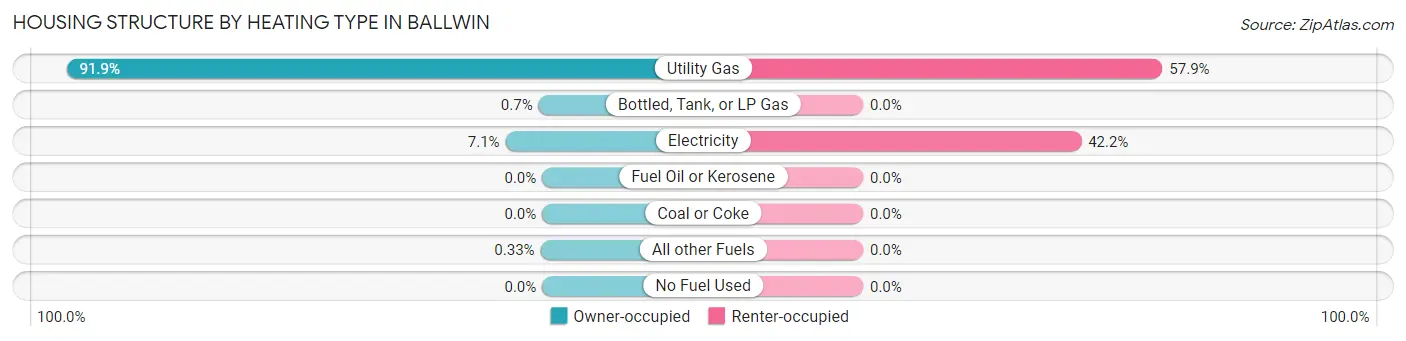
| Heating Type | Owner-occupied | Renter-occupied |
| Utility Gas | 9,229 (91.9%) | 1,116 (57.9%) |
| Bottled, Tank, or LP Gas | 70 (0.7%) | 0 (0.0%) |
| Electricity | 712 (7.1%) | 813 (42.1%) |
| Fuel Oil or Kerosene | 0 (0.0%) | 0 (0.0%) |
| Coal or Coke | 0 (0.0%) | 0 (0.0%) |
| All other Fuels | 33 (0.3%) | 0 (0.0%) |
| No Fuel Used | 0 (0.0%) | 0 (0.0%) |
| Total | 10,044 (100.0%) | 1,929 (100.0%) |
Household Vehicle Usage in Ballwin
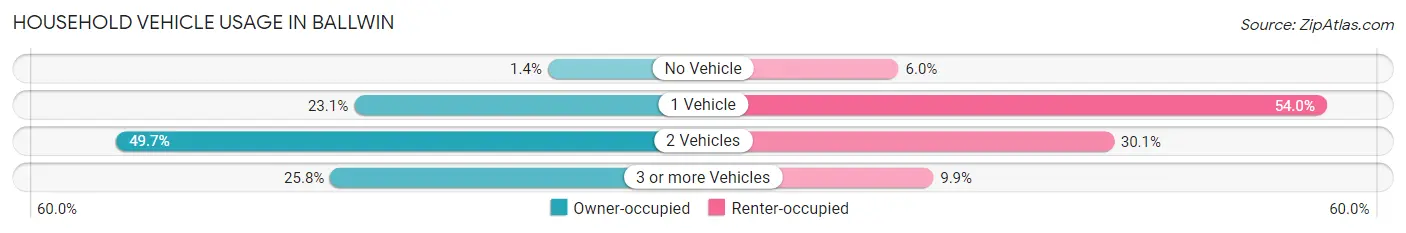
| Vehicles per Household | Owner-occupied | Renter-occupied |
| No Vehicle | 141 (1.4%) | 116 (6.0%) |
| 1 Vehicle | 2,320 (23.1%) | 1,041 (54.0%) |
| 2 Vehicles | 4,995 (49.7%) | 581 (30.1%) |
| 3 or more Vehicles | 2,588 (25.8%) | 191 (9.9%) |
| Total | 10,044 (100.0%) | 1,929 (100.0%) |
Real Estate & Mortgages in Ballwin
Real Estate and Mortgage Overview in Ballwin
| Characteristic | Without Mortgage | With Mortgage |
| Housing Units | 3,143 | 6,901 |
| Median Property Value | $305,400 | $350,700 |
| Median Household Income | $89,441 | $3,453 |
| Monthly Housing Costs | $728 | $713 |
| Real Estate Taxes | $3,951 | $121 |
Property Value by Mortgage Status in Ballwin
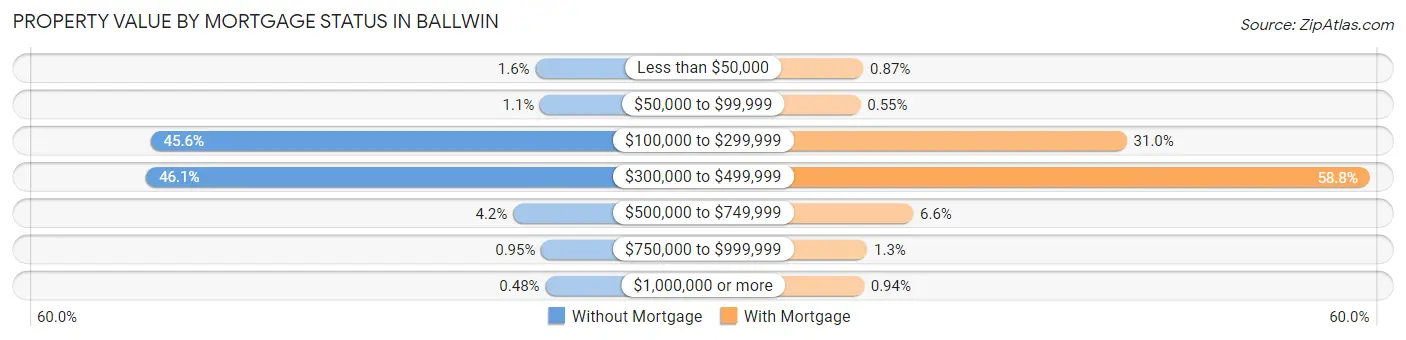
| Property Value | Without Mortgage | With Mortgage |
| Less than $50,000 | 51 (1.6%) | 60 (0.9%) |
| $50,000 to $99,999 | 34 (1.1%) | 38 (0.5%) |
| $100,000 to $299,999 | 1,433 (45.6%) | 2,138 (31.0%) |
| $300,000 to $499,999 | 1,449 (46.1%) | 4,055 (58.8%) |
| $500,000 to $749,999 | 131 (4.2%) | 454 (6.6%) |
| $750,000 to $999,999 | 30 (0.9%) | 91 (1.3%) |
| $1,000,000 or more | 15 (0.5%) | 65 (0.9%) |
| Total | 3,143 (100.0%) | 6,901 (100.0%) |
Household Income by Mortgage Status in Ballwin
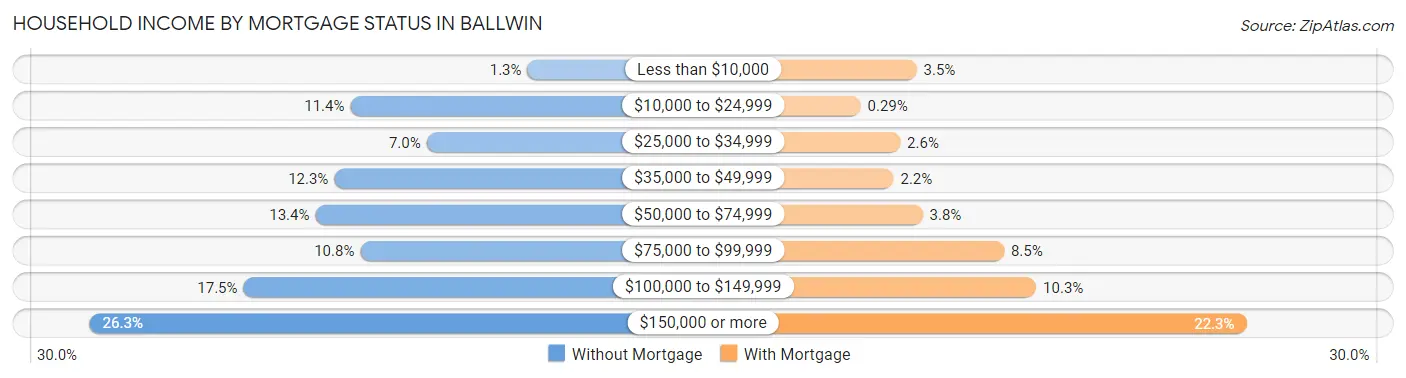
| Household Income | Without Mortgage | With Mortgage |
| Less than $10,000 | 40 (1.3%) | 241 (3.5%) |
| $10,000 to $24,999 | 358 (11.4%) | 20 (0.3%) |
| $25,000 to $34,999 | 221 (7.0%) | 176 (2.5%) |
| $35,000 to $49,999 | 387 (12.3%) | 150 (2.2%) |
| $50,000 to $74,999 | 421 (13.4%) | 264 (3.8%) |
| $75,000 to $99,999 | 340 (10.8%) | 585 (8.5%) |
| $100,000 to $149,999 | 550 (17.5%) | 712 (10.3%) |
| $150,000 or more | 826 (26.3%) | 1,541 (22.3%) |
| Total | 3,143 (100.0%) | 6,901 (100.0%) |
Property Value to Household Income Ratio in Ballwin
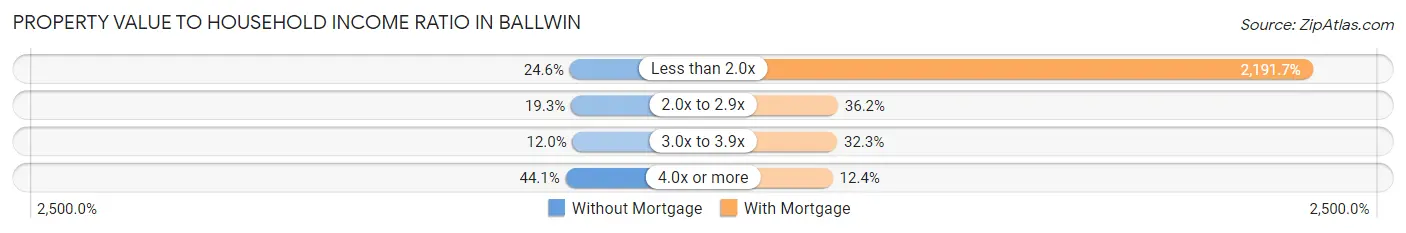
| Value-to-Income Ratio | Without Mortgage | With Mortgage |
| Less than 2.0x | 773 (24.6%) | 151,250 (2,191.7%) |
| 2.0x to 2.9x | 607 (19.3%) | 2,495 (36.1%) |
| 3.0x to 3.9x | 378 (12.0%) | 2,229 (32.3%) |
| 4.0x or more | 1,385 (44.1%) | 857 (12.4%) |
| Total | 3,143 (100.0%) | 6,901 (100.0%) |
Real Estate Taxes by Mortgage Status in Ballwin
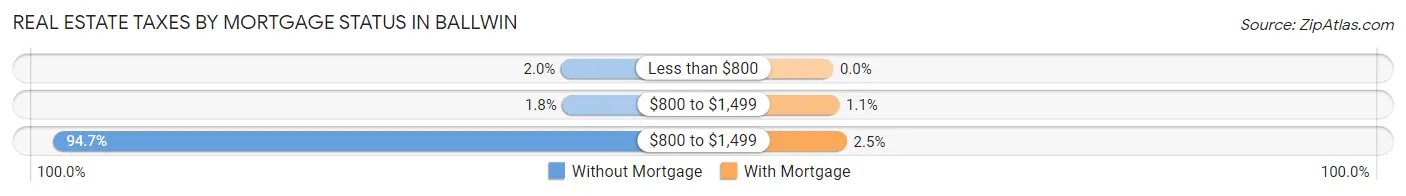
| Property Taxes | Without Mortgage | With Mortgage |
| Less than $800 | 63 (2.0%) | 0 (0.0%) |
| $800 to $1,499 | 55 (1.8%) | 76 (1.1%) |
| $800 to $1,499 | 2,977 (94.7%) | 172 (2.5%) |
| Total | 3,143 (100.0%) | 6,901 (100.0%) |
Health & Disability in Ballwin
Health Insurance Coverage by Age in Ballwin
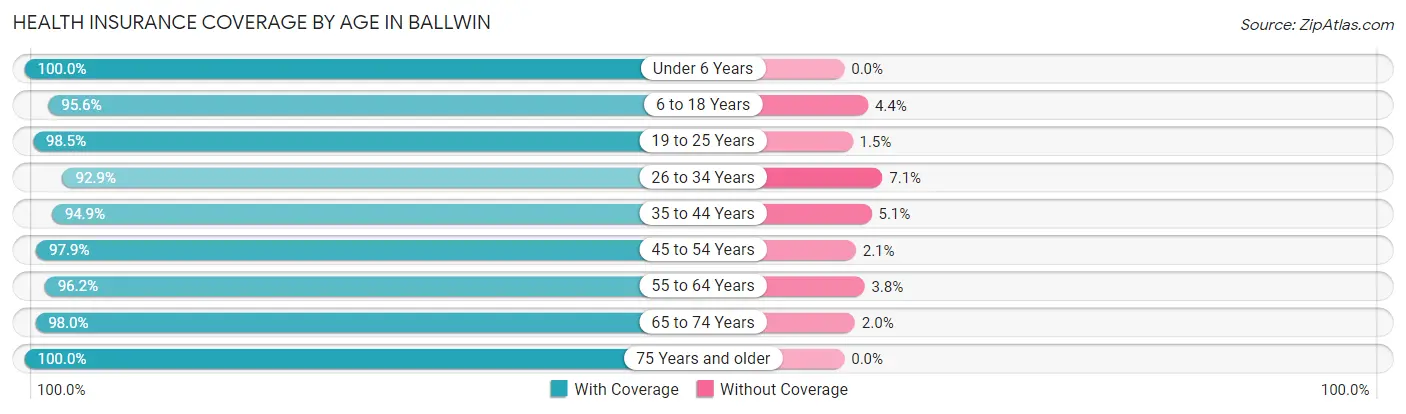
| Age Bracket | With Coverage | Without Coverage |
| Under 6 Years | 2,391 (100.0%) | 0 (0.0%) |
| 6 to 18 Years | 4,607 (95.6%) | 213 (4.4%) |
| 19 to 25 Years | 2,376 (98.5%) | 37 (1.5%) |
| 26 to 34 Years | 3,038 (92.9%) | 232 (7.1%) |
| 35 to 44 Years | 3,528 (94.9%) | 189 (5.1%) |
| 45 to 54 Years | 3,804 (97.9%) | 83 (2.1%) |
| 55 to 64 Years | 4,373 (96.2%) | 171 (3.8%) |
| 65 to 74 Years | 3,471 (98.0%) | 70 (2.0%) |
| 75 Years and older | 2,365 (100.0%) | 0 (0.0%) |
| Total | 29,953 (96.8%) | 995 (3.2%) |
Health Insurance Coverage by Citizenship Status in Ballwin
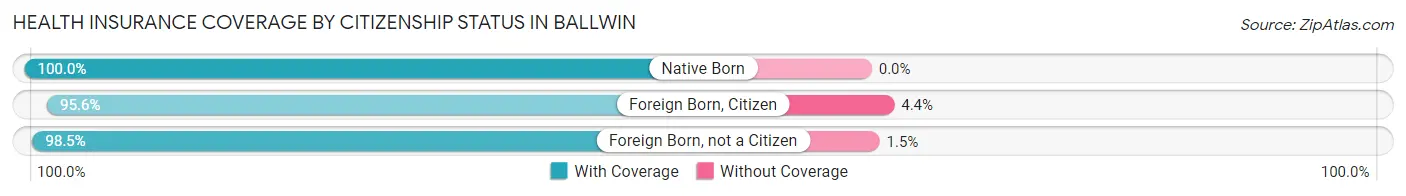
| Citizenship Status | With Coverage | Without Coverage |
| Native Born | 2,391 (100.0%) | 0 (0.0%) |
| Foreign Born, Citizen | 4,607 (95.6%) | 213 (4.4%) |
| Foreign Born, not a Citizen | 2,376 (98.5%) | 37 (1.5%) |
Health Insurance Coverage by Household Income in Ballwin
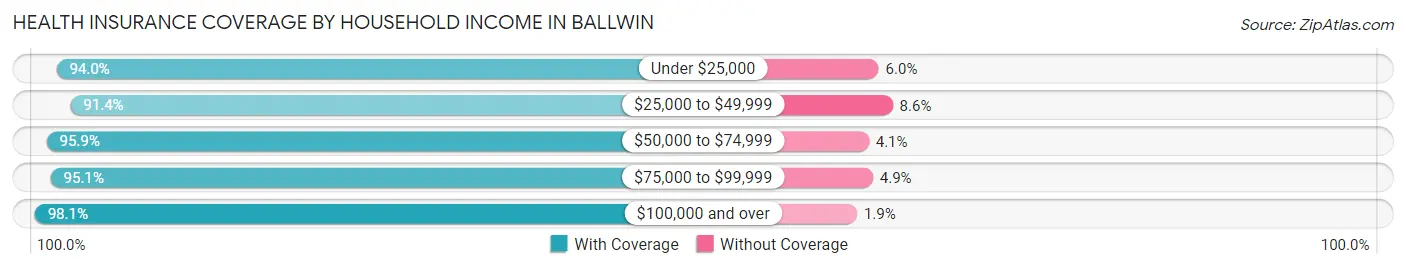
| Household Income | With Coverage | Without Coverage |
| Under $25,000 | 1,733 (94.0%) | 110 (6.0%) |
| $25,000 to $49,999 | 2,300 (91.4%) | 216 (8.6%) |
| $50,000 to $74,999 | 2,814 (95.9%) | 121 (4.1%) |
| $75,000 to $99,999 | 3,097 (95.1%) | 159 (4.9%) |
| $100,000 and over | 20,000 (98.1%) | 389 (1.9%) |
Public vs Private Health Insurance Coverage by Age in Ballwin
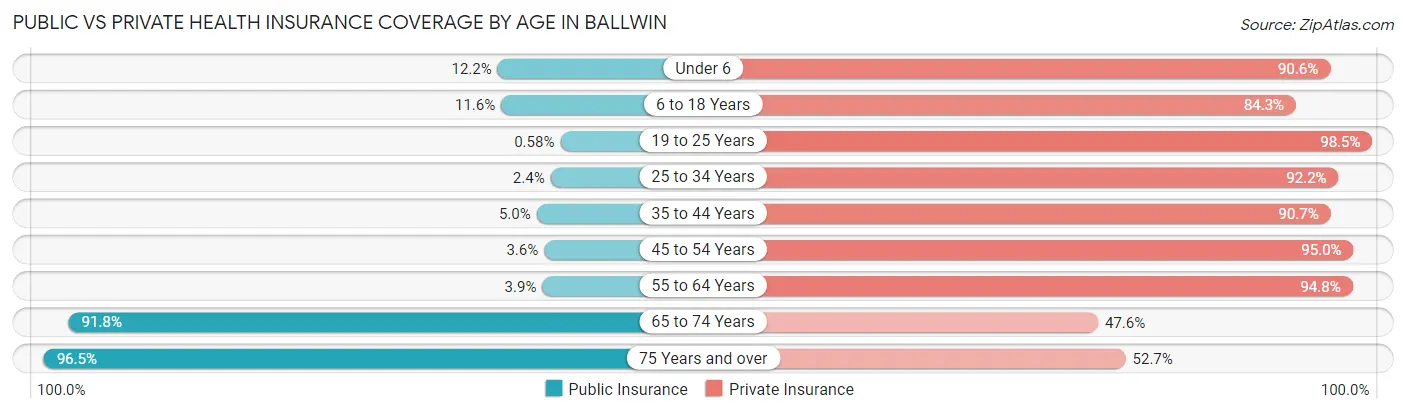
| Age Bracket | Public Insurance | Private Insurance |
| Under 6 | 292 (12.2%) | 2,167 (90.6%) |
| 6 to 18 Years | 557 (11.6%) | 4,063 (84.3%) |
| 19 to 25 Years | 14 (0.6%) | 2,376 (98.5%) |
| 25 to 34 Years | 78 (2.4%) | 3,014 (92.2%) |
| 35 to 44 Years | 185 (5.0%) | 3,372 (90.7%) |
| 45 to 54 Years | 139 (3.6%) | 3,691 (95.0%) |
| 55 to 64 Years | 178 (3.9%) | 4,307 (94.8%) |
| 65 to 74 Years | 3,252 (91.8%) | 1,684 (47.6%) |
| 75 Years and over | 2,281 (96.5%) | 1,246 (52.7%) |
| Total | 6,976 (22.5%) | 25,920 (83.8%) |
Disability Status by Sex by Age in Ballwin
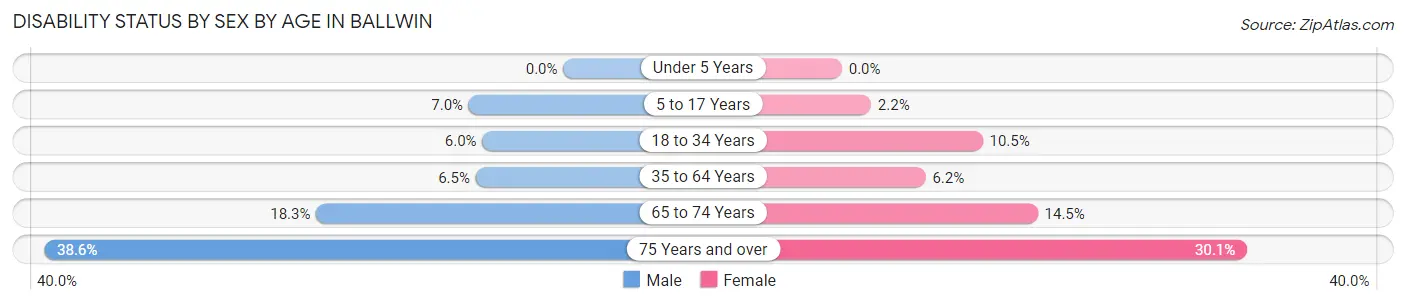
| Age Bracket | Male | Female |
| Under 5 Years | 0 (0.0%) | 0 (0.0%) |
| 5 to 17 Years | 176 (7.0%) | 52 (2.2%) |
| 18 to 34 Years | 180 (6.0%) | 310 (10.4%) |
| 35 to 64 Years | 401 (6.5%) | 371 (6.2%) |
| 65 to 74 Years | 300 (18.3%) | 277 (14.5%) |
| 75 Years and over | 357 (38.6%) | 433 (30.1%) |
Disability Class by Sex by Age in Ballwin
Disability Class: Hearing Difficulty
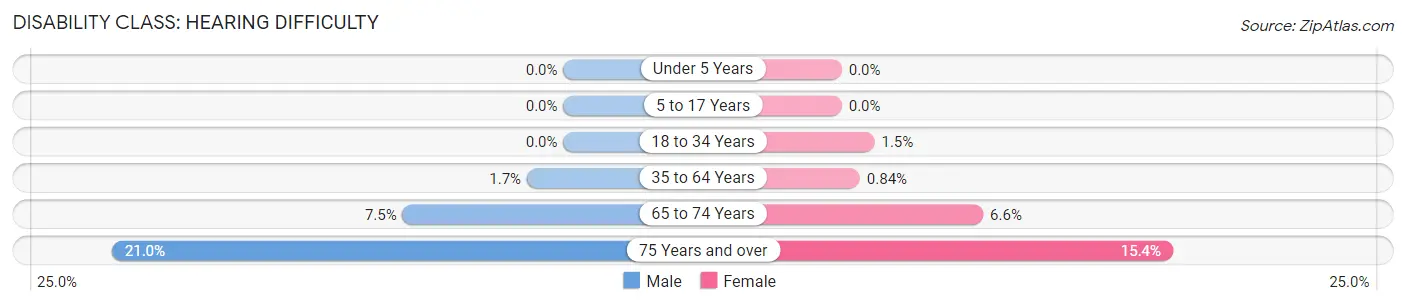
| Age Bracket | Male | Female |
| Under 5 Years | 0 (0.0%) | 0 (0.0%) |
| 5 to 17 Years | 0 (0.0%) | 0 (0.0%) |
| 18 to 34 Years | 0 (0.0%) | 45 (1.5%) |
| 35 to 64 Years | 104 (1.7%) | 50 (0.8%) |
| 65 to 74 Years | 122 (7.5%) | 125 (6.6%) |
| 75 Years and over | 194 (20.9%) | 221 (15.4%) |
Disability Class: Vision Difficulty
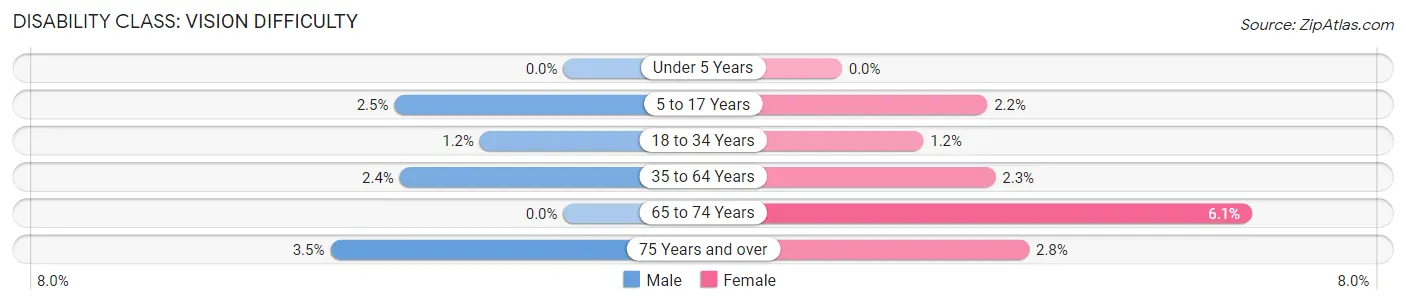
| Age Bracket | Male | Female |
| Under 5 Years | 0 (0.0%) | 0 (0.0%) |
| 5 to 17 Years | 63 (2.5%) | 52 (2.2%) |
| 18 to 34 Years | 37 (1.2%) | 36 (1.2%) |
| 35 to 64 Years | 150 (2.4%) | 136 (2.3%) |
| 65 to 74 Years | 0 (0.0%) | 116 (6.1%) |
| 75 Years and over | 32 (3.5%) | 40 (2.8%) |
Disability Class: Cognitive Difficulty
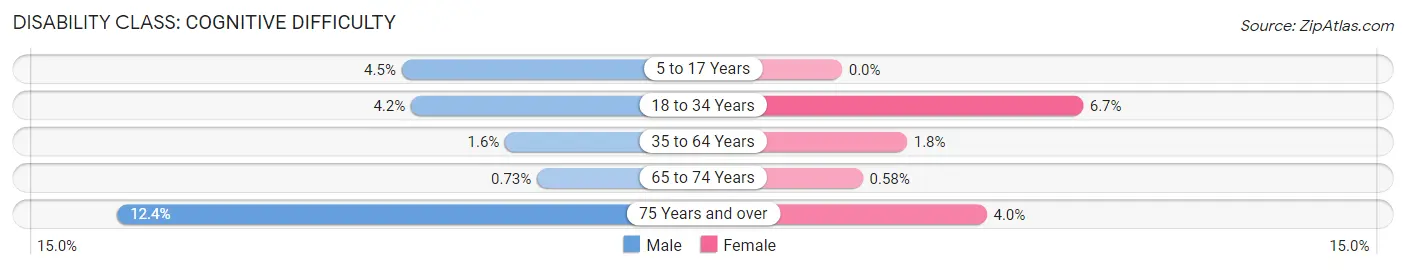
| Age Bracket | Male | Female |
| 5 to 17 Years | 113 (4.5%) | 0 (0.0%) |
| 18 to 34 Years | 127 (4.2%) | 199 (6.7%) |
| 35 to 64 Years | 100 (1.6%) | 108 (1.8%) |
| 65 to 74 Years | 12 (0.7%) | 11 (0.6%) |
| 75 Years and over | 115 (12.4%) | 58 (4.0%) |
Disability Class: Ambulatory Difficulty
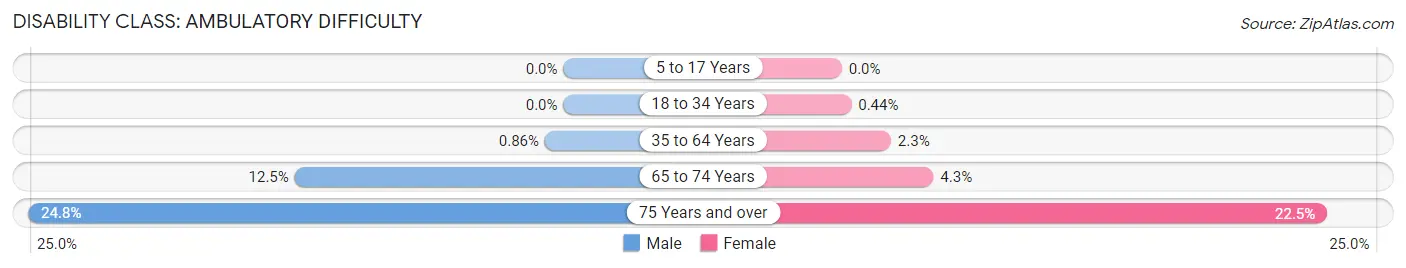
| Age Bracket | Male | Female |
| 5 to 17 Years | 0 (0.0%) | 0 (0.0%) |
| 18 to 34 Years | 0 (0.0%) | 13 (0.4%) |
| 35 to 64 Years | 53 (0.9%) | 136 (2.3%) |
| 65 to 74 Years | 204 (12.5%) | 81 (4.3%) |
| 75 Years and over | 230 (24.8%) | 324 (22.5%) |
Disability Class: Self-Care Difficulty
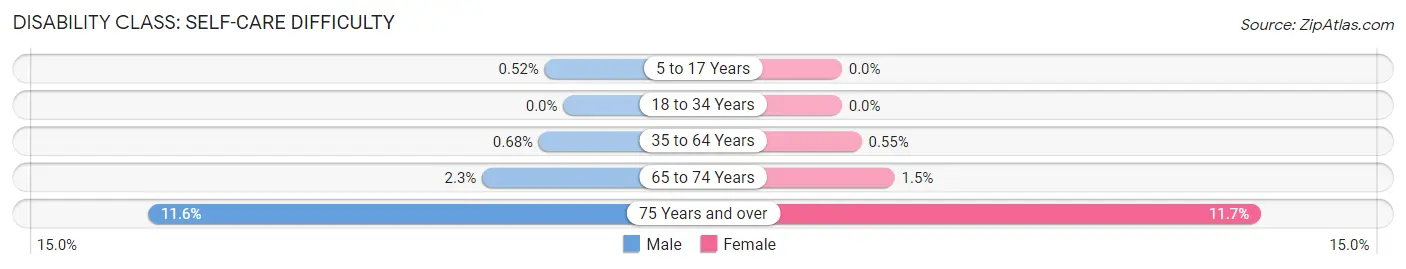
| Age Bracket | Male | Female |
| 5 to 17 Years | 13 (0.5%) | 0 (0.0%) |
| 18 to 34 Years | 0 (0.0%) | 0 (0.0%) |
| 35 to 64 Years | 42 (0.7%) | 33 (0.5%) |
| 65 to 74 Years | 37 (2.3%) | 28 (1.5%) |
| 75 Years and over | 107 (11.6%) | 168 (11.7%) |
Technology Access in Ballwin
Computing Device Access in Ballwin
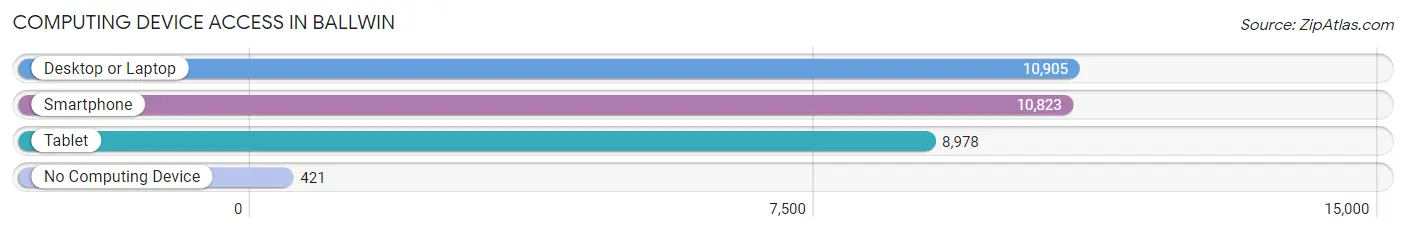
| Device Type | # Households | % Households |
| Desktop or Laptop | 10,905 | 91.1% |
| Smartphone | 10,823 | 90.4% |
| Tablet | 8,978 | 75.0% |
| No Computing Device | 421 | 3.5% |
| Total | 11,973 | 100.0% |
Internet Access in Ballwin
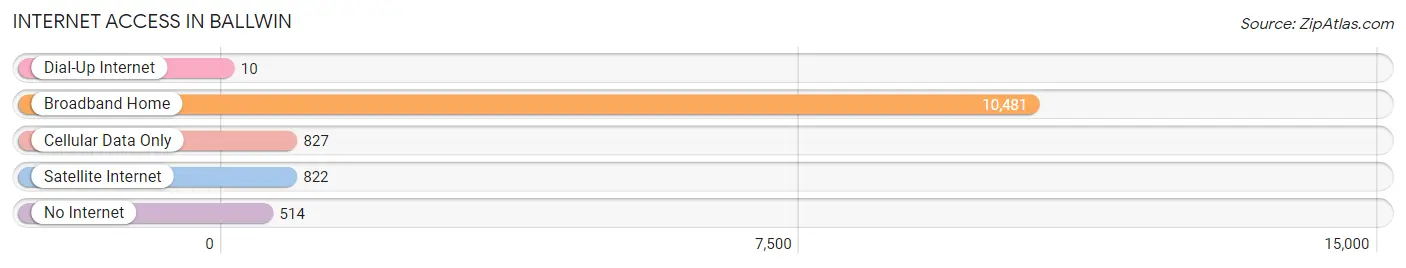
| Internet Type | # Households | % Households |
| Dial-Up Internet | 10 | 0.1% |
| Broadband Home | 10,481 | 87.5% |
| Cellular Data Only | 827 | 6.9% |
| Satellite Internet | 822 | 6.9% |
| No Internet | 514 | 4.3% |
| Total | 11,973 | 100.0% |
Ballwin Summary
History
Ballwin, Missouri is a city located in St. Louis County, Missouri, United States. It is a suburb of St. Louis and is part of the Greater St. Louis metropolitan area. The city was founded in 1837 and incorporated in 1950.
The area that is now Ballwin was originally inhabited by Native Americans, including the Osage and the Missouri tribes. The first European settlers arrived in the area in the early 1800s. The first settler was a man named John Ball, who arrived in 1837 and established a homestead. He named the area Ball’s Prairie, which eventually became Ballwin.
In the late 1800s, the area began to grow and develop. The first post office was established in 1871, and the first school was built in 1876. The city was officially incorporated in 1950.
Geography
Ballwin is located in St. Louis County, Missouri, United States. It is a suburb of St. Louis and is part of the Greater St. Louis metropolitan area. The city is situated on the Meramec River, and is bordered by Ellisville to the north, Manchester to the east, Wildwood to the south, and Ellisville and Chesterfield to the west.
The city has a total area of 8.3 square miles, of which 8.2 square miles is land and 0.1 square miles is water. The city has a humid continental climate, with hot, humid summers and cold, snowy winters.
Economy
Ballwin’s economy is largely based on the service industry. The city is home to a variety of businesses, including restaurants, retail stores, and professional services. The city is also home to several corporate headquarters, including the headquarters of the St. Louis-based company, Express Scripts.
The city is also home to several large employers, including the St. Louis County government, the St. Louis County Police Department, and the St. Louis County Library.
Demographics
As of the 2010 census, the population of Ballwin was 30,404. The racial makeup of the city was 87.3% White, 5.2% African American, 0.3% Native American, 3.2% Asian, 0.1% Pacific Islander, 1.3% from other races, and 2.6% from two or more races. Hispanic or Latino of any race were 4.2% of the population.
The median income for a household in the city was $68,945, and the median income for a family was $77,945. The per capita income for the city was $33,945. About 3.2% of families and 4.3% of the population were below the poverty line, including 5.2% of those under age 18 and 4.2% of those age 65 or over.
Common Questions
What is Per Capita Income in Ballwin?
Per Capita income in Ballwin is $55,277.
What is the Median Family Income in Ballwin?
Median Family Income in Ballwin is $145,252.
What is the Median Household income in Ballwin?
Median Household Income in Ballwin is $118,647.
What is Income or Wage Gap in Ballwin?
Income or Wage Gap in Ballwin is 46.0%.
Women in Ballwin earn 54.0 cents for every dollar earned by a man.
What is Inequality or Gini Index in Ballwin?
Inequality or Gini Index in Ballwin is 0.42.
What is the Total Population of Ballwin?
Total Population of Ballwin is 30,948.
What is the Total Male Population of Ballwin?
Total Male Population of Ballwin is 15,235.
What is the Total Female Population of Ballwin?
Total Female Population of Ballwin is 15,713.
What is the Ratio of Males per 100 Females in Ballwin?
There are 96.96 Males per 100 Females in Ballwin.
What is the Ratio of Females per 100 Males in Ballwin?
There are 103.14 Females per 100 Males in Ballwin.
What is the Median Population Age in Ballwin?
Median Population Age in Ballwin is 42.0 Years.
What is the Average Family Size in Ballwin
Average Family Size in Ballwin is 3.1 People.
What is the Average Household Size in Ballwin
Average Household Size in Ballwin is 2.6 People.
How Large is the Labor Force in Ballwin?
There are 16,480 People in the Labor Forcein in Ballwin.
What is the Percentage of People in the Labor Force in Ballwin?
66.3% of People are in the Labor Force in Ballwin.
What is the Unemployment Rate in Ballwin?
Unemployment Rate in Ballwin is 2.2%.