Belton, MO Map & Demographics
Belton Map
Belton Overview
$33,830
PER CAPITA INCOME
$79,387
AVG FAMILY INCOME
$68,030
AVG HOUSEHOLD INCOME
30.6%
WAGE / INCOME GAP [ % ]
69.4¢/ $1
WAGE / INCOME GAP [ $ ]
$11,154
FAMILY INCOME DEFICIT
0.39
INEQUALITY / GINI INDEX
24,241
TOTAL POPULATION
11,319
MALE POPULATION
12,922
FEMALE POPULATION
87.59
MALES / 100 FEMALES
114.16
FEMALES / 100 MALES
35.7
MEDIAN AGE
2.9
AVG FAMILY SIZE
2.5
AVG HOUSEHOLD SIZE
12,993
LABOR FORCE [ PEOPLE ]
69.2%
PERCENT IN LABOR FORCE
5.4%
UNEMPLOYMENT RATE
Belton Zip Codes
Belton Area Codes
Income in Belton
Income Overview in Belton
Per Capita Income in Belton is $33,830, while median incomes of families and households are $79,387 and $68,030 respectively.
| Characteristic | Number | Measure |
| Per Capita Income | 24,241 | $33,830 |
| Median Family Income | 6,733 | $79,387 |
| Mean Family Income | 6,733 | $92,295 |
| Median Household Income | 9,659 | $68,030 |
| Mean Household Income | 9,659 | $83,259 |
| Income Deficit | 6,733 | $11,154 |
| Wage / Income Gap (%) | 24,241 | 30.65% |
| Wage / Income Gap ($) | 24,241 | 69.35¢ per $1 |
| Gini / Inequality Index | 24,241 | 0.39 |
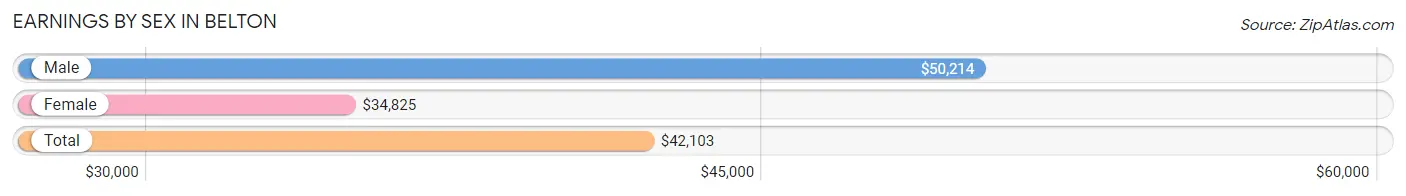
Earnings by Sex in Belton
Average Earnings in Belton are $42,103, $50,214 for men and $34,825 for women, a difference of 30.6%.
| Sex | Number | Average Earnings |
| Male | 6,768 (49.4%) | $50,214 |
| Female | 6,938 (50.6%) | $34,825 |
| Total | 13,706 (100.0%) | $42,103 |
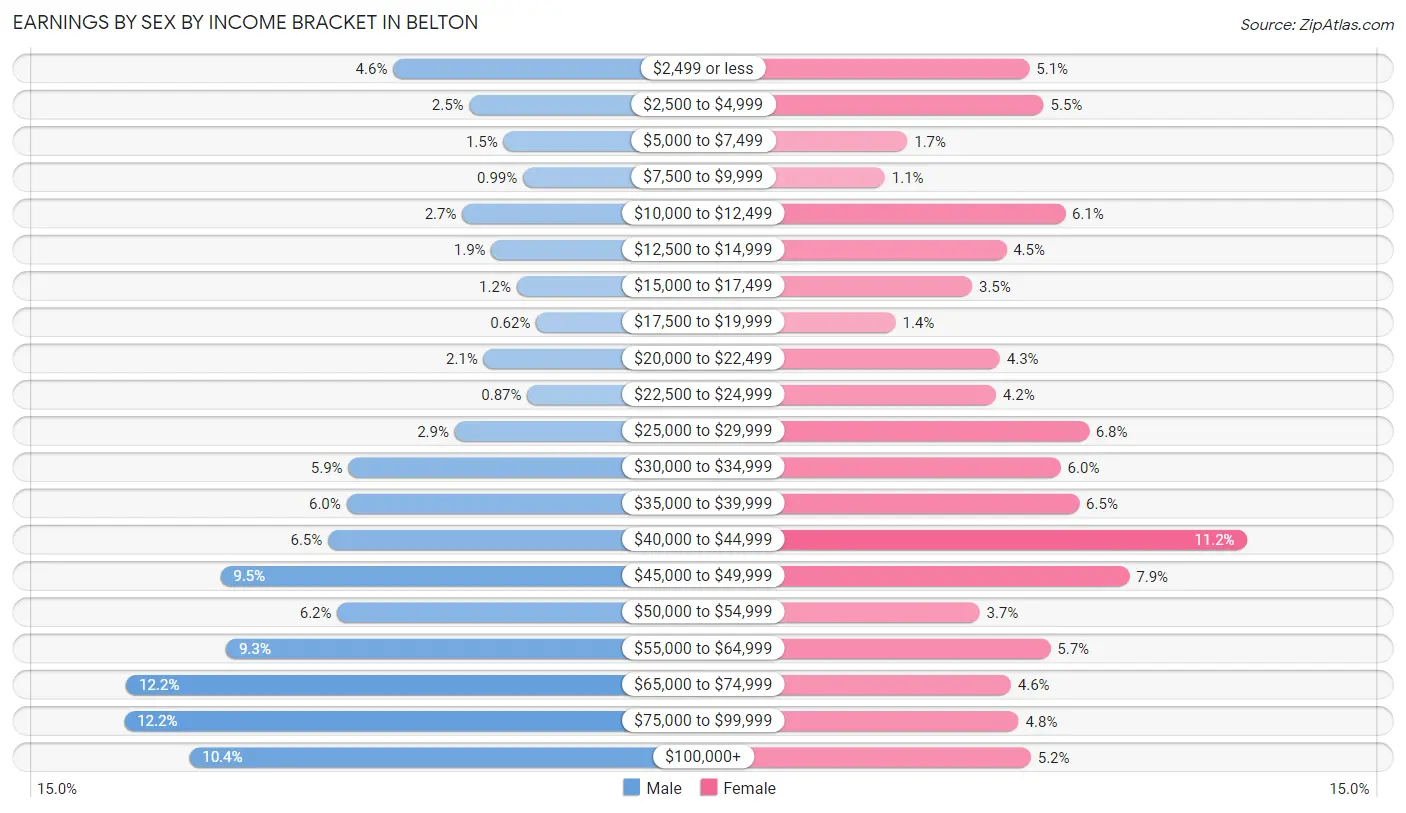
Earnings by Sex by Income Bracket in Belton
The most common earnings brackets in Belton are $75,000 to $99,999 for men (826 | 12.2%) and $40,000 to $44,999 for women (779 | 11.2%).
| Income | Male | Female |
| $2,499 or less | 314 (4.6%) | 356 (5.1%) |
| $2,500 to $4,999 | 169 (2.5%) | 384 (5.5%) |
| $5,000 to $7,499 | 104 (1.5%) | 118 (1.7%) |
| $7,500 to $9,999 | 67 (1.0%) | 74 (1.1%) |
| $10,000 to $12,499 | 183 (2.7%) | 425 (6.1%) |
| $12,500 to $14,999 | 127 (1.9%) | 311 (4.5%) |
| $15,000 to $17,499 | 79 (1.2%) | 244 (3.5%) |
| $17,500 to $19,999 | 42 (0.6%) | 95 (1.4%) |
| $20,000 to $22,499 | 142 (2.1%) | 298 (4.3%) |
| $22,500 to $24,999 | 59 (0.9%) | 291 (4.2%) |
| $25,000 to $29,999 | 197 (2.9%) | 472 (6.8%) |
| $30,000 to $34,999 | 399 (5.9%) | 417 (6.0%) |
| $35,000 to $39,999 | 403 (5.9%) | 453 (6.5%) |
| $40,000 to $44,999 | 438 (6.5%) | 779 (11.2%) |
| $45,000 to $49,999 | 643 (9.5%) | 551 (7.9%) |
| $50,000 to $54,999 | 420 (6.2%) | 259 (3.7%) |
| $55,000 to $64,999 | 632 (9.3%) | 397 (5.7%) |
| $65,000 to $74,999 | 822 (12.1%) | 320 (4.6%) |
| $75,000 to $99,999 | 826 (12.2%) | 335 (4.8%) |
| $100,000+ | 702 (10.4%) | 359 (5.2%) |
| Total | 6,768 (100.0%) | 6,938 (100.0%) |
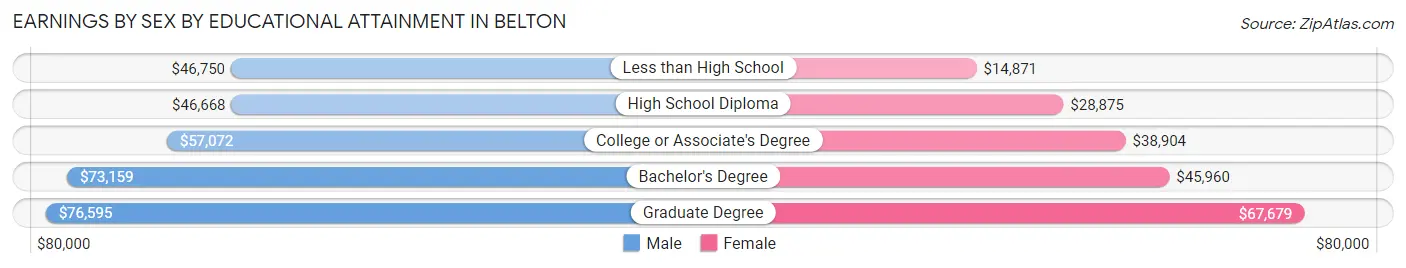
Earnings by Sex by Educational Attainment in Belton
Average earnings in Belton are $55,771 for men and $40,199 for women, a difference of 27.9%. Men with an educational attainment of graduate degree enjoy the highest average annual earnings of $76,595, while those with high school diploma education earn the least with $46,668. Women with an educational attainment of graduate degree earn the most with the average annual earnings of $67,679, while those with less than high school education have the smallest earnings of $14,871.
| Educational Attainment | Male Income | Female Income |
| Less than High School | $46,750 | $14,871 |
| High School Diploma | $46,668 | $28,875 |
| College or Associate's Degree | $57,072 | $38,904 |
| Bachelor's Degree | $73,159 | $45,960 |
| Graduate Degree | $76,595 | $67,679 |
| Total | $55,771 | $40,199 |
Family Income in Belton
Family Income Brackets in Belton
According to the Belton family income data, there are 1,629 families falling into the $100,000 to $149,999 income range, which is the most common income bracket and makes up 24.2% of all families. Conversely, the $10,000 to $14,999 income bracket is the least frequent group with only 135 families (2.0%) belonging to this category.
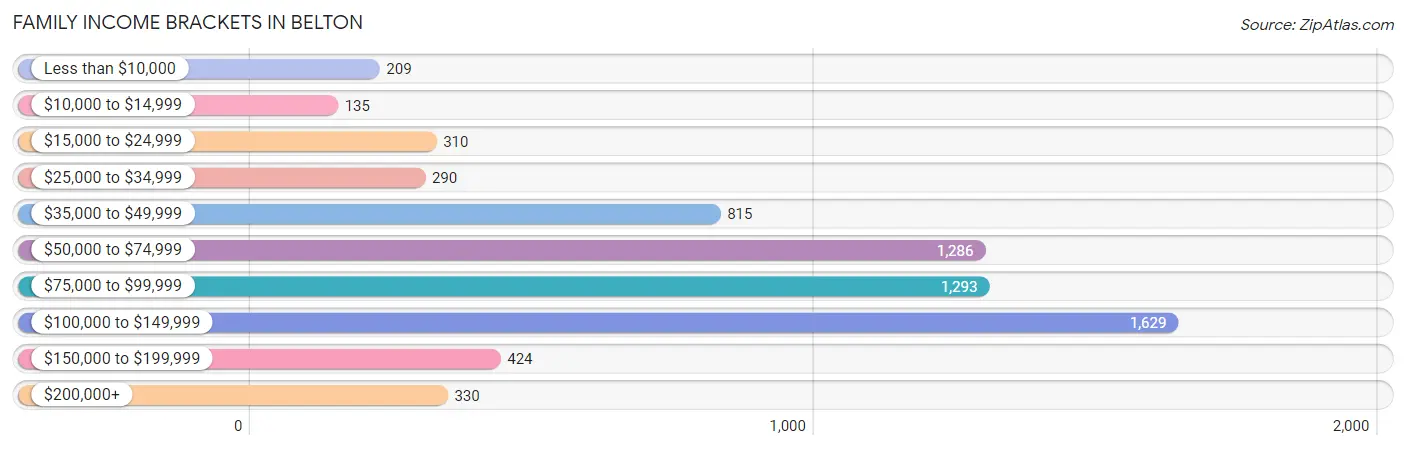
| Income Bracket | # Families | % Families |
| Less than $10,000 | 209 | 3.1% |
| $10,000 to $14,999 | 135 | 2.0% |
| $15,000 to $24,999 | 310 | 4.6% |
| $25,000 to $34,999 | 290 | 4.3% |
| $35,000 to $49,999 | 815 | 12.1% |
| $50,000 to $74,999 | 1,286 | 19.1% |
| $75,000 to $99,999 | 1,293 | 19.2% |
| $100,000 to $149,999 | 1,629 | 24.2% |
| $150,000 to $199,999 | 424 | 6.3% |
| $200,000+ | 330 | 4.9% |
Family Income by Famaliy Size in Belton
5-person families (821 | 12.2%) account for the highest median family income in Belton with $100,225 per family, while 2-person families (3,500 | 52.0%) have the highest median income of $36,000 per family member.
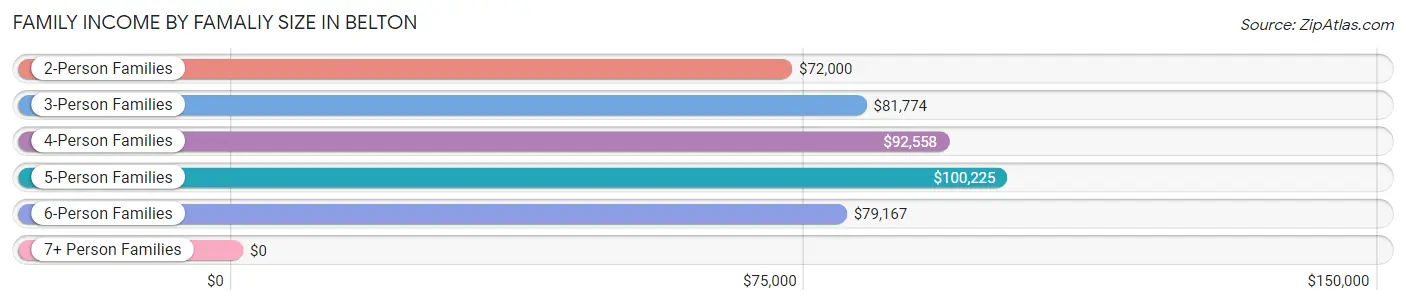
| Income Bracket | # Families | Median Income |
| 2-Person Families | 3,500 (52.0%) | $72,000 |
| 3-Person Families | 1,438 (21.4%) | $81,774 |
| 4-Person Families | 852 (12.7%) | $92,558 |
| 5-Person Families | 821 (12.2%) | $100,225 |
| 6-Person Families | 114 (1.7%) | $79,167 |
| 7+ Person Families | 8 (0.1%) | $0 |
| Total | 6,733 (100.0%) | $79,387 |
Family Income by Number of Earners in Belton
The median family income in Belton is $79,387, with families comprising 3+ earners (794) having the highest median family income of $124,035, while families with no earners (770) have the lowest median family income of $46,500, accounting for 11.8% and 11.4% of families, respectively.
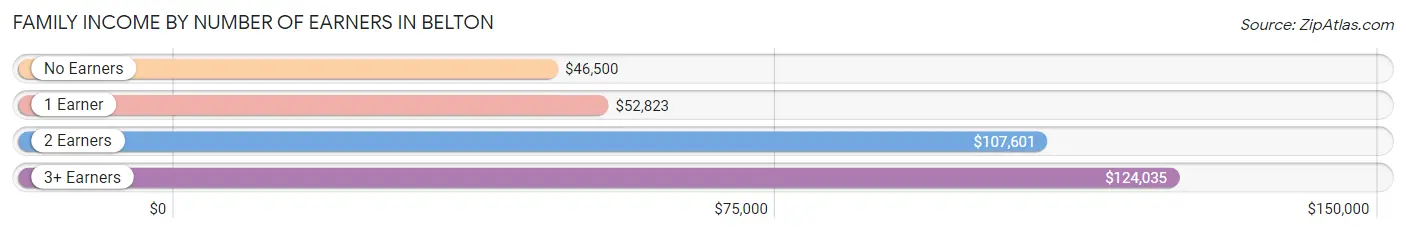
| Number of Earners | # Families | Median Income |
| No Earners | 770 (11.4%) | $46,500 |
| 1 Earner | 2,424 (36.0%) | $52,823 |
| 2 Earners | 2,745 (40.8%) | $107,601 |
| 3+ Earners | 794 (11.8%) | $124,035 |
| Total | 6,733 (100.0%) | $79,387 |
Household Income in Belton
Household Income Brackets in Belton
With 2,057 households falling in the category, the $50,000 to $74,999 income range is the most frequent in Belton, accounting for 21.3% of all households. In contrast, only 193 households (2.0%) fall into the $10,000 to $14,999 income bracket, making it the least populous group.
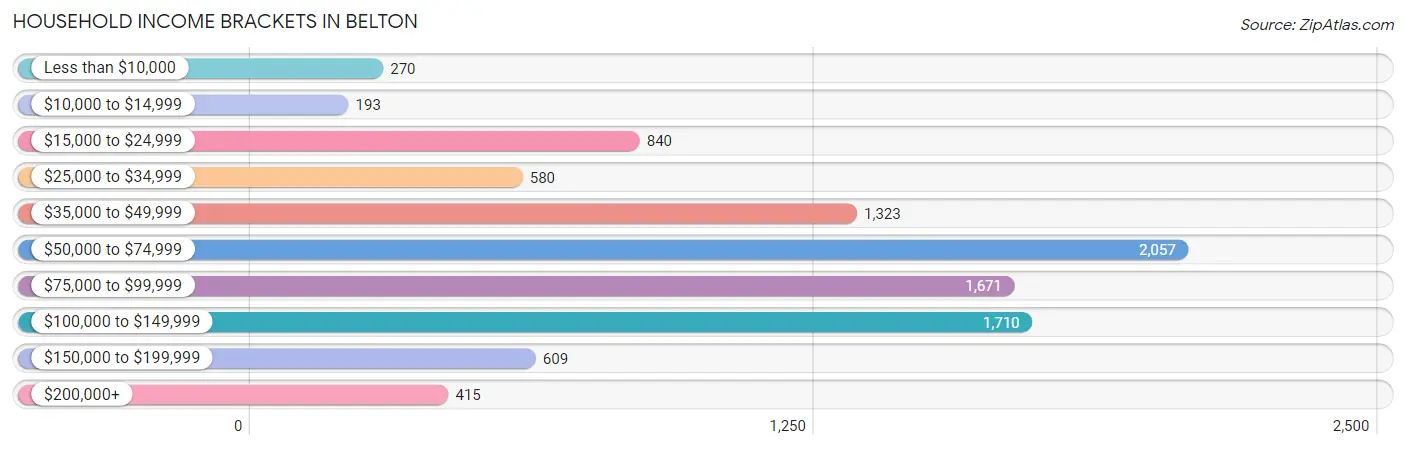
| Income Bracket | # Households | % Households |
| Less than $10,000 | 270 | 2.8% |
| $10,000 to $14,999 | 193 | 2.0% |
| $15,000 to $24,999 | 840 | 8.7% |
| $25,000 to $34,999 | 580 | 6.0% |
| $35,000 to $49,999 | 1,323 | 13.7% |
| $50,000 to $74,999 | 2,057 | 21.3% |
| $75,000 to $99,999 | 1,671 | 17.3% |
| $100,000 to $149,999 | 1,710 | 17.7% |
| $150,000 to $199,999 | 609 | 6.3% |
| $200,000+ | 415 | 4.3% |
Household Income by Householder Age in Belton
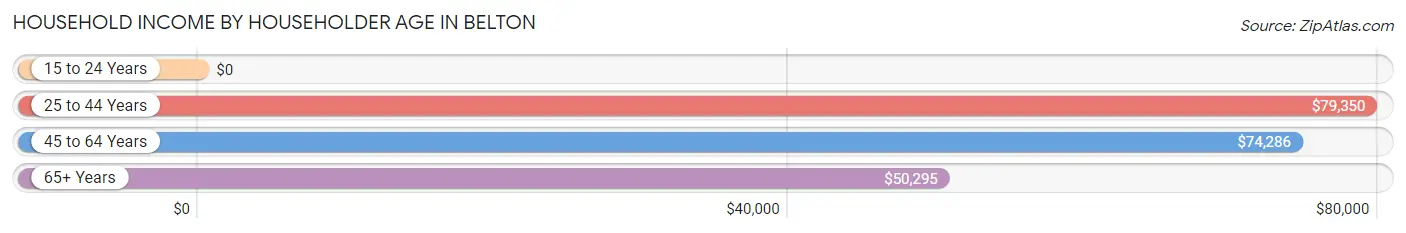
The median household income in Belton is $68,030, with the highest median household income of $79,350 found in the 25 to 44 years age bracket for the primary householder. A total of 3,482 households (36.0%) fall into this category. Meanwhile, the 15 to 24 years age bracket for the primary householder has the lowest median household income of $0, with 411 households (4.3%) in this group.
| Income Bracket | # Households | Median Income |
| 15 to 24 Years | 411 (4.3%) | $0 |
| 25 to 44 Years | 3,482 (36.0%) | $79,350 |
| 45 to 64 Years | 3,480 (36.0%) | $74,286 |
| 65+ Years | 2,286 (23.7%) | $50,295 |
| Total | 9,659 (100.0%) | $68,030 |
Poverty in Belton
Income Below Poverty by Sex and Age in Belton
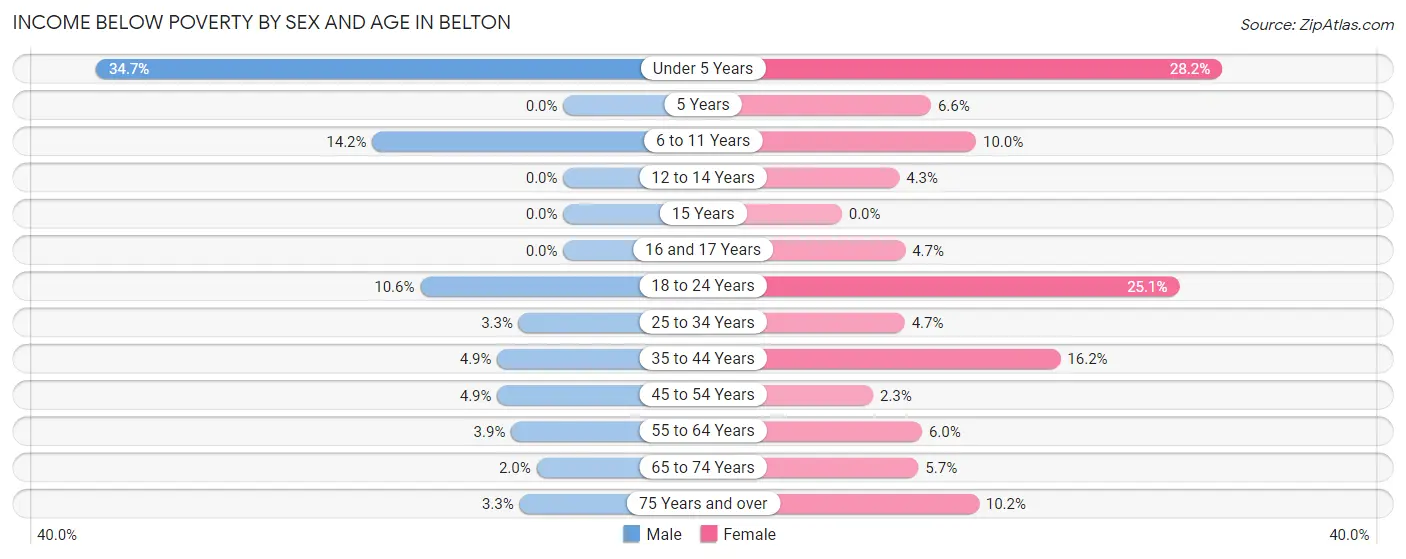
With 7.6% poverty level for males and 10.0% for females among the residents of Belton, under 5 year old males and under 5 year old females are the most vulnerable to poverty, with 331 males (34.7%) and 249 females (28.2%) in their respective age groups living below the poverty level.
| Age Bracket | Male | Female |
| Under 5 Years | 331 (34.7%) | 249 (28.2%) |
| 5 Years | 0 (0.0%) | 10 (6.6%) |
| 6 to 11 Years | 129 (14.2%) | 111 (10.0%) |
| 12 to 14 Years | 0 (0.0%) | 24 (4.3%) |
| 15 Years | 0 (0.0%) | 0 (0.0%) |
| 16 and 17 Years | 0 (0.0%) | 16 (4.7%) |
| 18 to 24 Years | 111 (10.6%) | 249 (25.1%) |
| 25 to 34 Years | 60 (3.3%) | 89 (4.7%) |
| 35 to 44 Years | 82 (4.9%) | 244 (16.2%) |
| 45 to 54 Years | 63 (4.9%) | 33 (2.3%) |
| 55 to 64 Years | 47 (3.9%) | 112 (5.9%) |
| 65 to 74 Years | 18 (2.0%) | 68 (5.7%) |
| 75 Years and over | 16 (3.3%) | 73 (10.2%) |
| Total | 857 (7.6%) | 1,278 (10.0%) |
Income Above Poverty by Sex and Age in Belton
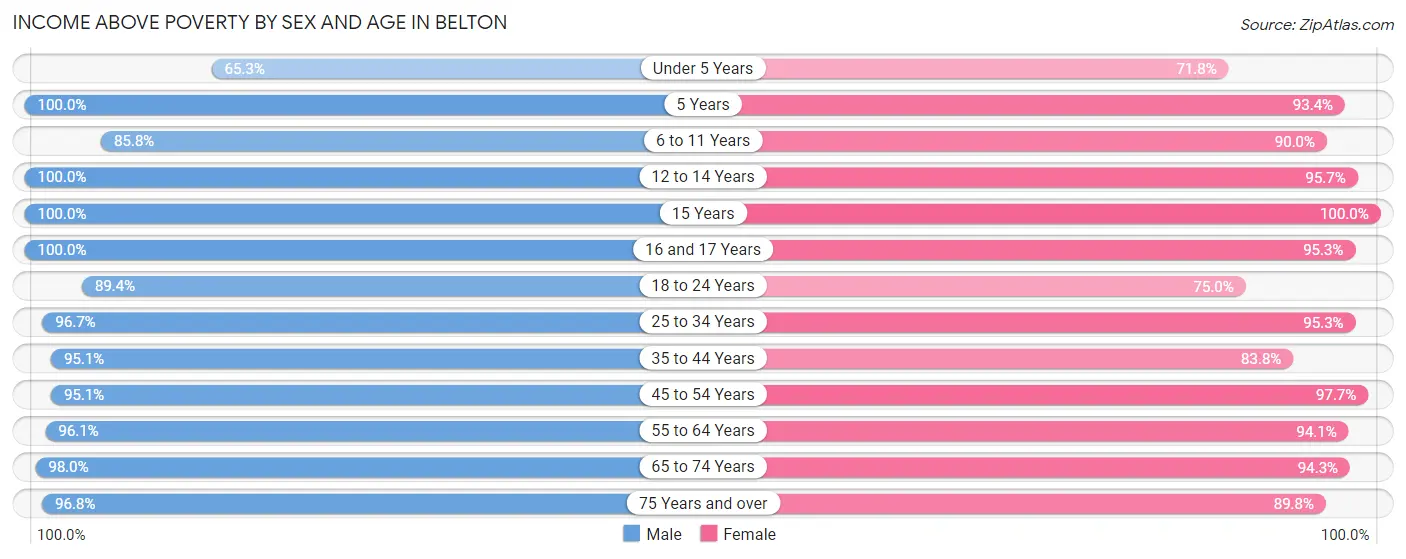
According to the poverty statistics in Belton, males aged 5 years and females aged 15 years are the age groups that are most secure financially, with 100.0% of males and 100.0% of females in these age groups living above the poverty line.
| Age Bracket | Male | Female |
| Under 5 Years | 623 (65.3%) | 633 (71.8%) |
| 5 Years | 56 (100.0%) | 141 (93.4%) |
| 6 to 11 Years | 781 (85.8%) | 1,002 (90.0%) |
| 12 to 14 Years | 442 (100.0%) | 538 (95.7%) |
| 15 Years | 191 (100.0%) | 81 (100.0%) |
| 16 and 17 Years | 253 (100.0%) | 324 (95.3%) |
| 18 to 24 Years | 934 (89.4%) | 745 (75.0%) |
| 25 to 34 Years | 1,752 (96.7%) | 1,817 (95.3%) |
| 35 to 44 Years | 1,593 (95.1%) | 1,259 (83.8%) |
| 45 to 54 Years | 1,223 (95.1%) | 1,391 (97.7%) |
| 55 to 64 Years | 1,169 (96.1%) | 1,771 (94.1%) |
| 65 to 74 Years | 887 (98.0%) | 1,128 (94.3%) |
| 75 Years and over | 476 (96.8%) | 645 (89.8%) |
| Total | 10,380 (92.4%) | 11,475 (90.0%) |
Income Below Poverty Among Married-Couple Families in Belton
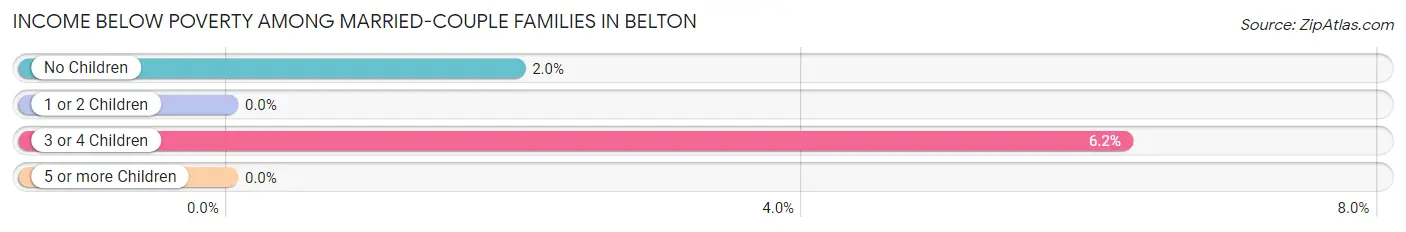
The poverty statistics for married-couple families in Belton show that 1.9% or 90 of the total 4,606 families live below the poverty line. Families with 3 or 4 children have the highest poverty rate of 6.2%, comprising of 33 families. On the other hand, families with 1 or 2 children have the lowest poverty rate of 0.0%, which includes 0 families.
| Children | Above Poverty | Below Poverty |
| No Children | 2,798 (98.0%) | 57 (2.0%) |
| 1 or 2 Children | 1,221 (100.0%) | 0 (0.0%) |
| 3 or 4 Children | 497 (93.8%) | 33 (6.2%) |
| 5 or more Children | 0 (0.0%) | 0 (0.0%) |
| Total | 4,516 (98.1%) | 90 (1.9%) |
Income Below Poverty Among Single-Parent Households in Belton
According to the poverty data in Belton, 11.7% or 72 single-father households and 24.9% or 377 single-mother households are living below the poverty line. Among single-father households, those with 1 or 2 children have the highest poverty rate, with 67 households (17.1%) experiencing poverty. Likewise, among single-mother households, those with 1 or 2 children have the highest poverty rate, with 360 households (42.0%) falling below the poverty line.
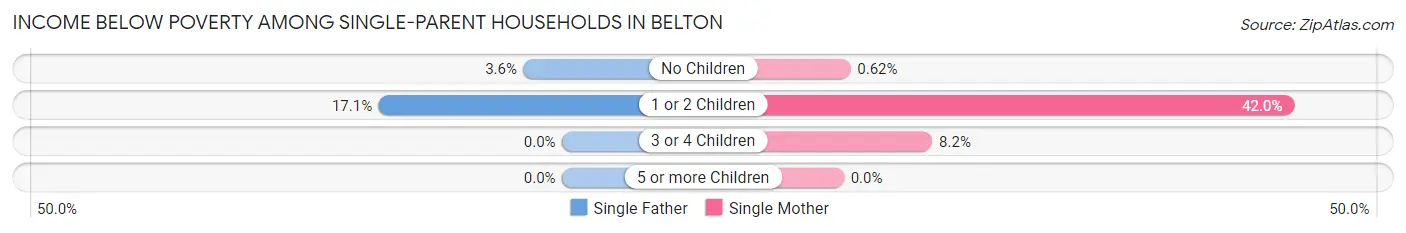
| Children | Single Father | Single Mother |
| No Children | 5 (3.6%) | 3 (0.6%) |
| 1 or 2 Children | 67 (17.1%) | 360 (42.0%) |
| 3 or 4 Children | 0 (0.0%) | 14 (8.2%) |
| 5 or more Children | 0 (0.0%) | 0 (0.0%) |
| Total | 72 (11.7%) | 377 (24.9%) |
Income Below Poverty Among Married-Couple vs Single-Parent Households in Belton
The poverty data for Belton shows that 90 of the married-couple family households (1.9%) and 449 of the single-parent households (21.1%) are living below the poverty level. Within the married-couple family households, those with 3 or 4 children have the highest poverty rate, with 33 households (6.2%) falling below the poverty line. Among the single-parent households, those with 1 or 2 children have the highest poverty rate, with 427 household (34.2%) living below poverty.
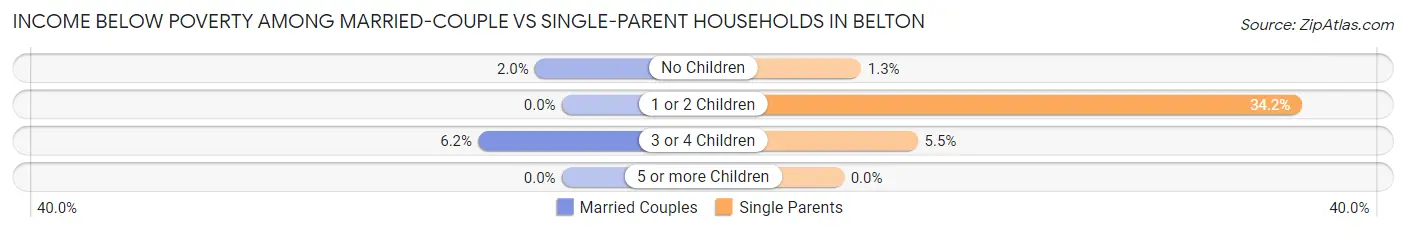
| Children | Married-Couple Families | Single-Parent Households |
| No Children | 57 (2.0%) | 8 (1.3%) |
| 1 or 2 Children | 0 (0.0%) | 427 (34.2%) |
| 3 or 4 Children | 33 (6.2%) | 14 (5.5%) |
| 5 or more Children | 0 (0.0%) | 0 (0.0%) |
| Total | 90 (1.9%) | 449 (21.1%) |
Race in Belton
The most populous races in Belton are White / Caucasian (19,867 | 82.0%), Hispanic or Latino (1,957 | 8.1%), and Two or more Races (1,865 | 7.7%).
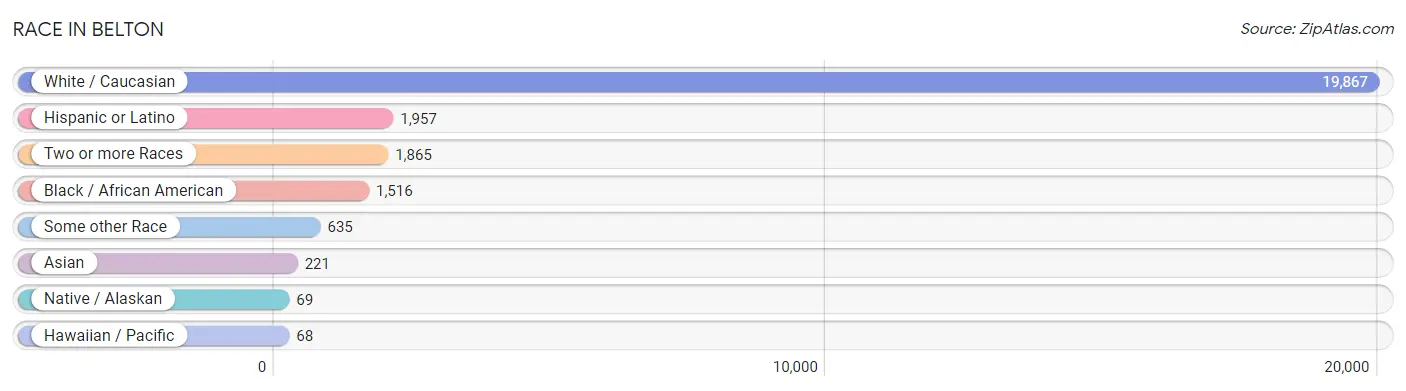
| Race | # Population | % Population |
| Asian | 221 | 0.9% |
| Black / African American | 1,516 | 6.2% |
| Hawaiian / Pacific | 68 | 0.3% |
| Hispanic or Latino | 1,957 | 8.1% |
| Native / Alaskan | 69 | 0.3% |
| White / Caucasian | 19,867 | 82.0% |
| Two or more Races | 1,865 | 7.7% |
| Some other Race | 635 | 2.6% |
| Total | 24,241 | 100.0% |
Ancestry in Belton
The most populous ancestries reported in Belton are German (4,901 | 20.2%), English (3,742 | 15.4%), Irish (3,583 | 14.8%), Mexican (1,447 | 6.0%), and American (1,066 | 4.4%), together accounting for 60.8% of all Belton residents.
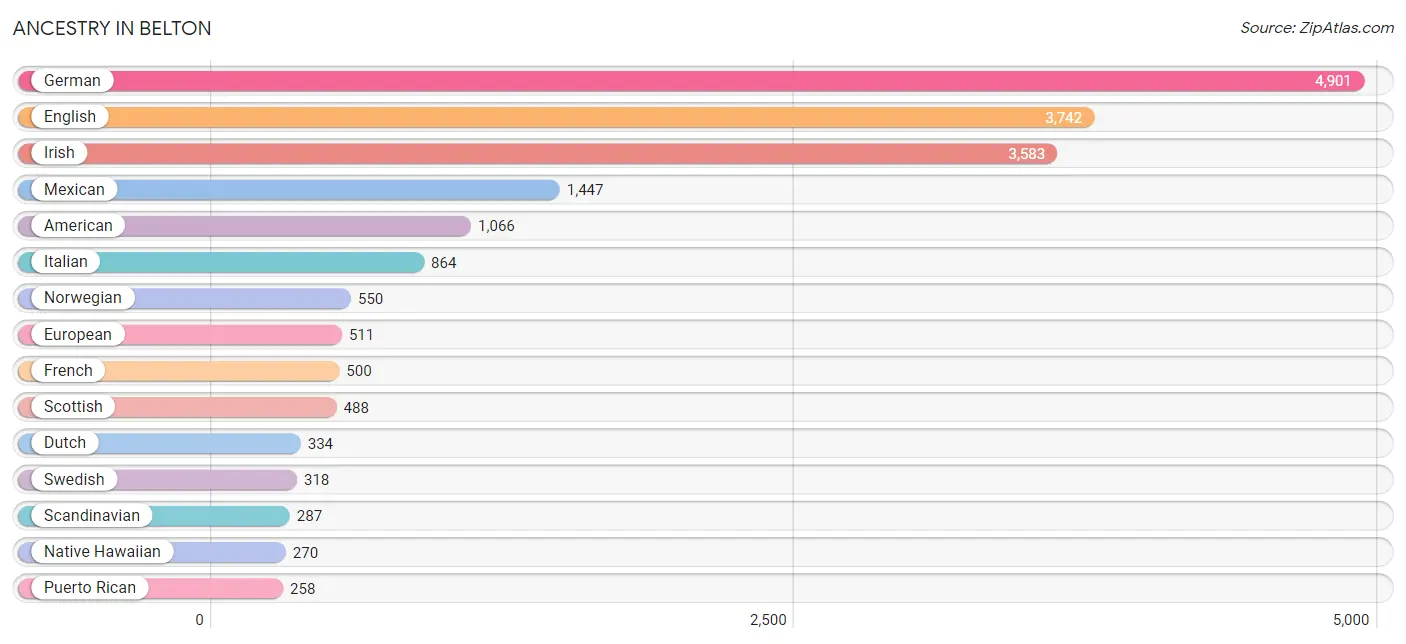
| Ancestry | # Population | % Population |
| African | 75 | 0.3% |
| American | 1,066 | 4.4% |
| Apache | 3 | 0.0% |
| Arab | 17 | 0.1% |
| Austrian | 52 | 0.2% |
| Belgian | 62 | 0.3% |
| Bhutanese | 79 | 0.3% |
| Blackfeet | 49 | 0.2% |
| British | 155 | 0.6% |
| Burmese | 36 | 0.2% |
| Canadian | 16 | 0.1% |
| Central American | 31 | 0.1% |
| Cherokee | 169 | 0.7% |
| Cheyenne | 29 | 0.1% |
| Choctaw | 3 | 0.0% |
| Colombian | 24 | 0.1% |
| Creek | 8 | 0.0% |
| Croatian | 6 | 0.0% |
| Czech | 129 | 0.5% |
| Czechoslovakian | 12 | 0.1% |
| Danish | 75 | 0.3% |
| Dutch | 334 | 1.4% |
| Eastern European | 6 | 0.0% |
| English | 3,742 | 15.4% |
| European | 511 | 2.1% |
| French | 500 | 2.1% |
| French Canadian | 41 | 0.2% |
| German | 4,901 | 20.2% |
| Greek | 79 | 0.3% |
| Guamanian / Chamorro | 35 | 0.1% |
| Guatemalan | 7 | 0.0% |
| Haitian | 79 | 0.3% |
| Honduran | 11 | 0.1% |
| Hungarian | 67 | 0.3% |
| Icelander | 13 | 0.1% |
| Irish | 3,583 | 14.8% |
| Italian | 864 | 3.6% |
| Japanese | 9 | 0.0% |
| Korean | 10 | 0.0% |
| Laotian | 12 | 0.1% |
| Luxembourger | 9 | 0.0% |
| Mexican | 1,447 | 6.0% |
| Native Hawaiian | 270 | 1.1% |
| Nicaraguan | 13 | 0.1% |
| Northern European | 9 | 0.0% |
| Norwegian | 550 | 2.3% |
| Polish | 79 | 0.3% |
| Puerto Rican | 258 | 1.1% |
| Romanian | 24 | 0.1% |
| Russian | 85 | 0.4% |
| Samoan | 33 | 0.1% |
| Scandinavian | 287 | 1.2% |
| Scotch-Irish | 116 | 0.5% |
| Scottish | 488 | 2.0% |
| Senegalese | 8 | 0.0% |
| Sioux | 12 | 0.1% |
| Slovene | 12 | 0.1% |
| South American | 24 | 0.1% |
| Spaniard | 65 | 0.3% |
| Spanish | 32 | 0.1% |
| Sri Lankan | 10 | 0.0% |
| Subsaharan African | 83 | 0.3% |
| Swedish | 318 | 1.3% |
| Swiss | 28 | 0.1% |
| Syrian | 9 | 0.0% |
| Thai | 93 | 0.4% |
| Tongan | 19 | 0.1% |
| Welsh | 221 | 0.9% |
| Yugoslavian | 10 | 0.0% | View All 69 Rows |
Immigrants in Belton
The most numerous immigrant groups reported in Belton came from Latin America (104 | 0.4%), Central America (86 | 0.4%), Asia (81 | 0.3%), Mexico (55 | 0.2%), and South Central Asia (38 | 0.2%), together accounting for 1.5% of all Belton residents.
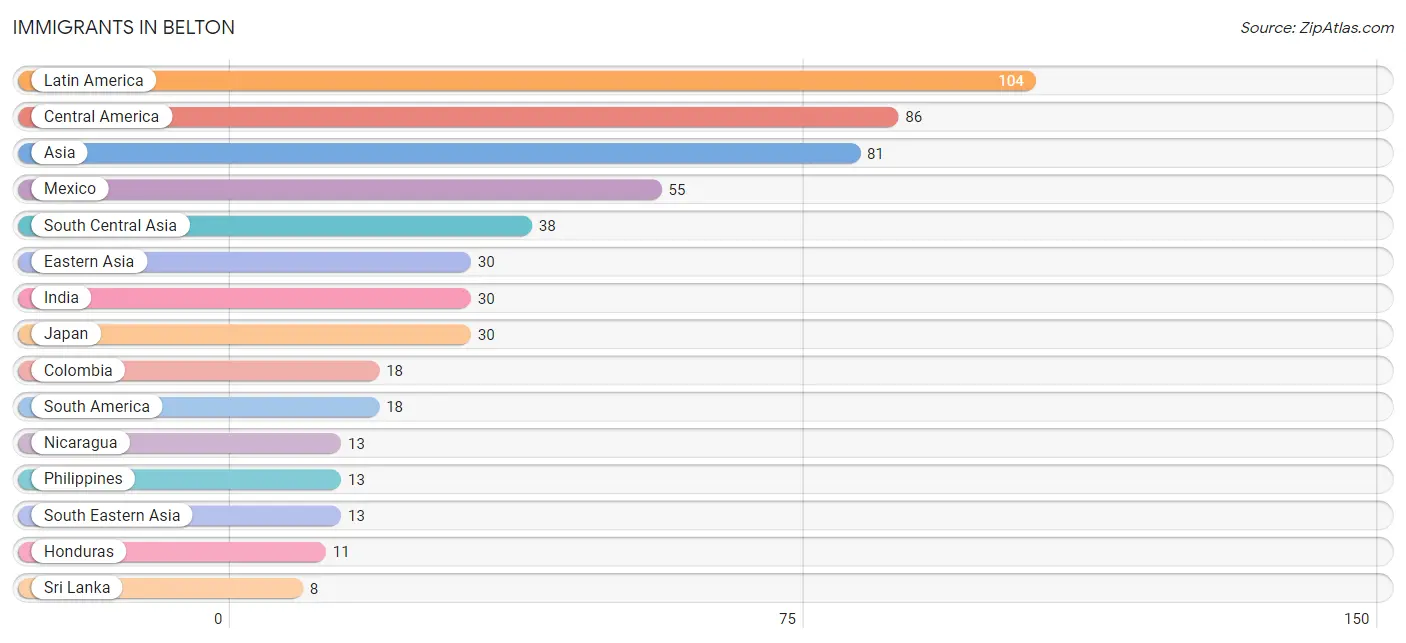
| Immigration Origin | # Population | % Population |
| Asia | 81 | 0.3% |
| Australia | 6 | 0.0% |
| Central America | 86 | 0.4% |
| Colombia | 18 | 0.1% |
| Eastern Asia | 30 | 0.1% |
| Guatemala | 7 | 0.0% |
| Honduras | 11 | 0.1% |
| India | 30 | 0.1% |
| Japan | 30 | 0.1% |
| Latin America | 104 | 0.4% |
| Mexico | 55 | 0.2% |
| Nicaragua | 13 | 0.1% |
| Oceania | 6 | 0.0% |
| Philippines | 13 | 0.1% |
| South America | 18 | 0.1% |
| South Central Asia | 38 | 0.2% |
| South Eastern Asia | 13 | 0.1% |
| Sri Lanka | 8 | 0.0% | View All 18 Rows |
Sex and Age in Belton
Sex and Age in Belton
The most populous age groups in Belton are 25 to 29 Years (1,173 | 10.4%) for men and 10 to 14 Years (1,058 | 8.2%) for women.
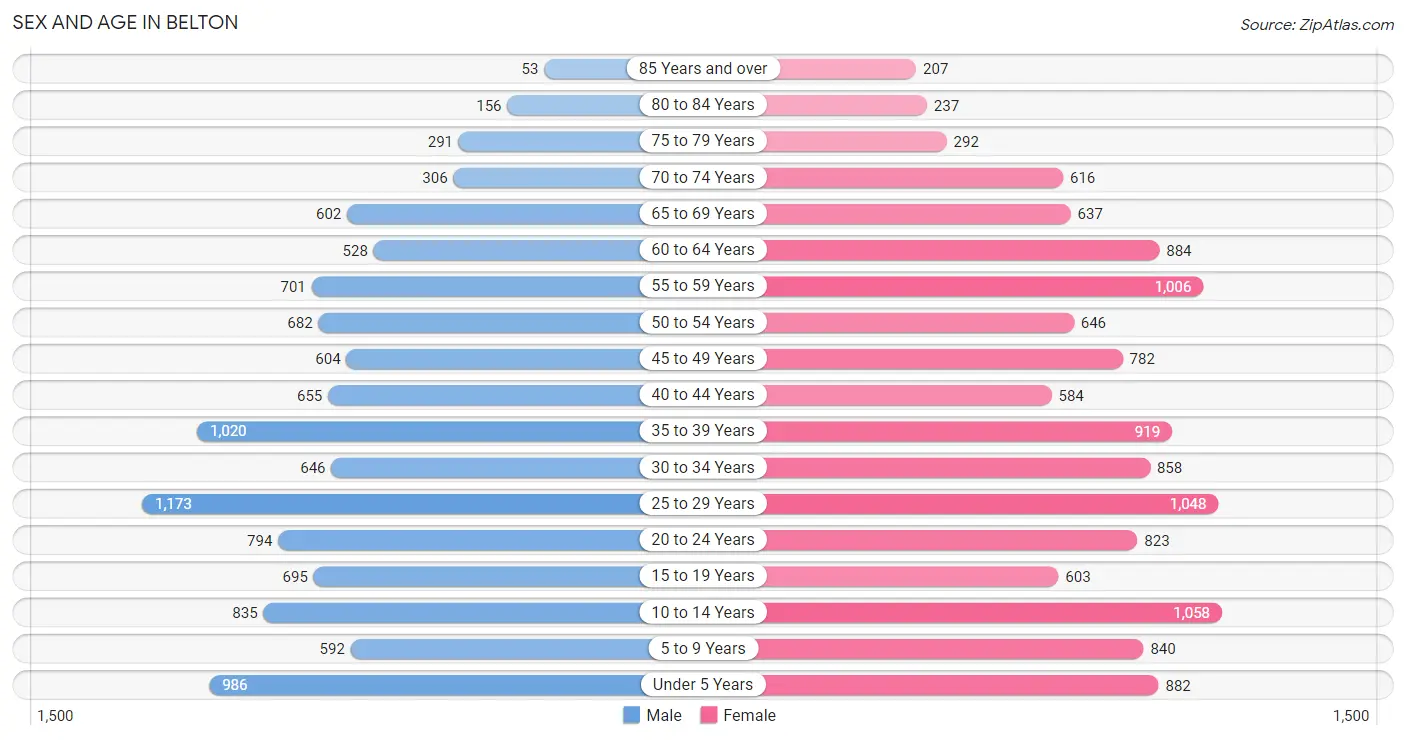
| Age Bracket | Male | Female |
| Under 5 Years | 986 (8.7%) | 882 (6.8%) |
| 5 to 9 Years | 592 (5.2%) | 840 (6.5%) |
| 10 to 14 Years | 835 (7.4%) | 1,058 (8.2%) |
| 15 to 19 Years | 695 (6.1%) | 603 (4.7%) |
| 20 to 24 Years | 794 (7.0%) | 823 (6.4%) |
| 25 to 29 Years | 1,173 (10.4%) | 1,048 (8.1%) |
| 30 to 34 Years | 646 (5.7%) | 858 (6.6%) |
| 35 to 39 Years | 1,020 (9.0%) | 919 (7.1%) |
| 40 to 44 Years | 655 (5.8%) | 584 (4.5%) |
| 45 to 49 Years | 604 (5.3%) | 782 (6.0%) |
| 50 to 54 Years | 682 (6.0%) | 646 (5.0%) |
| 55 to 59 Years | 701 (6.2%) | 1,006 (7.8%) |
| 60 to 64 Years | 528 (4.7%) | 884 (6.8%) |
| 65 to 69 Years | 602 (5.3%) | 637 (4.9%) |
| 70 to 74 Years | 306 (2.7%) | 616 (4.8%) |
| 75 to 79 Years | 291 (2.6%) | 292 (2.3%) |
| 80 to 84 Years | 156 (1.4%) | 237 (1.8%) |
| 85 Years and over | 53 (0.5%) | 207 (1.6%) |
| Total | 11,319 (100.0%) | 12,922 (100.0%) |
Families and Households in Belton
Median Family Size in Belton
The median family size in Belton is 2.93 persons per family, with single male/father families (615 | 9.1%) accounting for the largest median family size of 3.06 persons per family. On the other hand, single female/mother families (1,512 | 22.5%) represent the smallest median family size with 2.57 persons per family.
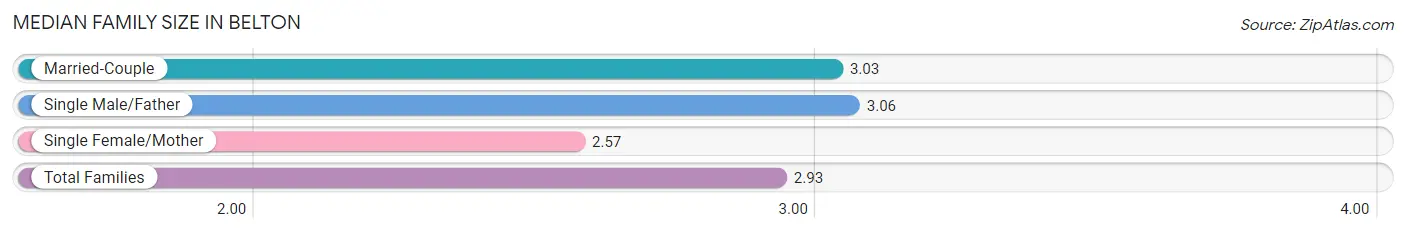
| Family Type | # Families | Family Size |
| Married-Couple | 4,606 (68.4%) | 3.03 |
| Single Male/Father | 615 (9.1%) | 3.06 |
| Single Female/Mother | 1,512 (22.5%) | 2.57 |
| Total Families | 6,733 (100.0%) | 2.93 |
Median Household Size in Belton
The median household size in Belton is 2.50 persons per household, with single male/father households (615 | 6.4%) accounting for the largest median household size of 3.48 persons per household. non-family households (2,926 | 30.3%) represent the smallest median household size with 1.18 persons per household.
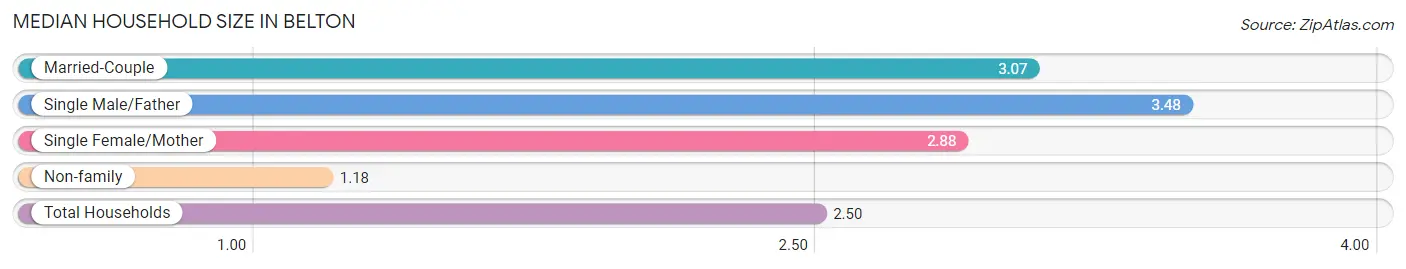
| Household Type | # Households | Household Size |
| Married-Couple | 4,606 (47.7%) | 3.07 |
| Single Male/Father | 615 (6.4%) | 3.48 |
| Single Female/Mother | 1,512 (15.7%) | 2.88 |
| Non-family | 2,926 (30.3%) | 1.18 |
| Total Households | 9,659 (100.0%) | 2.50 |
Household Size by Marriage Status in Belton
Out of a total of 9,659 households in Belton, 6,733 (69.7%) are family households, while 2,926 (30.3%) are nonfamily households. The most numerous type of family households are 2-person households, comprising 3,050, and the most common type of nonfamily households are 1-person households, comprising 2,507.
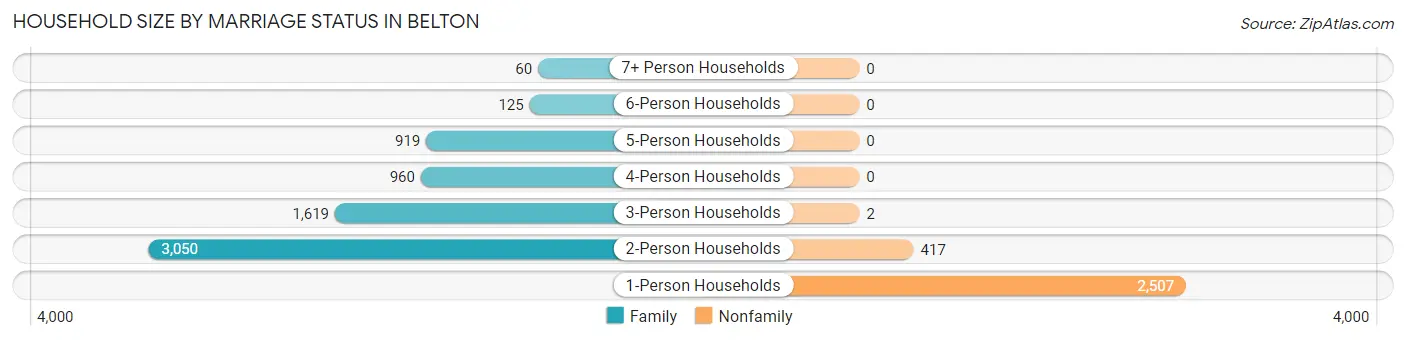
| Household Size | Family Households | Nonfamily Households |
| 1-Person Households | - | 2,507 (26.0%) |
| 2-Person Households | 3,050 (31.6%) | 417 (4.3%) |
| 3-Person Households | 1,619 (16.8%) | 2 (0.0%) |
| 4-Person Households | 960 (9.9%) | 0 (0.0%) |
| 5-Person Households | 919 (9.5%) | 0 (0.0%) |
| 6-Person Households | 125 (1.3%) | 0 (0.0%) |
| 7+ Person Households | 60 (0.6%) | 0 (0.0%) |
| Total | 6,733 (69.7%) | 2,926 (30.3%) |
Female Fertility in Belton
Fertility by Age in Belton
Average fertility rate in Belton is 68.0 births per 1,000 women. Women in the age bracket of 20 to 34 years have the highest fertility rate with 122.0 births per 1,000 women. Women in the age bracket of 20 to 34 years acount for 85.6% of all women with births.
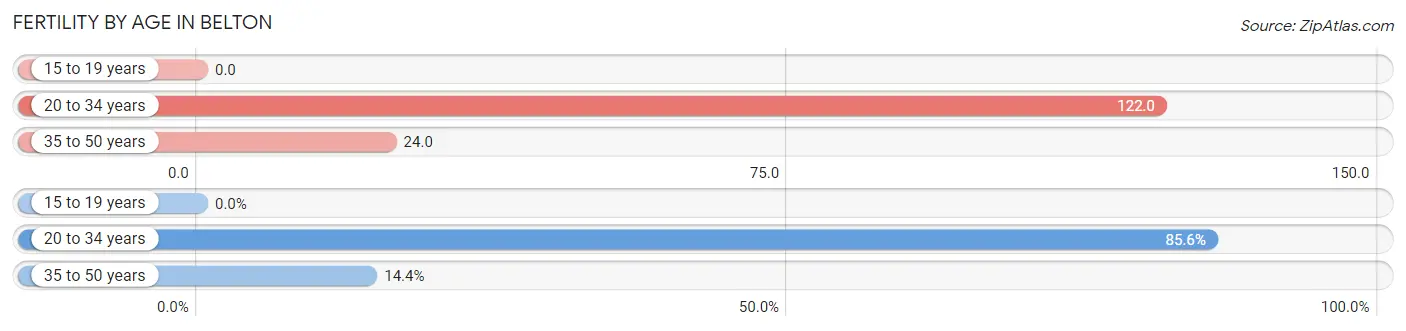
| Age Bracket | Women with Births | Births / 1,000 Women |
| 15 to 19 years | 0 (0.0%) | 0.0 |
| 20 to 34 years | 334 (85.6%) | 122.0 |
| 35 to 50 years | 56 (14.4%) | 24.0 |
| Total | 390 (100.0%) | 68.0 |
Fertility by Age by Marriage Status in Belton
32.8% of women with births (390) in Belton are married. The highest percentage of unmarried women with births falls into 20 to 34 years age bracket with 67.7% of them unmarried at the time of birth, while the lowest percentage of unmarried women with births belong to 35 to 50 years age bracket with 64.3% of them unmarried.
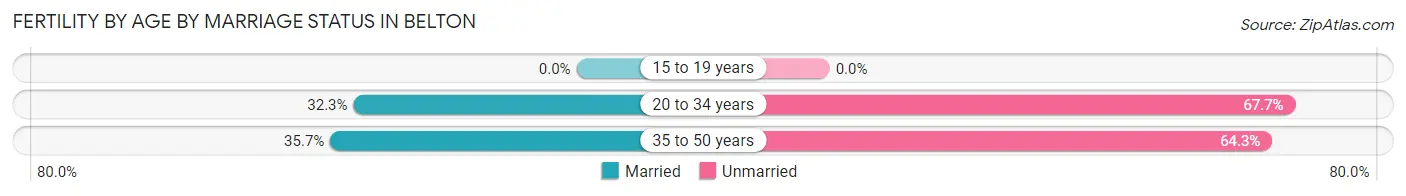
| Age Bracket | Married | Unmarried |
| 15 to 19 years | 0 (0.0%) | 0 (0.0%) |
| 20 to 34 years | 108 (32.3%) | 226 (67.7%) |
| 35 to 50 years | 20 (35.7%) | 36 (64.3%) |
| Total | 128 (32.8%) | 262 (67.2%) |
Fertility by Education in Belton
Average fertility rate in Belton is 68.0 births per 1,000 women. Women with the education attainment of high school diploma have the highest fertility rate of 83.0 births per 1,000 women, while women with the education attainment of less than high school have the lowest fertility at 14.0 births per 1,000 women. Women with the education attainment of college or associate's degree represent 39.0% of all women with births.
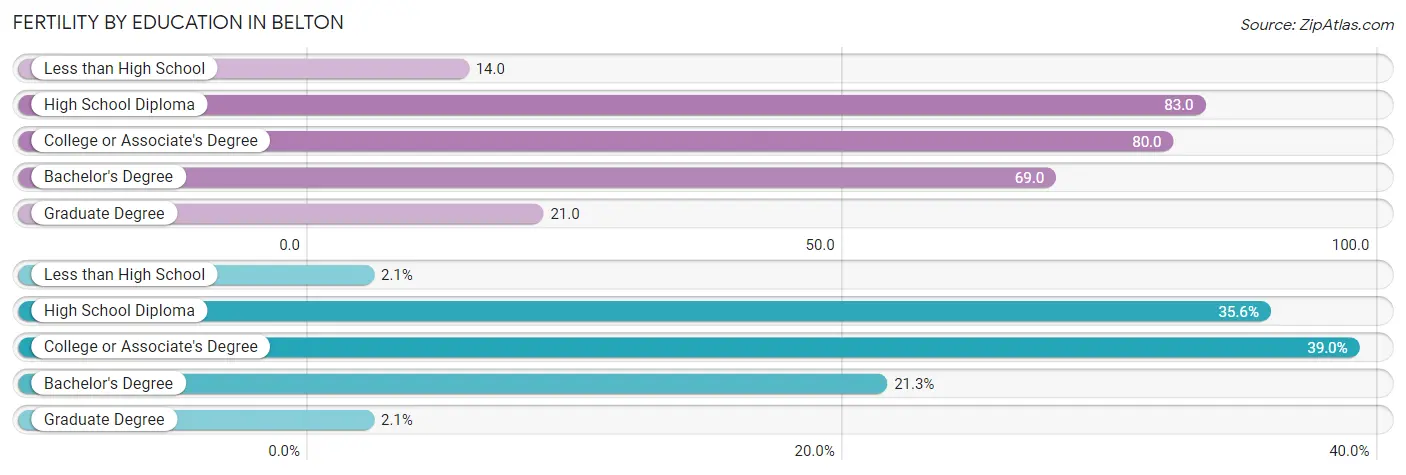
| Educational Attainment | Women with Births | Births / 1,000 Women |
| Less than High School | 8 (2.1%) | 14.0 |
| High School Diploma | 139 (35.6%) | 83.0 |
| College or Associate's Degree | 152 (39.0%) | 80.0 |
| Bachelor's Degree | 83 (21.3%) | 69.0 |
| Graduate Degree | 8 (2.1%) | 21.0 |
| Total | 390 (100.0%) | 68.0 |
Fertility by Education by Marriage Status in Belton
67.2% of women with births in Belton are unmarried. Women with the educational attainment of less than high school are most likely to be married with 100.0% of them married at childbirth, while women with the educational attainment of high school diploma are least likely to be married with 95.0% of them unmarried at childbirth.
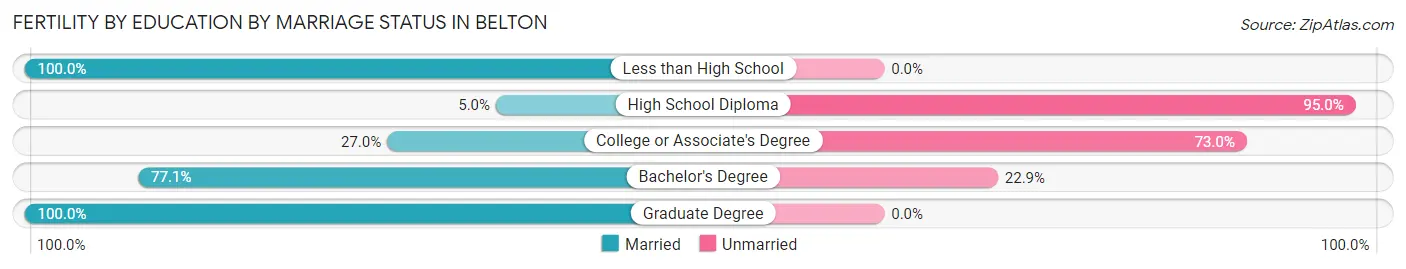
| Educational Attainment | Married | Unmarried |
| Less than High School | 8 (100.0%) | 0 (0.0%) |
| High School Diploma | 7 (5.0%) | 132 (95.0%) |
| College or Associate's Degree | 41 (27.0%) | 111 (73.0%) |
| Bachelor's Degree | 64 (77.1%) | 19 (22.9%) |
| Graduate Degree | 8 (100.0%) | 0 (0.0%) |
| Total | 128 (32.8%) | 262 (67.2%) |
Employment Characteristics in Belton
Employment by Class of Employer in Belton
Among the 12,170 employed individuals in Belton, private company employees (9,058 | 74.4%), not-for-profit organizations (727 | 6.0%), and local government employees (672 | 5.5%) make up the most common classes of employment.
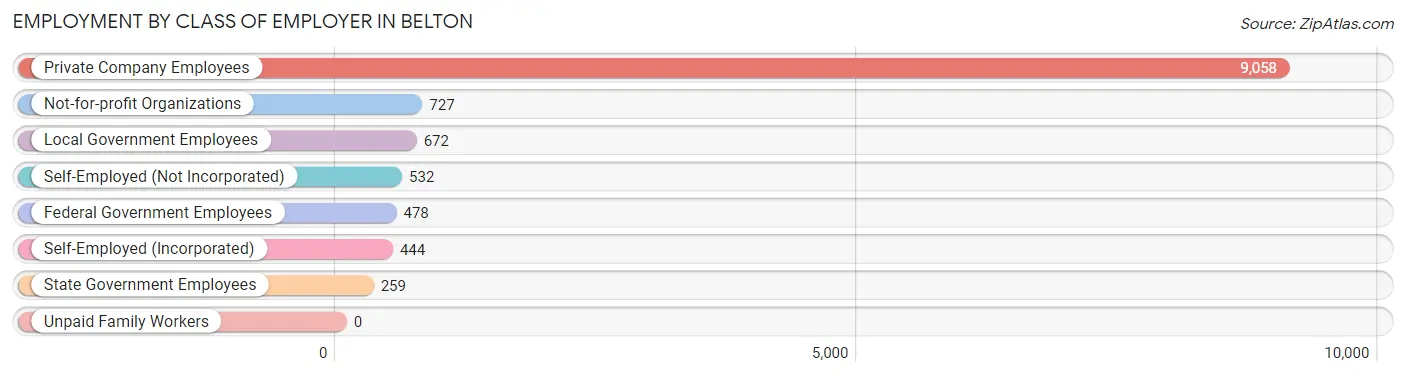
| Employer Class | # Employees | % Employees |
| Private Company Employees | 9,058 | 74.4% |
| Self-Employed (Incorporated) | 444 | 3.6% |
| Self-Employed (Not Incorporated) | 532 | 4.4% |
| Not-for-profit Organizations | 727 | 6.0% |
| Local Government Employees | 672 | 5.5% |
| State Government Employees | 259 | 2.1% |
| Federal Government Employees | 478 | 3.9% |
| Unpaid Family Workers | 0 | 0.0% |
| Total | 12,170 | 100.0% |
Employment Status by Age in Belton
According to the labor force statistics for Belton, out of the total population over 16 years of age (18,776), 69.2% or 12,993 individuals are in the labor force, with 5.4% or 702 of them unemployed. The age group with the highest labor force participation rate is 25 to 29 years, with 91.8% or 2,039 individuals in the labor force. Within the labor force, the 20 to 24 years age range has the highest percentage of unemployed individuals, with 15.9% or 226 of them being unemployed.
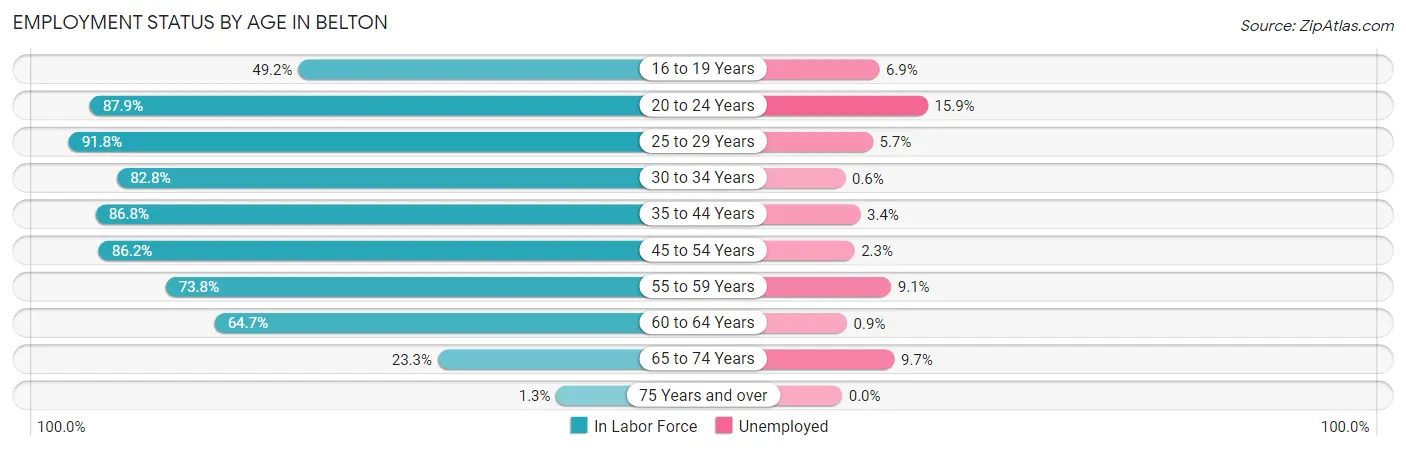
| Age Bracket | In Labor Force | Unemployed |
| 16 to 19 Years | 505 (49.2%) | 35 (6.9%) |
| 20 to 24 Years | 1,421 (87.9%) | 226 (15.9%) |
| 25 to 29 Years | 2,039 (91.8%) | 116 (5.7%) |
| 30 to 34 Years | 1,245 (82.8%) | 7 (0.6%) |
| 35 to 44 Years | 2,759 (86.8%) | 94 (3.4%) |
| 45 to 54 Years | 2,339 (86.2%) | 54 (2.3%) |
| 55 to 59 Years | 1,260 (73.8%) | 115 (9.1%) |
| 60 to 64 Years | 914 (64.7%) | 8 (0.9%) |
| 65 to 74 Years | 504 (23.3%) | 49 (9.7%) |
| 75 Years and over | 16 (1.3%) | 0 (0.0%) |
| Total | 12,993 (69.2%) | 702 (5.4%) |
Employment Status by Educational Attainment in Belton
According to labor force statistics for Belton, 82.9% of individuals (10,558) out of the total population between 25 and 64 years of age (12,736) are in the labor force, with 3.7% or 391 of them being unemployed. The group with the highest labor force participation rate are those with the educational attainment of bachelor's degree or higher, with 86.9% or 3,048 individuals in the labor force. Within the labor force, individuals with less than high school education have the highest percentage of unemployment, with 10.1% or 43 of them being unemployed.
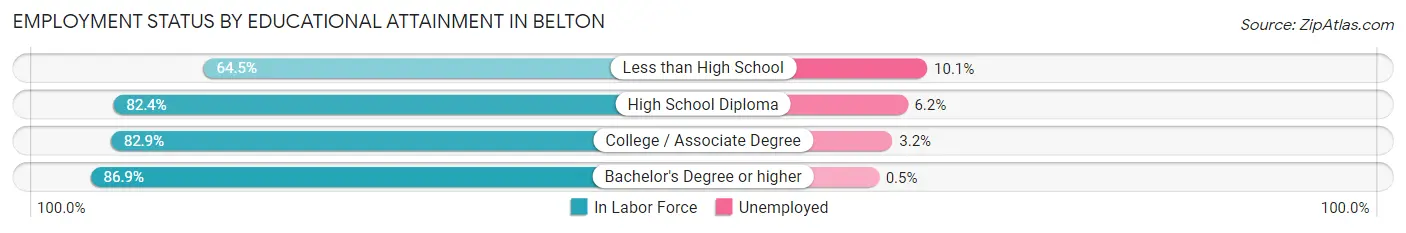
| Educational Attainment | In Labor Force | Unemployed |
| Less than High School | 424 (64.5%) | 66 (10.1%) |
| High School Diploma | 3,678 (82.4%) | 277 (6.2%) |
| College / Associate Degree | 3,406 (82.9%) | 131 (3.2%) |
| Bachelor's Degree or higher | 3,048 (86.9%) | 18 (0.5%) |
| Total | 10,558 (82.9%) | 471 (3.7%) |
Employment Occupations by Sex in Belton
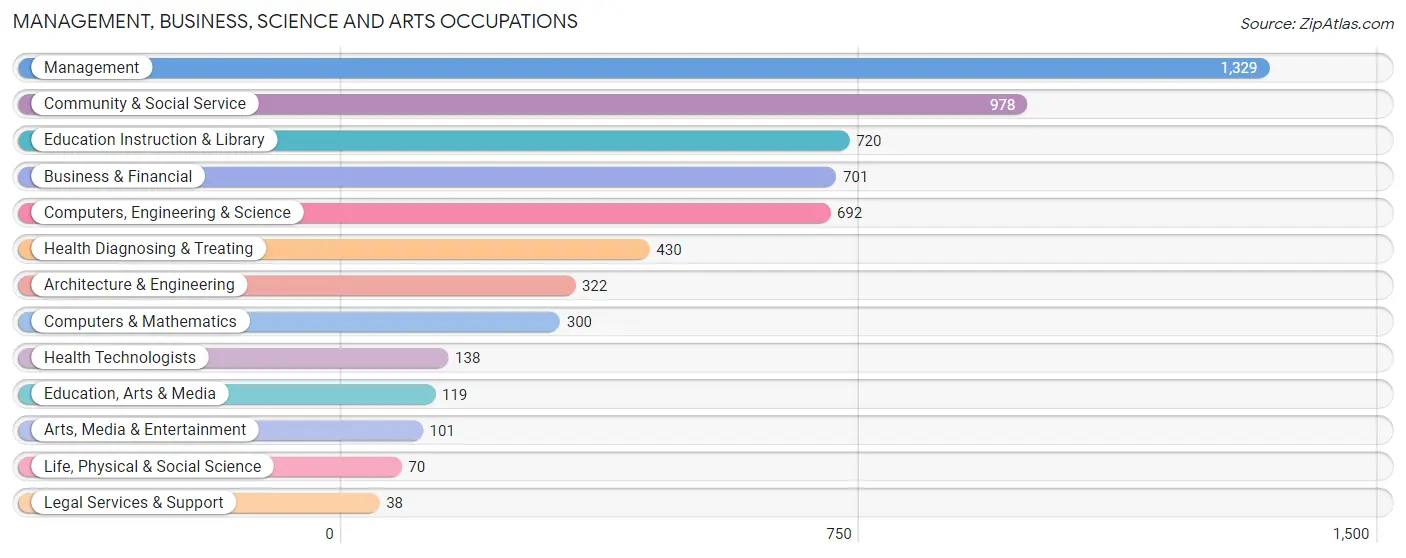
Management, Business, Science and Arts Occupations
The most common Management, Business, Science and Arts occupations in Belton are Management (1,329 | 10.8%), Community & Social Service (978 | 8.0%), Education Instruction & Library (720 | 5.9%), Business & Financial (701 | 5.7%), and Computers, Engineering & Science (692 | 5.7%).
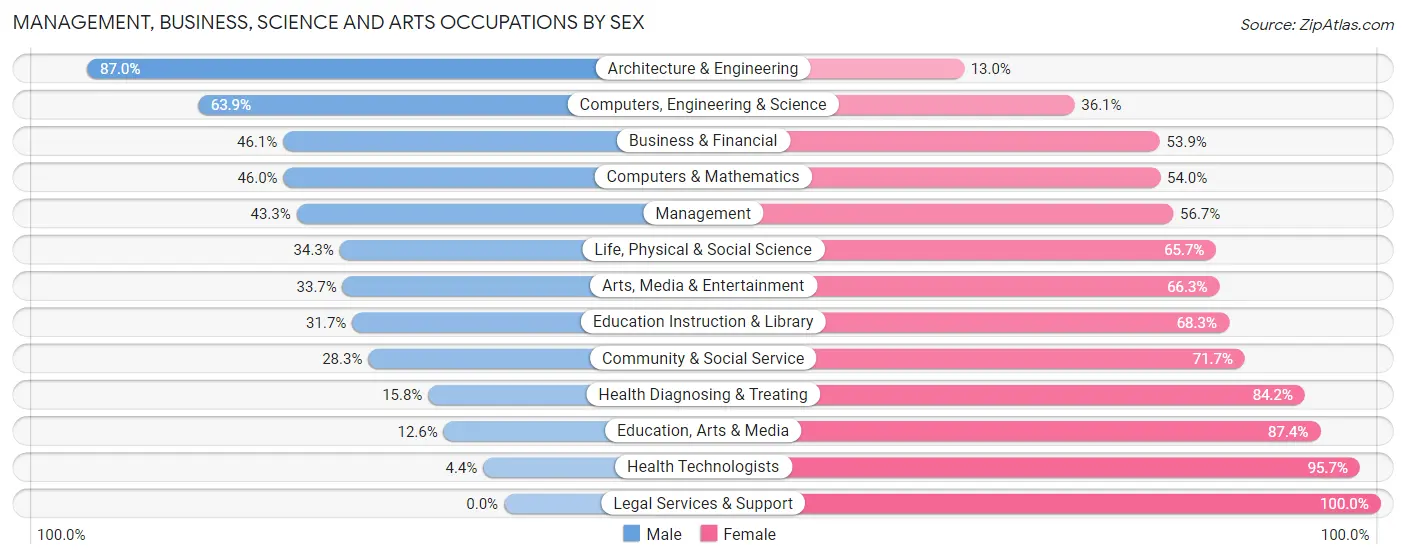
Management, Business, Science and Arts Occupations by Sex
Within the Management, Business, Science and Arts occupations in Belton, the most male-oriented occupations are Architecture & Engineering (87.0%), Computers, Engineering & Science (63.9%), and Business & Financial (46.1%), while the most female-oriented occupations are Legal Services & Support (100.0%), Health Technologists (95.7%), and Education, Arts & Media (87.4%).
| Occupation | Male | Female |
| Management | 575 (43.3%) | 754 (56.7%) |
| Business & Financial | 323 (46.1%) | 378 (53.9%) |
| Computers, Engineering & Science | 442 (63.9%) | 250 (36.1%) |
| Computers & Mathematics | 138 (46.0%) | 162 (54.0%) |
| Architecture & Engineering | 280 (87.0%) | 42 (13.0%) |
| Life, Physical & Social Science | 24 (34.3%) | 46 (65.7%) |
| Community & Social Service | 277 (28.3%) | 701 (71.7%) |
| Education, Arts & Media | 15 (12.6%) | 104 (87.4%) |
| Legal Services & Support | 0 (0.0%) | 38 (100.0%) |
| Education Instruction & Library | 228 (31.7%) | 492 (68.3%) |
| Arts, Media & Entertainment | 34 (33.7%) | 67 (66.3%) |
| Health Diagnosing & Treating | 68 (15.8%) | 362 (84.2%) |
| Health Technologists | 6 (4.3%) | 132 (95.7%) |
| Total (Category) | 1,685 (40.8%) | 2,445 (59.2%) |
| Total (Overall) | 6,160 (50.3%) | 6,087 (49.7%) |
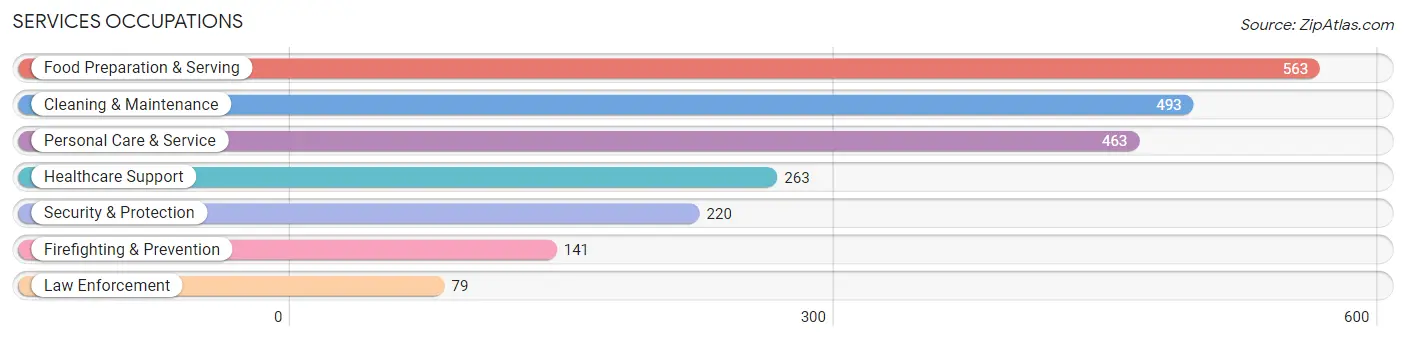
Services Occupations
The most common Services occupations in Belton are Food Preparation & Serving (563 | 4.6%), Cleaning & Maintenance (493 | 4.0%), Personal Care & Service (463 | 3.8%), Healthcare Support (263 | 2.1%), and Security & Protection (220 | 1.8%).
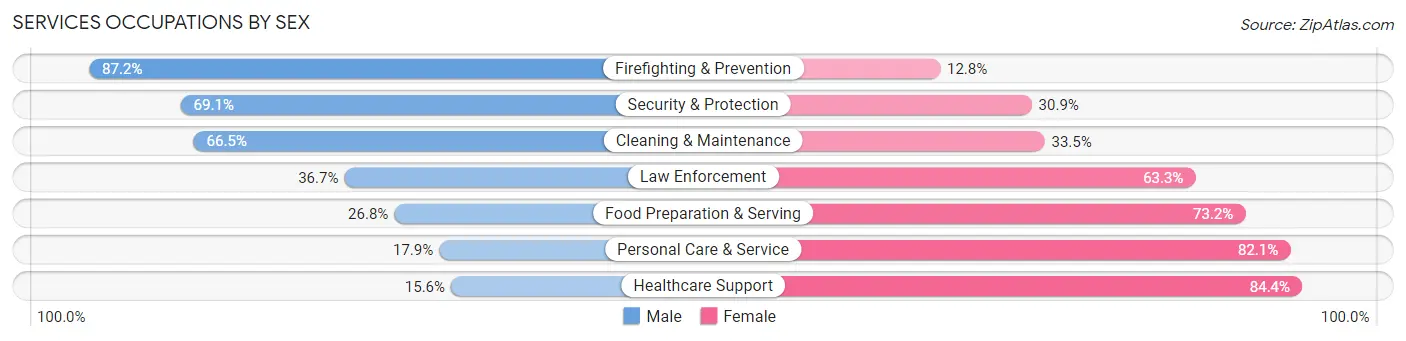
Services Occupations by Sex
Within the Services occupations in Belton, the most male-oriented occupations are Firefighting & Prevention (87.2%), Security & Protection (69.1%), and Cleaning & Maintenance (66.5%), while the most female-oriented occupations are Healthcare Support (84.4%), Personal Care & Service (82.1%), and Food Preparation & Serving (73.2%).
| Occupation | Male | Female |
| Healthcare Support | 41 (15.6%) | 222 (84.4%) |
| Security & Protection | 152 (69.1%) | 68 (30.9%) |
| Firefighting & Prevention | 123 (87.2%) | 18 (12.8%) |
| Law Enforcement | 29 (36.7%) | 50 (63.3%) |
| Food Preparation & Serving | 151 (26.8%) | 412 (73.2%) |
| Cleaning & Maintenance | 328 (66.5%) | 165 (33.5%) |
| Personal Care & Service | 83 (17.9%) | 380 (82.1%) |
| Total (Category) | 755 (37.7%) | 1,247 (62.3%) |
| Total (Overall) | 6,160 (50.3%) | 6,087 (49.7%) |
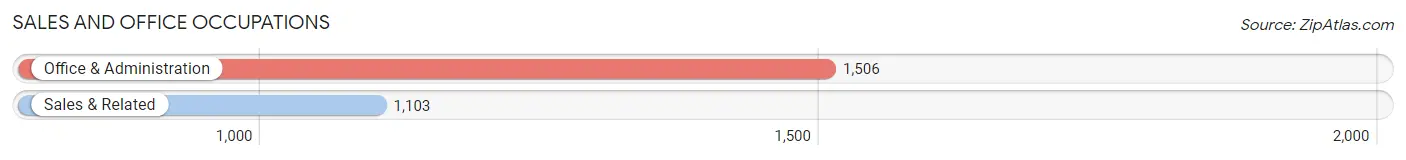
Sales and Office Occupations
The most common Sales and Office occupations in Belton are Office & Administration (1,506 | 12.3%), and Sales & Related (1,103 | 9.0%).
Sales and Office Occupations by Sex
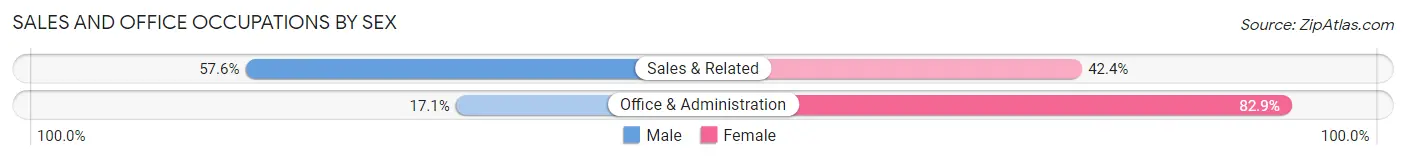
| Occupation | Male | Female |
| Sales & Related | 635 (57.6%) | 468 (42.4%) |
| Office & Administration | 258 (17.1%) | 1,248 (82.9%) |
| Total (Category) | 893 (34.2%) | 1,716 (65.8%) |
| Total (Overall) | 6,160 (50.3%) | 6,087 (49.7%) |
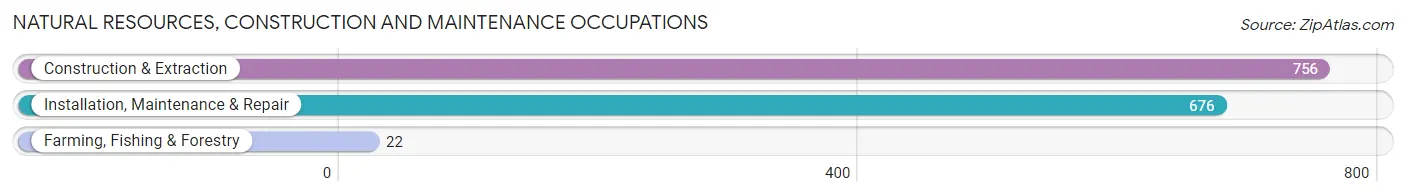
Natural Resources, Construction and Maintenance Occupations
The most common Natural Resources, Construction and Maintenance occupations in Belton are Construction & Extraction (756 | 6.2%), Installation, Maintenance & Repair (676 | 5.5%), and Farming, Fishing & Forestry (22 | 0.2%).
Natural Resources, Construction and Maintenance Occupations by Sex
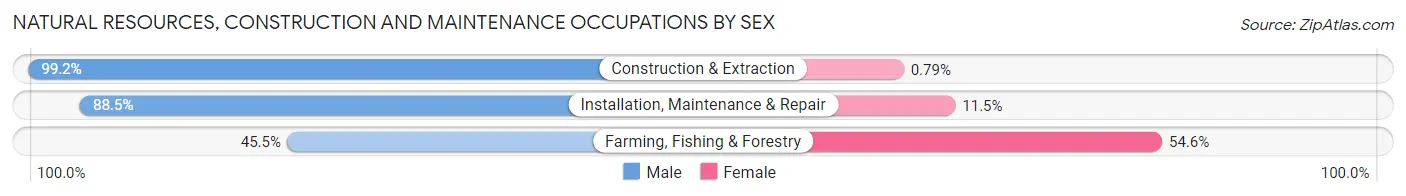
| Occupation | Male | Female |
| Farming, Fishing & Forestry | 10 (45.5%) | 12 (54.5%) |
| Construction & Extraction | 750 (99.2%) | 6 (0.8%) |
| Installation, Maintenance & Repair | 598 (88.5%) | 78 (11.5%) |
| Total (Category) | 1,358 (93.4%) | 96 (6.6%) |
| Total (Overall) | 6,160 (50.3%) | 6,087 (49.7%) |
Production, Transportation and Moving Occupations
The most common Production, Transportation and Moving occupations in Belton are Production (946 | 7.7%), Transportation (593 | 4.8%), and Material Moving (513 | 4.2%).
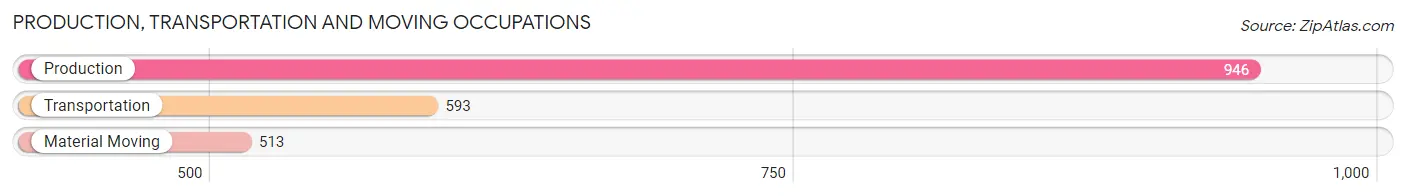
Production, Transportation and Moving Occupations by Sex
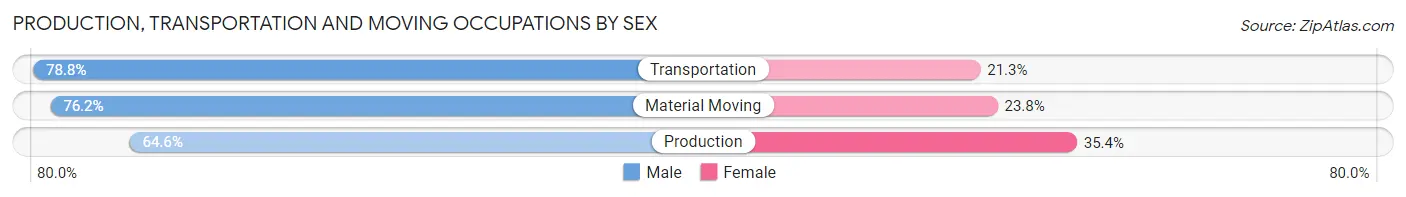
| Occupation | Male | Female |
| Production | 611 (64.6%) | 335 (35.4%) |
| Transportation | 467 (78.7%) | 126 (21.2%) |
| Material Moving | 391 (76.2%) | 122 (23.8%) |
| Total (Category) | 1,469 (71.6%) | 583 (28.4%) |
| Total (Overall) | 6,160 (50.3%) | 6,087 (49.7%) |
Employment Industries by Sex in Belton
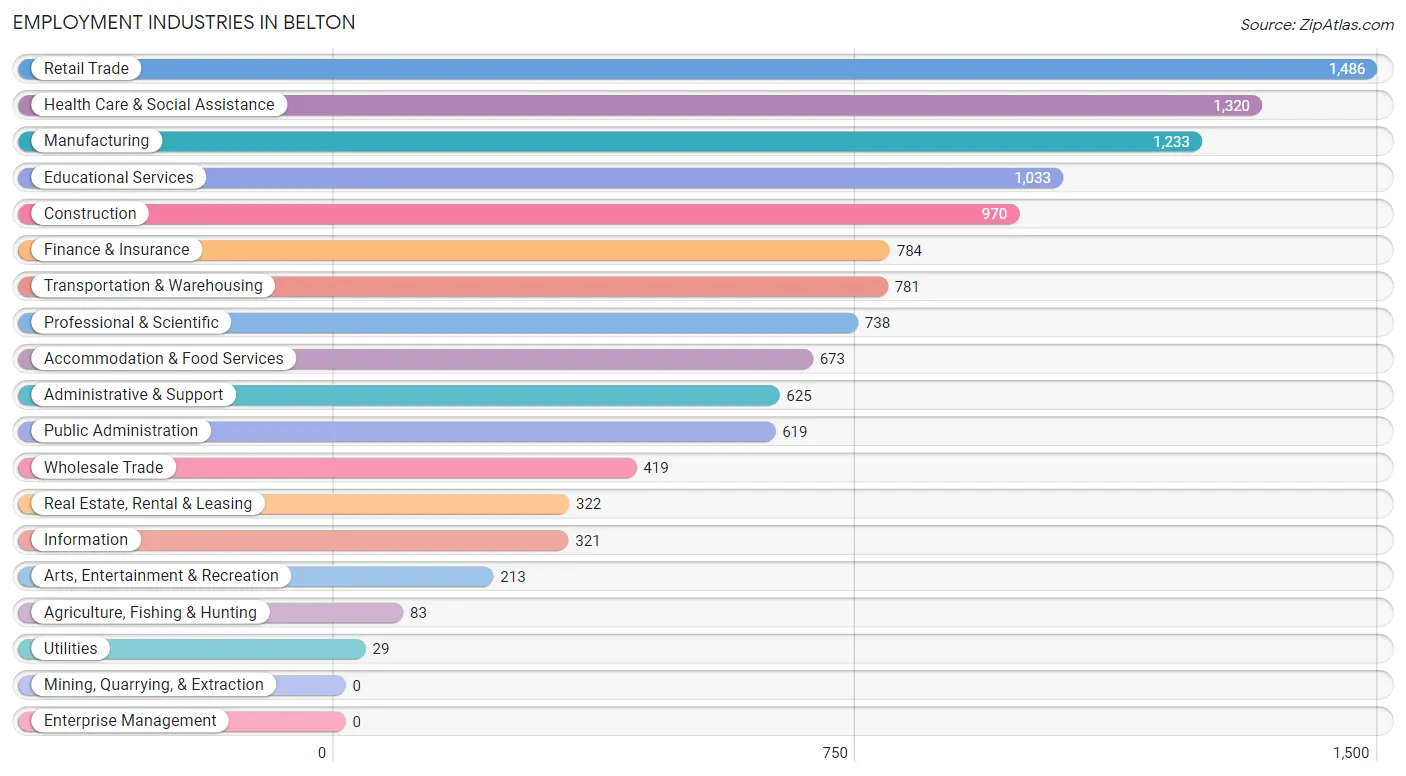
Employment Industries in Belton
The major employment industries in Belton include Retail Trade (1,486 | 12.1%), Health Care & Social Assistance (1,320 | 10.8%), Manufacturing (1,233 | 10.1%), Educational Services (1,033 | 8.4%), and Construction (970 | 7.9%).
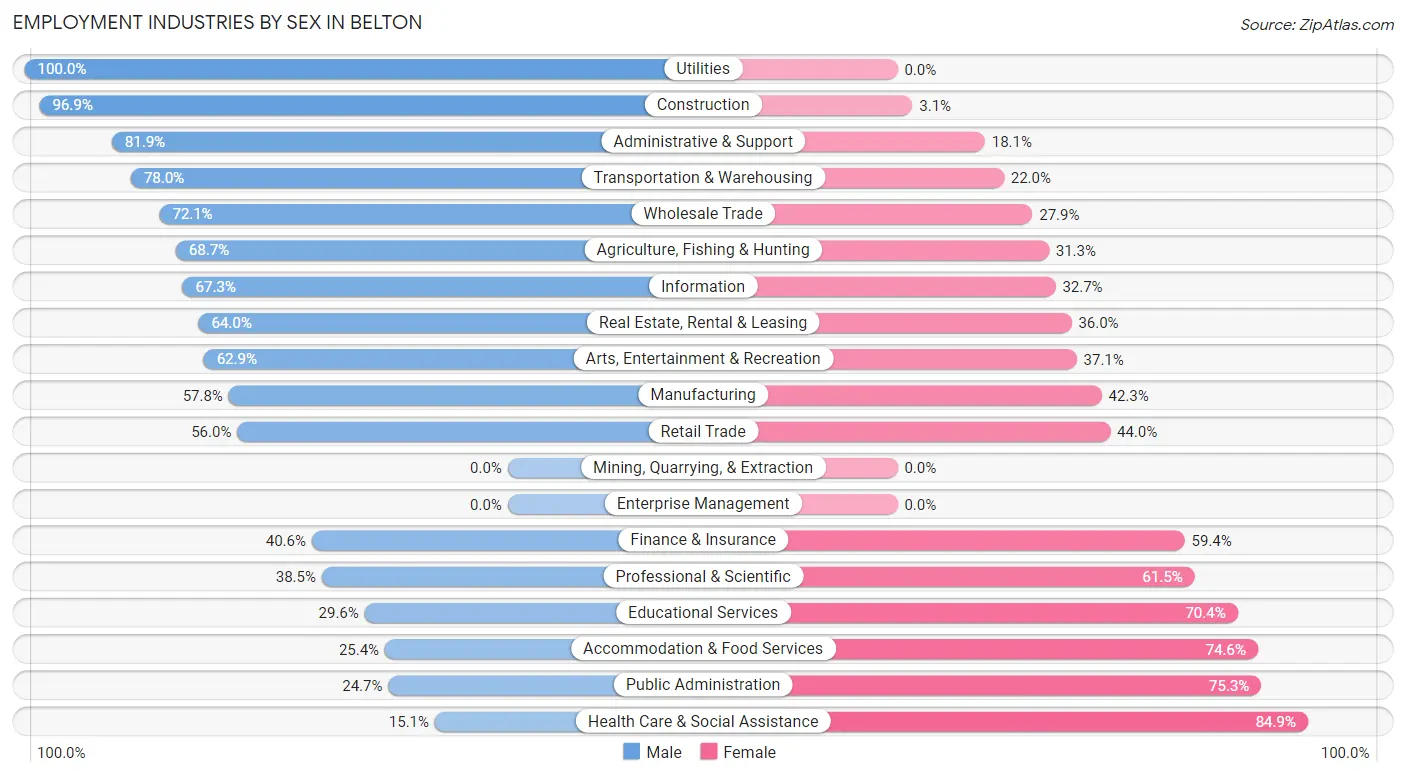
Employment Industries by Sex in Belton
The Belton industries that see more men than women are Utilities (100.0%), Construction (96.9%), and Administrative & Support (81.9%), whereas the industries that tend to have a higher number of women are Health Care & Social Assistance (84.9%), Public Administration (75.3%), and Accommodation & Food Services (74.6%).
| Industry | Male | Female |
| Agriculture, Fishing & Hunting | 57 (68.7%) | 26 (31.3%) |
| Mining, Quarrying, & Extraction | 0 (0.0%) | 0 (0.0%) |
| Construction | 940 (96.9%) | 30 (3.1%) |
| Manufacturing | 712 (57.8%) | 521 (42.2%) |
| Wholesale Trade | 302 (72.1%) | 117 (27.9%) |
| Retail Trade | 832 (56.0%) | 654 (44.0%) |
| Transportation & Warehousing | 609 (78.0%) | 172 (22.0%) |
| Utilities | 29 (100.0%) | 0 (0.0%) |
| Information | 216 (67.3%) | 105 (32.7%) |
| Finance & Insurance | 318 (40.6%) | 466 (59.4%) |
| Real Estate, Rental & Leasing | 206 (64.0%) | 116 (36.0%) |
| Professional & Scientific | 284 (38.5%) | 454 (61.5%) |
| Enterprise Management | 0 (0.0%) | 0 (0.0%) |
| Administrative & Support | 512 (81.9%) | 113 (18.1%) |
| Educational Services | 306 (29.6%) | 727 (70.4%) |
| Health Care & Social Assistance | 199 (15.1%) | 1,121 (84.9%) |
| Arts, Entertainment & Recreation | 134 (62.9%) | 79 (37.1%) |
| Accommodation & Food Services | 171 (25.4%) | 502 (74.6%) |
| Public Administration | 153 (24.7%) | 466 (75.3%) |
| Total | 6,160 (50.3%) | 6,087 (49.7%) |
Education in Belton
School Enrollment in Belton
The most common levels of schooling among the 5,261 students in Belton are middle school (1,450 | 27.6%), high school (1,194 | 22.7%), and elementary school (1,182 | 22.5%).
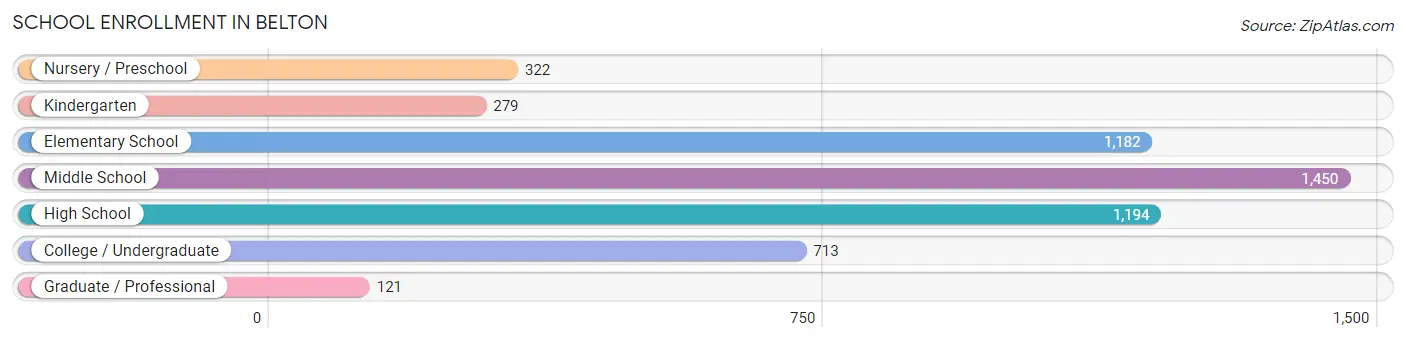
| School Level | # Students | % Students |
| Nursery / Preschool | 322 | 6.1% |
| Kindergarten | 279 | 5.3% |
| Elementary School | 1,182 | 22.5% |
| Middle School | 1,450 | 27.6% |
| High School | 1,194 | 22.7% |
| College / Undergraduate | 713 | 13.6% |
| Graduate / Professional | 121 | 2.3% |
| Total | 5,261 | 100.0% |
School Enrollment by Age by Funding Source in Belton
Out of a total of 5,261 students who are enrolled in schools in Belton, 468 (8.9%) attend a private institution, while the remaining 4,793 (91.1%) are enrolled in public schools. The age group of 20 to 24 year olds has the highest likelihood of being enrolled in private schools, with 101 (35.3% in the age bracket) enrolled. Conversely, the age group of 15 to 17 year olds has the lowest likelihood of being enrolled in a private school, with 793 (95.9% in the age bracket) attending a public institution.
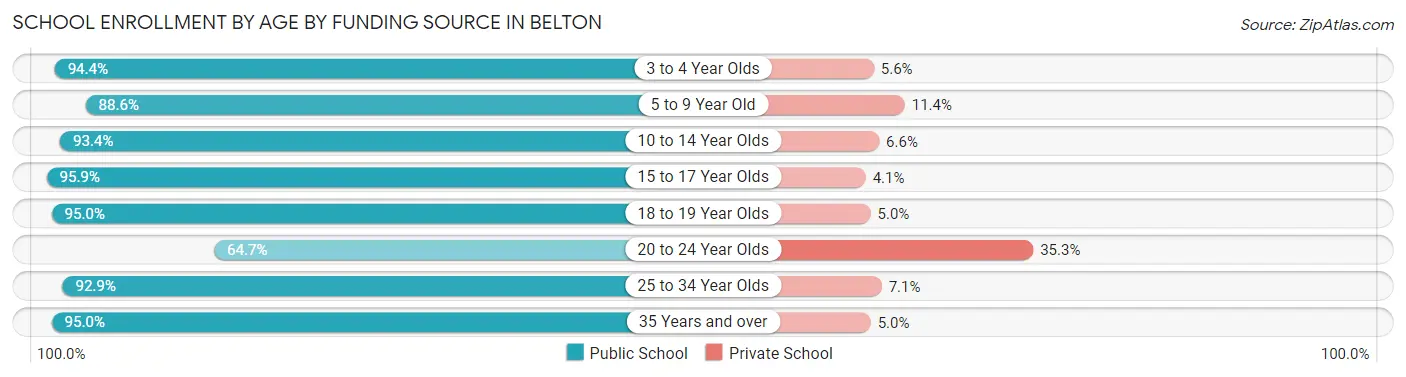
| Age Bracket | Public School | Private School |
| 3 to 4 Year Olds | 235 (94.4%) | 14 (5.6%) |
| 5 to 9 Year Old | 1,215 (88.6%) | 156 (11.4%) |
| 10 to 14 Year Olds | 1,710 (93.4%) | 121 (6.6%) |
| 15 to 17 Year Olds | 793 (95.9%) | 34 (4.1%) |
| 18 to 19 Year Olds | 208 (95.0%) | 11 (5.0%) |
| 20 to 24 Year Olds | 185 (64.7%) | 101 (35.3%) |
| 25 to 34 Year Olds | 315 (92.9%) | 24 (7.1%) |
| 35 Years and over | 132 (95.0%) | 7 (5.0%) |
| Total | 4,793 (91.1%) | 468 (8.9%) |
Educational Attainment by Field of Study in Belton
Business (870 | 20.1%), education (693 | 16.0%), arts & humanities (394 | 9.1%), science & technology (383 | 8.8%), and social sciences (320 | 7.4%) are the most common fields of study among 4,339 individuals in Belton who have obtained a bachelor's degree or higher.
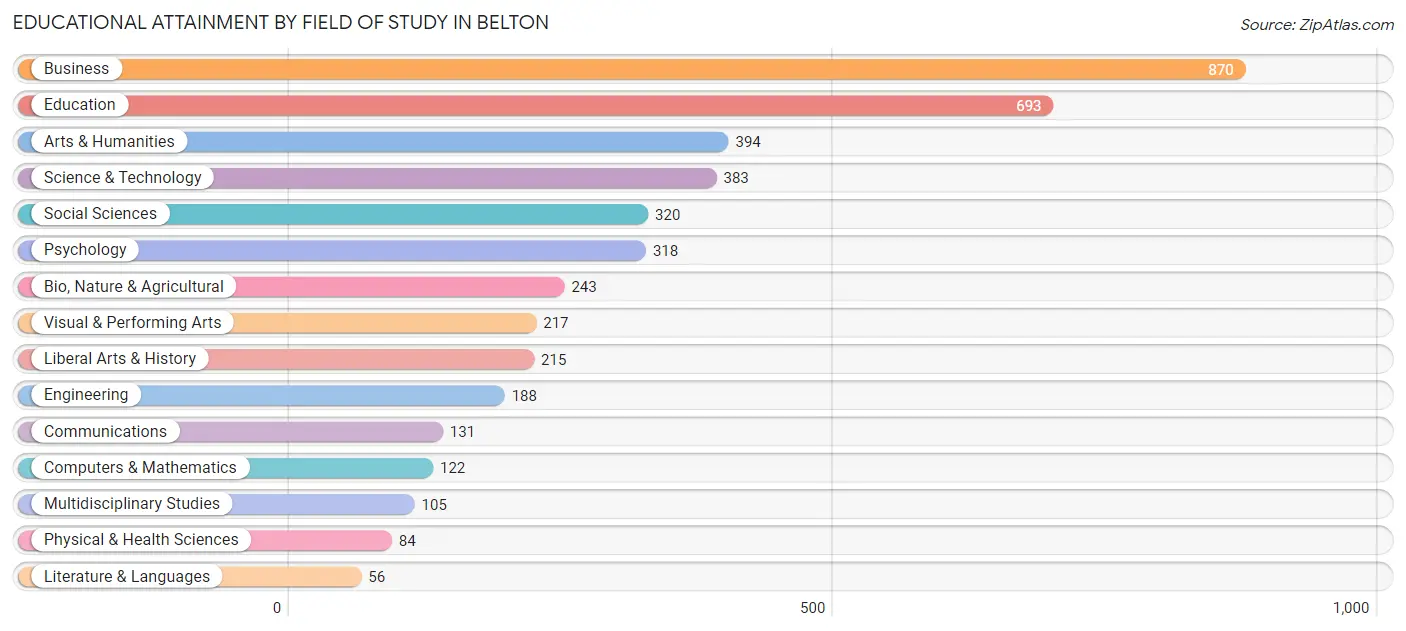
| Field of Study | # Graduates | % Graduates |
| Computers & Mathematics | 122 | 2.8% |
| Bio, Nature & Agricultural | 243 | 5.6% |
| Physical & Health Sciences | 84 | 1.9% |
| Psychology | 318 | 7.3% |
| Social Sciences | 320 | 7.4% |
| Engineering | 188 | 4.3% |
| Multidisciplinary Studies | 105 | 2.4% |
| Science & Technology | 383 | 8.8% |
| Business | 870 | 20.1% |
| Education | 693 | 16.0% |
| Literature & Languages | 56 | 1.3% |
| Liberal Arts & History | 215 | 5.0% |
| Visual & Performing Arts | 217 | 5.0% |
| Communications | 131 | 3.0% |
| Arts & Humanities | 394 | 9.1% |
| Total | 4,339 | 100.0% |
Transportation & Commute in Belton
Vehicle Availability by Sex in Belton
The most prevalent vehicle ownership categories in Belton are males with 2 vehicles (2,977, accounting for 48.3%) and females with 2 vehicles (2,286, making up 49.5%).
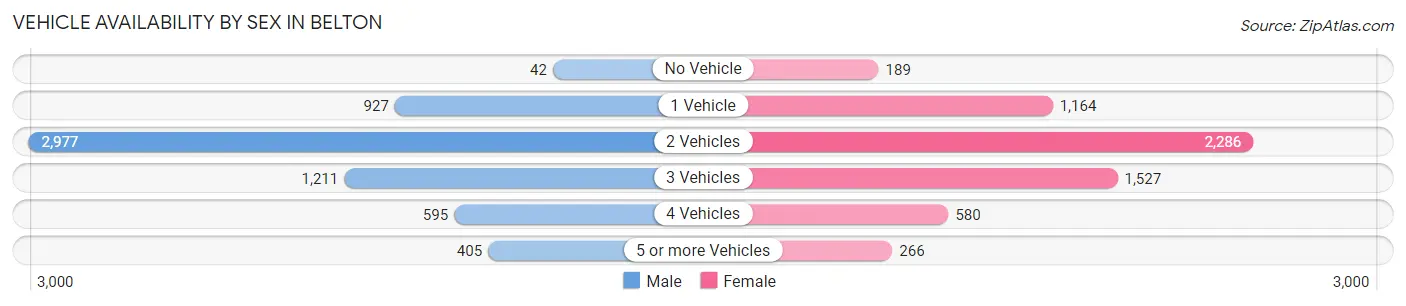
| Vehicles Available | Male | Female |
| No Vehicle | 42 (0.7%) | 189 (3.1%) |
| 1 Vehicle | 927 (15.1%) | 1,164 (19.4%) |
| 2 Vehicles | 2,977 (48.3%) | 2,286 (38.0%) |
| 3 Vehicles | 1,211 (19.7%) | 1,527 (25.4%) |
| 4 Vehicles | 595 (9.7%) | 580 (9.7%) |
| 5 or more Vehicles | 405 (6.6%) | 266 (4.4%) |
| Total | 6,157 (100.0%) | 6,012 (100.0%) |
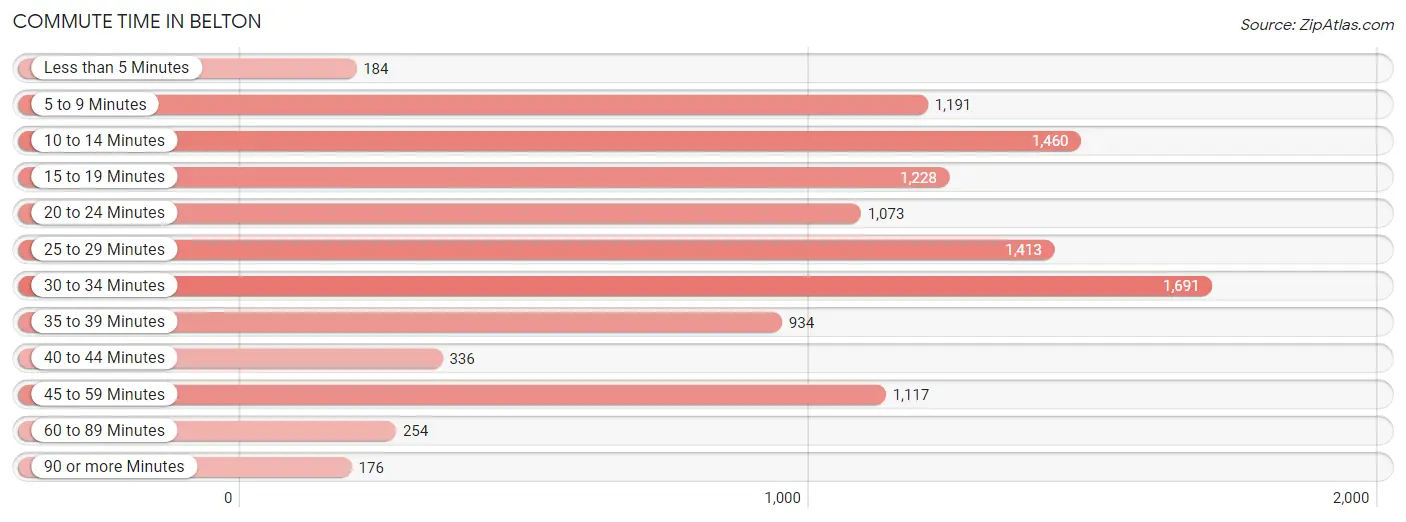
Commute Time in Belton
The most frequently occuring commute durations in Belton are 30 to 34 minutes (1,691 commuters, 15.3%), 10 to 14 minutes (1,460 commuters, 13.2%), and 25 to 29 minutes (1,413 commuters, 12.8%).
| Commute Time | # Commuters | % Commuters |
| Less than 5 Minutes | 184 | 1.7% |
| 5 to 9 Minutes | 1,191 | 10.8% |
| 10 to 14 Minutes | 1,460 | 13.2% |
| 15 to 19 Minutes | 1,228 | 11.1% |
| 20 to 24 Minutes | 1,073 | 9.7% |
| 25 to 29 Minutes | 1,413 | 12.8% |
| 30 to 34 Minutes | 1,691 | 15.3% |
| 35 to 39 Minutes | 934 | 8.5% |
| 40 to 44 Minutes | 336 | 3.0% |
| 45 to 59 Minutes | 1,117 | 10.1% |
| 60 to 89 Minutes | 254 | 2.3% |
| 90 or more Minutes | 176 | 1.6% |
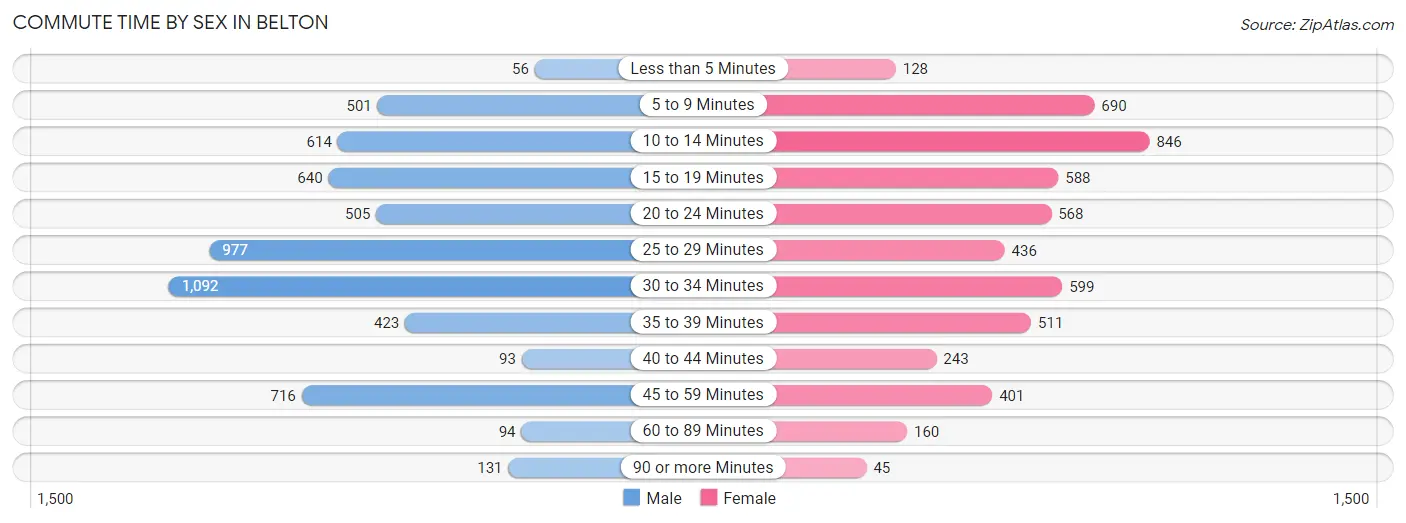
Commute Time by Sex in Belton
The most common commute times in Belton are 30 to 34 minutes (1,092 commuters, 18.7%) for males and 10 to 14 minutes (846 commuters, 16.2%) for females.
| Commute Time | Male | Female |
| Less than 5 Minutes | 56 (1.0%) | 128 (2.5%) |
| 5 to 9 Minutes | 501 (8.6%) | 690 (13.2%) |
| 10 to 14 Minutes | 614 (10.5%) | 846 (16.2%) |
| 15 to 19 Minutes | 640 (11.0%) | 588 (11.3%) |
| 20 to 24 Minutes | 505 (8.6%) | 568 (10.9%) |
| 25 to 29 Minutes | 977 (16.7%) | 436 (8.4%) |
| 30 to 34 Minutes | 1,092 (18.7%) | 599 (11.5%) |
| 35 to 39 Minutes | 423 (7.2%) | 511 (9.8%) |
| 40 to 44 Minutes | 93 (1.6%) | 243 (4.7%) |
| 45 to 59 Minutes | 716 (12.3%) | 401 (7.7%) |
| 60 to 89 Minutes | 94 (1.6%) | 160 (3.1%) |
| 90 or more Minutes | 131 (2.2%) | 45 (0.9%) |
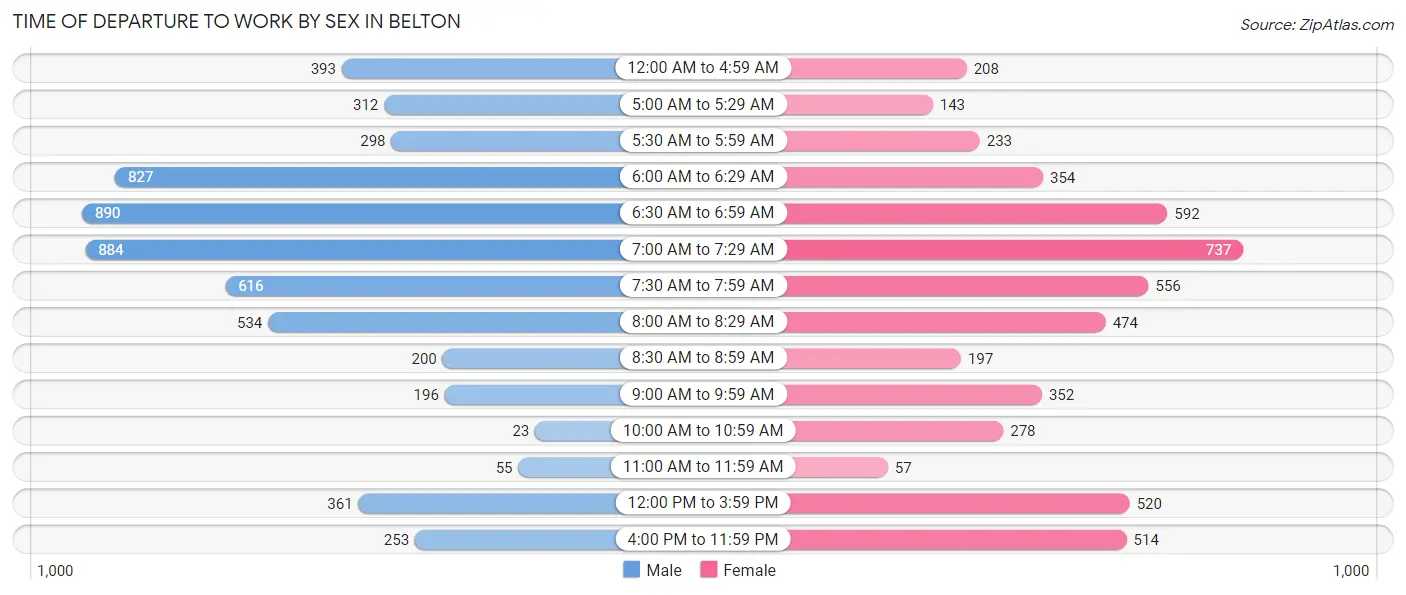
Time of Departure to Work by Sex in Belton
The most frequent times of departure to work in Belton are 6:30 AM to 6:59 AM (890, 15.2%) for males and 7:00 AM to 7:29 AM (737, 14.1%) for females.
| Time of Departure | Male | Female |
| 12:00 AM to 4:59 AM | 393 (6.7%) | 208 (4.0%) |
| 5:00 AM to 5:29 AM | 312 (5.3%) | 143 (2.7%) |
| 5:30 AM to 5:59 AM | 298 (5.1%) | 233 (4.5%) |
| 6:00 AM to 6:29 AM | 827 (14.2%) | 354 (6.8%) |
| 6:30 AM to 6:59 AM | 890 (15.2%) | 592 (11.4%) |
| 7:00 AM to 7:29 AM | 884 (15.1%) | 737 (14.1%) |
| 7:30 AM to 7:59 AM | 616 (10.5%) | 556 (10.7%) |
| 8:00 AM to 8:29 AM | 534 (9.1%) | 474 (9.1%) |
| 8:30 AM to 8:59 AM | 200 (3.4%) | 197 (3.8%) |
| 9:00 AM to 9:59 AM | 196 (3.4%) | 352 (6.8%) |
| 10:00 AM to 10:59 AM | 23 (0.4%) | 278 (5.3%) |
| 11:00 AM to 11:59 AM | 55 (0.9%) | 57 (1.1%) |
| 12:00 PM to 3:59 PM | 361 (6.2%) | 520 (10.0%) |
| 4:00 PM to 11:59 PM | 253 (4.3%) | 514 (9.9%) |
| Total | 5,842 (100.0%) | 5,215 (100.0%) |
Housing Occupancy in Belton
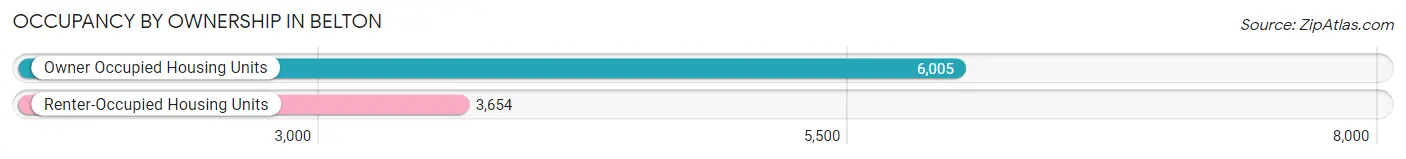
Occupancy by Ownership in Belton
Of the total 9,659 dwellings in Belton, owner-occupied units account for 6,005 (62.2%), while renter-occupied units make up 3,654 (37.8%).
| Occupancy | # Housing Units | % Housing Units |
| Owner Occupied Housing Units | 6,005 | 62.2% |
| Renter-Occupied Housing Units | 3,654 | 37.8% |
| Total Occupied Housing Units | 9,659 | 100.0% |
Occupancy by Household Size in Belton
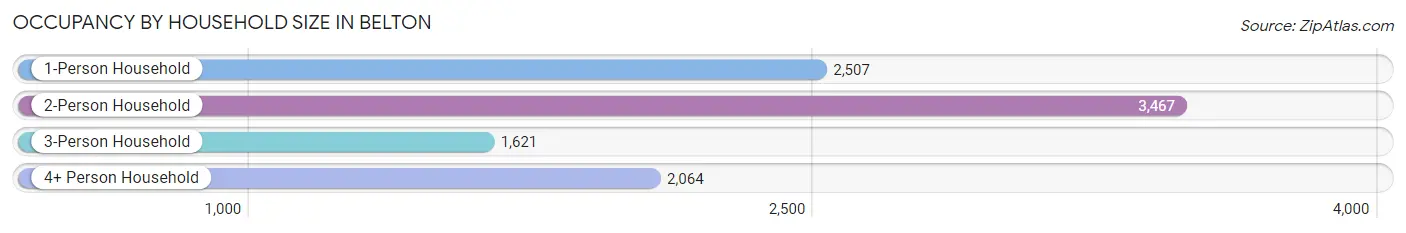
| Household Size | # Housing Units | % Housing Units |
| 1-Person Household | 2,507 | 26.0% |
| 2-Person Household | 3,467 | 35.9% |
| 3-Person Household | 1,621 | 16.8% |
| 4+ Person Household | 2,064 | 21.4% |
| Total Housing Units | 9,659 | 100.0% |
Occupancy by Ownership by Household Size in Belton
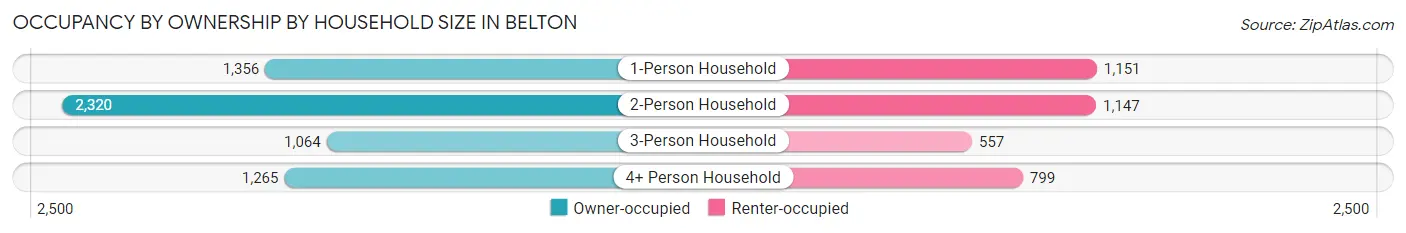
| Household Size | Owner-occupied | Renter-occupied |
| 1-Person Household | 1,356 (54.1%) | 1,151 (45.9%) |
| 2-Person Household | 2,320 (66.9%) | 1,147 (33.1%) |
| 3-Person Household | 1,064 (65.6%) | 557 (34.4%) |
| 4+ Person Household | 1,265 (61.3%) | 799 (38.7%) |
| Total Housing Units | 6,005 (62.2%) | 3,654 (37.8%) |
Occupancy by Educational Attainment in Belton
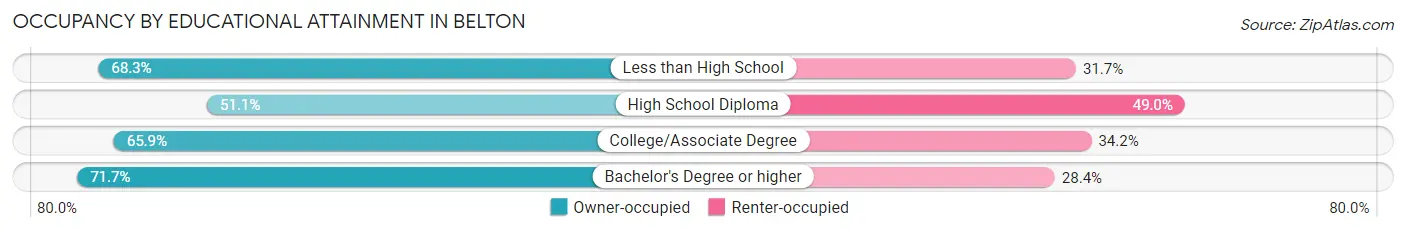
| Household Size | Owner-occupied | Renter-occupied |
| Less than High School | 295 (68.3%) | 137 (31.7%) |
| High School Diploma | 1,719 (51.0%) | 1,648 (48.9%) |
| College/Associate Degree | 2,358 (65.8%) | 1,223 (34.2%) |
| Bachelor's Degree or higher | 1,633 (71.7%) | 646 (28.3%) |
Occupancy by Age of Householder in Belton
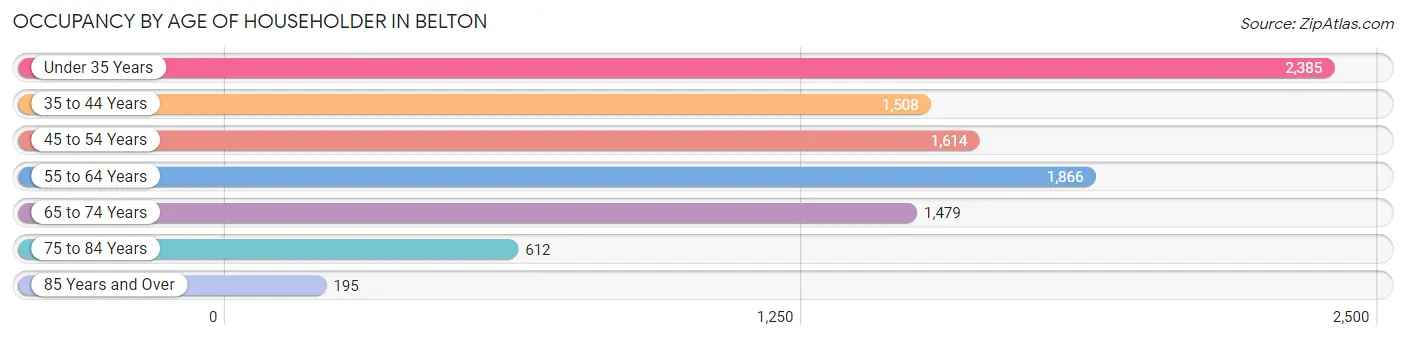
| Age Bracket | # Households | % Households |
| Under 35 Years | 2,385 | 24.7% |
| 35 to 44 Years | 1,508 | 15.6% |
| 45 to 54 Years | 1,614 | 16.7% |
| 55 to 64 Years | 1,866 | 19.3% |
| 65 to 74 Years | 1,479 | 15.3% |
| 75 to 84 Years | 612 | 6.3% |
| 85 Years and Over | 195 | 2.0% |
| Total | 9,659 | 100.0% |
Housing Finances in Belton
Median Income by Occupancy in Belton
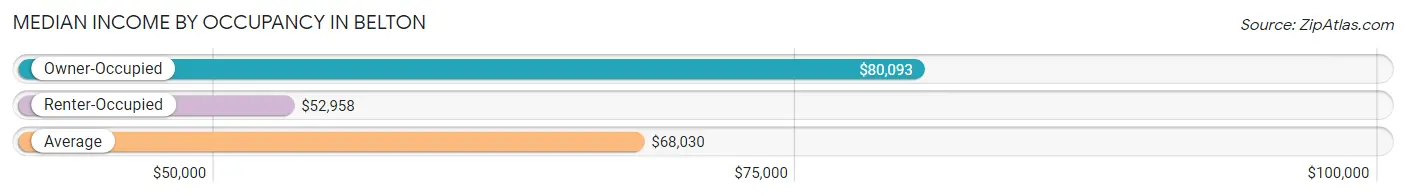
| Occupancy Type | # Households | Median Income |
| Owner-Occupied | 6,005 (62.2%) | $80,093 |
| Renter-Occupied | 3,654 (37.8%) | $52,958 |
| Average | 9,659 (100.0%) | $68,030 |
Occupancy by Householder Income Bracket in Belton
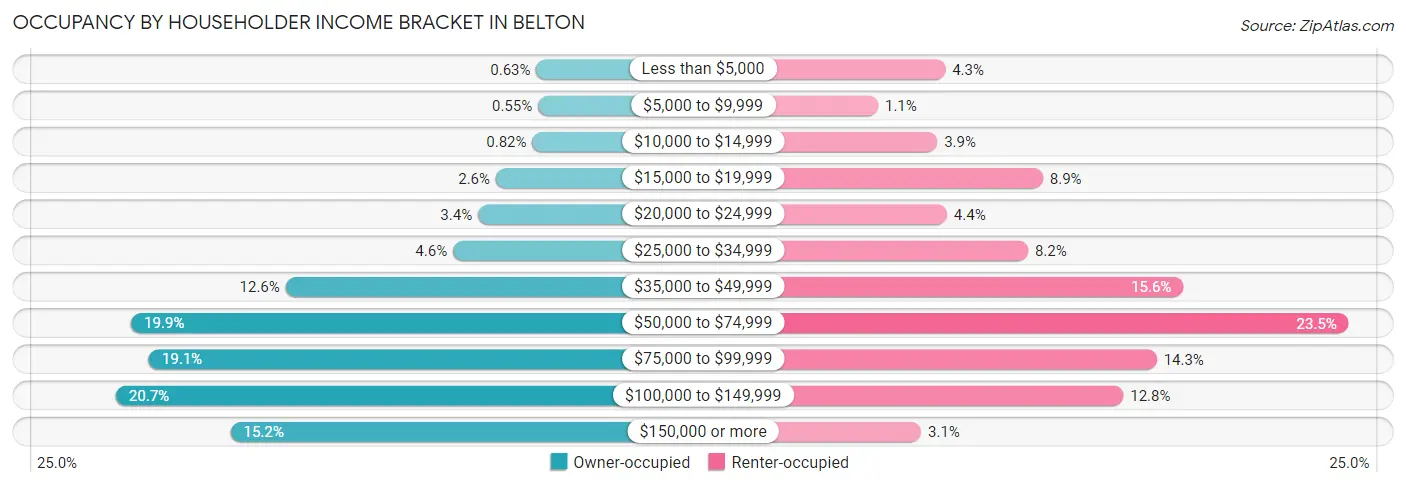
| Income Bracket | Owner-occupied | Renter-occupied |
| Less than $5,000 | 38 (0.6%) | 156 (4.3%) |
| $5,000 to $9,999 | 33 (0.5%) | 39 (1.1%) |
| $10,000 to $14,999 | 49 (0.8%) | 142 (3.9%) |
| $15,000 to $19,999 | 154 (2.6%) | 326 (8.9%) |
| $20,000 to $24,999 | 205 (3.4%) | 159 (4.3%) |
| $25,000 to $34,999 | 276 (4.6%) | 300 (8.2%) |
| $35,000 to $49,999 | 755 (12.6%) | 570 (15.6%) |
| $50,000 to $74,999 | 1,197 (19.9%) | 858 (23.5%) |
| $75,000 to $99,999 | 1,146 (19.1%) | 524 (14.3%) |
| $100,000 to $149,999 | 1,240 (20.6%) | 466 (12.8%) |
| $150,000 or more | 912 (15.2%) | 114 (3.1%) |
| Total | 6,005 (100.0%) | 3,654 (100.0%) |
Monthly Housing Cost Tiers in Belton
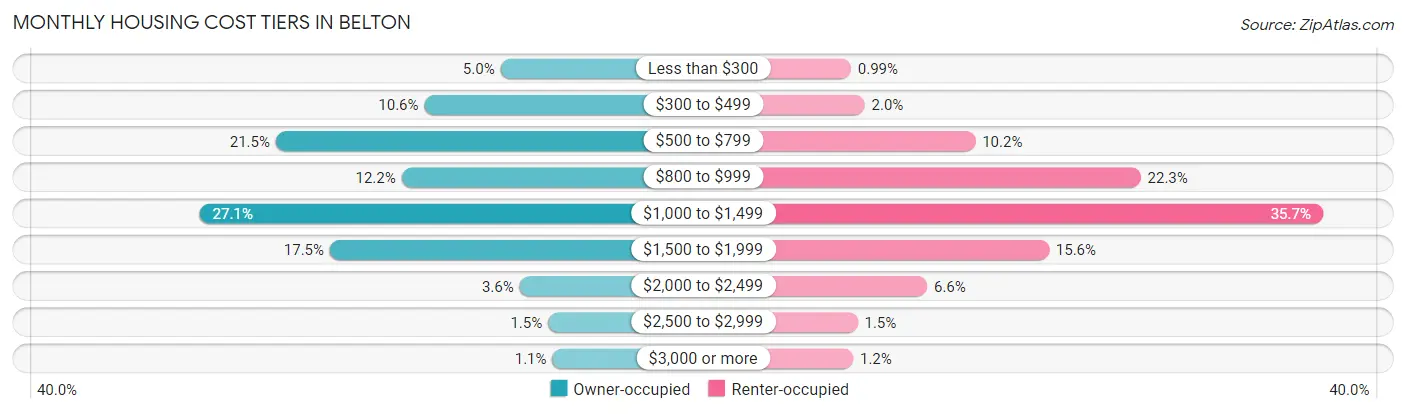
| Monthly Cost | Owner-occupied | Renter-occupied |
| Less than $300 | 297 (5.0%) | 36 (1.0%) |
| $300 to $499 | 634 (10.6%) | 73 (2.0%) |
| $500 to $799 | 1,291 (21.5%) | 371 (10.2%) |
| $800 to $999 | 735 (12.2%) | 816 (22.3%) |
| $1,000 to $1,499 | 1,628 (27.1%) | 1,306 (35.7%) |
| $1,500 to $1,999 | 1,052 (17.5%) | 569 (15.6%) |
| $2,000 to $2,499 | 213 (3.5%) | 241 (6.6%) |
| $2,500 to $2,999 | 87 (1.5%) | 54 (1.5%) |
| $3,000 or more | 68 (1.1%) | 42 (1.1%) |
| Total | 6,005 (100.0%) | 3,654 (100.0%) |
Physical Housing Characteristics in Belton
Housing Structures in Belton
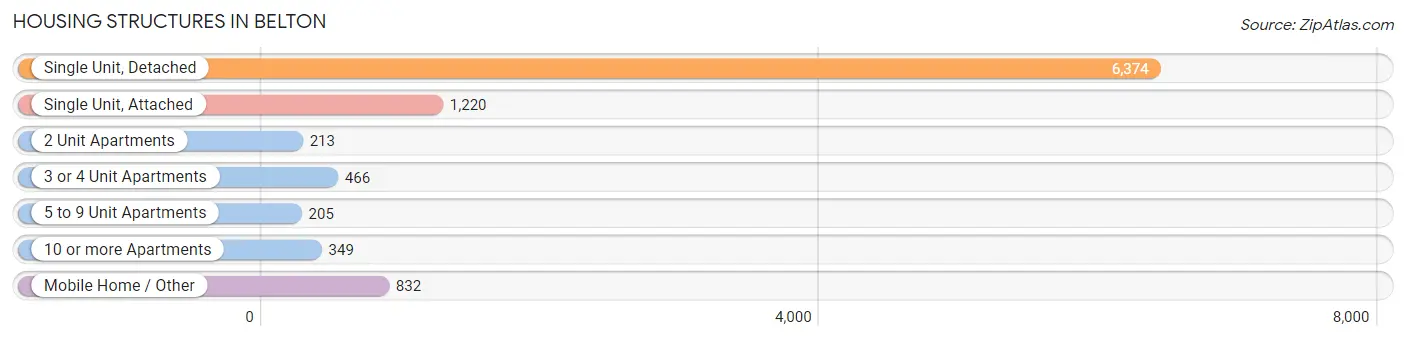
| Structure Type | # Housing Units | % Housing Units |
| Single Unit, Detached | 6,374 | 66.0% |
| Single Unit, Attached | 1,220 | 12.6% |
| 2 Unit Apartments | 213 | 2.2% |
| 3 or 4 Unit Apartments | 466 | 4.8% |
| 5 to 9 Unit Apartments | 205 | 2.1% |
| 10 or more Apartments | 349 | 3.6% |
| Mobile Home / Other | 832 | 8.6% |
| Total | 9,659 | 100.0% |
Housing Structures by Occupancy in Belton
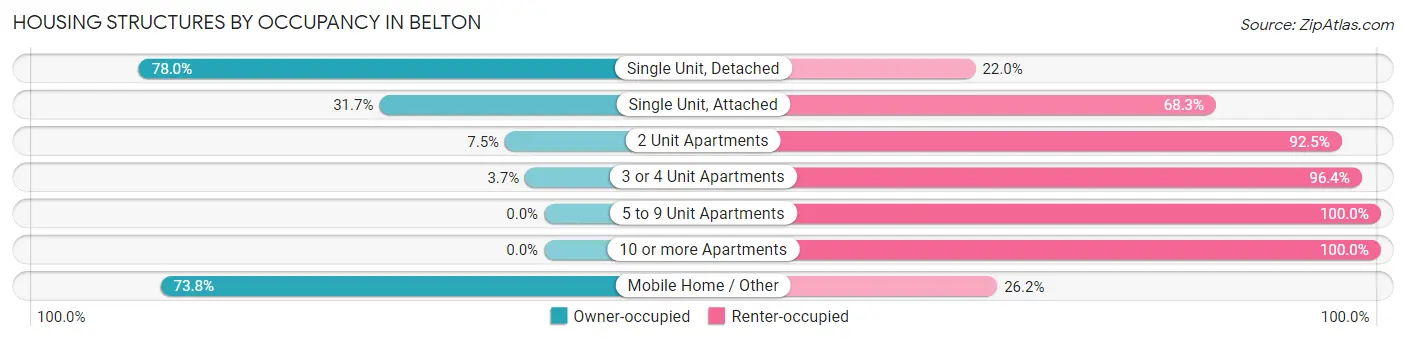
| Structure Type | Owner-occupied | Renter-occupied |
| Single Unit, Detached | 4,971 (78.0%) | 1,403 (22.0%) |
| Single Unit, Attached | 387 (31.7%) | 833 (68.3%) |
| 2 Unit Apartments | 16 (7.5%) | 197 (92.5%) |
| 3 or 4 Unit Apartments | 17 (3.6%) | 449 (96.4%) |
| 5 to 9 Unit Apartments | 0 (0.0%) | 205 (100.0%) |
| 10 or more Apartments | 0 (0.0%) | 349 (100.0%) |
| Mobile Home / Other | 614 (73.8%) | 218 (26.2%) |
| Total | 6,005 (62.2%) | 3,654 (37.8%) |
Housing Structures by Number of Rooms in Belton
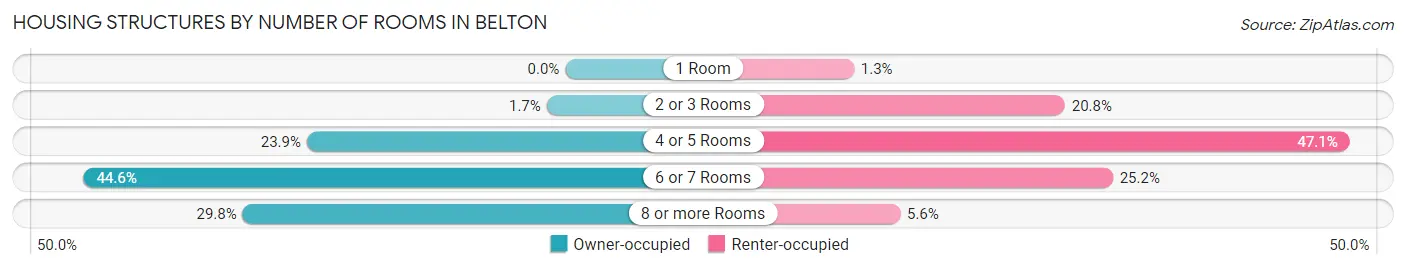
| Number of Rooms | Owner-occupied | Renter-occupied |
| 1 Room | 0 (0.0%) | 47 (1.3%) |
| 2 or 3 Rooms | 103 (1.7%) | 760 (20.8%) |
| 4 or 5 Rooms | 1,435 (23.9%) | 1,722 (47.1%) |
| 6 or 7 Rooms | 2,675 (44.6%) | 922 (25.2%) |
| 8 or more Rooms | 1,792 (29.8%) | 203 (5.6%) |
| Total | 6,005 (100.0%) | 3,654 (100.0%) |
Housing Structure by Heating Type in Belton
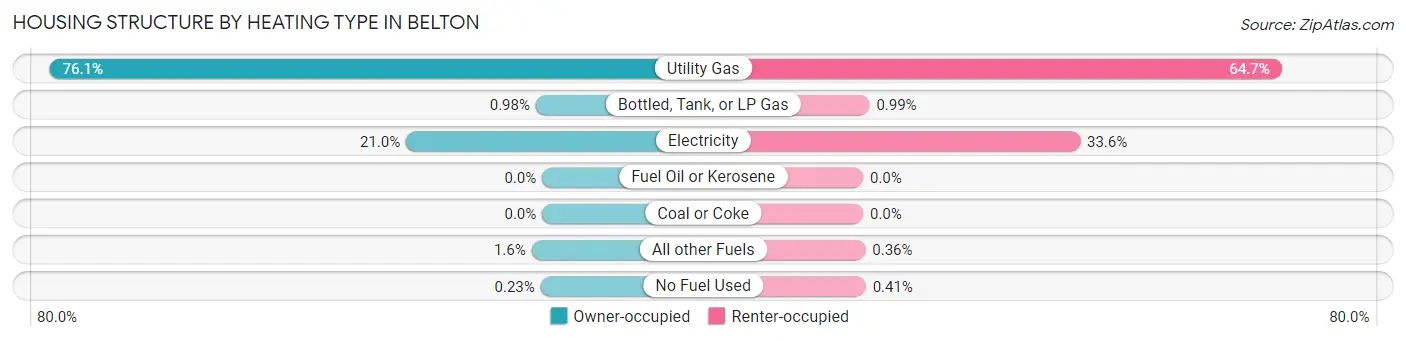
| Heating Type | Owner-occupied | Renter-occupied |
| Utility Gas | 4,571 (76.1%) | 2,364 (64.7%) |
| Bottled, Tank, or LP Gas | 59 (1.0%) | 36 (1.0%) |
| Electricity | 1,263 (21.0%) | 1,226 (33.6%) |
| Fuel Oil or Kerosene | 0 (0.0%) | 0 (0.0%) |
| Coal or Coke | 0 (0.0%) | 0 (0.0%) |
| All other Fuels | 98 (1.6%) | 13 (0.4%) |
| No Fuel Used | 14 (0.2%) | 15 (0.4%) |
| Total | 6,005 (100.0%) | 3,654 (100.0%) |
Household Vehicle Usage in Belton
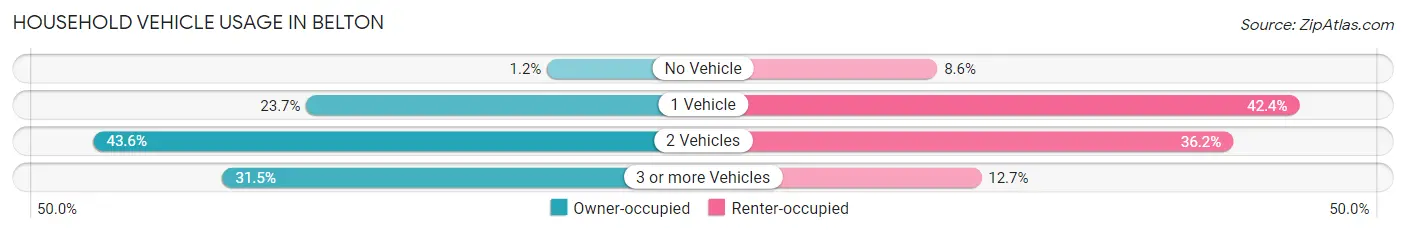
| Vehicles per Household | Owner-occupied | Renter-occupied |
| No Vehicle | 73 (1.2%) | 315 (8.6%) |
| 1 Vehicle | 1,423 (23.7%) | 1,550 (42.4%) |
| 2 Vehicles | 2,616 (43.6%) | 1,324 (36.2%) |
| 3 or more Vehicles | 1,893 (31.5%) | 465 (12.7%) |
| Total | 6,005 (100.0%) | 3,654 (100.0%) |
Real Estate & Mortgages in Belton
Real Estate and Mortgage Overview in Belton
| Characteristic | Without Mortgage | With Mortgage |
| Housing Units | 2,269 | 3,736 |
| Median Property Value | $164,300 | $180,100 |
| Median Household Income | $74,769 | $699 |
| Monthly Housing Costs | $580 | $43 |
| Real Estate Taxes | $1,839 | $239 |
Property Value by Mortgage Status in Belton
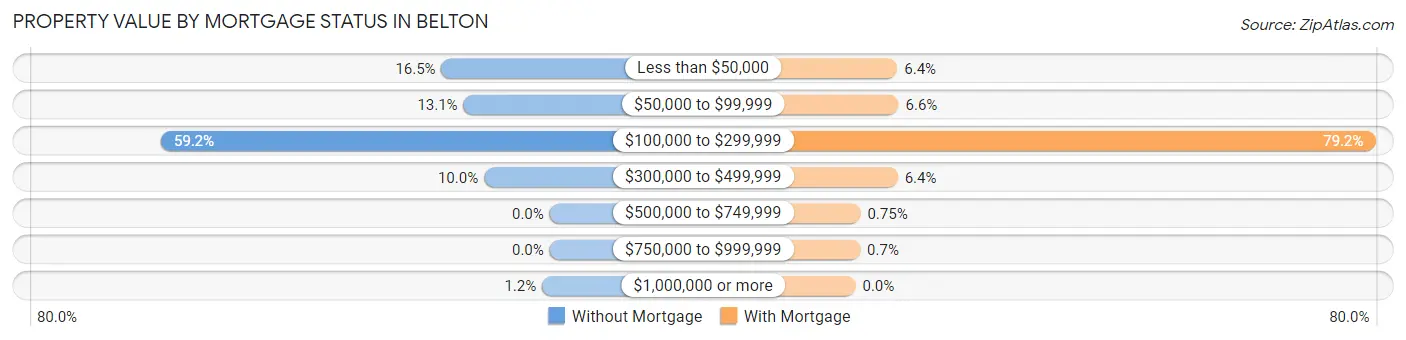
| Property Value | Without Mortgage | With Mortgage |
| Less than $50,000 | 374 (16.5%) | 238 (6.4%) |
| $50,000 to $99,999 | 298 (13.1%) | 245 (6.6%) |
| $100,000 to $299,999 | 1,344 (59.2%) | 2,959 (79.2%) |
| $300,000 to $499,999 | 227 (10.0%) | 240 (6.4%) |
| $500,000 to $749,999 | 0 (0.0%) | 28 (0.7%) |
| $750,000 to $999,999 | 0 (0.0%) | 26 (0.7%) |
| $1,000,000 or more | 26 (1.1%) | 0 (0.0%) |
| Total | 2,269 (100.0%) | 3,736 (100.0%) |
Household Income by Mortgage Status in Belton
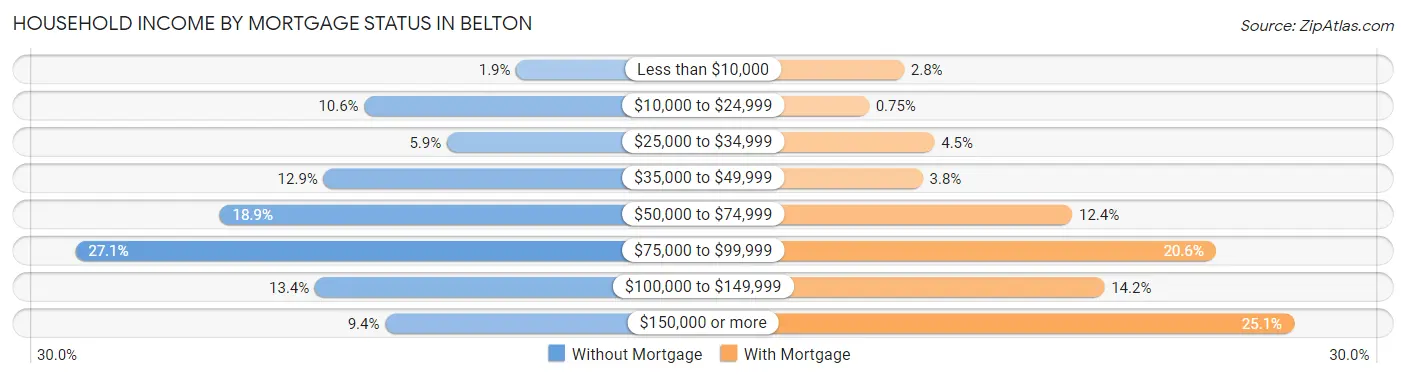
| Household Income | Without Mortgage | With Mortgage |
| Less than $10,000 | 43 (1.9%) | 103 (2.8%) |
| $10,000 to $24,999 | 240 (10.6%) | 28 (0.7%) |
| $25,000 to $34,999 | 133 (5.9%) | 168 (4.5%) |
| $35,000 to $49,999 | 293 (12.9%) | 143 (3.8%) |
| $50,000 to $74,999 | 428 (18.9%) | 462 (12.4%) |
| $75,000 to $99,999 | 615 (27.1%) | 769 (20.6%) |
| $100,000 to $149,999 | 304 (13.4%) | 531 (14.2%) |
| $150,000 or more | 213 (9.4%) | 936 (25.1%) |
| Total | 2,269 (100.0%) | 3,736 (100.0%) |
Property Value to Household Income Ratio in Belton
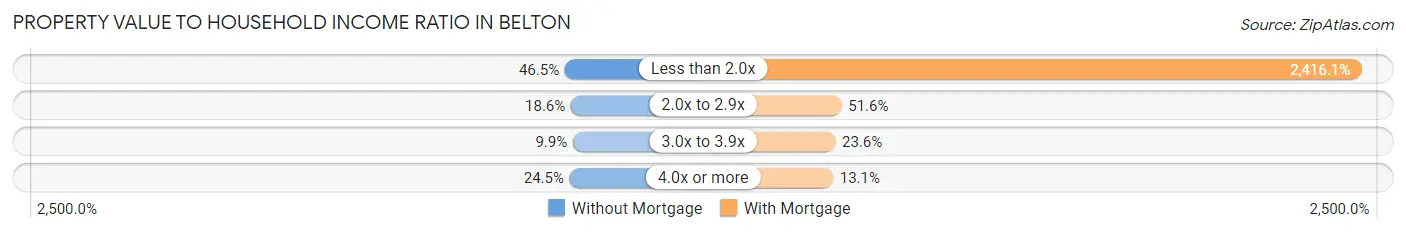
| Value-to-Income Ratio | Without Mortgage | With Mortgage |
| Less than 2.0x | 1,055 (46.5%) | 90,265 (2,416.1%) |
| 2.0x to 2.9x | 421 (18.5%) | 1,928 (51.6%) |
| 3.0x to 3.9x | 224 (9.9%) | 882 (23.6%) |
| 4.0x or more | 556 (24.5%) | 488 (13.1%) |
| Total | 2,269 (100.0%) | 3,736 (100.0%) |
Real Estate Taxes by Mortgage Status in Belton
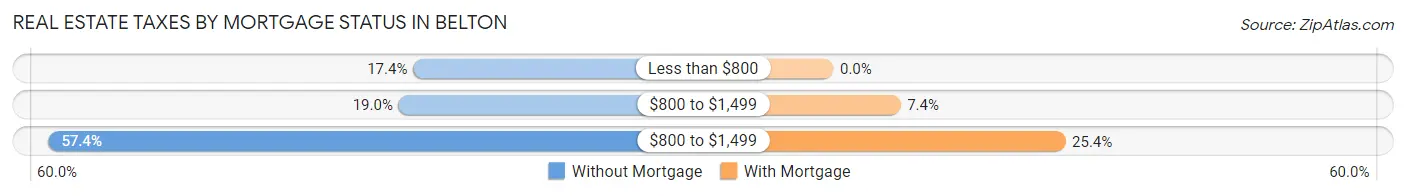
| Property Taxes | Without Mortgage | With Mortgage |
| Less than $800 | 395 (17.4%) | 0 (0.0%) |
| $800 to $1,499 | 431 (19.0%) | 275 (7.4%) |
| $800 to $1,499 | 1,302 (57.4%) | 950 (25.4%) |
| Total | 2,269 (100.0%) | 3,736 (100.0%) |
Health & Disability in Belton
Health Insurance Coverage by Age in Belton
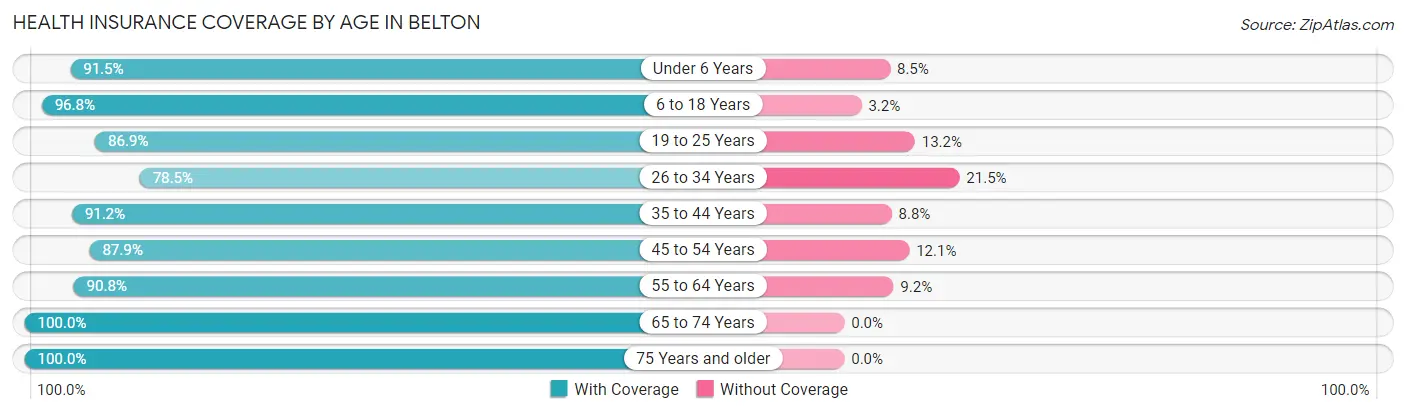
| Age Bracket | With Coverage | Without Coverage |
| Under 6 Years | 1,898 (91.5%) | 177 (8.5%) |
| 6 to 18 Years | 4,060 (96.8%) | 134 (3.2%) |
| 19 to 25 Years | 1,816 (86.9%) | 275 (13.2%) |
| 26 to 34 Years | 2,699 (78.5%) | 738 (21.5%) |
| 35 to 44 Years | 2,885 (91.2%) | 279 (8.8%) |
| 45 to 54 Years | 2,374 (87.9%) | 327 (12.1%) |
| 55 to 64 Years | 2,815 (90.8%) | 284 (9.2%) |
| 65 to 74 Years | 2,101 (100.0%) | 0 (0.0%) |
| 75 Years and older | 1,210 (100.0%) | 0 (0.0%) |
| Total | 21,858 (90.8%) | 2,214 (9.2%) |
Health Insurance Coverage by Citizenship Status in Belton
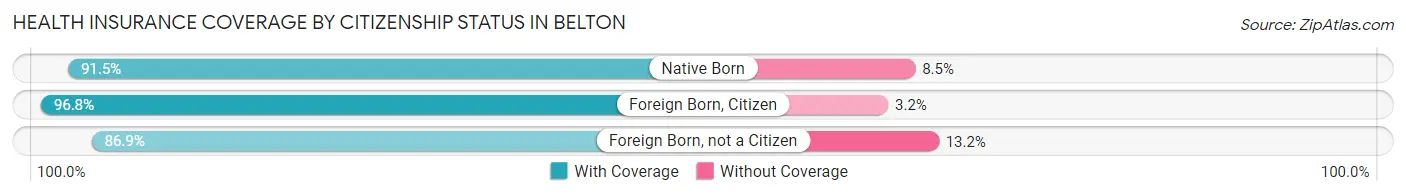
| Citizenship Status | With Coverage | Without Coverage |
| Native Born | 1,898 (91.5%) | 177 (8.5%) |
| Foreign Born, Citizen | 4,060 (96.8%) | 134 (3.2%) |
| Foreign Born, not a Citizen | 1,816 (86.9%) | 275 (13.2%) |
Health Insurance Coverage by Household Income in Belton
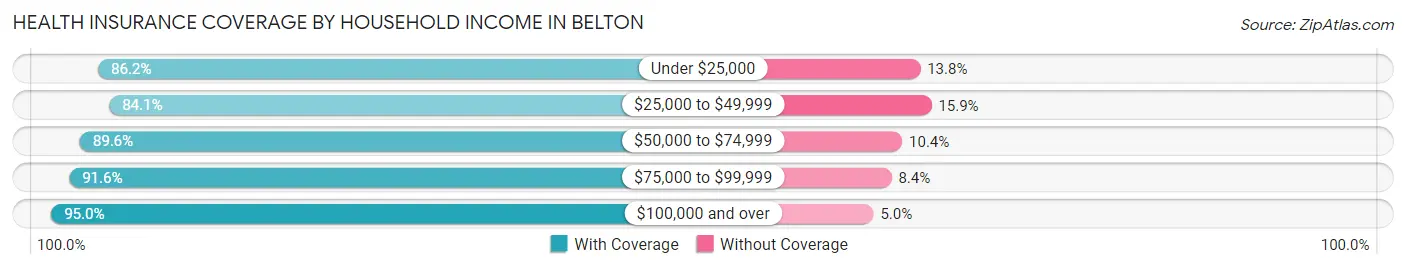
| Household Income | With Coverage | Without Coverage |
| Under $25,000 | 1,961 (86.2%) | 313 (13.8%) |
| $25,000 to $49,999 | 3,172 (84.1%) | 598 (15.9%) |
| $50,000 to $74,999 | 3,987 (89.6%) | 461 (10.4%) |
| $75,000 to $99,999 | 4,433 (91.6%) | 405 (8.4%) |
| $100,000 and over | 8,289 (95.0%) | 436 (5.0%) |
Public vs Private Health Insurance Coverage by Age in Belton
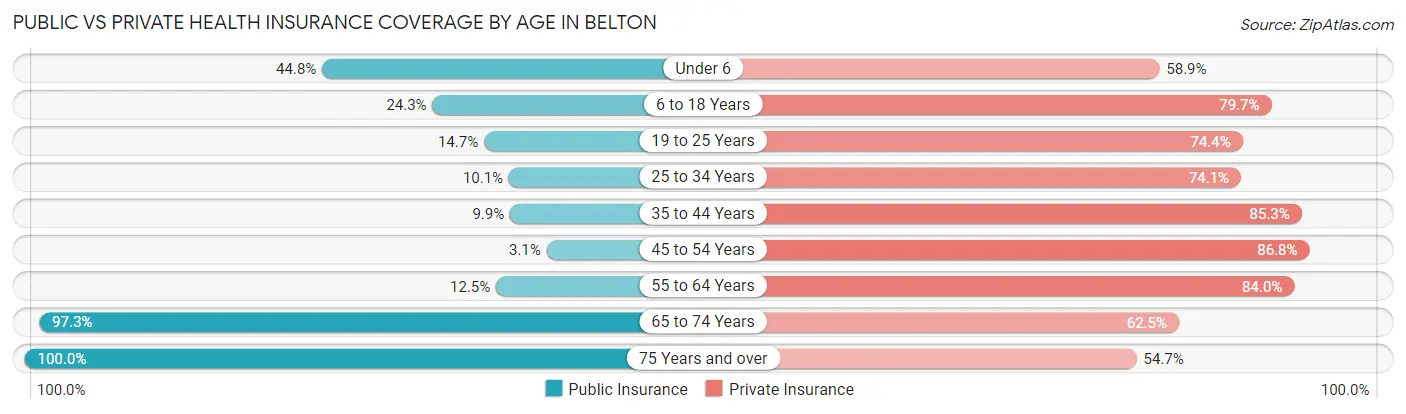
| Age Bracket | Public Insurance | Private Insurance |
| Under 6 | 929 (44.8%) | 1,223 (58.9%) |
| 6 to 18 Years | 1,019 (24.3%) | 3,343 (79.7%) |
| 19 to 25 Years | 308 (14.7%) | 1,555 (74.4%) |
| 25 to 34 Years | 347 (10.1%) | 2,546 (74.1%) |
| 35 to 44 Years | 313 (9.9%) | 2,700 (85.3%) |
| 45 to 54 Years | 84 (3.1%) | 2,344 (86.8%) |
| 55 to 64 Years | 387 (12.5%) | 2,602 (84.0%) |
| 65 to 74 Years | 2,044 (97.3%) | 1,314 (62.5%) |
| 75 Years and over | 1,210 (100.0%) | 662 (54.7%) |
| Total | 6,641 (27.6%) | 18,289 (76.0%) |
Disability Status by Sex by Age in Belton
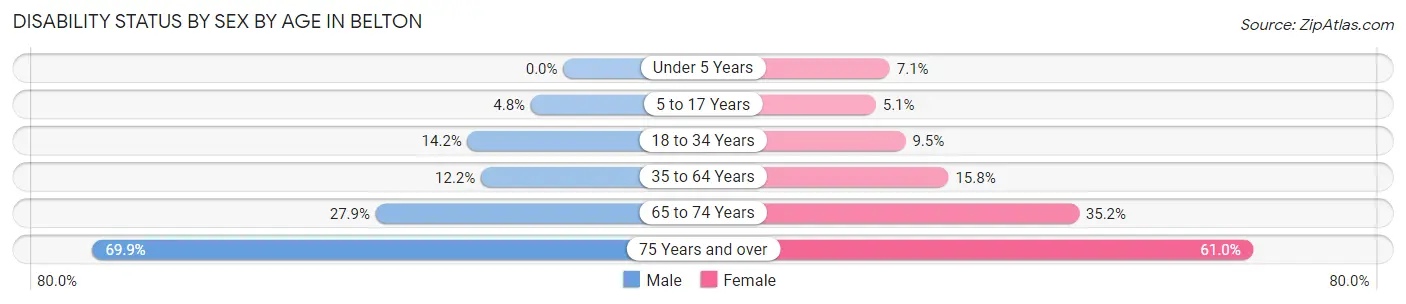
| Age Bracket | Male | Female |
| Under 5 Years | 0 (0.0%) | 63 (7.1%) |
| 5 to 17 Years | 90 (4.8%) | 117 (5.1%) |
| 18 to 34 Years | 402 (14.2%) | 275 (9.5%) |
| 35 to 64 Years | 507 (12.2%) | 762 (15.8%) |
| 65 to 74 Years | 252 (27.9%) | 421 (35.2%) |
| 75 Years and over | 344 (69.9%) | 438 (61.0%) |
Disability Class by Sex by Age in Belton
Disability Class: Hearing Difficulty
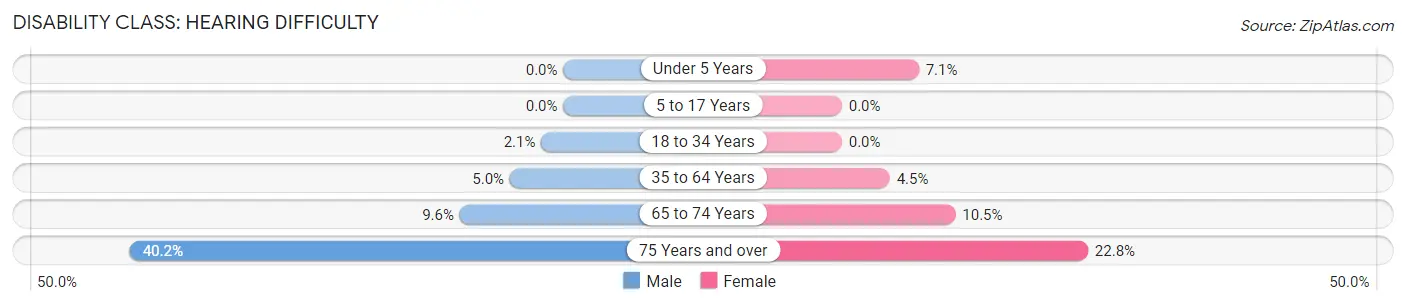
| Age Bracket | Male | Female |
| Under 5 Years | 0 (0.0%) | 63 (7.1%) |
| 5 to 17 Years | 0 (0.0%) | 0 (0.0%) |
| 18 to 34 Years | 58 (2.1%) | 0 (0.0%) |
| 35 to 64 Years | 206 (5.0%) | 214 (4.4%) |
| 65 to 74 Years | 87 (9.6%) | 126 (10.5%) |
| 75 Years and over | 198 (40.2%) | 164 (22.8%) |
Disability Class: Vision Difficulty
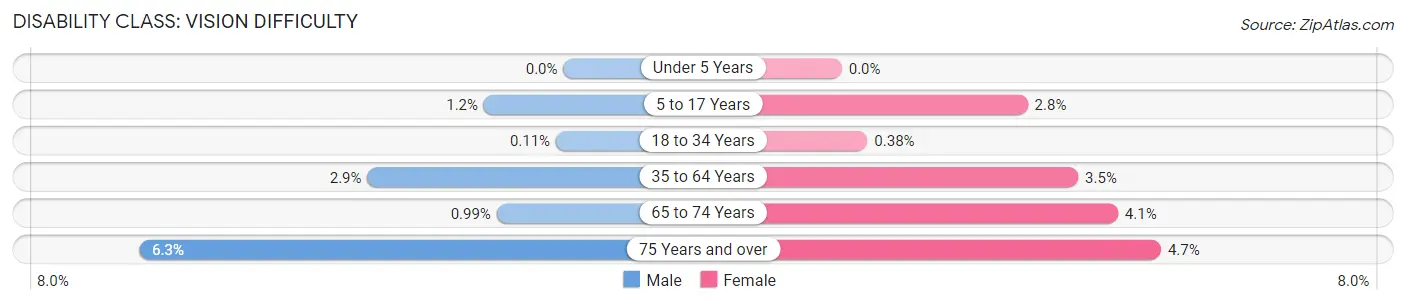
| Age Bracket | Male | Female |
| Under 5 Years | 0 (0.0%) | 0 (0.0%) |
| 5 to 17 Years | 22 (1.2%) | 64 (2.8%) |
| 18 to 34 Years | 3 (0.1%) | 11 (0.4%) |
| 35 to 64 Years | 121 (2.9%) | 169 (3.5%) |
| 65 to 74 Years | 9 (1.0%) | 49 (4.1%) |
| 75 Years and over | 31 (6.3%) | 34 (4.7%) |
Disability Class: Cognitive Difficulty
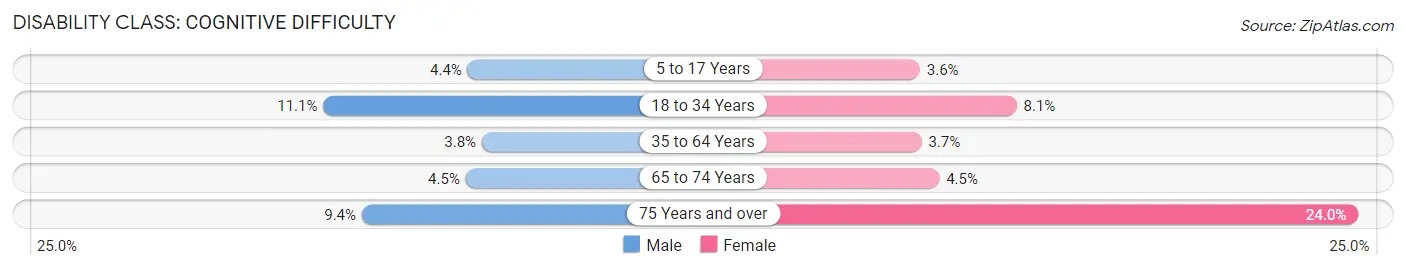
| Age Bracket | Male | Female |
| 5 to 17 Years | 83 (4.4%) | 84 (3.6%) |
| 18 to 34 Years | 315 (11.1%) | 236 (8.1%) |
| 35 to 64 Years | 157 (3.8%) | 178 (3.7%) |
| 65 to 74 Years | 41 (4.5%) | 54 (4.5%) |
| 75 Years and over | 46 (9.3%) | 172 (24.0%) |
Disability Class: Ambulatory Difficulty
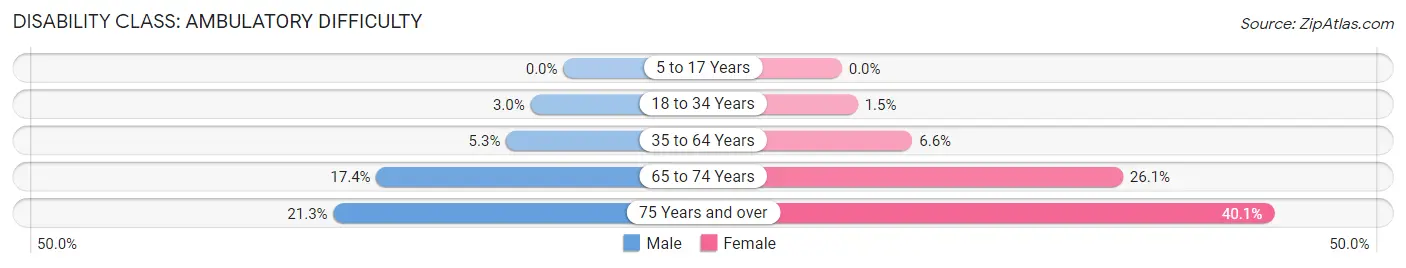
| Age Bracket | Male | Female |
| 5 to 17 Years | 0 (0.0%) | 0 (0.0%) |
| 18 to 34 Years | 86 (3.0%) | 43 (1.5%) |
| 35 to 64 Years | 220 (5.3%) | 315 (6.6%) |
| 65 to 74 Years | 157 (17.3%) | 312 (26.1%) |
| 75 Years and over | 105 (21.3%) | 288 (40.1%) |
Disability Class: Self-Care Difficulty
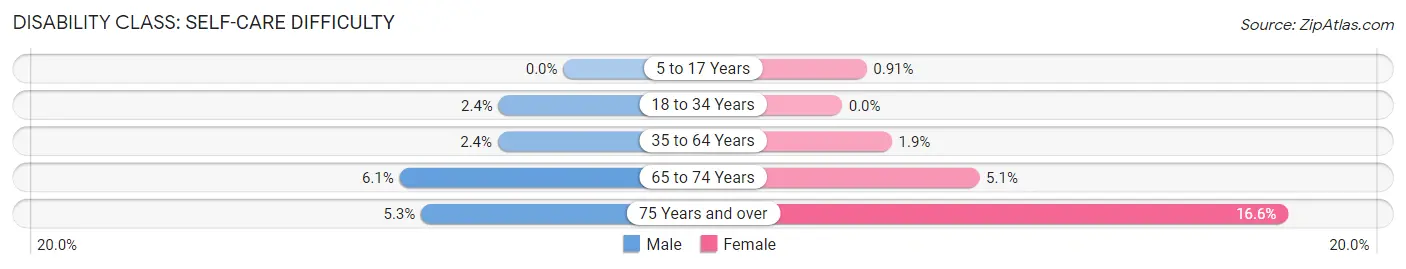
| Age Bracket | Male | Female |
| 5 to 17 Years | 0 (0.0%) | 21 (0.9%) |
| 18 to 34 Years | 68 (2.4%) | 0 (0.0%) |
| 35 to 64 Years | 101 (2.4%) | 89 (1.8%) |
| 65 to 74 Years | 55 (6.1%) | 61 (5.1%) |
| 75 Years and over | 26 (5.3%) | 119 (16.6%) |
Technology Access in Belton
Computing Device Access in Belton
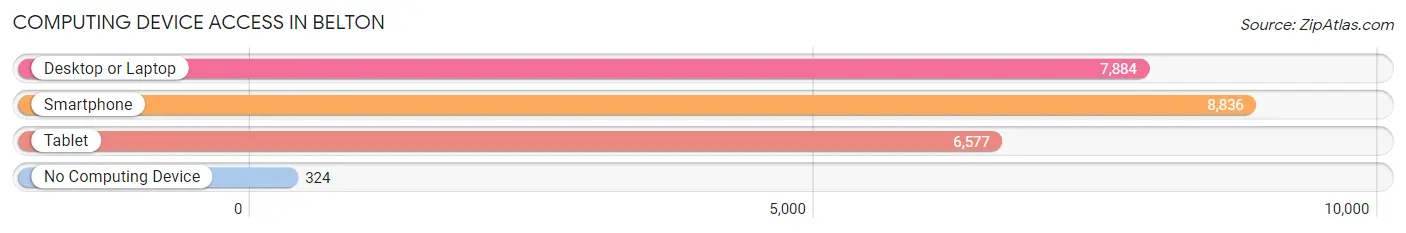
| Device Type | # Households | % Households |
| Desktop or Laptop | 7,884 | 81.6% |
| Smartphone | 8,836 | 91.5% |
| Tablet | 6,577 | 68.1% |
| No Computing Device | 324 | 3.4% |
| Total | 9,659 | 100.0% |
Internet Access in Belton
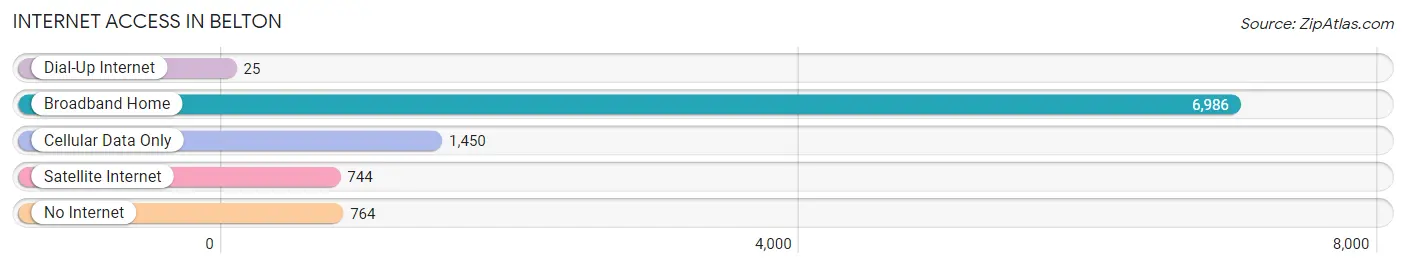
| Internet Type | # Households | % Households |
| Dial-Up Internet | 25 | 0.3% |
| Broadband Home | 6,986 | 72.3% |
| Cellular Data Only | 1,450 | 15.0% |
| Satellite Internet | 744 | 7.7% |
| No Internet | 764 | 7.9% |
| Total | 9,659 | 100.0% |
Belton Summary
Belton, Missouri is a city located in Cass County, Missouri, United States. It is part of the Kansas City metropolitan area. The population was estimated to be 23,943 in 2019. Belton is located in the heart of the Midwest, just south of Kansas City, Missouri.
History
Belton was founded in 1871 by William B. Strang Jr., a prominent local businessman. The city was named after Strang's hometown of Belton, South Carolina. The city was incorporated in 1872 and has since grown to become a thriving community.
Belton was the site of a major Civil War battle in 1862, when Union forces under General Samuel R. Curtis defeated Confederate forces under General Sterling Price. The battle was known as the Battle of Belton.
Geography
Belton is located at 38°48'N 94°25'W (38.80, -94.42). It is situated in the rolling hills of western Missouri, about 25 miles south of Kansas City. The city is located in the Missouri River Valley, and is surrounded by farmland and wooded areas.
The city has a total area of 11.2 square miles, of which 11.1 square miles is land and 0.1 square miles is water.
Economy
Belton's economy is largely based on agriculture and manufacturing. The city is home to several large companies, including Tyson Foods, Inc., which has a large poultry processing plant in the city. Other major employers include the Belton School District, the Belton Regional Medical Center, and the Belton Regional Airport.
The city also has a vibrant retail sector, with several shopping centers and malls located in the city.
Demographics
As of the 2010 census, Belton had a population of 23,116. The racial makeup of the city was 87.2% White, 8.2% African American, 0.5% Native American, 1.2% Asian, 0.1% Pacific Islander, 1.2% from other races, and 1.7% from two or more races. Hispanic or Latino of any race were 3.3% of the population.
Belton is a diverse city, with a variety of religious denominations represented. The largest religious group is the Catholic Church, followed by the United Methodist Church, the Church of Jesus Christ of Latter-day Saints, and the Assemblies of God.
Belton is served by the Belton School District, which consists of seven elementary schools, two middle schools, and one high school. The district also operates a virtual academy for students in grades K-12.
Belton is also home to several higher education institutions, including the University of Central Missouri, Missouri Western State University, and the University of Missouri-Kansas City.
Conclusion
Belton, Missouri is a vibrant city located in the heart of the Midwest. It is home to a diverse population and a thriving economy. The city is known for its rich history, its agricultural and manufacturing industries, and its excellent educational opportunities. Belton is a great place to live, work, and raise a family.
Common Questions
What is Per Capita Income in Belton?
Per Capita income in Belton is $33,830.
What is the Median Family Income in Belton?
Median Family Income in Belton is $79,387.
What is the Median Household income in Belton?
Median Household Income in Belton is $68,030.
What is Income or Wage Gap in Belton?
Income or Wage Gap in Belton is 30.6%.
Women in Belton earn 69.4 cents for every dollar earned by a man.
What is Family Income Deficit in Belton?
Family Income Deficit in Belton is $11,154.
Families that are below poverty line in Belton earn $11,154 less on average than the poverty threshold level.
What is Inequality or Gini Index in Belton?
Inequality or Gini Index in Belton is 0.39.
What is the Total Population of Belton?
Total Population of Belton is 24,241.
What is the Total Male Population of Belton?
Total Male Population of Belton is 11,319.
What is the Total Female Population of Belton?
Total Female Population of Belton is 12,922.
What is the Ratio of Males per 100 Females in Belton?
There are 87.59 Males per 100 Females in Belton.
What is the Ratio of Females per 100 Males in Belton?
There are 114.16 Females per 100 Males in Belton.
What is the Median Population Age in Belton?
Median Population Age in Belton is 35.7 Years.
What is the Average Family Size in Belton
Average Family Size in Belton is 2.9 People.
What is the Average Household Size in Belton
Average Household Size in Belton is 2.5 People.
How Large is the Labor Force in Belton?
There are 12,993 People in the Labor Forcein in Belton.
What is the Percentage of People in the Labor Force in Belton?
69.2% of People are in the Labor Force in Belton.
What is the Unemployment Rate in Belton?
Unemployment Rate in Belton is 5.4%.