Area Code 417 Map & Demographics
Area Code 417 Map
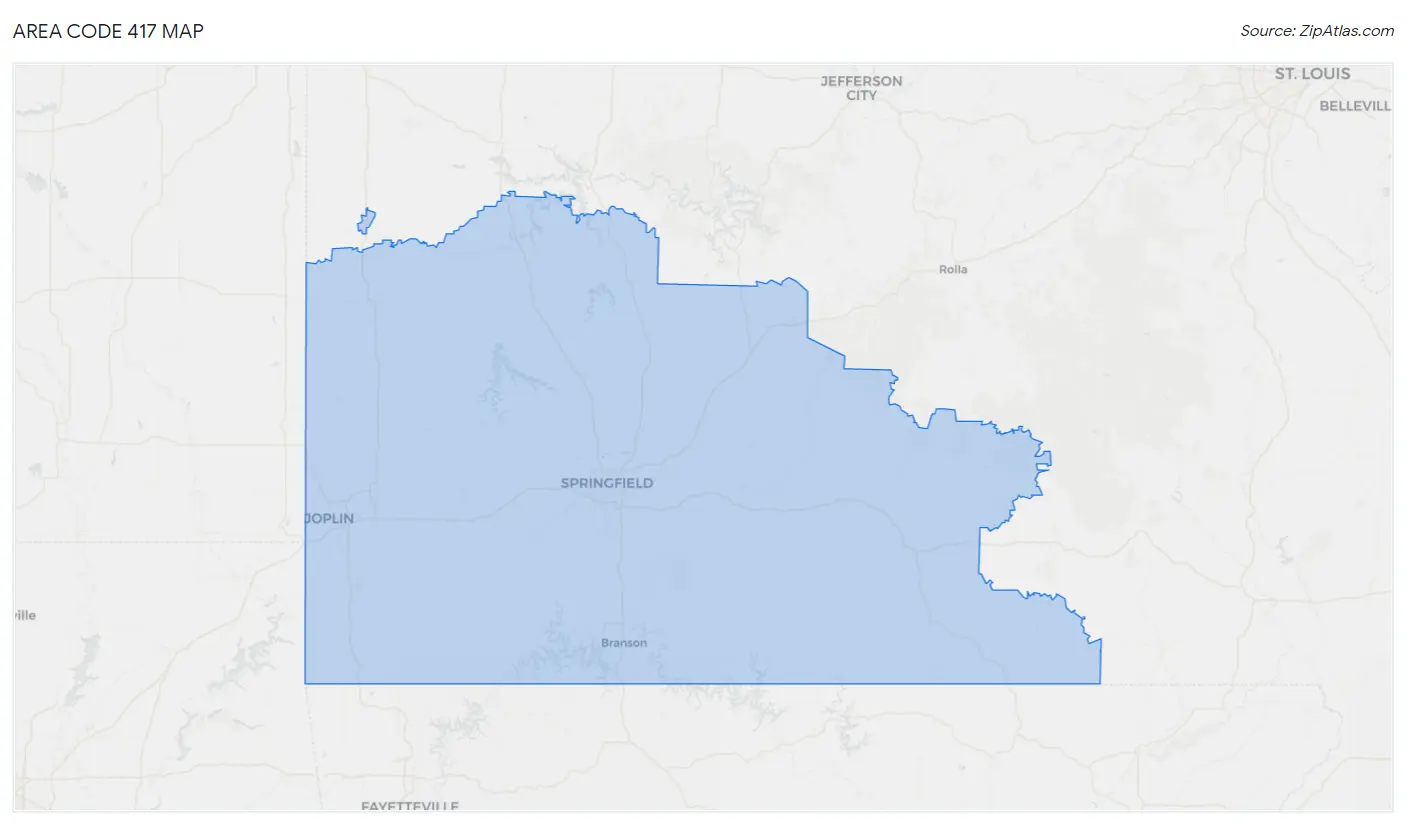
Area Code 417 Overview
$28,199
PER CAPITA INCOME
$66,161
AVG FAMILY INCOME
$54,364
AVG HOUSEHOLD INCOME
30.3%
WAGE / INCOME GAP [ % ]
69.7¢/ $1
WAGE / INCOME GAP [ $ ]
$9,969
FAMILY INCOME DEFICIT
88.62
INEQUALITY / GINI INDEX
1,048,519
TOTAL POPULATION
518,737
MALE POPULATION
529,782
FEMALE POPULATION
97.92
MALES / 100 FEMALES
102.13
FEMALES / 100 MALES
44.3
MEDIAN AGE
3.1
AVG FAMILY SIZE
2.6
AVG HOUSEHOLD SIZE
454,952
LABOR FORCE [ PEOPLE ]
54.3%
PERCENT IN LABOR FORCE
6.5%
UNEMPLOYMENT RATE
Income in Area Code 417
Income Overview in Area Code 417
Per Capita Income in Area Code 417 is $28,199, while median incomes of families and households are $66,161 and $54,364 respectively.
| Characteristic | Number | Measure |
| Per Capita Income | 1,048,519 | $28,199 |
| Median Family Income | 268,497 | $66,161 |
| Mean Family Income | 268,497 | $16,740,245 |
| Median Household Income | 416,944 | $54,364 |
| Mean Household Income | 416,944 | $14,546,838 |
| Income Deficit | 268,497 | $9,969 |
| Wage / Income Gap (%) | 1,048,519 | 30.26% |
| Wage / Income Gap ($) | 1,048,519 | 69.74¢ per $1 |
| Gini / Inequality Index | 1,048,519 | 88.62 |
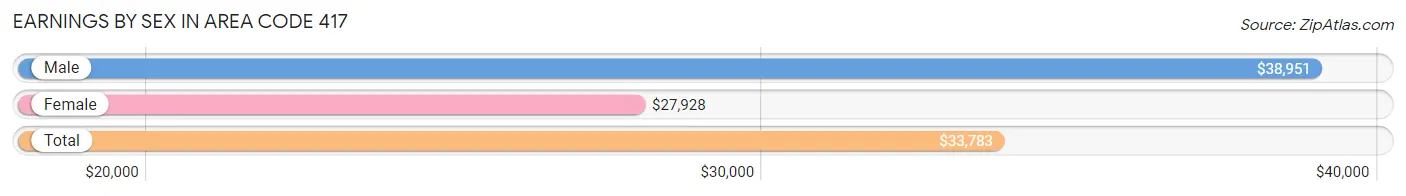
Earnings by Sex in Area Code 417
Average Earnings in Area Code 417 are $33,783, $38,951 for men and $27,928 for women, a difference of 28.3%.
| Sex | Number | Average Earnings |
| Male | 272,406 (52.6%) | $38,951 |
| Female | 245,225 (47.4%) | $27,928 |
| Total | 517,631 (100.0%) | $33,783 |
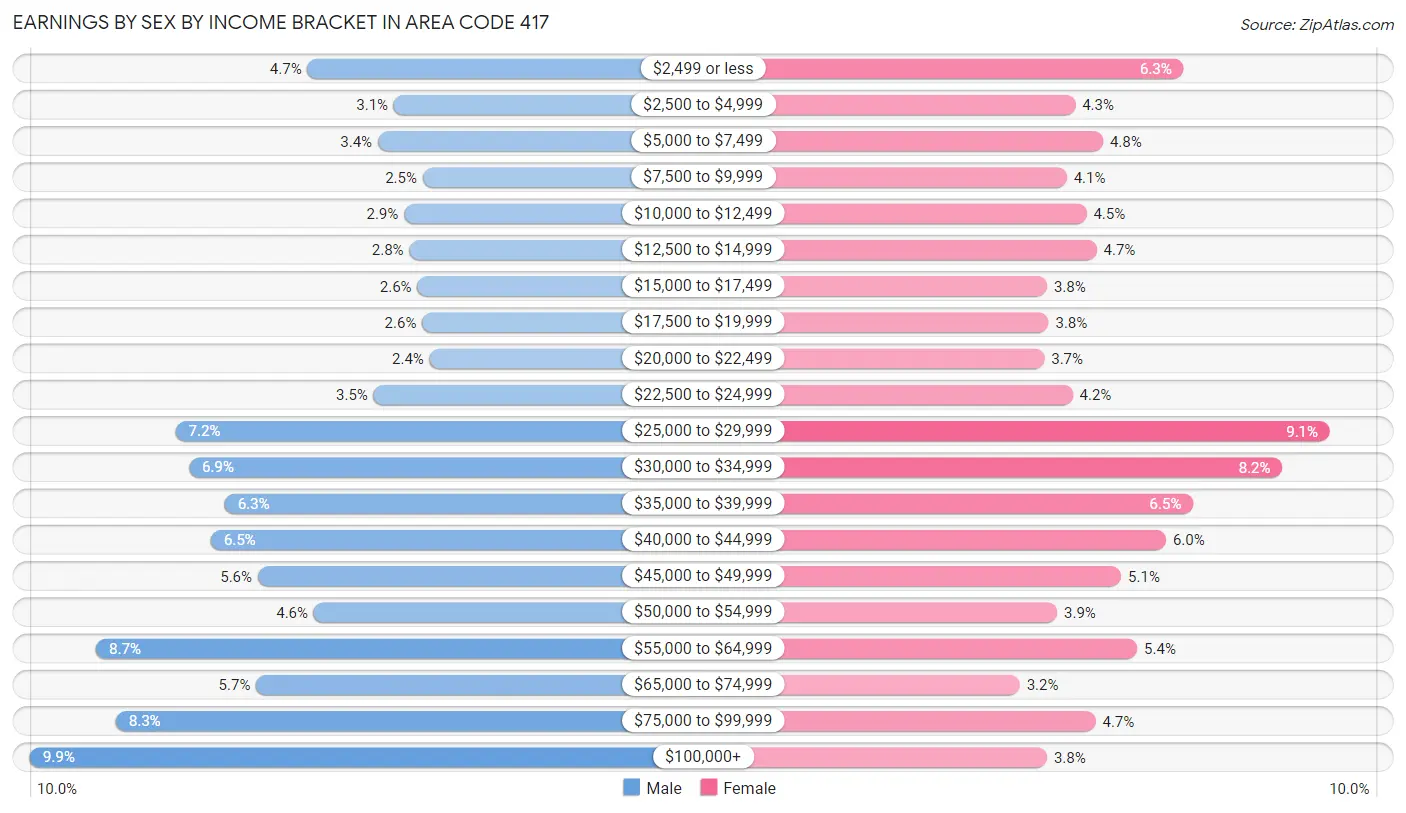
Earnings by Sex by Income Bracket in Area Code 417
The most common earnings brackets in Area Code 417 are $100,000+ for men (26,956 | 9.9%) and $25,000 to $29,999 for women (22,192 | 9.0%).
| Income | Male | Female |
| $2,499 or less | 12,801 (4.7%) | 15,481 (6.3%) |
| $2,500 to $4,999 | 8,394 (3.1%) | 10,491 (4.3%) |
| $5,000 to $7,499 | 9,200 (3.4%) | 11,765 (4.8%) |
| $7,500 to $9,999 | 6,932 (2.5%) | 10,092 (4.1%) |
| $10,000 to $12,499 | 7,878 (2.9%) | 11,018 (4.5%) |
| $12,500 to $14,999 | 7,591 (2.8%) | 11,488 (4.7%) |
| $15,000 to $17,499 | 7,191 (2.6%) | 9,184 (3.7%) |
| $17,500 to $19,999 | 6,937 (2.5%) | 9,272 (3.8%) |
| $20,000 to $22,499 | 6,566 (2.4%) | 9,069 (3.7%) |
| $22,500 to $24,999 | 9,418 (3.5%) | 10,379 (4.2%) |
| $25,000 to $29,999 | 19,535 (7.2%) | 22,192 (9.0%) |
| $30,000 to $34,999 | 18,844 (6.9%) | 20,012 (8.2%) |
| $35,000 to $39,999 | 17,026 (6.2%) | 15,922 (6.5%) |
| $40,000 to $44,999 | 17,728 (6.5%) | 14,665 (6.0%) |
| $45,000 to $49,999 | 15,331 (5.6%) | 12,598 (5.1%) |
| $50,000 to $54,999 | 12,467 (4.6%) | 9,656 (3.9%) |
| $55,000 to $64,999 | 23,603 (8.7%) | 13,343 (5.4%) |
| $65,000 to $74,999 | 15,421 (5.7%) | 7,952 (3.2%) |
| $75,000 to $99,999 | 22,587 (8.3%) | 11,439 (4.7%) |
| $100,000+ | 26,956 (9.9%) | 9,207 (3.7%) |
| Total | 272,406 (100.0%) | 245,225 (100.0%) |
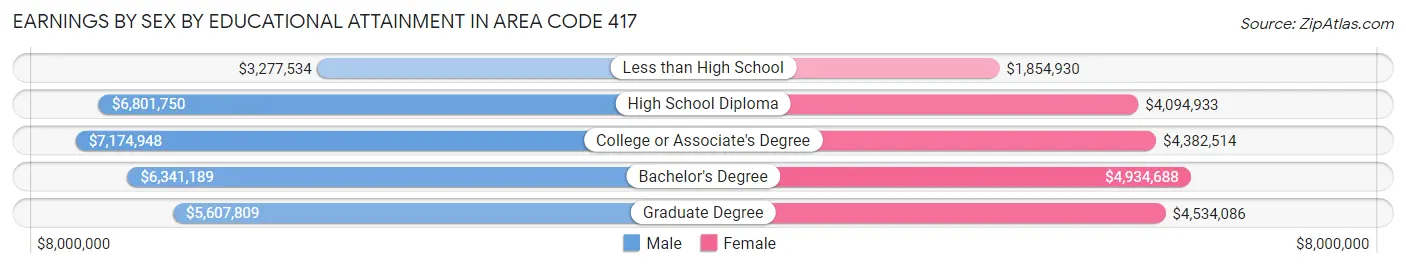
Earnings by Sex by Educational Attainment in Area Code 417
Average earnings in Area Code 417 are $8,045,514 for men and $5,519,908 for women, a difference of 31.4%. Men with an educational attainment of college or associate's degree enjoy the highest average annual earnings of $7,174,948, while those with less than high school education earn the least with $3,277,534. Women with an educational attainment of bachelor's degree earn the most with the average annual earnings of $4,934,688, while those with less than high school education have the smallest earnings of $1,854,930.
| Educational Attainment | Male Income | Female Income |
| Less than High School | $3,277,534 | $1,854,930 |
| High School Diploma | $6,801,750 | $4,094,933 |
| College or Associate's Degree | $7,174,948 | $4,382,514 |
| Bachelor's Degree | $6,341,189 | $4,934,688 |
| Graduate Degree | $5,607,809 | $4,534,086 |
| Total | $8,045,514 | $5,519,908 |
Family Income in Area Code 417
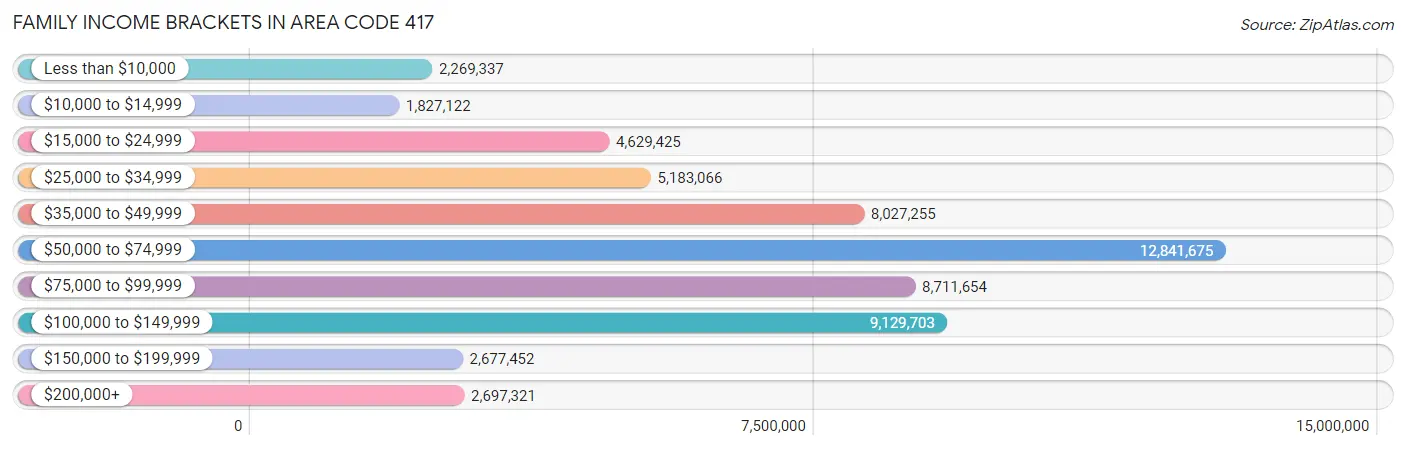
Family Income Brackets in Area Code 417
According to the Area Code 417 family income data, there are 12,841,675 families falling into the $50,000 to $74,999 income range, which is the most common income bracket and makes up 4,782.8% of all families. Conversely, the $10,000 to $14,999 income bracket is the least frequent group with only 1,827,122 families (680.5%) belonging to this category.
| Income Bracket | # Families | % Families |
| Less than $10,000 | 2,269,337 | 845.2% |
| $10,000 to $14,999 | 1,827,122 | 680.5% |
| $15,000 to $24,999 | 4,629,425 | 1,724.2% |
| $25,000 to $34,999 | 5,183,066 | 1,930.4% |
| $35,000 to $49,999 | 8,027,255 | 2,989.7% |
| $50,000 to $74,999 | 12,841,675 | 4,782.8% |
| $75,000 to $99,999 | 8,711,654 | 3,244.6% |
| $100,000 to $149,999 | 9,129,703 | 3,400.3% |
| $150,000 to $199,999 | 2,677,452 | 997.2% |
| $200,000+ | 2,697,321 | 1,004.6% |
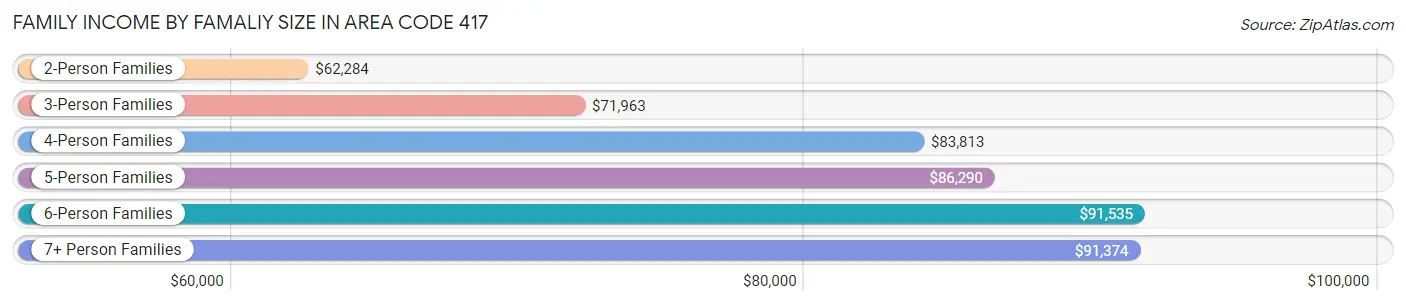
Family Income by Famaliy Size in Area Code 417
6-person families (8,101 | 3.0%) account for the highest median family income in Area Code 417 with $91,535 per family, while 2-person families (141,376 | 52.6%) have the highest median income of $31,142 per family member.
| Income Bracket | # Families | Median Income |
| 2-Person Families | 141,376 (52.6%) | $62,284 |
| 3-Person Families | 52,736 (19.6%) | $71,963 |
| 4-Person Families | 42,711 (15.9%) | $83,813 |
| 5-Person Families | 18,845 (7.0%) | $86,290 |
| 6-Person Families | 8,101 (3.0%) | $91,535 |
| 7+ Person Families | 4,728 (1.8%) | $91,374 |
| Total | 268,497 (100.0%) | $66,161 |
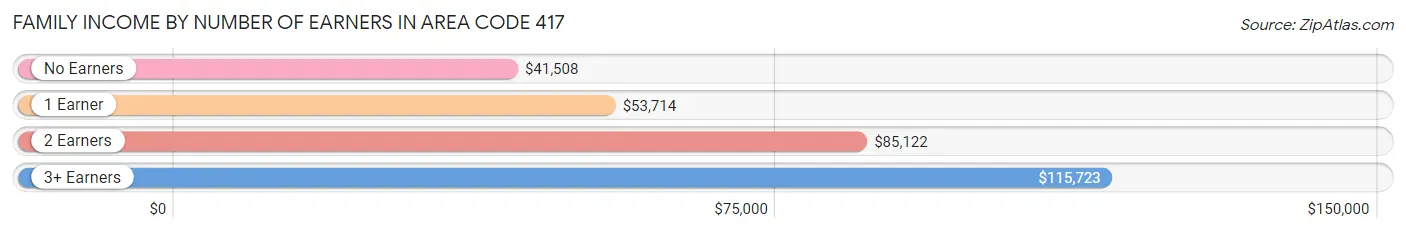
Family Income by Number of Earners in Area Code 417
The median family income in Area Code 417 is $66,161, with families comprising 3+ earners (23,935) having the highest median family income of $115,723, while families with no earners (51,402) have the lowest median family income of $41,508, accounting for 8.9% and 19.1% of families, respectively.
| Number of Earners | # Families | Median Income |
| No Earners | 51,402 (19.1%) | $41,508 |
| 1 Earner | 85,235 (31.8%) | $53,714 |
| 2 Earners | 107,925 (40.2%) | $85,122 |
| 3+ Earners | 23,935 (8.9%) | $115,723 |
| Total | 268,497 (100.0%) | $66,161 |
Household Income in Area Code 417
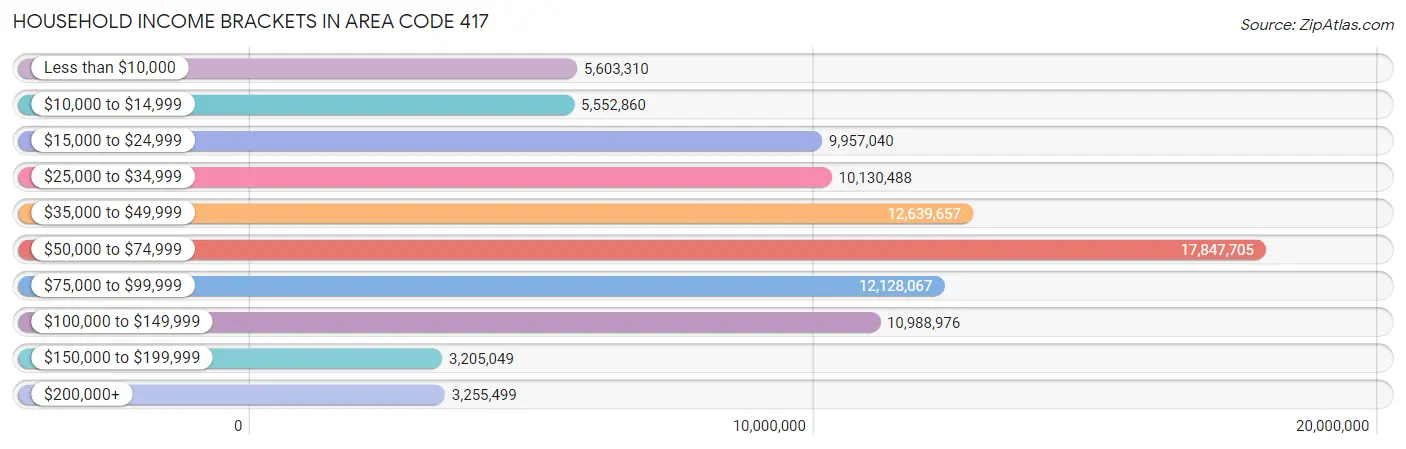
Household Income Brackets in Area Code 417
With 17,847,705 households falling in the category, the $50,000 to $74,999 income range is the most frequent in Area Code 417, accounting for 4,280.6% of all households. In contrast, only 3,205,049 households (768.7%) fall into the $150,000 to $199,999 income bracket, making it the least populous group.
| Income Bracket | # Households | % Households |
| Less than $10,000 | 5,603,310 | 1,343.9% |
| $10,000 to $14,999 | 5,552,860 | 1,331.8% |
| $15,000 to $24,999 | 9,957,040 | 2,388.1% |
| $25,000 to $34,999 | 10,130,488 | 2,429.7% |
| $35,000 to $49,999 | 12,639,657 | 3,031.5% |
| $50,000 to $74,999 | 17,847,705 | 4,280.6% |
| $75,000 to $99,999 | 12,128,067 | 2,908.8% |
| $100,000 to $149,999 | 10,988,976 | 2,635.6% |
| $150,000 to $199,999 | 3,205,049 | 768.7% |
| $200,000+ | 3,255,499 | 780.8% |
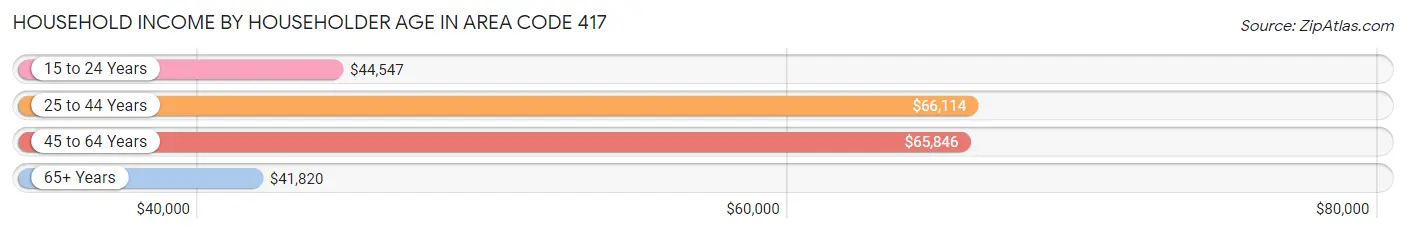
Household Income by Householder Age in Area Code 417
The median household income in Area Code 417 is $54,364, with the highest median household income of $66,114 found in the 25 to 44 years age bracket for the primary householder. A total of 124,720 households (29.9%) fall into this category. Meanwhile, the 65+ years age bracket for the primary householder has the lowest median household income of $41,820, with 122,715 households (29.4%) in this group.
| Income Bracket | # Households | Median Income |
| 15 to 24 Years | 24,590 (5.9%) | $44,547 |
| 25 to 44 Years | 124,720 (29.9%) | $66,114 |
| 45 to 64 Years | 144,919 (34.8%) | $65,846 |
| 65+ Years | 122,715 (29.4%) | $41,820 |
| Total | 416,944 (100.0%) | $54,364 |
Poverty in Area Code 417
Income Below Poverty by Sex and Age in Area Code 417
With 15.0% poverty level for males and 17.4% for females among the residents of Area Code 417, 15 year old males and 18 to 24 year old females are the most vulnerable to poverty, with 1,784 males (24.2%) and 12,497 females (28.4%) in their respective age groups living below the poverty level.
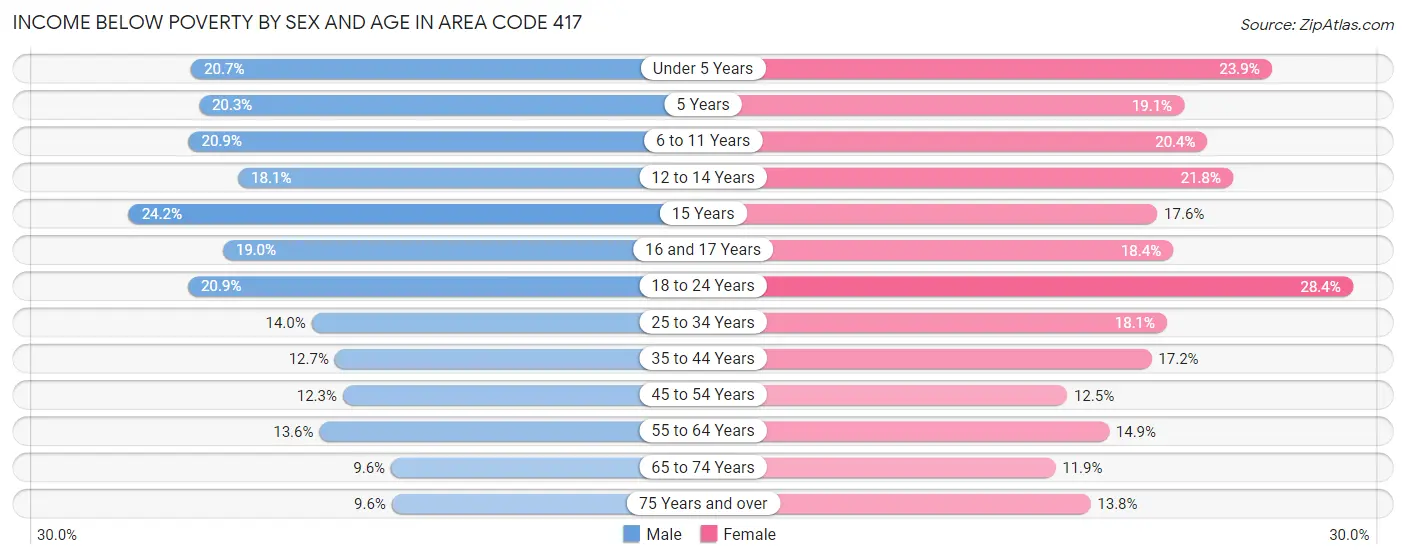
| Age Bracket | Male | Female |
| Under 5 Years | 6,469 (20.7%) | 6,960 (23.9%) |
| 5 Years | 1,266 (20.3%) | 1,181 (19.1%) |
| 6 to 11 Years | 8,393 (20.9%) | 7,477 (20.3%) |
| 12 to 14 Years | 3,806 (18.1%) | 4,463 (21.8%) |
| 15 Years | 1,784 (24.2%) | 1,177 (17.6%) |
| 16 and 17 Years | 2,730 (19.0%) | 2,463 (18.4%) |
| 18 to 24 Years | 9,803 (20.9%) | 12,497 (28.4%) |
| 25 to 34 Years | 8,879 (14.0%) | 11,501 (18.1%) |
| 35 to 44 Years | 7,866 (12.7%) | 10,592 (17.2%) |
| 45 to 54 Years | 7,469 (12.3%) | 7,585 (12.5%) |
| 55 to 64 Years | 9,065 (13.6%) | 10,455 (14.9%) |
| 65 to 74 Years | 5,049 (9.6%) | 6,984 (11.9%) |
| 75 Years and over | 3,202 (9.6%) | 6,175 (13.8%) |
| Total | 75,781 (15.0%) | 89,510 (17.4%) |
Income Above Poverty by Sex and Age in Area Code 417
According to the poverty statistics in Area Code 417, males aged 75 years and over and females aged 65 to 74 years are the age groups that are most secure financially, with 90.4% of males and 88.1% of females in these age groups living above the poverty line.
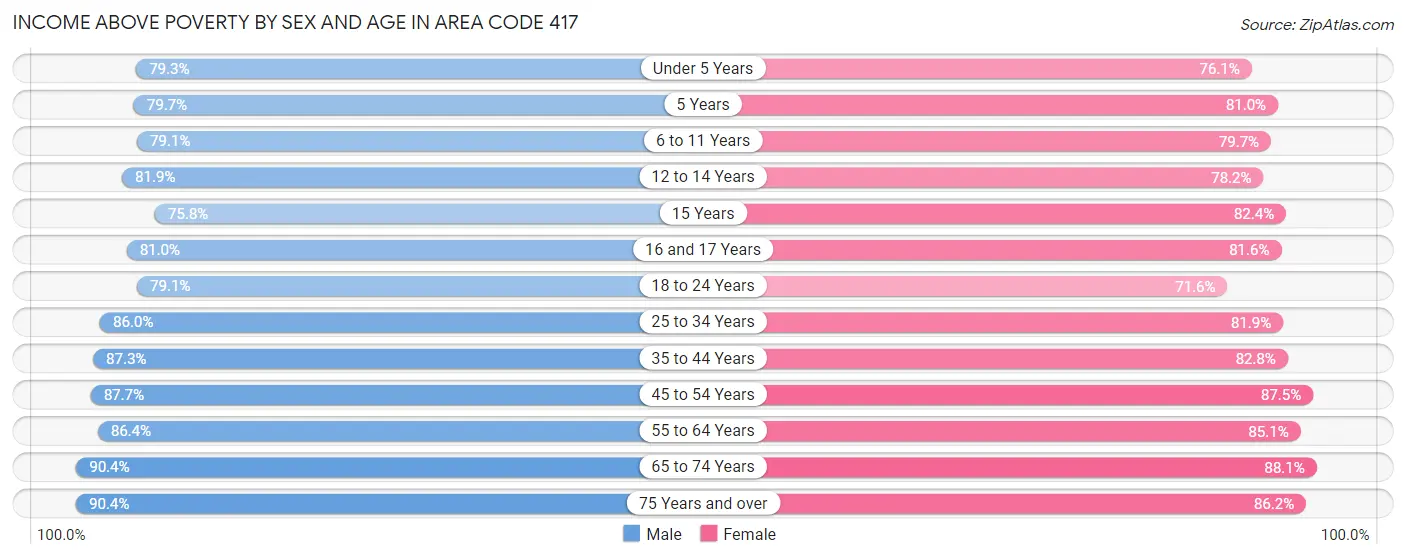
| Age Bracket | Male | Female |
| Under 5 Years | 24,733 (79.3%) | 22,130 (76.1%) |
| 5 Years | 4,975 (79.7%) | 5,017 (80.9%) |
| 6 to 11 Years | 31,831 (79.1%) | 29,262 (79.6%) |
| 12 to 14 Years | 17,207 (81.9%) | 16,036 (78.2%) |
| 15 Years | 5,589 (75.8%) | 5,525 (82.4%) |
| 16 and 17 Years | 11,665 (81.0%) | 10,893 (81.6%) |
| 18 to 24 Years | 37,096 (79.1%) | 31,438 (71.6%) |
| 25 to 34 Years | 54,455 (86.0%) | 52,036 (81.9%) |
| 35 to 44 Years | 53,947 (87.3%) | 50,837 (82.8%) |
| 45 to 54 Years | 53,332 (87.7%) | 52,903 (87.5%) |
| 55 to 64 Years | 57,651 (86.4%) | 59,850 (85.1%) |
| 65 to 74 Years | 47,572 (90.4%) | 51,764 (88.1%) |
| 75 Years and over | 30,294 (90.4%) | 38,457 (86.2%) |
| Total | 430,347 (85.0%) | 426,148 (82.6%) |
Income Below Poverty Among Married-Couple Families in Area Code 417
The poverty statistics for married-couple families in Area Code 417 show that 6.6% or 13,927 of the total 210,772 families live below the poverty line. Families with 5 or more children have the highest poverty rate of 37.5%, comprising of 877 families. On the other hand, families with no children have the lowest poverty rate of 5.1%, which includes 6,654 families.
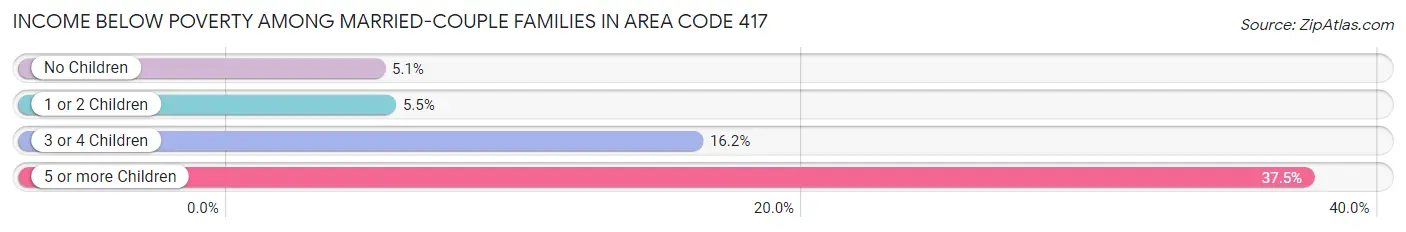
| Children | Above Poverty | Below Poverty |
| No Children | 123,272 (94.9%) | 6,654 (5.1%) |
| 1 or 2 Children | 55,834 (94.5%) | 3,252 (5.5%) |
| 3 or 4 Children | 16,275 (83.8%) | 3,144 (16.2%) |
| 5 or more Children | 1,464 (62.5%) | 877 (37.5%) |
| Total | 196,845 (93.4%) | 13,927 (6.6%) |
Income Below Poverty Among Single-Parent Households in Area Code 417
According to the poverty data in Area Code 417, 18.2% or 3,334 single-father households and 30.3% or 11,966 single-mother households are living below the poverty line. Among single-father households, those with 5 or more children have the highest poverty rate, with 55 households (52.4%) experiencing poverty. Likewise, among single-mother households, those with 5 or more children have the highest poverty rate, with 163 households (78.4%) falling below the poverty line.
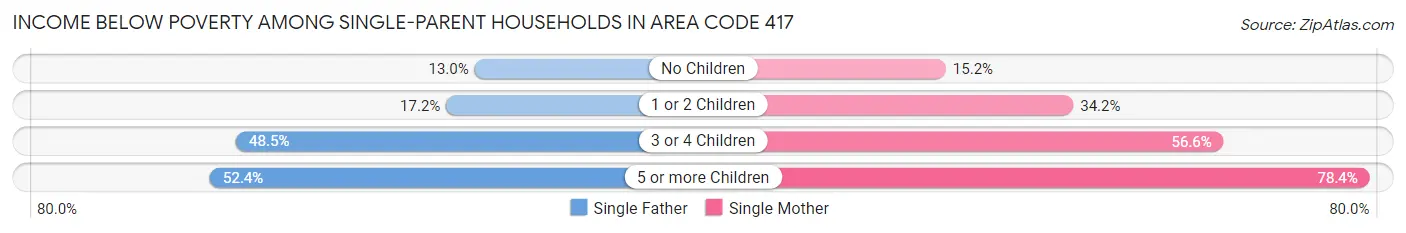
| Children | Single Father | Single Mother |
| No Children | 987 (13.0%) | 2,084 (15.2%) |
| 1 or 2 Children | 1,547 (17.2%) | 7,265 (34.2%) |
| 3 or 4 Children | 745 (48.5%) | 2,454 (56.6%) |
| 5 or more Children | 55 (52.4%) | 163 (78.4%) |
| Total | 3,334 (18.2%) | 11,966 (30.3%) |
Income Below Poverty Among Married-Couple vs Single-Parent Households in Area Code 417
The poverty data for Area Code 417 shows that 13,927 of the married-couple family households (6.6%) and 15,300 of the single-parent households (26.5%) are living below the poverty level. Within the married-couple family households, those with 5 or more children have the highest poverty rate, with 877 households (37.5%) falling below the poverty line. Among the single-parent households, those with 5 or more children have the highest poverty rate, with 218 household (69.7%) living below poverty.
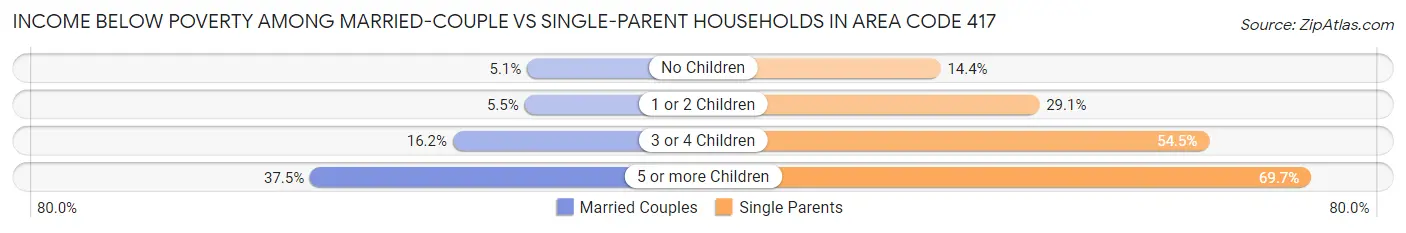
| Children | Married-Couple Families | Single-Parent Households |
| No Children | 6,654 (5.1%) | 3,071 (14.4%) |
| 1 or 2 Children | 3,252 (5.5%) | 8,812 (29.1%) |
| 3 or 4 Children | 3,144 (16.2%) | 3,199 (54.5%) |
| 5 or more Children | 877 (37.5%) | 218 (69.7%) |
| Total | 13,927 (6.6%) | 15,300 (26.5%) |
Race in Area Code 417
The most populous races in Area Code 417 are White / Caucasian (937,920 | 89.4%), Two or more Races (59,956 | 5.7%), and Hispanic or Latino (49,827 | 4.8%).
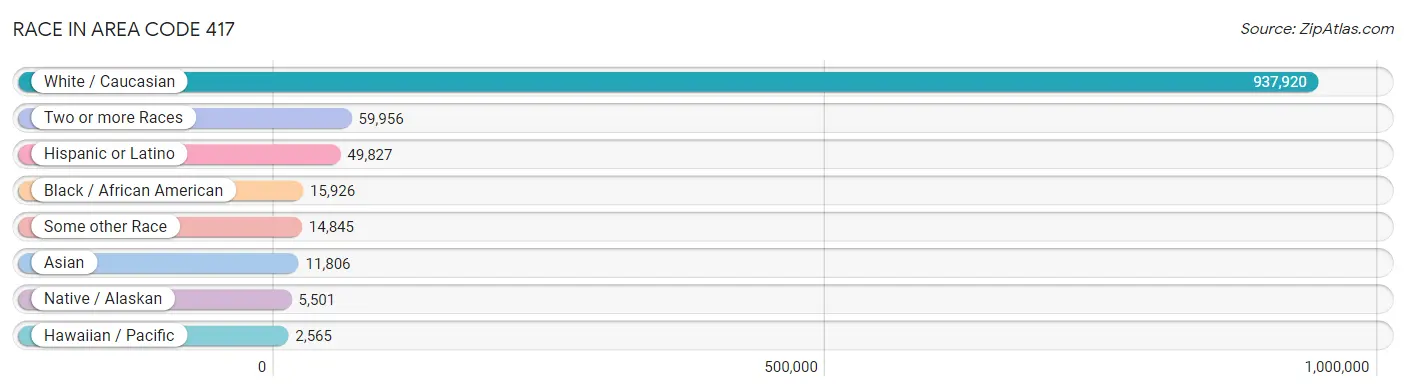
| Race | # Population | % Population |
| Asian | 11,806 | 1.1% |
| Black / African American | 15,926 | 1.5% |
| Hawaiian / Pacific | 2,565 | 0.2% |
| Hispanic or Latino | 49,827 | 4.8% |
| Native / Alaskan | 5,501 | 0.5% |
| White / Caucasian | 937,920 | 89.4% |
| Two or more Races | 59,956 | 5.7% |
| Some other Race | 14,845 | 1.4% |
| Total | 1,048,519 | 100.0% |
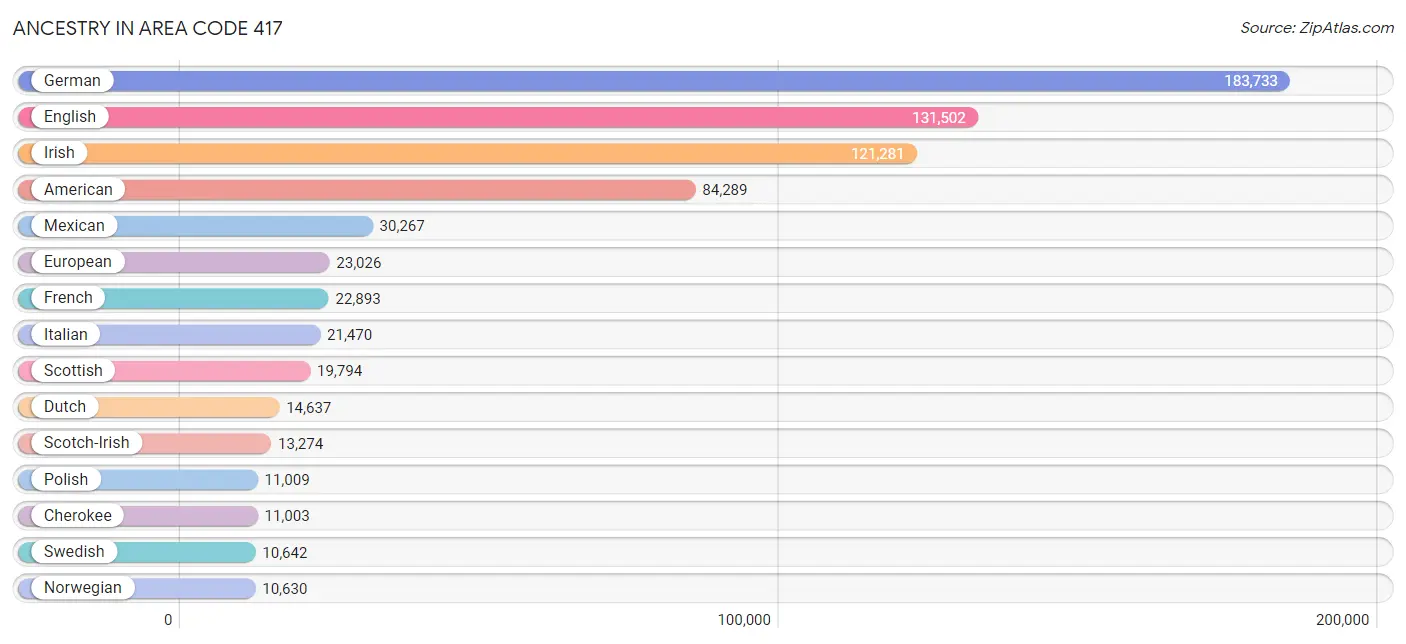
Ancestry in Area Code 417
The most populous ancestries reported in Area Code 417 are German (183,733 | 17.5%), English (131,502 | 12.5%), Irish (121,281 | 11.6%), American (84,289 | 8.0%), and Mexican (30,267 | 2.9%), together accounting for 52.6% of all Area Code 417 residents.
| Ancestry | # Population | % Population |
| African | 2,013 | 0.2% |
| Alaska Native | 1 | 0.0% |
| Alaskan Athabascan | 11 | 0.0% |
| Albanian | 92 | 0.0% |
| Aleut | 11 | 0.0% |
| Alsatian | 44 | 0.0% |
| American | 84,289 | 8.0% |
| Apache | 349 | 0.0% |
| Arab | 2,306 | 0.2% |
| Arapaho | 12 | 0.0% |
| Argentinean | 91 | 0.0% |
| Armenian | 265 | 0.0% |
| Assyrian / Chaldean / Syriac | 11 | 0.0% |
| Australian | 316 | 0.0% |
| Austrian | 1,561 | 0.2% |
| Bahamian | 17 | 0.0% |
| Bangladeshi | 1,292 | 0.1% |
| Barbadian | 30 | 0.0% |
| Belgian | 384 | 0.0% |
| Belizean | 303 | 0.0% |
| Bermudan | 9 | 0.0% |
| Bhutanese | 1,357 | 0.1% |
| Blackfeet | 1,154 | 0.1% |
| Bolivian | 27 | 0.0% |
| Brazilian | 573 | 0.1% |
| British | 5,078 | 0.5% |
| Bulgarian | 306 | 0.0% |
| Burmese | 2,290 | 0.2% |
| Cajun | 102 | 0.0% |
| Cambodian | 21 | 0.0% |
| Canadian | 866 | 0.1% |
| Celtic | 191 | 0.0% |
| Central American | 7,874 | 0.7% |
| Central American Indian | 369 | 0.0% |
| Cherokee | 11,003 | 1.1% |
| Cheyenne | 85 | 0.0% |
| Chickasaw | 121 | 0.0% |
| Chilean | 118 | 0.0% |
| Chinese | 27 | 0.0% |
| Chippewa | 296 | 0.0% |
| Choctaw | 927 | 0.1% |
| Colombian | 217 | 0.0% |
| Colville | 1 | 0.0% |
| Comanche | 111 | 0.0% |
| Costa Rican | 421 | 0.0% |
| Cree | 40 | 0.0% |
| Creek | 462 | 0.0% |
| Croatian | 601 | 0.1% |
| Crow | 28 | 0.0% |
| Cuban | 624 | 0.1% |
| Czech | 3,603 | 0.3% |
| Czechoslovakian | 631 | 0.1% |
| Danish | 3,407 | 0.3% |
| Delaware | 121 | 0.0% |
| Dominican | 208 | 0.0% |
| Dutch | 14,637 | 1.4% |
| Dutch West Indian | 109 | 0.0% |
| Eastern European | 1,398 | 0.1% |
| Ecuadorian | 203 | 0.0% |
| Egyptian | 233 | 0.0% |
| English | 131,502 | 12.5% |
| Estonian | 64 | 0.0% |
| Ethiopian | 322 | 0.0% |
| European | 23,026 | 2.2% |
| Fijian | 77 | 0.0% |
| Filipino | 69 | 0.0% |
| Finnish | 843 | 0.1% |
| French | 22,893 | 2.2% |
| French American Indian | 324 | 0.0% |
| French Canadian | 1,853 | 0.2% |
| German | 183,733 | 17.5% |
| German Russian | 43 | 0.0% |
| Ghanaian | 283 | 0.0% |
| Greek | 1,090 | 0.1% |
| Guamanian / Chamorro | 331 | 0.0% |
| Guatemalan | 5,325 | 0.5% |
| Haitian | 100 | 0.0% |
| Honduran | 483 | 0.1% |
| Hopi | 31 | 0.0% |
| Hungarian | 1,366 | 0.1% |
| Icelander | 67 | 0.0% |
| Indian (Asian) | 2,771 | 0.3% |
| Indonesian | 387 | 0.0% |
| Inupiat | 37 | 0.0% |
| Iranian | 131 | 0.0% |
| Iraqi | 12 | 0.0% |
| Irish | 121,281 | 11.6% |
| Iroquois | 654 | 0.1% |
| Israeli | 93 | 0.0% |
| Italian | 21,470 | 2.1% |
| Jamaican | 328 | 0.0% |
| Japanese | 347 | 0.0% |
| Jordanian | 104 | 0.0% |
| Kenyan | 263 | 0.0% |
| Kiowa | 69 | 0.0% |
| Korean | 4,055 | 0.4% |
| Laotian | 19 | 0.0% |
| Latvian | 149 | 0.0% |
| Lebanese | 956 | 0.1% |
| Lithuanian | 631 | 0.1% |
| Lumbee | 45 | 0.0% |
| Luxembourger | 55 | 0.0% |
| Macedonian | 18 | 0.0% |
| Malaysian | 82 | 0.0% |
| Maltese | 4 | 0.0% |
| Marshallese | 162 | 0.0% |
| Menominee | 13 | 0.0% |
| Mexican | 30,267 | 2.9% |
| Mexican American Indian | 415 | 0.0% |
| Moroccan | 9 | 0.0% |
| Native Hawaiian | 730 | 0.1% |
| Navajo | 435 | 0.0% |
| New Zealander | 58 | 0.0% |
| Nicaraguan | 133 | 0.0% |
| Nigerian | 230 | 0.0% |
| Northern European | 1,324 | 0.1% |
| Norwegian | 10,630 | 1.0% |
| Osage | 252 | 0.0% |
| Ottawa | 216 | 0.0% |
| Paiute | 7 | 0.0% |
| Pakistani | 594 | 0.1% |
| Palestinian | 56 | 0.0% |
| Panamanian | 192 | 0.0% |
| Pennsylvania German | 662 | 0.1% |
| Peruvian | 174 | 0.0% |
| Polish | 11,009 | 1.1% |
| Portuguese | 1,608 | 0.2% |
| Potawatomi | 142 | 0.0% |
| Pueblo | 58 | 0.0% |
| Puerto Rican | 4,585 | 0.4% |
| Puget Sound Salish | 15 | 0.0% |
| Romanian | 1,803 | 0.2% |
| Russian | 2,860 | 0.3% |
| Salvadoran | 1,320 | 0.1% |
| Samoan | 698 | 0.1% |
| Scandinavian | 3,672 | 0.4% |
| Scotch-Irish | 13,274 | 1.3% |
| Scottish | 19,794 | 1.9% |
| Seminole | 125 | 0.0% |
| Serbian | 95 | 0.0% |
| Shoshone | 21 | 0.0% |
| Sioux | 763 | 0.1% |
| Slavic | 292 | 0.0% |
| Slovak | 440 | 0.0% |
| Slovene | 100 | 0.0% |
| Somali | 363 | 0.0% |
| South African | 65 | 0.0% |
| South American | 1,253 | 0.1% |
| South American Indian | 6 | 0.0% |
| Spaniard | 1,874 | 0.2% |
| Spanish | 772 | 0.1% |
| Spanish American | 15 | 0.0% |
| Sri Lankan | 2,289 | 0.2% |
| Subsaharan African | 3,740 | 0.4% |
| Sudanese | 26 | 0.0% |
| Swedish | 10,642 | 1.0% |
| Swiss | 4,464 | 0.4% |
| Syrian | 235 | 0.0% |
| Taiwanese | 10 | 0.0% |
| Thai | 1,483 | 0.1% |
| Tlingit-Haida | 11 | 0.0% |
| Trinidadian and Tobagonian | 37 | 0.0% |
| Turkish | 44 | 0.0% |
| Ugandan | 9 | 0.0% |
| Ukrainian | 1,467 | 0.1% |
| Ute | 38 | 0.0% |
| Venezuelan | 405 | 0.0% |
| Vietnamese | 18 | 0.0% |
| Welsh | 7,466 | 0.7% |
| West Indian | 91 | 0.0% |
| Yaqui | 165 | 0.0% |
| Yugoslavian | 196 | 0.0% | View All 172 Rows |
Immigrants in Area Code 417
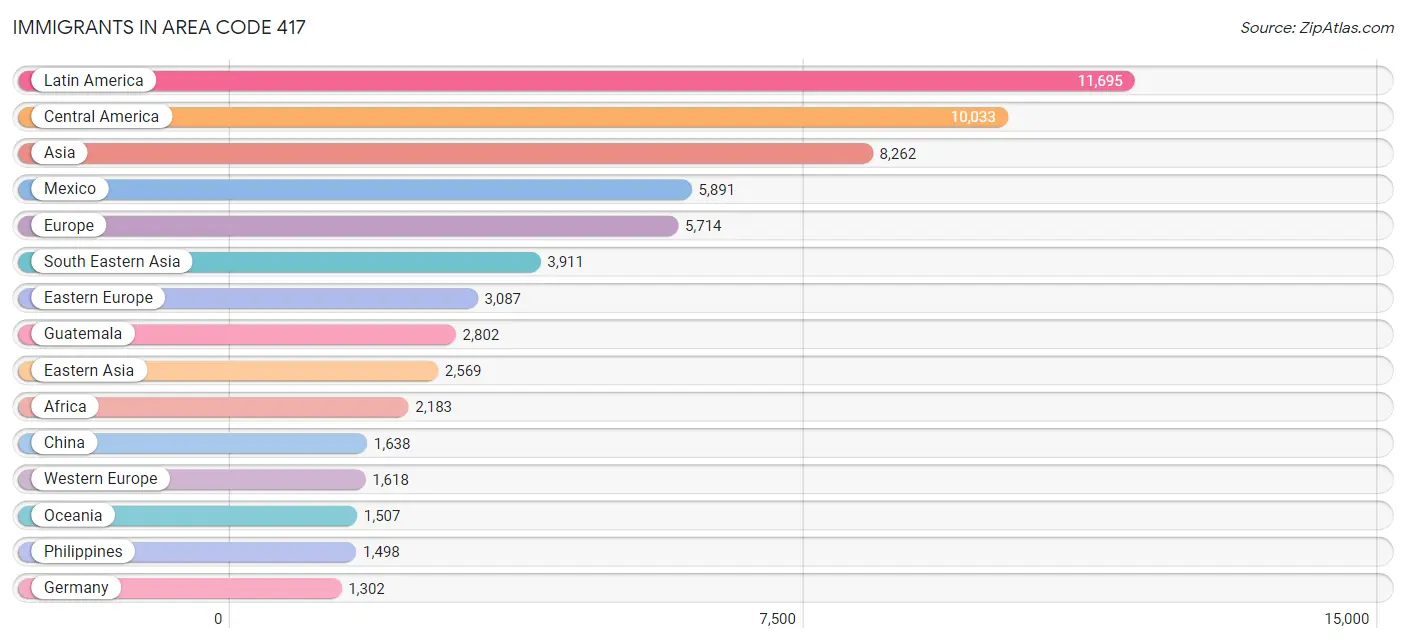
The most numerous immigrant groups reported in Area Code 417 came from Latin America (11,695 | 1.1%), Central America (10,033 | 1.0%), Asia (8,262 | 0.8%), Mexico (5,891 | 0.6%), and Europe (5,714 | 0.5%), together accounting for 4.0% of all Area Code 417 residents.
| Immigration Origin | # Population | % Population |
| Africa | 2,183 | 0.2% |
| Argentina | 72 | 0.0% |
| Asia | 8,262 | 0.8% |
| Australia | 94 | 0.0% |
| Austria | 25 | 0.0% |
| Azores | 27 | 0.0% |
| Bahamas | 5 | 0.0% |
| Bangladesh | 53 | 0.0% |
| Belarus | 6 | 0.0% |
| Belgium | 18 | 0.0% |
| Belize | 157 | 0.0% |
| Bolivia | 10 | 0.0% |
| Bosnia and Herzegovina | 14 | 0.0% |
| Brazil | 483 | 0.1% |
| Bulgaria | 120 | 0.0% |
| Cambodia | 105 | 0.0% |
| Canada | 466 | 0.0% |
| Caribbean | 427 | 0.0% |
| Central America | 10,033 | 1.0% |
| Chile | 68 | 0.0% |
| China | 1,638 | 0.2% |
| Colombia | 80 | 0.0% |
| Costa Rica | 123 | 0.0% |
| Croatia | 18 | 0.0% |
| Cuba | 203 | 0.0% |
| Czechoslovakia | 27 | 0.0% |
| Denmark | 12 | 0.0% |
| Dominica | 3 | 0.0% |
| Dominican Republic | 74 | 0.0% |
| Eastern Africa | 1,055 | 0.1% |
| Eastern Asia | 2,569 | 0.3% |
| Eastern Europe | 3,087 | 0.3% |
| Ecuador | 76 | 0.0% |
| Egypt | 107 | 0.0% |
| El Salvador | 646 | 0.1% |
| England | 343 | 0.0% |
| Eritrea | 8 | 0.0% |
| Ethiopia | 329 | 0.0% |
| Europe | 5,714 | 0.5% |
| France | 114 | 0.0% |
| Germany | 1,302 | 0.1% |
| Ghana | 152 | 0.0% |
| Greece | 3 | 0.0% |
| Guatemala | 2,802 | 0.3% |
| Haiti | 19 | 0.0% |
| Honduras | 301 | 0.0% |
| Hong Kong | 28 | 0.0% |
| Hungary | 149 | 0.0% |
| India | 614 | 0.1% |
| Indonesia | 10 | 0.0% |
| Iran | 93 | 0.0% |
| Iraq | 69 | 0.0% |
| Ireland | 66 | 0.0% |
| Israel | 42 | 0.0% |
| Italy | 41 | 0.0% |
| Jamaica | 83 | 0.0% |
| Japan | 170 | 0.0% |
| Jordan | 54 | 0.0% |
| Kazakhstan | 67 | 0.0% |
| Kenya | 315 | 0.0% |
| Korea | 761 | 0.1% |
| Kuwait | 111 | 0.0% |
| Laos | 283 | 0.0% |
| Latin America | 11,695 | 1.1% |
| Latvia | 13 | 0.0% |
| Malaysia | 7 | 0.0% |
| Mexico | 5,891 | 0.6% |
| Micronesia | 1,293 | 0.1% |
| Middle Africa | 132 | 0.0% |
| Moldova | 79 | 0.0% |
| Morocco | 16 | 0.0% |
| Nepal | 156 | 0.0% |
| Netherlands | 134 | 0.0% |
| Nicaragua | 25 | 0.0% |
| Nigeria | 275 | 0.0% |
| North Macedonia | 19 | 0.0% |
| Northern Africa | 196 | 0.0% |
| Northern Europe | 811 | 0.1% |
| Norway | 4 | 0.0% |
| Oceania | 1,507 | 0.1% |
| Pakistan | 132 | 0.0% |
| Panama | 69 | 0.0% |
| Peru | 90 | 0.0% |
| Philippines | 1,498 | 0.1% |
| Poland | 104 | 0.0% |
| Portugal | 41 | 0.0% |
| Romania | 760 | 0.1% |
| Russia | 1,001 | 0.1% |
| Saudi Arabia | 214 | 0.0% |
| Scotland | 83 | 0.0% |
| Serbia | 14 | 0.0% |
| Sierra Leone | 6 | 0.0% |
| Singapore | 2 | 0.0% |
| Somalia | 217 | 0.0% |
| South Africa | 177 | 0.0% |
| South America | 1,235 | 0.1% |
| South Central Asia | 1,220 | 0.1% |
| South Eastern Asia | 3,911 | 0.4% |
| Southern Europe | 151 | 0.0% |
| Spain | 66 | 0.0% |
| Sri Lanka | 45 | 0.0% |
| Sudan | 56 | 0.0% |
| Sweden | 35 | 0.0% |
| Switzerland | 25 | 0.0% |
| Syria | 10 | 0.0% |
| Taiwan | 199 | 0.0% |
| Thailand | 628 | 0.1% |
| Trinidad and Tobago | 40 | 0.0% |
| Uganda | 42 | 0.0% |
| Ukraine | 689 | 0.1% |
| Uzbekistan | 23 | 0.0% |
| Venezuela | 296 | 0.0% |
| Vietnam | 1,130 | 0.1% |
| Western Africa | 556 | 0.1% |
| Western Asia | 528 | 0.1% |
| Western Europe | 1,618 | 0.2% |
| Zaire | 132 | 0.0% |
| Zimbabwe | 40 | 0.0% | View All 118 Rows |
Sex and Age in Area Code 417
Sex and Age in Area Code 417
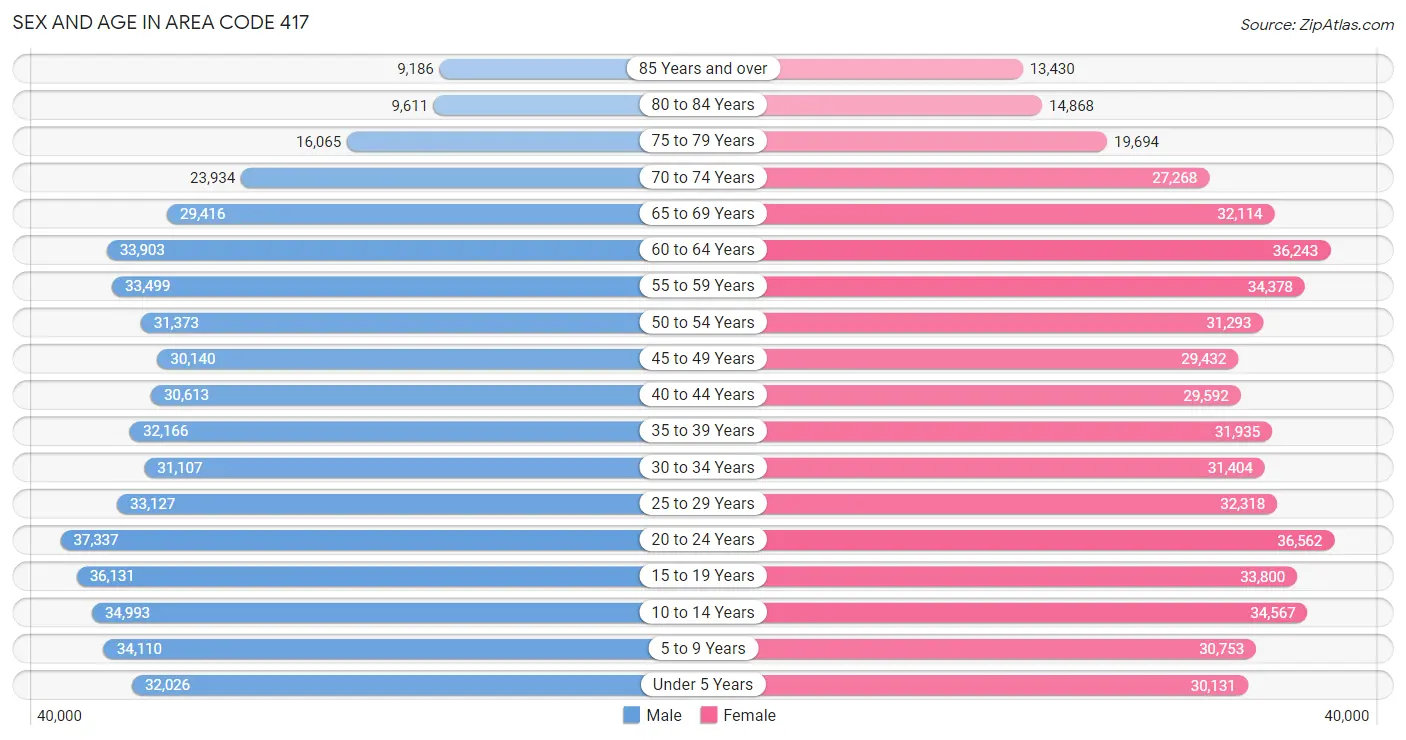
The most populous age groups in Area Code 417 are 20 to 24 Years (37,337 | 7.2%) for men and 20 to 24 Years (36,562 | 6.9%) for women.
| Age Bracket | Male | Female |
| Under 5 Years | 32,026 (6.2%) | 30,131 (5.7%) |
| 5 to 9 Years | 34,110 (6.6%) | 30,753 (5.8%) |
| 10 to 14 Years | 34,993 (6.8%) | 34,567 (6.5%) |
| 15 to 19 Years | 36,131 (7.0%) | 33,800 (6.4%) |
| 20 to 24 Years | 37,337 (7.2%) | 36,562 (6.9%) |
| 25 to 29 Years | 33,127 (6.4%) | 32,318 (6.1%) |
| 30 to 34 Years | 31,107 (6.0%) | 31,404 (5.9%) |
| 35 to 39 Years | 32,166 (6.2%) | 31,935 (6.0%) |
| 40 to 44 Years | 30,613 (5.9%) | 29,592 (5.6%) |
| 45 to 49 Years | 30,140 (5.8%) | 29,432 (5.6%) |
| 50 to 54 Years | 31,373 (6.0%) | 31,293 (5.9%) |
| 55 to 59 Years | 33,499 (6.5%) | 34,378 (6.5%) |
| 60 to 64 Years | 33,903 (6.5%) | 36,243 (6.8%) |
| 65 to 69 Years | 29,416 (5.7%) | 32,114 (6.1%) |
| 70 to 74 Years | 23,934 (4.6%) | 27,268 (5.1%) |
| 75 to 79 Years | 16,065 (3.1%) | 19,694 (3.7%) |
| 80 to 84 Years | 9,611 (1.8%) | 14,868 (2.8%) |
| 85 Years and over | 9,186 (1.8%) | 13,430 (2.5%) |
| Total | 518,737 (100.0%) | 529,782 (100.0%) |
Families and Households in Area Code 417
Median Family Size in Area Code 417
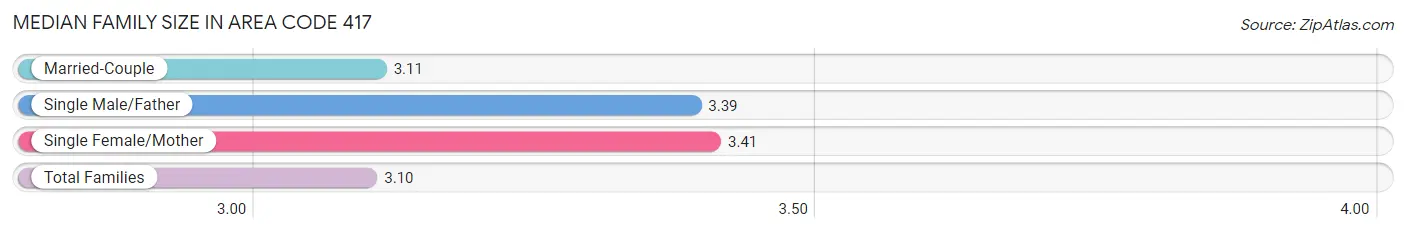
The median family size in Area Code 417 is 3.10 persons per family, with single female/mother families (39,457 | 14.7%) accounting for the largest median family size of 3.40625 persons per family. On the other hand, married-couple families (210,772 | 78.5%) represent the smallest median family size with 3.11 persons per family.
| Family Type | # Families | Family Size |
| Married-Couple | 210,772 (78.5%) | 3.11 |
| Single Male/Father | 18,268 (6.8%) | 3.39 |
| Single Female/Mother | 39,457 (14.7%) | 3.41 |
| Total Families | 268,497 (100.0%) | 3.10 |
Median Household Size in Area Code 417
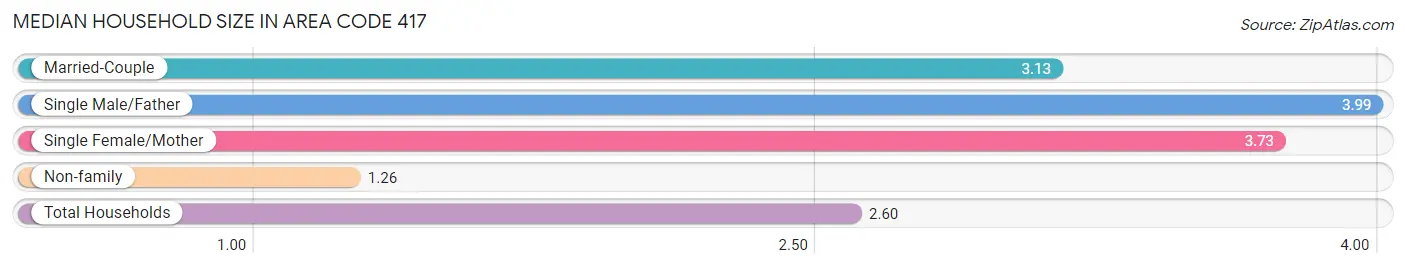
The median household size in Area Code 417 is 2.60 persons per household, with single male/father households (18,268 | 4.4%) accounting for the largest median household size of 3.99 persons per household. non-family households (148,447 | 35.6%) represent the smallest median household size with 1.26 persons per household.
| Household Type | # Households | Household Size |
| Married-Couple | 210,772 (50.5%) | 3.13 |
| Single Male/Father | 18,268 (4.4%) | 3.99 |
| Single Female/Mother | 39,457 (9.5%) | 3.73 |
| Non-family | 148,447 (35.6%) | 1.26 |
| Total Households | 416,944 (100.0%) | 2.60 |
Household Size by Marriage Status in Area Code 417
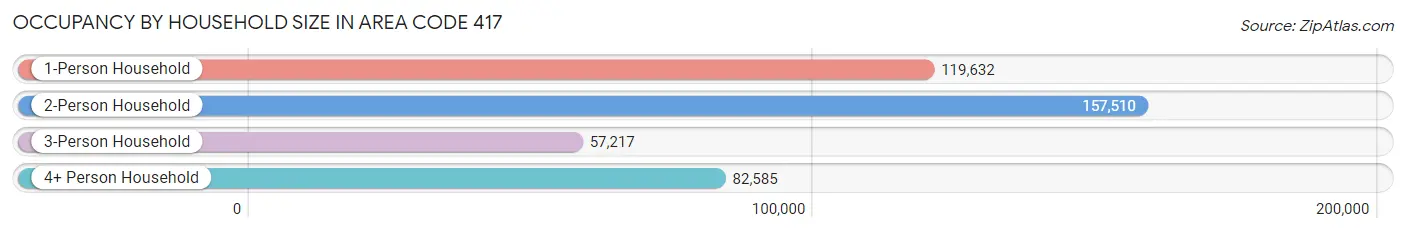
Out of a total of 416,944 households in Area Code 417, 268,497 (64.4%) are family households, while 148,447 (35.6%) are nonfamily households. The most numerous type of family households are 2-person households, comprising 133,072, and the most common type of nonfamily households are 1-person households, comprising 119,632.
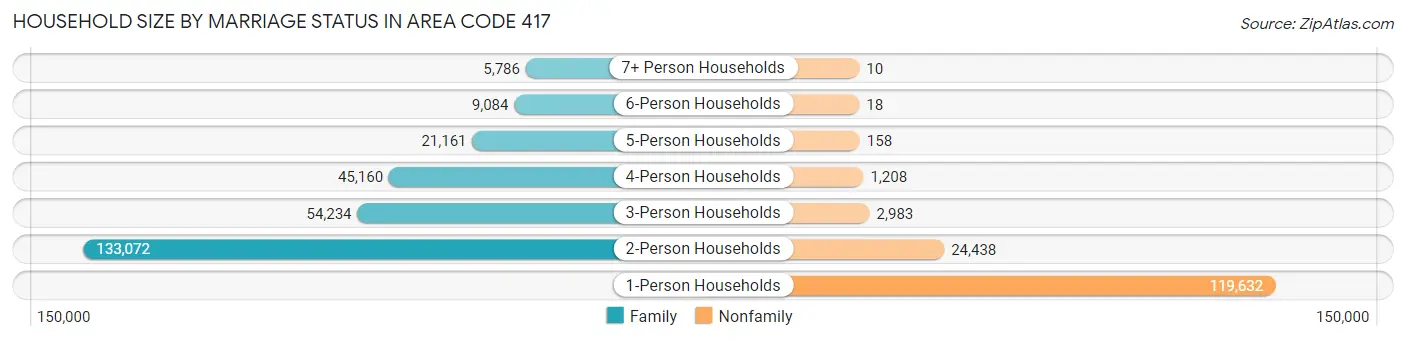
| Household Size | Family Households | Nonfamily Households |
| 1-Person Households | - | 119,632 (28.7%) |
| 2-Person Households | 133,072 (31.9%) | 24,438 (5.9%) |
| 3-Person Households | 54,234 (13.0%) | 2,983 (0.7%) |
| 4-Person Households | 45,160 (10.8%) | 1,208 (0.3%) |
| 5-Person Households | 21,161 (5.1%) | 158 (0.0%) |
| 6-Person Households | 9,084 (2.2%) | 18 (0.0%) |
| 7+ Person Households | 5,786 (1.4%) | 10 (0.0%) |
| Total | 268,497 (64.4%) | 148,447 (35.6%) |
Female Fertility in Area Code 417
Fertility by Age in Area Code 417
Average fertility rate in Area Code 417 is 94.0 births per 1,000 women. Women in the age bracket of 20 to 34 years have the highest fertility rate with 182.6 births per 1,000 women. Women in the age bracket of 20 to 34 years acount for 76.5% of all women with births.
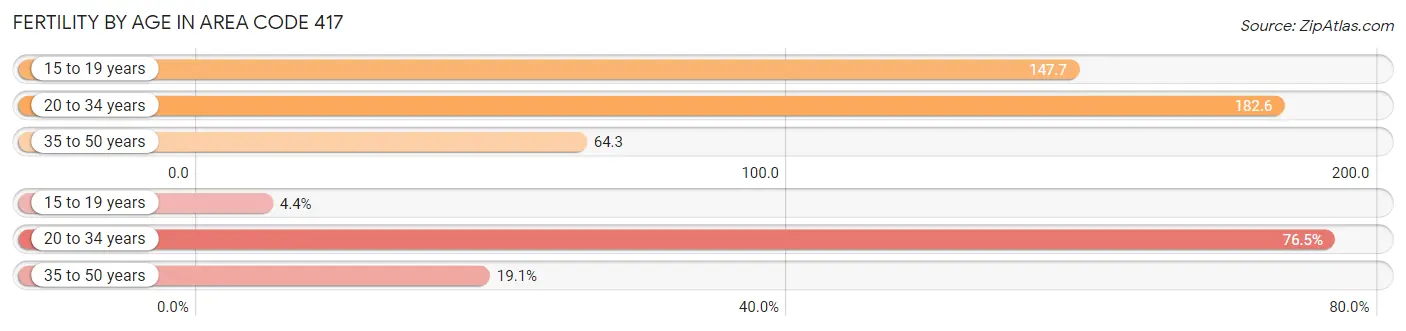
| Age Bracket | Women with Births | Births / 1,000 Women |
| 15 to 19 years | 641 (4.4%) | 147.7 |
| 20 to 34 years | 11,150 (76.5%) | 182.6 |
| 35 to 50 years | 2,789 (19.1%) | 64.3 |
| Total | 14,580 (100.0%) | 94.0 |
Fertility by Age by Marriage Status in Area Code 417
61.2% of women with births (14,580) in Area Code 417 are married. The highest percentage of unmarried women with births falls into 15 to 19 years age bracket with 97.7% of them unmarried at the time of birth, while the lowest percentage of unmarried women with births belong to 20 to 34 years age bracket with 37.8% of them unmarried.
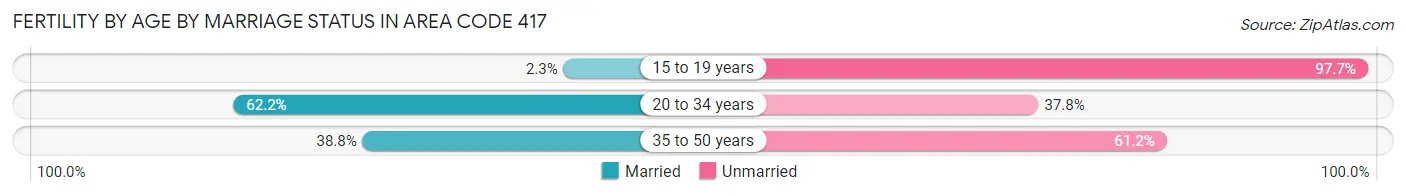
| Age Bracket | Married | Unmarried |
| 15 to 19 years | 15 (2.3%) | 626 (97.7%) |
| 20 to 34 years | 6,931 (62.2%) | 4,219 (37.8%) |
| 35 to 50 years | 1,081 (38.8%) | 1,708 (61.2%) |
| Total | 8,927 (61.2%) | 5,653 (38.8%) |
Fertility by Education in Area Code 417
Average fertility rate in Area Code 417 is 94.0 births per 1,000 women. Women with the education attainment of graduate degree have the highest fertility rate of 265.1 births per 1,000 women, while women with the education attainment of college or associate's degree have the lowest fertility at 128.7 births per 1,000 women. Women with the education attainment of college or associate's degree represent 37.2% of all women with births.
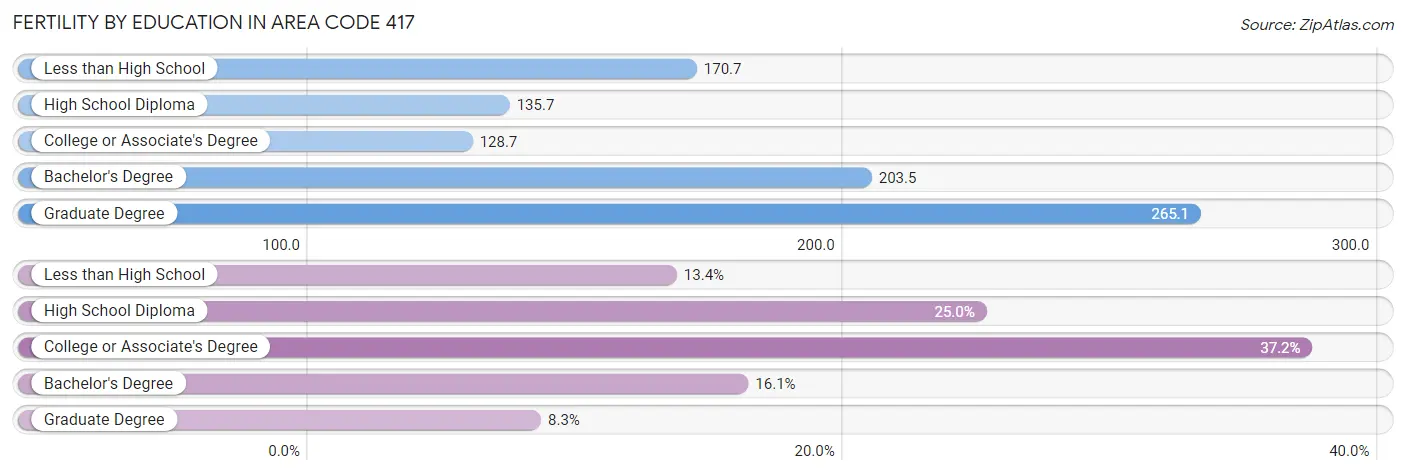
| Educational Attainment | Women with Births | Births / 1,000 Women |
| Less than High School | 1,954 (13.4%) | 170.7 |
| High School Diploma | 3,645 (25.0%) | 135.7 |
| College or Associate's Degree | 5,425 (37.2%) | 128.7 |
| Bachelor's Degree | 2,345 (16.1%) | 203.5 |
| Graduate Degree | 1,211 (8.3%) | 265.1 |
| Total | 14,580 (100.0%) | 94.0 |
Fertility by Education by Marriage Status in Area Code 417
38.8% of women with births in Area Code 417 are unmarried. Women with the educational attainment of graduate degree are most likely to be married with 78.4% of them married at childbirth, while women with the educational attainment of high school diploma are least likely to be married with 71.5% of them unmarried at childbirth.
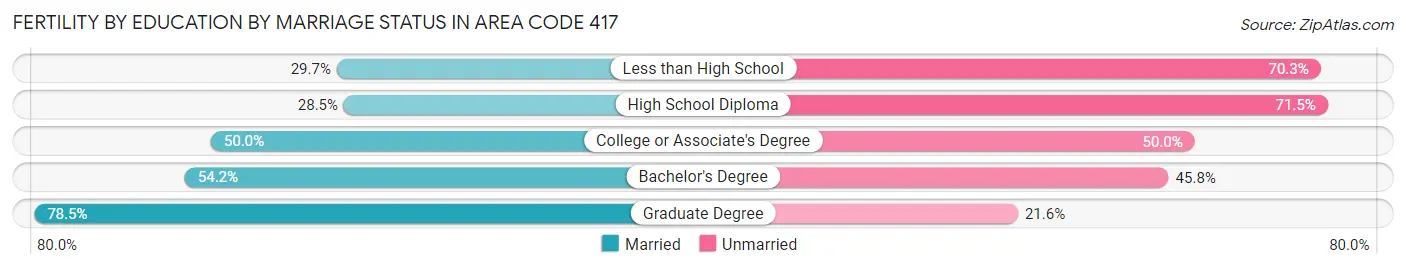
| Educational Attainment | Married | Unmarried |
| Less than High School | 580 (29.7%) | 1,374 (70.3%) |
| High School Diploma | 1,040 (28.5%) | 2,605 (71.5%) |
| College or Associate's Degree | 2,711 (50.0%) | 2,714 (50.0%) |
| Bachelor's Degree | 1,270 (54.2%) | 1,075 (45.8%) |
| Graduate Degree | 950 (78.4%) | 261 (21.5%) |
| Total | 8,927 (61.2%) | 5,653 (38.8%) |
Employment Characteristics in Area Code 417
Employment by Class of Employer in Area Code 417
Among the 459,457 employed individuals in Area Code 417, private company employees (306,517 | 66.7%), not-for-profit organizations (46,955 | 10.2%), and self-employed (not incorporated) (33,315 | 7.2%) make up the most common classes of employment.
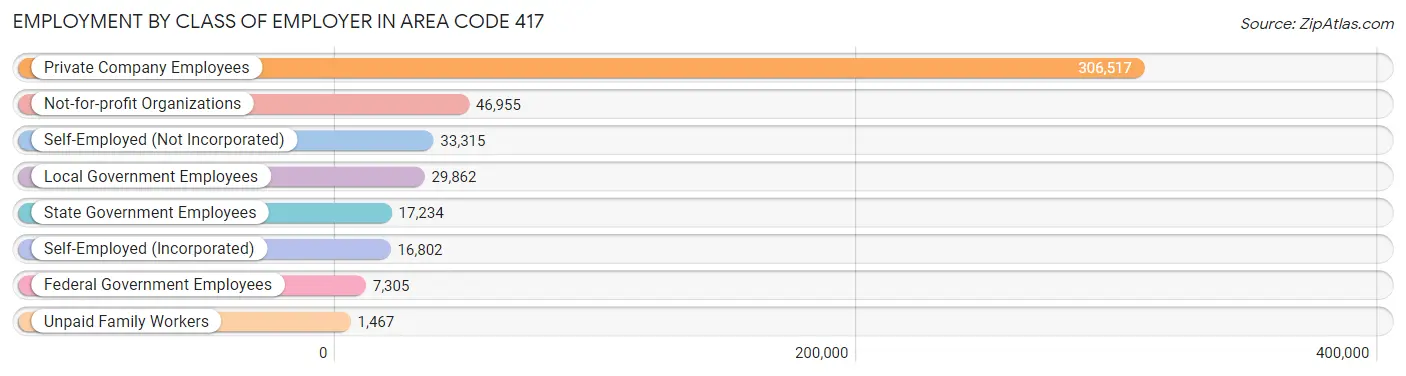
| Employer Class | # Employees | % Employees |
| Private Company Employees | 306,517 | 66.7% |
| Self-Employed (Incorporated) | 16,802 | 3.7% |
| Self-Employed (Not Incorporated) | 33,315 | 7.2% |
| Not-for-profit Organizations | 46,955 | 10.2% |
| Local Government Employees | 29,862 | 6.5% |
| State Government Employees | 17,234 | 3.7% |
| Federal Government Employees | 7,305 | 1.6% |
| Unpaid Family Workers | 1,467 | 0.3% |
| Total | 459,457 | 100.0% |
Employment Status by Age in Area Code 417
According to the labor force statistics for Area Code 417, out of the total population over 16 years of age (837,741), 54.3% or 454,977 individuals are in the labor force, with 6.5% or 29,528 of them unemployed. The age group with the highest labor force participation rate is 25 to 29 years, with 81.3% or 53,220 individuals in the labor force. Within the labor force, the 16 to 19 years age range has the highest percentage of unemployed individuals, with 2,219.4% or 572,450 of them being unemployed.
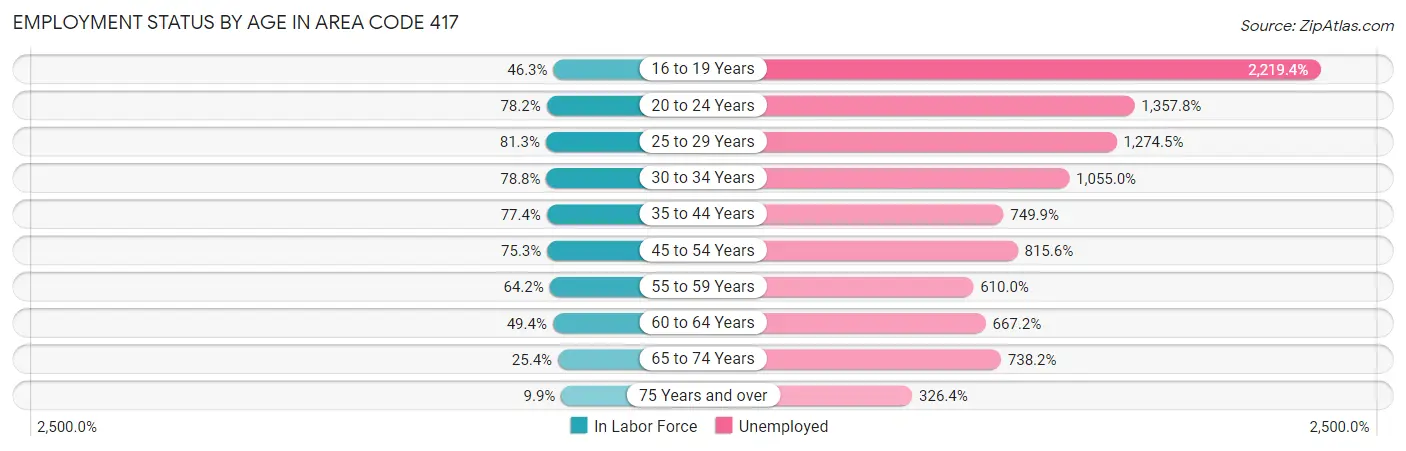
| Age Bracket | In Labor Force | Unemployed |
| 16 to 19 Years | 25,796 (46.3%) | 572,450 (2,219.4%) |
| 20 to 24 Years | 57,820 (78.2%) | 785,066 (1,357.8%) |
| 25 to 29 Years | 53,219 (81.3%) | 678,289 (1,274.5%) |
| 30 to 34 Years | 49,247 (78.8%) | 519,545 (1,055.0%) |
| 35 to 44 Years | 96,162 (77.4%) | 721,126 (749.9%) |
| 45 to 54 Years | 92,035 (75.3%) | 750,621 (815.6%) |
| 55 to 59 Years | 43,594 (64.2%) | 265,905 (610.0%) |
| 60 to 64 Years | 34,637 (49.4%) | 231,105 (667.2%) |
| 65 to 74 Years | 28,584 (25.4%) | 211,044 (738.2%) |
| 75 Years and over | 8,215 (9.9%) | 26,827 (326.4%) |
| Total | 454,952 (54.3%) | 29,529 (6.5%) |
Employment Status by Educational Attainment in Area Code 417
According to labor force statistics for Area Code 417, 69.9% of individuals (358,459) out of the total population between 25 and 64 years of age (512,523) are in the labor force, with 952.2% or 3,413,247 of them being unemployed. The group with the highest labor force participation rate are those with the educational attainment of bachelor's degree or higher, with 80.6% or 103,344 individuals in the labor force. Within the labor force, individuals with less than high school education have the highest percentage of unemployment, with 1,601.4% or 455,822 of them being unemployed.
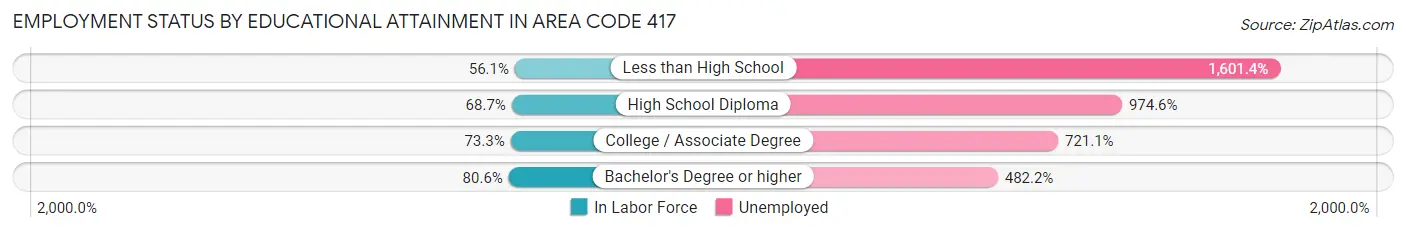
| Educational Attainment | In Labor Force | Unemployed |
| Less than High School | 28,463 (56.1%) | 812,070 (1,601.4%) |
| High School Diploma | 117,517 (68.7%) | 1,666,254 (974.6%) |
| College / Associate Degree | 119,268 (73.3%) | 1,172,703 (721.1%) |
| Bachelor's Degree or higher | 103,348 (80.6%) | 618,267 (482.2%) |
| Total | 358,477 (69.9%) | 4,880,244 (952.2%) |
Employment Occupations by Sex in Area Code 417
Management, Business, Science and Arts Occupations
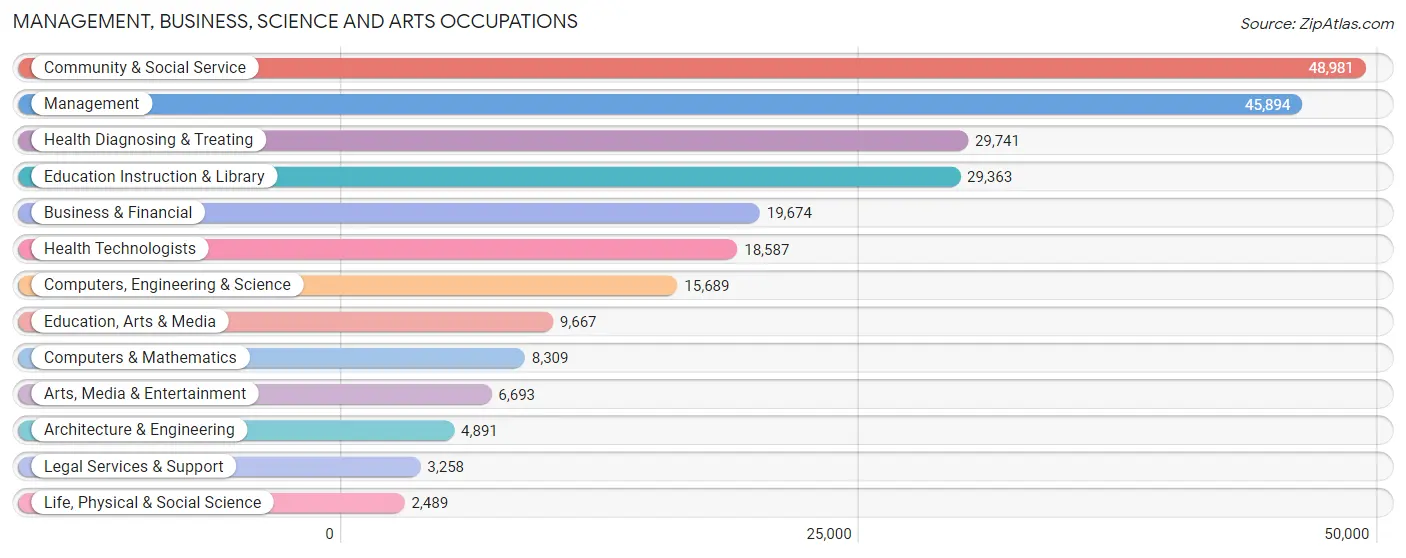
The most common Management, Business, Science and Arts occupations in Area Code 417 are Community & Social Service (48,981 | 10.4%), Management (45,894 | 9.8%), Health Diagnosing & Treating (29,741 | 6.4%), Education Instruction & Library (29,363 | 6.3%), and Business & Financial (19,674 | 4.2%).
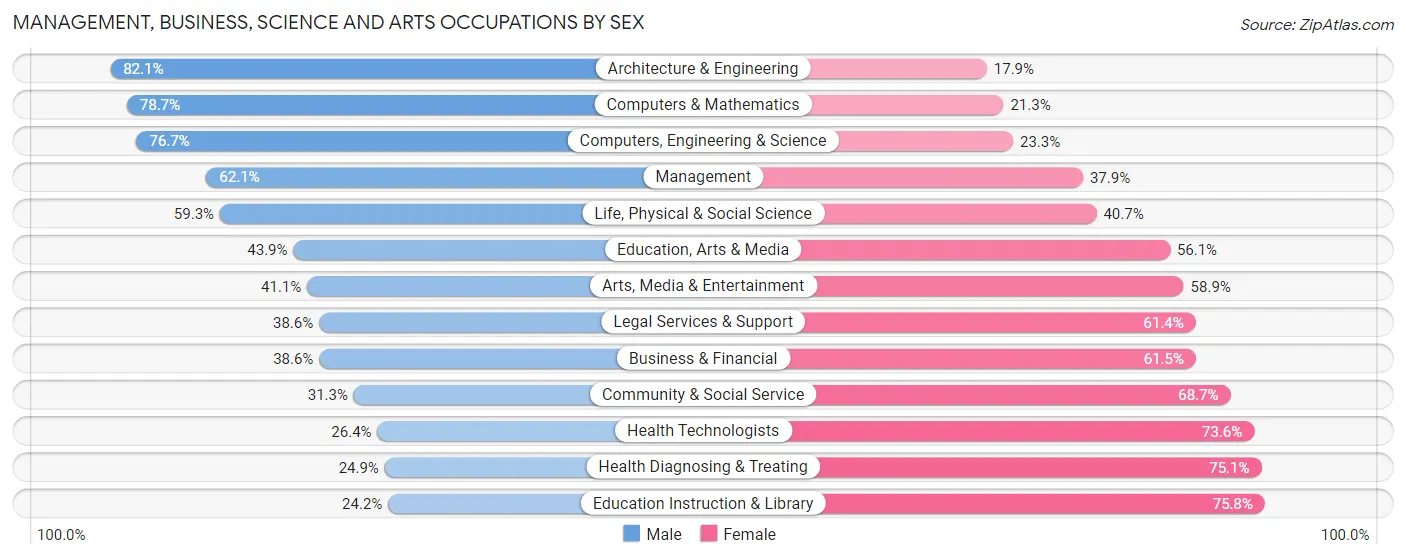
Management, Business, Science and Arts Occupations by Sex
Within the Management, Business, Science and Arts occupations in Area Code 417, the most male-oriented occupations are Architecture & Engineering (82.1%), Computers & Mathematics (78.7%), and Computers, Engineering & Science (76.7%), while the most female-oriented occupations are Education Instruction & Library (75.8%), Health Diagnosing & Treating (75.1%), and Health Technologists (73.6%).
| Occupation | Male | Female |
| Management | 28,485 (62.1%) | 17,409 (37.9%) |
| Business & Financial | 7,584 (38.6%) | 12,090 (61.5%) |
| Computers, Engineering & Science | 12,028 (76.7%) | 3,661 (23.3%) |
| Computers & Mathematics | 6,536 (78.7%) | 1,773 (21.3%) |
| Architecture & Engineering | 4,017 (82.1%) | 874 (17.9%) |
| Life, Physical & Social Science | 1,475 (59.3%) | 1,014 (40.7%) |
| Community & Social Service | 15,346 (31.3%) | 33,635 (68.7%) |
| Education, Arts & Media | 4,247 (43.9%) | 5,420 (56.1%) |
| Legal Services & Support | 1,257 (38.6%) | 2,001 (61.4%) |
| Education Instruction & Library | 7,093 (24.2%) | 22,270 (75.8%) |
| Arts, Media & Entertainment | 2,749 (41.1%) | 3,944 (58.9%) |
| Health Diagnosing & Treating | 7,399 (24.9%) | 22,342 (75.1%) |
| Health Technologists | 4,907 (26.4%) | 13,680 (73.6%) |
| Total (Category) | 70,842 (44.3%) | 89,137 (55.7%) |
| Total (Overall) | 247,750 (52.9%) | 220,864 (47.1%) |
Services Occupations
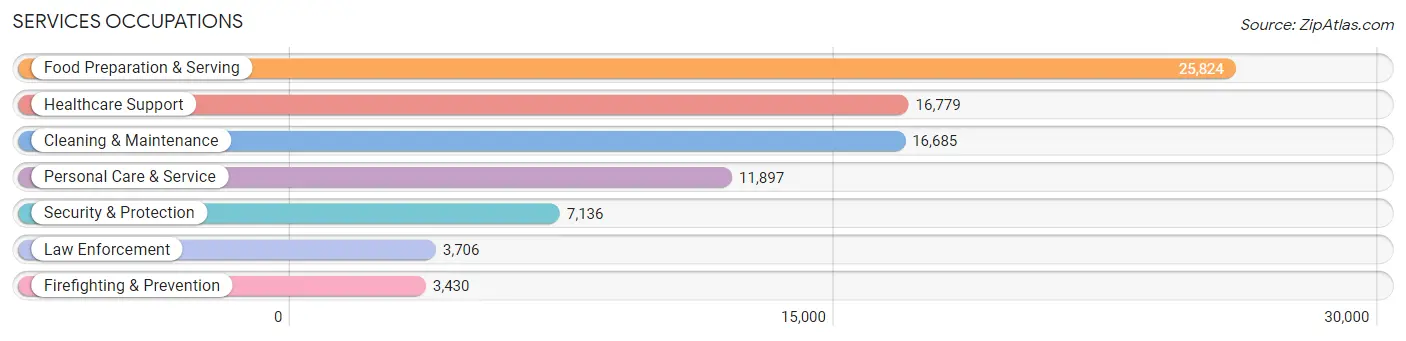
The most common Services occupations in Area Code 417 are Food Preparation & Serving (25,824 | 5.5%), Healthcare Support (16,779 | 3.6%), Cleaning & Maintenance (16,685 | 3.6%), Personal Care & Service (11,897 | 2.5%), and Security & Protection (7,136 | 1.5%).
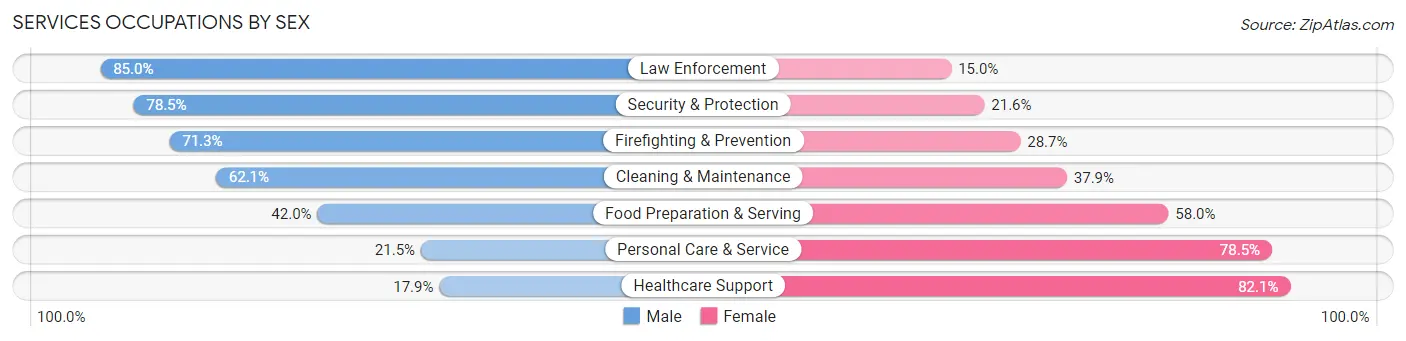
Services Occupations by Sex
Within the Services occupations in Area Code 417, the most male-oriented occupations are Law Enforcement (85.0%), Security & Protection (78.4%), and Firefighting & Prevention (71.3%), while the most female-oriented occupations are Healthcare Support (82.1%), Personal Care & Service (78.5%), and Food Preparation & Serving (58.0%).
| Occupation | Male | Female |
| Healthcare Support | 3,001 (17.9%) | 13,778 (82.1%) |
| Security & Protection | 5,598 (78.4%) | 1,538 (21.5%) |
| Firefighting & Prevention | 2,447 (71.3%) | 983 (28.7%) |
| Law Enforcement | 3,151 (85.0%) | 555 (15.0%) |
| Food Preparation & Serving | 10,851 (42.0%) | 14,973 (58.0%) |
| Cleaning & Maintenance | 10,364 (62.1%) | 6,321 (37.9%) |
| Personal Care & Service | 2,560 (21.5%) | 9,337 (78.5%) |
| Total (Category) | 32,374 (41.3%) | 45,947 (58.7%) |
| Total (Overall) | 247,750 (52.9%) | 220,864 (47.1%) |
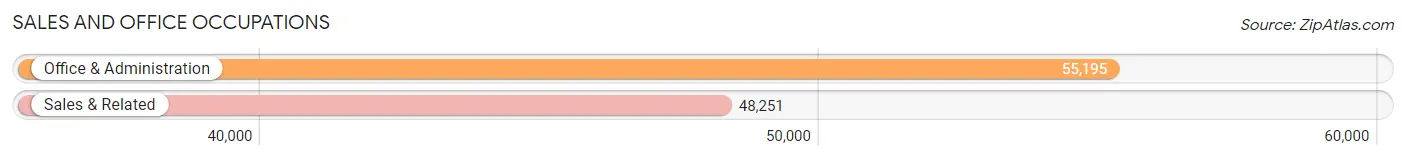
Sales and Office Occupations
The most common Sales and Office occupations in Area Code 417 are Office & Administration (55,195 | 11.8%), and Sales & Related (48,251 | 10.3%).
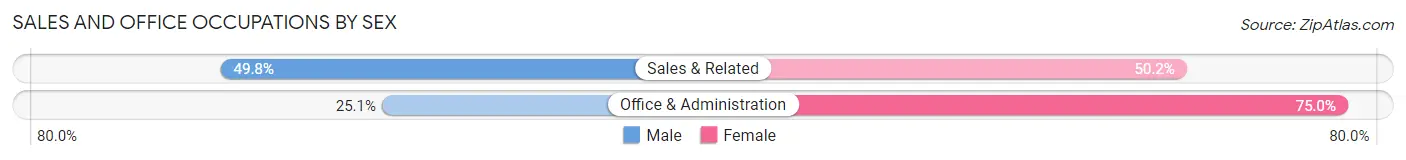
Sales and Office Occupations by Sex
| Occupation | Male | Female |
| Sales & Related | 24,047 (49.8%) | 24,204 (50.2%) |
| Office & Administration | 13,827 (25.1%) | 41,368 (75.0%) |
| Total (Category) | 37,874 (36.6%) | 65,572 (63.4%) |
| Total (Overall) | 247,750 (52.9%) | 220,864 (47.1%) |
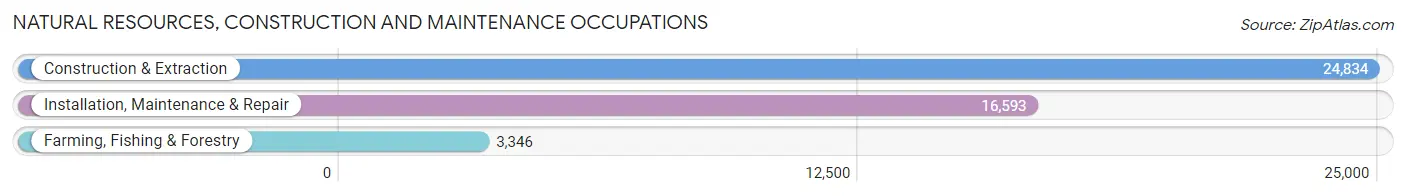
Natural Resources, Construction and Maintenance Occupations
The most common Natural Resources, Construction and Maintenance occupations in Area Code 417 are Construction & Extraction (24,834 | 5.3%), Installation, Maintenance & Repair (16,593 | 3.5%), and Farming, Fishing & Forestry (3,346 | 0.7%).
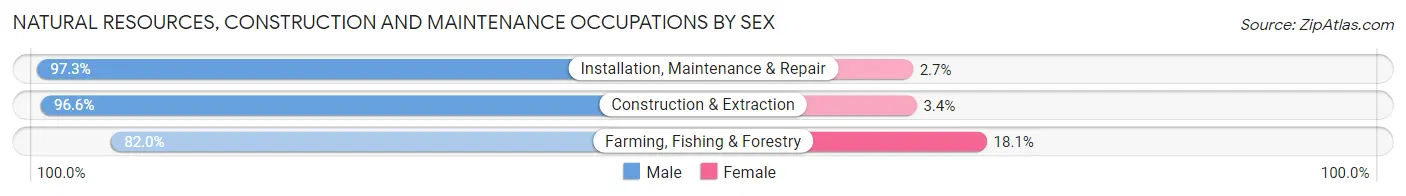
Natural Resources, Construction and Maintenance Occupations by Sex
| Occupation | Male | Female |
| Farming, Fishing & Forestry | 2,742 (82.0%) | 604 (18.0%) |
| Construction & Extraction | 23,979 (96.6%) | 855 (3.4%) |
| Installation, Maintenance & Repair | 16,152 (97.3%) | 441 (2.7%) |
| Total (Category) | 42,873 (95.8%) | 1,900 (4.2%) |
| Total (Overall) | 247,750 (52.9%) | 220,864 (47.1%) |
Production, Transportation and Moving Occupations
The most common Production, Transportation and Moving occupations in Area Code 417 are Production (38,270 | 8.2%), Transportation (22,009 | 4.7%), and Material Moving (21,816 | 4.7%).
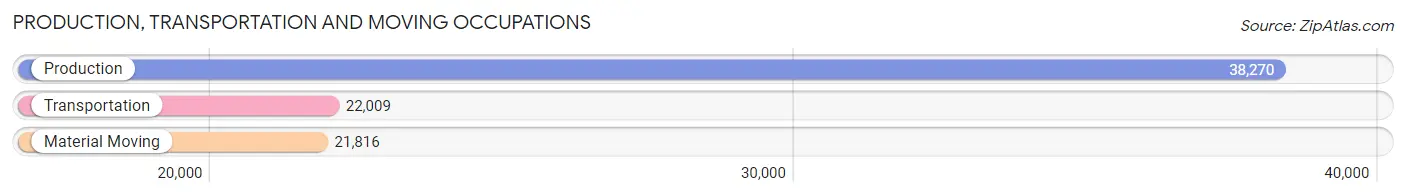
Production, Transportation and Moving Occupations by Sex
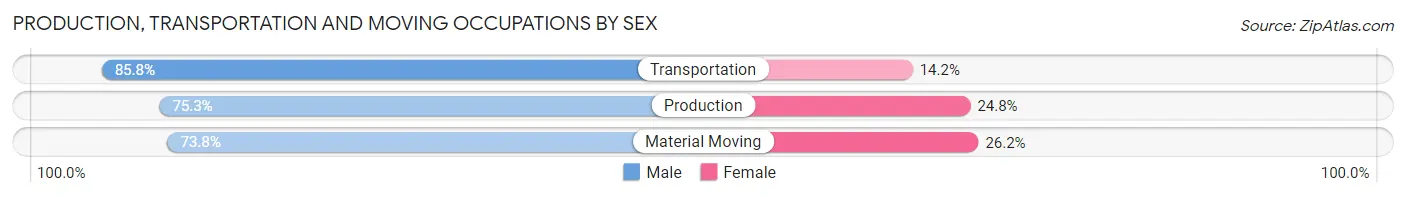
| Occupation | Male | Female |
| Production | 28,798 (75.2%) | 9,472 (24.7%) |
| Transportation | 18,893 (85.8%) | 3,116 (14.2%) |
| Material Moving | 16,096 (73.8%) | 5,720 (26.2%) |
| Total (Category) | 63,787 (77.7%) | 18,308 (22.3%) |
| Total (Overall) | 247,750 (52.9%) | 220,864 (47.1%) |
Employment Industries by Sex in Area Code 417
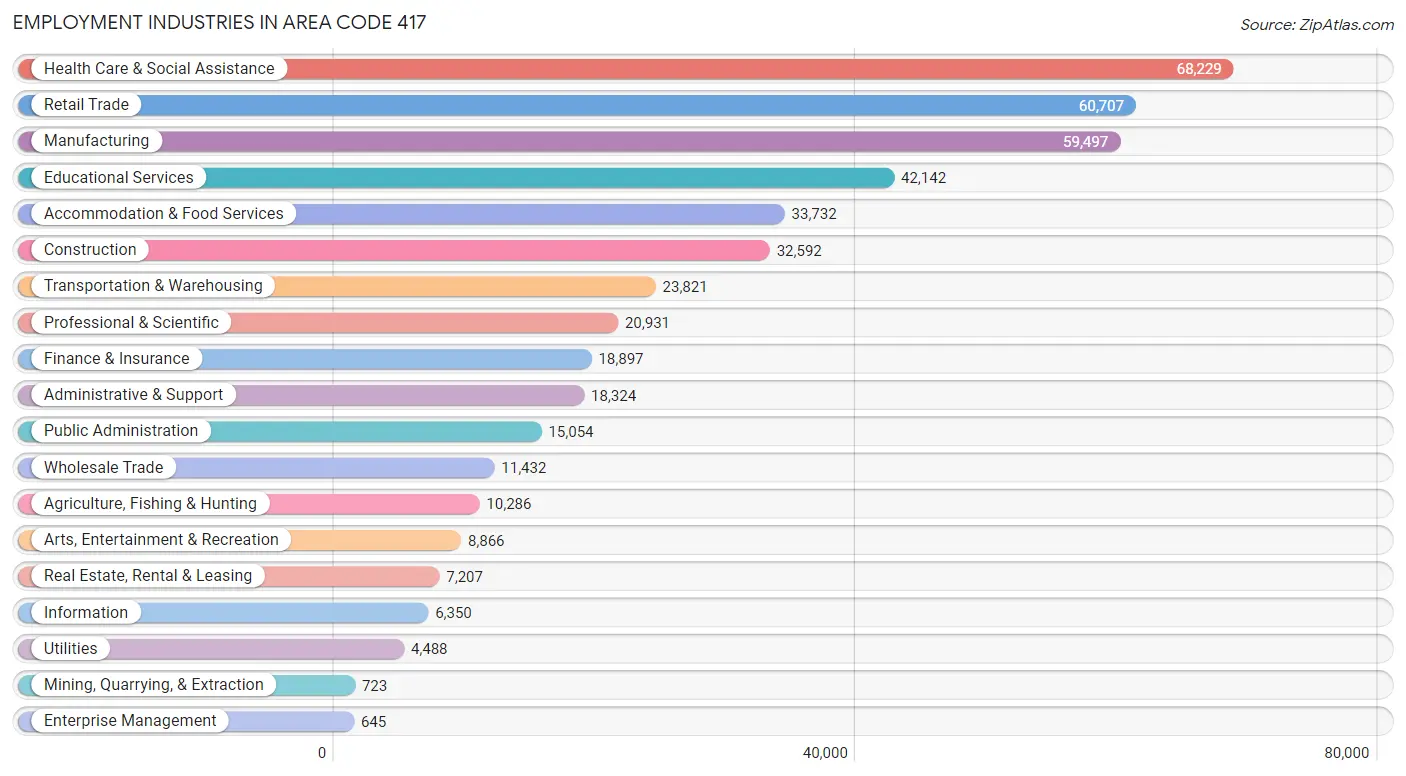
Employment Industries in Area Code 417
The major employment industries in Area Code 417 include Health Care & Social Assistance (68,229 | 14.6%), Retail Trade (60,707 | 13.0%), Manufacturing (59,497 | 12.7%), Educational Services (42,142 | 9.0%), and Accommodation & Food Services (33,732 | 7.2%).
Employment Industries by Sex in Area Code 417
The Area Code 417 industries that see more men than women are Construction (90.4%), Mining, Quarrying, & Extraction (84.5%), and Agriculture, Fishing & Hunting (82.1%), whereas the industries that tend to have a higher number of women are Health Care & Social Assistance (77.6%), Enterprise Management (72.6%), and Educational Services (69.7%).
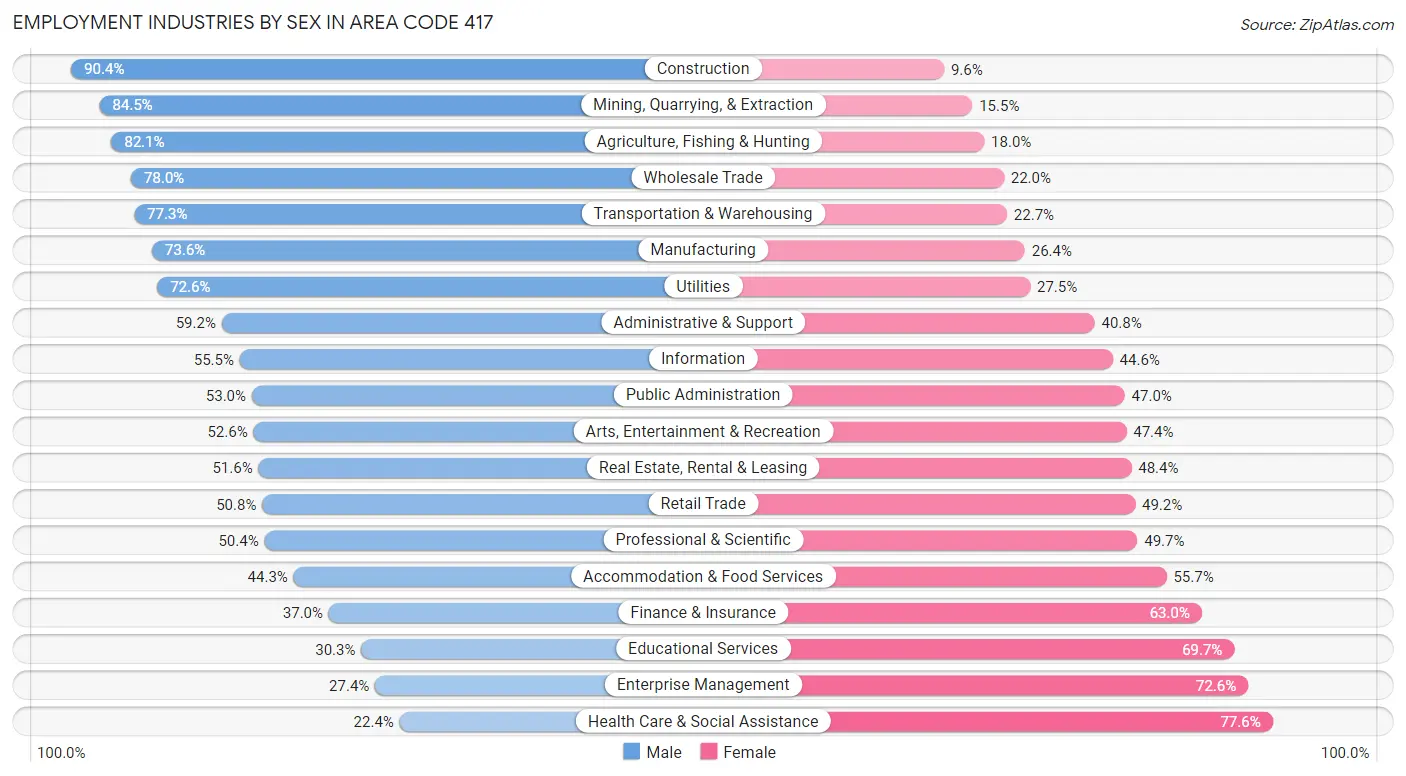
| Industry | Male | Female |
| Agriculture, Fishing & Hunting | 8,440 (82.1%) | 1,846 (17.9%) |
| Mining, Quarrying, & Extraction | 611 (84.5%) | 112 (15.5%) |
| Construction | 29,453 (90.4%) | 3,139 (9.6%) |
| Manufacturing | 43,816 (73.6%) | 15,681 (26.4%) |
| Wholesale Trade | 8,915 (78.0%) | 2,517 (22.0%) |
| Retail Trade | 30,847 (50.8%) | 29,860 (49.2%) |
| Transportation & Warehousing | 18,424 (77.3%) | 5,397 (22.7%) |
| Utilities | 3,256 (72.6%) | 1,232 (27.5%) |
| Information | 3,521 (55.4%) | 2,829 (44.6%) |
| Finance & Insurance | 6,995 (37.0%) | 11,902 (63.0%) |
| Real Estate, Rental & Leasing | 3,718 (51.6%) | 3,489 (48.4%) |
| Professional & Scientific | 10,538 (50.3%) | 10,393 (49.6%) |
| Enterprise Management | 177 (27.4%) | 468 (72.6%) |
| Administrative & Support | 10,848 (59.2%) | 7,476 (40.8%) |
| Educational Services | 12,768 (30.3%) | 29,374 (69.7%) |
| Health Care & Social Assistance | 15,260 (22.4%) | 52,969 (77.6%) |
| Arts, Entertainment & Recreation | 4,665 (52.6%) | 4,201 (47.4%) |
| Accommodation & Food Services | 14,945 (44.3%) | 18,787 (55.7%) |
| Public Administration | 7,972 (53.0%) | 7,082 (47.0%) |
| Total | 247,750 (52.9%) | 220,864 (47.1%) |
Education in Area Code 417
School Enrollment in Area Code 417
The most common levels of schooling among the 243,519 students in Area Code 417 are middle school (54,870 | 22.5%), high school (51,361 | 21.1%), and college / undergraduate (50,705 | 20.8%).
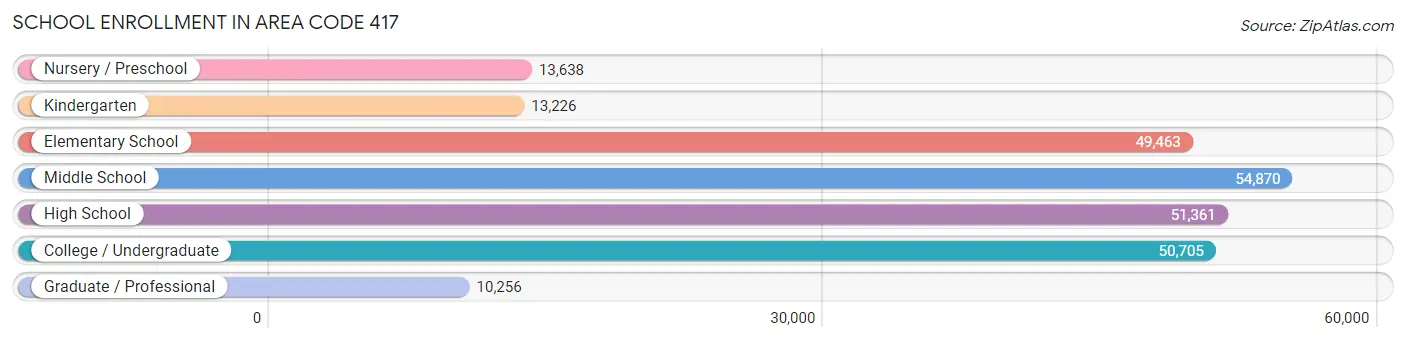
| School Level | # Students | % Students |
| Nursery / Preschool | 13,638 | 5.6% |
| Kindergarten | 13,226 | 5.4% |
| Elementary School | 49,463 | 20.3% |
| Middle School | 54,870 | 22.5% |
| High School | 51,361 | 21.1% |
| College / Undergraduate | 50,705 | 20.8% |
| Graduate / Professional | 10,256 | 4.2% |
| Total | 243,519 | 100.0% |
School Enrollment by Age by Funding Source in Area Code 417
Out of a total of 243,519 students who are enrolled in schools in Area Code 417, 40,169 (16.5%) attend a private institution, while the remaining 203,350 (83.5%) are enrolled in public schools. The age group of 3 to 4 year olds has the highest likelihood of being enrolled in private schools, with 2,725 (28.8% in the age bracket) enrolled. Conversely, the age group of 15 to 17 year olds has the lowest likelihood of being enrolled in a private school, with 34,825 (89.4% in the age bracket) attending a public institution.
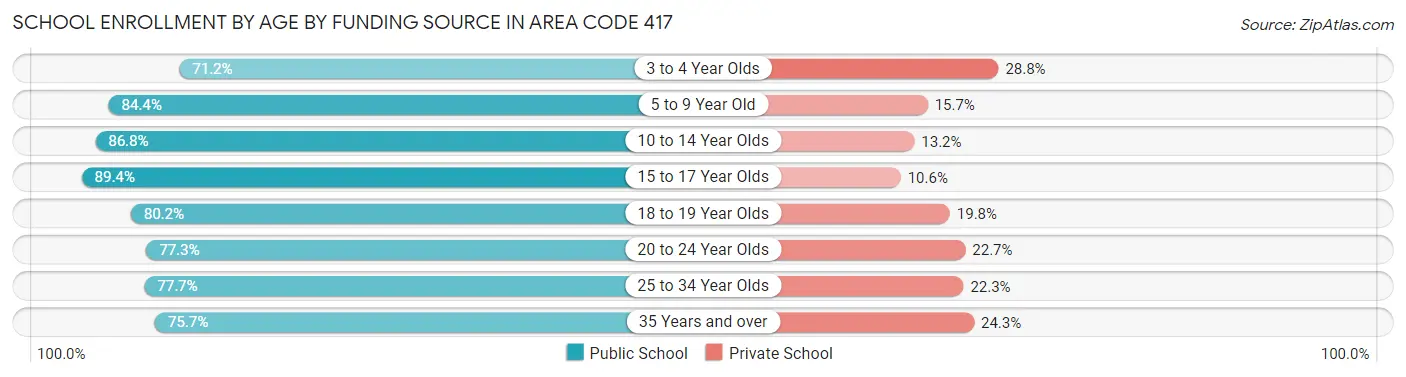
| Age Bracket | Public School | Private School |
| 3 to 4 Year Olds | 6,727 (71.2%) | 2,725 (28.8%) |
| 5 to 9 Year Old | 50,056 (84.4%) | 9,286 (15.7%) |
| 10 to 14 Year Olds | 58,240 (86.8%) | 8,835 (13.2%) |
| 15 to 17 Year Olds | 34,825 (89.4%) | 4,143 (10.6%) |
| 18 to 19 Year Olds | 15,198 (80.2%) | 3,747 (19.8%) |
| 20 to 24 Year Olds | 20,533 (77.3%) | 6,019 (22.7%) |
| 25 to 34 Year Olds | 9,016 (77.7%) | 2,589 (22.3%) |
| 35 Years and over | 8,767 (75.7%) | 2,813 (24.3%) |
| Total | 203,350 (83.5%) | 40,169 (16.5%) |
Educational Attainment by Field of Study in Area Code 417
Business (34,850 | 19.2%), education (34,573 | 19.1%), science & technology (20,837 | 11.5%), bio, nature & agricultural (14,549 | 8.0%), and arts & humanities (11,813 | 6.5%) are the most common fields of study among 181,323 individuals in Area Code 417 who have obtained a bachelor's degree or higher.
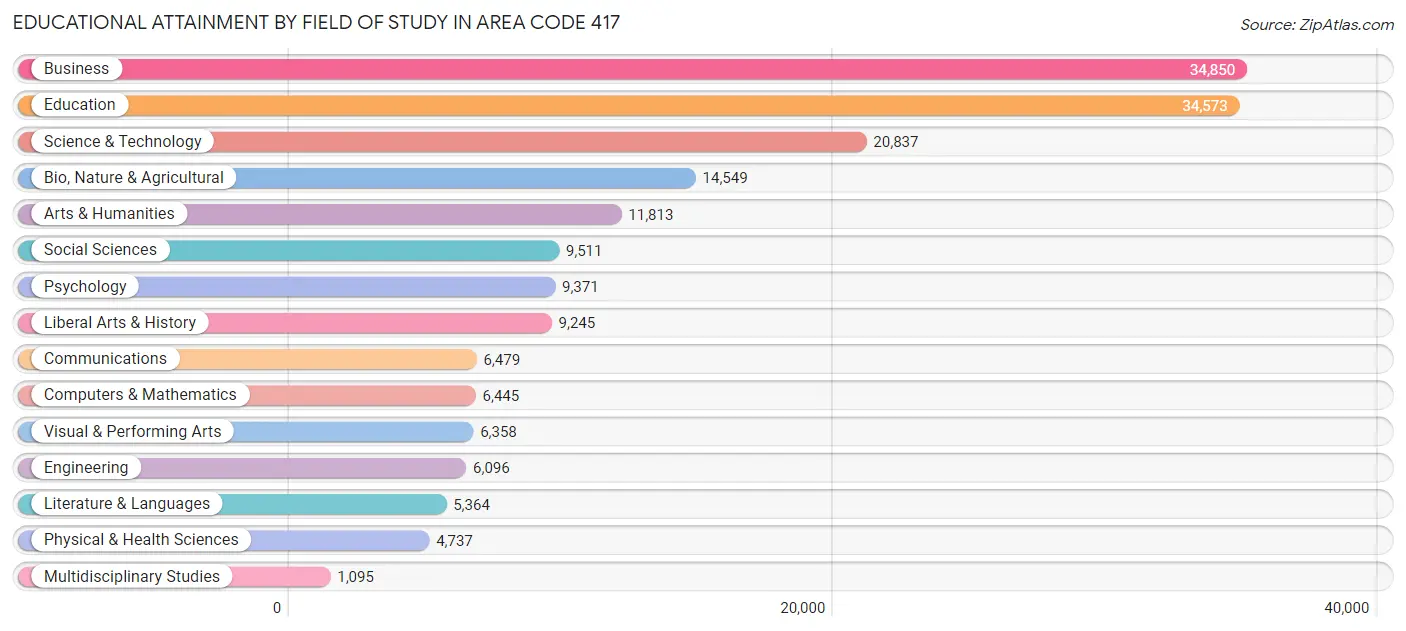
| Field of Study | # Graduates | % Graduates |
| Computers & Mathematics | 6,445 | 3.5% |
| Bio, Nature & Agricultural | 14,549 | 8.0% |
| Physical & Health Sciences | 4,737 | 2.6% |
| Psychology | 9,371 | 5.2% |
| Social Sciences | 9,511 | 5.2% |
| Engineering | 6,096 | 3.4% |
| Multidisciplinary Studies | 1,095 | 0.6% |
| Science & Technology | 20,837 | 11.5% |
| Business | 34,850 | 19.2% |
| Education | 34,573 | 19.1% |
| Literature & Languages | 5,364 | 3.0% |
| Liberal Arts & History | 9,245 | 5.1% |
| Visual & Performing Arts | 6,358 | 3.5% |
| Communications | 6,479 | 3.6% |
| Arts & Humanities | 11,813 | 6.5% |
| Total | 181,323 | 100.0% |
Transportation & Commute in Area Code 417
Vehicle Availability by Sex in Area Code 417
The most prevalent vehicle ownership categories in Area Code 417 are males with 2 vehicles (99,141, accounting for 40.8%) and females with 2 vehicles (84,819, making up 46.4%).
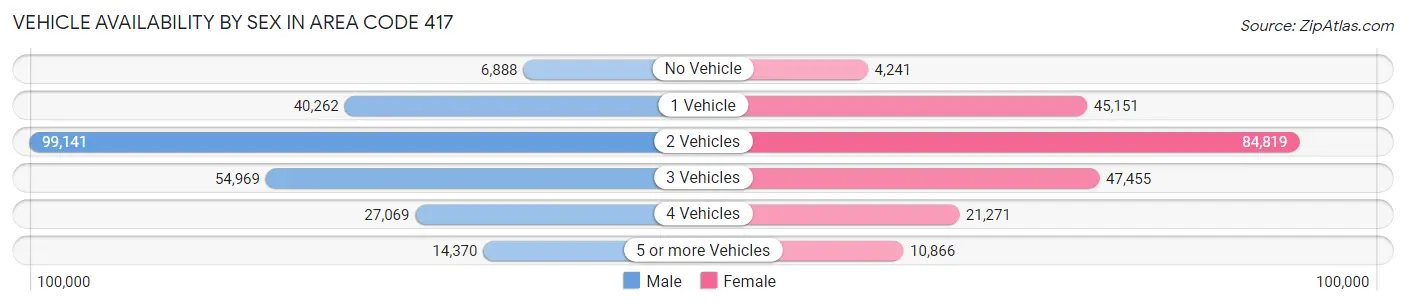
| Vehicles Available | Male | Female |
| No Vehicle | 6,888 (2.8%) | 4,241 (2.0%) |
| 1 Vehicle | 40,262 (16.6%) | 45,151 (21.1%) |
| 2 Vehicles | 99,141 (40.8%) | 84,819 (39.7%) |
| 3 Vehicles | 54,969 (22.7%) | 47,455 (22.2%) |
| 4 Vehicles | 27,069 (11.2%) | 21,271 (10.0%) |
| 5 or more Vehicles | 14,370 (5.9%) | 10,866 (5.1%) |
| Total | 242,699 (100.0%) | 213,803 (100.0%) |
Commute Time in Area Code 417
The most frequently occuring commute durations in Area Code 417 are 15 to 19 minutes (71,175 commuters, 16.8%), 20 to 24 minutes (67,023 commuters, 15.8%), and 10 to 14 minutes (66,902 commuters, 15.8%).
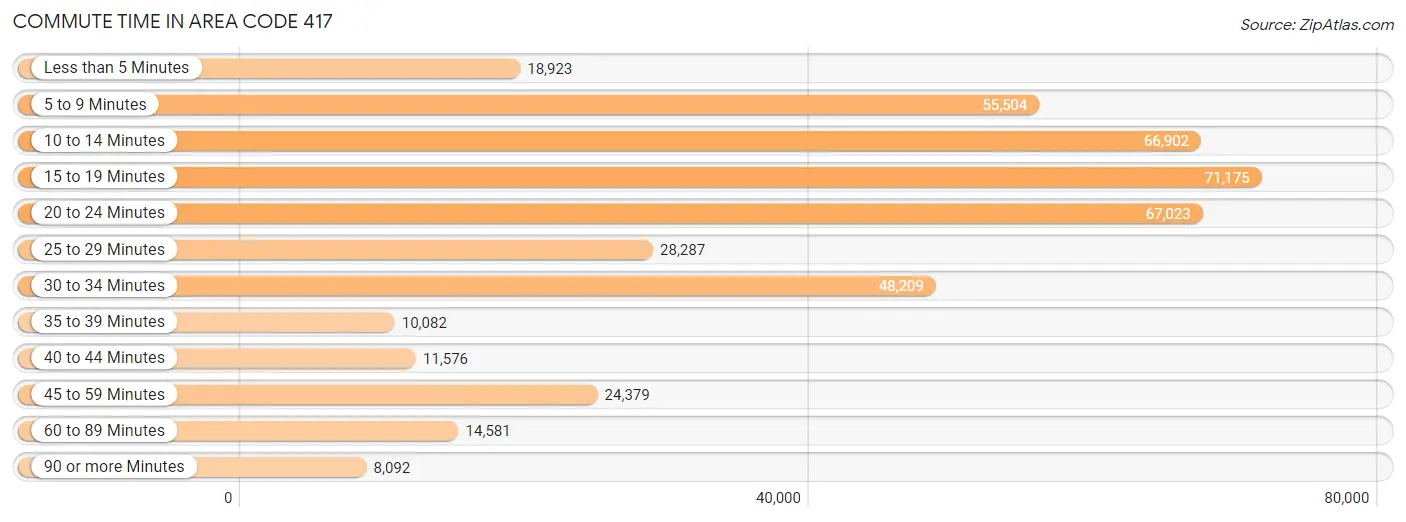
| Commute Time | # Commuters | % Commuters |
| Less than 5 Minutes | 18,923 | 4.5% |
| 5 to 9 Minutes | 55,504 | 13.1% |
| 10 to 14 Minutes | 66,902 | 15.8% |
| 15 to 19 Minutes | 71,175 | 16.8% |
| 20 to 24 Minutes | 67,023 | 15.8% |
| 25 to 29 Minutes | 28,287 | 6.7% |
| 30 to 34 Minutes | 48,209 | 11.4% |
| 35 to 39 Minutes | 10,082 | 2.4% |
| 40 to 44 Minutes | 11,576 | 2.7% |
| 45 to 59 Minutes | 24,379 | 5.7% |
| 60 to 89 Minutes | 14,581 | 3.4% |
| 90 or more Minutes | 8,092 | 1.9% |
Commute Time by Sex in Area Code 417
The most common commute times in Area Code 417 are 15 to 19 minutes (37,220 commuters, 16.5%) for males and 15 to 19 minutes (33,955 commuters, 17.1%) for females.
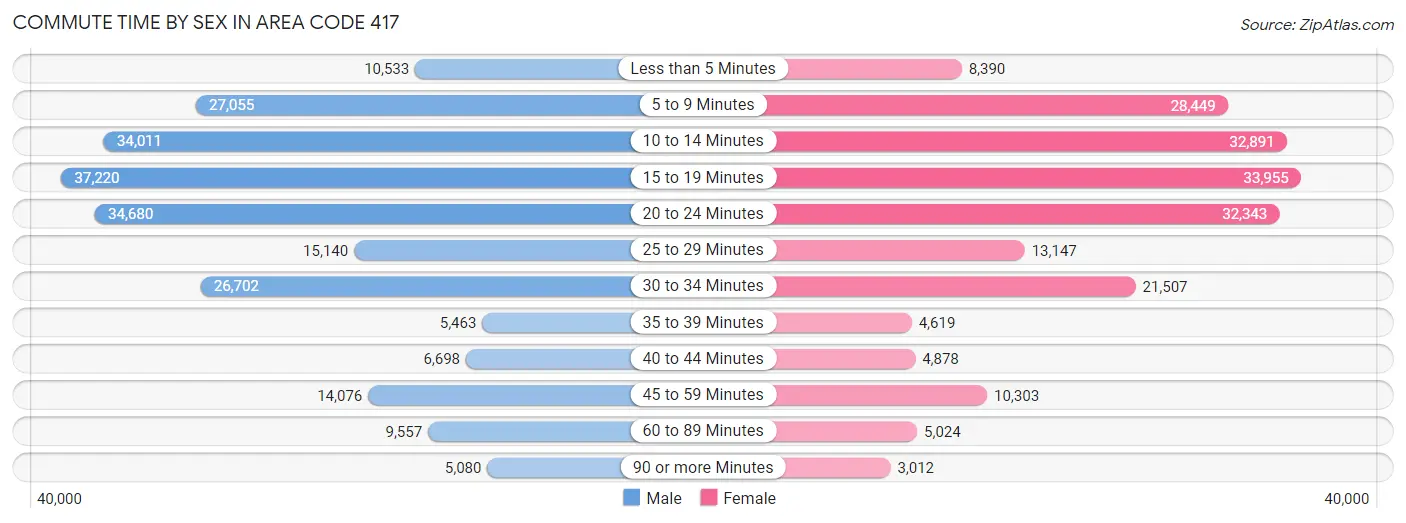
| Commute Time | Male | Female |
| Less than 5 Minutes | 10,533 (4.7%) | 8,390 (4.2%) |
| 5 to 9 Minutes | 27,055 (12.0%) | 28,449 (14.3%) |
| 10 to 14 Minutes | 34,011 (15.0%) | 32,891 (16.6%) |
| 15 to 19 Minutes | 37,220 (16.5%) | 33,955 (17.1%) |
| 20 to 24 Minutes | 34,680 (15.3%) | 32,343 (16.3%) |
| 25 to 29 Minutes | 15,140 (6.7%) | 13,147 (6.6%) |
| 30 to 34 Minutes | 26,702 (11.8%) | 21,507 (10.8%) |
| 35 to 39 Minutes | 5,463 (2.4%) | 4,619 (2.3%) |
| 40 to 44 Minutes | 6,698 (3.0%) | 4,878 (2.5%) |
| 45 to 59 Minutes | 14,076 (6.2%) | 10,303 (5.2%) |
| 60 to 89 Minutes | 9,557 (4.2%) | 5,024 (2.5%) |
| 90 or more Minutes | 5,080 (2.2%) | 3,012 (1.5%) |
Time of Departure to Work by Sex in Area Code 417
The most frequent times of departure to work in Area Code 417 are 7:00 AM to 7:29 AM (34,240, 15.1%) for males and 7:00 AM to 7:29 AM (34,631, 17.4%) for females.
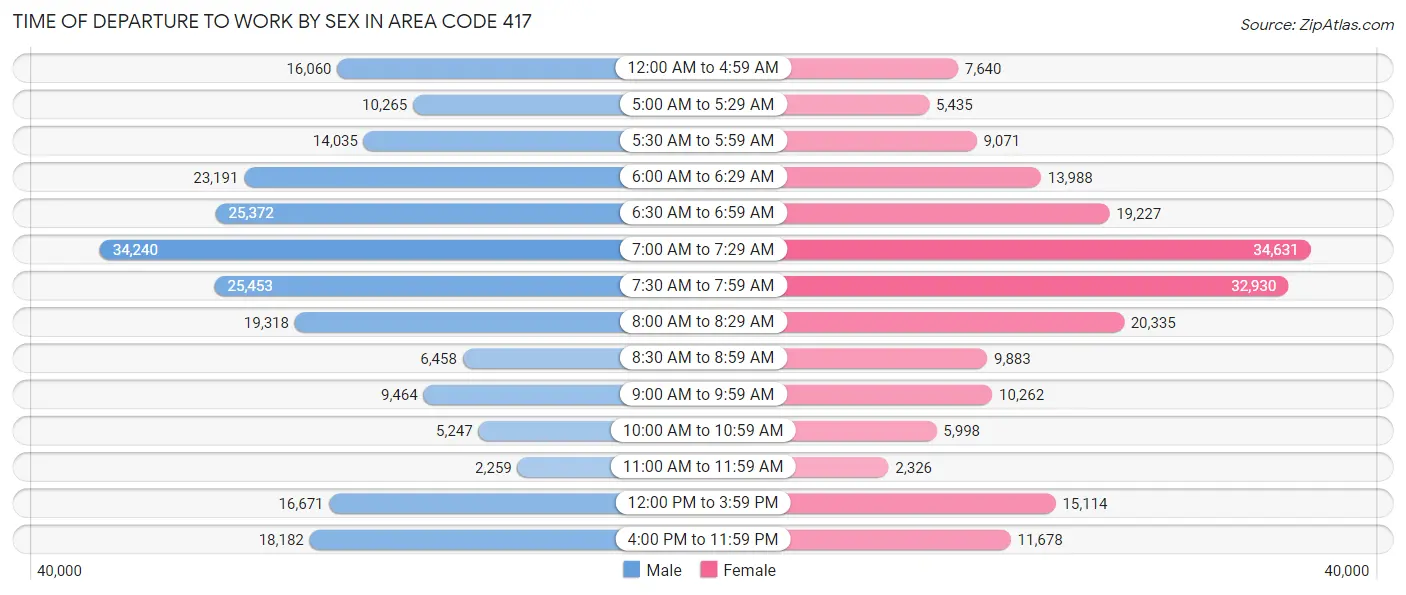
| Time of Departure | Male | Female |
| 12:00 AM to 4:59 AM | 16,060 (7.1%) | 7,640 (3.8%) |
| 5:00 AM to 5:29 AM | 10,265 (4.5%) | 5,435 (2.7%) |
| 5:30 AM to 5:59 AM | 14,035 (6.2%) | 9,071 (4.6%) |
| 6:00 AM to 6:29 AM | 23,191 (10.2%) | 13,988 (7.0%) |
| 6:30 AM to 6:59 AM | 25,372 (11.2%) | 19,227 (9.7%) |
| 7:00 AM to 7:29 AM | 34,240 (15.1%) | 34,631 (17.4%) |
| 7:30 AM to 7:59 AM | 25,453 (11.3%) | 32,930 (16.6%) |
| 8:00 AM to 8:29 AM | 19,318 (8.5%) | 20,335 (10.2%) |
| 8:30 AM to 8:59 AM | 6,458 (2.9%) | 9,883 (5.0%) |
| 9:00 AM to 9:59 AM | 9,464 (4.2%) | 10,262 (5.2%) |
| 10:00 AM to 10:59 AM | 5,247 (2.3%) | 5,998 (3.0%) |
| 11:00 AM to 11:59 AM | 2,259 (1.0%) | 2,326 (1.2%) |
| 12:00 PM to 3:59 PM | 16,671 (7.4%) | 15,114 (7.6%) |
| 4:00 PM to 11:59 PM | 18,182 (8.0%) | 11,678 (5.9%) |
| Total | 226,215 (100.0%) | 198,518 (100.0%) |
Housing Occupancy in Area Code 417
Occupancy by Ownership in Area Code 417
Of the total 416,944 dwellings in Area Code 417, owner-occupied units account for 279,906 (67.1%), while renter-occupied units make up 137,038 (32.9%).
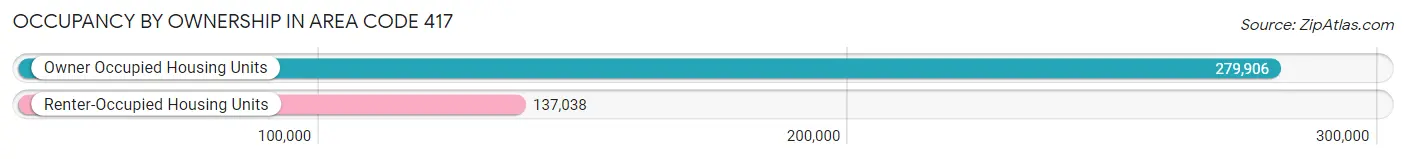
| Occupancy | # Housing Units | % Housing Units |
| Owner Occupied Housing Units | 279,906 | 67.1% |
| Renter-Occupied Housing Units | 137,038 | 32.9% |
| Total Occupied Housing Units | 416,944 | 100.0% |
Occupancy by Household Size in Area Code 417
| Household Size | # Housing Units | % Housing Units |
| 1-Person Household | 119,632 | 28.7% |
| 2-Person Household | 157,510 | 37.8% |
| 3-Person Household | 57,217 | 13.7% |
| 4+ Person Household | 82,585 | 19.8% |
| Total Housing Units | 416,944 | 100.0% |
Occupancy by Ownership by Household Size in Area Code 417
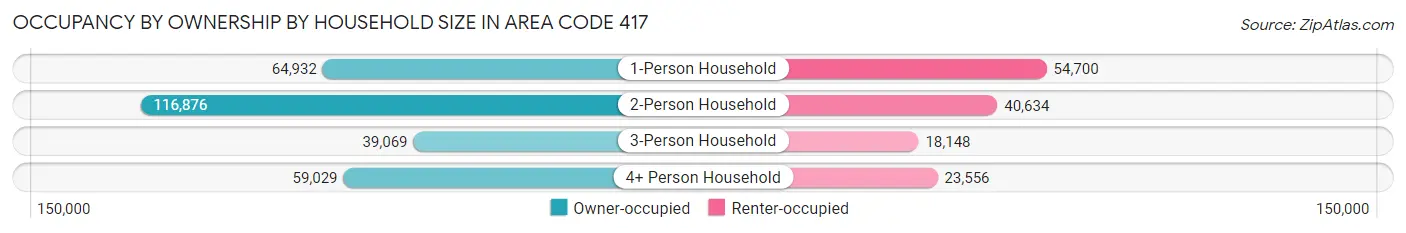
| Household Size | Owner-occupied | Renter-occupied |
| 1-Person Household | 64,932 (54.3%) | 54,700 (45.7%) |
| 2-Person Household | 116,876 (74.2%) | 40,634 (25.8%) |
| 3-Person Household | 39,069 (68.3%) | 18,148 (31.7%) |
| 4+ Person Household | 59,029 (71.5%) | 23,556 (28.5%) |
| Total Housing Units | 279,906 (67.1%) | 137,038 (32.9%) |
Occupancy by Educational Attainment in Area Code 417
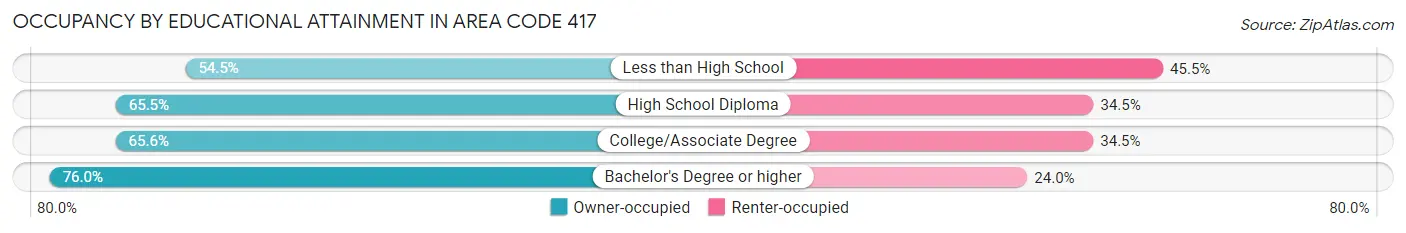
| Household Size | Owner-occupied | Renter-occupied |
| Less than High School | 21,433 (54.5%) | 17,907 (45.5%) |
| High School Diploma | 86,940 (65.5%) | 45,746 (34.5%) |
| College/Associate Degree | 91,691 (65.5%) | 48,183 (34.4%) |
| Bachelor's Degree or higher | 79,842 (76.0%) | 25,202 (24.0%) |
Occupancy by Age of Householder in Area Code 417
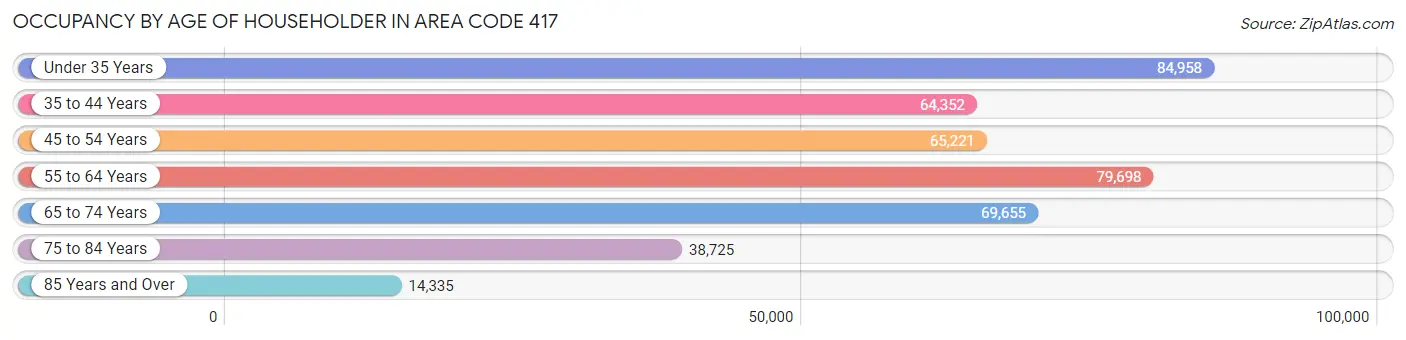
| Age Bracket | # Households | % Households |
| Under 35 Years | 84,958 | 20.4% |
| 35 to 44 Years | 64,352 | 15.4% |
| 45 to 54 Years | 65,221 | 15.6% |
| 55 to 64 Years | 79,698 | 19.1% |
| 65 to 74 Years | 69,655 | 16.7% |
| 75 to 84 Years | 38,725 | 9.3% |
| 85 Years and Over | 14,335 | 3.4% |
| Total | 416,944 | 100.0% |
Housing Finances in Area Code 417
Median Income by Occupancy in Area Code 417
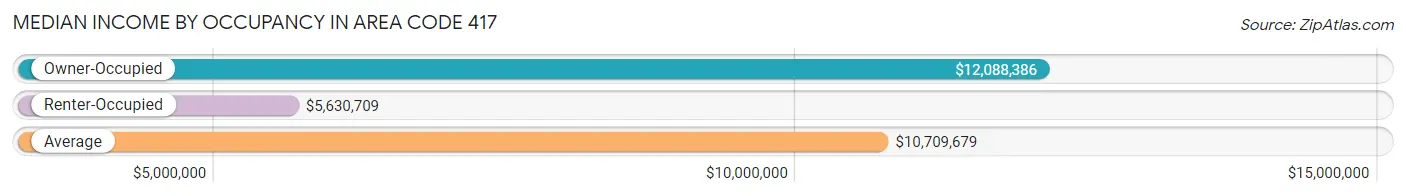
| Occupancy Type | # Households | Median Income |
| Owner-Occupied | 279,906 (67.1%) | $12,088,386 |
| Renter-Occupied | 137,038 (32.9%) | $5,630,709 |
| Average | 416,944 (100.0%) | $10,709,679 |
Occupancy by Householder Income Bracket in Area Code 417
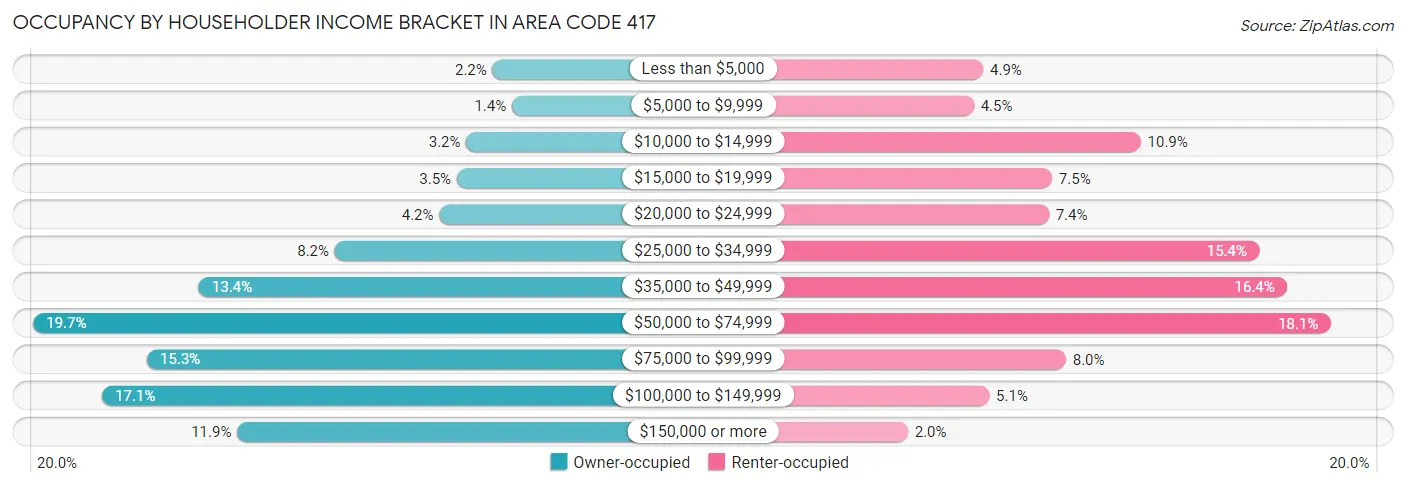
| Income Bracket | Owner-occupied | Renter-occupied |
| Less than $5,000 | 6,071 (2.2%) | 6,654 (4.9%) |
| $5,000 to $9,999 | 4,014 (1.4%) | 6,170 (4.5%) |
| $10,000 to $14,999 | 8,879 (3.2%) | 14,876 (10.9%) |
| $15,000 to $19,999 | 9,883 (3.5%) | 10,247 (7.5%) |
| $20,000 to $24,999 | 11,743 (4.2%) | 10,091 (7.4%) |
| $25,000 to $34,999 | 22,896 (8.2%) | 21,049 (15.4%) |
| $35,000 to $49,999 | 37,403 (13.4%) | 22,500 (16.4%) |
| $50,000 to $74,999 | 55,053 (19.7%) | 24,775 (18.1%) |
| $75,000 to $99,999 | 42,931 (15.3%) | 10,981 (8.0%) |
| $100,000 to $149,999 | 47,726 (17.1%) | 6,972 (5.1%) |
| $150,000 or more | 33,307 (11.9%) | 2,723 (2.0%) |
| Total | 279,906 (100.0%) | 137,038 (100.0%) |
Monthly Housing Cost Tiers in Area Code 417
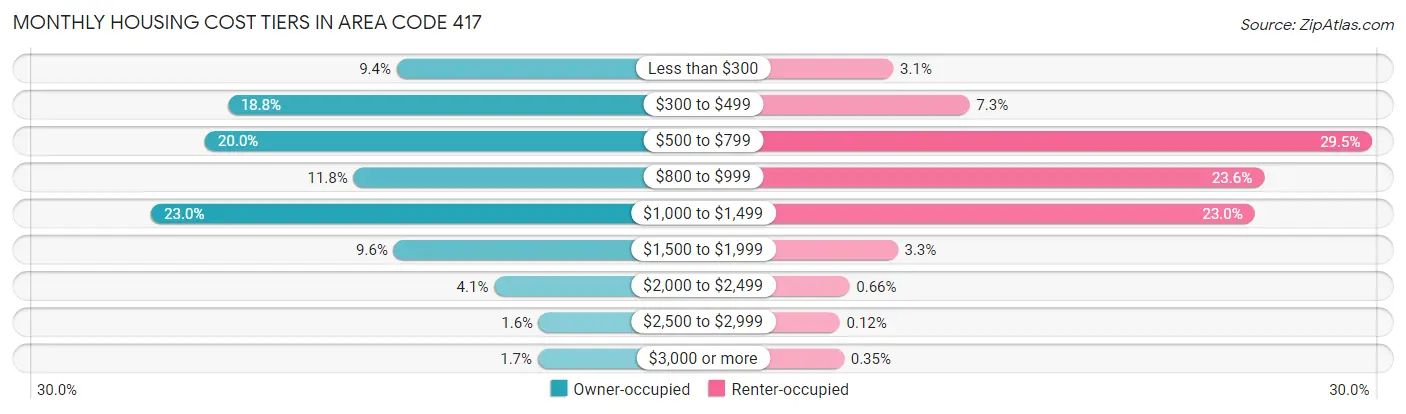
| Monthly Cost | Owner-occupied | Renter-occupied |
| Less than $300 | 26,414 (9.4%) | 4,216 (3.1%) |
| $300 to $499 | 52,575 (18.8%) | 9,991 (7.3%) |
| $500 to $799 | 56,083 (20.0%) | 40,482 (29.5%) |
| $800 to $999 | 33,101 (11.8%) | 32,291 (23.6%) |
| $1,000 to $1,499 | 64,418 (23.0%) | 31,567 (23.0%) |
| $1,500 to $1,999 | 26,890 (9.6%) | 4,545 (3.3%) |
| $2,000 to $2,499 | 11,363 (4.1%) | 904 (0.7%) |
| $2,500 to $2,999 | 4,439 (1.6%) | 167 (0.1%) |
| $3,000 or more | 4,623 (1.7%) | 479 (0.4%) |
| Total | 279,906 (100.0%) | 137,038 (100.0%) |
Physical Housing Characteristics in Area Code 417
Housing Structures in Area Code 417
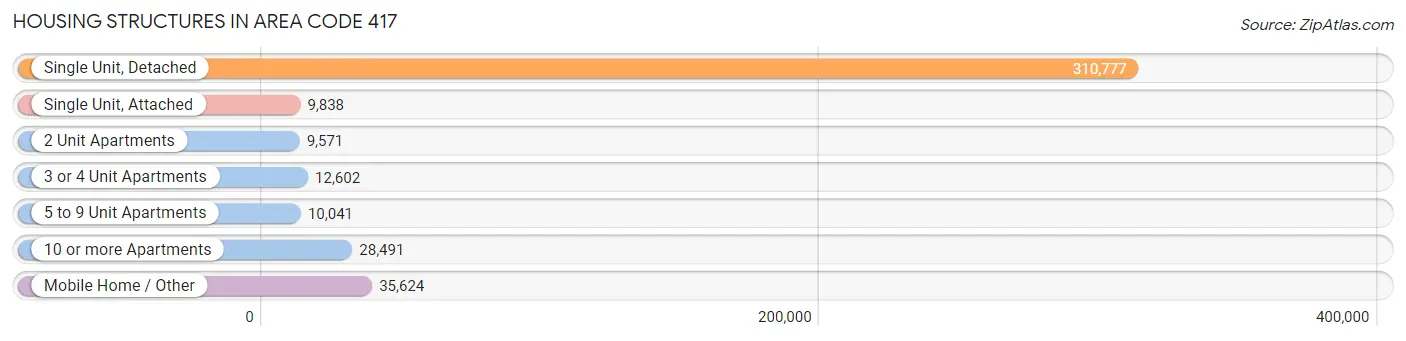
| Structure Type | # Housing Units | % Housing Units |
| Single Unit, Detached | 310,777 | 74.5% |
| Single Unit, Attached | 9,838 | 2.4% |
| 2 Unit Apartments | 9,571 | 2.3% |
| 3 or 4 Unit Apartments | 12,602 | 3.0% |
| 5 to 9 Unit Apartments | 10,041 | 2.4% |
| 10 or more Apartments | 28,491 | 6.8% |
| Mobile Home / Other | 35,624 | 8.5% |
| Total | 416,944 | 100.0% |
Housing Structures by Occupancy in Area Code 417
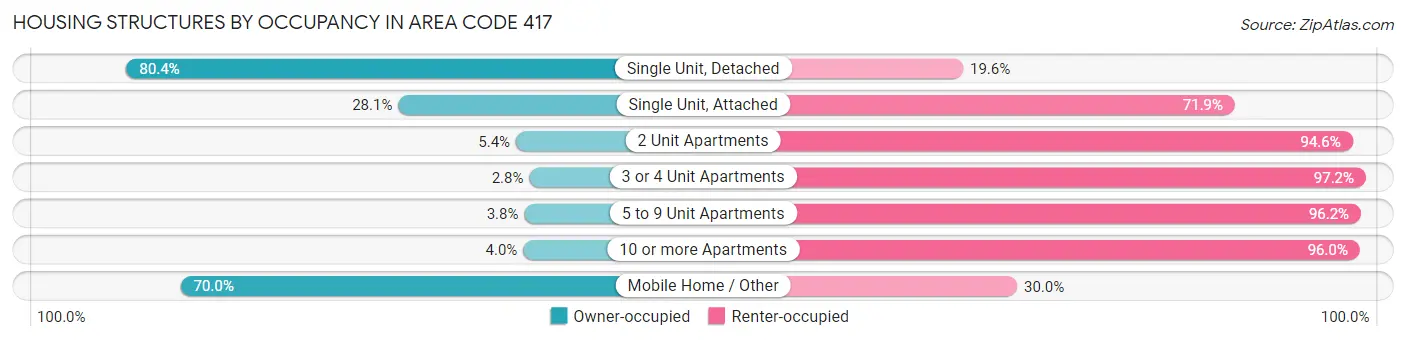
| Structure Type | Owner-occupied | Renter-occupied |
| Single Unit, Detached | 249,819 (80.4%) | 60,958 (19.6%) |
| Single Unit, Attached | 2,761 (28.1%) | 7,077 (71.9%) |
| 2 Unit Apartments | 517 (5.4%) | 9,054 (94.6%) |
| 3 or 4 Unit Apartments | 357 (2.8%) | 12,245 (97.2%) |
| 5 to 9 Unit Apartments | 380 (3.8%) | 9,661 (96.2%) |
| 10 or more Apartments | 1,143 (4.0%) | 27,348 (96.0%) |
| Mobile Home / Other | 24,929 (70.0%) | 10,695 (30.0%) |
| Total | 279,906 (67.1%) | 137,038 (32.9%) |
Housing Structures by Number of Rooms in Area Code 417
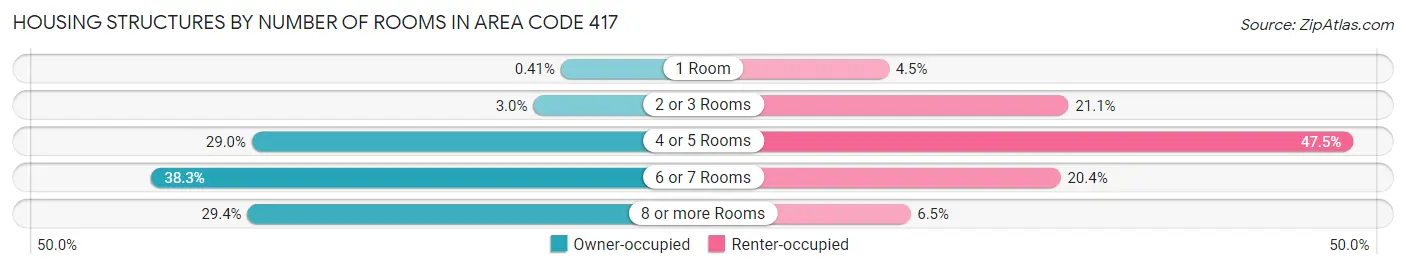
| Number of Rooms | Owner-occupied | Renter-occupied |
| 1 Room | 1,134 (0.4%) | 6,181 (4.5%) |
| 2 or 3 Rooms | 8,266 (2.9%) | 28,957 (21.1%) |
| 4 or 5 Rooms | 81,126 (29.0%) | 65,022 (47.4%) |
| 6 or 7 Rooms | 107,126 (38.3%) | 27,950 (20.4%) |
| 8 or more Rooms | 82,254 (29.4%) | 8,928 (6.5%) |
| Total | 279,906 (100.0%) | 137,038 (100.0%) |
Housing Structure by Heating Type in Area Code 417
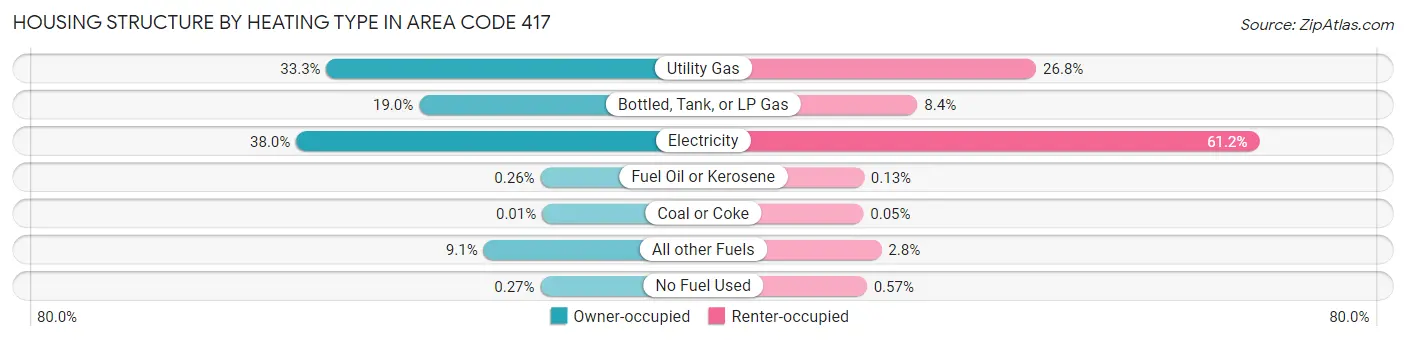
| Heating Type | Owner-occupied | Renter-occupied |
| Utility Gas | 93,323 (33.3%) | 36,674 (26.8%) |
| Bottled, Tank, or LP Gas | 53,245 (19.0%) | 11,517 (8.4%) |
| Electricity | 106,448 (38.0%) | 83,917 (61.2%) |
| Fuel Oil or Kerosene | 734 (0.3%) | 179 (0.1%) |
| Coal or Coke | 40 (0.0%) | 75 (0.1%) |
| All other Fuels | 25,356 (9.1%) | 3,895 (2.8%) |
| No Fuel Used | 760 (0.3%) | 781 (0.6%) |
| Total | 279,906 (100.0%) | 137,038 (100.0%) |
Household Vehicle Usage in Area Code 417
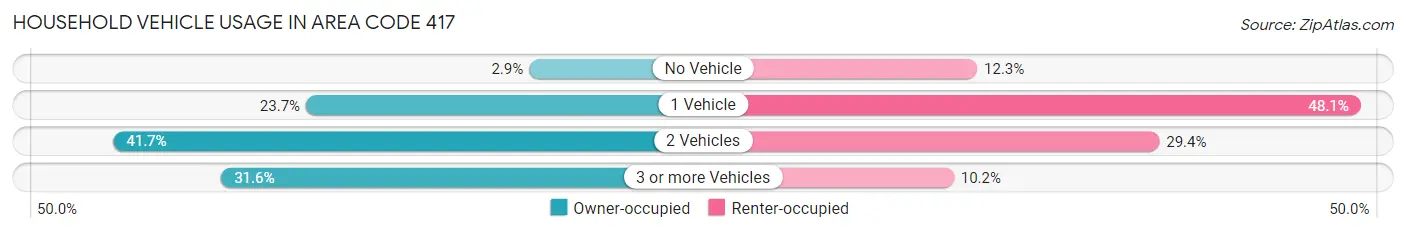
| Vehicles per Household | Owner-occupied | Renter-occupied |
| No Vehicle | 8,134 (2.9%) | 16,912 (12.3%) |
| 1 Vehicle | 66,453 (23.7%) | 65,973 (48.1%) |
| 2 Vehicles | 116,760 (41.7%) | 40,226 (29.3%) |
| 3 or more Vehicles | 88,559 (31.6%) | 13,927 (10.2%) |
| Total | 279,906 (100.0%) | 137,038 (100.0%) |
Real Estate & Mortgages in Area Code 417
Real Estate and Mortgage Overview in Area Code 417
| Characteristic | Without Mortgage | With Mortgage |
| Housing Units | 120,797 | 159,109 |
| Median Property Value | $26,181,299 | $30,924,300 |
| Median Household Income | $8,575,097 | $23,256 |
| Monthly Housing Costs | $80,183 | $4,478 |
| Real Estate Taxes | $161,205 | $3,018 |
Property Value by Mortgage Status in Area Code 417
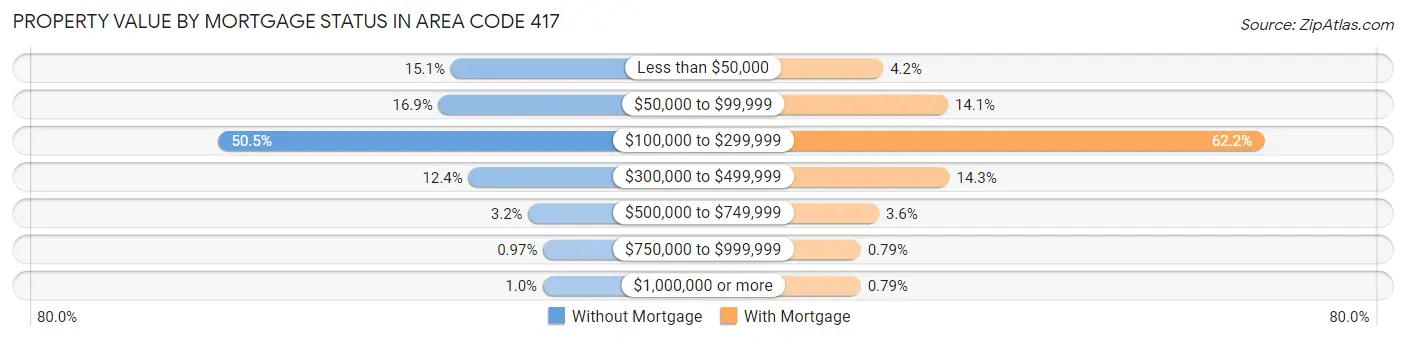
| Property Value | Without Mortgage | With Mortgage |
| Less than $50,000 | 18,195 (15.1%) | 6,713 (4.2%) |
| $50,000 to $99,999 | 20,434 (16.9%) | 22,406 (14.1%) |
| $100,000 to $299,999 | 60,937 (50.4%) | 99,013 (62.2%) |
| $300,000 to $499,999 | 14,925 (12.4%) | 22,799 (14.3%) |
| $500,000 to $749,999 | 3,904 (3.2%) | 5,668 (3.6%) |
| $750,000 to $999,999 | 1,170 (1.0%) | 1,258 (0.8%) |
| $1,000,000 or more | 1,232 (1.0%) | 1,252 (0.8%) |
| Total | 120,797 (100.0%) | 159,109 (100.0%) |
Household Income by Mortgage Status in Area Code 417
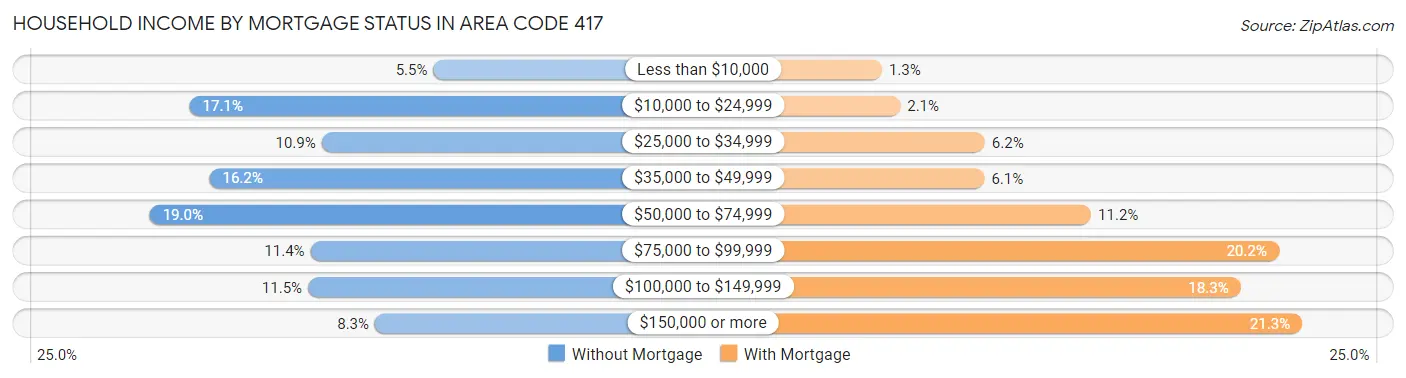
| Household Income | Without Mortgage | With Mortgage |
| Less than $10,000 | 6,693 (5.5%) | 2,007 (1.3%) |
| $10,000 to $24,999 | 20,708 (17.1%) | 3,392 (2.1%) |
| $25,000 to $34,999 | 13,124 (10.9%) | 9,797 (6.2%) |
| $35,000 to $49,999 | 19,556 (16.2%) | 9,772 (6.1%) |
| $50,000 to $74,999 | 22,999 (19.0%) | 17,847 (11.2%) |
| $75,000 to $99,999 | 13,759 (11.4%) | 32,054 (20.2%) |
| $100,000 to $149,999 | 13,907 (11.5%) | 29,172 (18.3%) |
| $150,000 or more | 10,051 (8.3%) | 33,819 (21.3%) |
| Total | 120,797 (100.0%) | 159,109 (100.0%) |
Property Value to Household Income Ratio in Area Code 417
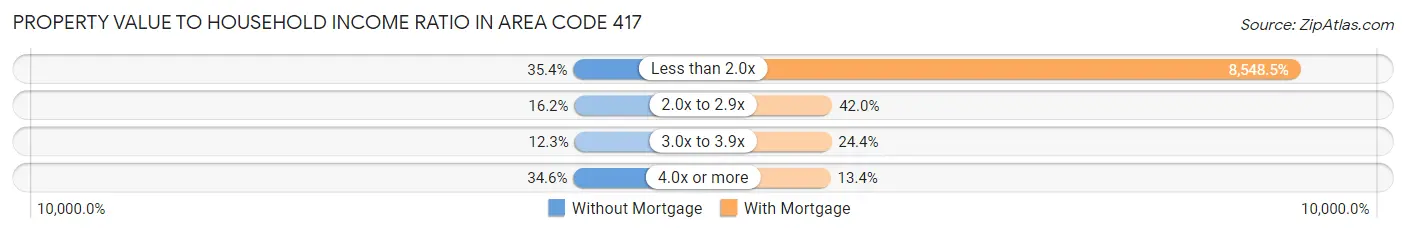
| Value-to-Income Ratio | Without Mortgage | With Mortgage |
| Less than 2.0x | 42,757 (35.4%) | 13,601,360 (8,548.4%) |
| 2.0x to 2.9x | 19,573 (16.2%) | 66,879 (42.0%) |
| 3.0x to 3.9x | 14,864 (12.3%) | 38,820 (24.4%) |
| 4.0x or more | 41,756 (34.6%) | 21,308 (13.4%) |
| Total | 120,797 (100.0%) | 159,109 (100.0%) |
Real Estate Taxes by Mortgage Status in Area Code 417
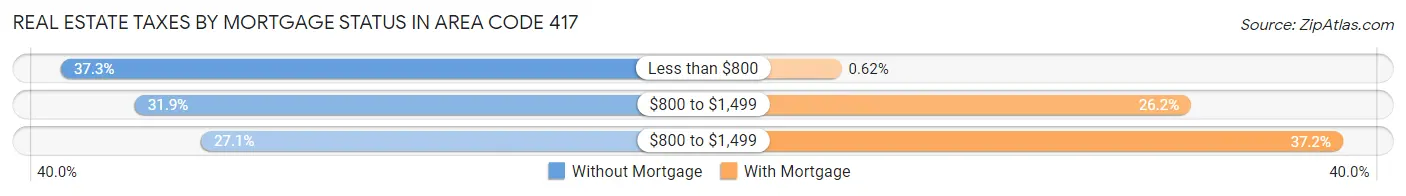
| Property Taxes | Without Mortgage | With Mortgage |
| Less than $800 | 45,107 (37.3%) | 984 (0.6%) |
| $800 to $1,499 | 38,577 (31.9%) | 41,601 (26.2%) |
| $800 to $1,499 | 32,747 (27.1%) | 59,256 (37.2%) |
| Total | 120,797 (100.0%) | 159,109 (100.0%) |
Health & Disability in Area Code 417
Health Insurance Coverage by Age in Area Code 417
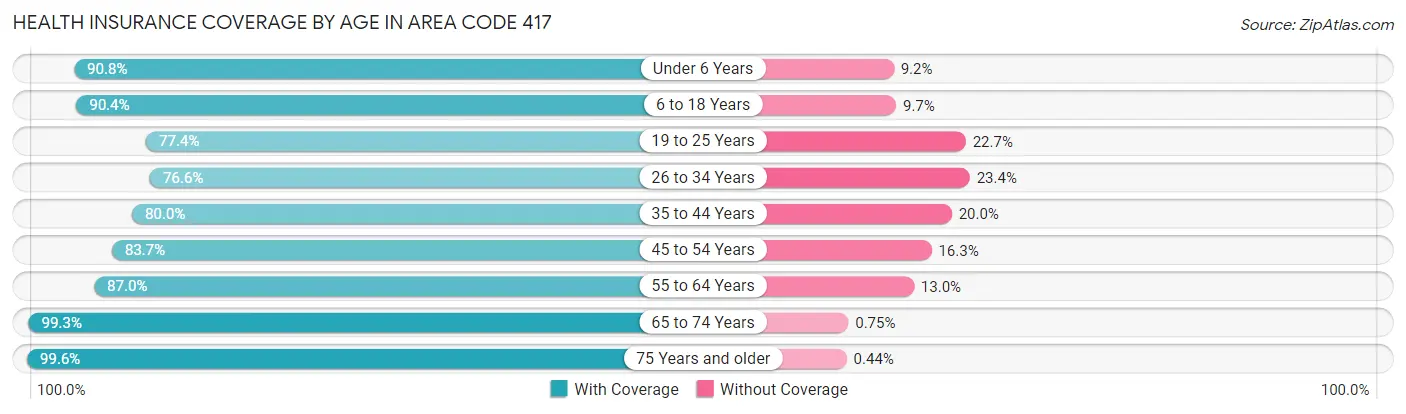
| Age Bracket | With Coverage | Without Coverage |
| Under 6 Years | 68,045 (90.8%) | 6,908 (9.2%) |
| 6 to 18 Years | 160,904 (90.3%) | 17,187 (9.7%) |
| 19 to 25 Years | 76,974 (77.3%) | 22,534 (22.7%) |
| 26 to 34 Years | 86,906 (76.6%) | 26,533 (23.4%) |
| 35 to 44 Years | 98,447 (80.0%) | 24,662 (20.0%) |
| 45 to 54 Years | 101,359 (83.7%) | 19,688 (16.3%) |
| 55 to 64 Years | 119,229 (87.0%) | 17,784 (13.0%) |
| 65 to 74 Years | 110,530 (99.3%) | 839 (0.7%) |
| 75 Years and older | 77,786 (99.6%) | 342 (0.4%) |
| Total | 900,180 (86.8%) | 136,477 (13.2%) |
Health Insurance Coverage by Citizenship Status in Area Code 417
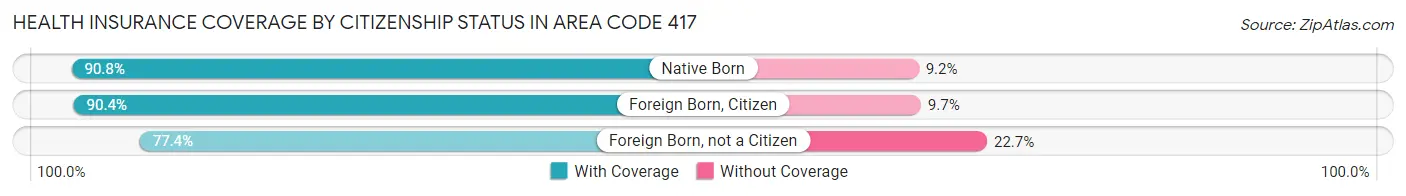
| Citizenship Status | With Coverage | Without Coverage |
| Native Born | 68,045 (90.8%) | 6,908 (9.2%) |
| Foreign Born, Citizen | 160,904 (90.3%) | 17,187 (9.7%) |
| Foreign Born, not a Citizen | 76,974 (77.3%) | 22,534 (22.7%) |
Health Insurance Coverage by Household Income in Area Code 417
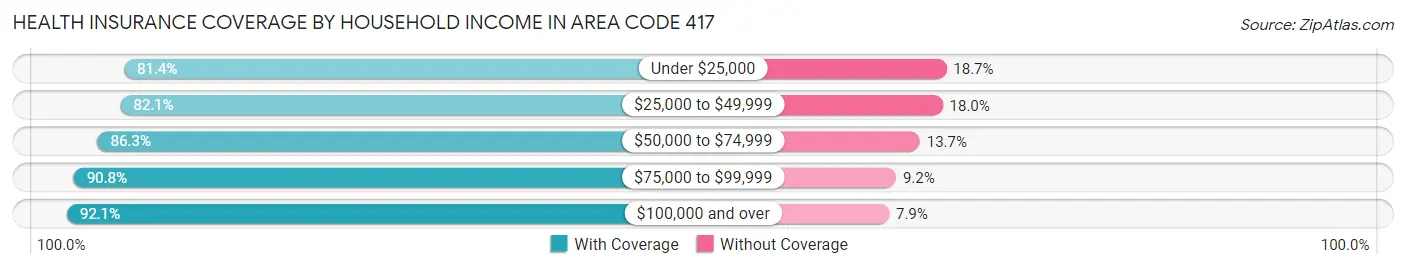
| Household Income | With Coverage | Without Coverage |
| Under $25,000 | 119,696 (81.4%) | 27,433 (18.6%) |
| $25,000 to $49,999 | 189,894 (82.1%) | 41,534 (17.9%) |
| $50,000 to $74,999 | 177,538 (86.3%) | 28,131 (13.7%) |
| $75,000 to $99,999 | 137,094 (90.8%) | 13,902 (9.2%) |
| $100,000 and over | 265,517 (92.1%) | 22,818 (7.9%) |
Public vs Private Health Insurance Coverage by Age in Area Code 417
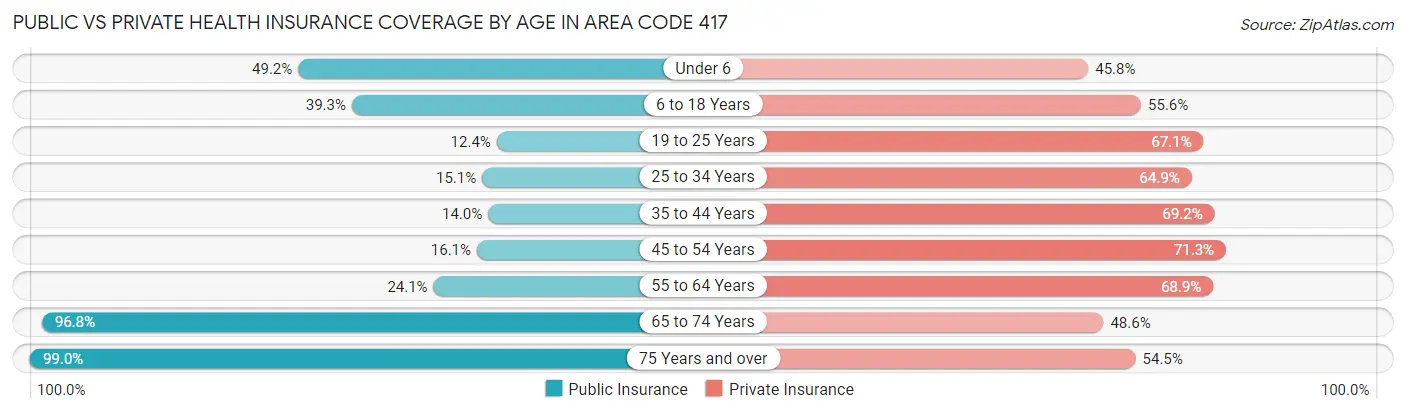
| Age Bracket | Public Insurance | Private Insurance |
| Under 6 | 36,900 (49.2%) | 34,295 (45.8%) |
| 6 to 18 Years | 69,930 (39.3%) | 98,951 (55.6%) |
| 19 to 25 Years | 12,321 (12.4%) | 66,810 (67.1%) |
| 25 to 34 Years | 17,115 (15.1%) | 73,660 (64.9%) |
| 35 to 44 Years | 17,214 (14.0%) | 85,175 (69.2%) |
| 45 to 54 Years | 19,443 (16.1%) | 86,311 (71.3%) |
| 55 to 64 Years | 33,035 (24.1%) | 94,448 (68.9%) |
| 65 to 74 Years | 107,810 (96.8%) | 54,087 (48.6%) |
| 75 Years and over | 77,347 (99.0%) | 42,608 (54.5%) |
| Total | 391,115 (37.7%) | 636,345 (61.4%) |
Disability Status by Sex by Age in Area Code 417
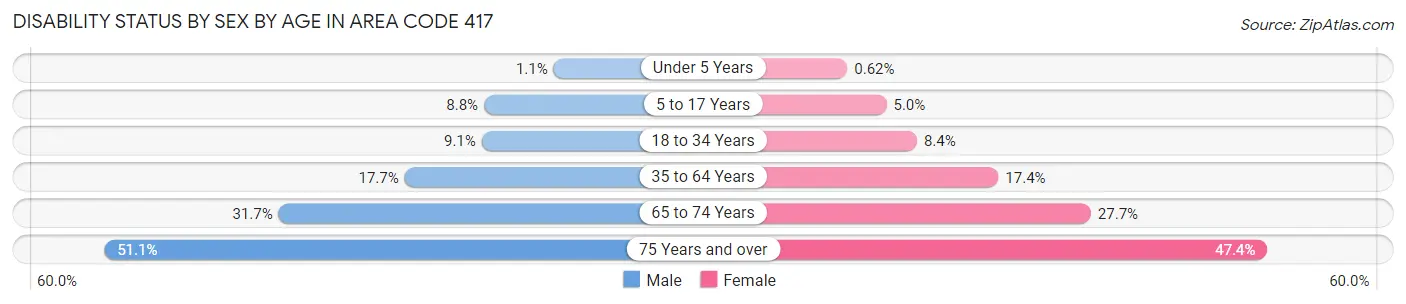
| Age Bracket | Male | Female |
| Under 5 Years | 349 (1.1%) | 186 (0.6%) |
| 5 to 17 Years | 8,027 (8.8%) | 4,250 (5.0%) |
| 18 to 34 Years | 10,394 (9.1%) | 9,504 (8.4%) |
| 35 to 64 Years | 33,427 (17.7%) | 33,526 (17.4%) |
| 65 to 74 Years | 16,689 (31.7%) | 16,297 (27.7%) |
| 75 Years and over | 17,126 (51.1%) | 21,153 (47.4%) |
Disability Class by Sex by Age in Area Code 417
Disability Class: Hearing Difficulty
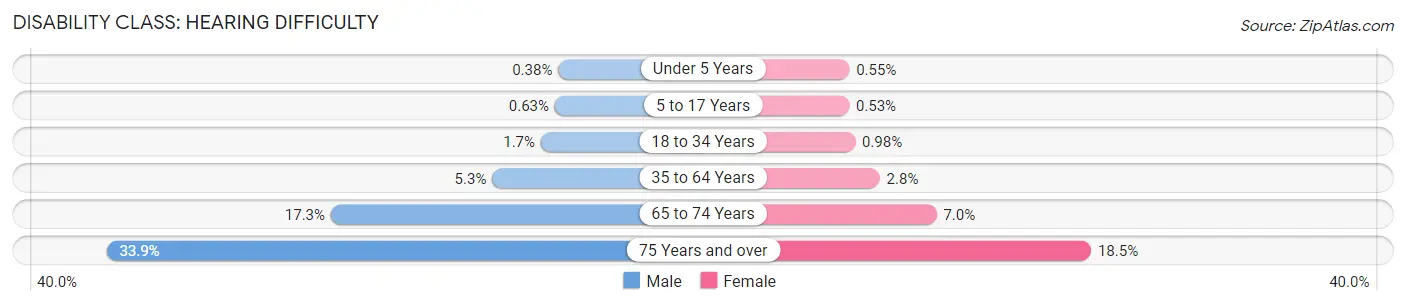
| Age Bracket | Male | Female |
| Under 5 Years | 121 (0.4%) | 166 (0.5%) |
| 5 to 17 Years | 576 (0.6%) | 453 (0.5%) |
| 18 to 34 Years | 1,906 (1.7%) | 1,118 (1.0%) |
| 35 to 64 Years | 9,969 (5.3%) | 5,407 (2.8%) |
| 65 to 74 Years | 9,084 (17.3%) | 4,129 (7.0%) |
| 75 Years and over | 11,361 (33.9%) | 8,259 (18.5%) |
Disability Class: Vision Difficulty
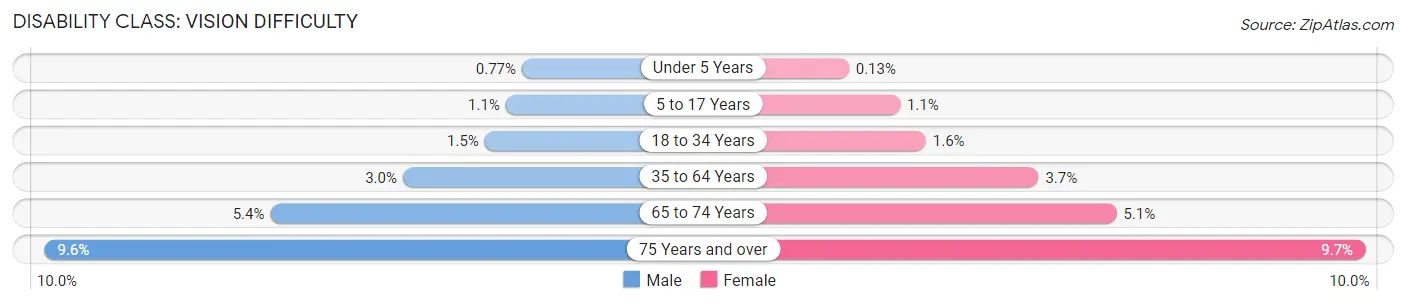
| Age Bracket | Male | Female |
| Under 5 Years | 248 (0.8%) | 40 (0.1%) |
| 5 to 17 Years | 973 (1.1%) | 926 (1.1%) |
| 18 to 34 Years | 1,672 (1.5%) | 1,773 (1.6%) |
| 35 to 64 Years | 5,635 (3.0%) | 7,019 (3.6%) |
| 65 to 74 Years | 2,863 (5.4%) | 2,999 (5.1%) |
| 75 Years and over | 3,225 (9.6%) | 4,333 (9.7%) |
Disability Class: Cognitive Difficulty
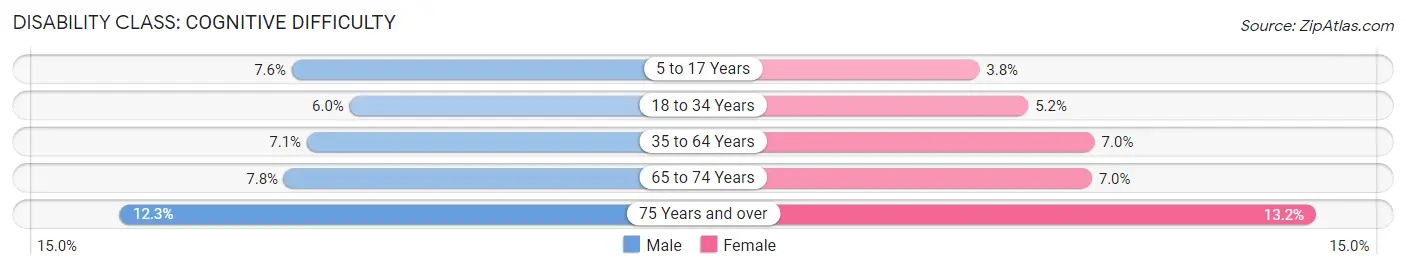
| Age Bracket | Male | Female |
| 5 to 17 Years | 6,859 (7.6%) | 3,270 (3.8%) |
| 18 to 34 Years | 6,792 (5.9%) | 5,898 (5.2%) |
| 35 to 64 Years | 13,502 (7.1%) | 13,529 (7.0%) |
| 65 to 74 Years | 4,092 (7.8%) | 4,088 (7.0%) |
| 75 Years and over | 4,132 (12.3%) | 5,892 (13.2%) |
Disability Class: Ambulatory Difficulty
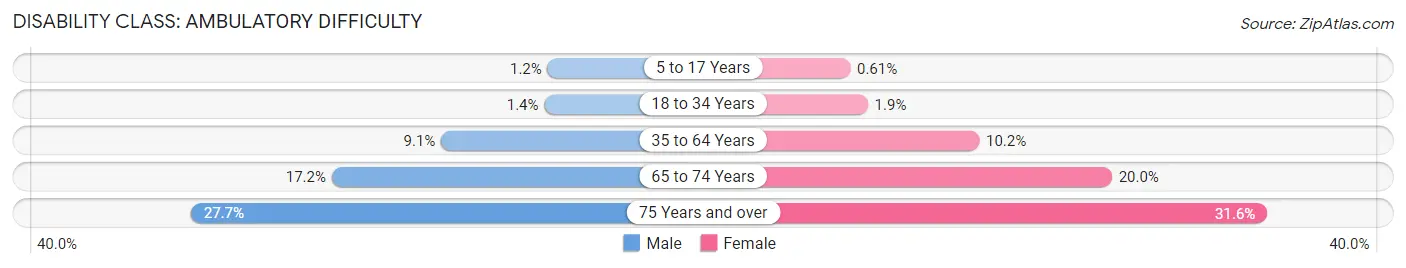
| Age Bracket | Male | Female |
| 5 to 17 Years | 1,062 (1.2%) | 524 (0.6%) |
| 18 to 34 Years | 1,611 (1.4%) | 2,181 (1.9%) |
| 35 to 64 Years | 17,147 (9.1%) | 19,580 (10.2%) |
| 65 to 74 Years | 9,048 (17.2%) | 11,772 (20.0%) |
| 75 Years and over | 9,265 (27.7%) | 14,096 (31.6%) |
Disability Class: Self-Care Difficulty
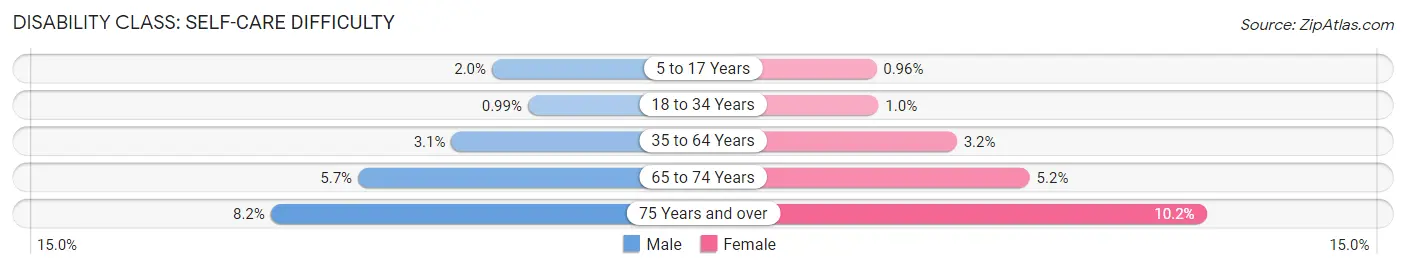
| Age Bracket | Male | Female |
| 5 to 17 Years | 1,802 (2.0%) | 821 (1.0%) |
| 18 to 34 Years | 1,131 (1.0%) | 1,158 (1.0%) |
| 35 to 64 Years | 5,890 (3.1%) | 6,150 (3.2%) |
| 65 to 74 Years | 3,008 (5.7%) | 3,071 (5.2%) |
| 75 Years and over | 2,730 (8.2%) | 4,532 (10.2%) |
Technology Access in Area Code 417
Computing Device Access in Area Code 417
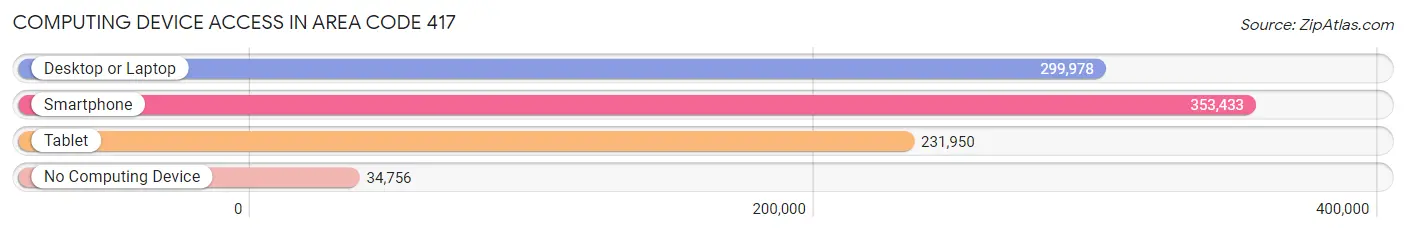
| Device Type | # Households | % Households |
| Desktop or Laptop | 299,978 | 72.0% |
| Smartphone | 353,433 | 84.8% |
| Tablet | 231,950 | 55.6% |
| No Computing Device | 34,756 | 8.3% |
| Total | 416,944 | 100.0% |
Internet Access in Area Code 417
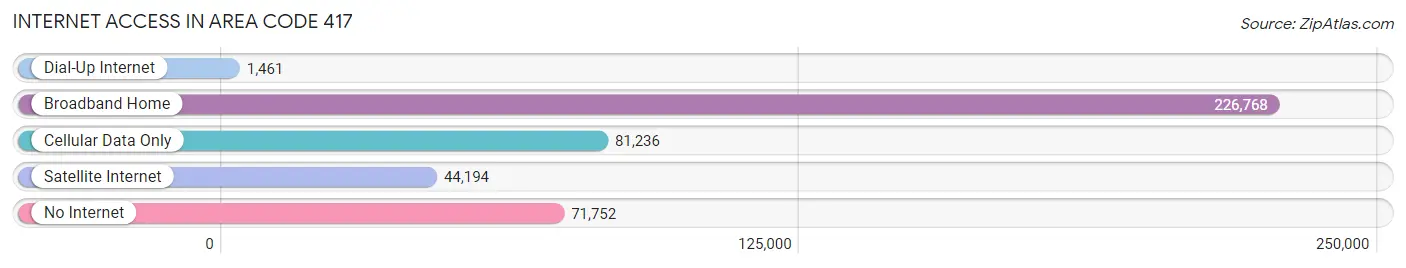
| Internet Type | # Households | % Households |
| Dial-Up Internet | 1,461 | 0.4% |
| Broadband Home | 226,768 | 54.4% |
| Cellular Data Only | 81,236 | 19.5% |
| Satellite Internet | 44,194 | 10.6% |
| No Internet | 71,752 | 17.2% |
| Total | 416,944 | 100.0% |
Area Code 417 Summary
Geography
Area code 417 is located in the southwestern corner of Missouri. It covers the entire southwestern portion of the state, including the cities of Springfield, Joplin, and Branson.
Social
Area code 417 is home to a diverse population of people from all walks of life. The area is known for its friendly and welcoming atmosphere, and its residents are proud of their heritage and culture.
Economics
Area code 417 is a major economic hub in the state of Missouri. It is home to a number of large businesses, including Walmart, Bass Pro Shops, and O'Reilly Auto Parts. The area also has a thriving tourism industry, with attractions such as Silver Dollar City and Table Rock Lake.
Demographics
Area code 417 is home to a population of over 1.2 million people. The population is largely white, with a significant African American population. The median household income is around $45,000, and the unemployment rate is around 4%.
Common Questions
What is Per Capita Income in Area Code 417?
Per Capita income in Area Code 417 is $28,199.
What is the Median Family Income in Area Code 417?
Median Family Income in Area Code 417 is $66,161.
What is the Median Household income in Area Code 417?
Median Household Income in Area Code 417 is $54,364.
What is Income or Wage Gap in Area Code 417?
Income or Wage Gap in Area Code 417 is 30.3%.
Women in Area Code 417 earn 69.7 cents for every dollar earned by a man.
What is Family Income Deficit in Area Code 417?
Family Income Deficit in Area Code 417 is $9,969.
Families that are below poverty line in Area Code 417 earn $9,969 less on average than the poverty threshold level.
What is Inequality or Gini Index in Area Code 417?
Inequality or Gini Index in Area Code 417 is 88.62.
What is the Total Population of Area Code 417?
Total Population of Area Code 417 is 1,048,519.
What is the Total Male Population of Area Code 417?
Total Male Population of Area Code 417 is 518,737.
What is the Total Female Population of Area Code 417?
Total Female Population of Area Code 417 is 529,782.
What is the Ratio of Males per 100 Females in Area Code 417?
There are 97.92 Males per 100 Females in Area Code 417.
What is the Ratio of Females per 100 Males in Area Code 417?
There are 102.13 Females per 100 Males in Area Code 417.
What is the Median Population Age in Area Code 417?
Median Population Age in Area Code 417 is 44.3 Years.
What is the Average Family Size in Area Code 417
Average Family Size in Area Code 417 is 3.1 People.
What is the Average Household Size in Area Code 417
Average Household Size in Area Code 417 is 2.6 People.
How Large is the Labor Force in Area Code 417?
There are 454,952 People in the Labor Forcein in Area Code 417.
What is the Percentage of People in the Labor Force in Area Code 417?
54.3% of People are in the Labor Force in Area Code 417.
What is the Unemployment Rate in Area Code 417?
Unemployment Rate in Area Code 417 is 6.5%.