Springfield, MO Map & Demographics
Springfield Map
Springfield Overview
$28,806
PER CAPITA INCOME
$61,245
AVG FAMILY INCOME
$43,450
AVG HOUSEHOLD INCOME
17.5%
WAGE / INCOME GAP [ % ]
82.5¢/ $1
WAGE / INCOME GAP [ $ ]
$9,580
FAMILY INCOME DEFICIT
0.48
INEQUALITY / GINI INDEX
168,873
TOTAL POPULATION
82,917
MALE POPULATION
85,956
FEMALE POPULATION
96.46
MALES / 100 FEMALES
103.67
FEMALES / 100 MALES
33.3
MEDIAN AGE
2.7
AVG FAMILY SIZE
2.0
AVG HOUSEHOLD SIZE
85,157
LABOR FORCE [ PEOPLE ]
59.6%
PERCENT IN LABOR FORCE
4.8%
UNEMPLOYMENT RATE
Springfield Area Codes
Income in Springfield
Income Overview in Springfield
Per Capita Income in Springfield is $28,806, while median incomes of families and households are $61,245 and $43,450 respectively.
| Characteristic | Number | Measure |
| Per Capita Income | 168,873 | $28,806 |
| Median Family Income | 36,939 | $61,245 |
| Mean Family Income | 36,939 | $83,644 |
| Median Household Income | 79,070 | $43,450 |
| Mean Household Income | 79,070 | $62,030 |
| Income Deficit | 36,939 | $9,580 |
| Wage / Income Gap (%) | 168,873 | 17.53% |
| Wage / Income Gap ($) | 168,873 | 82.47¢ per $1 |
| Gini / Inequality Index | 168,873 | 0.48 |
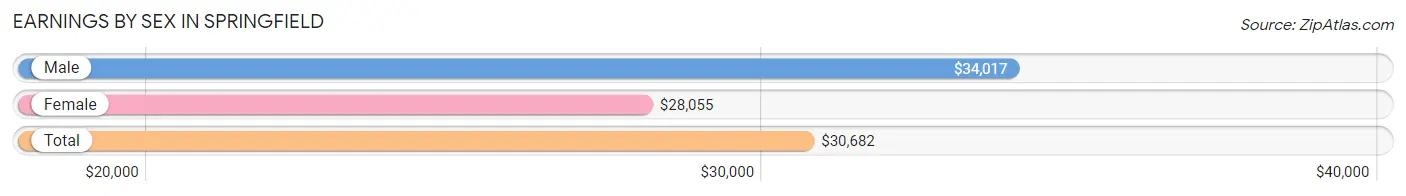
Earnings by Sex in Springfield
Average Earnings in Springfield are $30,682, $34,017 for men and $28,055 for women, a difference of 17.5%.
| Sex | Number | Average Earnings |
| Male | 45,178 (50.6%) | $34,017 |
| Female | 44,134 (49.4%) | $28,055 |
| Total | 89,312 (100.0%) | $30,682 |
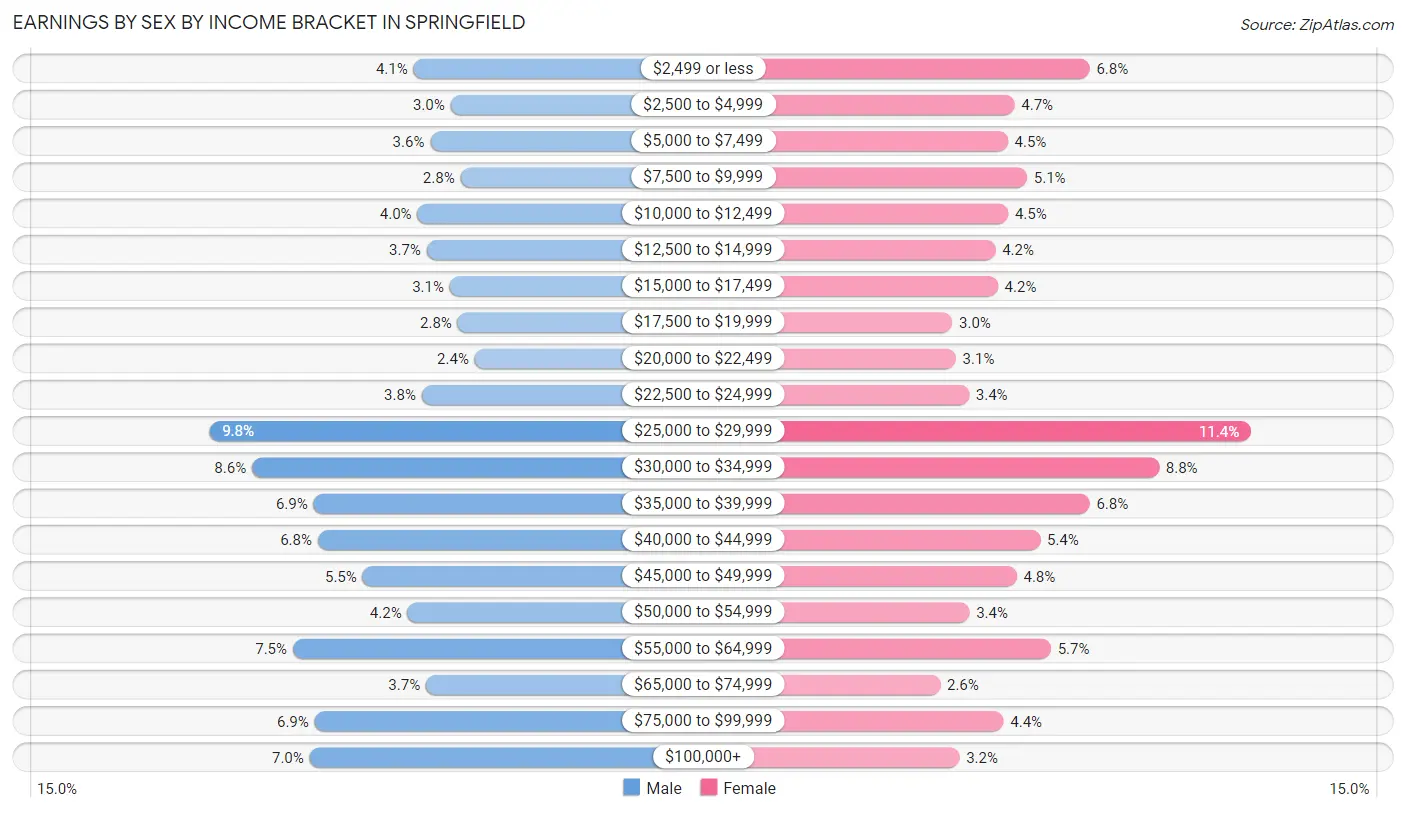
Earnings by Sex by Income Bracket in Springfield
The most common earnings brackets in Springfield are $25,000 to $29,999 for men (4,430 | 9.8%) and $25,000 to $29,999 for women (5,015 | 11.4%).
| Income | Male | Female |
| $2,499 or less | 1,841 (4.1%) | 3,009 (6.8%) |
| $2,500 to $4,999 | 1,368 (3.0%) | 2,077 (4.7%) |
| $5,000 to $7,499 | 1,625 (3.6%) | 1,996 (4.5%) |
| $7,500 to $9,999 | 1,241 (2.8%) | 2,235 (5.1%) |
| $10,000 to $12,499 | 1,789 (4.0%) | 1,999 (4.5%) |
| $12,500 to $14,999 | 1,673 (3.7%) | 1,841 (4.2%) |
| $15,000 to $17,499 | 1,380 (3.0%) | 1,871 (4.2%) |
| $17,500 to $19,999 | 1,278 (2.8%) | 1,306 (3.0%) |
| $20,000 to $22,499 | 1,063 (2.4%) | 1,351 (3.1%) |
| $22,500 to $24,999 | 1,734 (3.8%) | 1,512 (3.4%) |
| $25,000 to $29,999 | 4,430 (9.8%) | 5,015 (11.4%) |
| $30,000 to $34,999 | 3,891 (8.6%) | 3,871 (8.8%) |
| $35,000 to $39,999 | 3,109 (6.9%) | 3,011 (6.8%) |
| $40,000 to $44,999 | 3,053 (6.8%) | 2,395 (5.4%) |
| $45,000 to $49,999 | 2,484 (5.5%) | 2,105 (4.8%) |
| $50,000 to $54,999 | 1,917 (4.2%) | 1,518 (3.4%) |
| $55,000 to $64,999 | 3,370 (7.5%) | 2,529 (5.7%) |
| $65,000 to $74,999 | 1,680 (3.7%) | 1,158 (2.6%) |
| $75,000 to $99,999 | 3,095 (6.9%) | 1,942 (4.4%) |
| $100,000+ | 3,157 (7.0%) | 1,393 (3.2%) |
| Total | 45,178 (100.0%) | 44,134 (100.0%) |
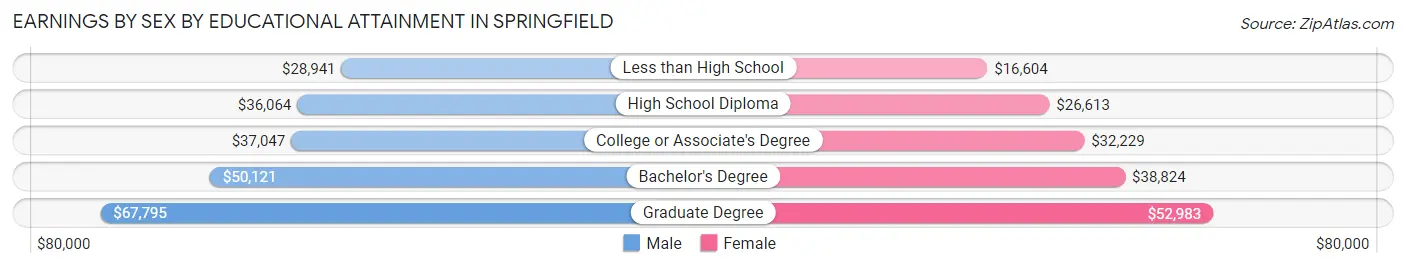
Earnings by Sex by Educational Attainment in Springfield
Average earnings in Springfield are $40,919 for men and $33,725 for women, a difference of 17.6%. Men with an educational attainment of graduate degree enjoy the highest average annual earnings of $67,795, while those with less than high school education earn the least with $28,941. Women with an educational attainment of graduate degree earn the most with the average annual earnings of $52,983, while those with less than high school education have the smallest earnings of $16,604.
| Educational Attainment | Male Income | Female Income |
| Less than High School | $28,941 | $16,604 |
| High School Diploma | $36,064 | $26,613 |
| College or Associate's Degree | $37,047 | $32,229 |
| Bachelor's Degree | $50,121 | $38,824 |
| Graduate Degree | $67,795 | $52,983 |
| Total | $40,919 | $33,725 |
Family Income in Springfield
Family Income Brackets in Springfield
According to the Springfield family income data, there are 7,905 families falling into the $50,000 to $74,999 income range, which is the most common income bracket and makes up 21.4% of all families. Conversely, the $10,000 to $14,999 income bracket is the least frequent group with only 1,108 families (3.0%) belonging to this category.
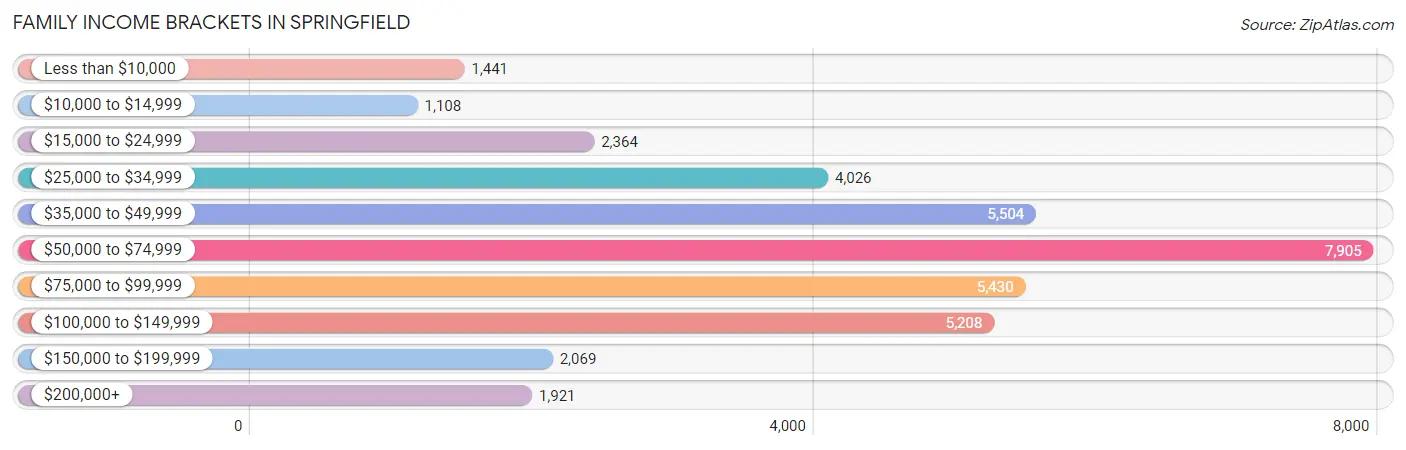
| Income Bracket | # Families | % Families |
| Less than $10,000 | 1,441 | 3.9% |
| $10,000 to $14,999 | 1,108 | 3.0% |
| $15,000 to $24,999 | 2,364 | 6.4% |
| $25,000 to $34,999 | 4,026 | 10.9% |
| $35,000 to $49,999 | 5,504 | 14.9% |
| $50,000 to $74,999 | 7,905 | 21.4% |
| $75,000 to $99,999 | 5,430 | 14.7% |
| $100,000 to $149,999 | 5,208 | 14.1% |
| $150,000 to $199,999 | 2,069 | 5.6% |
| $200,000+ | 1,921 | 5.2% |
Family Income by Famaliy Size in Springfield
7+ person families (286 | 0.8%) account for the highest median family income in Springfield with $92,083 per family, while 2-person families (21,134 | 57.2%) have the highest median income of $28,388 per family member.
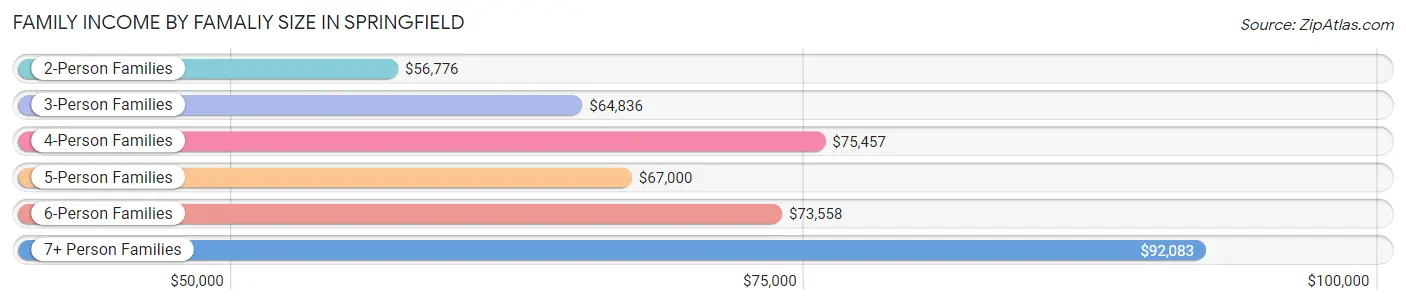
| Income Bracket | # Families | Median Income |
| 2-Person Families | 21,134 (57.2%) | $56,776 |
| 3-Person Families | 8,067 (21.8%) | $64,836 |
| 4-Person Families | 4,773 (12.9%) | $75,457 |
| 5-Person Families | 1,990 (5.4%) | $67,000 |
| 6-Person Families | 689 (1.9%) | $73,558 |
| 7+ Person Families | 286 (0.8%) | $92,083 |
| Total | 36,939 (100.0%) | $61,245 |
Family Income by Number of Earners in Springfield
The median family income in Springfield is $61,245, with families comprising 3+ earners (2,308) having the highest median family income of $113,467, while families with no earners (6,846) have the lowest median family income of $35,722, accounting for 6.2% and 18.5% of families, respectively.
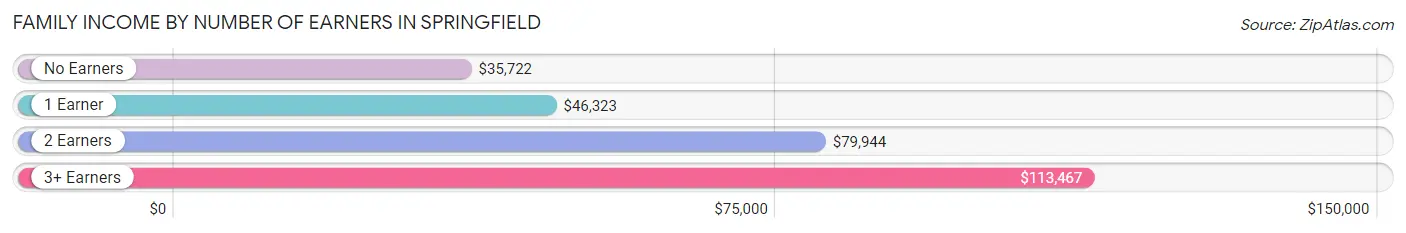
| Number of Earners | # Families | Median Income |
| No Earners | 6,846 (18.5%) | $35,722 |
| 1 Earner | 12,459 (33.7%) | $46,323 |
| 2 Earners | 15,326 (41.5%) | $79,944 |
| 3+ Earners | 2,308 (6.2%) | $113,467 |
| Total | 36,939 (100.0%) | $61,245 |
Household Income in Springfield
Household Income Brackets in Springfield
With 14,312 households falling in the category, the $50,000 to $74,999 income range is the most frequent in Springfield, accounting for 18.1% of all households. In contrast, only 2,372 households (3.0%) fall into the $200,000+ income bracket, making it the least populous group.
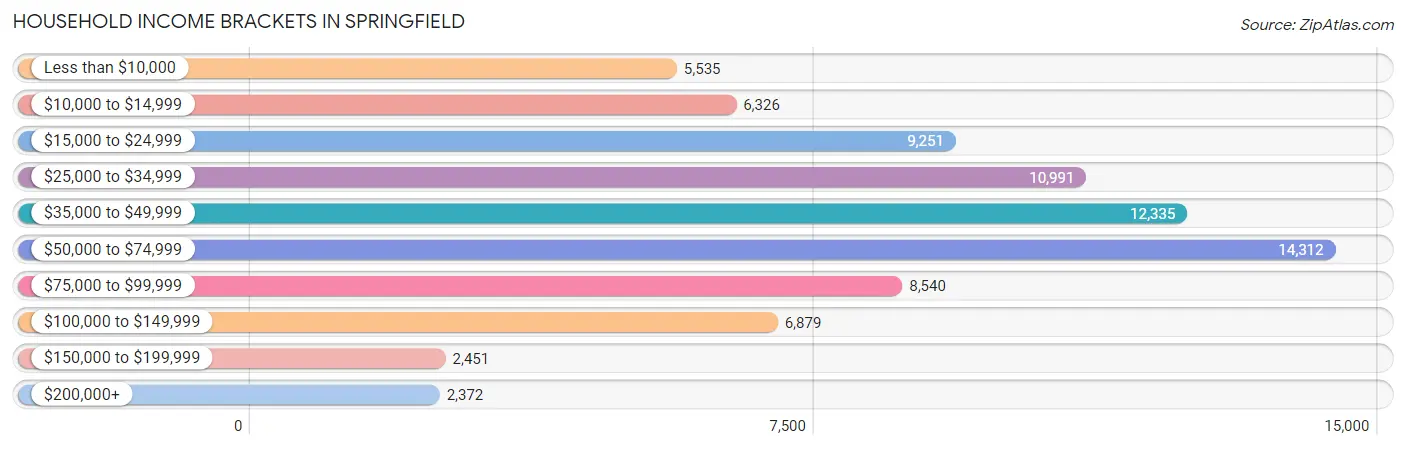
| Income Bracket | # Households | % Households |
| Less than $10,000 | 5,535 | 7.0% |
| $10,000 to $14,999 | 6,326 | 8.0% |
| $15,000 to $24,999 | 9,251 | 11.7% |
| $25,000 to $34,999 | 10,991 | 13.9% |
| $35,000 to $49,999 | 12,335 | 15.6% |
| $50,000 to $74,999 | 14,312 | 18.1% |
| $75,000 to $99,999 | 8,540 | 10.8% |
| $100,000 to $149,999 | 6,879 | 8.7% |
| $150,000 to $199,999 | 2,451 | 3.1% |
| $200,000+ | 2,372 | 3.0% |
Household Income by Householder Age in Springfield
The median household income in Springfield is $43,450, with the highest median household income of $52,803 found in the 25 to 44 years age bracket for the primary householder. A total of 26,092 households (33.0%) fall into this category. Meanwhile, the 15 to 24 years age bracket for the primary householder has the lowest median household income of $29,095, with 12,032 households (15.2%) in this group.
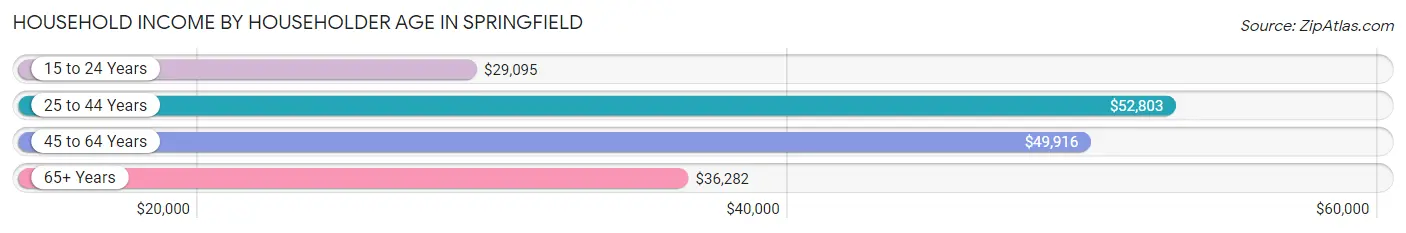
| Income Bracket | # Households | Median Income |
| 15 to 24 Years | 12,032 (15.2%) | $29,095 |
| 25 to 44 Years | 26,092 (33.0%) | $52,803 |
| 45 to 64 Years | 22,186 (28.1%) | $49,916 |
| 65+ Years | 18,760 (23.7%) | $36,282 |
| Total | 79,070 (100.0%) | $43,450 |
Poverty in Springfield
Income Below Poverty by Sex and Age in Springfield
With 20.1% poverty level for males and 20.5% for females among the residents of Springfield, 15 year old males and 18 to 24 year old females are the most vulnerable to poverty, with 236 males (39.9%) and 5,329 females (40.4%) in their respective age groups living below the poverty level.
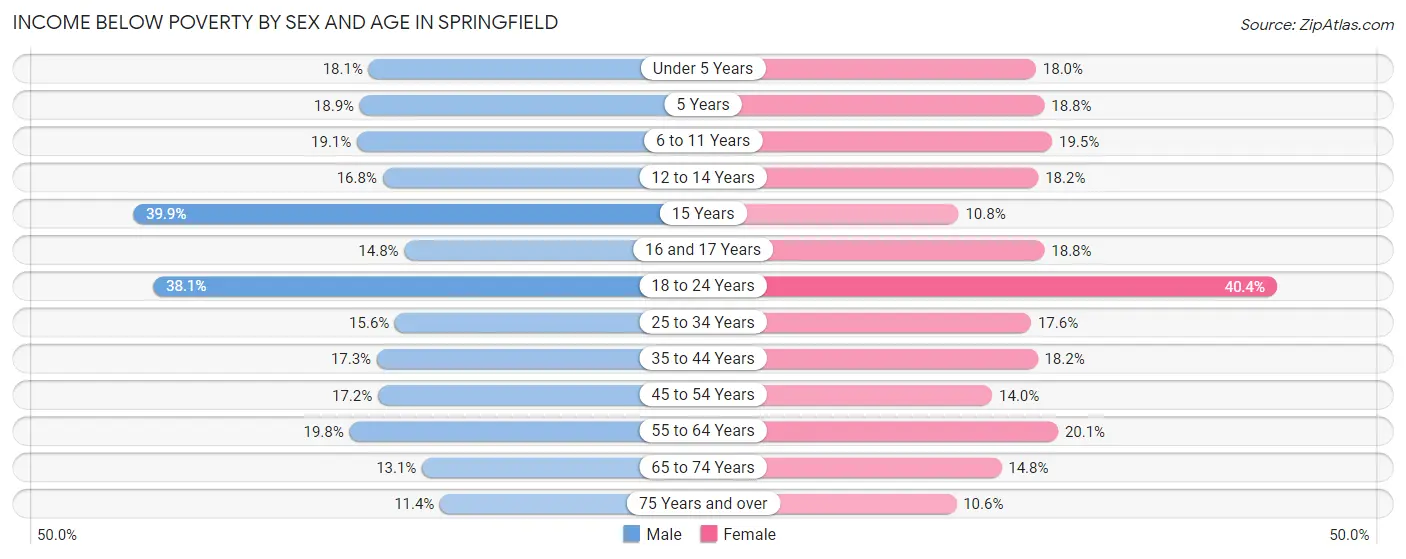
| Age Bracket | Male | Female |
| Under 5 Years | 847 (18.1%) | 693 (18.0%) |
| 5 Years | 159 (18.9%) | 125 (18.8%) |
| 6 to 11 Years | 924 (19.1%) | 849 (19.5%) |
| 12 to 14 Years | 444 (16.8%) | 414 (18.2%) |
| 15 Years | 236 (39.9%) | 65 (10.8%) |
| 16 and 17 Years | 255 (14.7%) | 286 (18.8%) |
| 18 to 24 Years | 4,626 (38.1%) | 5,329 (40.4%) |
| 25 to 34 Years | 2,102 (15.6%) | 2,239 (17.6%) |
| 35 to 44 Years | 1,668 (17.3%) | 1,609 (18.2%) |
| 45 to 54 Years | 1,445 (17.2%) | 1,159 (14.0%) |
| 55 to 64 Years | 1,674 (19.8%) | 1,842 (20.1%) |
| 65 to 74 Years | 822 (13.1%) | 1,150 (14.8%) |
| 75 Years and over | 474 (11.4%) | 781 (10.6%) |
| Total | 15,676 (20.1%) | 16,541 (20.5%) |
Income Above Poverty by Sex and Age in Springfield
According to the poverty statistics in Springfield, males aged 75 years and over and females aged 75 years and over are the age groups that are most secure financially, with 88.6% of males and 89.4% of females in these age groups living above the poverty line.
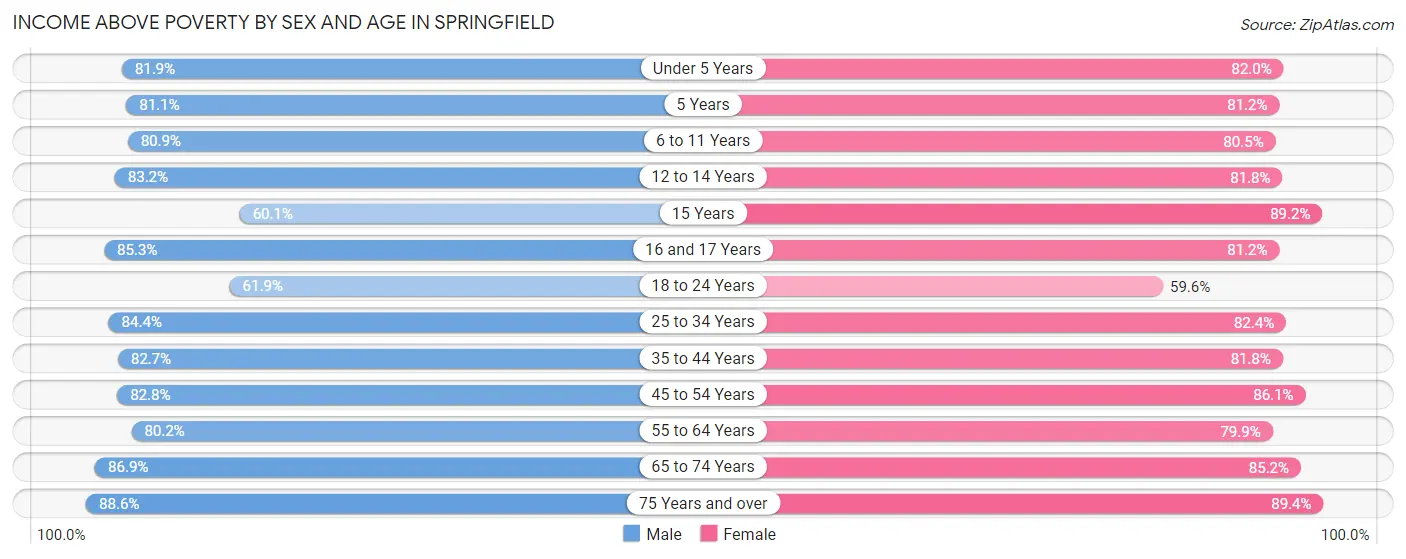
| Age Bracket | Male | Female |
| Under 5 Years | 3,844 (81.9%) | 3,154 (82.0%) |
| 5 Years | 683 (81.1%) | 540 (81.2%) |
| 6 to 11 Years | 3,903 (80.9%) | 3,503 (80.5%) |
| 12 to 14 Years | 2,205 (83.2%) | 1,857 (81.8%) |
| 15 Years | 355 (60.1%) | 535 (89.2%) |
| 16 and 17 Years | 1,474 (85.3%) | 1,235 (81.2%) |
| 18 to 24 Years | 7,524 (61.9%) | 7,873 (59.6%) |
| 25 to 34 Years | 11,363 (84.4%) | 10,512 (82.4%) |
| 35 to 44 Years | 7,976 (82.7%) | 7,252 (81.8%) |
| 45 to 54 Years | 6,956 (82.8%) | 7,149 (86.1%) |
| 55 to 64 Years | 6,764 (80.2%) | 7,342 (79.9%) |
| 65 to 74 Years | 5,453 (86.9%) | 6,621 (85.2%) |
| 75 Years and over | 3,674 (88.6%) | 6,576 (89.4%) |
| Total | 62,174 (79.9%) | 64,149 (79.5%) |
Income Below Poverty Among Married-Couple Families in Springfield
The poverty statistics for married-couple families in Springfield show that 5.9% or 1,518 of the total 25,612 families live below the poverty line. Families with 5 or more children have the highest poverty rate of 61.9%, comprising of 39 families. On the other hand, families with 1 or 2 children have the lowest poverty rate of 4.8%, which includes 346 families.
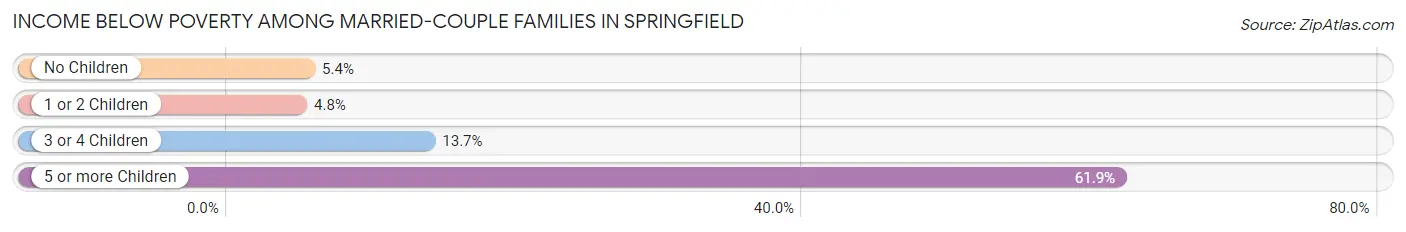
| Children | Above Poverty | Below Poverty |
| No Children | 15,695 (94.6%) | 890 (5.4%) |
| 1 or 2 Children | 6,850 (95.2%) | 346 (4.8%) |
| 3 or 4 Children | 1,525 (86.3%) | 243 (13.7%) |
| 5 or more Children | 24 (38.1%) | 39 (61.9%) |
| Total | 24,094 (94.1%) | 1,518 (5.9%) |
Income Below Poverty Among Single-Parent Households in Springfield
According to the poverty data in Springfield, 20.5% or 761 single-father households and 27.0% or 2,053 single-mother households are living below the poverty line. Among single-father households, those with 3 or 4 children have the highest poverty rate, with 129 households (81.7%) experiencing poverty. Likewise, among single-mother households, those with 5 or more children have the highest poverty rate, with 51 households (73.9%) falling below the poverty line.
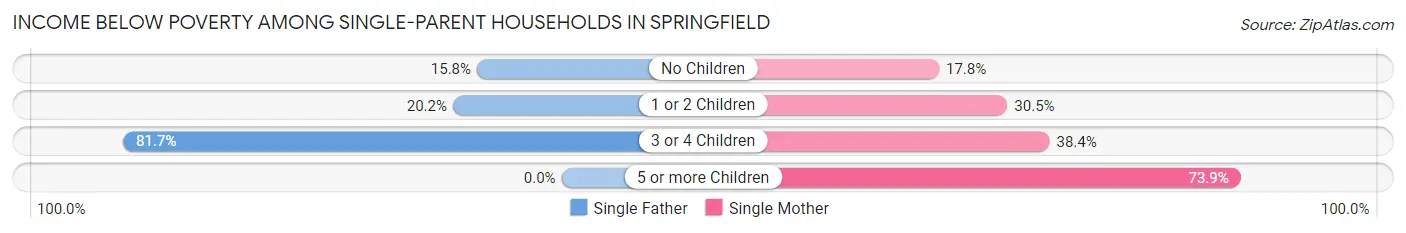
| Children | Single Father | Single Mother |
| No Children | 306 (15.8%) | 486 (17.8%) |
| 1 or 2 Children | 326 (20.2%) | 1,279 (30.5%) |
| 3 or 4 Children | 129 (81.7%) | 237 (38.4%) |
| 5 or more Children | 0 (0.0%) | 51 (73.9%) |
| Total | 761 (20.5%) | 2,053 (27.0%) |
Income Below Poverty Among Married-Couple vs Single-Parent Households in Springfield
The poverty data for Springfield shows that 1,518 of the married-couple family households (5.9%) and 2,814 of the single-parent households (24.8%) are living below the poverty level. Within the married-couple family households, those with 5 or more children have the highest poverty rate, with 39 households (61.9%) falling below the poverty line. Among the single-parent households, those with 5 or more children have the highest poverty rate, with 51 household (73.9%) living below poverty.
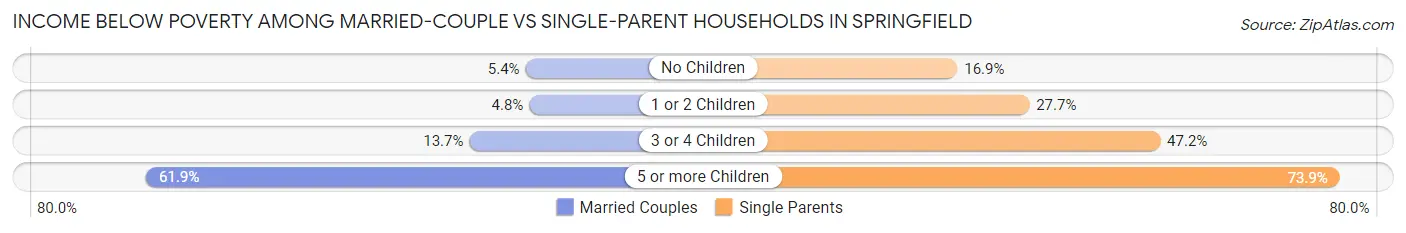
| Children | Married-Couple Families | Single-Parent Households |
| No Children | 890 (5.4%) | 792 (16.9%) |
| 1 or 2 Children | 346 (4.8%) | 1,605 (27.7%) |
| 3 or 4 Children | 243 (13.7%) | 366 (47.2%) |
| 5 or more Children | 39 (61.9%) | 51 (73.9%) |
| Total | 1,518 (5.9%) | 2,814 (24.8%) |
Race in Springfield
The most populous races in Springfield are White / Caucasian (145,961 | 86.4%), Two or more Races (9,354 | 5.5%), and Hispanic or Latino (7,758 | 4.6%).
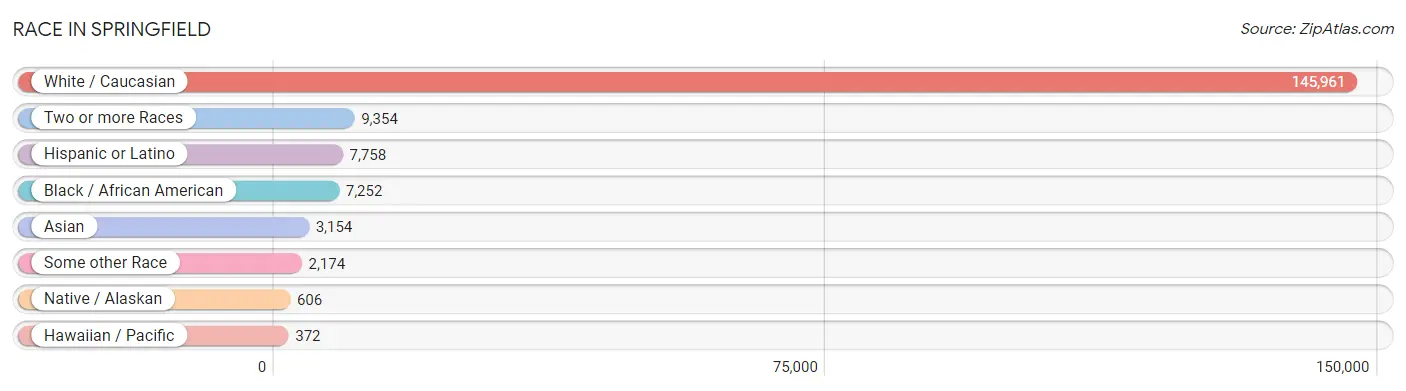
| Race | # Population | % Population |
| Asian | 3,154 | 1.9% |
| Black / African American | 7,252 | 4.3% |
| Hawaiian / Pacific | 372 | 0.2% |
| Hispanic or Latino | 7,758 | 4.6% |
| Native / Alaskan | 606 | 0.4% |
| White / Caucasian | 145,961 | 86.4% |
| Two or more Races | 9,354 | 5.5% |
| Some other Race | 2,174 | 1.3% |
| Total | 168,873 | 100.0% |
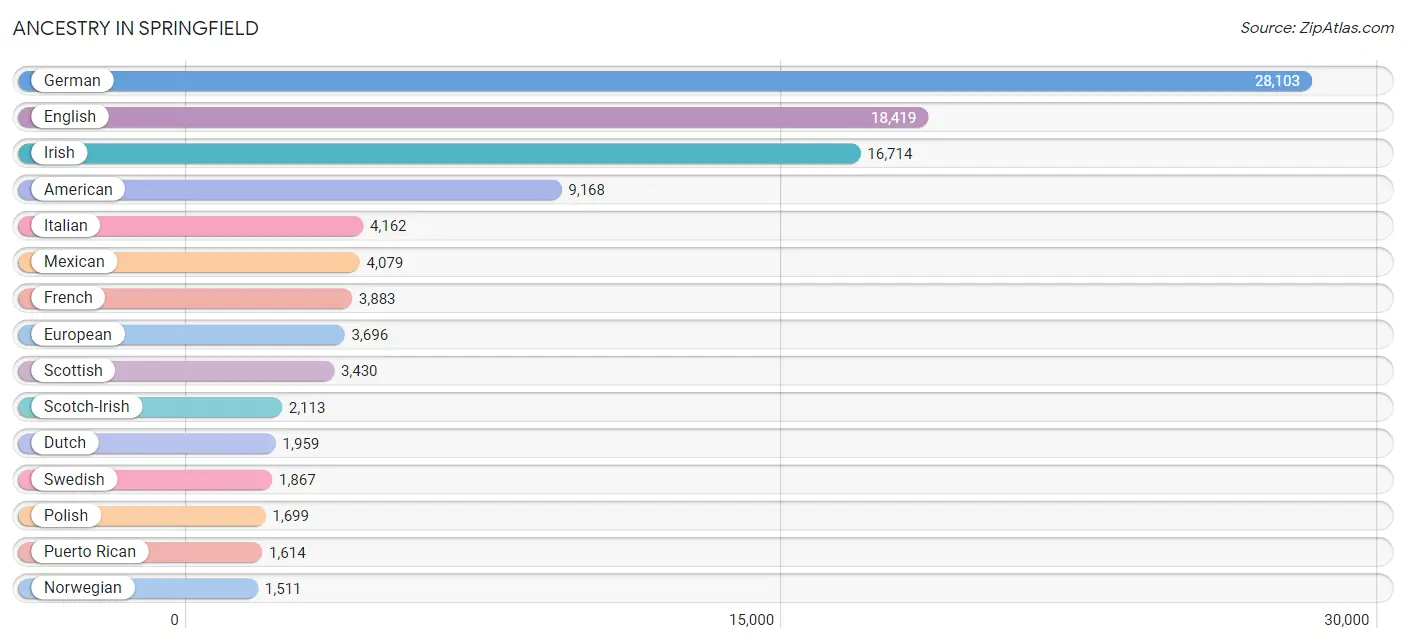
Ancestry in Springfield
The most populous ancestries reported in Springfield are German (28,103 | 16.6%), English (18,419 | 10.9%), Irish (16,714 | 9.9%), American (9,168 | 5.4%), and Italian (4,162 | 2.5%), together accounting for 45.3% of all Springfield residents.
| Ancestry | # Population | % Population |
| African | 760 | 0.4% |
| Albanian | 33 | 0.0% |
| American | 9,168 | 5.4% |
| Apache | 70 | 0.0% |
| Arab | 670 | 0.4% |
| Argentinean | 66 | 0.0% |
| Armenian | 44 | 0.0% |
| Australian | 19 | 0.0% |
| Austrian | 264 | 0.2% |
| Bahamian | 12 | 0.0% |
| Belgian | 88 | 0.1% |
| Bhutanese | 289 | 0.2% |
| Blackfeet | 271 | 0.2% |
| Brazilian | 39 | 0.0% |
| British | 993 | 0.6% |
| Bulgarian | 260 | 0.2% |
| Burmese | 885 | 0.5% |
| Canadian | 178 | 0.1% |
| Celtic | 38 | 0.0% |
| Central American | 758 | 0.4% |
| Central American Indian | 8 | 0.0% |
| Cherokee | 1,373 | 0.8% |
| Chickasaw | 43 | 0.0% |
| Chilean | 50 | 0.0% |
| Chippewa | 120 | 0.1% |
| Choctaw | 83 | 0.1% |
| Comanche | 6 | 0.0% |
| Costa Rican | 192 | 0.1% |
| Cree | 38 | 0.0% |
| Creek | 99 | 0.1% |
| Croatian | 185 | 0.1% |
| Cuban | 122 | 0.1% |
| Czech | 564 | 0.3% |
| Czechoslovakian | 58 | 0.0% |
| Danish | 619 | 0.4% |
| Delaware | 9 | 0.0% |
| Dominican | 41 | 0.0% |
| Dutch | 1,959 | 1.2% |
| Dutch West Indian | 8 | 0.0% |
| Eastern European | 167 | 0.1% |
| Ecuadorian | 158 | 0.1% |
| Egyptian | 19 | 0.0% |
| English | 18,419 | 10.9% |
| Ethiopian | 171 | 0.1% |
| European | 3,696 | 2.2% |
| Finnish | 72 | 0.0% |
| French | 3,883 | 2.3% |
| French Canadian | 380 | 0.2% |
| German | 28,103 | 16.6% |
| German Russian | 16 | 0.0% |
| Ghanaian | 55 | 0.0% |
| Greek | 104 | 0.1% |
| Guamanian / Chamorro | 3 | 0.0% |
| Guatemalan | 64 | 0.0% |
| Haitian | 19 | 0.0% |
| Honduran | 55 | 0.0% |
| Hopi | 4 | 0.0% |
| Hungarian | 356 | 0.2% |
| Icelander | 19 | 0.0% |
| Indian (Asian) | 1,187 | 0.7% |
| Inupiat | 11 | 0.0% |
| Iranian | 16 | 0.0% |
| Iraqi | 12 | 0.0% |
| Irish | 16,714 | 9.9% |
| Iroquois | 100 | 0.1% |
| Italian | 4,162 | 2.5% |
| Jamaican | 90 | 0.1% |
| Japanese | 211 | 0.1% |
| Kenyan | 100 | 0.1% |
| Kiowa | 5 | 0.0% |
| Korean | 1,032 | 0.6% |
| Latvian | 23 | 0.0% |
| Lebanese | 112 | 0.1% |
| Lithuanian | 118 | 0.1% |
| Luxembourger | 35 | 0.0% |
| Mexican | 4,079 | 2.4% |
| Mexican American Indian | 36 | 0.0% |
| Moroccan | 9 | 0.0% |
| Native Hawaiian | 124 | 0.1% |
| Navajo | 65 | 0.0% |
| New Zealander | 47 | 0.0% |
| Nicaraguan | 107 | 0.1% |
| Nigerian | 151 | 0.1% |
| Northern European | 430 | 0.3% |
| Norwegian | 1,511 | 0.9% |
| Osage | 68 | 0.0% |
| Ottawa | 9 | 0.0% |
| Pakistani | 125 | 0.1% |
| Panamanian | 81 | 0.1% |
| Pennsylvania German | 47 | 0.0% |
| Peruvian | 54 | 0.0% |
| Polish | 1,699 | 1.0% |
| Portuguese | 163 | 0.1% |
| Potawatomi | 10 | 0.0% |
| Puerto Rican | 1,614 | 1.0% |
| Romanian | 299 | 0.2% |
| Russian | 566 | 0.3% |
| Salvadoran | 259 | 0.2% |
| Samoan | 362 | 0.2% |
| Scandinavian | 453 | 0.3% |
| Scotch-Irish | 2,113 | 1.3% |
| Scottish | 3,430 | 2.0% |
| Serbian | 17 | 0.0% |
| Sioux | 194 | 0.1% |
| Slavic | 8 | 0.0% |
| Slovak | 48 | 0.0% |
| Slovene | 7 | 0.0% |
| South African | 52 | 0.0% |
| South American | 370 | 0.2% |
| Spaniard | 161 | 0.1% |
| Spanish | 95 | 0.1% |
| Sri Lankan | 347 | 0.2% |
| Subsaharan African | 1,421 | 0.8% |
| Swedish | 1,867 | 1.1% |
| Swiss | 207 | 0.1% |
| Syrian | 53 | 0.0% |
| Thai | 345 | 0.2% |
| Ugandan | 9 | 0.0% |
| Ukrainian | 193 | 0.1% |
| Ute | 38 | 0.0% |
| Venezuelan | 42 | 0.0% |
| Vietnamese | 18 | 0.0% |
| Welsh | 1,286 | 0.8% |
| Yugoslavian | 93 | 0.1% | View All 124 Rows |
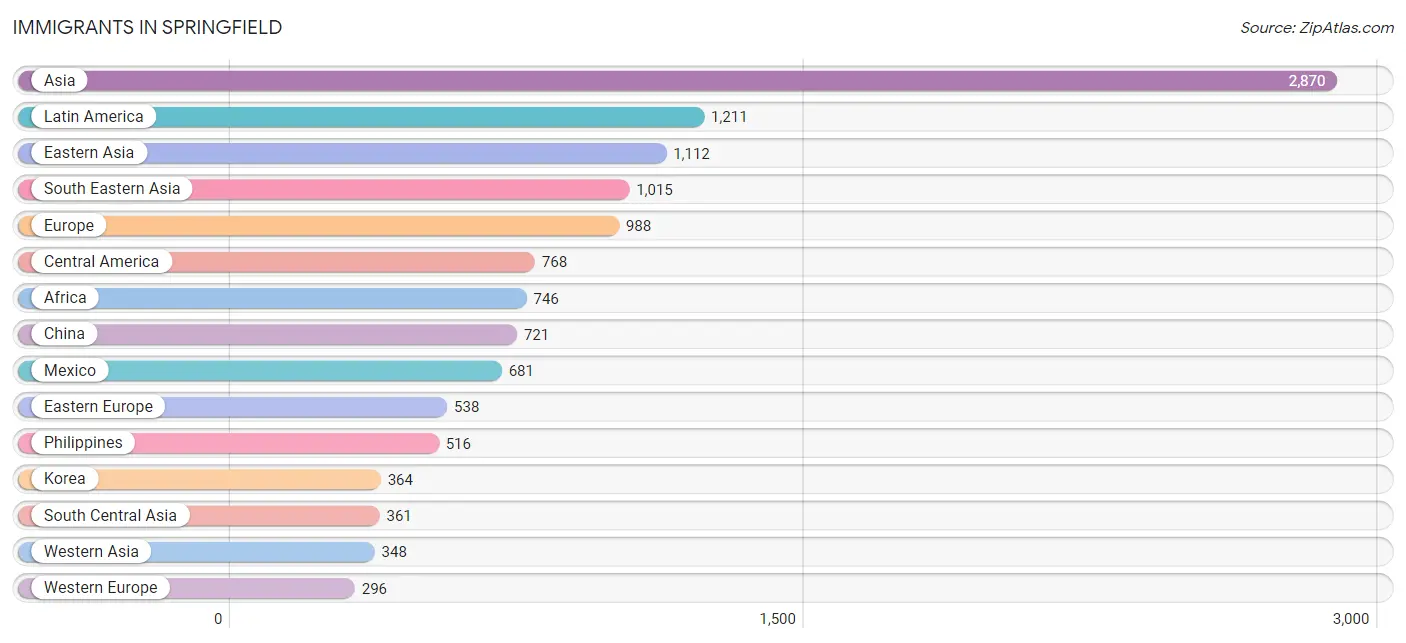
Immigrants in Springfield
The most numerous immigrant groups reported in Springfield came from Asia (2,870 | 1.7%), Latin America (1,211 | 0.7%), Eastern Asia (1,112 | 0.7%), South Eastern Asia (1,015 | 0.6%), and Europe (988 | 0.6%), together accounting for 4.3% of all Springfield residents.
| Immigration Origin | # Population | % Population |
| Africa | 746 | 0.4% |
| Argentina | 66 | 0.0% |
| Asia | 2,870 | 1.7% |
| Australia | 19 | 0.0% |
| Bangladesh | 48 | 0.0% |
| Brazil | 27 | 0.0% |
| Bulgaria | 77 | 0.1% |
| Cambodia | 76 | 0.1% |
| Canada | 165 | 0.1% |
| Caribbean | 175 | 0.1% |
| Central America | 768 | 0.4% |
| China | 721 | 0.4% |
| Colombia | 6 | 0.0% |
| Cuba | 81 | 0.1% |
| Dominican Republic | 14 | 0.0% |
| Eastern Africa | 222 | 0.1% |
| Eastern Asia | 1,112 | 0.7% |
| Eastern Europe | 538 | 0.3% |
| Ecuador | 76 | 0.1% |
| Egypt | 35 | 0.0% |
| El Salvador | 75 | 0.0% |
| England | 50 | 0.0% |
| Eritrea | 8 | 0.0% |
| Ethiopia | 41 | 0.0% |
| Europe | 988 | 0.6% |
| France | 13 | 0.0% |
| Germany | 245 | 0.2% |
| Ghana | 55 | 0.0% |
| Guatemala | 5 | 0.0% |
| Haiti | 19 | 0.0% |
| Hong Kong | 13 | 0.0% |
| Hungary | 20 | 0.0% |
| India | 194 | 0.1% |
| Iran | 4 | 0.0% |
| Iraq | 25 | 0.0% |
| Israel | 13 | 0.0% |
| Italy | 27 | 0.0% |
| Jamaica | 61 | 0.0% |
| Japan | 27 | 0.0% |
| Kazakhstan | 33 | 0.0% |
| Kenya | 127 | 0.1% |
| Korea | 364 | 0.2% |
| Kuwait | 111 | 0.1% |
| Laos | 25 | 0.0% |
| Latin America | 1,211 | 0.7% |
| Mexico | 681 | 0.4% |
| Middle Africa | 99 | 0.1% |
| Netherlands | 13 | 0.0% |
| Nicaragua | 7 | 0.0% |
| Nigeria | 200 | 0.1% |
| Northern Africa | 52 | 0.0% |
| Northern Europe | 116 | 0.1% |
| Oceania | 77 | 0.1% |
| Pakistan | 30 | 0.0% |
| Peru | 54 | 0.0% |
| Philippines | 516 | 0.3% |
| Poland | 5 | 0.0% |
| Romania | 125 | 0.1% |
| Russia | 176 | 0.1% |
| Saudi Arabia | 199 | 0.1% |
| Scotland | 10 | 0.0% |
| South Africa | 62 | 0.0% |
| South America | 268 | 0.2% |
| South Central Asia | 361 | 0.2% |
| South Eastern Asia | 1,015 | 0.6% |
| Southern Europe | 38 | 0.0% |
| Spain | 11 | 0.0% |
| Sri Lanka | 41 | 0.0% |
| Switzerland | 25 | 0.0% |
| Taiwan | 29 | 0.0% |
| Thailand | 157 | 0.1% |
| Uganda | 42 | 0.0% |
| Ukraine | 135 | 0.1% |
| Venezuela | 25 | 0.0% |
| Vietnam | 241 | 0.1% |
| Western Africa | 264 | 0.2% |
| Western Asia | 348 | 0.2% |
| Western Europe | 296 | 0.2% |
| Zaire | 99 | 0.1% |
| Zimbabwe | 4 | 0.0% | View All 80 Rows |
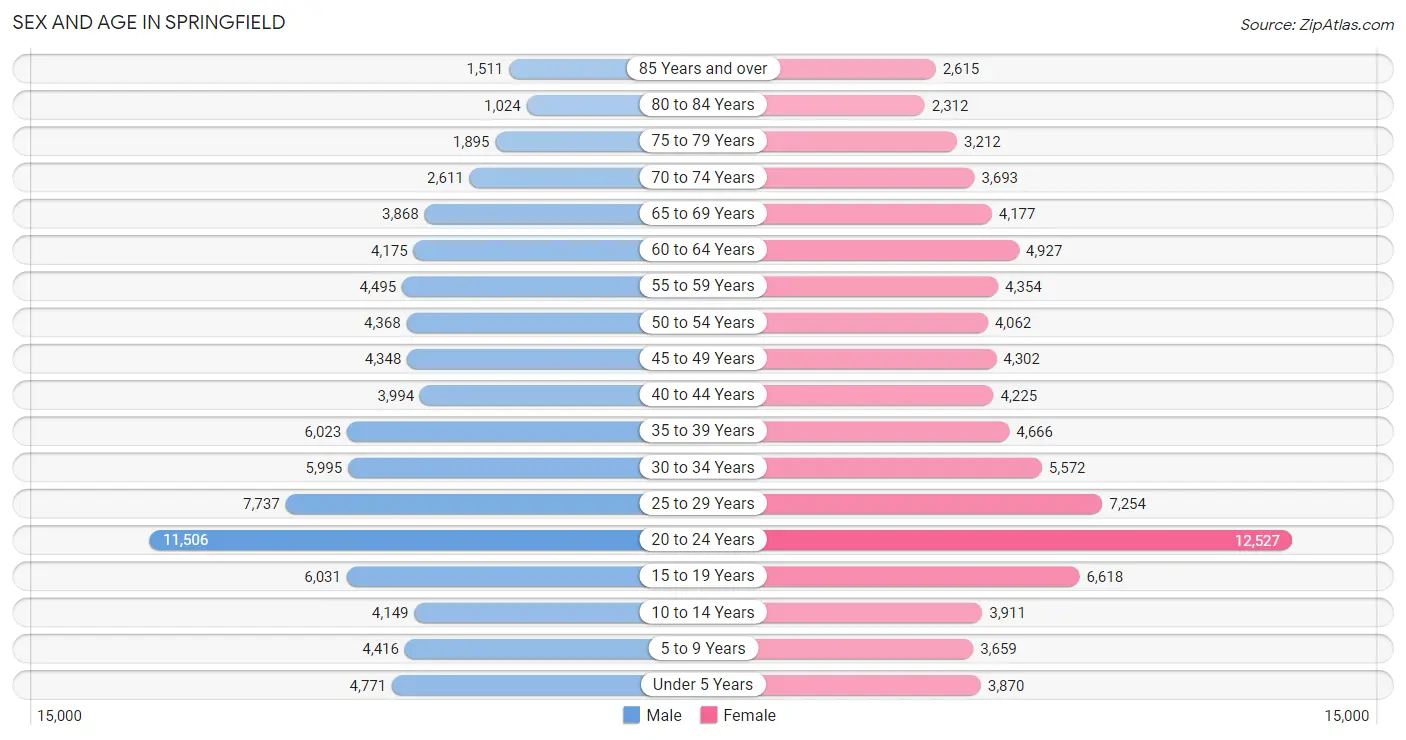
Sex and Age in Springfield
Sex and Age in Springfield
The most populous age groups in Springfield are 20 to 24 Years (11,506 | 13.9%) for men and 20 to 24 Years (12,527 | 14.6%) for women.
| Age Bracket | Male | Female |
| Under 5 Years | 4,771 (5.8%) | 3,870 (4.5%) |
| 5 to 9 Years | 4,416 (5.3%) | 3,659 (4.3%) |
| 10 to 14 Years | 4,149 (5.0%) | 3,911 (4.5%) |
| 15 to 19 Years | 6,031 (7.3%) | 6,618 (7.7%) |
| 20 to 24 Years | 11,506 (13.9%) | 12,527 (14.6%) |
| 25 to 29 Years | 7,737 (9.3%) | 7,254 (8.4%) |
| 30 to 34 Years | 5,995 (7.2%) | 5,572 (6.5%) |
| 35 to 39 Years | 6,023 (7.3%) | 4,666 (5.4%) |
| 40 to 44 Years | 3,994 (4.8%) | 4,225 (4.9%) |
| 45 to 49 Years | 4,348 (5.2%) | 4,302 (5.0%) |
| 50 to 54 Years | 4,368 (5.3%) | 4,062 (4.7%) |
| 55 to 59 Years | 4,495 (5.4%) | 4,354 (5.1%) |
| 60 to 64 Years | 4,175 (5.0%) | 4,927 (5.7%) |
| 65 to 69 Years | 3,868 (4.7%) | 4,177 (4.9%) |
| 70 to 74 Years | 2,611 (3.2%) | 3,693 (4.3%) |
| 75 to 79 Years | 1,895 (2.3%) | 3,212 (3.7%) |
| 80 to 84 Years | 1,024 (1.2%) | 2,312 (2.7%) |
| 85 Years and over | 1,511 (1.8%) | 2,615 (3.0%) |
| Total | 82,917 (100.0%) | 85,956 (100.0%) |
Families and Households in Springfield
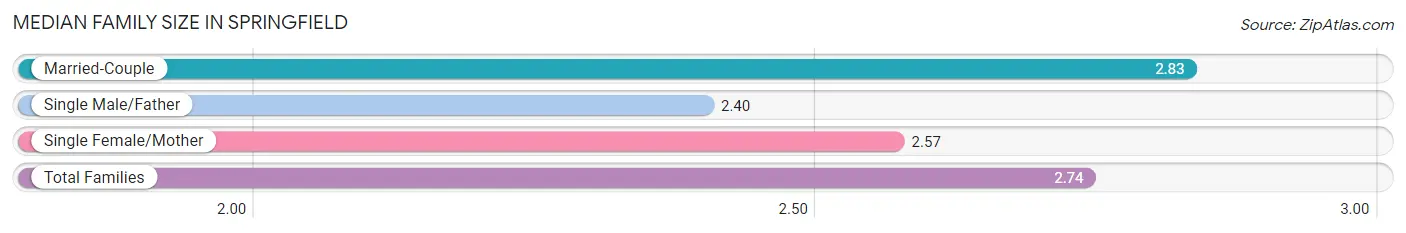
Median Family Size in Springfield
The median family size in Springfield is 2.74 persons per family, with married-couple families (25,612 | 69.3%) accounting for the largest median family size of 2.83 persons per family. On the other hand, single male/father families (3,711 | 10.1%) represent the smallest median family size with 2.40 persons per family.
| Family Type | # Families | Family Size |
| Married-Couple | 25,612 (69.3%) | 2.83 |
| Single Male/Father | 3,711 (10.1%) | 2.40 |
| Single Female/Mother | 7,616 (20.6%) | 2.57 |
| Total Families | 36,939 (100.0%) | 2.74 |
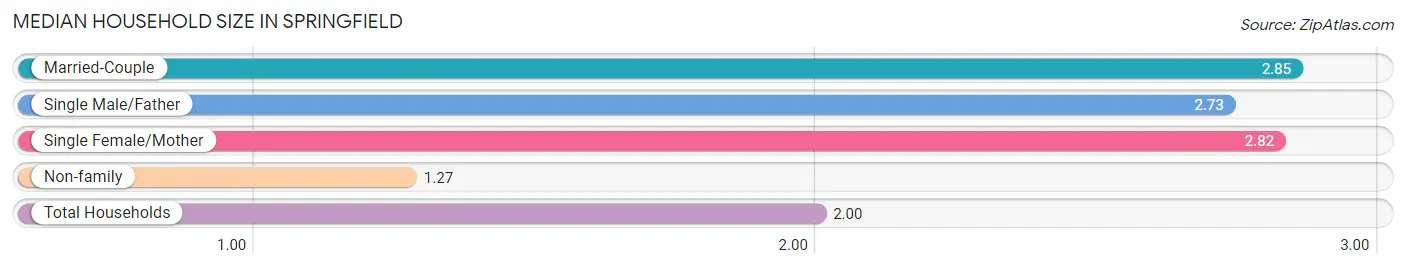
Median Household Size in Springfield
The median household size in Springfield is 2.00 persons per household, with married-couple households (25,612 | 32.4%) accounting for the largest median household size of 2.85 persons per household. non-family households (42,131 | 53.3%) represent the smallest median household size with 1.27 persons per household.
| Household Type | # Households | Household Size |
| Married-Couple | 25,612 (32.4%) | 2.85 |
| Single Male/Father | 3,711 (4.7%) | 2.73 |
| Single Female/Mother | 7,616 (9.6%) | 2.82 |
| Non-family | 42,131 (53.3%) | 1.27 |
| Total Households | 79,070 (100.0%) | 2.00 |
Household Size by Marriage Status in Springfield
Out of a total of 79,070 households in Springfield, 36,939 (46.7%) are family households, while 42,131 (53.3%) are nonfamily households. The most numerous type of family households are 2-person households, comprising 19,317, and the most common type of nonfamily households are 1-person households, comprising 32,103.
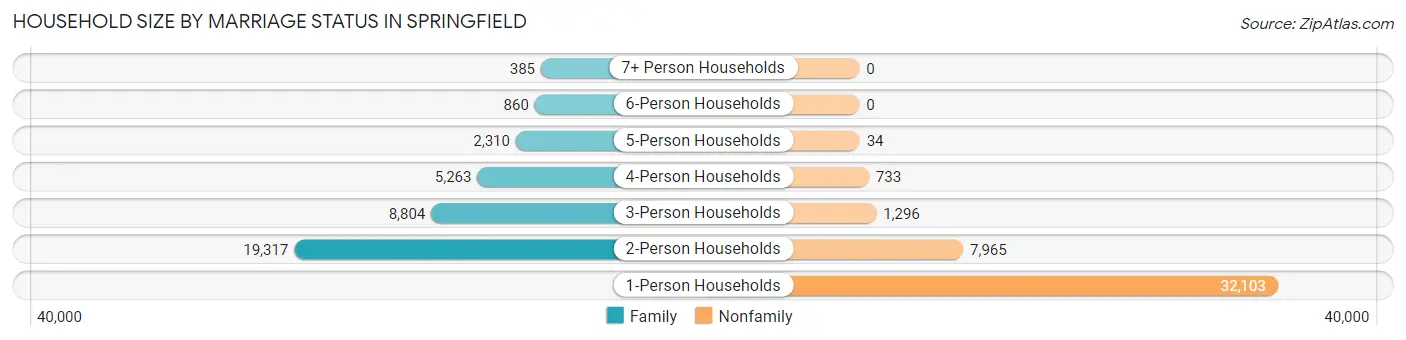
| Household Size | Family Households | Nonfamily Households |
| 1-Person Households | - | 32,103 (40.6%) |
| 2-Person Households | 19,317 (24.4%) | 7,965 (10.1%) |
| 3-Person Households | 8,804 (11.1%) | 1,296 (1.6%) |
| 4-Person Households | 5,263 (6.7%) | 733 (0.9%) |
| 5-Person Households | 2,310 (2.9%) | 34 (0.0%) |
| 6-Person Households | 860 (1.1%) | 0 (0.0%) |
| 7+ Person Households | 385 (0.5%) | 0 (0.0%) |
| Total | 36,939 (46.7%) | 42,131 (53.3%) |
Female Fertility in Springfield
Fertility by Age in Springfield
Average fertility rate in Springfield is 54.0 births per 1,000 women. Women in the age bracket of 20 to 34 years have the highest fertility rate with 82.0 births per 1,000 women. Women in the age bracket of 20 to 34 years acount for 83.0% of all women with births.
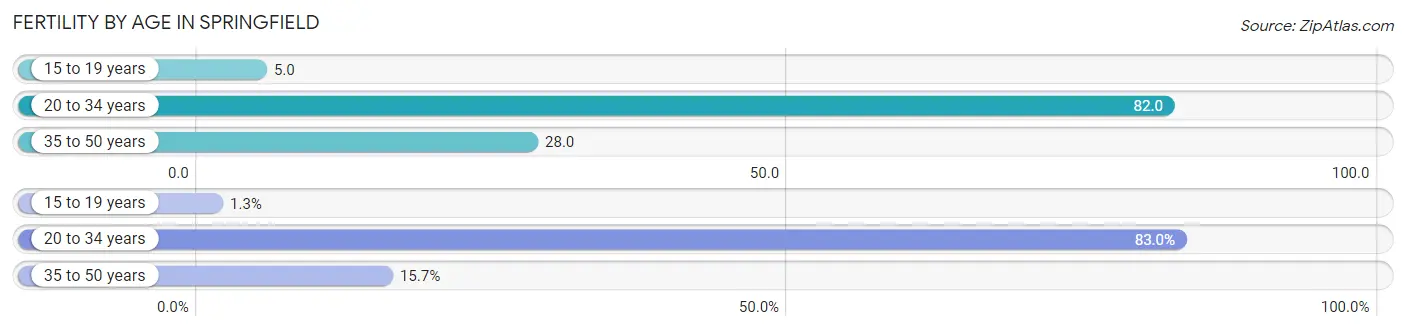
| Age Bracket | Women with Births | Births / 1,000 Women |
| 15 to 19 years | 32 (1.3%) | 5.0 |
| 20 to 34 years | 2,069 (83.0%) | 82.0 |
| 35 to 50 years | 391 (15.7%) | 28.0 |
| Total | 2,492 (100.0%) | 54.0 |
Fertility by Age by Marriage Status in Springfield
60.4% of women with births (2,492) in Springfield are married. The highest percentage of unmarried women with births falls into 15 to 19 years age bracket with 100.0% of them unmarried at the time of birth, while the lowest percentage of unmarried women with births belong to 35 to 50 years age bracket with 20.0% of them unmarried.
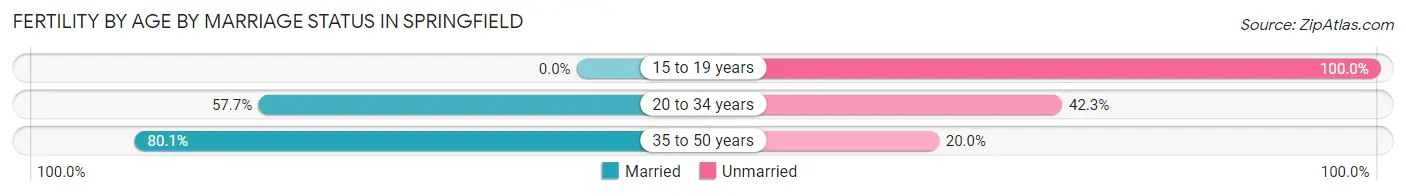
| Age Bracket | Married | Unmarried |
| 15 to 19 years | 0 (0.0%) | 32 (100.0%) |
| 20 to 34 years | 1,194 (57.7%) | 875 (42.3%) |
| 35 to 50 years | 313 (80.0%) | 78 (20.0%) |
| Total | 1,505 (60.4%) | 987 (39.6%) |
Fertility by Education in Springfield
Average fertility rate in Springfield is 54.0 births per 1,000 women. Women with the education attainment of less than high school have the highest fertility rate of 71.0 births per 1,000 women, while women with the education attainment of college or associate's degree have the lowest fertility at 48.0 births per 1,000 women. Women with the education attainment of college or associate's degree represent 39.4% of all women with births.
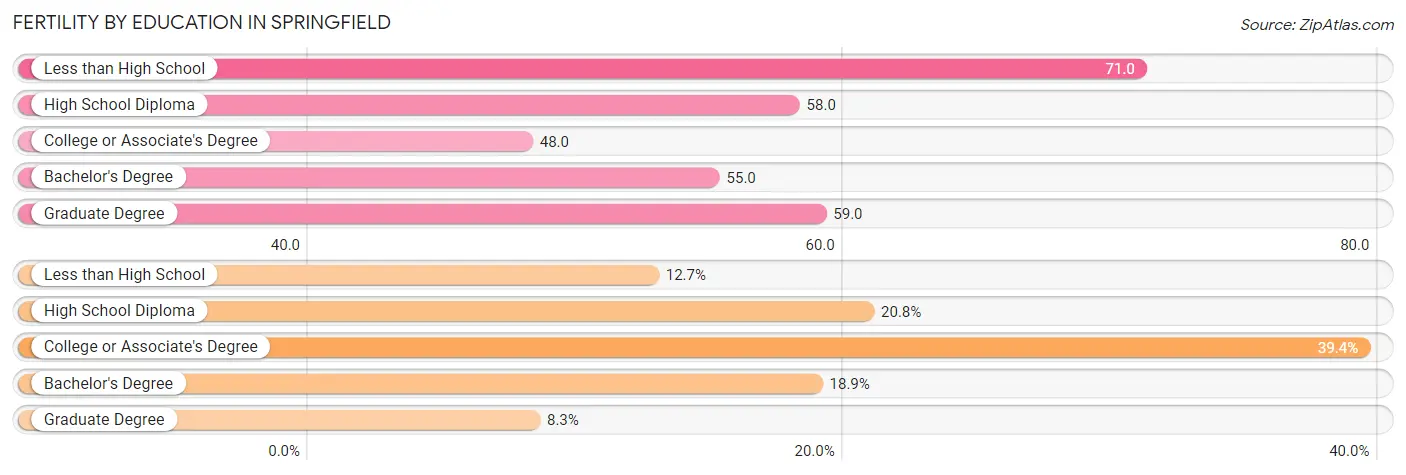
| Educational Attainment | Women with Births | Births / 1,000 Women |
| Less than High School | 317 (12.7%) | 71.0 |
| High School Diploma | 518 (20.8%) | 58.0 |
| College or Associate's Degree | 981 (39.4%) | 48.0 |
| Bachelor's Degree | 470 (18.9%) | 55.0 |
| Graduate Degree | 206 (8.3%) | 59.0 |
| Total | 2,492 (100.0%) | 54.0 |
Fertility by Education by Marriage Status in Springfield
39.6% of women with births in Springfield are unmarried. Women with the educational attainment of graduate degree are most likely to be married with 90.3% of them married at childbirth, while women with the educational attainment of high school diploma are least likely to be married with 73.8% of them unmarried at childbirth.
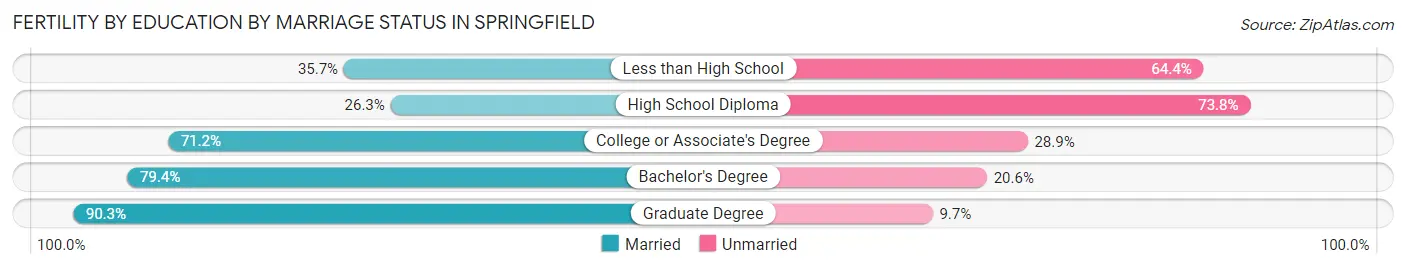
| Educational Attainment | Married | Unmarried |
| Less than High School | 113 (35.6%) | 204 (64.3%) |
| High School Diploma | 136 (26.3%) | 382 (73.8%) |
| College or Associate's Degree | 698 (71.2%) | 283 (28.8%) |
| Bachelor's Degree | 373 (79.4%) | 97 (20.6%) |
| Graduate Degree | 186 (90.3%) | 20 (9.7%) |
| Total | 1,505 (60.4%) | 987 (39.6%) |
Employment Characteristics in Springfield
Employment by Class of Employer in Springfield
Among the 79,314 employed individuals in Springfield, private company employees (56,557 | 71.3%), not-for-profit organizations (8,913 | 11.2%), and local government employees (3,861 | 4.9%) make up the most common classes of employment.
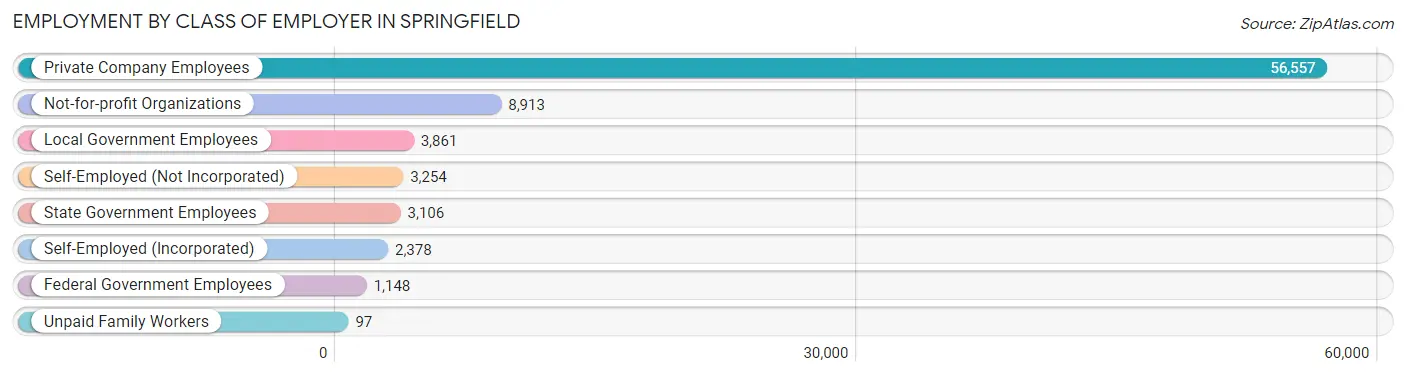
| Employer Class | # Employees | % Employees |
| Private Company Employees | 56,557 | 71.3% |
| Self-Employed (Incorporated) | 2,378 | 3.0% |
| Self-Employed (Not Incorporated) | 3,254 | 4.1% |
| Not-for-profit Organizations | 8,913 | 11.2% |
| Local Government Employees | 3,861 | 4.9% |
| State Government Employees | 3,106 | 3.9% |
| Federal Government Employees | 1,148 | 1.5% |
| Unpaid Family Workers | 97 | 0.1% |
| Total | 79,314 | 100.0% |
Employment Status by Age in Springfield
According to the labor force statistics for Springfield, out of the total population over 16 years of age (142,881), 59.6% or 85,157 individuals are in the labor force, with 4.8% or 4,088 of them unemployed. The age group with the highest labor force participation rate is 25 to 29 years, with 86.7% or 12,997 individuals in the labor force. Within the labor force, the 16 to 19 years age range has the highest percentage of unemployed individuals, with 11.8% or 482 of them being unemployed.
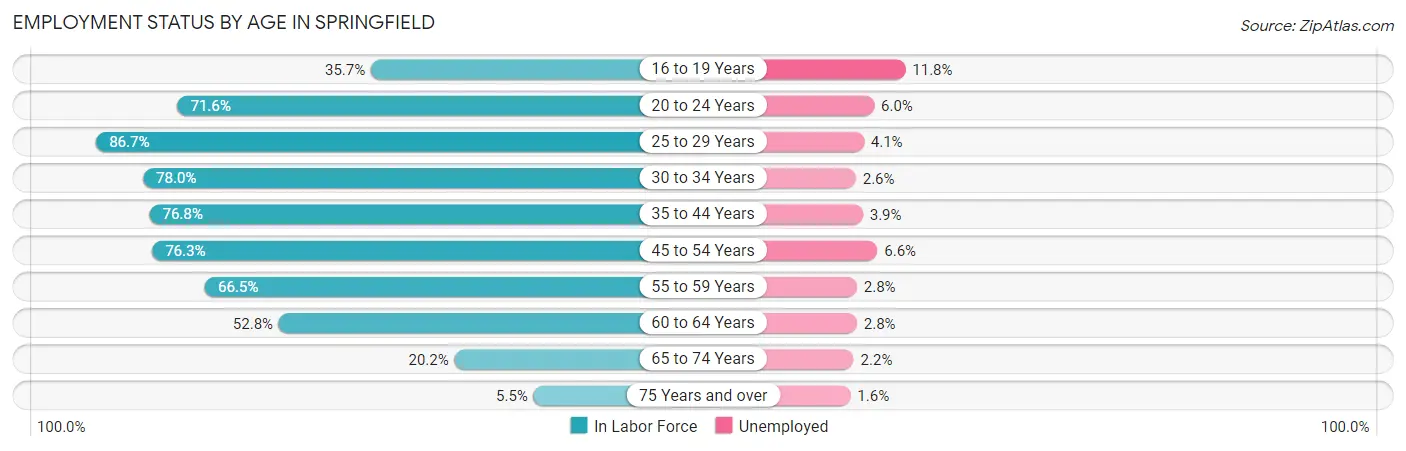
| Age Bracket | In Labor Force | Unemployed |
| 16 to 19 Years | 4,082 (35.7%) | 482 (11.8%) |
| 20 to 24 Years | 17,208 (71.6%) | 1,032 (6.0%) |
| 25 to 29 Years | 12,997 (86.7%) | 533 (4.1%) |
| 30 to 34 Years | 9,022 (78.0%) | 235 (2.6%) |
| 35 to 44 Years | 14,521 (76.8%) | 566 (3.9%) |
| 45 to 54 Years | 13,032 (76.3%) | 860 (6.6%) |
| 55 to 59 Years | 5,885 (66.5%) | 165 (2.8%) |
| 60 to 64 Years | 4,806 (52.8%) | 135 (2.8%) |
| 65 to 74 Years | 2,898 (20.2%) | 64 (2.2%) |
| 75 Years and over | 691 (5.5%) | 11 (1.6%) |
| Total | 85,157 (59.6%) | 4,088 (4.8%) |
Employment Status by Educational Attainment in Springfield
According to labor force statistics for Springfield, 74.9% of individuals (60,292) out of the total population between 25 and 64 years of age (80,497) are in the labor force, with 4.2% or 2,532 of them being unemployed. The group with the highest labor force participation rate are those with the educational attainment of bachelor's degree or higher, with 88.5% or 21,590 individuals in the labor force. Within the labor force, individuals with less than high school education have the highest percentage of unemployment, with 15.6% or 423 of them being unemployed.
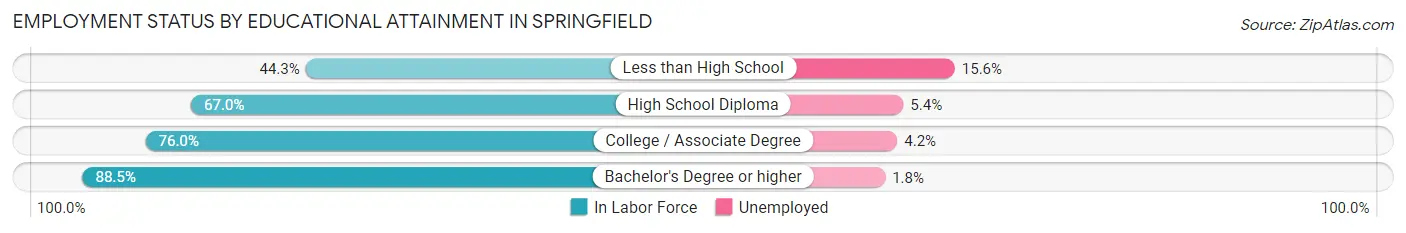
| Educational Attainment | In Labor Force | Unemployed |
| Less than High School | 2,710 (44.3%) | 954 (15.6%) |
| High School Diploma | 15,184 (67.0%) | 1,224 (5.4%) |
| College / Associate Degree | 20,765 (76.0%) | 1,148 (4.2%) |
| Bachelor's Degree or higher | 21,590 (88.5%) | 439 (1.8%) |
| Total | 60,292 (74.9%) | 3,381 (4.2%) |
Employment Occupations by Sex in Springfield
Management, Business, Science and Arts Occupations
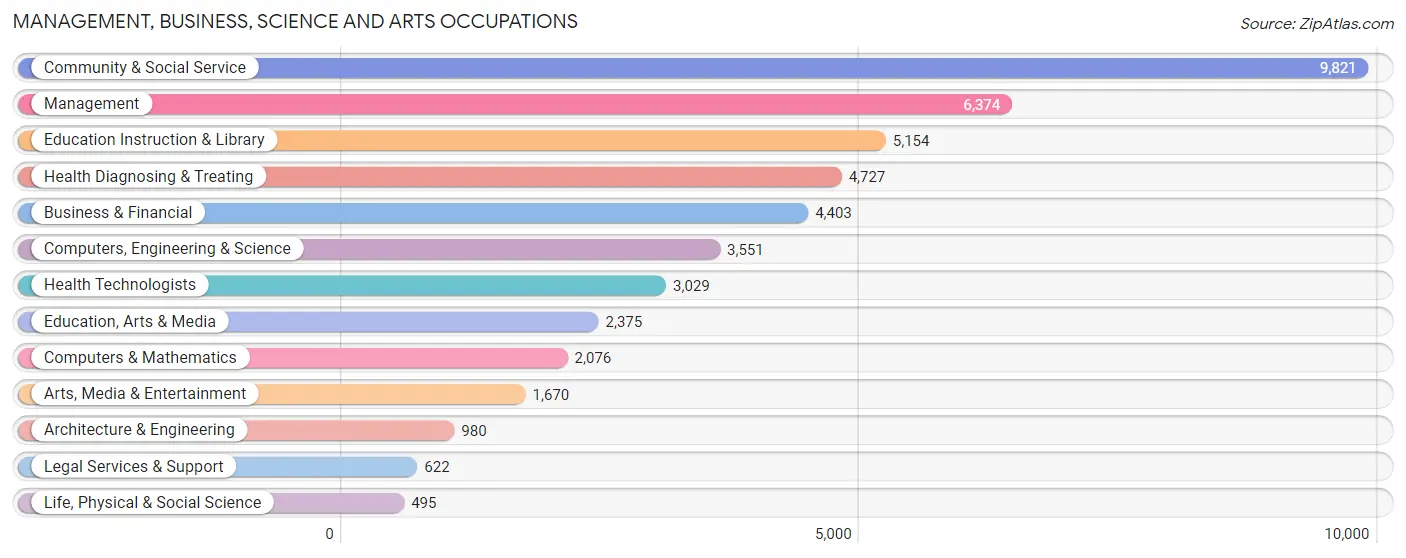
The most common Management, Business, Science and Arts occupations in Springfield are Community & Social Service (9,821 | 12.1%), Management (6,374 | 7.9%), Education Instruction & Library (5,154 | 6.4%), Health Diagnosing & Treating (4,727 | 5.8%), and Business & Financial (4,403 | 5.4%).
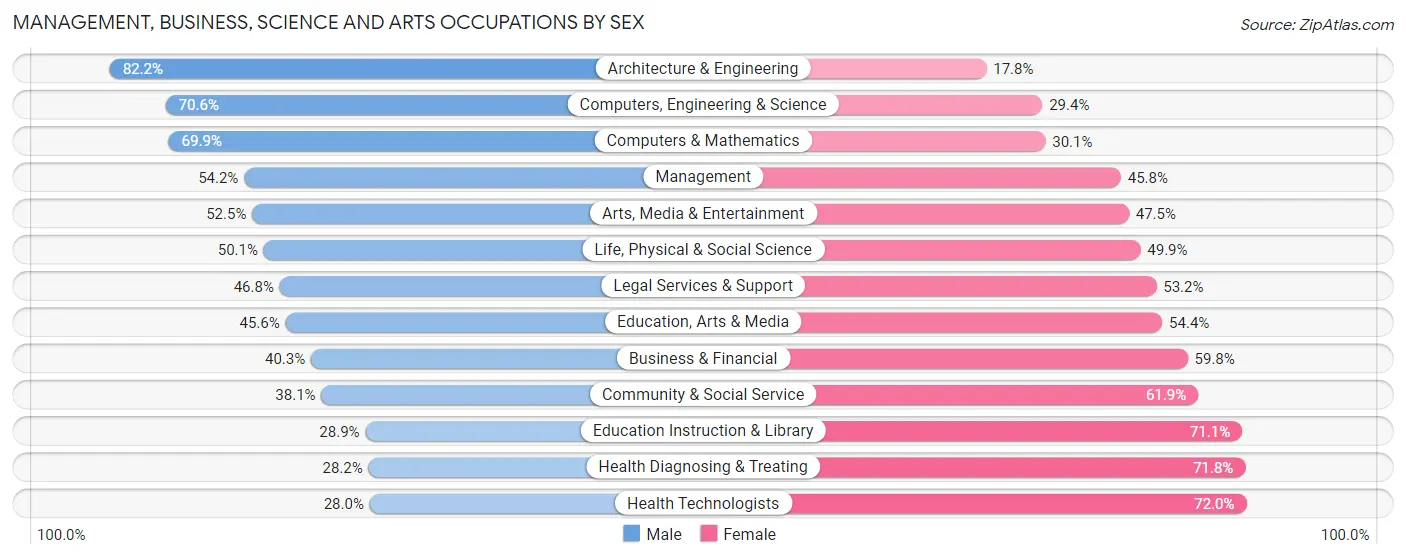
Management, Business, Science and Arts Occupations by Sex
Within the Management, Business, Science and Arts occupations in Springfield, the most male-oriented occupations are Architecture & Engineering (82.2%), Computers, Engineering & Science (70.6%), and Computers & Mathematics (69.9%), while the most female-oriented occupations are Health Technologists (72.0%), Health Diagnosing & Treating (71.8%), and Education Instruction & Library (71.1%).
| Occupation | Male | Female |
| Management | 3,454 (54.2%) | 2,920 (45.8%) |
| Business & Financial | 1,772 (40.3%) | 2,631 (59.8%) |
| Computers, Engineering & Science | 2,506 (70.6%) | 1,045 (29.4%) |
| Computers & Mathematics | 1,452 (69.9%) | 624 (30.1%) |
| Architecture & Engineering | 806 (82.2%) | 174 (17.8%) |
| Life, Physical & Social Science | 248 (50.1%) | 247 (49.9%) |
| Community & Social Service | 3,740 (38.1%) | 6,081 (61.9%) |
| Education, Arts & Media | 1,082 (45.6%) | 1,293 (54.4%) |
| Legal Services & Support | 291 (46.8%) | 331 (53.2%) |
| Education Instruction & Library | 1,490 (28.9%) | 3,664 (71.1%) |
| Arts, Media & Entertainment | 877 (52.5%) | 793 (47.5%) |
| Health Diagnosing & Treating | 1,335 (28.2%) | 3,392 (71.8%) |
| Health Technologists | 848 (28.0%) | 2,181 (72.0%) |
| Total (Category) | 12,807 (44.4%) | 16,069 (55.6%) |
| Total (Overall) | 41,315 (51.1%) | 39,592 (48.9%) |
Services Occupations
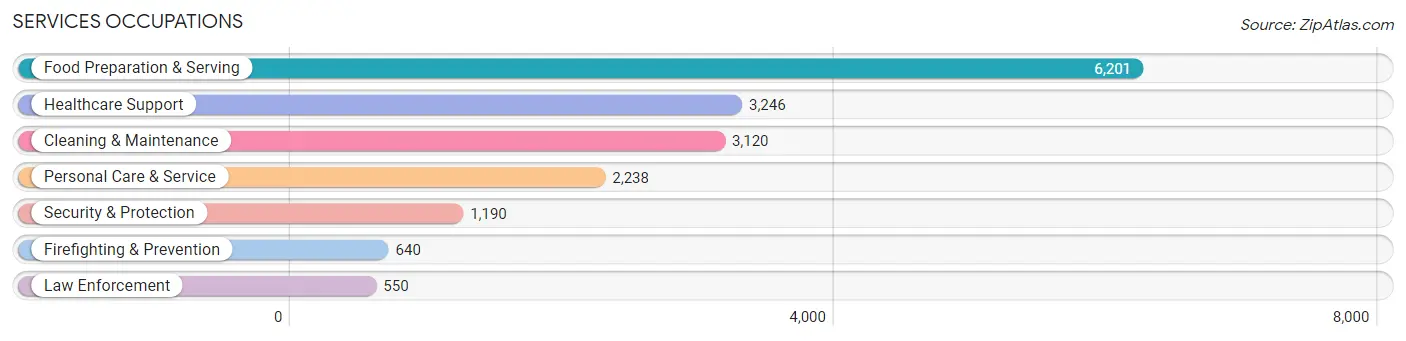
The most common Services occupations in Springfield are Food Preparation & Serving (6,201 | 7.7%), Healthcare Support (3,246 | 4.0%), Cleaning & Maintenance (3,120 | 3.9%), Personal Care & Service (2,238 | 2.8%), and Security & Protection (1,190 | 1.5%).
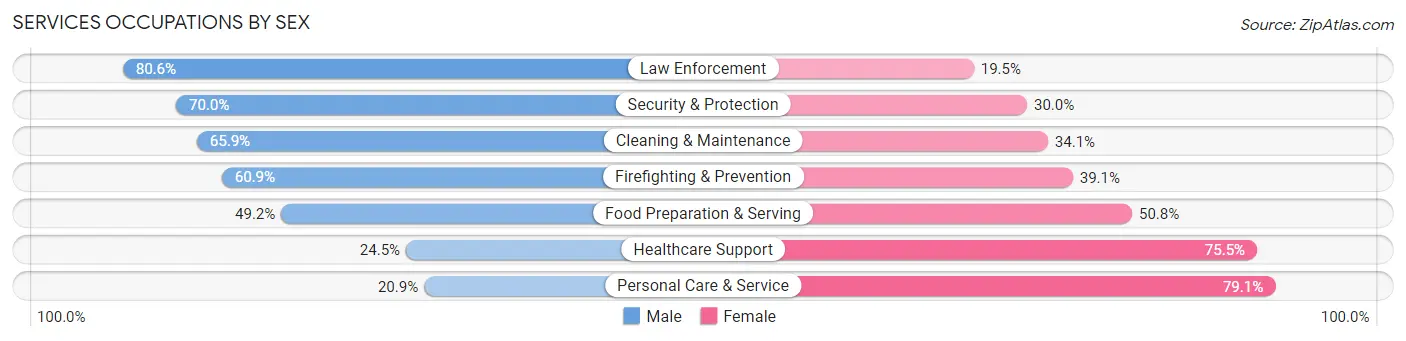
Services Occupations by Sex
Within the Services occupations in Springfield, the most male-oriented occupations are Law Enforcement (80.5%), Security & Protection (70.0%), and Cleaning & Maintenance (65.9%), while the most female-oriented occupations are Personal Care & Service (79.1%), Healthcare Support (75.5%), and Food Preparation & Serving (50.8%).
| Occupation | Male | Female |
| Healthcare Support | 795 (24.5%) | 2,451 (75.5%) |
| Security & Protection | 833 (70.0%) | 357 (30.0%) |
| Firefighting & Prevention | 390 (60.9%) | 250 (39.1%) |
| Law Enforcement | 443 (80.5%) | 107 (19.5%) |
| Food Preparation & Serving | 3,051 (49.2%) | 3,150 (50.8%) |
| Cleaning & Maintenance | 2,055 (65.9%) | 1,065 (34.1%) |
| Personal Care & Service | 468 (20.9%) | 1,770 (79.1%) |
| Total (Category) | 7,202 (45.0%) | 8,793 (55.0%) |
| Total (Overall) | 41,315 (51.1%) | 39,592 (48.9%) |
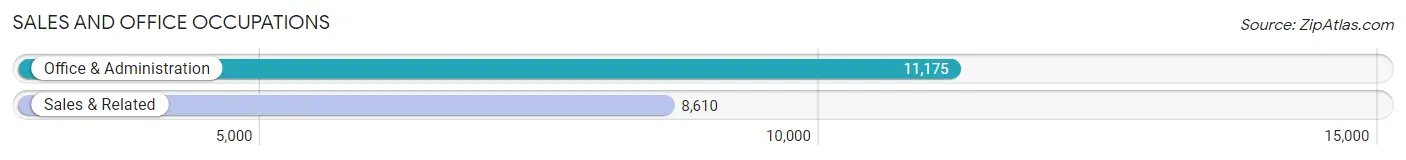
Sales and Office Occupations
The most common Sales and Office occupations in Springfield are Office & Administration (11,175 | 13.8%), and Sales & Related (8,610 | 10.6%).
Sales and Office Occupations by Sex
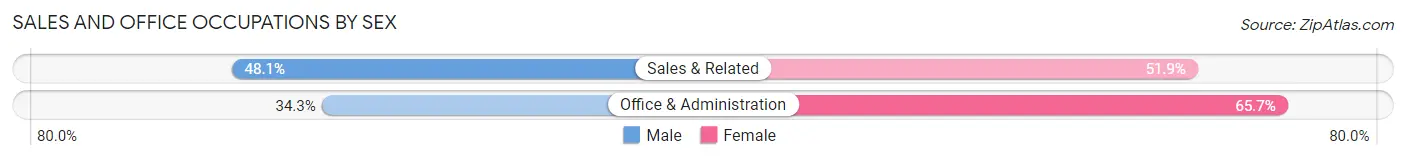
| Occupation | Male | Female |
| Sales & Related | 4,145 (48.1%) | 4,465 (51.9%) |
| Office & Administration | 3,834 (34.3%) | 7,341 (65.7%) |
| Total (Category) | 7,979 (40.3%) | 11,806 (59.7%) |
| Total (Overall) | 41,315 (51.1%) | 39,592 (48.9%) |
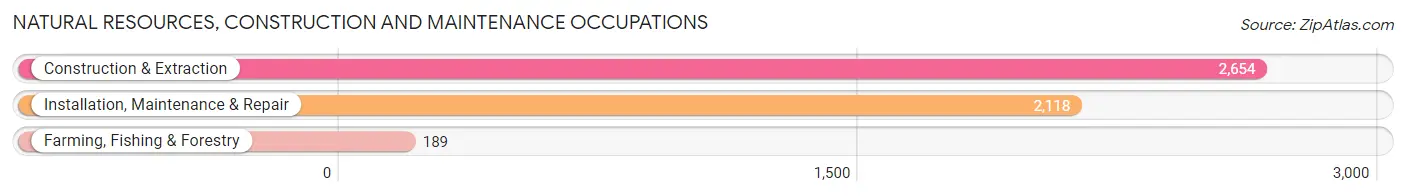
Natural Resources, Construction and Maintenance Occupations
The most common Natural Resources, Construction and Maintenance occupations in Springfield are Construction & Extraction (2,654 | 3.3%), Installation, Maintenance & Repair (2,118 | 2.6%), and Farming, Fishing & Forestry (189 | 0.2%).
Natural Resources, Construction and Maintenance Occupations by Sex
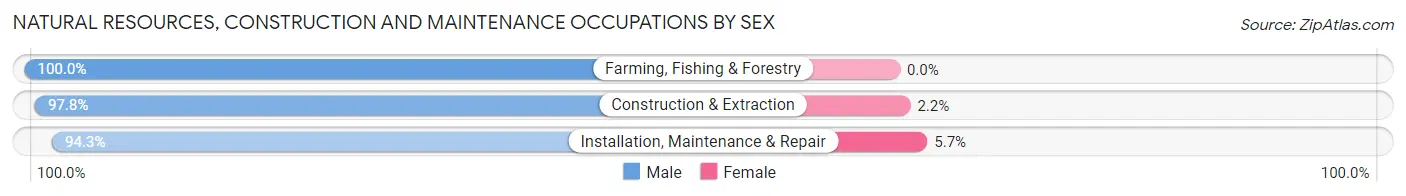
| Occupation | Male | Female |
| Farming, Fishing & Forestry | 189 (100.0%) | 0 (0.0%) |
| Construction & Extraction | 2,596 (97.8%) | 58 (2.2%) |
| Installation, Maintenance & Repair | 1,997 (94.3%) | 121 (5.7%) |
| Total (Category) | 4,782 (96.4%) | 179 (3.6%) |
| Total (Overall) | 41,315 (51.1%) | 39,592 (48.9%) |
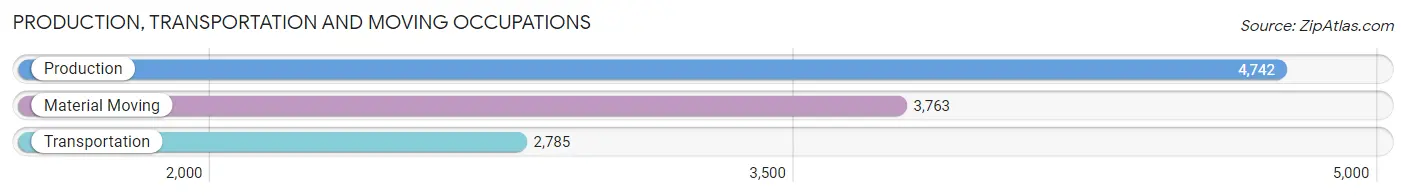
Production, Transportation and Moving Occupations
The most common Production, Transportation and Moving occupations in Springfield are Production (4,742 | 5.9%), Material Moving (3,763 | 4.6%), and Transportation (2,785 | 3.4%).
Production, Transportation and Moving Occupations by Sex
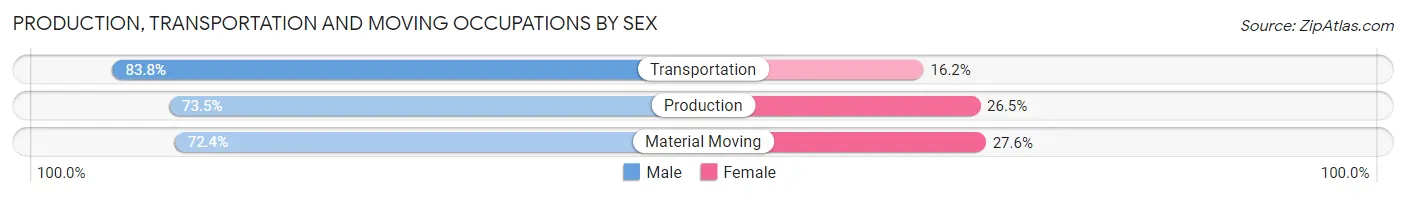
| Occupation | Male | Female |
| Production | 3,484 (73.5%) | 1,258 (26.5%) |
| Transportation | 2,335 (83.8%) | 450 (16.2%) |
| Material Moving | 2,726 (72.4%) | 1,037 (27.6%) |
| Total (Category) | 8,545 (75.7%) | 2,745 (24.3%) |
| Total (Overall) | 41,315 (51.1%) | 39,592 (48.9%) |
Employment Industries by Sex in Springfield
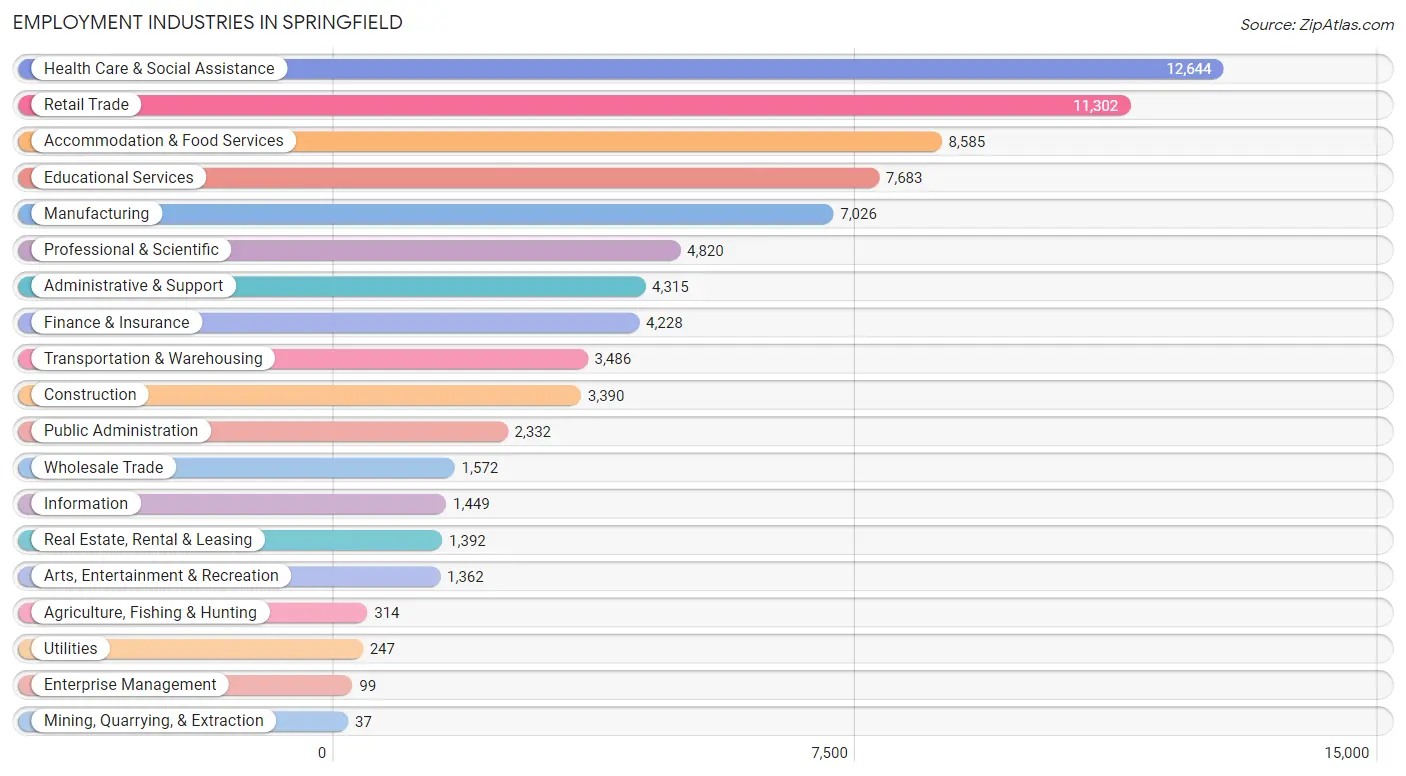
Employment Industries in Springfield
The major employment industries in Springfield include Health Care & Social Assistance (12,644 | 15.6%), Retail Trade (11,302 | 14.0%), Accommodation & Food Services (8,585 | 10.6%), Educational Services (7,683 | 9.5%), and Manufacturing (7,026 | 8.7%).
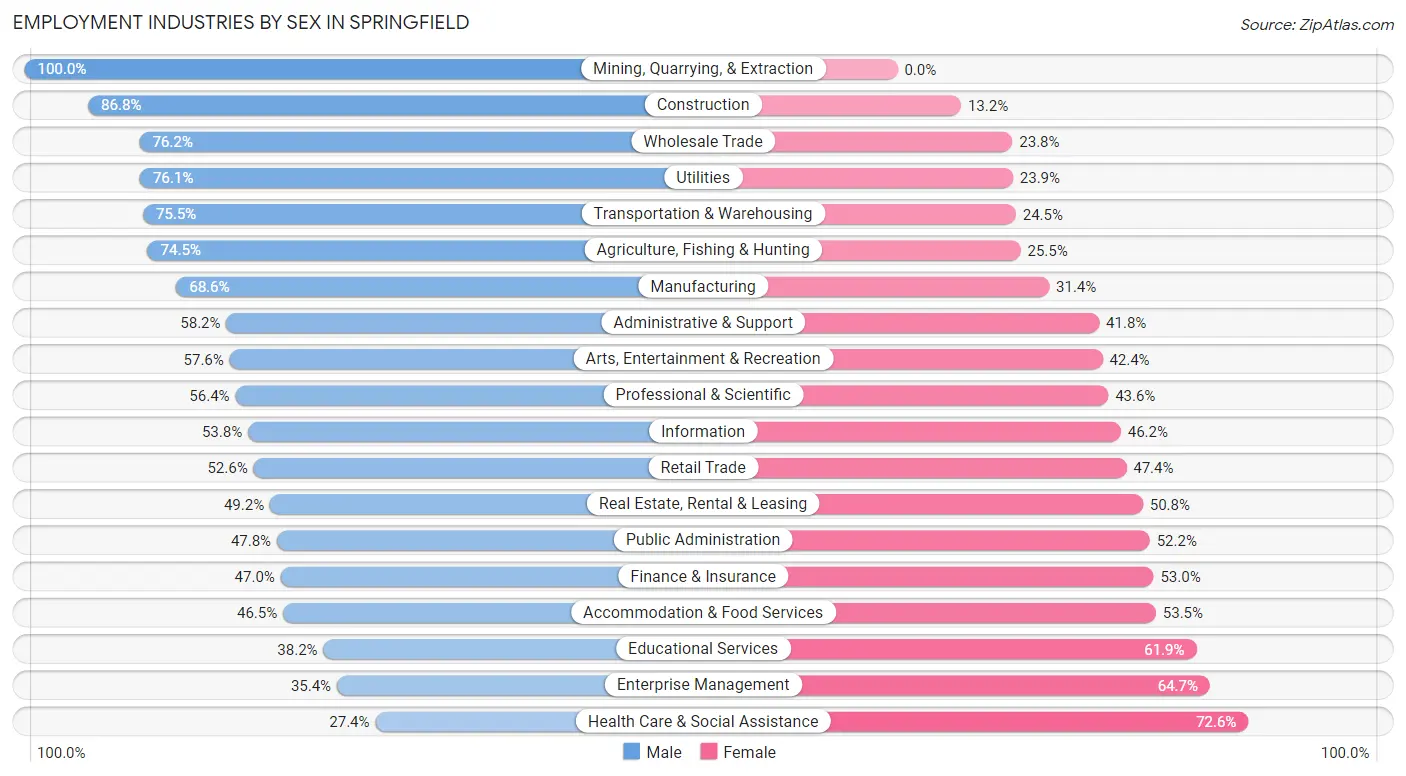
Employment Industries by Sex in Springfield
The Springfield industries that see more men than women are Mining, Quarrying, & Extraction (100.0%), Construction (86.8%), and Wholesale Trade (76.2%), whereas the industries that tend to have a higher number of women are Health Care & Social Assistance (72.6%), Enterprise Management (64.6%), and Educational Services (61.9%).
| Industry | Male | Female |
| Agriculture, Fishing & Hunting | 234 (74.5%) | 80 (25.5%) |
| Mining, Quarrying, & Extraction | 37 (100.0%) | 0 (0.0%) |
| Construction | 2,944 (86.8%) | 446 (13.2%) |
| Manufacturing | 4,820 (68.6%) | 2,206 (31.4%) |
| Wholesale Trade | 1,198 (76.2%) | 374 (23.8%) |
| Retail Trade | 5,947 (52.6%) | 5,355 (47.4%) |
| Transportation & Warehousing | 2,632 (75.5%) | 854 (24.5%) |
| Utilities | 188 (76.1%) | 59 (23.9%) |
| Information | 779 (53.8%) | 670 (46.2%) |
| Finance & Insurance | 1,987 (47.0%) | 2,241 (53.0%) |
| Real Estate, Rental & Leasing | 685 (49.2%) | 707 (50.8%) |
| Professional & Scientific | 2,717 (56.4%) | 2,103 (43.6%) |
| Enterprise Management | 35 (35.3%) | 64 (64.6%) |
| Administrative & Support | 2,513 (58.2%) | 1,802 (41.8%) |
| Educational Services | 2,931 (38.2%) | 4,752 (61.9%) |
| Health Care & Social Assistance | 3,465 (27.4%) | 9,179 (72.6%) |
| Arts, Entertainment & Recreation | 784 (57.6%) | 578 (42.4%) |
| Accommodation & Food Services | 3,993 (46.5%) | 4,592 (53.5%) |
| Public Administration | 1,114 (47.8%) | 1,218 (52.2%) |
| Total | 41,315 (51.1%) | 39,592 (48.9%) |
Education in Springfield
School Enrollment in Springfield
The most common levels of schooling among the 44,913 students in Springfield are college / undergraduate (20,910 | 46.6%), elementary school (5,928 | 13.2%), and middle school (5,839 | 13.0%).
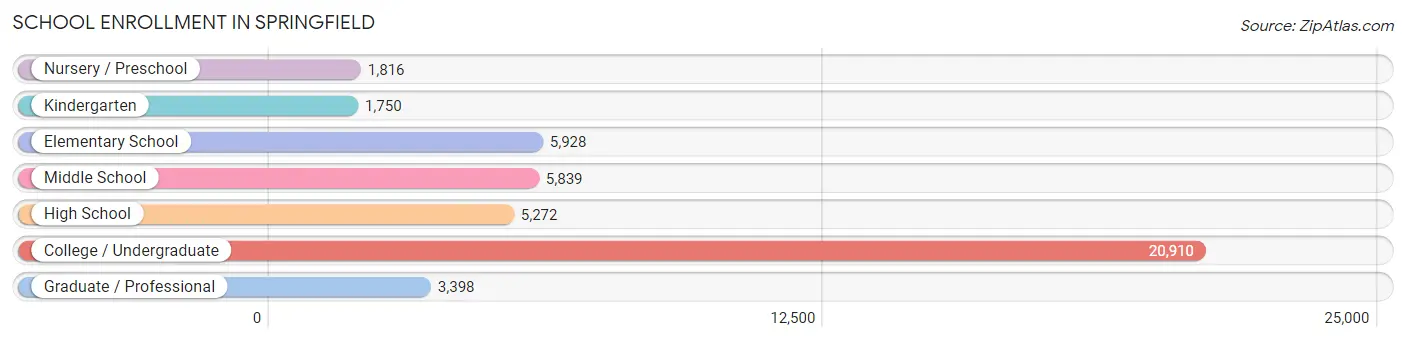
| School Level | # Students | % Students |
| Nursery / Preschool | 1,816 | 4.0% |
| Kindergarten | 1,750 | 3.9% |
| Elementary School | 5,928 | 13.2% |
| Middle School | 5,839 | 13.0% |
| High School | 5,272 | 11.7% |
| College / Undergraduate | 20,910 | 46.6% |
| Graduate / Professional | 3,398 | 7.6% |
| Total | 44,913 | 100.0% |
School Enrollment by Age by Funding Source in Springfield
Out of a total of 44,913 students who are enrolled in schools in Springfield, 7,186 (16.0%) attend a private institution, while the remaining 37,727 (84.0%) are enrolled in public schools. The age group of 3 to 4 year olds has the highest likelihood of being enrolled in private schools, with 486 (33.4% in the age bracket) enrolled. Conversely, the age group of 15 to 17 year olds has the lowest likelihood of being enrolled in a private school, with 3,239 (90.1% in the age bracket) attending a public institution.
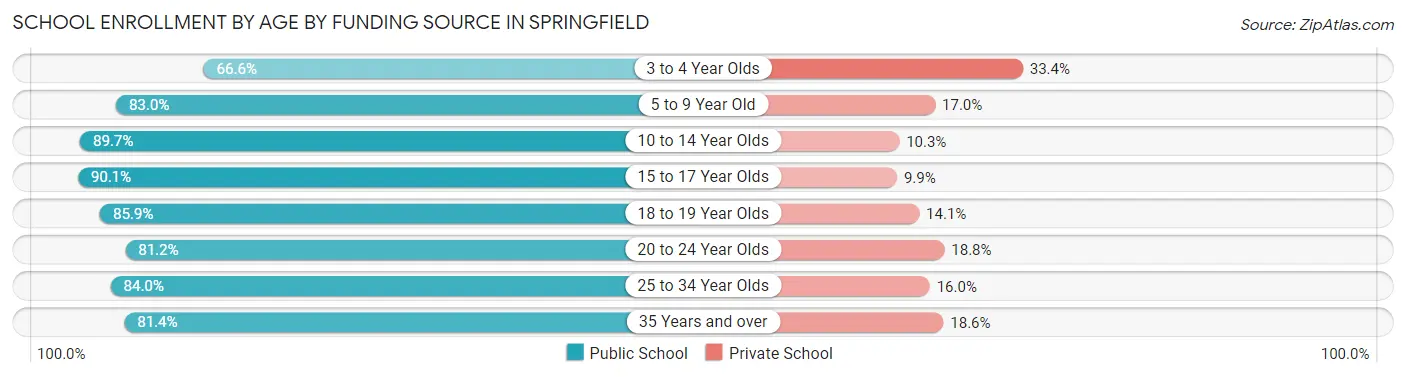
| Age Bracket | Public School | Private School |
| 3 to 4 Year Olds | 971 (66.6%) | 486 (33.4%) |
| 5 to 9 Year Old | 6,056 (83.0%) | 1,243 (17.0%) |
| 10 to 14 Year Olds | 6,506 (89.7%) | 750 (10.3%) |
| 15 to 17 Year Olds | 3,239 (90.1%) | 357 (9.9%) |
| 18 to 19 Year Olds | 5,624 (85.9%) | 920 (14.1%) |
| 20 to 24 Year Olds | 10,524 (81.2%) | 2,430 (18.8%) |
| 25 to 34 Year Olds | 2,823 (84.0%) | 539 (16.0%) |
| 35 Years and over | 1,991 (81.4%) | 454 (18.6%) |
| Total | 37,727 (84.0%) | 7,186 (16.0%) |
Educational Attainment by Field of Study in Springfield
Business (6,376 | 18.1%), education (5,016 | 14.2%), science & technology (3,623 | 10.3%), social sciences (2,606 | 7.4%), and liberal arts & history (2,337 | 6.6%) are the most common fields of study among 35,260 individuals in Springfield who have obtained a bachelor's degree or higher.
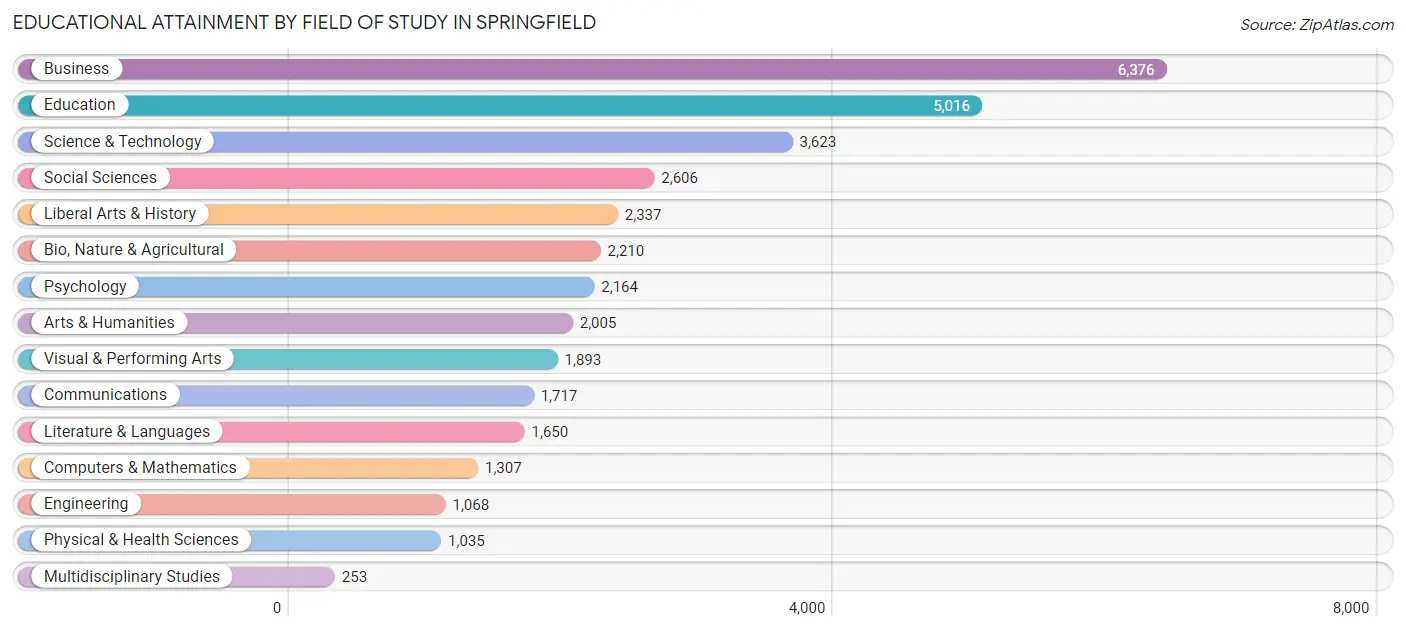
| Field of Study | # Graduates | % Graduates |
| Computers & Mathematics | 1,307 | 3.7% |
| Bio, Nature & Agricultural | 2,210 | 6.3% |
| Physical & Health Sciences | 1,035 | 2.9% |
| Psychology | 2,164 | 6.1% |
| Social Sciences | 2,606 | 7.4% |
| Engineering | 1,068 | 3.0% |
| Multidisciplinary Studies | 253 | 0.7% |
| Science & Technology | 3,623 | 10.3% |
| Business | 6,376 | 18.1% |
| Education | 5,016 | 14.2% |
| Literature & Languages | 1,650 | 4.7% |
| Liberal Arts & History | 2,337 | 6.6% |
| Visual & Performing Arts | 1,893 | 5.4% |
| Communications | 1,717 | 4.9% |
| Arts & Humanities | 2,005 | 5.7% |
| Total | 35,260 | 100.0% |
Transportation & Commute in Springfield
Vehicle Availability by Sex in Springfield
The most prevalent vehicle ownership categories in Springfield are males with 2 vehicles (17,705, accounting for 43.9%) and females with 2 vehicles (16,178, making up 47.0%).
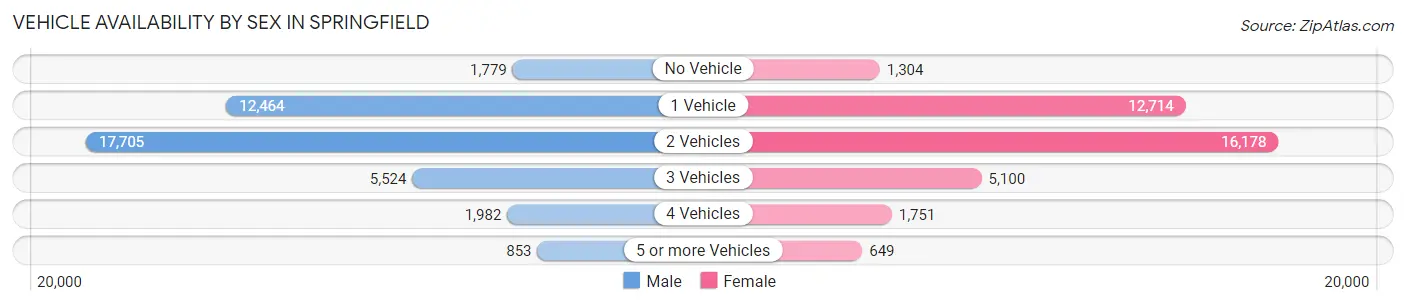
| Vehicles Available | Male | Female |
| No Vehicle | 1,779 (4.4%) | 1,304 (3.5%) |
| 1 Vehicle | 12,464 (30.9%) | 12,714 (33.7%) |
| 2 Vehicles | 17,705 (43.9%) | 16,178 (42.9%) |
| 3 Vehicles | 5,524 (13.7%) | 5,100 (13.5%) |
| 4 Vehicles | 1,982 (4.9%) | 1,751 (4.6%) |
| 5 or more Vehicles | 853 (2.1%) | 649 (1.7%) |
| Total | 40,307 (100.0%) | 37,696 (100.0%) |
Commute Time in Springfield
The most frequently occuring commute durations in Springfield are 10 to 14 minutes (16,687 commuters, 22.7%), 15 to 19 minutes (16,514 commuters, 22.5%), and 20 to 24 minutes (14,103 commuters, 19.2%).
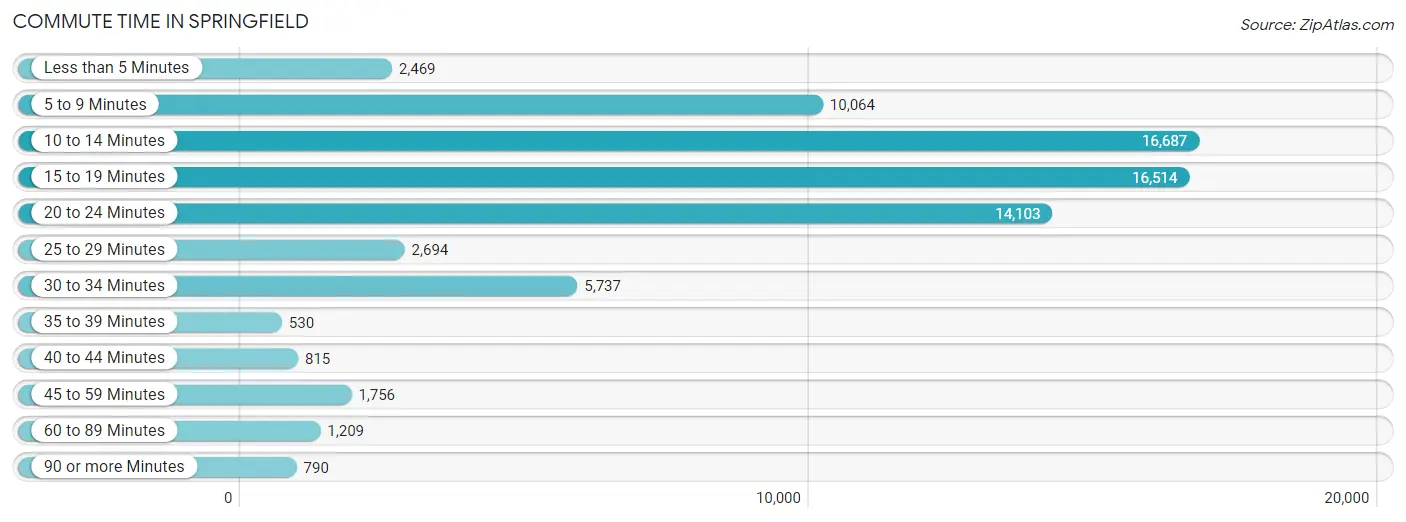
| Commute Time | # Commuters | % Commuters |
| Less than 5 Minutes | 2,469 | 3.4% |
| 5 to 9 Minutes | 10,064 | 13.7% |
| 10 to 14 Minutes | 16,687 | 22.7% |
| 15 to 19 Minutes | 16,514 | 22.5% |
| 20 to 24 Minutes | 14,103 | 19.2% |
| 25 to 29 Minutes | 2,694 | 3.7% |
| 30 to 34 Minutes | 5,737 | 7.8% |
| 35 to 39 Minutes | 530 | 0.7% |
| 40 to 44 Minutes | 815 | 1.1% |
| 45 to 59 Minutes | 1,756 | 2.4% |
| 60 to 89 Minutes | 1,209 | 1.7% |
| 90 or more Minutes | 790 | 1.1% |
Commute Time by Sex in Springfield
The most common commute times in Springfield are 10 to 14 minutes (8,686 commuters, 22.8%) for males and 10 to 14 minutes (8,001 commuters, 22.7%) for females.
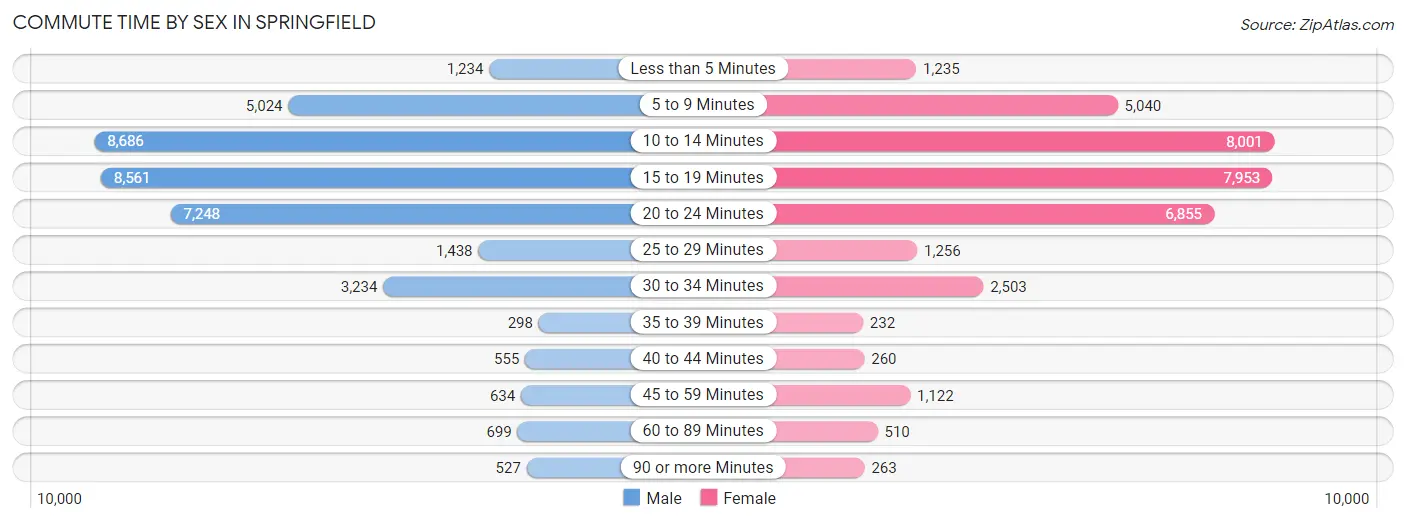
| Commute Time | Male | Female |
| Less than 5 Minutes | 1,234 (3.2%) | 1,235 (3.5%) |
| 5 to 9 Minutes | 5,024 (13.2%) | 5,040 (14.3%) |
| 10 to 14 Minutes | 8,686 (22.8%) | 8,001 (22.7%) |
| 15 to 19 Minutes | 8,561 (22.5%) | 7,953 (22.6%) |
| 20 to 24 Minutes | 7,248 (19.0%) | 6,855 (19.5%) |
| 25 to 29 Minutes | 1,438 (3.8%) | 1,256 (3.6%) |
| 30 to 34 Minutes | 3,234 (8.5%) | 2,503 (7.1%) |
| 35 to 39 Minutes | 298 (0.8%) | 232 (0.7%) |
| 40 to 44 Minutes | 555 (1.5%) | 260 (0.7%) |
| 45 to 59 Minutes | 634 (1.7%) | 1,122 (3.2%) |
| 60 to 89 Minutes | 699 (1.8%) | 510 (1.5%) |
| 90 or more Minutes | 527 (1.4%) | 263 (0.7%) |
Time of Departure to Work by Sex in Springfield
The most frequent times of departure to work in Springfield are 7:00 AM to 7:29 AM (5,357, 14.1%) for males and 7:30 AM to 7:59 AM (6,068, 17.2%) for females.
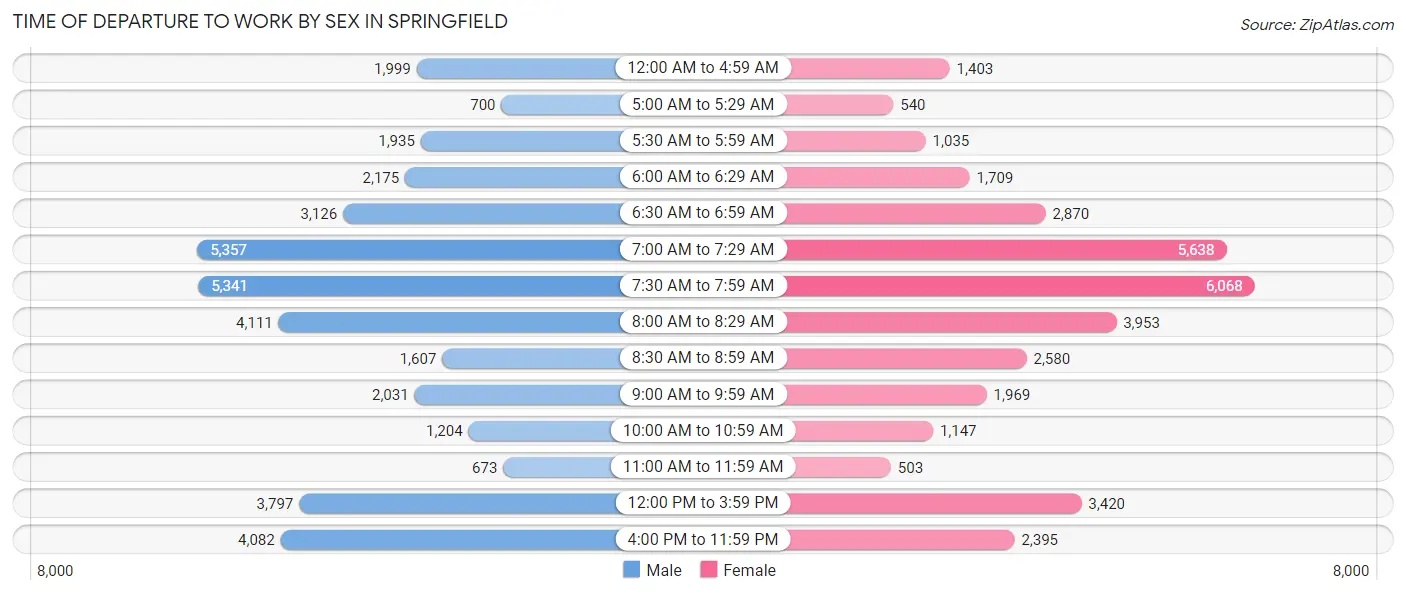
| Time of Departure | Male | Female |
| 12:00 AM to 4:59 AM | 1,999 (5.2%) | 1,403 (4.0%) |
| 5:00 AM to 5:29 AM | 700 (1.8%) | 540 (1.5%) |
| 5:30 AM to 5:59 AM | 1,935 (5.1%) | 1,035 (2.9%) |
| 6:00 AM to 6:29 AM | 2,175 (5.7%) | 1,709 (4.9%) |
| 6:30 AM to 6:59 AM | 3,126 (8.2%) | 2,870 (8.2%) |
| 7:00 AM to 7:29 AM | 5,357 (14.1%) | 5,638 (16.0%) |
| 7:30 AM to 7:59 AM | 5,341 (14.0%) | 6,068 (17.2%) |
| 8:00 AM to 8:29 AM | 4,111 (10.8%) | 3,953 (11.2%) |
| 8:30 AM to 8:59 AM | 1,607 (4.2%) | 2,580 (7.3%) |
| 9:00 AM to 9:59 AM | 2,031 (5.3%) | 1,969 (5.6%) |
| 10:00 AM to 10:59 AM | 1,204 (3.2%) | 1,147 (3.3%) |
| 11:00 AM to 11:59 AM | 673 (1.8%) | 503 (1.4%) |
| 12:00 PM to 3:59 PM | 3,797 (10.0%) | 3,420 (9.7%) |
| 4:00 PM to 11:59 PM | 4,082 (10.7%) | 2,395 (6.8%) |
| Total | 38,138 (100.0%) | 35,230 (100.0%) |
Housing Occupancy in Springfield
Occupancy by Ownership in Springfield
Of the total 79,070 dwellings in Springfield, owner-occupied units account for 33,467 (42.3%), while renter-occupied units make up 45,603 (57.7%).
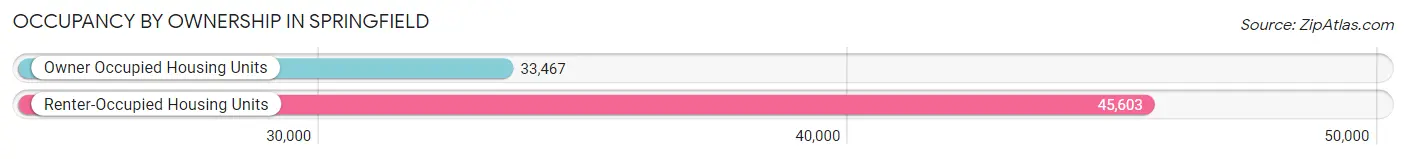
| Occupancy | # Housing Units | % Housing Units |
| Owner Occupied Housing Units | 33,467 | 42.3% |
| Renter-Occupied Housing Units | 45,603 | 57.7% |
| Total Occupied Housing Units | 79,070 | 100.0% |
Occupancy by Household Size in Springfield
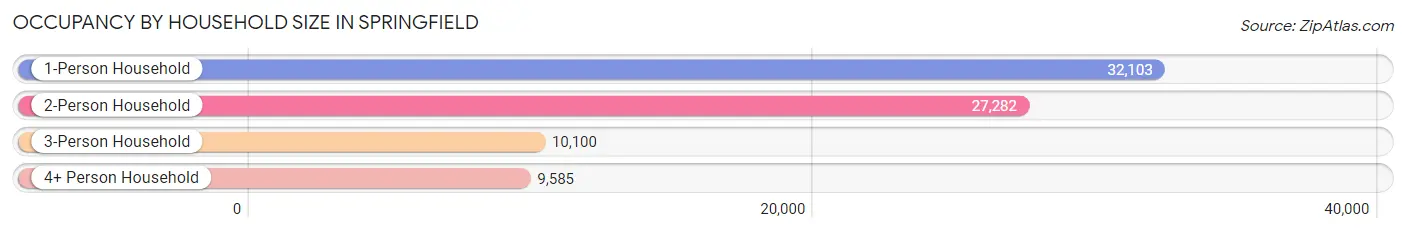
| Household Size | # Housing Units | % Housing Units |
| 1-Person Household | 32,103 | 40.6% |
| 2-Person Household | 27,282 | 34.5% |
| 3-Person Household | 10,100 | 12.8% |
| 4+ Person Household | 9,585 | 12.1% |
| Total Housing Units | 79,070 | 100.0% |
Occupancy by Ownership by Household Size in Springfield
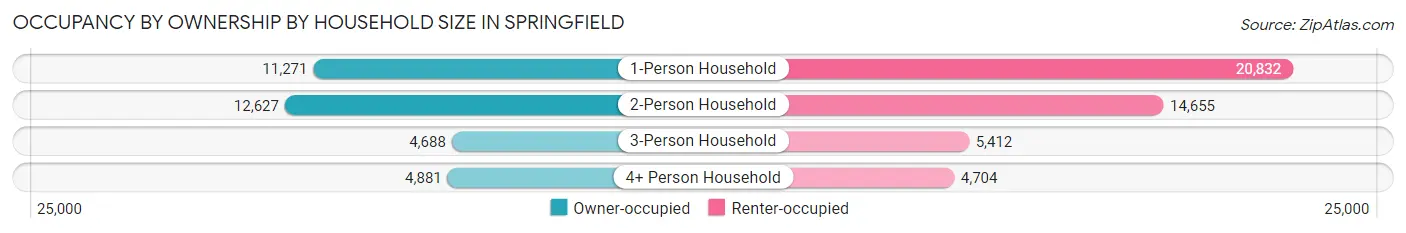
| Household Size | Owner-occupied | Renter-occupied |
| 1-Person Household | 11,271 (35.1%) | 20,832 (64.9%) |
| 2-Person Household | 12,627 (46.3%) | 14,655 (53.7%) |
| 3-Person Household | 4,688 (46.4%) | 5,412 (53.6%) |
| 4+ Person Household | 4,881 (50.9%) | 4,704 (49.1%) |
| Total Housing Units | 33,467 (42.3%) | 45,603 (57.7%) |
Occupancy by Educational Attainment in Springfield
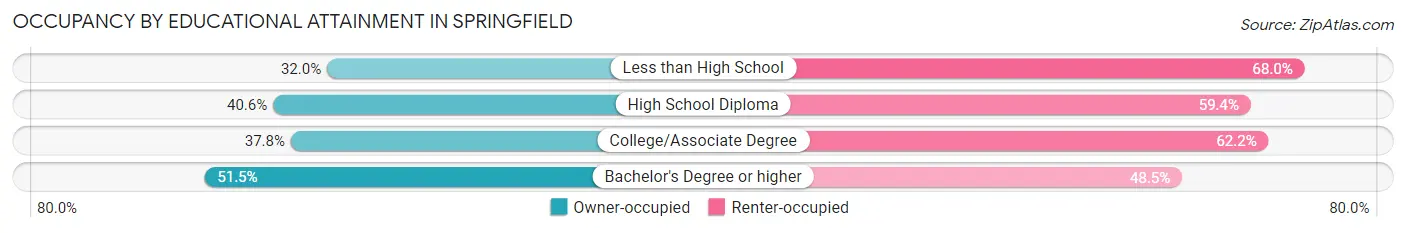
| Household Size | Owner-occupied | Renter-occupied |
| Less than High School | 1,706 (32.0%) | 3,619 (68.0%) |
| High School Diploma | 7,968 (40.6%) | 11,664 (59.4%) |
| College/Associate Degree | 11,208 (37.8%) | 18,460 (62.2%) |
| Bachelor's Degree or higher | 12,585 (51.5%) | 11,860 (48.5%) |
Occupancy by Age of Householder in Springfield
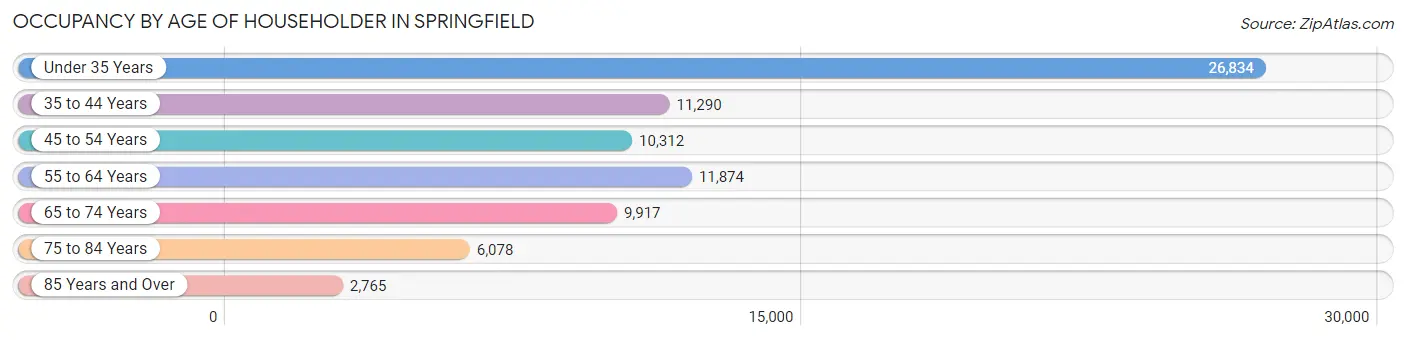
| Age Bracket | # Households | % Households |
| Under 35 Years | 26,834 | 33.9% |
| 35 to 44 Years | 11,290 | 14.3% |
| 45 to 54 Years | 10,312 | 13.0% |
| 55 to 64 Years | 11,874 | 15.0% |
| 65 to 74 Years | 9,917 | 12.5% |
| 75 to 84 Years | 6,078 | 7.7% |
| 85 Years and Over | 2,765 | 3.5% |
| Total | 79,070 | 100.0% |
Housing Finances in Springfield
Median Income by Occupancy in Springfield
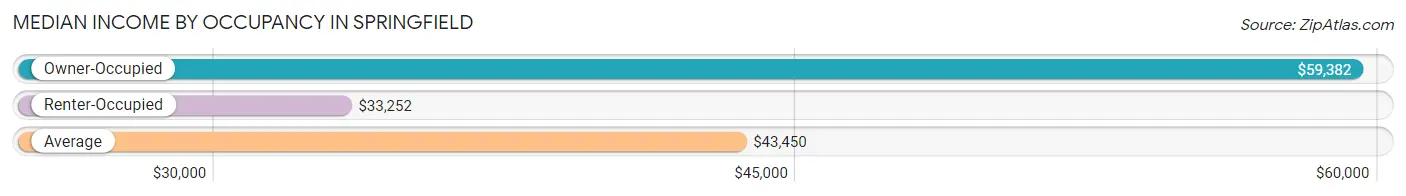
| Occupancy Type | # Households | Median Income |
| Owner-Occupied | 33,467 (42.3%) | $59,382 |
| Renter-Occupied | 45,603 (57.7%) | $33,252 |
| Average | 79,070 (100.0%) | $43,450 |
Occupancy by Householder Income Bracket in Springfield
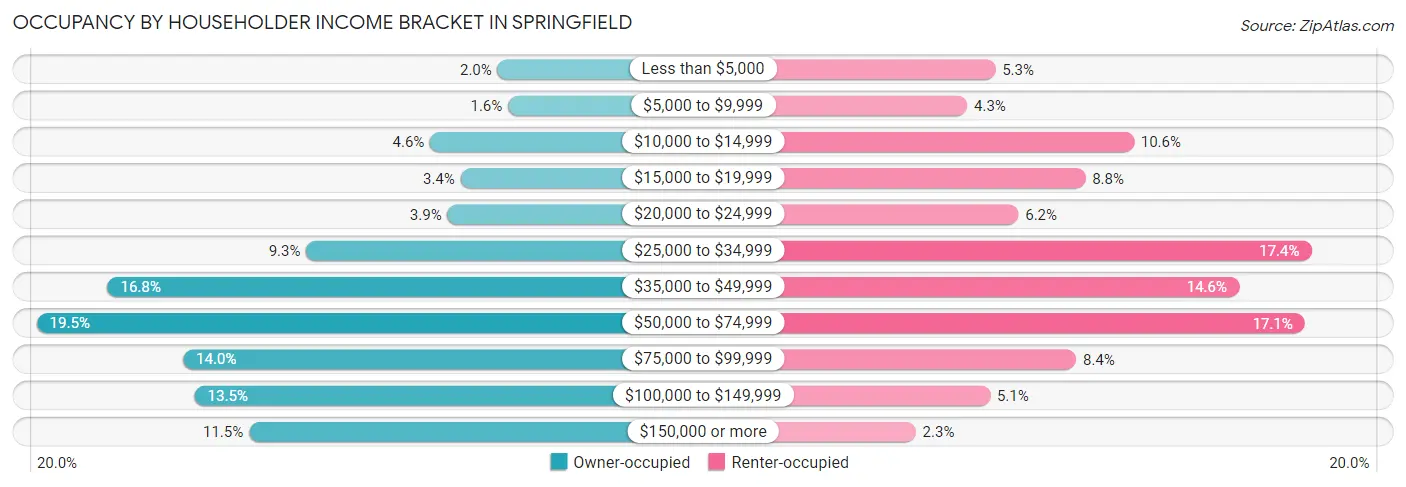
| Income Bracket | Owner-occupied | Renter-occupied |
| Less than $5,000 | 664 (2.0%) | 2,424 (5.3%) |
| $5,000 to $9,999 | 530 (1.6%) | 1,939 (4.3%) |
| $10,000 to $14,999 | 1,524 (4.5%) | 4,833 (10.6%) |
| $15,000 to $19,999 | 1,135 (3.4%) | 3,989 (8.7%) |
| $20,000 to $24,999 | 1,303 (3.9%) | 2,828 (6.2%) |
| $25,000 to $34,999 | 3,103 (9.3%) | 7,916 (17.4%) |
| $35,000 to $49,999 | 5,636 (16.8%) | 6,660 (14.6%) |
| $50,000 to $74,999 | 6,540 (19.5%) | 7,803 (17.1%) |
| $75,000 to $99,999 | 4,673 (14.0%) | 3,830 (8.4%) |
| $100,000 to $149,999 | 4,526 (13.5%) | 2,337 (5.1%) |
| $150,000 or more | 3,833 (11.5%) | 1,044 (2.3%) |
| Total | 33,467 (100.0%) | 45,603 (100.0%) |
Monthly Housing Cost Tiers in Springfield
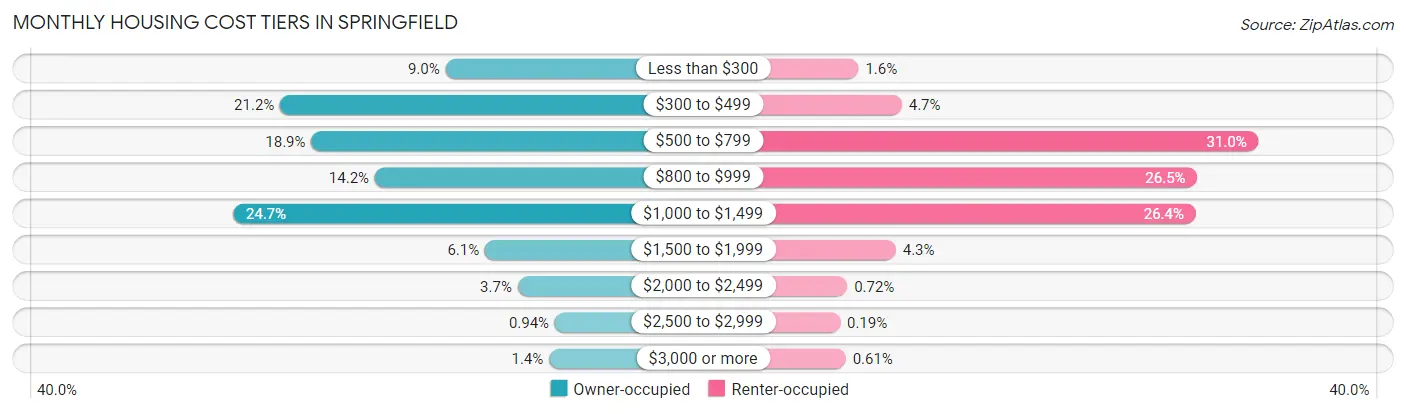
| Monthly Cost | Owner-occupied | Renter-occupied |
| Less than $300 | 3,013 (9.0%) | 708 (1.5%) |
| $300 to $499 | 7,087 (21.2%) | 2,161 (4.7%) |
| $500 to $799 | 6,317 (18.9%) | 14,144 (31.0%) |
| $800 to $999 | 4,751 (14.2%) | 12,089 (26.5%) |
| $1,000 to $1,499 | 8,254 (24.7%) | 12,034 (26.4%) |
| $1,500 to $1,999 | 2,038 (6.1%) | 1,962 (4.3%) |
| $2,000 to $2,499 | 1,233 (3.7%) | 328 (0.7%) |
| $2,500 to $2,999 | 316 (0.9%) | 86 (0.2%) |
| $3,000 or more | 458 (1.4%) | 277 (0.6%) |
| Total | 33,467 (100.0%) | 45,603 (100.0%) |
Physical Housing Characteristics in Springfield
Housing Structures in Springfield
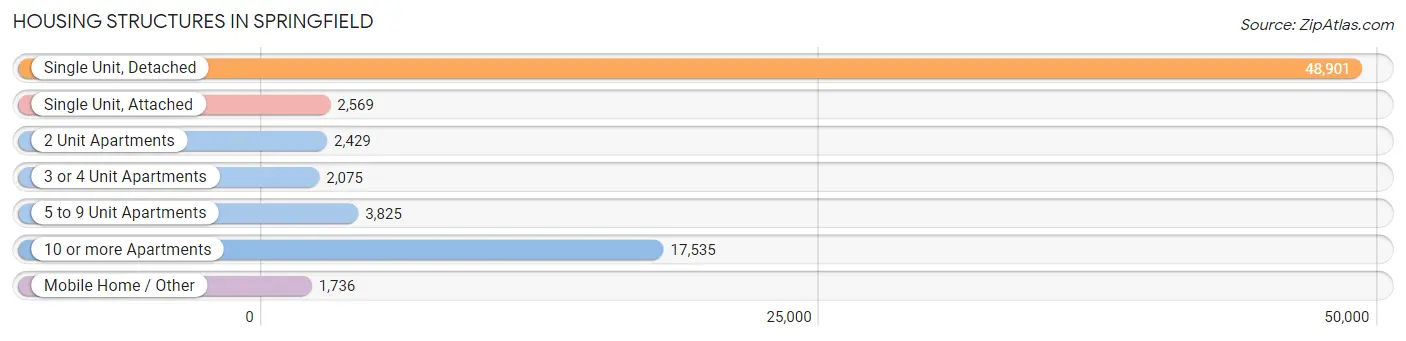
| Structure Type | # Housing Units | % Housing Units |
| Single Unit, Detached | 48,901 | 61.9% |
| Single Unit, Attached | 2,569 | 3.3% |
| 2 Unit Apartments | 2,429 | 3.1% |
| 3 or 4 Unit Apartments | 2,075 | 2.6% |
| 5 to 9 Unit Apartments | 3,825 | 4.8% |
| 10 or more Apartments | 17,535 | 22.2% |
| Mobile Home / Other | 1,736 | 2.2% |
| Total | 79,070 | 100.0% |
Housing Structures by Occupancy in Springfield
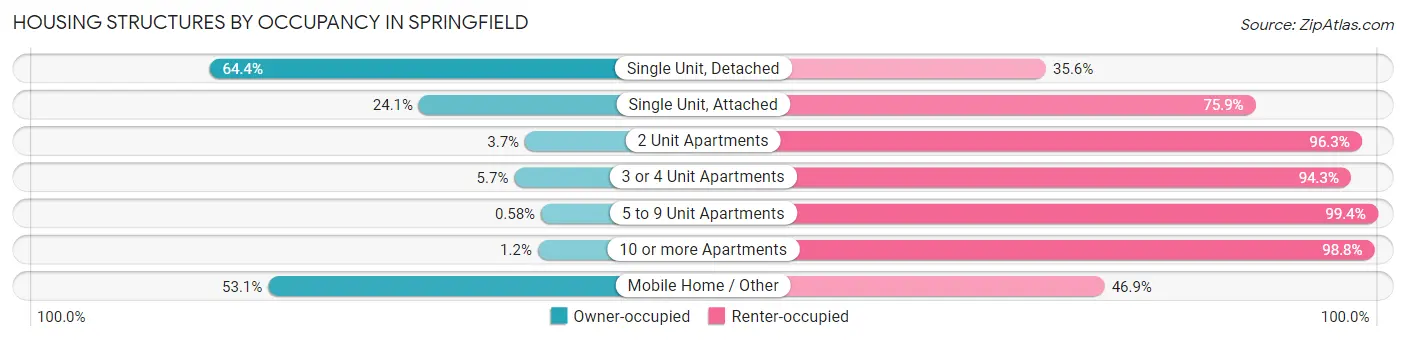
| Structure Type | Owner-occupied | Renter-occupied |
| Single Unit, Detached | 31,485 (64.4%) | 17,416 (35.6%) |
| Single Unit, Attached | 619 (24.1%) | 1,950 (75.9%) |
| 2 Unit Apartments | 89 (3.7%) | 2,340 (96.3%) |
| 3 or 4 Unit Apartments | 119 (5.7%) | 1,956 (94.3%) |
| 5 to 9 Unit Apartments | 22 (0.6%) | 3,803 (99.4%) |
| 10 or more Apartments | 211 (1.2%) | 17,324 (98.8%) |
| Mobile Home / Other | 922 (53.1%) | 814 (46.9%) |
| Total | 33,467 (42.3%) | 45,603 (57.7%) |
Housing Structures by Number of Rooms in Springfield
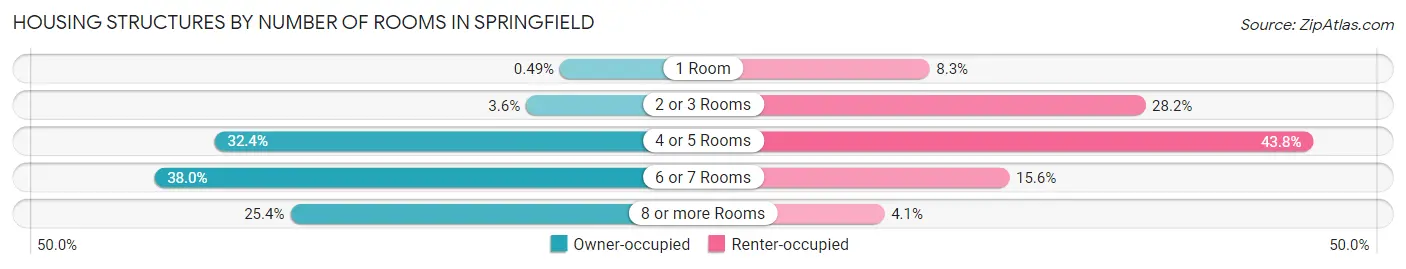
| Number of Rooms | Owner-occupied | Renter-occupied |
| 1 Room | 165 (0.5%) | 3,770 (8.3%) |
| 2 or 3 Rooms | 1,215 (3.6%) | 12,874 (28.2%) |
| 4 or 5 Rooms | 10,853 (32.4%) | 19,960 (43.8%) |
| 6 or 7 Rooms | 12,722 (38.0%) | 7,131 (15.6%) |
| 8 or more Rooms | 8,512 (25.4%) | 1,868 (4.1%) |
| Total | 33,467 (100.0%) | 45,603 (100.0%) |
Housing Structure by Heating Type in Springfield
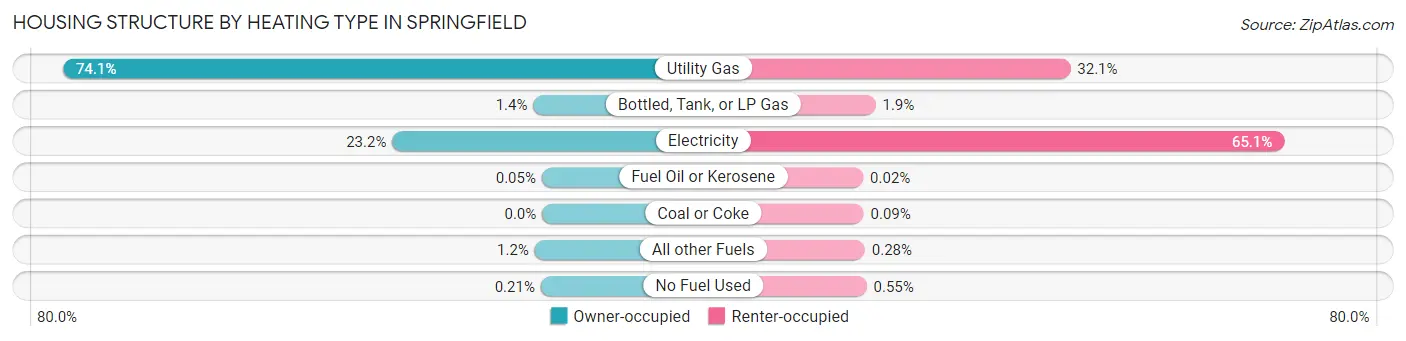
| Heating Type | Owner-occupied | Renter-occupied |
| Utility Gas | 24,786 (74.1%) | 14,616 (32.1%) |
| Bottled, Tank, or LP Gas | 454 (1.4%) | 882 (1.9%) |
| Electricity | 7,755 (23.2%) | 29,680 (65.1%) |
| Fuel Oil or Kerosene | 17 (0.1%) | 9 (0.0%) |
| Coal or Coke | 0 (0.0%) | 39 (0.1%) |
| All other Fuels | 384 (1.1%) | 127 (0.3%) |
| No Fuel Used | 71 (0.2%) | 250 (0.5%) |
| Total | 33,467 (100.0%) | 45,603 (100.0%) |
Household Vehicle Usage in Springfield
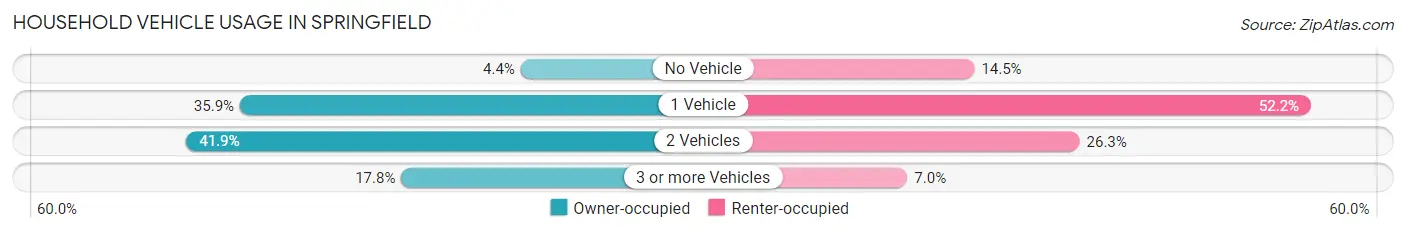
| Vehicles per Household | Owner-occupied | Renter-occupied |
| No Vehicle | 1,482 (4.4%) | 6,616 (14.5%) |
| 1 Vehicle | 12,009 (35.9%) | 23,803 (52.2%) |
| 2 Vehicles | 14,015 (41.9%) | 11,991 (26.3%) |
| 3 or more Vehicles | 5,961 (17.8%) | 3,193 (7.0%) |
| Total | 33,467 (100.0%) | 45,603 (100.0%) |
Real Estate & Mortgages in Springfield
Real Estate and Mortgage Overview in Springfield
| Characteristic | Without Mortgage | With Mortgage |
| Housing Units | 13,811 | 19,656 |
| Median Property Value | $139,700 | $150,900 |
| Median Household Income | $44,949 | $2,487 |
| Monthly Housing Costs | $418 | $458 |
| Real Estate Taxes | $1,213 | $518 |
Property Value by Mortgage Status in Springfield
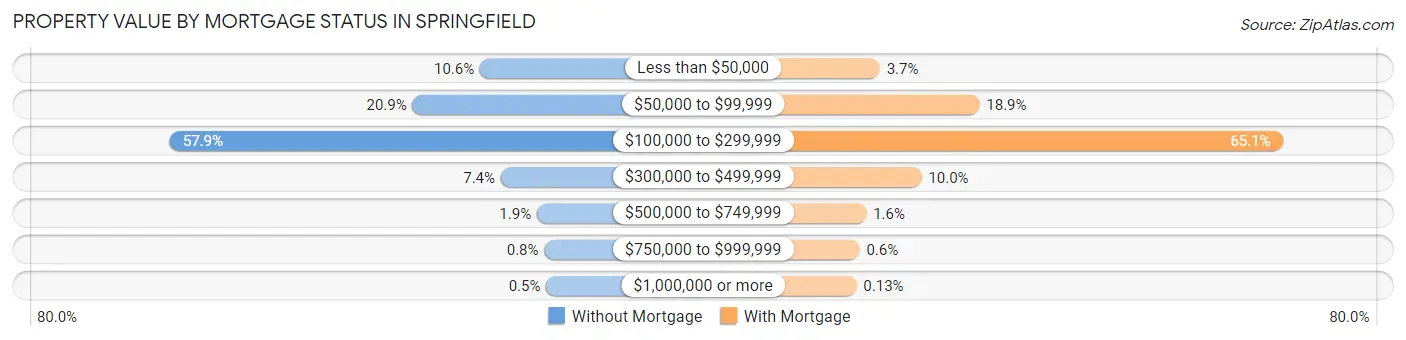
| Property Value | Without Mortgage | With Mortgage |
| Less than $50,000 | 1,464 (10.6%) | 725 (3.7%) |
| $50,000 to $99,999 | 2,884 (20.9%) | 3,710 (18.9%) |
| $100,000 to $299,999 | 7,993 (57.9%) | 12,786 (65.0%) |
| $300,000 to $499,999 | 1,026 (7.4%) | 1,974 (10.0%) |
| $500,000 to $749,999 | 265 (1.9%) | 318 (1.6%) |
| $750,000 to $999,999 | 110 (0.8%) | 117 (0.6%) |
| $1,000,000 or more | 69 (0.5%) | 26 (0.1%) |
| Total | 13,811 (100.0%) | 19,656 (100.0%) |
Household Income by Mortgage Status in Springfield
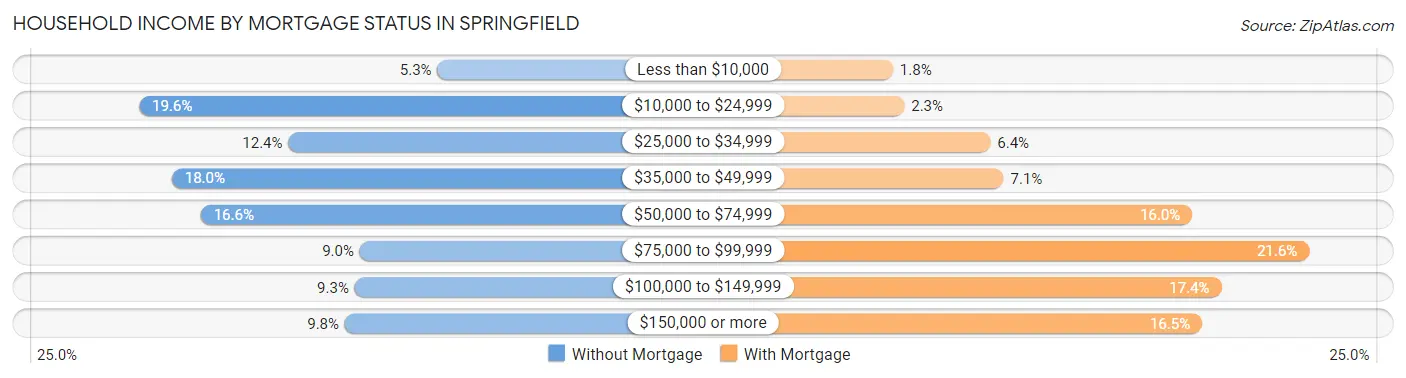
| Household Income | Without Mortgage | With Mortgage |
| Less than $10,000 | 738 (5.3%) | 350 (1.8%) |
| $10,000 to $24,999 | 2,700 (19.6%) | 456 (2.3%) |
| $25,000 to $34,999 | 1,718 (12.4%) | 1,262 (6.4%) |
| $35,000 to $49,999 | 2,485 (18.0%) | 1,385 (7.0%) |
| $50,000 to $74,999 | 2,294 (16.6%) | 3,151 (16.0%) |
| $75,000 to $99,999 | 1,248 (9.0%) | 4,246 (21.6%) |
| $100,000 to $149,999 | 1,282 (9.3%) | 3,425 (17.4%) |
| $150,000 or more | 1,346 (9.8%) | 3,244 (16.5%) |
| Total | 13,811 (100.0%) | 19,656 (100.0%) |
Property Value to Household Income Ratio in Springfield
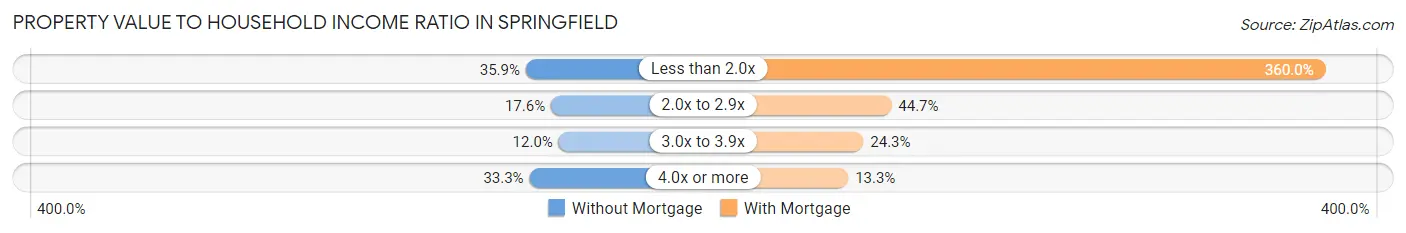
| Value-to-Income Ratio | Without Mortgage | With Mortgage |
| Less than 2.0x | 4,957 (35.9%) | 70,767 (360.0%) |
| 2.0x to 2.9x | 2,433 (17.6%) | 8,777 (44.7%) |
| 3.0x to 3.9x | 1,661 (12.0%) | 4,777 (24.3%) |
| 4.0x or more | 4,594 (33.3%) | 2,612 (13.3%) |
| Total | 13,811 (100.0%) | 19,656 (100.0%) |
Real Estate Taxes by Mortgage Status in Springfield
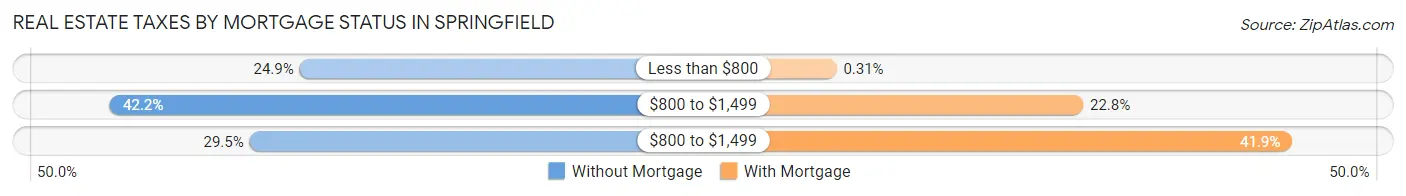
| Property Taxes | Without Mortgage | With Mortgage |
| Less than $800 | 3,437 (24.9%) | 60 (0.3%) |
| $800 to $1,499 | 5,828 (42.2%) | 4,488 (22.8%) |
| $800 to $1,499 | 4,069 (29.5%) | 8,244 (41.9%) |
| Total | 13,811 (100.0%) | 19,656 (100.0%) |
Health & Disability in Springfield
Health Insurance Coverage by Age in Springfield
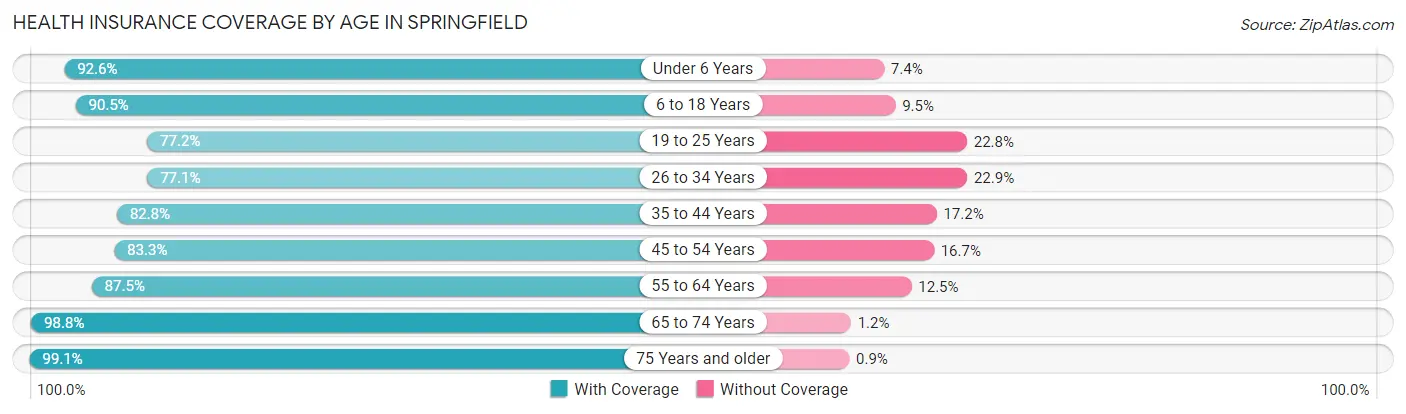
| Age Bracket | With Coverage | Without Coverage |
| Under 6 Years | 9,440 (92.6%) | 753 (7.4%) |
| 6 to 18 Years | 20,942 (90.5%) | 2,197 (9.5%) |
| 19 to 25 Years | 23,897 (77.2%) | 7,073 (22.8%) |
| 26 to 34 Years | 17,782 (77.1%) | 5,276 (22.9%) |
| 35 to 44 Years | 15,320 (82.8%) | 3,181 (17.2%) |
| 45 to 54 Years | 13,914 (83.3%) | 2,786 (16.7%) |
| 55 to 64 Years | 15,417 (87.5%) | 2,205 (12.5%) |
| 65 to 74 Years | 13,877 (98.8%) | 169 (1.2%) |
| 75 Years and older | 11,401 (99.1%) | 104 (0.9%) |
| Total | 141,990 (85.7%) | 23,744 (14.3%) |
Health Insurance Coverage by Citizenship Status in Springfield
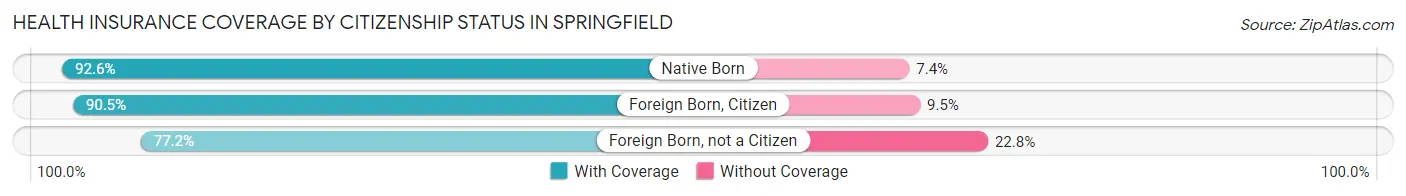
| Citizenship Status | With Coverage | Without Coverage |
| Native Born | 9,440 (92.6%) | 753 (7.4%) |
| Foreign Born, Citizen | 20,942 (90.5%) | 2,197 (9.5%) |
| Foreign Born, not a Citizen | 23,897 (77.2%) | 7,073 (22.8%) |
Health Insurance Coverage by Household Income in Springfield
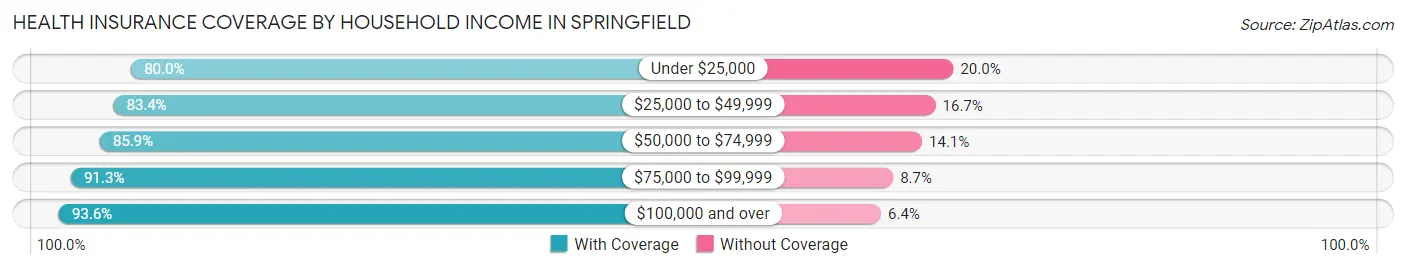
| Household Income | With Coverage | Without Coverage |
| Under $25,000 | 24,503 (80.0%) | 6,123 (20.0%) |
| $25,000 to $49,999 | 36,212 (83.4%) | 7,236 (16.7%) |
| $50,000 to $74,999 | 27,090 (85.9%) | 4,451 (14.1%) |
| $75,000 to $99,999 | 18,346 (91.3%) | 1,749 (8.7%) |
| $100,000 and over | 30,409 (93.6%) | 2,090 (6.4%) |
Public vs Private Health Insurance Coverage by Age in Springfield
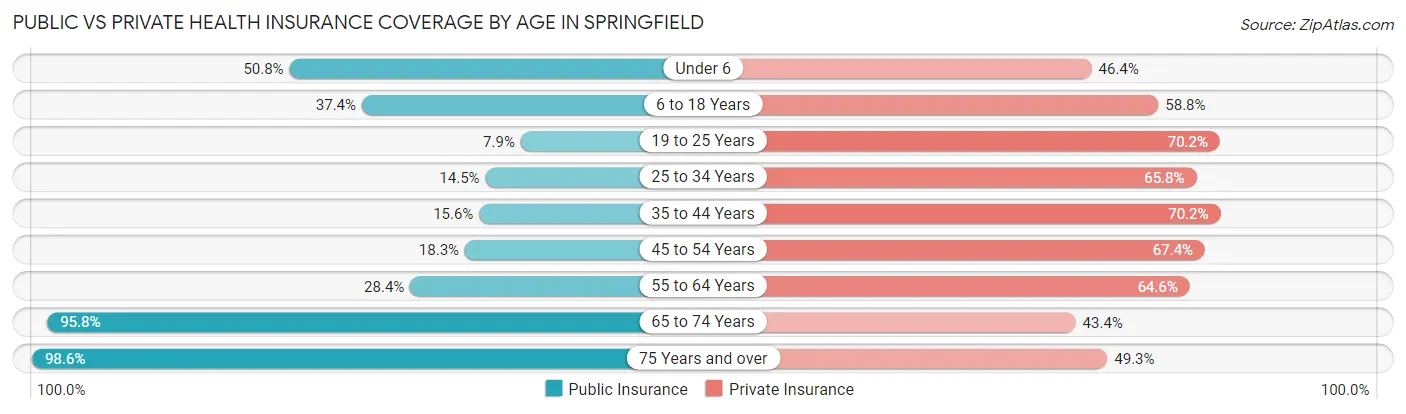
| Age Bracket | Public Insurance | Private Insurance |
| Under 6 | 5,182 (50.8%) | 4,727 (46.4%) |
| 6 to 18 Years | 8,653 (37.4%) | 13,596 (58.8%) |
| 19 to 25 Years | 2,451 (7.9%) | 21,724 (70.2%) |
| 25 to 34 Years | 3,337 (14.5%) | 15,173 (65.8%) |
| 35 to 44 Years | 2,889 (15.6%) | 12,996 (70.2%) |
| 45 to 54 Years | 3,051 (18.3%) | 11,254 (67.4%) |
| 55 to 64 Years | 5,011 (28.4%) | 11,380 (64.6%) |
| 65 to 74 Years | 13,455 (95.8%) | 6,097 (43.4%) |
| 75 Years and over | 11,346 (98.6%) | 5,671 (49.3%) |
| Total | 55,375 (33.4%) | 102,618 (61.9%) |
Disability Status by Sex by Age in Springfield
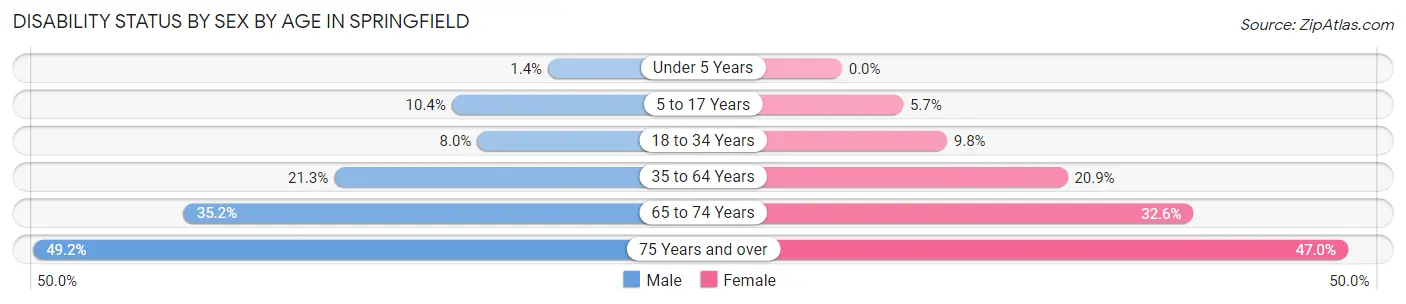
| Age Bracket | Male | Female |
| Under 5 Years | 68 (1.4%) | 0 (0.0%) |
| 5 to 17 Years | 1,127 (10.4%) | 552 (5.7%) |
| 18 to 34 Years | 2,276 (8.0%) | 2,894 (9.8%) |
| 35 to 64 Years | 5,633 (21.3%) | 5,518 (20.9%) |
| 65 to 74 Years | 2,210 (35.2%) | 2,535 (32.6%) |
| 75 Years and over | 2,041 (49.2%) | 3,455 (47.0%) |
Disability Class by Sex by Age in Springfield
Disability Class: Hearing Difficulty
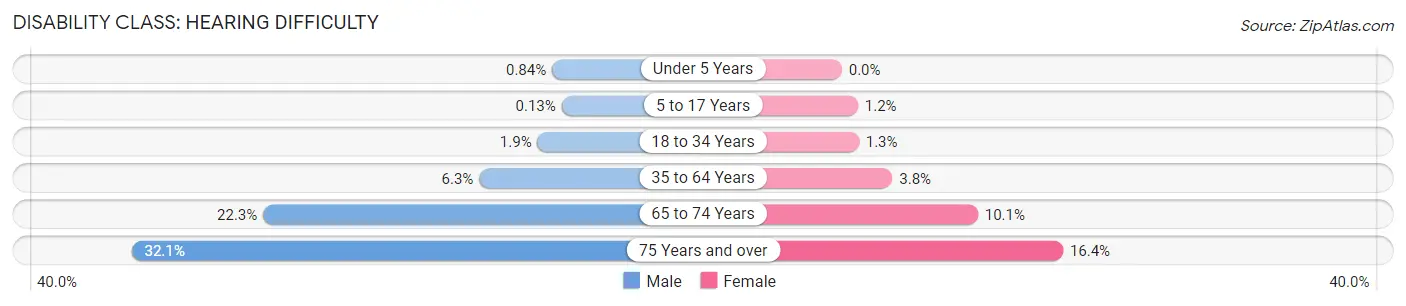
| Age Bracket | Male | Female |
| Under 5 Years | 40 (0.8%) | 0 (0.0%) |
| 5 to 17 Years | 14 (0.1%) | 116 (1.2%) |
| 18 to 34 Years | 547 (1.9%) | 375 (1.3%) |
| 35 to 64 Years | 1,654 (6.2%) | 988 (3.7%) |
| 65 to 74 Years | 1,399 (22.3%) | 785 (10.1%) |
| 75 Years and over | 1,330 (32.1%) | 1,208 (16.4%) |
Disability Class: Vision Difficulty
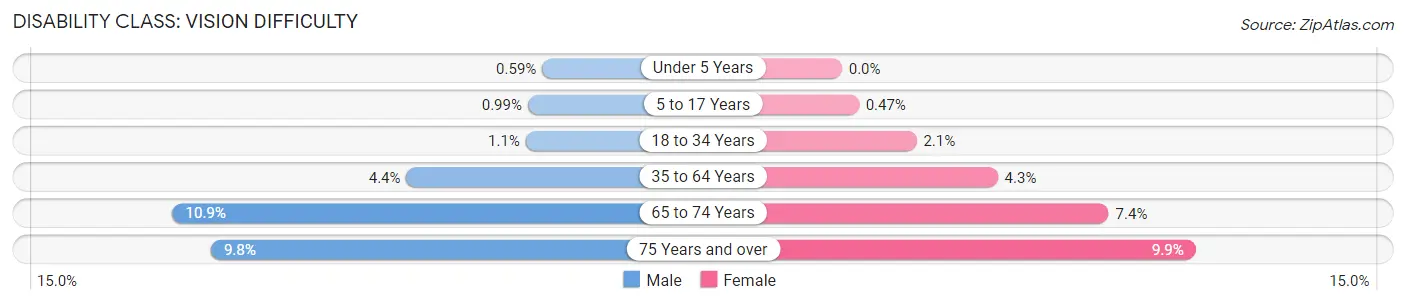
| Age Bracket | Male | Female |
| Under 5 Years | 28 (0.6%) | 0 (0.0%) |
| 5 to 17 Years | 108 (1.0%) | 46 (0.5%) |
| 18 to 34 Years | 298 (1.1%) | 616 (2.1%) |
| 35 to 64 Years | 1,156 (4.4%) | 1,143 (4.3%) |
| 65 to 74 Years | 683 (10.9%) | 577 (7.4%) |
| 75 Years and over | 407 (9.8%) | 725 (9.9%) |
Disability Class: Cognitive Difficulty
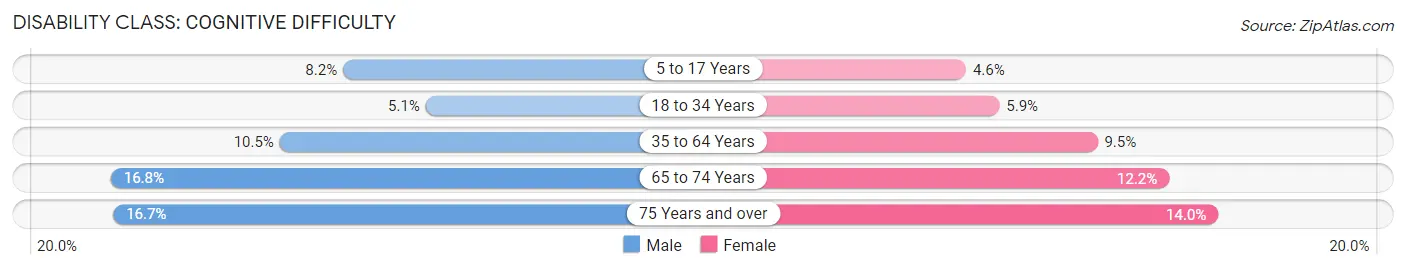
| Age Bracket | Male | Female |
| 5 to 17 Years | 889 (8.2%) | 448 (4.6%) |
| 18 to 34 Years | 1,455 (5.1%) | 1,735 (5.9%) |
| 35 to 64 Years | 2,786 (10.5%) | 2,502 (9.5%) |
| 65 to 74 Years | 1,054 (16.8%) | 944 (12.1%) |
| 75 Years and over | 693 (16.7%) | 1,028 (14.0%) |
Disability Class: Ambulatory Difficulty
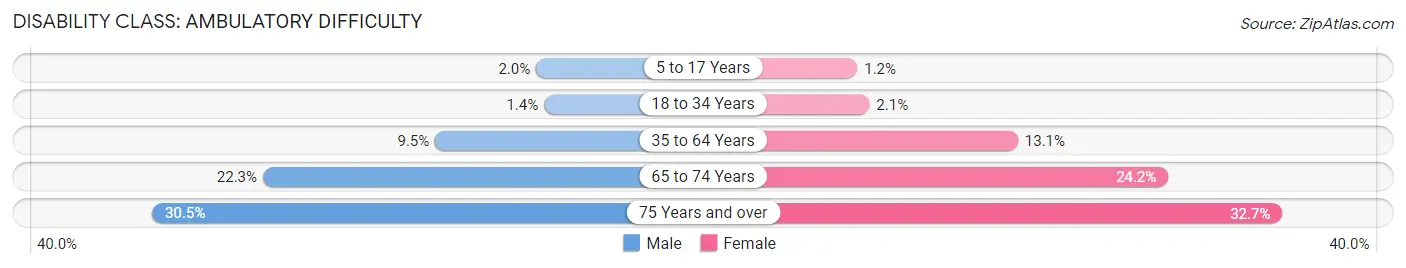
| Age Bracket | Male | Female |
| 5 to 17 Years | 221 (2.0%) | 112 (1.1%) |
| 18 to 34 Years | 406 (1.4%) | 607 (2.1%) |
| 35 to 64 Years | 2,521 (9.5%) | 3,445 (13.1%) |
| 65 to 74 Years | 1,400 (22.3%) | 1,883 (24.2%) |
| 75 Years and over | 1,267 (30.5%) | 2,406 (32.7%) |
Disability Class: Self-Care Difficulty
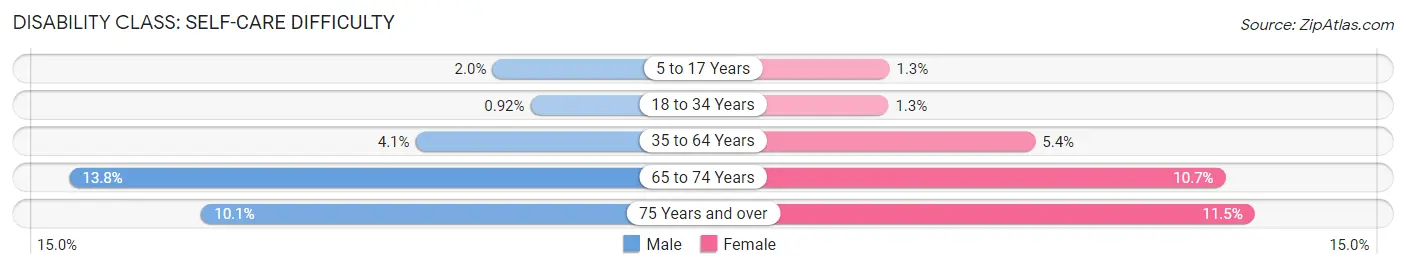
| Age Bracket | Male | Female |
| 5 to 17 Years | 215 (2.0%) | 129 (1.3%) |
| 18 to 34 Years | 261 (0.9%) | 386 (1.3%) |
| 35 to 64 Years | 1,091 (4.1%) | 1,420 (5.4%) |
| 65 to 74 Years | 863 (13.8%) | 830 (10.7%) |
| 75 Years and over | 418 (10.1%) | 845 (11.5%) |
Technology Access in Springfield
Computing Device Access in Springfield
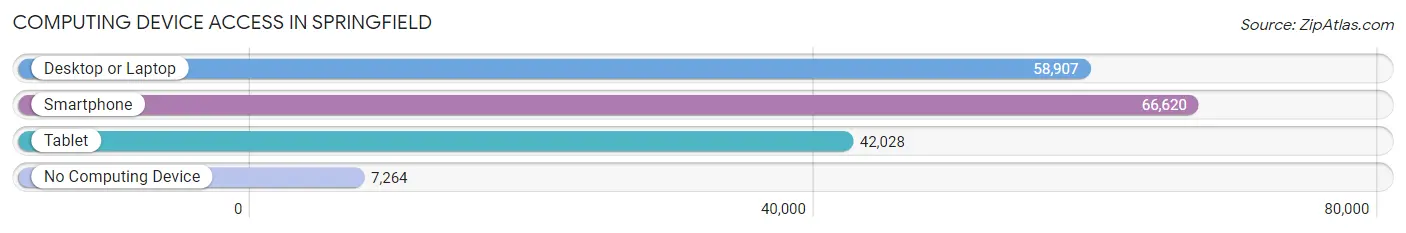
| Device Type | # Households | % Households |
| Desktop or Laptop | 58,907 | 74.5% |
| Smartphone | 66,620 | 84.3% |
| Tablet | 42,028 | 53.1% |
| No Computing Device | 7,264 | 9.2% |
| Total | 79,070 | 100.0% |
Internet Access in Springfield
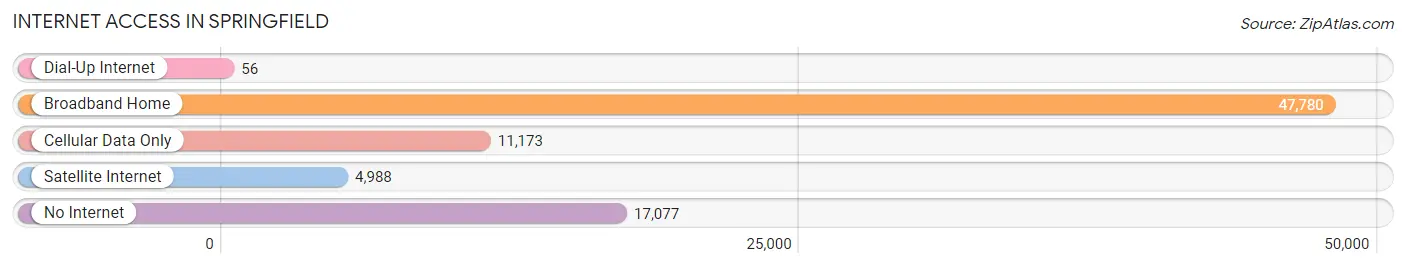
| Internet Type | # Households | % Households |
| Dial-Up Internet | 56 | 0.1% |
| Broadband Home | 47,780 | 60.4% |
| Cellular Data Only | 11,173 | 14.1% |
| Satellite Internet | 4,988 | 6.3% |
| No Internet | 17,077 | 21.6% |
| Total | 79,070 | 100.0% |
Springfield Summary
Springfield, Missouri is a city located in the southwestern corner of the state, in Greene County. It is the third-largest city in Missouri, with a population of 159,498 as of the 2010 census. Springfield is the county seat of Greene County and the principal city of the Springfield metropolitan area, which has a population of 462,369 and includes the counties of Christian, Dallas, Greene, Polk, and Webster.
History
The area that is now Springfield was first settled in 1829 by John Polk Campbell and his family. Campbell was a veteran of the War of 1812 and a member of the Cherokee Nation. He established a trading post and a ferry service on the James River, which was the first permanent settlement in the area. The settlement was named Springfield after the nearby spring.
In 1833, the town was officially incorporated and the first post office was established. The city quickly grew and by the 1850s, it had become a major transportation hub, with the arrival of the railroad. The city was also home to several industries, including a large flour mill and a woolen mill.
During the Civil War, Springfield was a major supply center for the Confederate Army. The city was also the site of the Battle of Wilson's Creek, which was the first major battle of the war in the Trans-Mississippi Theater.
In the late 19th century, Springfield became a major center for the cattle industry. The city was also home to several large manufacturing companies, including the International Harvester Company and the Springfield Armory.
Geography
Springfield is located in the southwestern corner of Missouri, in Greene County. It is situated on the James River, which flows through the city. The city is located at the intersection of Interstate 44 and U.S. Route 65.
The city has a total area of 77.2 square miles, of which 76.9 square miles is land and 0.3 square miles is water. The city is located in the Ozark Mountains and is surrounded by rolling hills and forests.
Economy
Springfield is a major economic center in the region. The city is home to several large companies, including Bass Pro Shops, O'Reilly Auto Parts, and Kraft Foods. The city is also home to several major healthcare providers, including Mercy Hospital and CoxHealth.
The city is also home to several higher education institutions, including Missouri State University, Drury University, and Ozarks Technical Community College.
Demographics
As of the 2010 census, Springfield had a population of 159,498. The racial makeup of the city was 79.2% White, 13.3% African American, 0.7% Native American, 2.2% Asian, 0.1% Pacific Islander, 1.7% from other races, and 2.8% from two or more races. Hispanic or Latino of any race were 5.2% of the population.
The median income for a household in the city was $37,837, and the median income for a family was $45,919. The per capita income for the city was $21,845. About 15.2% of the population was below the poverty line.
Common Questions
What is Per Capita Income in Springfield?
Per Capita income in Springfield is $28,806.
What is the Median Family Income in Springfield?
Median Family Income in Springfield is $61,245.
What is the Median Household income in Springfield?
Median Household Income in Springfield is $43,450.
What is Income or Wage Gap in Springfield?
Income or Wage Gap in Springfield is 17.5%.
Women in Springfield earn 82.5 cents for every dollar earned by a man.
What is Family Income Deficit in Springfield?
Family Income Deficit in Springfield is $9,580.
Families that are below poverty line in Springfield earn $9,580 less on average than the poverty threshold level.
What is Inequality or Gini Index in Springfield?
Inequality or Gini Index in Springfield is 0.48.
What is the Total Population of Springfield?
Total Population of Springfield is 168,873.
What is the Total Male Population of Springfield?
Total Male Population of Springfield is 82,917.
What is the Total Female Population of Springfield?
Total Female Population of Springfield is 85,956.
What is the Ratio of Males per 100 Females in Springfield?
There are 96.46 Males per 100 Females in Springfield.
What is the Ratio of Females per 100 Males in Springfield?
There are 103.67 Females per 100 Males in Springfield.
What is the Median Population Age in Springfield?
Median Population Age in Springfield is 33.3 Years.
What is the Average Family Size in Springfield
Average Family Size in Springfield is 2.7 People.
What is the Average Household Size in Springfield
Average Household Size in Springfield is 2.0 People.
How Large is the Labor Force in Springfield?
There are 85,157 People in the Labor Forcein in Springfield.
What is the Percentage of People in the Labor Force in Springfield?
59.6% of People are in the Labor Force in Springfield.
What is the Unemployment Rate in Springfield?
Unemployment Rate in Springfield is 4.8%.