Florissant, MO Map & Demographics
Florissant Map
Florissant Overview
$31,308
PER CAPITA INCOME
$78,568
AVG FAMILY INCOME
$64,178
AVG HOUSEHOLD INCOME
9.4%
WAGE / INCOME GAP [ % ]
90.6¢/ $1
WAGE / INCOME GAP [ $ ]
$9,808
FAMILY INCOME DEFICIT
0.38
INEQUALITY / GINI INDEX
52,167
TOTAL POPULATION
25,043
MALE POPULATION
27,124
FEMALE POPULATION
92.33
MALES / 100 FEMALES
108.31
FEMALES / 100 MALES
37.1
MEDIAN AGE
3.2
AVG FAMILY SIZE
2.5
AVG HOUSEHOLD SIZE
28,717
LABOR FORCE [ PEOPLE ]
69.3%
PERCENT IN LABOR FORCE
6.4%
UNEMPLOYMENT RATE
Income in Florissant
Income Overview in Florissant
Per Capita Income in Florissant is $31,308, while median incomes of families and households are $78,568 and $64,178 respectively.
| Characteristic | Number | Measure |
| Per Capita Income | 52,167 | $31,308 |
| Median Family Income | 12,890 | $78,568 |
| Mean Family Income | 12,890 | $85,503 |
| Median Household Income | 20,505 | $64,178 |
| Mean Household Income | 20,505 | $76,557 |
| Income Deficit | 12,890 | $9,808 |
| Wage / Income Gap (%) | 52,167 | 9.41% |
| Wage / Income Gap ($) | 52,167 | 90.59¢ per $1 |
| Gini / Inequality Index | 52,167 | 0.38 |
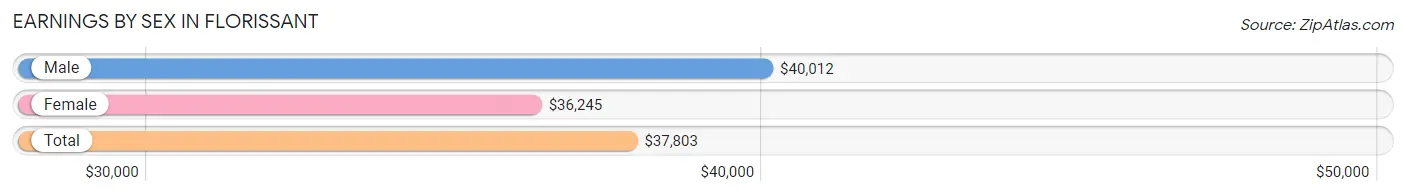
Earnings by Sex in Florissant
Average Earnings in Florissant are $37,803, $40,012 for men and $36,245 for women, a difference of 9.4%.
| Sex | Number | Average Earnings |
| Male | 14,951 (51.1%) | $40,012 |
| Female | 14,283 (48.9%) | $36,245 |
| Total | 29,234 (100.0%) | $37,803 |
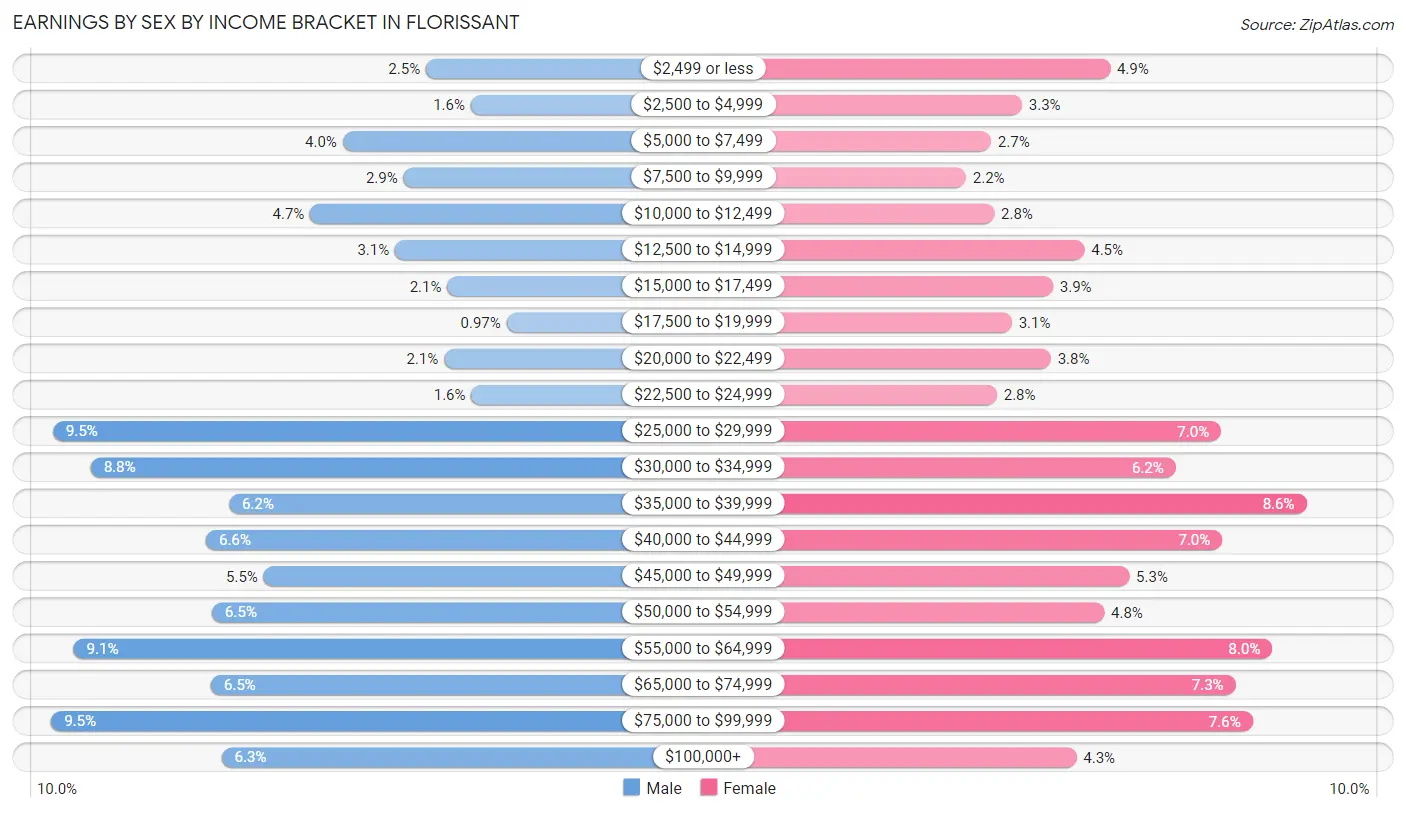
Earnings by Sex by Income Bracket in Florissant
The most common earnings brackets in Florissant are $75,000 to $99,999 for men (1,421 | 9.5%) and $35,000 to $39,999 for women (1,230 | 8.6%).
| Income | Male | Female |
| $2,499 or less | 371 (2.5%) | 704 (4.9%) |
| $2,500 to $4,999 | 245 (1.6%) | 469 (3.3%) |
| $5,000 to $7,499 | 604 (4.0%) | 385 (2.7%) |
| $7,500 to $9,999 | 434 (2.9%) | 318 (2.2%) |
| $10,000 to $12,499 | 695 (4.6%) | 394 (2.8%) |
| $12,500 to $14,999 | 457 (3.1%) | 636 (4.4%) |
| $15,000 to $17,499 | 311 (2.1%) | 552 (3.9%) |
| $17,500 to $19,999 | 145 (1.0%) | 441 (3.1%) |
| $20,000 to $22,499 | 320 (2.1%) | 546 (3.8%) |
| $22,500 to $24,999 | 244 (1.6%) | 401 (2.8%) |
| $25,000 to $29,999 | 1,416 (9.5%) | 1,001 (7.0%) |
| $30,000 to $34,999 | 1,309 (8.8%) | 880 (6.2%) |
| $35,000 to $39,999 | 922 (6.2%) | 1,230 (8.6%) |
| $40,000 to $44,999 | 987 (6.6%) | 1,004 (7.0%) |
| $45,000 to $49,999 | 825 (5.5%) | 755 (5.3%) |
| $50,000 to $54,999 | 970 (6.5%) | 688 (4.8%) |
| $55,000 to $64,999 | 1,357 (9.1%) | 1,139 (8.0%) |
| $65,000 to $74,999 | 974 (6.5%) | 1,040 (7.3%) |
| $75,000 to $99,999 | 1,421 (9.5%) | 1,086 (7.6%) |
| $100,000+ | 944 (6.3%) | 614 (4.3%) |
| Total | 14,951 (100.0%) | 14,283 (100.0%) |
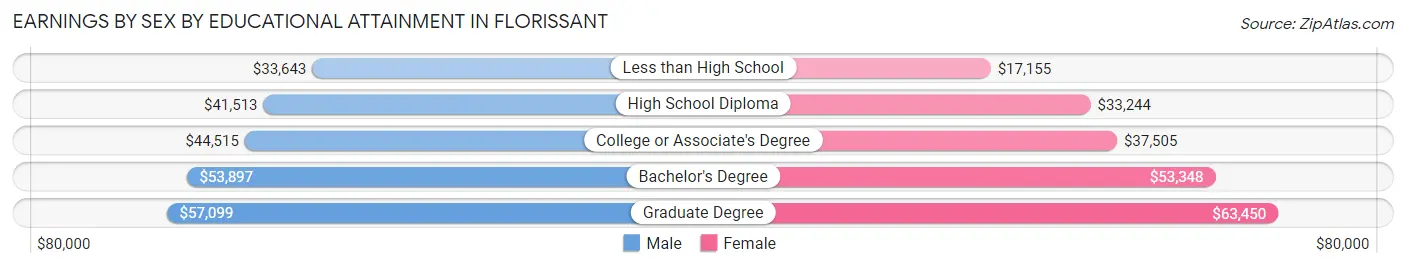
Earnings by Sex by Educational Attainment in Florissant
Average earnings in Florissant are $44,553 for men and $39,607 for women, a difference of 11.1%. Men with an educational attainment of graduate degree enjoy the highest average annual earnings of $57,099, while those with less than high school education earn the least with $33,643. Women with an educational attainment of graduate degree earn the most with the average annual earnings of $63,450, while those with less than high school education have the smallest earnings of $17,155.
| Educational Attainment | Male Income | Female Income |
| Less than High School | $33,643 | $17,155 |
| High School Diploma | $41,513 | $33,244 |
| College or Associate's Degree | $44,515 | $37,505 |
| Bachelor's Degree | $53,897 | $53,348 |
| Graduate Degree | $57,099 | $63,450 |
| Total | $44,553 | $39,607 |
Family Income in Florissant
Family Income Brackets in Florissant
According to the Florissant family income data, there are 2,900 families falling into the $100,000 to $149,999 income range, which is the most common income bracket and makes up 22.5% of all families. Conversely, the $10,000 to $14,999 income bracket is the least frequent group with only 219 families (1.7%) belonging to this category.
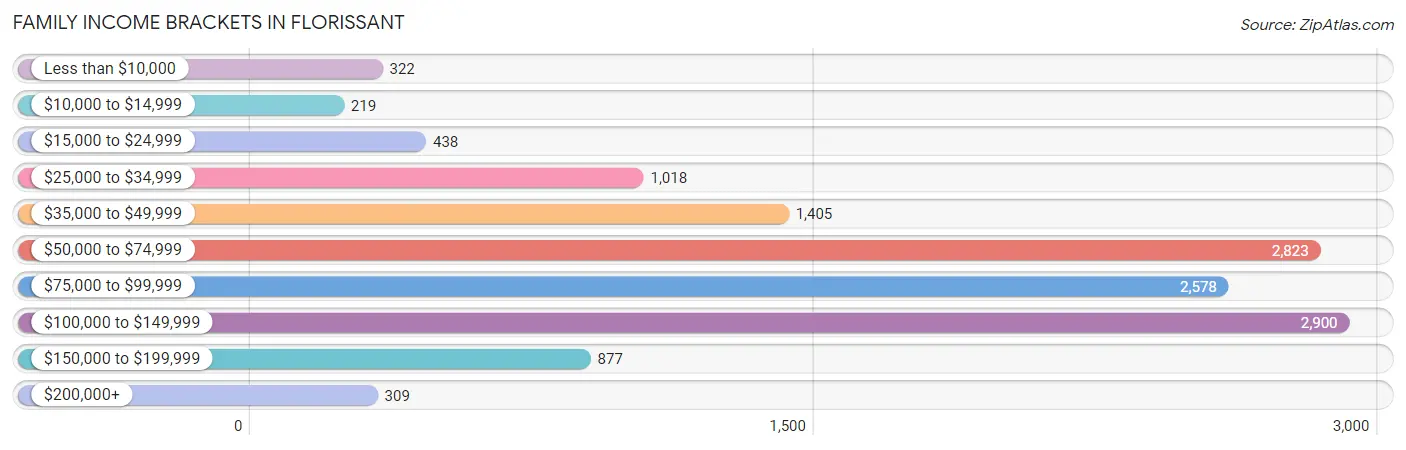
| Income Bracket | # Families | % Families |
| Less than $10,000 | 322 | 2.5% |
| $10,000 to $14,999 | 219 | 1.7% |
| $15,000 to $24,999 | 438 | 3.4% |
| $25,000 to $34,999 | 1,018 | 7.9% |
| $35,000 to $49,999 | 1,405 | 10.9% |
| $50,000 to $74,999 | 2,823 | 21.9% |
| $75,000 to $99,999 | 2,578 | 20.0% |
| $100,000 to $149,999 | 2,900 | 22.5% |
| $150,000 to $199,999 | 877 | 6.8% |
| $200,000+ | 309 | 2.4% |
Family Income by Famaliy Size in Florissant
7+ person families (136 | 1.1%) account for the highest median family income in Florissant with $115,263 per family, while 2-person families (5,944 | 46.1%) have the highest median income of $36,413 per family member.
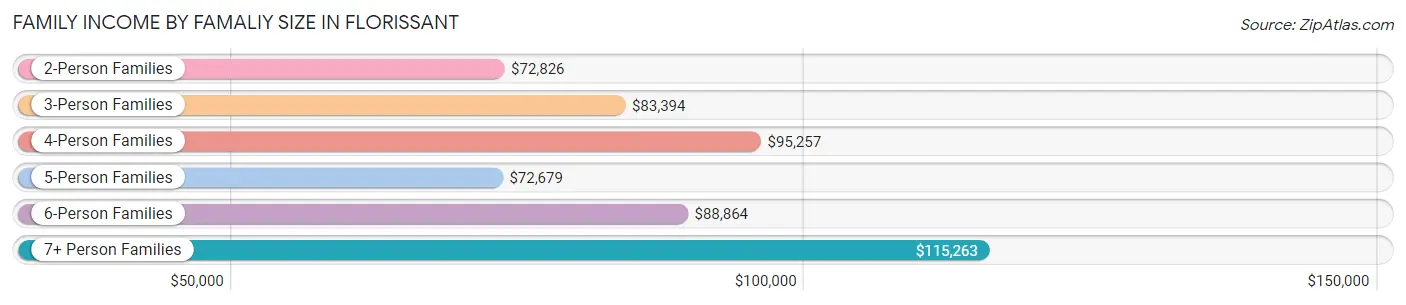
| Income Bracket | # Families | Median Income |
| 2-Person Families | 5,944 (46.1%) | $72,826 |
| 3-Person Families | 3,252 (25.2%) | $83,394 |
| 4-Person Families | 2,055 (15.9%) | $95,257 |
| 5-Person Families | 1,203 (9.3%) | $72,679 |
| 6-Person Families | 300 (2.3%) | $88,864 |
| 7+ Person Families | 136 (1.1%) | $115,263 |
| Total | 12,890 (100.0%) | $78,568 |
Family Income by Number of Earners in Florissant
The median family income in Florissant is $78,568, with families comprising 3+ earners (1,407) having the highest median family income of $130,336, while families with no earners (1,196) have the lowest median family income of $52,063, accounting for 10.9% and 9.3% of families, respectively.
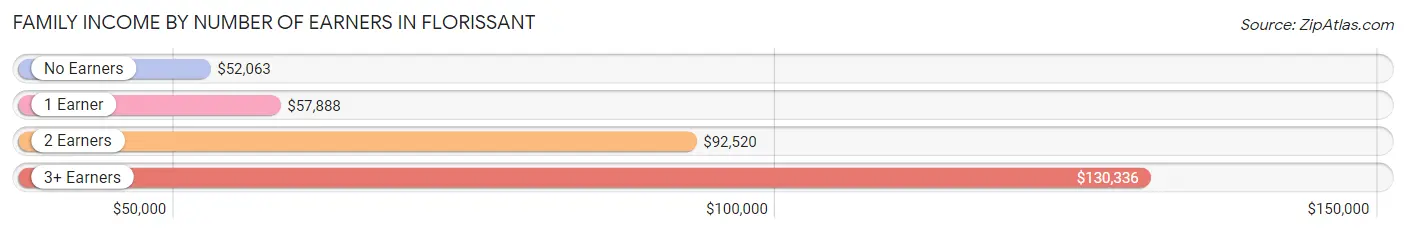
| Number of Earners | # Families | Median Income |
| No Earners | 1,196 (9.3%) | $52,063 |
| 1 Earner | 4,615 (35.8%) | $57,888 |
| 2 Earners | 5,672 (44.0%) | $92,520 |
| 3+ Earners | 1,407 (10.9%) | $130,336 |
| Total | 12,890 (100.0%) | $78,568 |
Household Income in Florissant
Household Income Brackets in Florissant
With 4,306 households falling in the category, the $50,000 to $74,999 income range is the most frequent in Florissant, accounting for 21.0% of all households. In contrast, only 472 households (2.3%) fall into the $200,000+ income bracket, making it the least populous group.
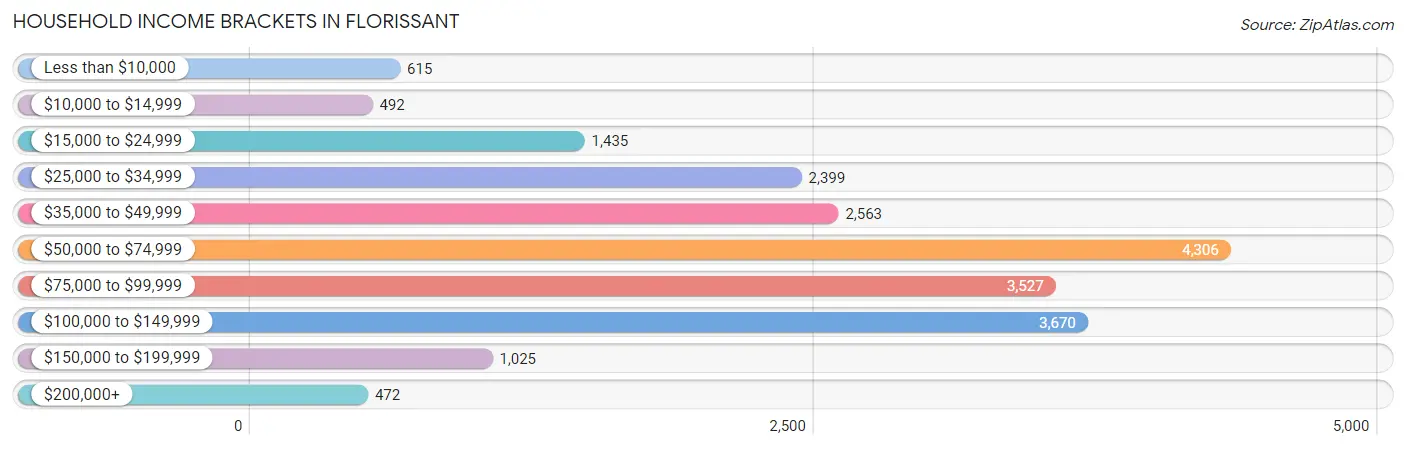
| Income Bracket | # Households | % Households |
| Less than $10,000 | 615 | 3.0% |
| $10,000 to $14,999 | 492 | 2.4% |
| $15,000 to $24,999 | 1,435 | 7.0% |
| $25,000 to $34,999 | 2,399 | 11.7% |
| $35,000 to $49,999 | 2,563 | 12.5% |
| $50,000 to $74,999 | 4,306 | 21.0% |
| $75,000 to $99,999 | 3,527 | 17.2% |
| $100,000 to $149,999 | 3,670 | 17.9% |
| $150,000 to $199,999 | 1,025 | 5.0% |
| $200,000+ | 472 | 2.3% |
Household Income by Householder Age in Florissant
The median household income in Florissant is $64,178, with the highest median household income of $83,009 found in the 45 to 64 years age bracket for the primary householder. A total of 7,781 households (38.0%) fall into this category. Meanwhile, the 65+ years age bracket for the primary householder has the lowest median household income of $47,500, with 4,748 households (23.2%) in this group.
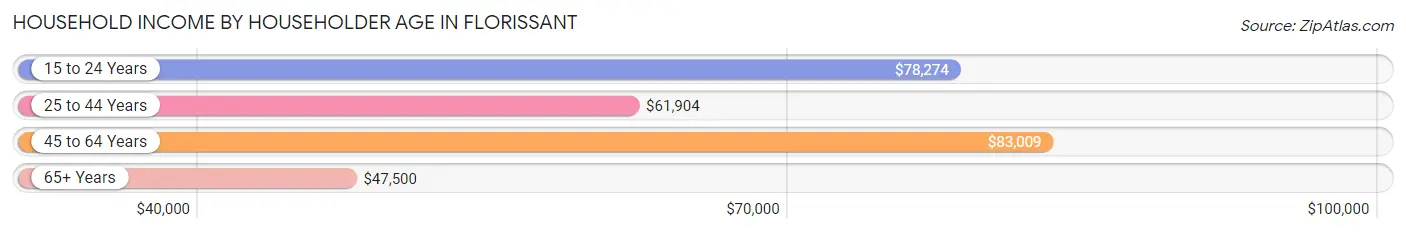
| Income Bracket | # Households | Median Income |
| 15 to 24 Years | 403 (2.0%) | $78,274 |
| 25 to 44 Years | 7,573 (36.9%) | $61,904 |
| 45 to 64 Years | 7,781 (38.0%) | $83,009 |
| 65+ Years | 4,748 (23.2%) | $47,500 |
| Total | 20,505 (100.0%) | $64,178 |
Poverty in Florissant
Income Below Poverty by Sex and Age in Florissant
With 7.8% poverty level for males and 10.4% for females among the residents of Florissant, 6 to 11 year old males and 15 year old females are the most vulnerable to poverty, with 457 males (21.7%) and 51 females (17.1%) in their respective age groups living below the poverty level.
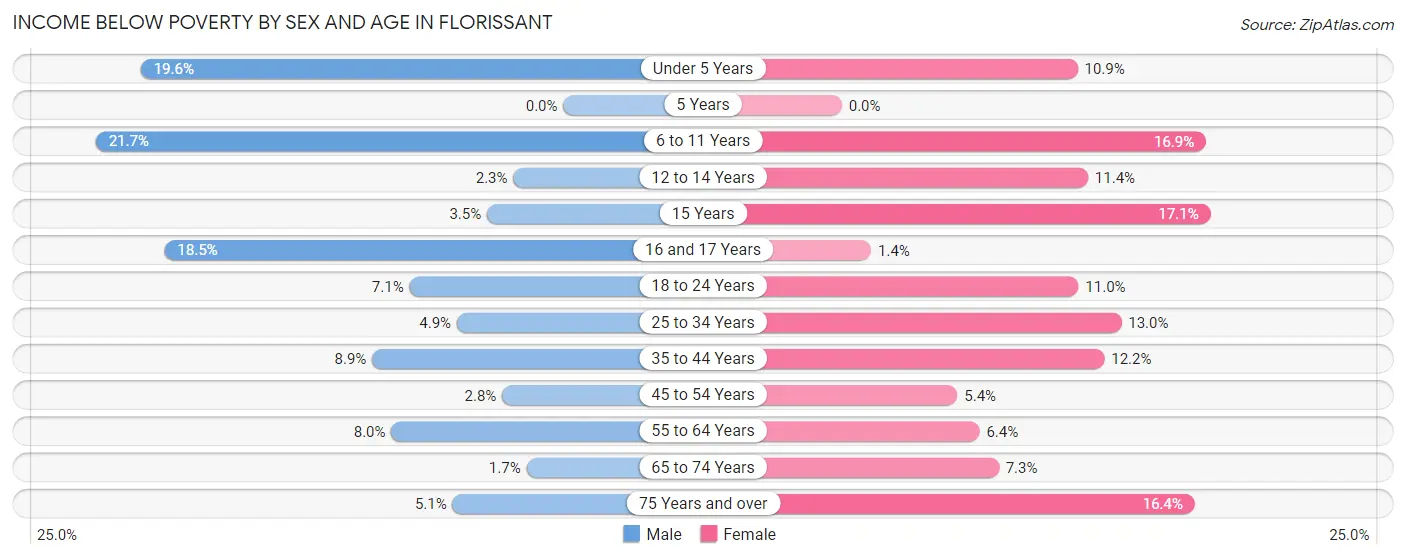
| Age Bracket | Male | Female |
| Under 5 Years | 230 (19.6%) | 160 (10.9%) |
| 5 Years | 0 (0.0%) | 0 (0.0%) |
| 6 to 11 Years | 457 (21.7%) | 343 (16.9%) |
| 12 to 14 Years | 18 (2.3%) | 154 (11.4%) |
| 15 Years | 21 (3.5%) | 51 (17.1%) |
| 16 and 17 Years | 77 (18.5%) | 10 (1.4%) |
| 18 to 24 Years | 186 (7.1%) | 214 (11.0%) |
| 25 to 34 Years | 194 (4.9%) | 530 (13.0%) |
| 35 to 44 Years | 273 (8.9%) | 485 (12.2%) |
| 45 to 54 Years | 79 (2.8%) | 156 (5.4%) |
| 55 to 64 Years | 284 (8.0%) | 235 (6.4%) |
| 65 to 74 Years | 32 (1.7%) | 167 (7.3%) |
| 75 Years and over | 63 (5.1%) | 274 (16.4%) |
| Total | 1,914 (7.8%) | 2,779 (10.4%) |
Income Above Poverty by Sex and Age in Florissant
According to the poverty statistics in Florissant, males aged 5 years and females aged 5 years are the age groups that are most secure financially, with 100.0% of males and 100.0% of females in these age groups living above the poverty line.
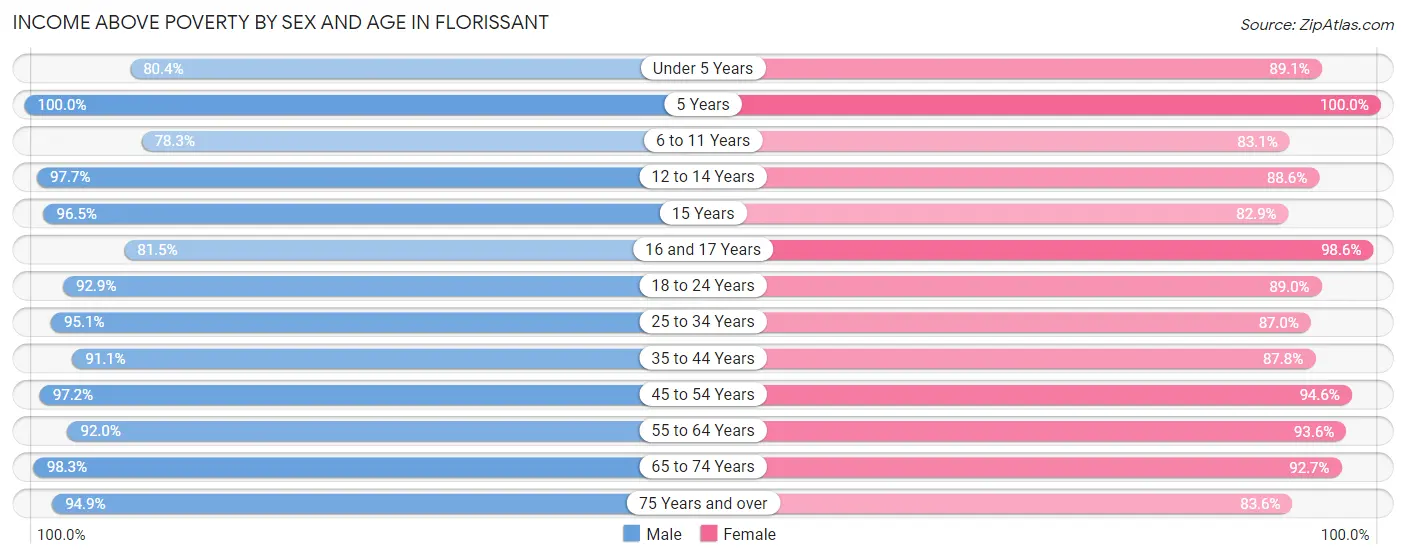
| Age Bracket | Male | Female |
| Under 5 Years | 943 (80.4%) | 1,302 (89.1%) |
| 5 Years | 452 (100.0%) | 175 (100.0%) |
| 6 to 11 Years | 1,649 (78.3%) | 1,686 (83.1%) |
| 12 to 14 Years | 757 (97.7%) | 1,194 (88.6%) |
| 15 Years | 572 (96.5%) | 247 (82.9%) |
| 16 and 17 Years | 339 (81.5%) | 725 (98.6%) |
| 18 to 24 Years | 2,420 (92.9%) | 1,735 (89.0%) |
| 25 to 34 Years | 3,730 (95.1%) | 3,557 (87.0%) |
| 35 to 44 Years | 2,804 (91.1%) | 3,496 (87.8%) |
| 45 to 54 Years | 2,703 (97.2%) | 2,757 (94.6%) |
| 55 to 64 Years | 3,277 (92.0%) | 3,443 (93.6%) |
| 65 to 74 Years | 1,841 (98.3%) | 2,128 (92.7%) |
| 75 Years and over | 1,162 (94.9%) | 1,399 (83.6%) |
| Total | 22,649 (92.2%) | 23,844 (89.6%) |
Income Below Poverty Among Married-Couple Families in Florissant
The poverty statistics for married-couple families in Florissant show that 2.8% or 230 of the total 8,127 families live below the poverty line. Families with 3 or 4 children have the highest poverty rate of 13.6%, comprising of 116 families. On the other hand, families with 1 or 2 children have the lowest poverty rate of 0.0%, which includes 0 families.
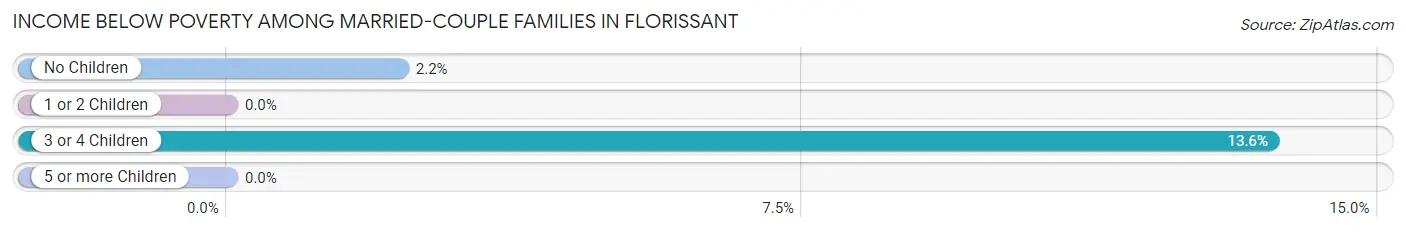
| Children | Above Poverty | Below Poverty |
| No Children | 4,992 (97.8%) | 114 (2.2%) |
| 1 or 2 Children | 2,108 (100.0%) | 0 (0.0%) |
| 3 or 4 Children | 737 (86.4%) | 116 (13.6%) |
| 5 or more Children | 60 (100.0%) | 0 (0.0%) |
| Total | 7,897 (97.2%) | 230 (2.8%) |
Income Below Poverty Among Single-Parent Households in Florissant
According to the poverty data in Florissant, 7.8% or 84 single-father households and 18.6% or 686 single-mother households are living below the poverty line. Among single-father households, those with 1 or 2 children have the highest poverty rate, with 71 households (17.0%) experiencing poverty. Likewise, among single-mother households, those with 1 or 2 children have the highest poverty rate, with 489 households (28.9%) falling below the poverty line.
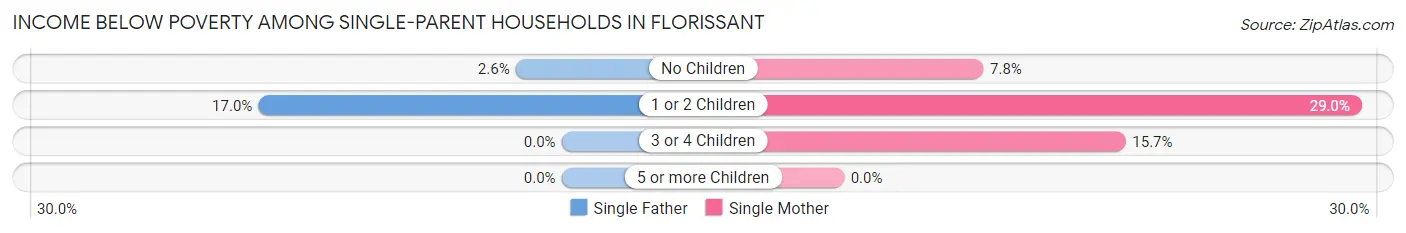
| Children | Single Father | Single Mother |
| No Children | 13 (2.6%) | 115 (7.8%) |
| 1 or 2 Children | 71 (17.0%) | 489 (28.9%) |
| 3 or 4 Children | 0 (0.0%) | 82 (15.7%) |
| 5 or more Children | 0 (0.0%) | 0 (0.0%) |
| Total | 84 (7.8%) | 686 (18.6%) |
Income Below Poverty Among Married-Couple vs Single-Parent Households in Florissant
The poverty data for Florissant shows that 230 of the married-couple family households (2.8%) and 770 of the single-parent households (16.2%) are living below the poverty level. Within the married-couple family households, those with 3 or 4 children have the highest poverty rate, with 116 households (13.6%) falling below the poverty line. Among the single-parent households, those with 1 or 2 children have the highest poverty rate, with 560 household (26.6%) living below poverty.
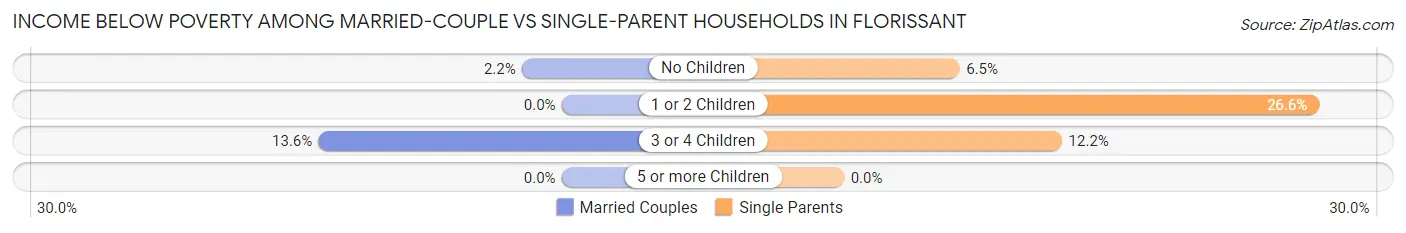
| Children | Married-Couple Families | Single-Parent Households |
| No Children | 114 (2.2%) | 128 (6.5%) |
| 1 or 2 Children | 0 (0.0%) | 560 (26.6%) |
| 3 or 4 Children | 116 (13.6%) | 82 (12.2%) |
| 5 or more Children | 0 (0.0%) | 0 (0.0%) |
| Total | 230 (2.8%) | 770 (16.2%) |
Race in Florissant
The most populous races in Florissant are White / Caucasian (25,914 | 49.7%), Black / African American (21,258 | 40.7%), and Two or more Races (3,602 | 6.9%).
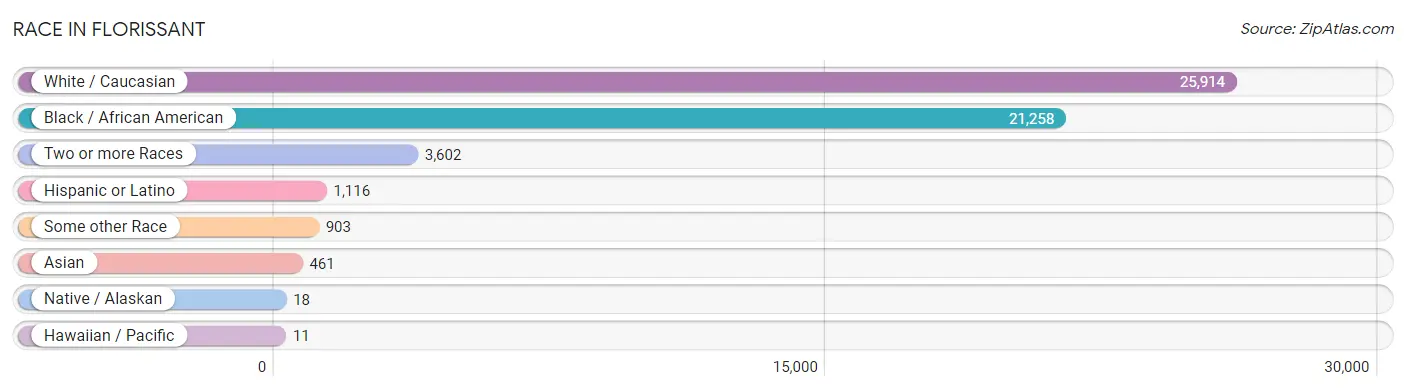
| Race | # Population | % Population |
| Asian | 461 | 0.9% |
| Black / African American | 21,258 | 40.7% |
| Hawaiian / Pacific | 11 | 0.0% |
| Hispanic or Latino | 1,116 | 2.1% |
| Native / Alaskan | 18 | 0.0% |
| White / Caucasian | 25,914 | 49.7% |
| Two or more Races | 3,602 | 6.9% |
| Some other Race | 903 | 1.7% |
| Total | 52,167 | 100.0% |
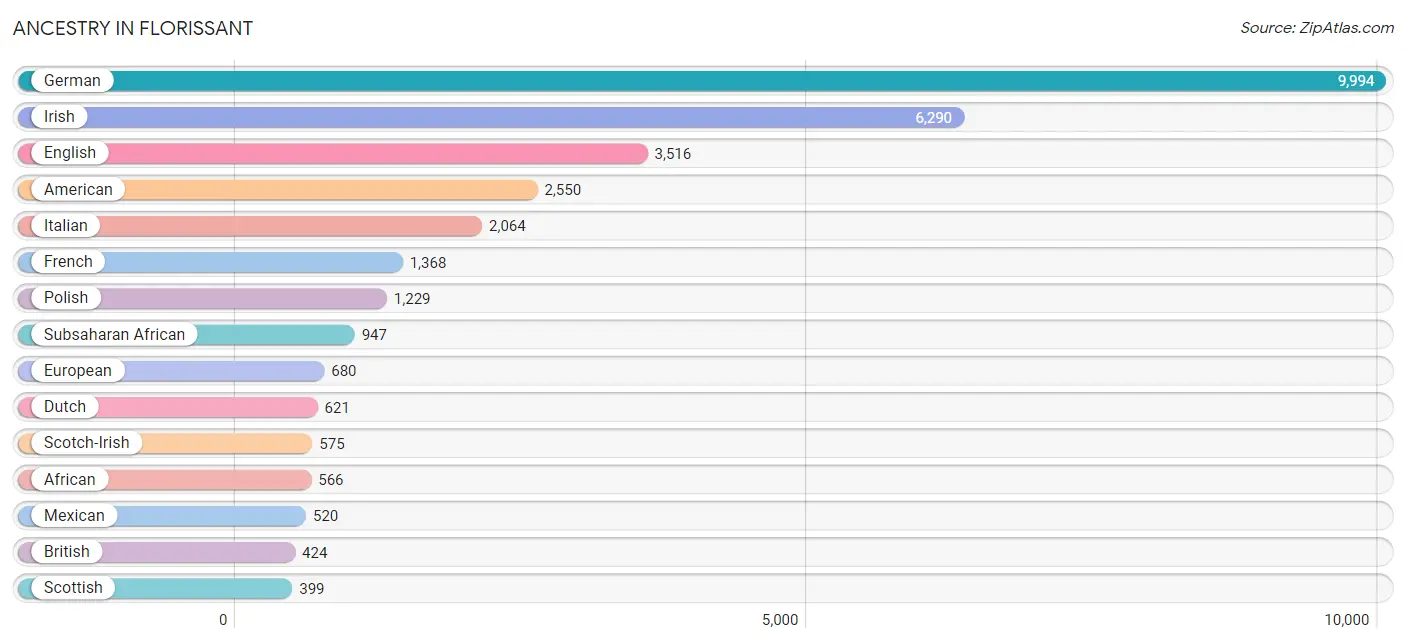
Ancestry in Florissant
The most populous ancestries reported in Florissant are German (9,994 | 19.2%), Irish (6,290 | 12.1%), English (3,516 | 6.7%), American (2,550 | 4.9%), and Italian (2,064 | 4.0%), together accounting for 46.8% of all Florissant residents.
| Ancestry | # Population | % Population |
| African | 566 | 1.1% |
| American | 2,550 | 4.9% |
| Arab | 282 | 0.5% |
| Austrian | 49 | 0.1% |
| Belgian | 29 | 0.1% |
| Bhutanese | 46 | 0.1% |
| Blackfeet | 215 | 0.4% |
| Brazilian | 24 | 0.1% |
| British | 424 | 0.8% |
| Burmese | 59 | 0.1% |
| Canadian | 21 | 0.0% |
| Central American | 153 | 0.3% |
| Cherokee | 223 | 0.4% |
| Choctaw | 29 | 0.1% |
| Colombian | 326 | 0.6% |
| Croatian | 6 | 0.0% |
| Cuban | 28 | 0.1% |
| Czech | 207 | 0.4% |
| Czechoslovakian | 18 | 0.0% |
| Danish | 36 | 0.1% |
| Dominican | 31 | 0.1% |
| Dutch | 621 | 1.2% |
| Eastern European | 146 | 0.3% |
| Ecuadorian | 1 | 0.0% |
| Egyptian | 7 | 0.0% |
| English | 3,516 | 6.7% |
| Ethiopian | 74 | 0.1% |
| European | 680 | 1.3% |
| Finnish | 4 | 0.0% |
| French | 1,368 | 2.6% |
| French American Indian | 15 | 0.0% |
| French Canadian | 91 | 0.2% |
| German | 9,994 | 19.2% |
| Greek | 368 | 0.7% |
| Honduran | 142 | 0.3% |
| Hungarian | 8 | 0.0% |
| Indian (Asian) | 38 | 0.1% |
| Irish | 6,290 | 12.1% |
| Italian | 2,064 | 4.0% |
| Kenyan | 173 | 0.3% |
| Korean | 255 | 0.5% |
| Lebanese | 29 | 0.1% |
| Liberian | 31 | 0.1% |
| Lithuanian | 24 | 0.1% |
| Mexican | 520 | 1.0% |
| Moroccan | 12 | 0.0% |
| Native Hawaiian | 38 | 0.1% |
| Nigerian | 122 | 0.2% |
| Northern European | 90 | 0.2% |
| Norwegian | 120 | 0.2% |
| Palestinian | 227 | 0.4% |
| Panamanian | 11 | 0.0% |
| Polish | 1,229 | 2.4% |
| Portuguese | 22 | 0.0% |
| Russian | 80 | 0.2% |
| Samoan | 11 | 0.0% |
| Scandinavian | 58 | 0.1% |
| Scotch-Irish | 575 | 1.1% |
| Scottish | 399 | 0.8% |
| Slovak | 9 | 0.0% |
| South American | 327 | 0.6% |
| Spaniard | 11 | 0.0% |
| Sri Lankan | 273 | 0.5% |
| Subsaharan African | 947 | 1.8% |
| Swedish | 249 | 0.5% |
| Swiss | 24 | 0.1% |
| Thai | 32 | 0.1% |
| Ukrainian | 18 | 0.0% |
| Welsh | 194 | 0.4% |
| Yugoslavian | 61 | 0.1% | View All 70 Rows |
Immigrants in Florissant
The most numerous immigrant groups reported in Florissant came from Africa (706 | 1.3%), Latin America (618 | 1.2%), Asia (596 | 1.1%), Eastern Africa (467 | 0.9%), and Kenya (395 | 0.8%), together accounting for 5.3% of all Florissant residents.
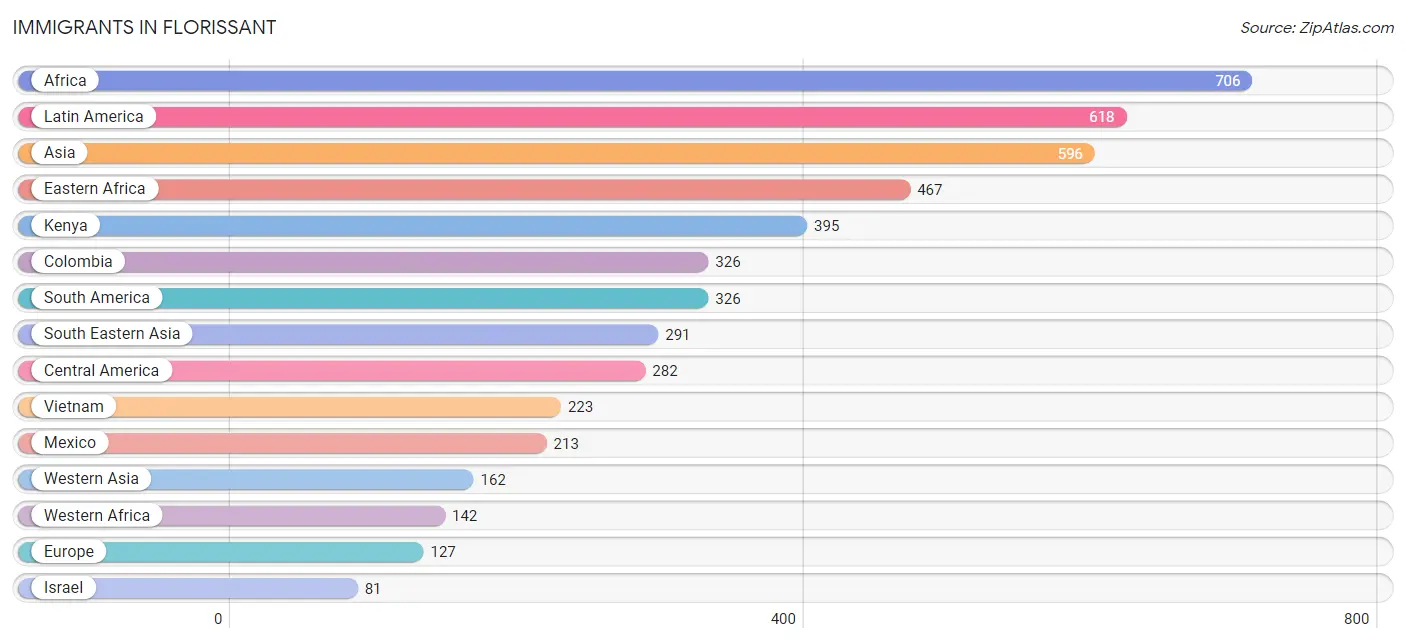
| Immigration Origin | # Population | % Population |
| Africa | 706 | 1.3% |
| Asia | 596 | 1.1% |
| Bosnia and Herzegovina | 9 | 0.0% |
| Canada | 5 | 0.0% |
| Caribbean | 10 | 0.0% |
| Central America | 282 | 0.5% |
| Colombia | 326 | 0.6% |
| Dominican Republic | 10 | 0.0% |
| Eastern Africa | 467 | 0.9% |
| Eastern Asia | 40 | 0.1% |
| Eastern Europe | 41 | 0.1% |
| England | 29 | 0.1% |
| Eritrea | 72 | 0.1% |
| Europe | 127 | 0.2% |
| Germany | 11 | 0.0% |
| Honduras | 58 | 0.1% |
| Ireland | 26 | 0.1% |
| Israel | 81 | 0.2% |
| Italy | 13 | 0.0% |
| Jordan | 81 | 0.2% |
| Kazakhstan | 20 | 0.0% |
| Kenya | 395 | 0.8% |
| Korea | 40 | 0.1% |
| Latin America | 618 | 1.2% |
| Liberia | 66 | 0.1% |
| Mexico | 213 | 0.4% |
| Middle Africa | 48 | 0.1% |
| Nigeria | 76 | 0.2% |
| Northern Africa | 13 | 0.0% |
| Northern Europe | 62 | 0.1% |
| Panama | 11 | 0.0% |
| Philippines | 68 | 0.1% |
| Poland | 17 | 0.0% |
| Russia | 15 | 0.0% |
| South America | 326 | 0.6% |
| South Central Asia | 20 | 0.0% |
| South Eastern Asia | 291 | 0.6% |
| Southern Europe | 13 | 0.0% |
| Vietnam | 223 | 0.4% |
| Western Africa | 142 | 0.3% |
| Western Asia | 162 | 0.3% |
| Western Europe | 11 | 0.0% |
| Zaire | 48 | 0.1% | View All 43 Rows |
Sex and Age in Florissant
Sex and Age in Florissant
The most populous age groups in Florissant are 30 to 34 Years (2,232 | 8.9%) for men and 10 to 14 Years (2,231 | 8.2%) for women.
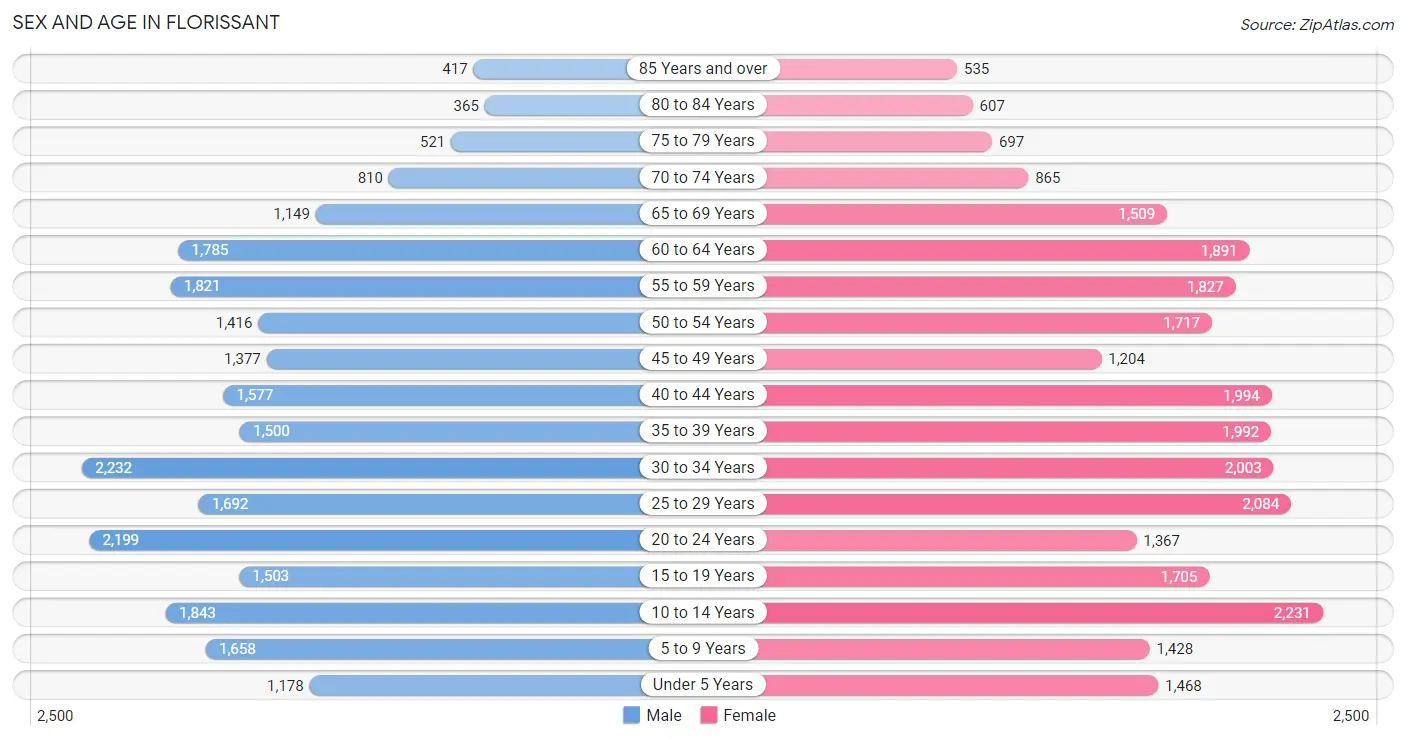
| Age Bracket | Male | Female |
| Under 5 Years | 1,178 (4.7%) | 1,468 (5.4%) |
| 5 to 9 Years | 1,658 (6.6%) | 1,428 (5.3%) |
| 10 to 14 Years | 1,843 (7.4%) | 2,231 (8.2%) |
| 15 to 19 Years | 1,503 (6.0%) | 1,705 (6.3%) |
| 20 to 24 Years | 2,199 (8.8%) | 1,367 (5.0%) |
| 25 to 29 Years | 1,692 (6.8%) | 2,084 (7.7%) |
| 30 to 34 Years | 2,232 (8.9%) | 2,003 (7.4%) |
| 35 to 39 Years | 1,500 (6.0%) | 1,992 (7.3%) |
| 40 to 44 Years | 1,577 (6.3%) | 1,994 (7.3%) |
| 45 to 49 Years | 1,377 (5.5%) | 1,204 (4.4%) |
| 50 to 54 Years | 1,416 (5.7%) | 1,717 (6.3%) |
| 55 to 59 Years | 1,821 (7.3%) | 1,827 (6.7%) |
| 60 to 64 Years | 1,785 (7.1%) | 1,891 (7.0%) |
| 65 to 69 Years | 1,149 (4.6%) | 1,509 (5.6%) |
| 70 to 74 Years | 810 (3.2%) | 865 (3.2%) |
| 75 to 79 Years | 521 (2.1%) | 697 (2.6%) |
| 80 to 84 Years | 365 (1.5%) | 607 (2.2%) |
| 85 Years and over | 417 (1.7%) | 535 (2.0%) |
| Total | 25,043 (100.0%) | 27,124 (100.0%) |
Families and Households in Florissant
Median Family Size in Florissant
The median family size in Florissant is 3.18 persons per family, with single female/mother families (3,686 | 28.6%) accounting for the largest median family size of 3.3 persons per family. On the other hand, single male/father families (1,077 | 8.4%) represent the smallest median family size with 3.06 persons per family.
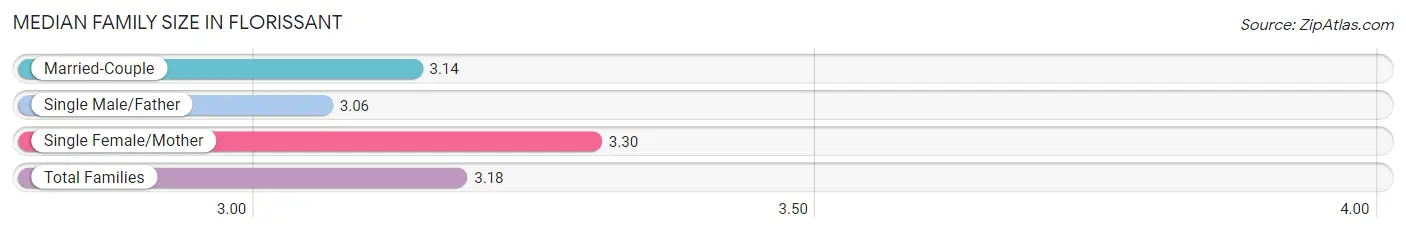
| Family Type | # Families | Family Size |
| Married-Couple | 8,127 (63.0%) | 3.14 |
| Single Male/Father | 1,077 (8.4%) | 3.06 |
| Single Female/Mother | 3,686 (28.6%) | 3.30 |
| Total Families | 12,890 (100.0%) | 3.18 |
Median Household Size in Florissant
The median household size in Florissant is 2.51 persons per household, with single female/mother households (3,686 | 18.0%) accounting for the largest median household size of 3.44 persons per household. non-family households (7,615 | 37.1%) represent the smallest median household size with 1.24 persons per household.
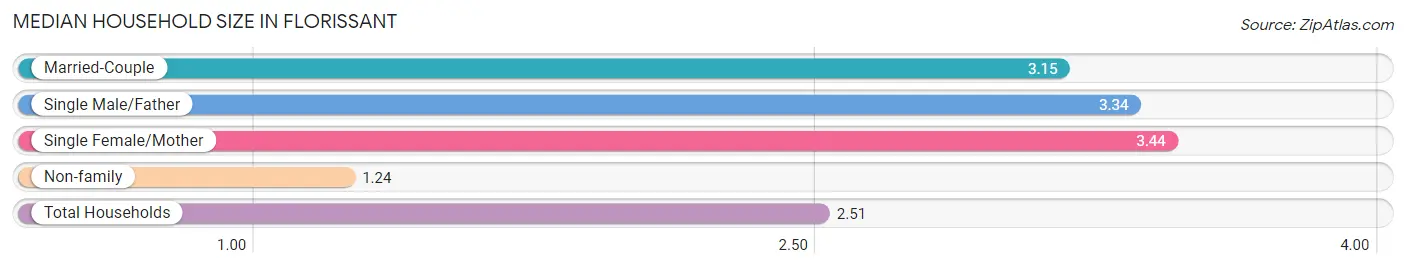
| Household Type | # Households | Household Size |
| Married-Couple | 8,127 (39.6%) | 3.15 |
| Single Male/Father | 1,077 (5.2%) | 3.34 |
| Single Female/Mother | 3,686 (18.0%) | 3.44 |
| Non-family | 7,615 (37.1%) | 1.24 |
| Total Households | 20,505 (100.0%) | 2.51 |
Household Size by Marriage Status in Florissant
Out of a total of 20,505 households in Florissant, 12,890 (62.9%) are family households, while 7,615 (37.1%) are nonfamily households. The most numerous type of family households are 2-person households, comprising 5,606, and the most common type of nonfamily households are 1-person households, comprising 6,269.
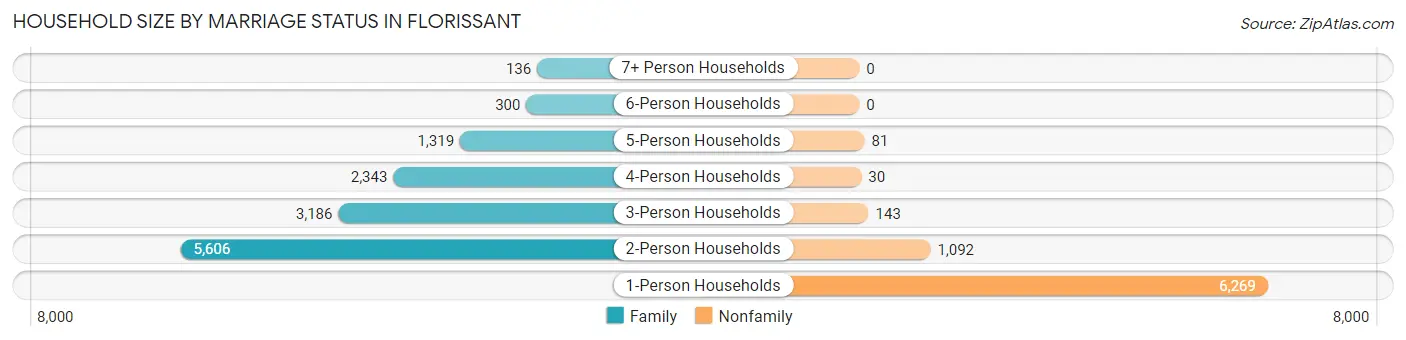
| Household Size | Family Households | Nonfamily Households |
| 1-Person Households | - | 6,269 (30.6%) |
| 2-Person Households | 5,606 (27.3%) | 1,092 (5.3%) |
| 3-Person Households | 3,186 (15.5%) | 143 (0.7%) |
| 4-Person Households | 2,343 (11.4%) | 30 (0.2%) |
| 5-Person Households | 1,319 (6.4%) | 81 (0.4%) |
| 6-Person Households | 300 (1.5%) | 0 (0.0%) |
| 7+ Person Households | 136 (0.7%) | 0 (0.0%) |
| Total | 12,890 (62.9%) | 7,615 (37.1%) |
Female Fertility in Florissant
Fertility by Age in Florissant
Average fertility rate in Florissant is 64.0 births per 1,000 women. Women in the age bracket of 20 to 34 years have the highest fertility rate with 125.0 births per 1,000 women. Women in the age bracket of 20 to 34 years acount for 84.5% of all women with births.
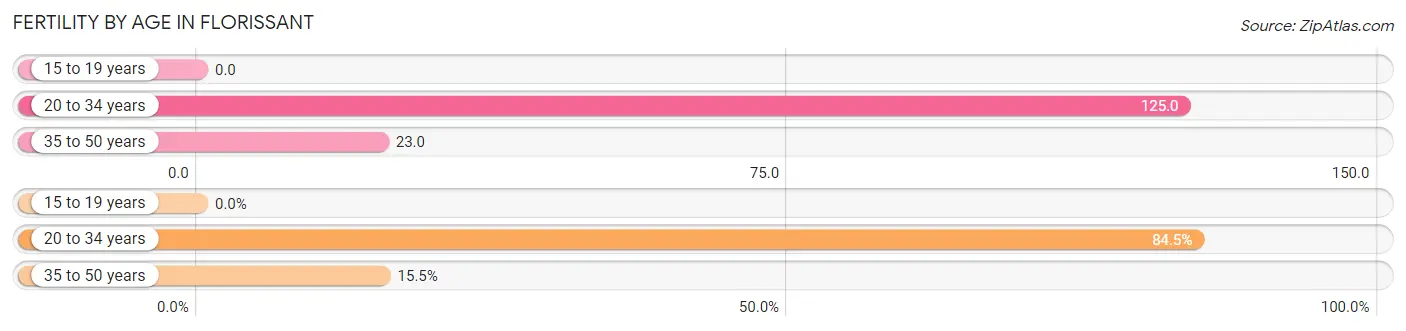
| Age Bracket | Women with Births | Births / 1,000 Women |
| 15 to 19 years | 0 (0.0%) | 0.0 |
| 20 to 34 years | 682 (84.5%) | 125.0 |
| 35 to 50 years | 125 (15.5%) | 23.0 |
| Total | 807 (100.0%) | 64.0 |
Fertility by Age by Marriage Status in Florissant
62.7% of women with births (807) in Florissant are married. The highest percentage of unmarried women with births falls into 35 to 50 years age bracket with 44.8% of them unmarried at the time of birth, while the lowest percentage of unmarried women with births belong to 20 to 34 years age bracket with 35.9% of them unmarried.
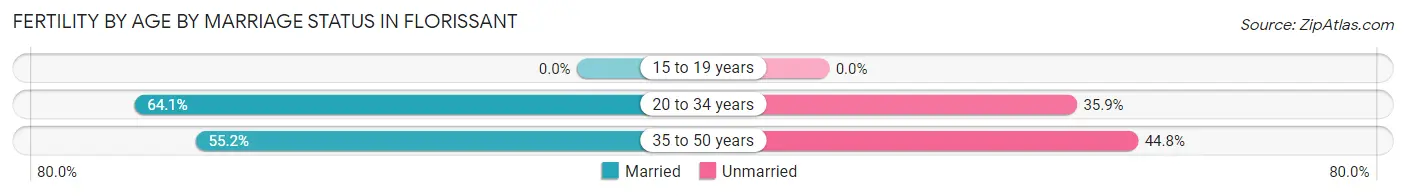
| Age Bracket | Married | Unmarried |
| 15 to 19 years | 0 (0.0%) | 0 (0.0%) |
| 20 to 34 years | 437 (64.1%) | 245 (35.9%) |
| 35 to 50 years | 69 (55.2%) | 56 (44.8%) |
| Total | 506 (62.7%) | 301 (37.3%) |
Fertility by Education in Florissant
Average fertility rate in Florissant is 64.0 births per 1,000 women. Women with the education attainment of graduate degree have the highest fertility rate of 157.0 births per 1,000 women, while women with the education attainment of college or associate's degree have the lowest fertility at 34.0 births per 1,000 women. Women with the education attainment of bachelor's degree represent 31.9% of all women with births.
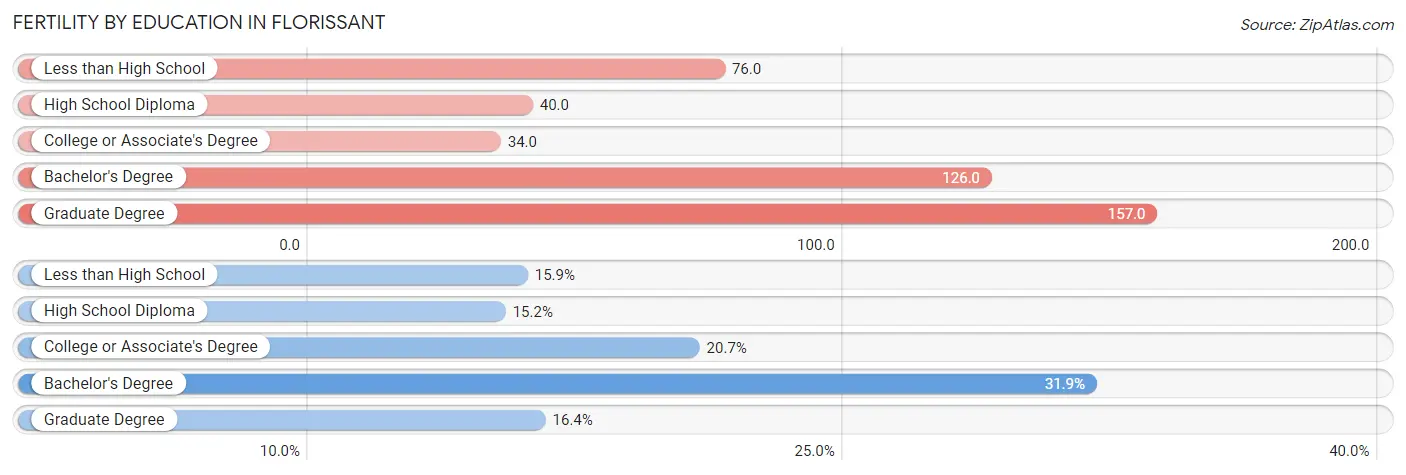
| Educational Attainment | Women with Births | Births / 1,000 Women |
| Less than High School | 128 (15.9%) | 76.0 |
| High School Diploma | 123 (15.2%) | 40.0 |
| College or Associate's Degree | 167 (20.7%) | 34.0 |
| Bachelor's Degree | 257 (31.9%) | 126.0 |
| Graduate Degree | 132 (16.4%) | 157.0 |
| Total | 807 (100.0%) | 64.0 |
Fertility by Education by Marriage Status in Florissant
37.3% of women with births in Florissant are unmarried. Women with the educational attainment of graduate degree are most likely to be married with 97.0% of them married at childbirth, while women with the educational attainment of college or associate's degree are least likely to be married with 81.4% of them unmarried at childbirth.
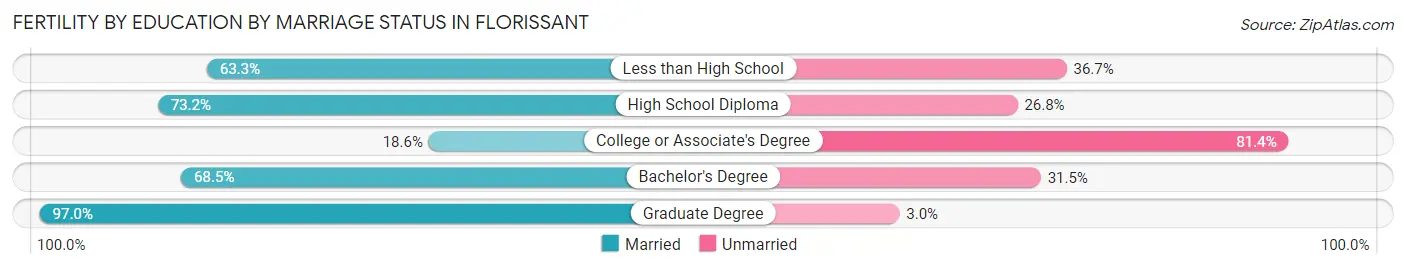
| Educational Attainment | Married | Unmarried |
| Less than High School | 81 (63.3%) | 47 (36.7%) |
| High School Diploma | 90 (73.2%) | 33 (26.8%) |
| College or Associate's Degree | 31 (18.6%) | 136 (81.4%) |
| Bachelor's Degree | 176 (68.5%) | 81 (31.5%) |
| Graduate Degree | 128 (97.0%) | 4 (3.0%) |
| Total | 506 (62.7%) | 301 (37.3%) |
Employment Characteristics in Florissant
Employment by Class of Employer in Florissant
Among the 26,404 employed individuals in Florissant, private company employees (18,879 | 71.5%), not-for-profit organizations (2,611 | 9.9%), and local government employees (1,746 | 6.6%) make up the most common classes of employment.
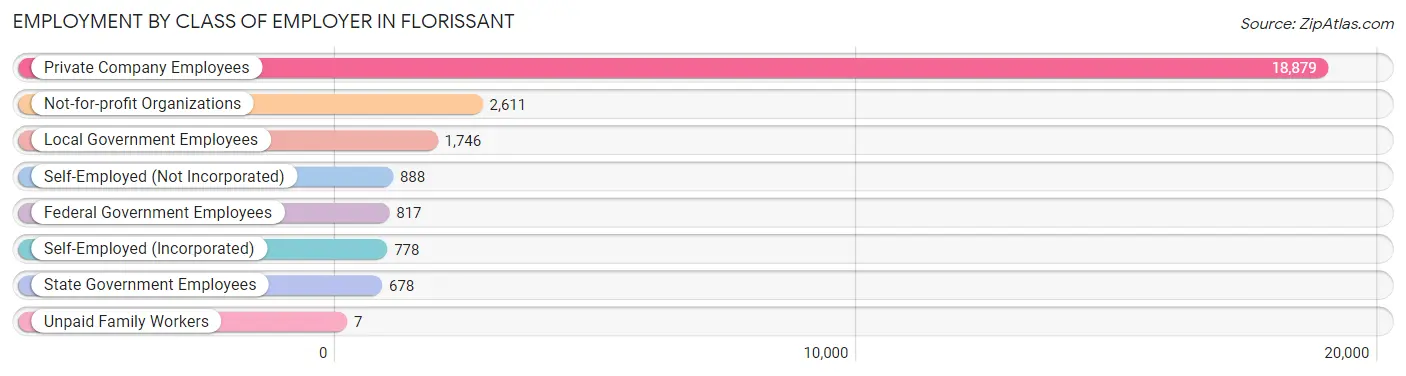
| Employer Class | # Employees | % Employees |
| Private Company Employees | 18,879 | 71.5% |
| Self-Employed (Incorporated) | 778 | 2.9% |
| Self-Employed (Not Incorporated) | 888 | 3.4% |
| Not-for-profit Organizations | 2,611 | 9.9% |
| Local Government Employees | 1,746 | 6.6% |
| State Government Employees | 678 | 2.6% |
| Federal Government Employees | 817 | 3.1% |
| Unpaid Family Workers | 7 | 0.0% |
| Total | 26,404 | 100.0% |
Employment Status by Age in Florissant
According to the labor force statistics for Florissant, out of the total population over 16 years of age (41,438), 69.3% or 28,717 individuals are in the labor force, with 6.4% or 1,838 of them unemployed. The age group with the highest labor force participation rate is 35 to 44 years, with 88.3% or 6,237 individuals in the labor force. Within the labor force, the 16 to 19 years age range has the highest percentage of unemployed individuals, with 35.9% or 389 of them being unemployed.
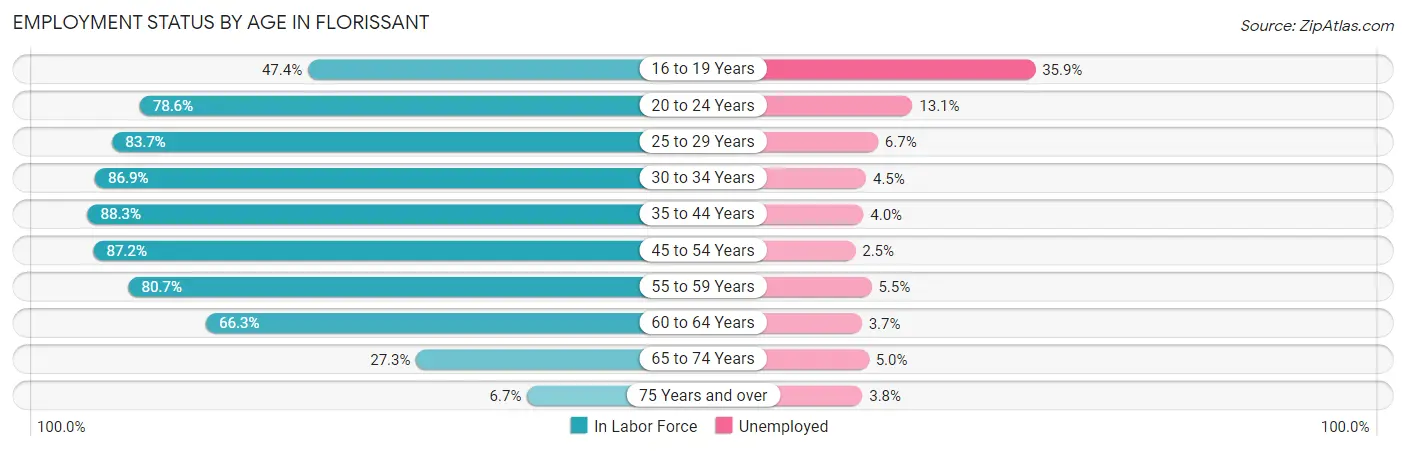
| Age Bracket | In Labor Force | Unemployed |
| 16 to 19 Years | 1,083 (47.4%) | 389 (35.9%) |
| 20 to 24 Years | 2,803 (78.6%) | 367 (13.1%) |
| 25 to 29 Years | 3,161 (83.7%) | 212 (6.7%) |
| 30 to 34 Years | 3,680 (86.9%) | 166 (4.5%) |
| 35 to 44 Years | 6,237 (88.3%) | 249 (4.0%) |
| 45 to 54 Years | 4,983 (87.2%) | 125 (2.5%) |
| 55 to 59 Years | 2,944 (80.7%) | 162 (5.5%) |
| 60 to 64 Years | 2,437 (66.3%) | 90 (3.7%) |
| 65 to 74 Years | 1,183 (27.3%) | 59 (5.0%) |
| 75 Years and over | 211 (6.7%) | 8 (3.8%) |
| Total | 28,717 (69.3%) | 1,838 (6.4%) |
Employment Status by Educational Attainment in Florissant
According to labor force statistics for Florissant, 83.4% of individuals (23,445) out of the total population between 25 and 64 years of age (28,112) are in the labor force, with 4.3% or 1,008 of them being unemployed. The group with the highest labor force participation rate are those with the educational attainment of bachelor's degree or higher, with 92.1% or 6,151 individuals in the labor force. Within the labor force, individuals with high school diploma education have the highest percentage of unemployment, with 5.7% or 391 of them being unemployed.
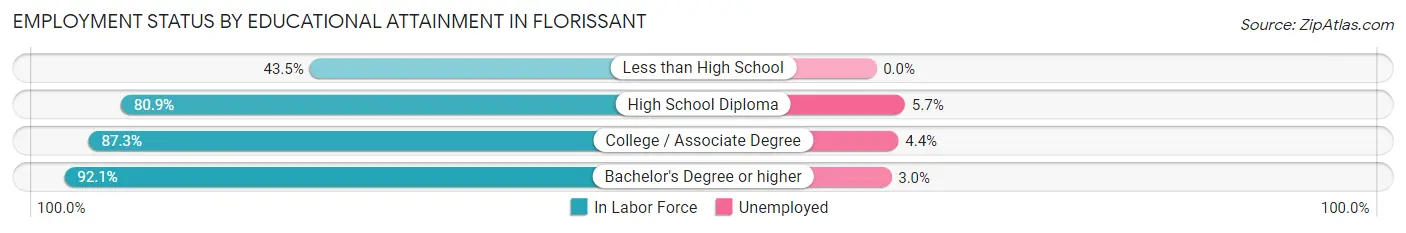
| Educational Attainment | In Labor Force | Unemployed |
| Less than High School | 875 (43.5%) | 0 (0.0%) |
| High School Diploma | 6,854 (80.9%) | 483 (5.7%) |
| College / Associate Degree | 9,559 (87.3%) | 482 (4.4%) |
| Bachelor's Degree or higher | 6,151 (92.1%) | 200 (3.0%) |
| Total | 23,445 (83.4%) | 1,209 (4.3%) |
Employment Occupations by Sex in Florissant
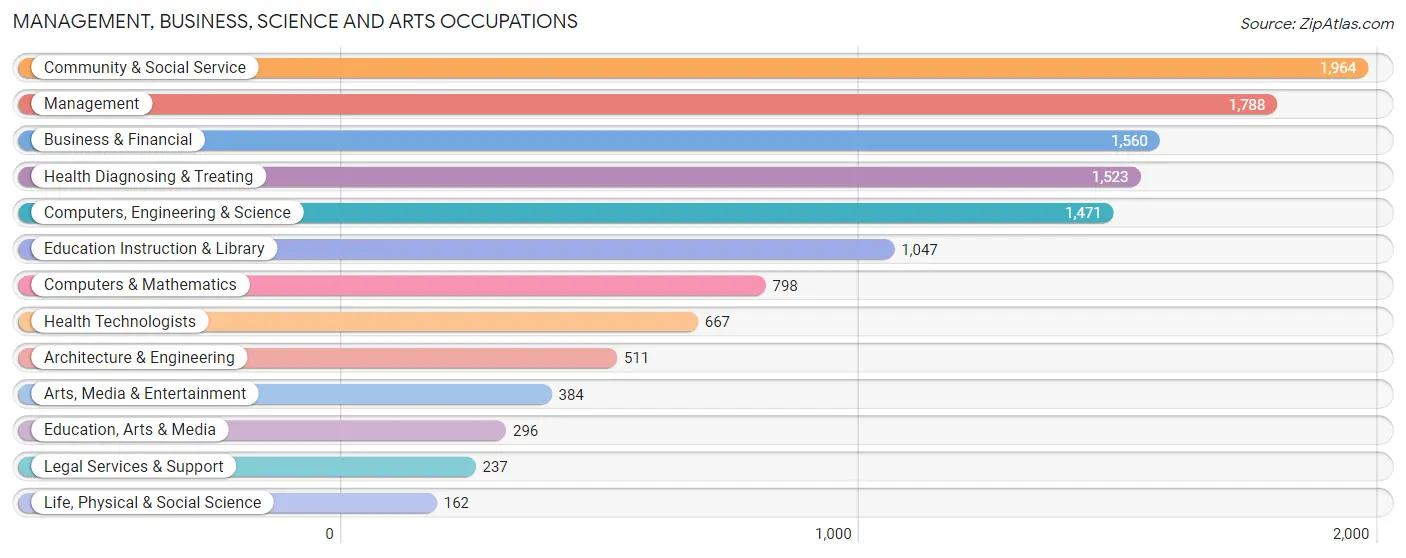
Management, Business, Science and Arts Occupations
The most common Management, Business, Science and Arts occupations in Florissant are Community & Social Service (1,964 | 7.3%), Management (1,788 | 6.7%), Business & Financial (1,560 | 5.8%), Health Diagnosing & Treating (1,523 | 5.7%), and Computers, Engineering & Science (1,471 | 5.5%).
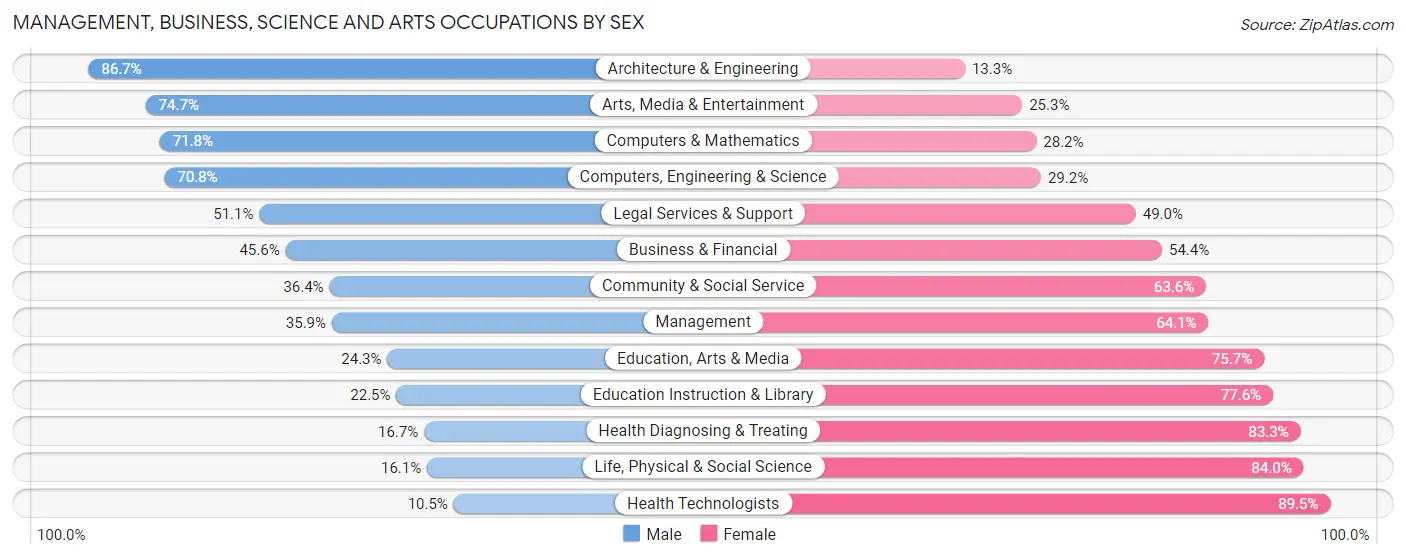
Management, Business, Science and Arts Occupations by Sex
Within the Management, Business, Science and Arts occupations in Florissant, the most male-oriented occupations are Architecture & Engineering (86.7%), Arts, Media & Entertainment (74.7%), and Computers & Mathematics (71.8%), while the most female-oriented occupations are Health Technologists (89.5%), Life, Physical & Social Science (84.0%), and Health Diagnosing & Treating (83.3%).
| Occupation | Male | Female |
| Management | 642 (35.9%) | 1,146 (64.1%) |
| Business & Financial | 711 (45.6%) | 849 (54.4%) |
| Computers, Engineering & Science | 1,042 (70.8%) | 429 (29.2%) |
| Computers & Mathematics | 573 (71.8%) | 225 (28.2%) |
| Architecture & Engineering | 443 (86.7%) | 68 (13.3%) |
| Life, Physical & Social Science | 26 (16.1%) | 136 (84.0%) |
| Community & Social Service | 715 (36.4%) | 1,249 (63.6%) |
| Education, Arts & Media | 72 (24.3%) | 224 (75.7%) |
| Legal Services & Support | 121 (51.0%) | 116 (48.9%) |
| Education Instruction & Library | 235 (22.5%) | 812 (77.5%) |
| Arts, Media & Entertainment | 287 (74.7%) | 97 (25.3%) |
| Health Diagnosing & Treating | 254 (16.7%) | 1,269 (83.3%) |
| Health Technologists | 70 (10.5%) | 597 (89.5%) |
| Total (Category) | 3,364 (40.5%) | 4,942 (59.5%) |
| Total (Overall) | 13,703 (51.0%) | 13,180 (49.0%) |
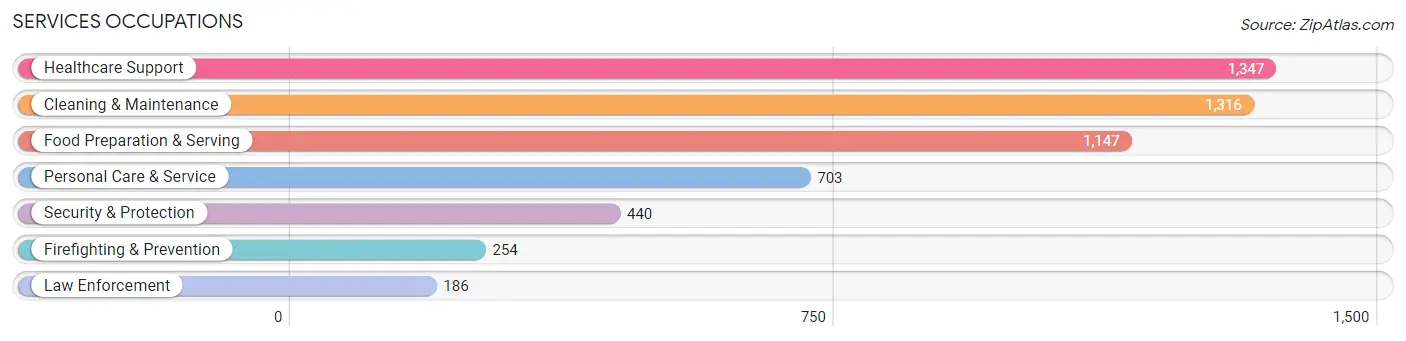
Services Occupations
The most common Services occupations in Florissant are Healthcare Support (1,347 | 5.0%), Cleaning & Maintenance (1,316 | 4.9%), Food Preparation & Serving (1,147 | 4.3%), Personal Care & Service (703 | 2.6%), and Security & Protection (440 | 1.6%).
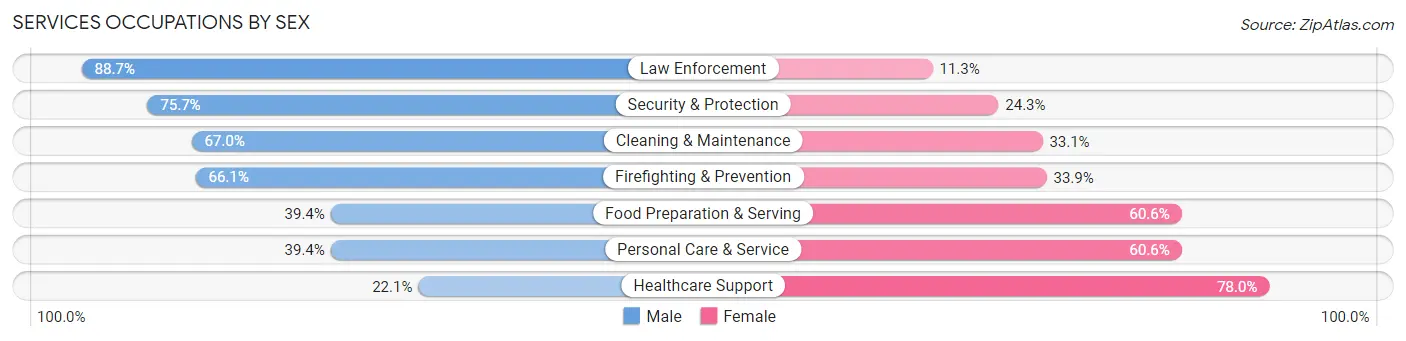
Services Occupations by Sex
Within the Services occupations in Florissant, the most male-oriented occupations are Law Enforcement (88.7%), Security & Protection (75.7%), and Cleaning & Maintenance (66.9%), while the most female-oriented occupations are Healthcare Support (77.9%), Personal Care & Service (60.6%), and Food Preparation & Serving (60.6%).
| Occupation | Male | Female |
| Healthcare Support | 297 (22.1%) | 1,050 (77.9%) |
| Security & Protection | 333 (75.7%) | 107 (24.3%) |
| Firefighting & Prevention | 168 (66.1%) | 86 (33.9%) |
| Law Enforcement | 165 (88.7%) | 21 (11.3%) |
| Food Preparation & Serving | 452 (39.4%) | 695 (60.6%) |
| Cleaning & Maintenance | 881 (66.9%) | 435 (33.1%) |
| Personal Care & Service | 277 (39.4%) | 426 (60.6%) |
| Total (Category) | 2,240 (45.2%) | 2,713 (54.8%) |
| Total (Overall) | 13,703 (51.0%) | 13,180 (49.0%) |
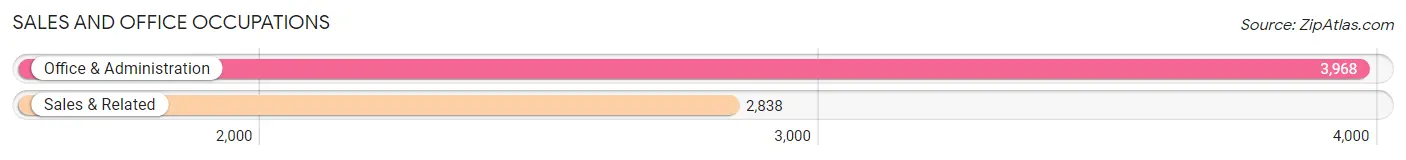
Sales and Office Occupations
The most common Sales and Office occupations in Florissant are Office & Administration (3,968 | 14.8%), and Sales & Related (2,838 | 10.6%).
Sales and Office Occupations by Sex
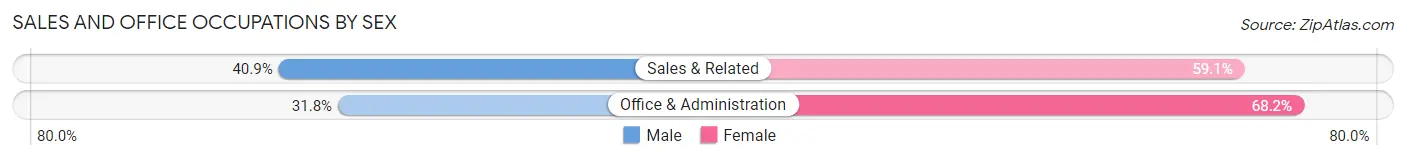
| Occupation | Male | Female |
| Sales & Related | 1,162 (40.9%) | 1,676 (59.1%) |
| Office & Administration | 1,262 (31.8%) | 2,706 (68.2%) |
| Total (Category) | 2,424 (35.6%) | 4,382 (64.4%) |
| Total (Overall) | 13,703 (51.0%) | 13,180 (49.0%) |
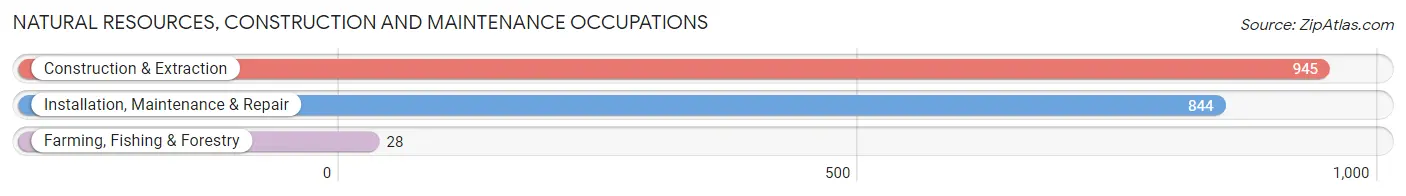
Natural Resources, Construction and Maintenance Occupations
The most common Natural Resources, Construction and Maintenance occupations in Florissant are Construction & Extraction (945 | 3.5%), Installation, Maintenance & Repair (844 | 3.1%), and Farming, Fishing & Forestry (28 | 0.1%).
Natural Resources, Construction and Maintenance Occupations by Sex
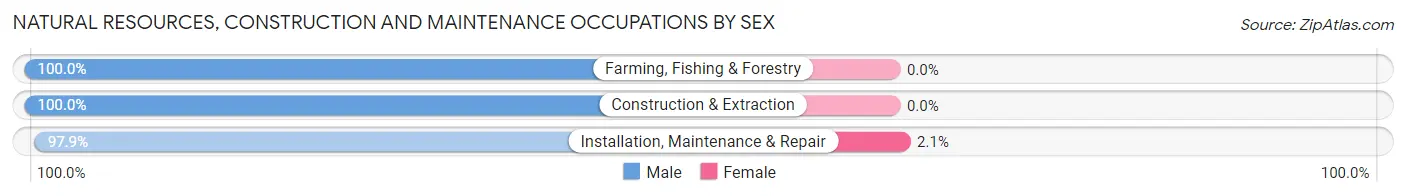
| Occupation | Male | Female |
| Farming, Fishing & Forestry | 28 (100.0%) | 0 (0.0%) |
| Construction & Extraction | 945 (100.0%) | 0 (0.0%) |
| Installation, Maintenance & Repair | 826 (97.9%) | 18 (2.1%) |
| Total (Category) | 1,799 (99.0%) | 18 (1.0%) |
| Total (Overall) | 13,703 (51.0%) | 13,180 (49.0%) |
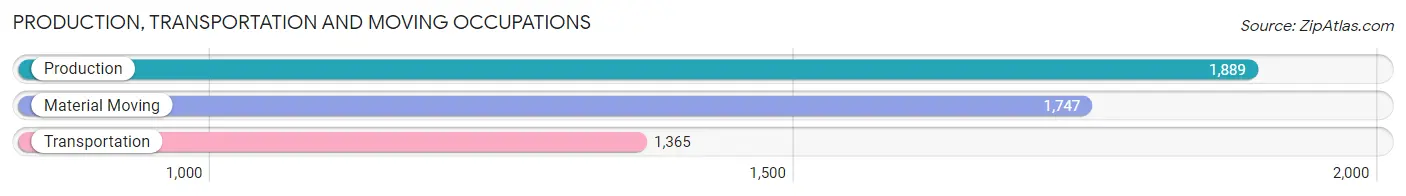
Production, Transportation and Moving Occupations
The most common Production, Transportation and Moving occupations in Florissant are Production (1,889 | 7.0%), Material Moving (1,747 | 6.5%), and Transportation (1,365 | 5.1%).
Production, Transportation and Moving Occupations by Sex
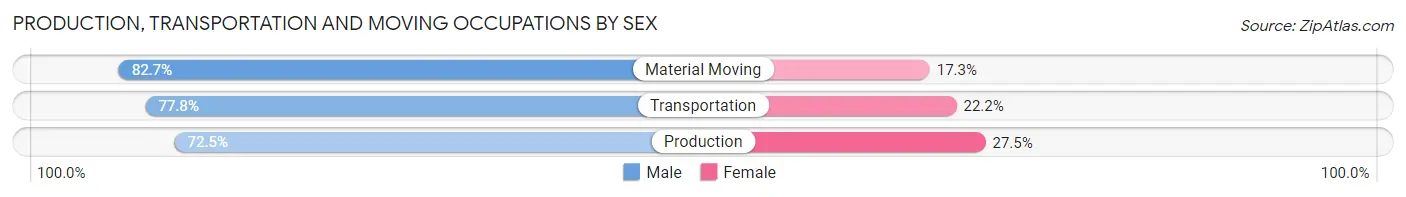
| Occupation | Male | Female |
| Production | 1,369 (72.5%) | 520 (27.5%) |
| Transportation | 1,062 (77.8%) | 303 (22.2%) |
| Material Moving | 1,445 (82.7%) | 302 (17.3%) |
| Total (Category) | 3,876 (77.5%) | 1,125 (22.5%) |
| Total (Overall) | 13,703 (51.0%) | 13,180 (49.0%) |
Employment Industries by Sex in Florissant
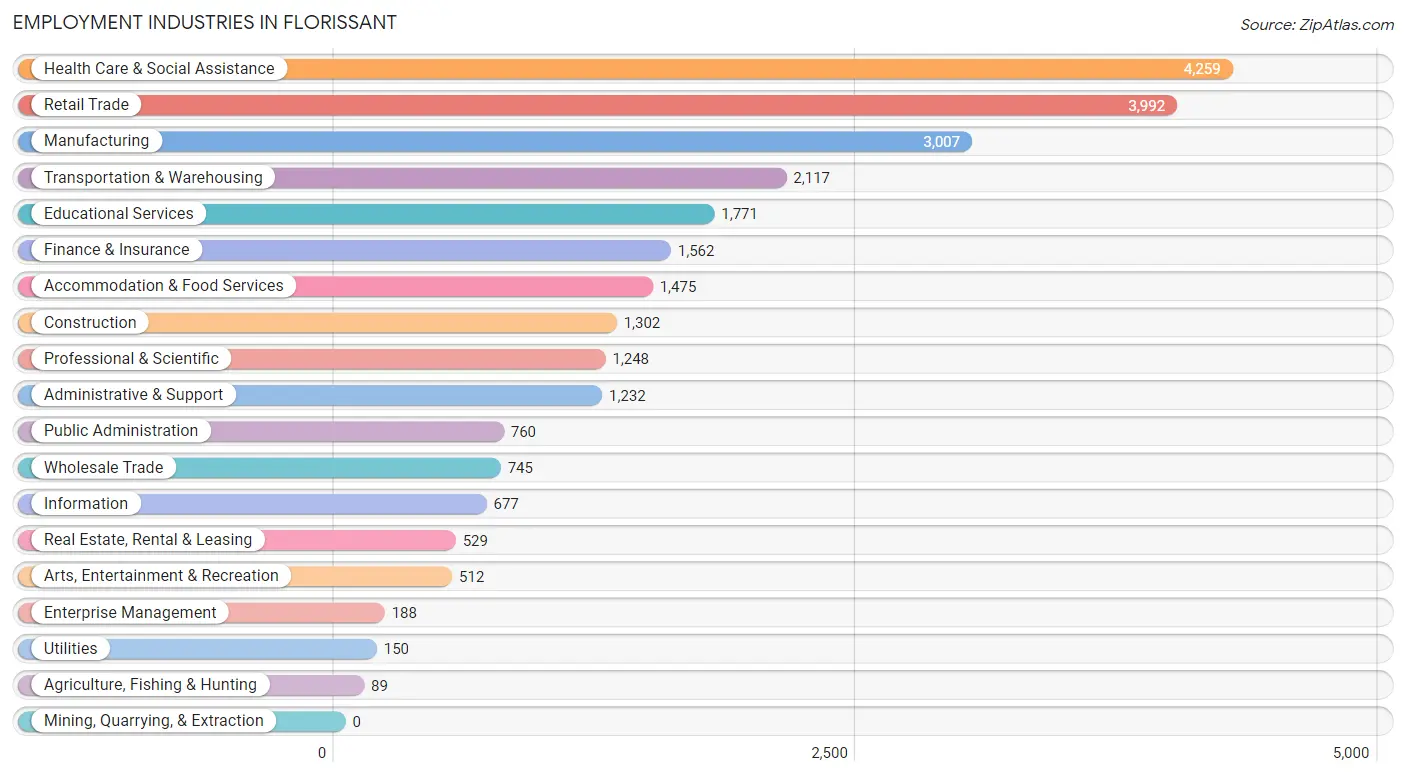
Employment Industries in Florissant
The major employment industries in Florissant include Health Care & Social Assistance (4,259 | 15.8%), Retail Trade (3,992 | 14.8%), Manufacturing (3,007 | 11.2%), Transportation & Warehousing (2,117 | 7.9%), and Educational Services (1,771 | 6.6%).
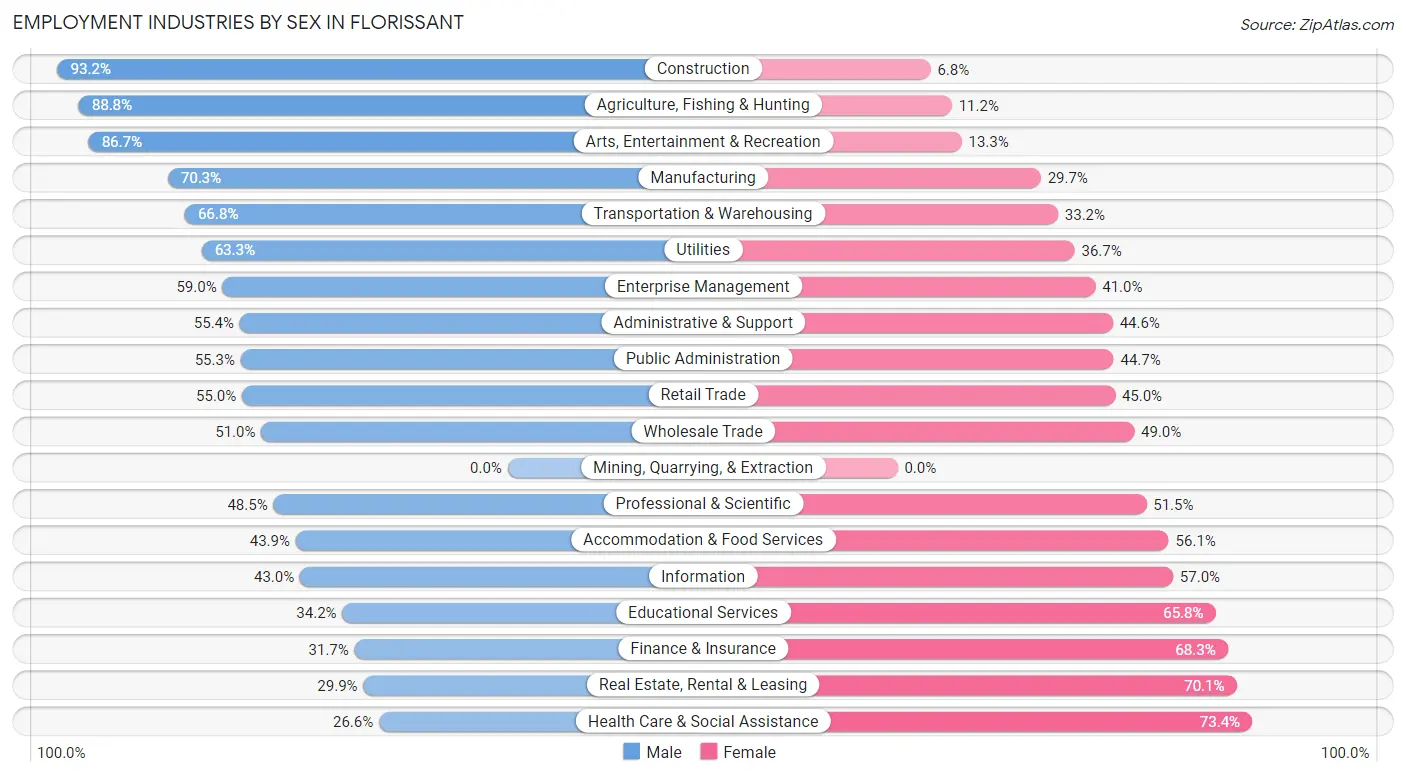
Employment Industries by Sex in Florissant
The Florissant industries that see more men than women are Construction (93.2%), Agriculture, Fishing & Hunting (88.8%), and Arts, Entertainment & Recreation (86.7%), whereas the industries that tend to have a higher number of women are Health Care & Social Assistance (73.4%), Real Estate, Rental & Leasing (70.1%), and Finance & Insurance (68.3%).
| Industry | Male | Female |
| Agriculture, Fishing & Hunting | 79 (88.8%) | 10 (11.2%) |
| Mining, Quarrying, & Extraction | 0 (0.0%) | 0 (0.0%) |
| Construction | 1,213 (93.2%) | 89 (6.8%) |
| Manufacturing | 2,115 (70.3%) | 892 (29.7%) |
| Wholesale Trade | 380 (51.0%) | 365 (49.0%) |
| Retail Trade | 2,195 (55.0%) | 1,797 (45.0%) |
| Transportation & Warehousing | 1,414 (66.8%) | 703 (33.2%) |
| Utilities | 95 (63.3%) | 55 (36.7%) |
| Information | 291 (43.0%) | 386 (57.0%) |
| Finance & Insurance | 495 (31.7%) | 1,067 (68.3%) |
| Real Estate, Rental & Leasing | 158 (29.9%) | 371 (70.1%) |
| Professional & Scientific | 605 (48.5%) | 643 (51.5%) |
| Enterprise Management | 111 (59.0%) | 77 (41.0%) |
| Administrative & Support | 683 (55.4%) | 549 (44.6%) |
| Educational Services | 606 (34.2%) | 1,165 (65.8%) |
| Health Care & Social Assistance | 1,134 (26.6%) | 3,125 (73.4%) |
| Arts, Entertainment & Recreation | 444 (86.7%) | 68 (13.3%) |
| Accommodation & Food Services | 647 (43.9%) | 828 (56.1%) |
| Public Administration | 420 (55.3%) | 340 (44.7%) |
| Total | 13,703 (51.0%) | 13,180 (49.0%) |
Education in Florissant
School Enrollment in Florissant
The most common levels of schooling among the 12,988 students in Florissant are middle school (3,164 | 24.4%), high school (2,757 | 21.2%), and elementary school (2,662 | 20.5%).
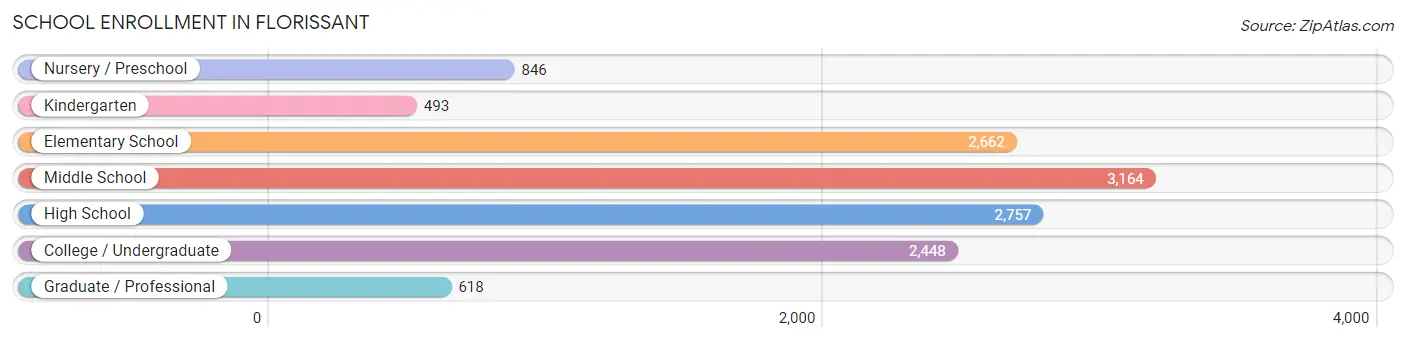
| School Level | # Students | % Students |
| Nursery / Preschool | 846 | 6.5% |
| Kindergarten | 493 | 3.8% |
| Elementary School | 2,662 | 20.5% |
| Middle School | 3,164 | 24.4% |
| High School | 2,757 | 21.2% |
| College / Undergraduate | 2,448 | 18.9% |
| Graduate / Professional | 618 | 4.8% |
| Total | 12,988 | 100.0% |
School Enrollment by Age by Funding Source in Florissant
Out of a total of 12,988 students who are enrolled in schools in Florissant, 2,455 (18.9%) attend a private institution, while the remaining 10,533 (81.1%) are enrolled in public schools. The age group of 3 to 4 year olds has the highest likelihood of being enrolled in private schools, with 165 (29.2% in the age bracket) enrolled. Conversely, the age group of 25 to 34 year olds has the lowest likelihood of being enrolled in a private school, with 754 (95.8% in the age bracket) attending a public institution.
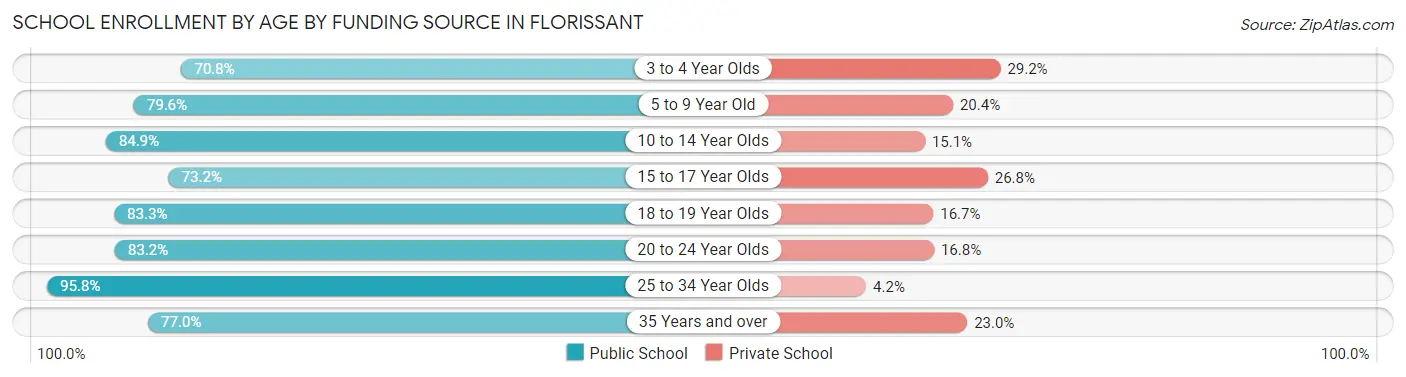
| Age Bracket | Public School | Private School |
| 3 to 4 Year Olds | 400 (70.8%) | 165 (29.2%) |
| 5 to 9 Year Old | 2,367 (79.6%) | 605 (20.4%) |
| 10 to 14 Year Olds | 3,409 (84.9%) | 608 (15.1%) |
| 15 to 17 Year Olds | 1,458 (73.2%) | 535 (26.8%) |
| 18 to 19 Year Olds | 509 (83.3%) | 102 (16.7%) |
| 20 to 24 Year Olds | 915 (83.2%) | 185 (16.8%) |
| 25 to 34 Year Olds | 754 (95.8%) | 33 (4.2%) |
| 35 Years and over | 726 (77.0%) | 217 (23.0%) |
| Total | 10,533 (81.1%) | 2,455 (18.9%) |
Educational Attainment by Field of Study in Florissant
Business (2,033 | 23.5%), education (1,351 | 15.7%), arts & humanities (918 | 10.6%), science & technology (828 | 9.6%), and computers & mathematics (471 | 5.4%) are the most common fields of study among 8,635 individuals in Florissant who have obtained a bachelor's degree or higher.
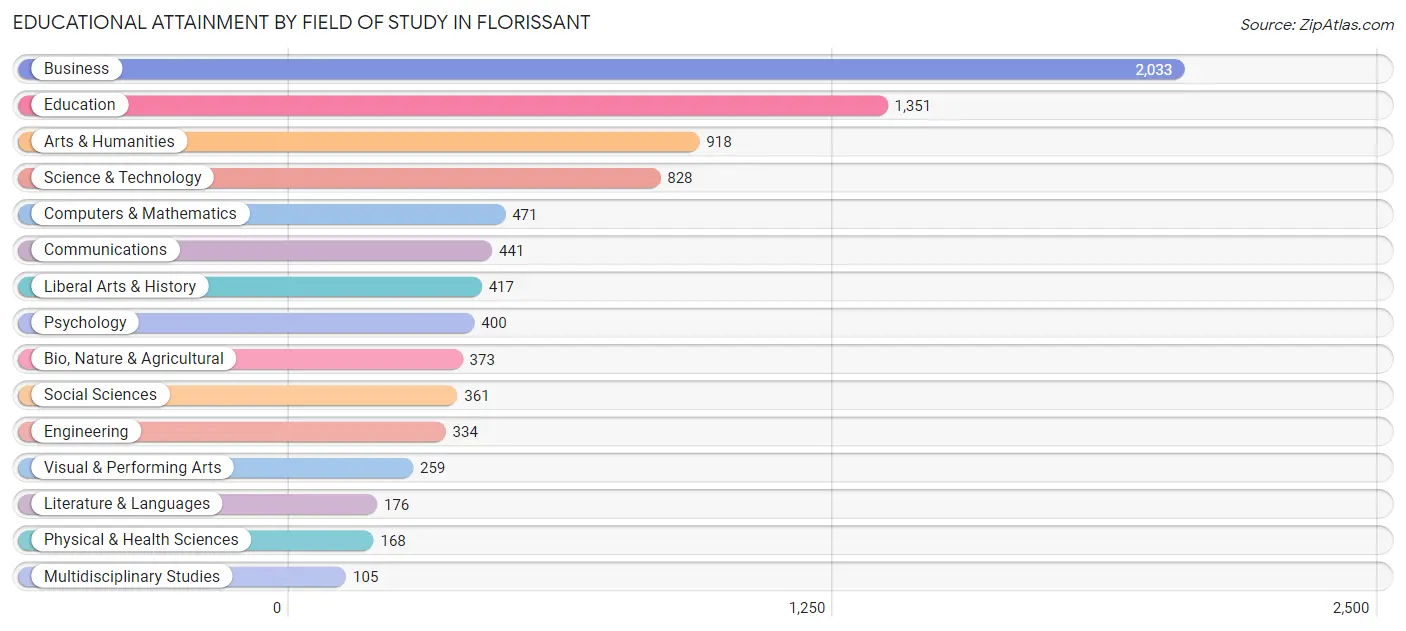
| Field of Study | # Graduates | % Graduates |
| Computers & Mathematics | 471 | 5.4% |
| Bio, Nature & Agricultural | 373 | 4.3% |
| Physical & Health Sciences | 168 | 1.9% |
| Psychology | 400 | 4.6% |
| Social Sciences | 361 | 4.2% |
| Engineering | 334 | 3.9% |
| Multidisciplinary Studies | 105 | 1.2% |
| Science & Technology | 828 | 9.6% |
| Business | 2,033 | 23.5% |
| Education | 1,351 | 15.7% |
| Literature & Languages | 176 | 2.0% |
| Liberal Arts & History | 417 | 4.8% |
| Visual & Performing Arts | 259 | 3.0% |
| Communications | 441 | 5.1% |
| Arts & Humanities | 918 | 10.6% |
| Total | 8,635 | 100.0% |
Transportation & Commute in Florissant
Vehicle Availability by Sex in Florissant
The most prevalent vehicle ownership categories in Florissant are males with 2 vehicles (6,917, accounting for 51.3%) and females with 2 vehicles (6,166, making up 53.8%).
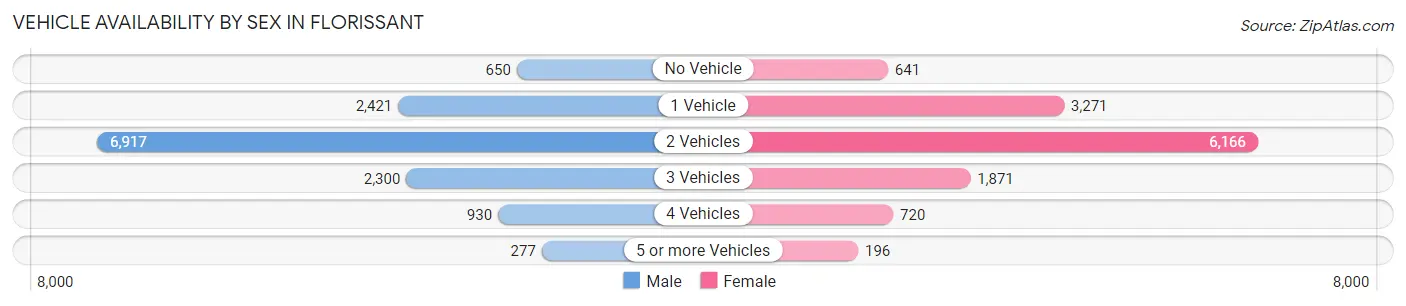
| Vehicles Available | Male | Female |
| No Vehicle | 650 (4.8%) | 641 (5.0%) |
| 1 Vehicle | 2,421 (17.9%) | 3,271 (25.4%) |
| 2 Vehicles | 6,917 (51.3%) | 6,166 (47.9%) |
| 3 Vehicles | 2,300 (17.0%) | 1,871 (14.5%) |
| 4 Vehicles | 930 (6.9%) | 720 (5.6%) |
| 5 or more Vehicles | 277 (2.1%) | 196 (1.5%) |
| Total | 13,495 (100.0%) | 12,865 (100.0%) |
Commute Time in Florissant
The most frequently occuring commute durations in Florissant are 30 to 34 minutes (4,785 commuters, 19.9%), 20 to 24 minutes (3,950 commuters, 16.4%), and 15 to 19 minutes (3,801 commuters, 15.8%).
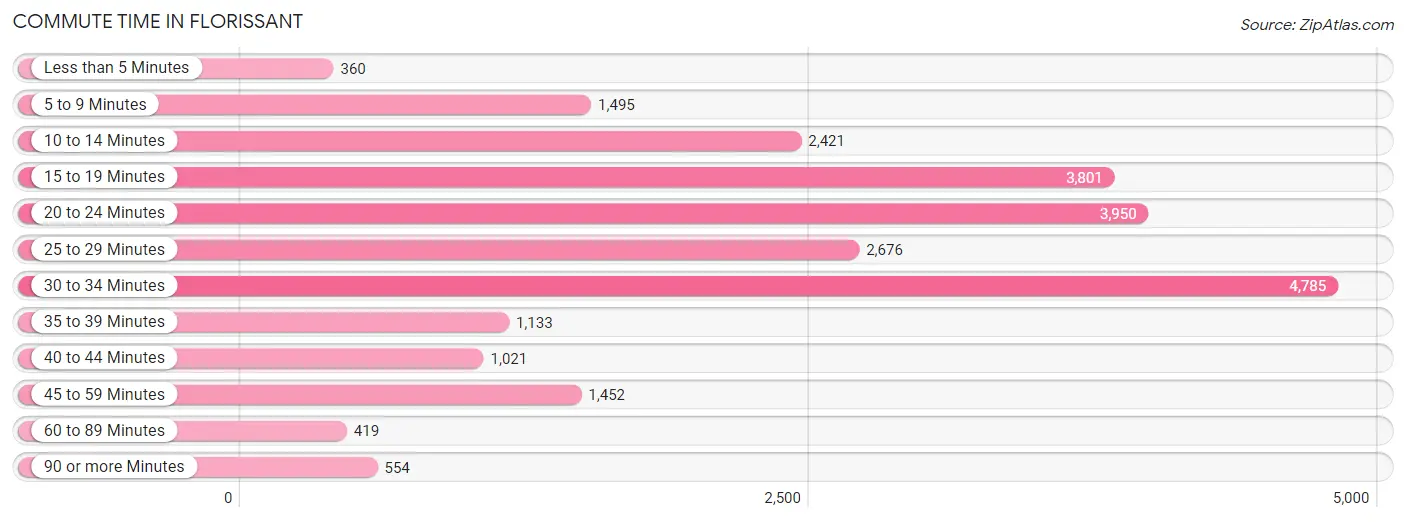
| Commute Time | # Commuters | % Commuters |
| Less than 5 Minutes | 360 | 1.5% |
| 5 to 9 Minutes | 1,495 | 6.2% |
| 10 to 14 Minutes | 2,421 | 10.1% |
| 15 to 19 Minutes | 3,801 | 15.8% |
| 20 to 24 Minutes | 3,950 | 16.4% |
| 25 to 29 Minutes | 2,676 | 11.1% |
| 30 to 34 Minutes | 4,785 | 19.9% |
| 35 to 39 Minutes | 1,133 | 4.7% |
| 40 to 44 Minutes | 1,021 | 4.2% |
| 45 to 59 Minutes | 1,452 | 6.0% |
| 60 to 89 Minutes | 419 | 1.7% |
| 90 or more Minutes | 554 | 2.3% |
Commute Time by Sex in Florissant
The most common commute times in Florissant are 30 to 34 minutes (2,715 commuters, 21.4%) for males and 30 to 34 minutes (2,070 commuters, 18.2%) for females.
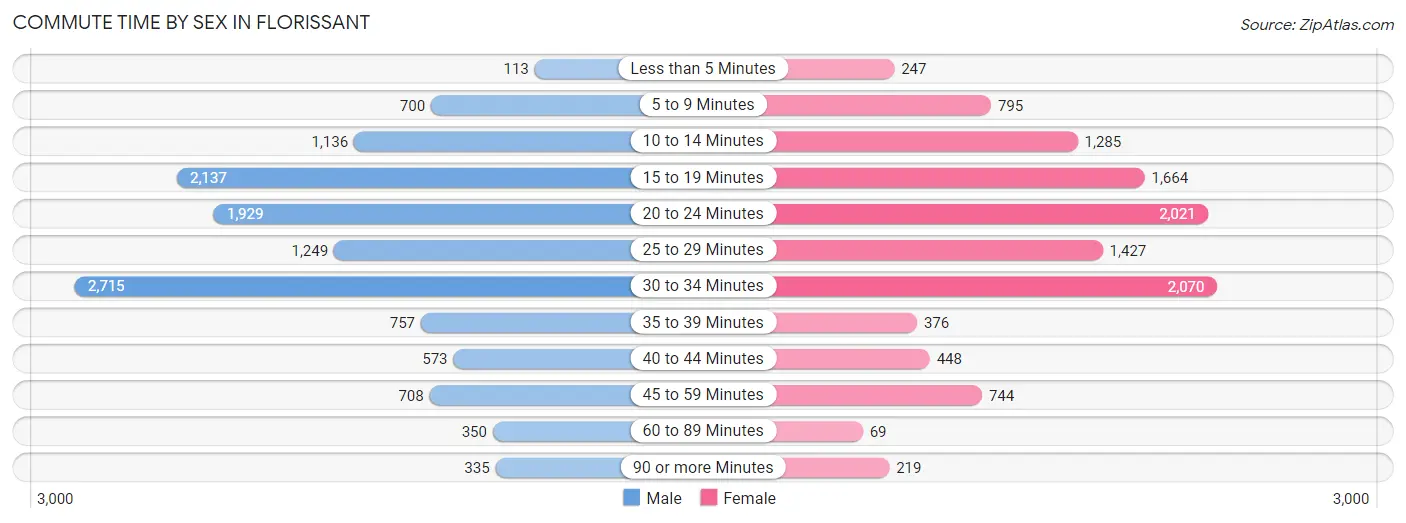
| Commute Time | Male | Female |
| Less than 5 Minutes | 113 (0.9%) | 247 (2.2%) |
| 5 to 9 Minutes | 700 (5.5%) | 795 (7.0%) |
| 10 to 14 Minutes | 1,136 (8.9%) | 1,285 (11.3%) |
| 15 to 19 Minutes | 2,137 (16.8%) | 1,664 (14.6%) |
| 20 to 24 Minutes | 1,929 (15.2%) | 2,021 (17.8%) |
| 25 to 29 Minutes | 1,249 (9.8%) | 1,427 (12.6%) |
| 30 to 34 Minutes | 2,715 (21.4%) | 2,070 (18.2%) |
| 35 to 39 Minutes | 757 (6.0%) | 376 (3.3%) |
| 40 to 44 Minutes | 573 (4.5%) | 448 (3.9%) |
| 45 to 59 Minutes | 708 (5.6%) | 744 (6.6%) |
| 60 to 89 Minutes | 350 (2.8%) | 69 (0.6%) |
| 90 or more Minutes | 335 (2.6%) | 219 (1.9%) |
Time of Departure to Work by Sex in Florissant
The most frequent times of departure to work in Florissant are 7:00 AM to 7:29 AM (1,359, 10.7%) for males and 7:00 AM to 7:29 AM (1,427, 12.6%) for females.
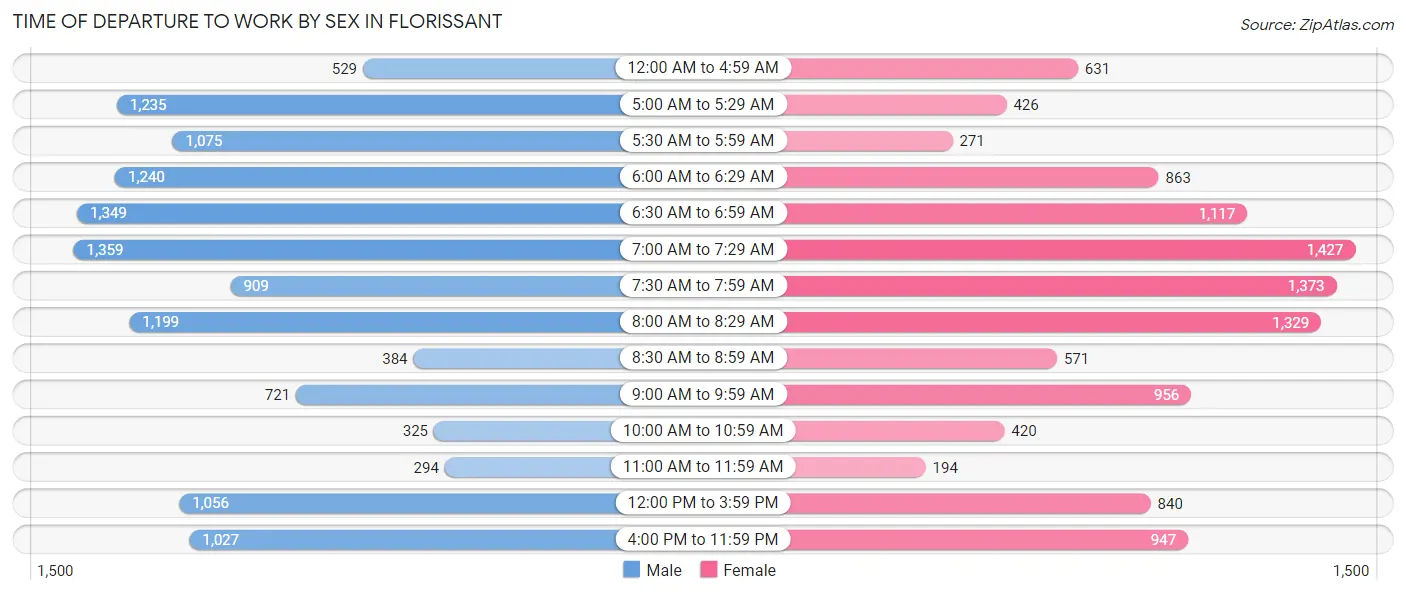
| Time of Departure | Male | Female |
| 12:00 AM to 4:59 AM | 529 (4.2%) | 631 (5.6%) |
| 5:00 AM to 5:29 AM | 1,235 (9.7%) | 426 (3.7%) |
| 5:30 AM to 5:59 AM | 1,075 (8.5%) | 271 (2.4%) |
| 6:00 AM to 6:29 AM | 1,240 (9.8%) | 863 (7.6%) |
| 6:30 AM to 6:59 AM | 1,349 (10.6%) | 1,117 (9.8%) |
| 7:00 AM to 7:29 AM | 1,359 (10.7%) | 1,427 (12.6%) |
| 7:30 AM to 7:59 AM | 909 (7.2%) | 1,373 (12.1%) |
| 8:00 AM to 8:29 AM | 1,199 (9.4%) | 1,329 (11.7%) |
| 8:30 AM to 8:59 AM | 384 (3.0%) | 571 (5.0%) |
| 9:00 AM to 9:59 AM | 721 (5.7%) | 956 (8.4%) |
| 10:00 AM to 10:59 AM | 325 (2.6%) | 420 (3.7%) |
| 11:00 AM to 11:59 AM | 294 (2.3%) | 194 (1.7%) |
| 12:00 PM to 3:59 PM | 1,056 (8.3%) | 840 (7.4%) |
| 4:00 PM to 11:59 PM | 1,027 (8.1%) | 947 (8.3%) |
| Total | 12,702 (100.0%) | 11,365 (100.0%) |
Housing Occupancy in Florissant
Occupancy by Ownership in Florissant
Of the total 20,505 dwellings in Florissant, owner-occupied units account for 13,540 (66.0%), while renter-occupied units make up 6,965 (34.0%).
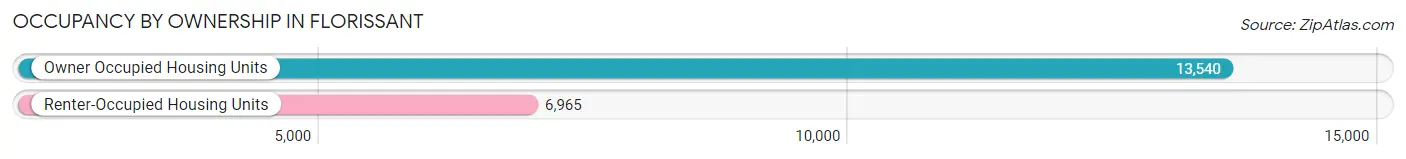
| Occupancy | # Housing Units | % Housing Units |
| Owner Occupied Housing Units | 13,540 | 66.0% |
| Renter-Occupied Housing Units | 6,965 | 34.0% |
| Total Occupied Housing Units | 20,505 | 100.0% |
Occupancy by Household Size in Florissant
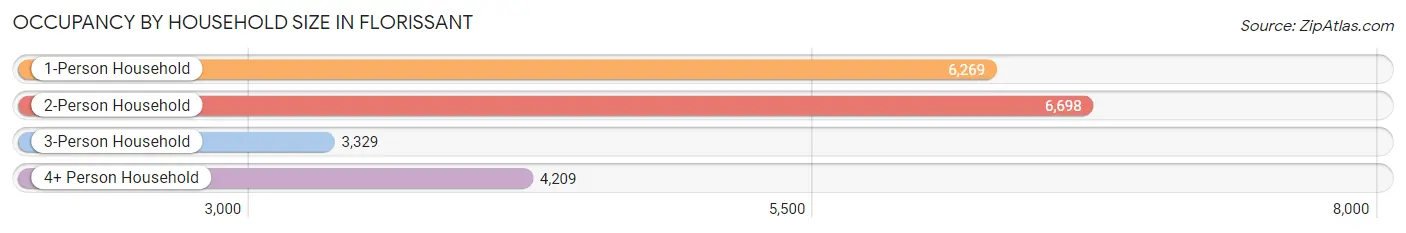
| Household Size | # Housing Units | % Housing Units |
| 1-Person Household | 6,269 | 30.6% |
| 2-Person Household | 6,698 | 32.7% |
| 3-Person Household | 3,329 | 16.2% |
| 4+ Person Household | 4,209 | 20.5% |
| Total Housing Units | 20,505 | 100.0% |
Occupancy by Ownership by Household Size in Florissant
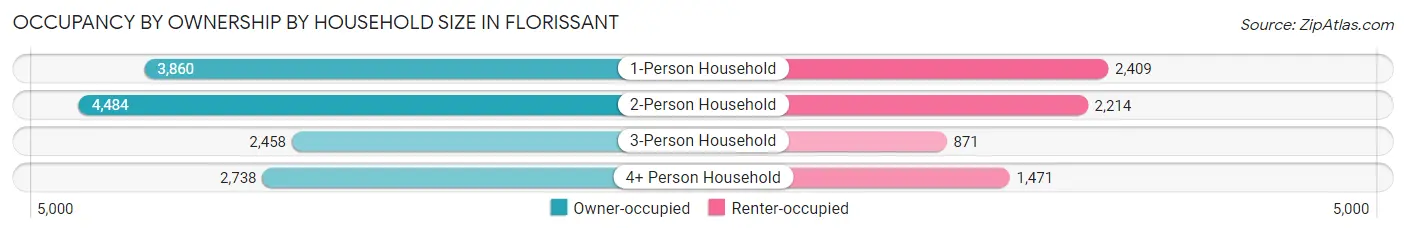
| Household Size | Owner-occupied | Renter-occupied |
| 1-Person Household | 3,860 (61.6%) | 2,409 (38.4%) |
| 2-Person Household | 4,484 (66.9%) | 2,214 (33.1%) |
| 3-Person Household | 2,458 (73.8%) | 871 (26.2%) |
| 4+ Person Household | 2,738 (65.0%) | 1,471 (34.9%) |
| Total Housing Units | 13,540 (66.0%) | 6,965 (34.0%) |
Occupancy by Educational Attainment in Florissant
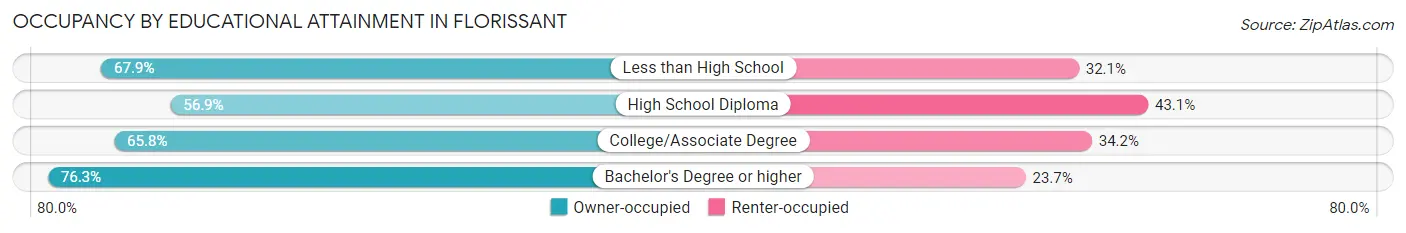
| Household Size | Owner-occupied | Renter-occupied |
| Less than High School | 813 (67.9%) | 385 (32.1%) |
| High School Diploma | 3,328 (56.9%) | 2,523 (43.1%) |
| College/Associate Degree | 5,446 (65.8%) | 2,830 (34.2%) |
| Bachelor's Degree or higher | 3,953 (76.3%) | 1,227 (23.7%) |
Occupancy by Age of Householder in Florissant
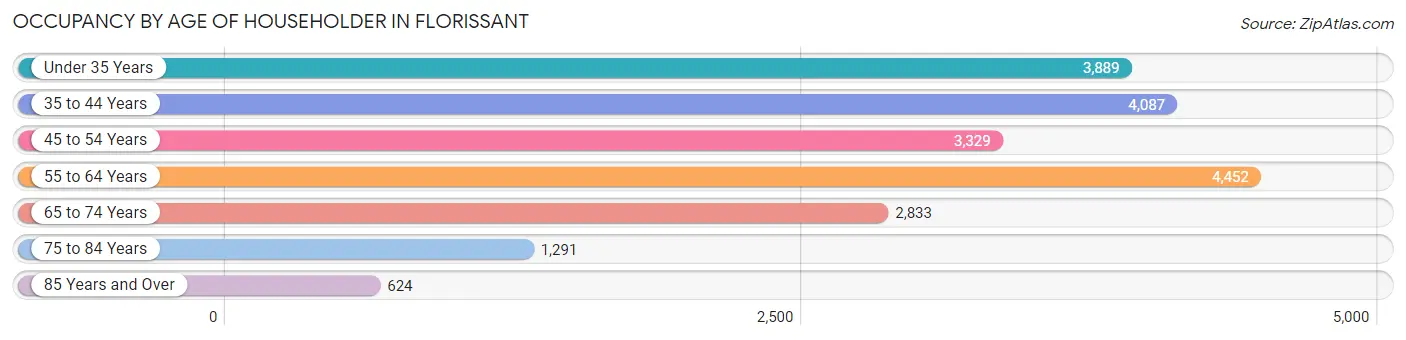
| Age Bracket | # Households | % Households |
| Under 35 Years | 3,889 | 19.0% |
| 35 to 44 Years | 4,087 | 19.9% |
| 45 to 54 Years | 3,329 | 16.2% |
| 55 to 64 Years | 4,452 | 21.7% |
| 65 to 74 Years | 2,833 | 13.8% |
| 75 to 84 Years | 1,291 | 6.3% |
| 85 Years and Over | 624 | 3.0% |
| Total | 20,505 | 100.0% |
Housing Finances in Florissant
Median Income by Occupancy in Florissant
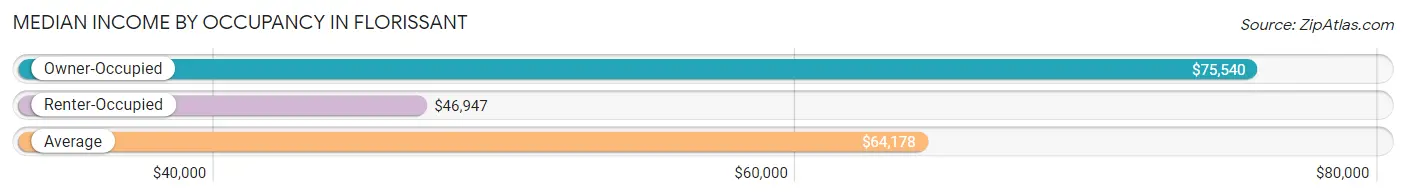
| Occupancy Type | # Households | Median Income |
| Owner-Occupied | 13,540 (66.0%) | $75,540 |
| Renter-Occupied | 6,965 (34.0%) | $46,947 |
| Average | 20,505 (100.0%) | $64,178 |
Occupancy by Householder Income Bracket in Florissant
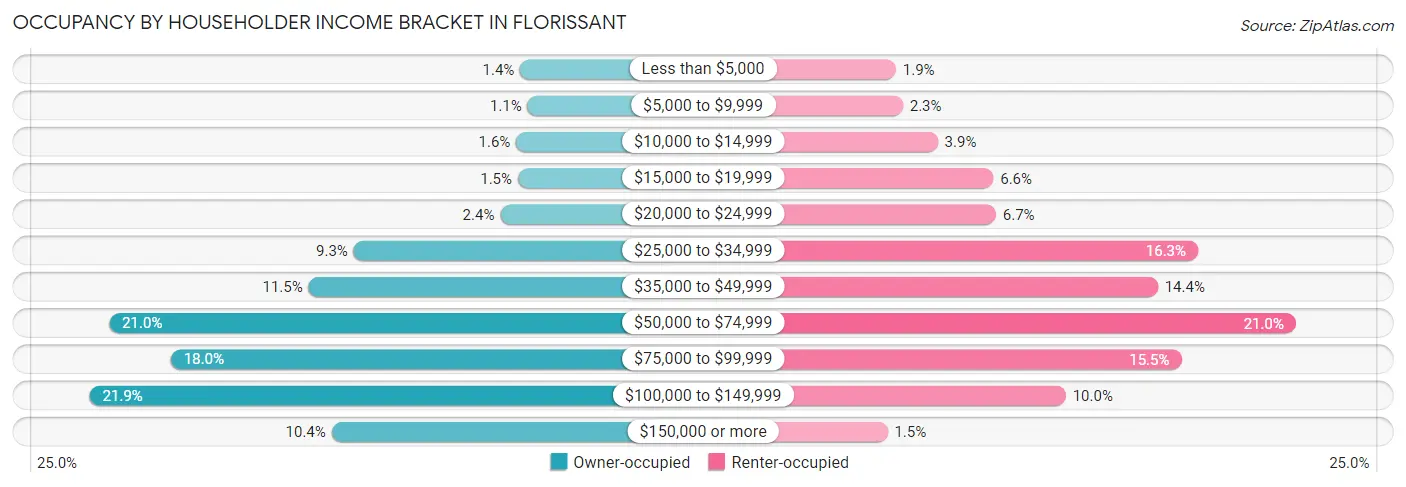
| Income Bracket | Owner-occupied | Renter-occupied |
| Less than $5,000 | 190 (1.4%) | 134 (1.9%) |
| $5,000 to $9,999 | 142 (1.1%) | 157 (2.2%) |
| $10,000 to $14,999 | 215 (1.6%) | 272 (3.9%) |
| $15,000 to $19,999 | 204 (1.5%) | 457 (6.6%) |
| $20,000 to $24,999 | 318 (2.4%) | 465 (6.7%) |
| $25,000 to $34,999 | 1,263 (9.3%) | 1,135 (16.3%) |
| $35,000 to $49,999 | 1,554 (11.5%) | 1,002 (14.4%) |
| $50,000 to $74,999 | 2,841 (21.0%) | 1,460 (21.0%) |
| $75,000 to $99,999 | 2,442 (18.0%) | 1,080 (15.5%) |
| $100,000 to $149,999 | 2,966 (21.9%) | 697 (10.0%) |
| $150,000 or more | 1,405 (10.4%) | 106 (1.5%) |
| Total | 13,540 (100.0%) | 6,965 (100.0%) |
Monthly Housing Cost Tiers in Florissant
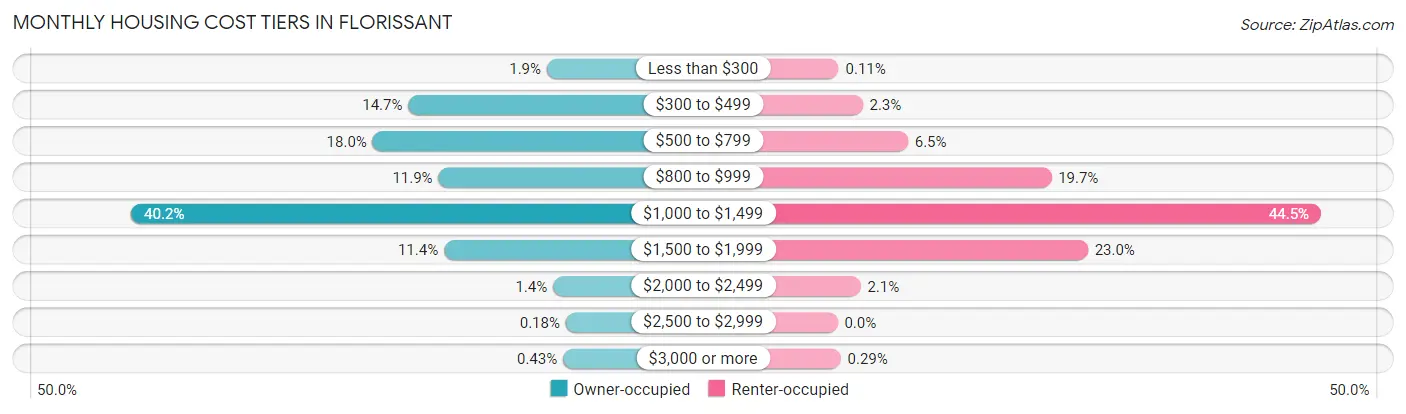
| Monthly Cost | Owner-occupied | Renter-occupied |
| Less than $300 | 260 (1.9%) | 8 (0.1%) |
| $300 to $499 | 1,987 (14.7%) | 161 (2.3%) |
| $500 to $799 | 2,432 (18.0%) | 451 (6.5%) |
| $800 to $999 | 1,611 (11.9%) | 1,371 (19.7%) |
| $1,000 to $1,499 | 5,442 (40.2%) | 3,100 (44.5%) |
| $1,500 to $1,999 | 1,542 (11.4%) | 1,605 (23.0%) |
| $2,000 to $2,499 | 183 (1.3%) | 148 (2.1%) |
| $2,500 to $2,999 | 25 (0.2%) | 0 (0.0%) |
| $3,000 or more | 58 (0.4%) | 20 (0.3%) |
| Total | 13,540 (100.0%) | 6,965 (100.0%) |
Physical Housing Characteristics in Florissant
Housing Structures in Florissant
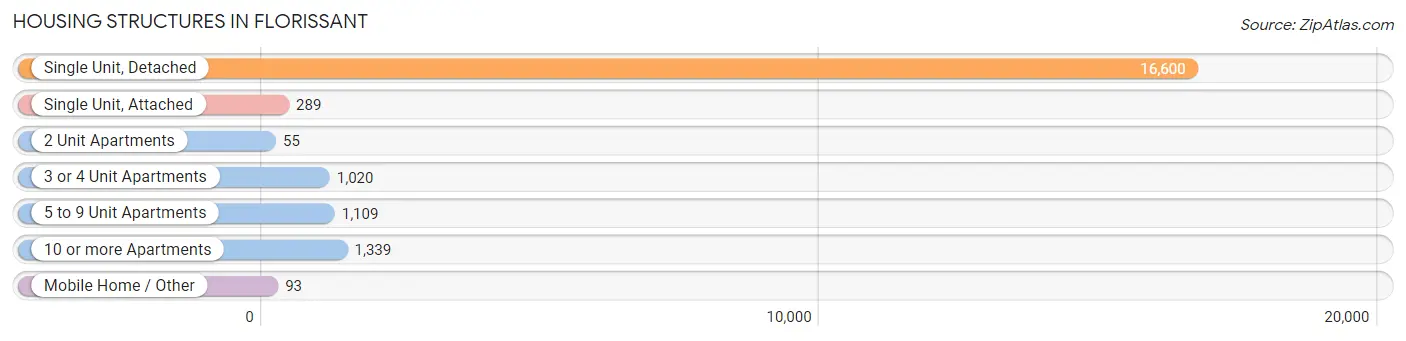
| Structure Type | # Housing Units | % Housing Units |
| Single Unit, Detached | 16,600 | 81.0% |
| Single Unit, Attached | 289 | 1.4% |
| 2 Unit Apartments | 55 | 0.3% |
| 3 or 4 Unit Apartments | 1,020 | 5.0% |
| 5 to 9 Unit Apartments | 1,109 | 5.4% |
| 10 or more Apartments | 1,339 | 6.5% |
| Mobile Home / Other | 93 | 0.4% |
| Total | 20,505 | 100.0% |
Housing Structures by Occupancy in Florissant
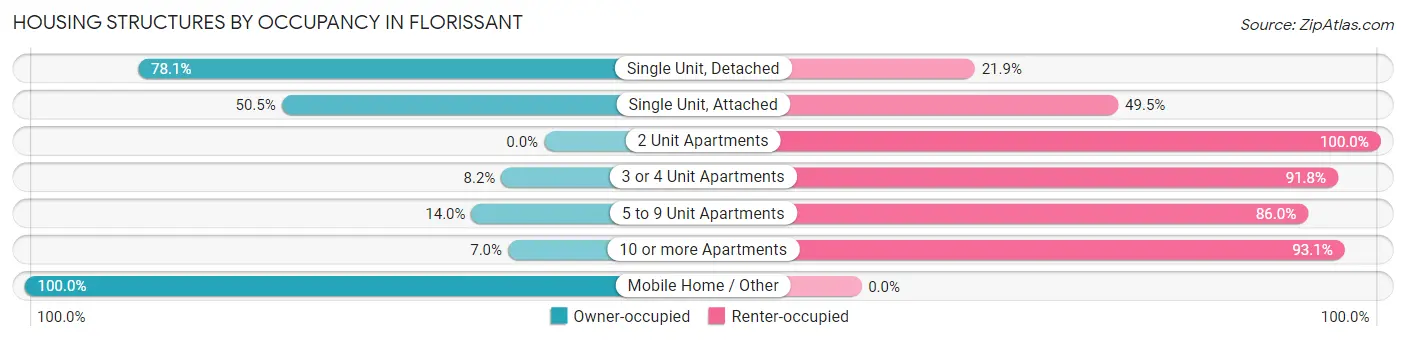
| Structure Type | Owner-occupied | Renter-occupied |
| Single Unit, Detached | 12,969 (78.1%) | 3,631 (21.9%) |
| Single Unit, Attached | 146 (50.5%) | 143 (49.5%) |
| 2 Unit Apartments | 0 (0.0%) | 55 (100.0%) |
| 3 or 4 Unit Apartments | 84 (8.2%) | 936 (91.8%) |
| 5 to 9 Unit Apartments | 155 (14.0%) | 954 (86.0%) |
| 10 or more Apartments | 93 (7.0%) | 1,246 (93.0%) |
| Mobile Home / Other | 93 (100.0%) | 0 (0.0%) |
| Total | 13,540 (66.0%) | 6,965 (34.0%) |
Housing Structures by Number of Rooms in Florissant
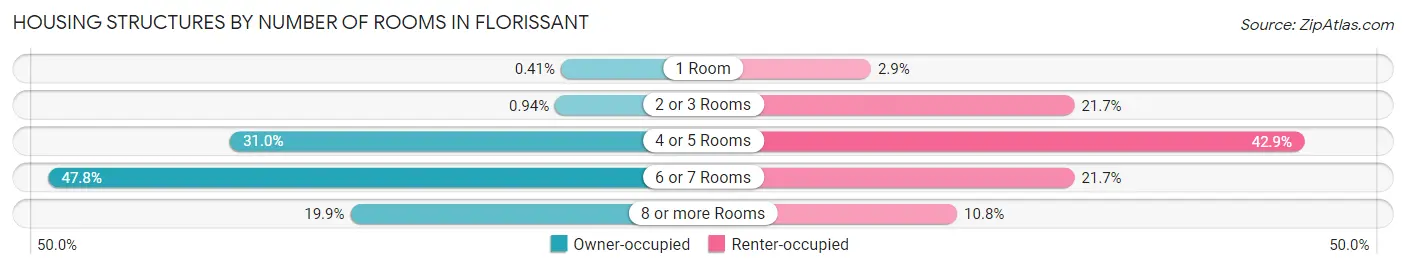
| Number of Rooms | Owner-occupied | Renter-occupied |
| 1 Room | 55 (0.4%) | 200 (2.9%) |
| 2 or 3 Rooms | 127 (0.9%) | 1,511 (21.7%) |
| 4 or 5 Rooms | 4,197 (31.0%) | 2,988 (42.9%) |
| 6 or 7 Rooms | 6,469 (47.8%) | 1,511 (21.7%) |
| 8 or more Rooms | 2,692 (19.9%) | 755 (10.8%) |
| Total | 13,540 (100.0%) | 6,965 (100.0%) |
Housing Structure by Heating Type in Florissant
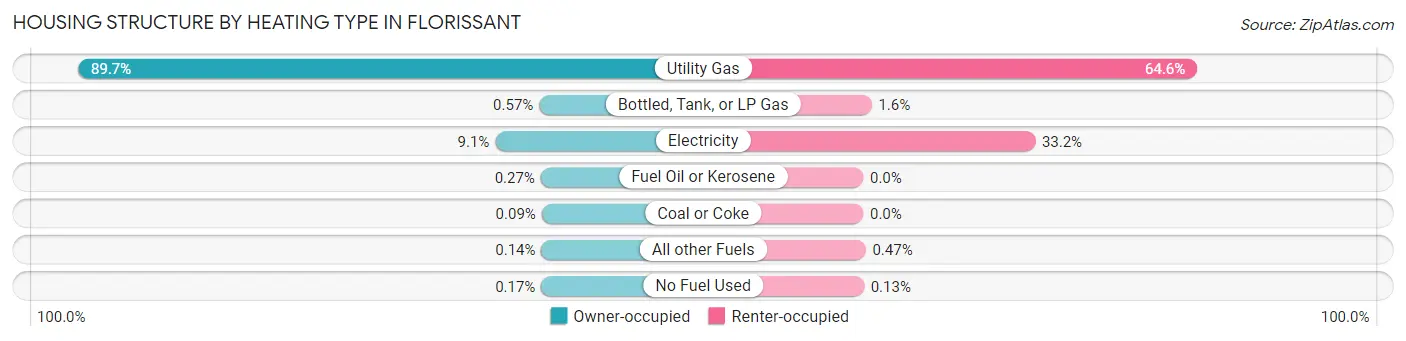
| Heating Type | Owner-occupied | Renter-occupied |
| Utility Gas | 12,145 (89.7%) | 4,496 (64.5%) |
| Bottled, Tank, or LP Gas | 77 (0.6%) | 113 (1.6%) |
| Electricity | 1,227 (9.1%) | 2,314 (33.2%) |
| Fuel Oil or Kerosene | 37 (0.3%) | 0 (0.0%) |
| Coal or Coke | 12 (0.1%) | 0 (0.0%) |
| All other Fuels | 19 (0.1%) | 33 (0.5%) |
| No Fuel Used | 23 (0.2%) | 9 (0.1%) |
| Total | 13,540 (100.0%) | 6,965 (100.0%) |
Household Vehicle Usage in Florissant
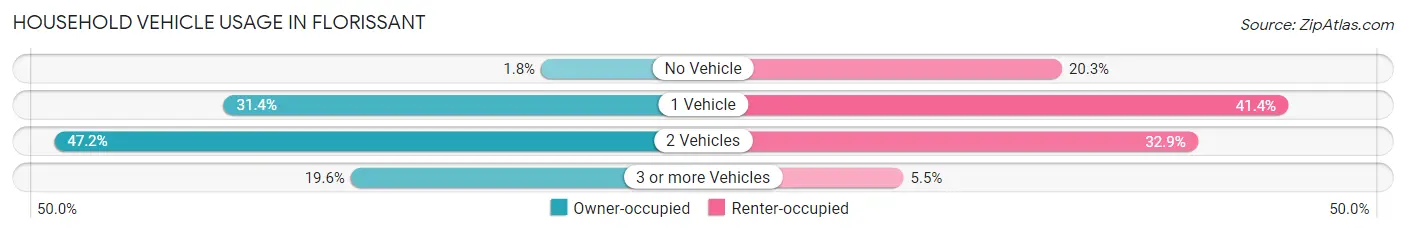
| Vehicles per Household | Owner-occupied | Renter-occupied |
| No Vehicle | 244 (1.8%) | 1,411 (20.3%) |
| 1 Vehicle | 4,254 (31.4%) | 2,880 (41.3%) |
| 2 Vehicles | 6,393 (47.2%) | 2,292 (32.9%) |
| 3 or more Vehicles | 2,649 (19.6%) | 382 (5.5%) |
| Total | 13,540 (100.0%) | 6,965 (100.0%) |
Real Estate & Mortgages in Florissant
Real Estate and Mortgage Overview in Florissant
| Characteristic | Without Mortgage | With Mortgage |
| Housing Units | 4,028 | 9,512 |
| Median Property Value | $118,600 | $128,300 |
| Median Household Income | $68,977 | $1,037 |
| Monthly Housing Costs | $492 | $58 |
| Real Estate Taxes | $1,923 | $281 |
Property Value by Mortgage Status in Florissant
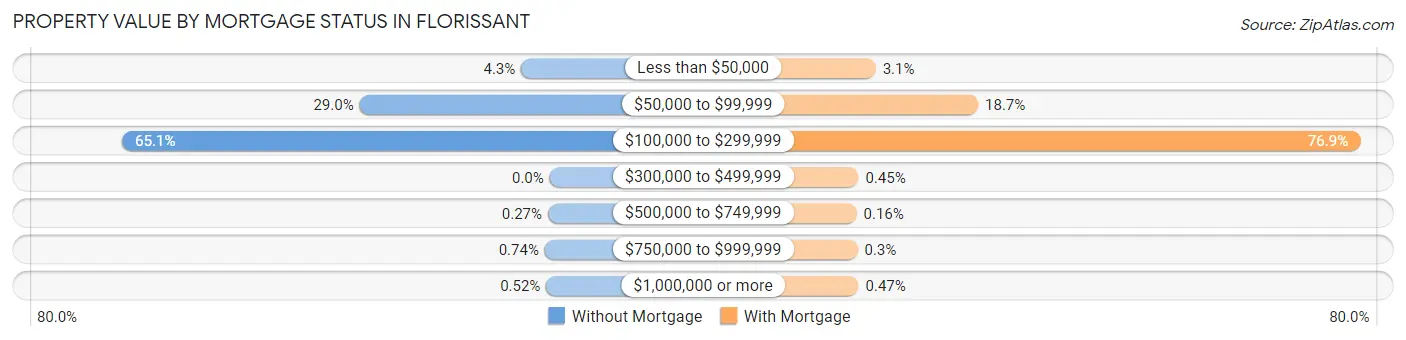
| Property Value | Without Mortgage | With Mortgage |
| Less than $50,000 | 175 (4.3%) | 292 (3.1%) |
| $50,000 to $99,999 | 1,167 (29.0%) | 1,777 (18.7%) |
| $100,000 to $299,999 | 2,624 (65.1%) | 7,311 (76.9%) |
| $300,000 to $499,999 | 0 (0.0%) | 43 (0.4%) |
| $500,000 to $749,999 | 11 (0.3%) | 15 (0.2%) |
| $750,000 to $999,999 | 30 (0.7%) | 29 (0.3%) |
| $1,000,000 or more | 21 (0.5%) | 45 (0.5%) |
| Total | 4,028 (100.0%) | 9,512 (100.0%) |
Household Income by Mortgage Status in Florissant
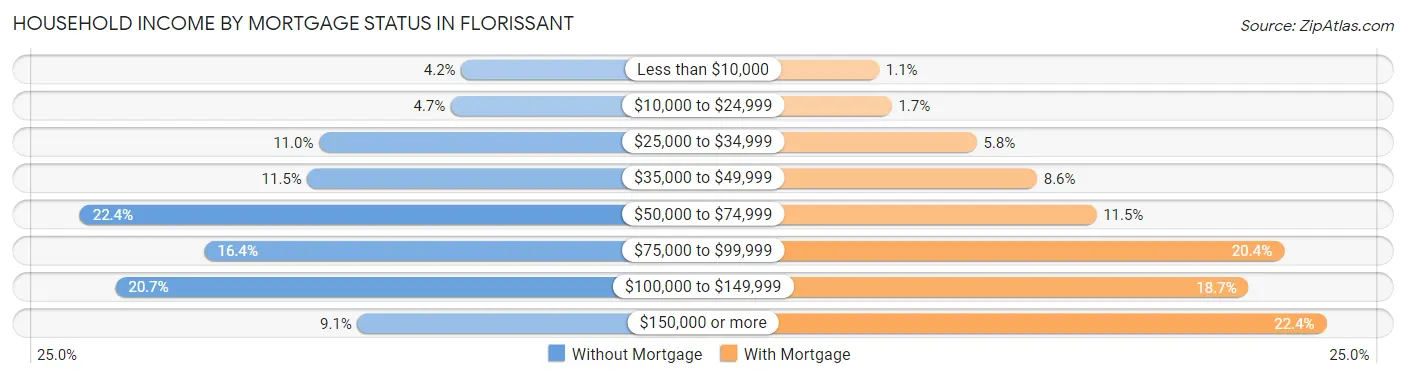
| Household Income | Without Mortgage | With Mortgage |
| Less than $10,000 | 169 (4.2%) | 106 (1.1%) |
| $10,000 to $24,999 | 189 (4.7%) | 163 (1.7%) |
| $25,000 to $34,999 | 442 (11.0%) | 548 (5.8%) |
| $35,000 to $49,999 | 464 (11.5%) | 821 (8.6%) |
| $50,000 to $74,999 | 901 (22.4%) | 1,090 (11.5%) |
| $75,000 to $99,999 | 662 (16.4%) | 1,940 (20.4%) |
| $100,000 to $149,999 | 833 (20.7%) | 1,780 (18.7%) |
| $150,000 or more | 368 (9.1%) | 2,133 (22.4%) |
| Total | 4,028 (100.0%) | 9,512 (100.0%) |
Property Value to Household Income Ratio in Florissant
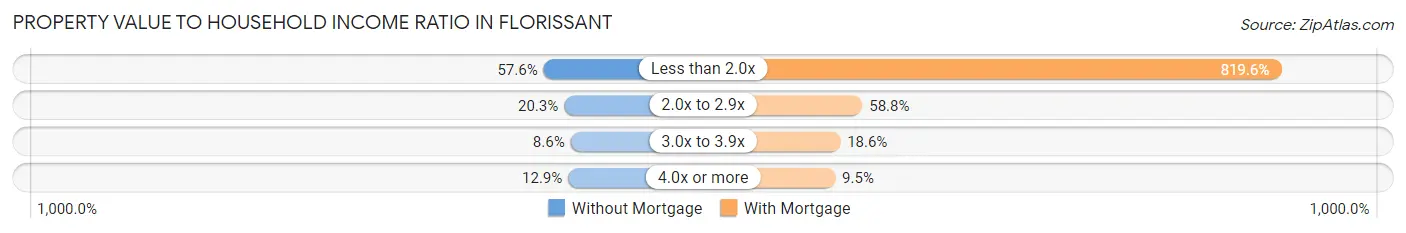
| Value-to-Income Ratio | Without Mortgage | With Mortgage |
| Less than 2.0x | 2,321 (57.6%) | 77,956 (819.5%) |
| 2.0x to 2.9x | 817 (20.3%) | 5,595 (58.8%) |
| 3.0x to 3.9x | 347 (8.6%) | 1,773 (18.6%) |
| 4.0x or more | 519 (12.9%) | 907 (9.5%) |
| Total | 4,028 (100.0%) | 9,512 (100.0%) |
Real Estate Taxes by Mortgage Status in Florissant
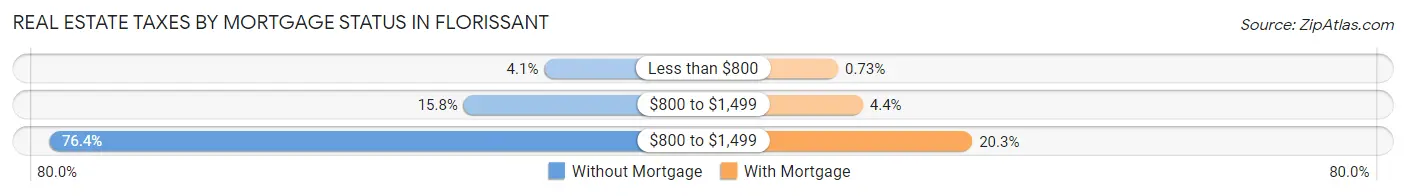
| Property Taxes | Without Mortgage | With Mortgage |
| Less than $800 | 164 (4.1%) | 69 (0.7%) |
| $800 to $1,499 | 638 (15.8%) | 414 (4.3%) |
| $800 to $1,499 | 3,079 (76.4%) | 1,935 (20.3%) |
| Total | 4,028 (100.0%) | 9,512 (100.0%) |
Health & Disability in Florissant
Health Insurance Coverage by Age in Florissant
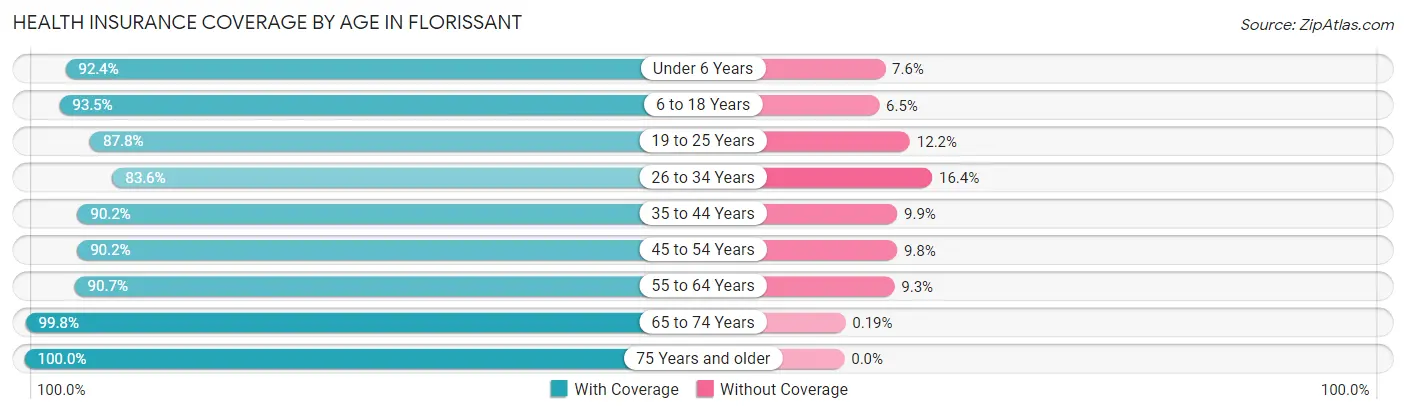
| Age Bracket | With Coverage | Without Coverage |
| Under 6 Years | 3,024 (92.4%) | 249 (7.6%) |
| 6 to 18 Years | 8,563 (93.5%) | 594 (6.5%) |
| 19 to 25 Years | 4,113 (87.8%) | 573 (12.2%) |
| 26 to 34 Years | 6,170 (83.6%) | 1,208 (16.4%) |
| 35 to 44 Years | 6,351 (90.1%) | 694 (9.9%) |
| 45 to 54 Years | 5,136 (90.2%) | 559 (9.8%) |
| 55 to 64 Years | 6,563 (90.7%) | 676 (9.3%) |
| 65 to 74 Years | 4,160 (99.8%) | 8 (0.2%) |
| 75 Years and older | 2,898 (100.0%) | 0 (0.0%) |
| Total | 46,978 (91.1%) | 4,561 (8.8%) |
Health Insurance Coverage by Citizenship Status in Florissant
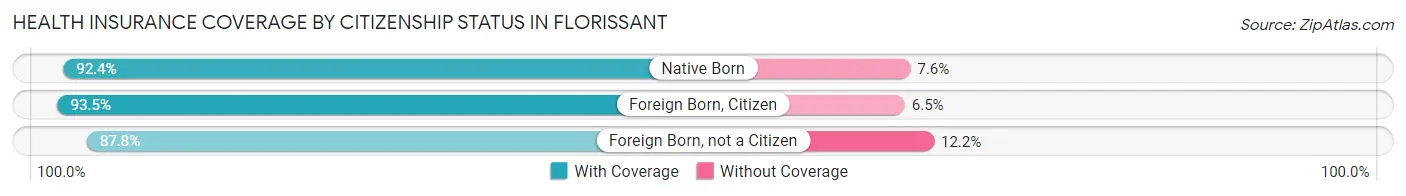
| Citizenship Status | With Coverage | Without Coverage |
| Native Born | 3,024 (92.4%) | 249 (7.6%) |
| Foreign Born, Citizen | 8,563 (93.5%) | 594 (6.5%) |
| Foreign Born, not a Citizen | 4,113 (87.8%) | 573 (12.2%) |
Health Insurance Coverage by Household Income in Florissant
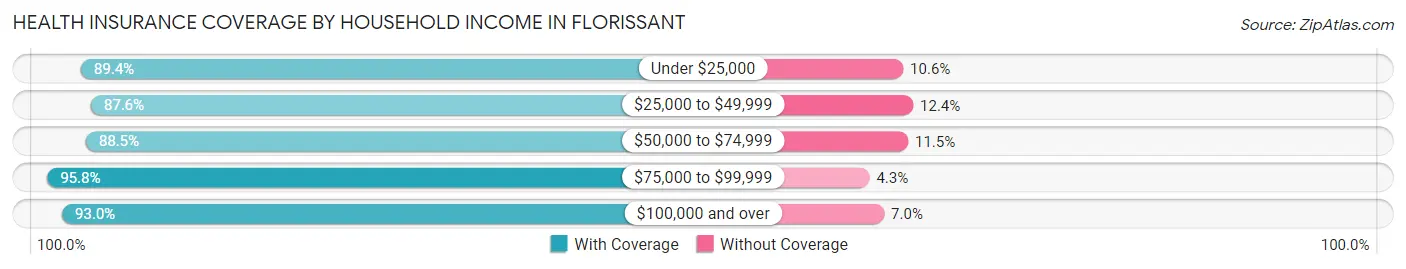
| Household Income | With Coverage | Without Coverage |
| Under $25,000 | 3,760 (89.4%) | 444 (10.6%) |
| $25,000 to $49,999 | 9,070 (87.6%) | 1,286 (12.4%) |
| $50,000 to $74,999 | 9,552 (88.5%) | 1,237 (11.5%) |
| $75,000 to $99,999 | 8,397 (95.8%) | 373 (4.3%) |
| $100,000 and over | 16,028 (93.0%) | 1,206 (7.0%) |
Public vs Private Health Insurance Coverage by Age in Florissant
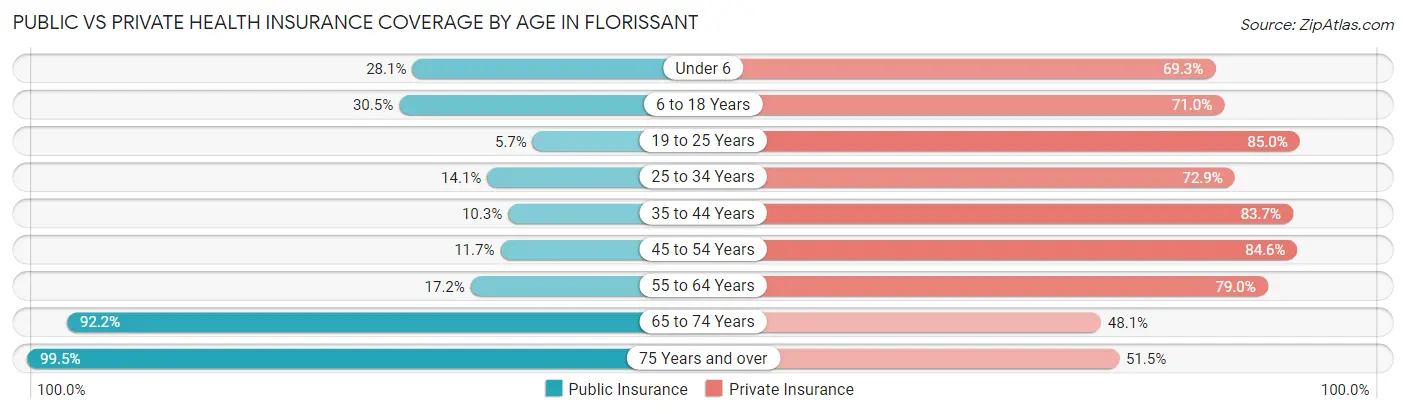
| Age Bracket | Public Insurance | Private Insurance |
| Under 6 | 918 (28.1%) | 2,268 (69.3%) |
| 6 to 18 Years | 2,794 (30.5%) | 6,497 (71.0%) |
| 19 to 25 Years | 268 (5.7%) | 3,982 (85.0%) |
| 25 to 34 Years | 1,043 (14.1%) | 5,379 (72.9%) |
| 35 to 44 Years | 724 (10.3%) | 5,896 (83.7%) |
| 45 to 54 Years | 667 (11.7%) | 4,815 (84.6%) |
| 55 to 64 Years | 1,246 (17.2%) | 5,721 (79.0%) |
| 65 to 74 Years | 3,841 (92.1%) | 2,005 (48.1%) |
| 75 Years and over | 2,884 (99.5%) | 1,491 (51.4%) |
| Total | 14,385 (27.9%) | 38,054 (73.8%) |
Disability Status by Sex by Age in Florissant
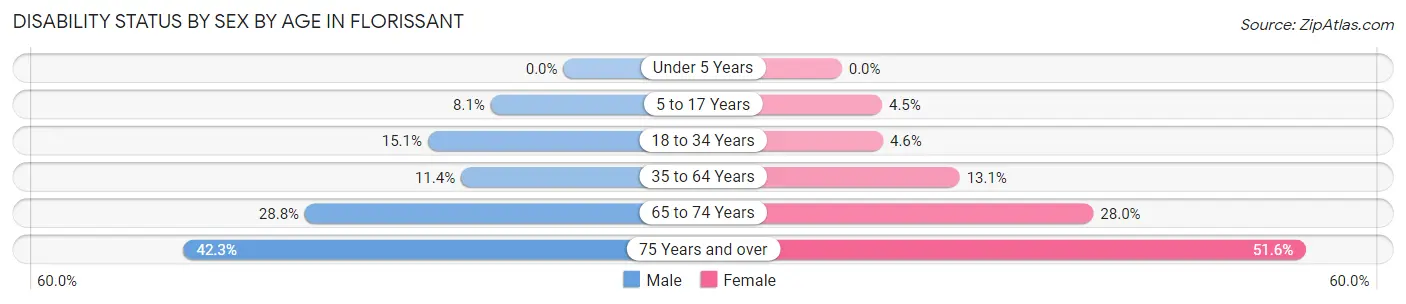
| Age Bracket | Male | Female |
| Under 5 Years | 0 (0.0%) | 0 (0.0%) |
| 5 to 17 Years | 364 (8.1%) | 210 (4.5%) |
| 18 to 34 Years | 991 (15.1%) | 280 (4.6%) |
| 35 to 64 Years | 1,073 (11.4%) | 1,387 (13.1%) |
| 65 to 74 Years | 539 (28.8%) | 643 (28.0%) |
| 75 Years and over | 518 (42.3%) | 863 (51.6%) |
Disability Class by Sex by Age in Florissant
Disability Class: Hearing Difficulty
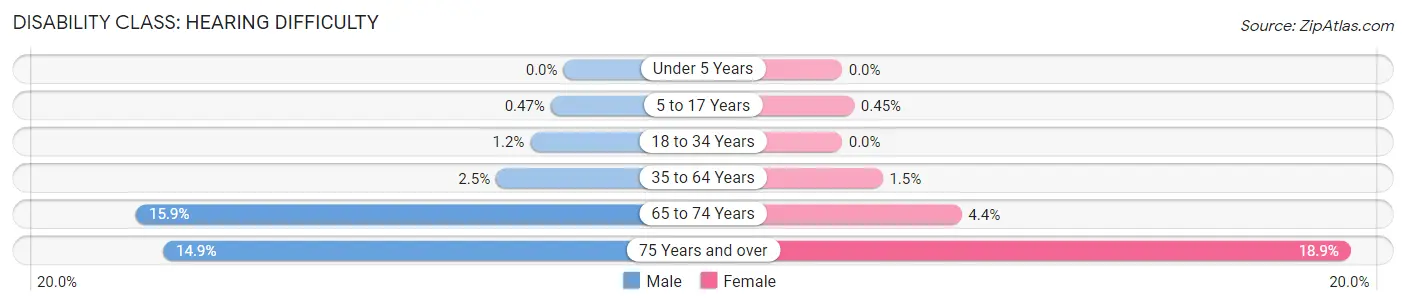
| Age Bracket | Male | Female |
| Under 5 Years | 0 (0.0%) | 0 (0.0%) |
| 5 to 17 Years | 21 (0.5%) | 21 (0.4%) |
| 18 to 34 Years | 81 (1.2%) | 0 (0.0%) |
| 35 to 64 Years | 235 (2.5%) | 160 (1.5%) |
| 65 to 74 Years | 297 (15.9%) | 102 (4.4%) |
| 75 Years and over | 182 (14.9%) | 316 (18.9%) |
Disability Class: Vision Difficulty
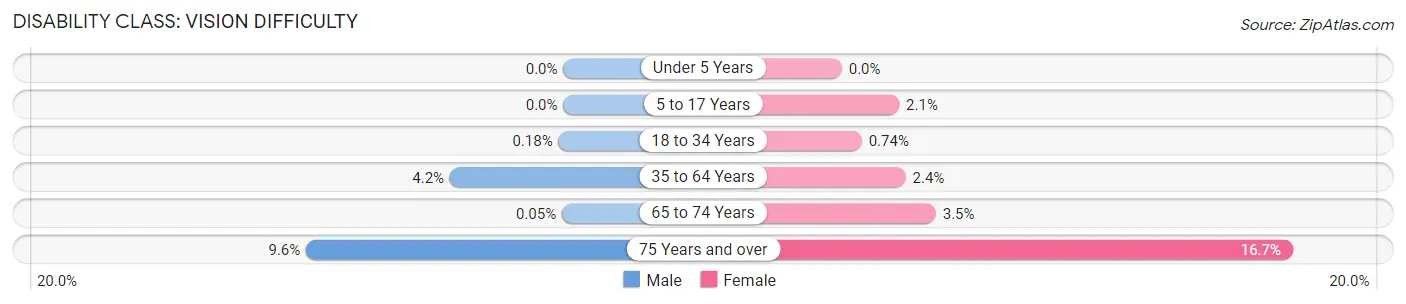
| Age Bracket | Male | Female |
| Under 5 Years | 0 (0.0%) | 0 (0.0%) |
| 5 to 17 Years | 0 (0.0%) | 100 (2.1%) |
| 18 to 34 Years | 12 (0.2%) | 45 (0.7%) |
| 35 to 64 Years | 396 (4.2%) | 250 (2.4%) |
| 65 to 74 Years | 1 (0.1%) | 80 (3.5%) |
| 75 Years and over | 117 (9.6%) | 280 (16.7%) |
Disability Class: Cognitive Difficulty
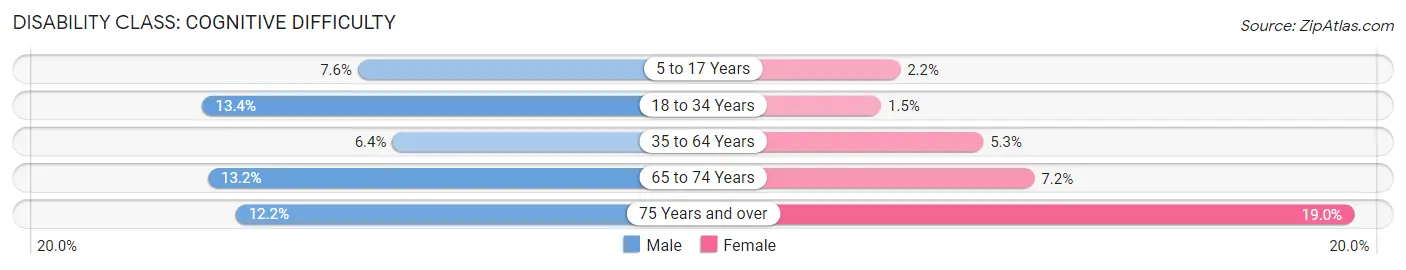
| Age Bracket | Male | Female |
| 5 to 17 Years | 343 (7.6%) | 102 (2.2%) |
| 18 to 34 Years | 879 (13.4%) | 89 (1.5%) |
| 35 to 64 Years | 598 (6.4%) | 555 (5.2%) |
| 65 to 74 Years | 247 (13.2%) | 164 (7.1%) |
| 75 Years and over | 149 (12.2%) | 318 (19.0%) |
Disability Class: Ambulatory Difficulty
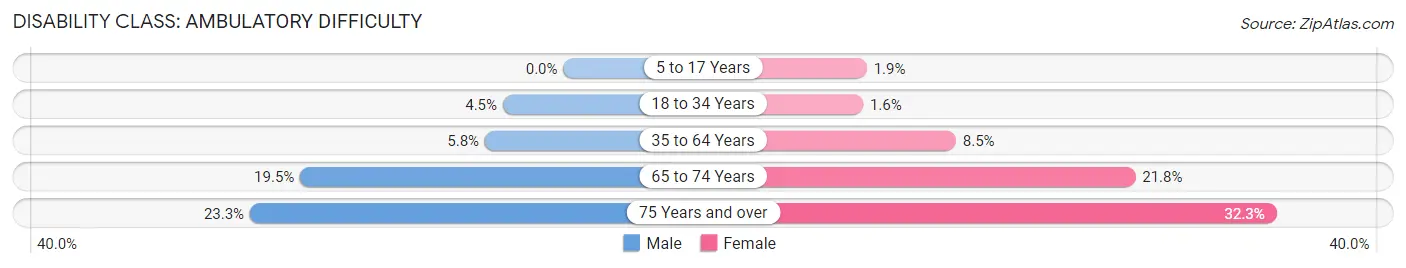
| Age Bracket | Male | Female |
| 5 to 17 Years | 0 (0.0%) | 87 (1.8%) |
| 18 to 34 Years | 295 (4.5%) | 96 (1.6%) |
| 35 to 64 Years | 548 (5.8%) | 895 (8.5%) |
| 65 to 74 Years | 366 (19.5%) | 500 (21.8%) |
| 75 Years and over | 285 (23.3%) | 540 (32.3%) |
Disability Class: Self-Care Difficulty
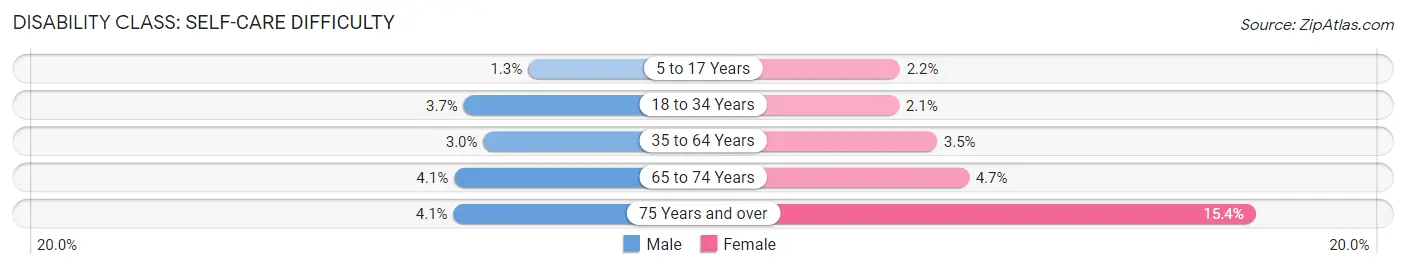
| Age Bracket | Male | Female |
| 5 to 17 Years | 59 (1.3%) | 101 (2.1%) |
| 18 to 34 Years | 243 (3.7%) | 129 (2.1%) |
| 35 to 64 Years | 280 (3.0%) | 373 (3.5%) |
| 65 to 74 Years | 76 (4.1%) | 108 (4.7%) |
| 75 Years and over | 50 (4.1%) | 257 (15.4%) |
Technology Access in Florissant
Computing Device Access in Florissant
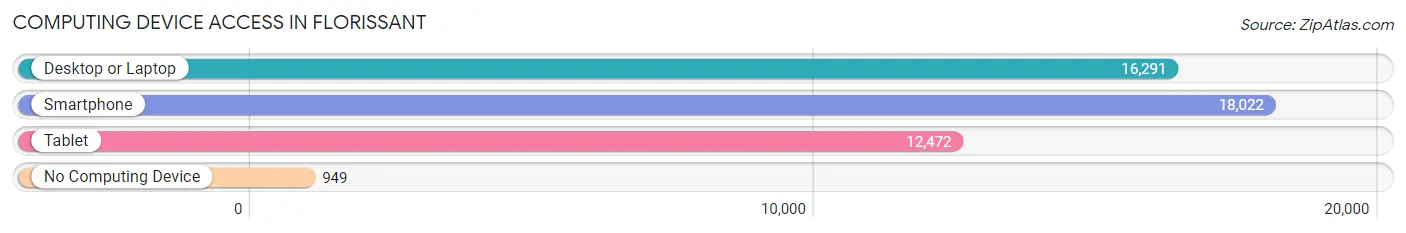
| Device Type | # Households | % Households |
| Desktop or Laptop | 16,291 | 79.4% |
| Smartphone | 18,022 | 87.9% |
| Tablet | 12,472 | 60.8% |
| No Computing Device | 949 | 4.6% |
| Total | 20,505 | 100.0% |
Internet Access in Florissant
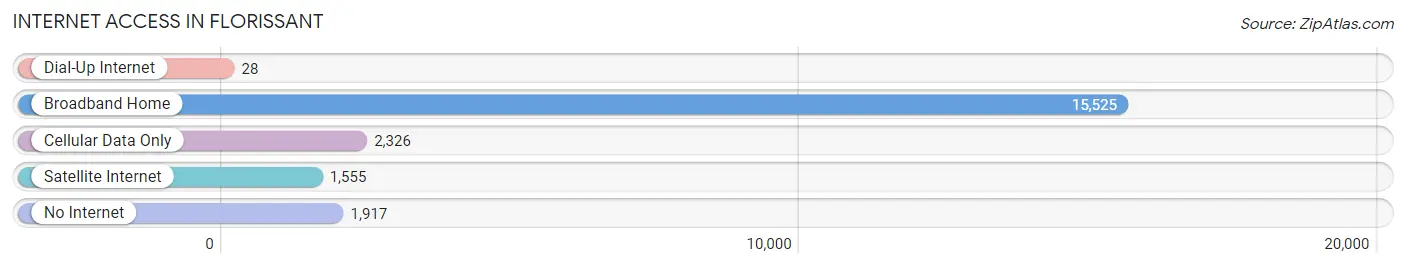
| Internet Type | # Households | % Households |
| Dial-Up Internet | 28 | 0.1% |
| Broadband Home | 15,525 | 75.7% |
| Cellular Data Only | 2,326 | 11.3% |
| Satellite Internet | 1,555 | 7.6% |
| No Internet | 1,917 | 9.3% |
| Total | 20,505 | 100.0% |
Florissant Summary
Flourissant, Missouri is a city located in St. Louis County, Missouri, United States. The city is a suburb of St. Louis and is part of the Greater St. Louis metropolitan area. The population of Flourissant was 52,158 at the 2010 census, making it the third-largest city in St. Louis County.
History
Flourissant was founded in 1786 by French settlers who named the area after the nearby Flourissant Valley. The area was originally a farming community, but in the late 19th century, the city began to grow as a suburb of St. Louis. The city was incorporated in 1855 and was home to a variety of industries, including a brickyard, a brewery, and a glass factory.
In the early 20th century, Flourissant was a popular destination for African Americans who were looking for a place to escape the racial segregation of St. Louis. The city was home to a number of African American businesses, churches, and organizations.
In the 1950s, Flourissant began to experience rapid growth as a result of the suburbanization of St. Louis. The city was home to a number of new housing developments and shopping centers.
Geography
Flourissant is located in St. Louis County, Missouri, United States. The city is located in the northern part of the county, about 15 miles northwest of downtown St. Louis. The city is bordered by the cities of Hazelwood to the north, Ferguson to the east, and Jennings to the south.
The city has a total area of 8.3 square miles, all of which is land. The city is located in the Missouri River Valley and is surrounded by rolling hills.
Economy
Flourissant is home to a variety of businesses and industries. The city is home to a number of retail stores, restaurants, and other businesses. The city is also home to a number of manufacturing and industrial businesses, including a steel mill, a printing company, and a plastics factory.
The city is also home to a number of government offices, including the St. Louis County Courthouse and the St. Louis County Police Department.
Demographics
As of the 2010 census, there were 52,158 people, 19,945 households, and 13,845 families living in the city. The population density was 6,269.3 people per square mile. The racial makeup of the city was 68.2% White, 25.3% African American, 0.4% Native American, 1.7% Asian, 0.1% Pacific Islander, 1.3% from other races, and 3.1% from two or more races. Hispanic or Latino of any race were 4.2% of the population.
The median income for a household in the city was $50,945, and the median income for a family was $60,945. The per capita income for the city was $24,945. About 8.2% of families and 10.3% of the population were below the poverty line, including 15.3% of those under age 18 and 6.2% of those age 65 or over.
Common Questions
What is Per Capita Income in Florissant?
Per Capita income in Florissant is $31,308.
What is the Median Family Income in Florissant?
Median Family Income in Florissant is $78,568.
What is the Median Household income in Florissant?
Median Household Income in Florissant is $64,178.
What is Income or Wage Gap in Florissant?
Income or Wage Gap in Florissant is 9.4%.
Women in Florissant earn 90.6 cents for every dollar earned by a man.
What is Family Income Deficit in Florissant?
Family Income Deficit in Florissant is $9,808.
Families that are below poverty line in Florissant earn $9,808 less on average than the poverty threshold level.
What is Inequality or Gini Index in Florissant?
Inequality or Gini Index in Florissant is 0.38.
What is the Total Population of Florissant?
Total Population of Florissant is 52,167.
What is the Total Male Population of Florissant?
Total Male Population of Florissant is 25,043.
What is the Total Female Population of Florissant?
Total Female Population of Florissant is 27,124.
What is the Ratio of Males per 100 Females in Florissant?
There are 92.33 Males per 100 Females in Florissant.
What is the Ratio of Females per 100 Males in Florissant?
There are 108.31 Females per 100 Males in Florissant.
What is the Median Population Age in Florissant?
Median Population Age in Florissant is 37.1 Years.
What is the Average Family Size in Florissant
Average Family Size in Florissant is 3.2 People.
What is the Average Household Size in Florissant
Average Household Size in Florissant is 2.5 People.
How Large is the Labor Force in Florissant?
There are 28,717 People in the Labor Forcein in Florissant.
What is the Percentage of People in the Labor Force in Florissant?
69.3% of People are in the Labor Force in Florissant.
What is the Unemployment Rate in Florissant?
Unemployment Rate in Florissant is 6.4%.