Bangor, ME Map & Demographics
Bangor Map
Bangor Overview
$36,120
PER CAPITA INCOME
$78,803
AVG FAMILY INCOME
$52,438
AVG HOUSEHOLD INCOME
18.7%
WAGE / INCOME GAP [ % ]
81.3¢/ $1
WAGE / INCOME GAP [ $ ]
$7,403
FAMILY INCOME DEFICIT
0.51
INEQUALITY / GINI INDEX
31,705
TOTAL POPULATION
14,749
MALE POPULATION
16,956
FEMALE POPULATION
86.98
MALES / 100 FEMALES
114.96
FEMALES / 100 MALES
40.6
MEDIAN AGE
2.9
AVG FAMILY SIZE
2.1
AVG HOUSEHOLD SIZE
16,263
LABOR FORCE [ PEOPLE ]
59.9%
PERCENT IN LABOR FORCE
4.5%
UNEMPLOYMENT RATE
Bangor Zip Codes
Bangor Area Codes
Income in Bangor
Income Overview in Bangor
Per Capita Income in Bangor is $36,120, while median incomes of families and households are $78,803 and $52,438 respectively.
| Characteristic | Number | Measure |
| Per Capita Income | 31,705 | $36,120 |
| Median Family Income | 6,855 | $78,803 |
| Mean Family Income | 6,855 | $109,359 |
| Median Household Income | 13,982 | $52,438 |
| Mean Household Income | 13,982 | $78,309 |
| Income Deficit | 6,855 | $7,403 |
| Wage / Income Gap (%) | 31,705 | 18.72% |
| Wage / Income Gap ($) | 31,705 | 81.28¢ per $1 |
| Gini / Inequality Index | 31,705 | 0.51 |
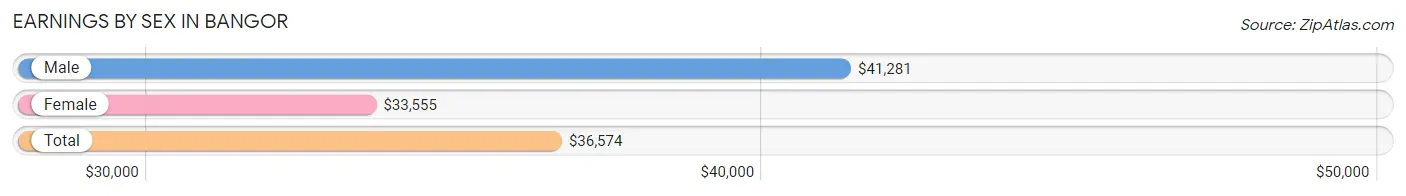
Earnings by Sex in Bangor
Average Earnings in Bangor are $36,574, $41,281 for men and $33,555 for women, a difference of 18.7%.
| Sex | Number | Average Earnings |
| Male | 8,700 (49.1%) | $41,281 |
| Female | 9,017 (50.9%) | $33,555 |
| Total | 17,717 (100.0%) | $36,574 |
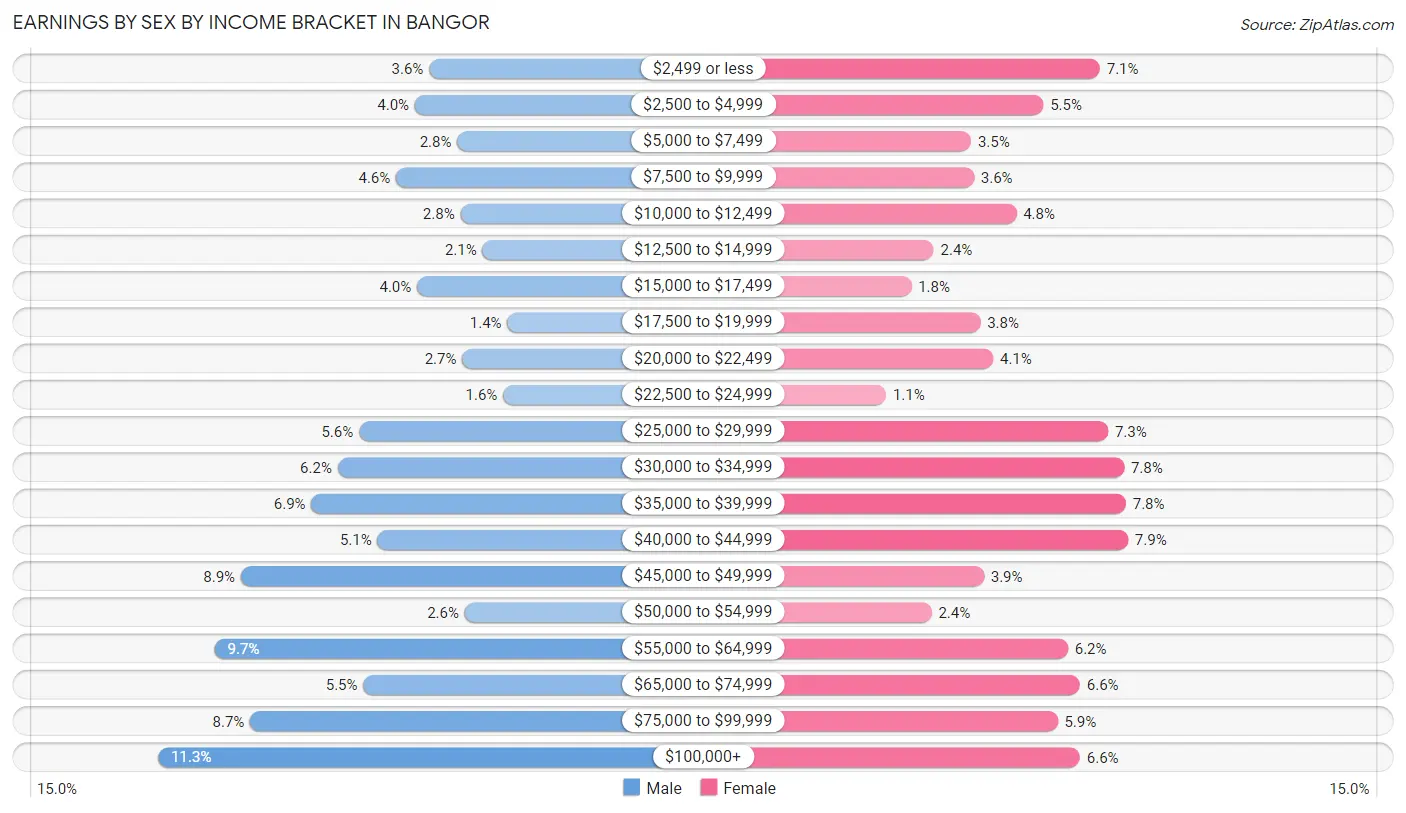
Earnings by Sex by Income Bracket in Bangor
The most common earnings brackets in Bangor are $100,000+ for men (979 | 11.3%) and $40,000 to $44,999 for women (712 | 7.9%).
| Income | Male | Female |
| $2,499 or less | 316 (3.6%) | 641 (7.1%) |
| $2,500 to $4,999 | 351 (4.0%) | 498 (5.5%) |
| $5,000 to $7,499 | 247 (2.8%) | 315 (3.5%) |
| $7,500 to $9,999 | 397 (4.6%) | 322 (3.6%) |
| $10,000 to $12,499 | 239 (2.8%) | 429 (4.8%) |
| $12,500 to $14,999 | 185 (2.1%) | 220 (2.4%) |
| $15,000 to $17,499 | 345 (4.0%) | 163 (1.8%) |
| $17,500 to $19,999 | 124 (1.4%) | 338 (3.7%) |
| $20,000 to $22,499 | 235 (2.7%) | 371 (4.1%) |
| $22,500 to $24,999 | 135 (1.5%) | 99 (1.1%) |
| $25,000 to $29,999 | 487 (5.6%) | 662 (7.3%) |
| $30,000 to $34,999 | 539 (6.2%) | 702 (7.8%) |
| $35,000 to $39,999 | 604 (6.9%) | 707 (7.8%) |
| $40,000 to $44,999 | 442 (5.1%) | 712 (7.9%) |
| $45,000 to $49,999 | 776 (8.9%) | 347 (3.8%) |
| $50,000 to $54,999 | 229 (2.6%) | 215 (2.4%) |
| $55,000 to $64,999 | 840 (9.7%) | 560 (6.2%) |
| $65,000 to $74,999 | 477 (5.5%) | 591 (6.6%) |
| $75,000 to $99,999 | 753 (8.7%) | 534 (5.9%) |
| $100,000+ | 979 (11.3%) | 591 (6.6%) |
| Total | 8,700 (100.0%) | 9,017 (100.0%) |
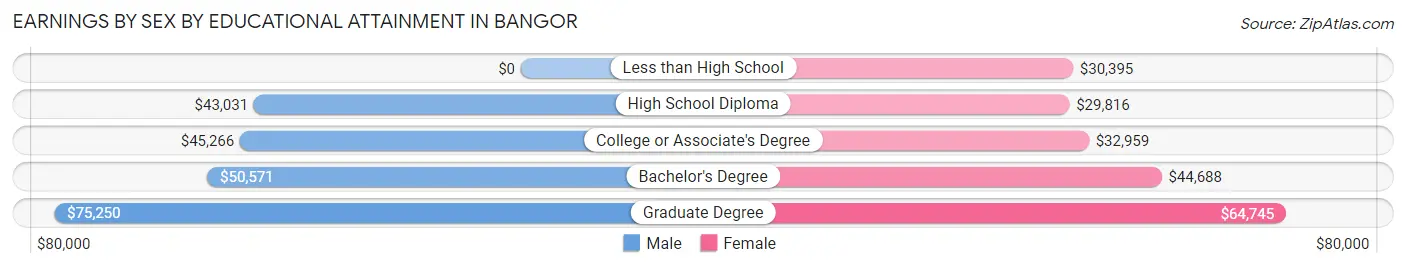
Earnings by Sex by Educational Attainment in Bangor
Average earnings in Bangor are $47,056 for men and $37,814 for women, a difference of 19.6%. Men with an educational attainment of graduate degree enjoy the highest average annual earnings of $75,250, while those with high school diploma education earn the least with $43,031. Women with an educational attainment of graduate degree earn the most with the average annual earnings of $64,745, while those with high school diploma education have the smallest earnings of $29,816.
| Educational Attainment | Male Income | Female Income |
| Less than High School | - | - |
| High School Diploma | $43,031 | $29,816 |
| College or Associate's Degree | $45,266 | $32,959 |
| Bachelor's Degree | $50,571 | $44,688 |
| Graduate Degree | $75,250 | $64,745 |
| Total | $47,056 | $37,814 |
Family Income in Bangor
Family Income Brackets in Bangor
According to the Bangor family income data, there are 1,309 families falling into the $100,000 to $149,999 income range, which is the most common income bracket and makes up 19.1% of all families. Conversely, the less than $10,000 income bracket is the least frequent group with only 123 families (1.8%) belonging to this category.
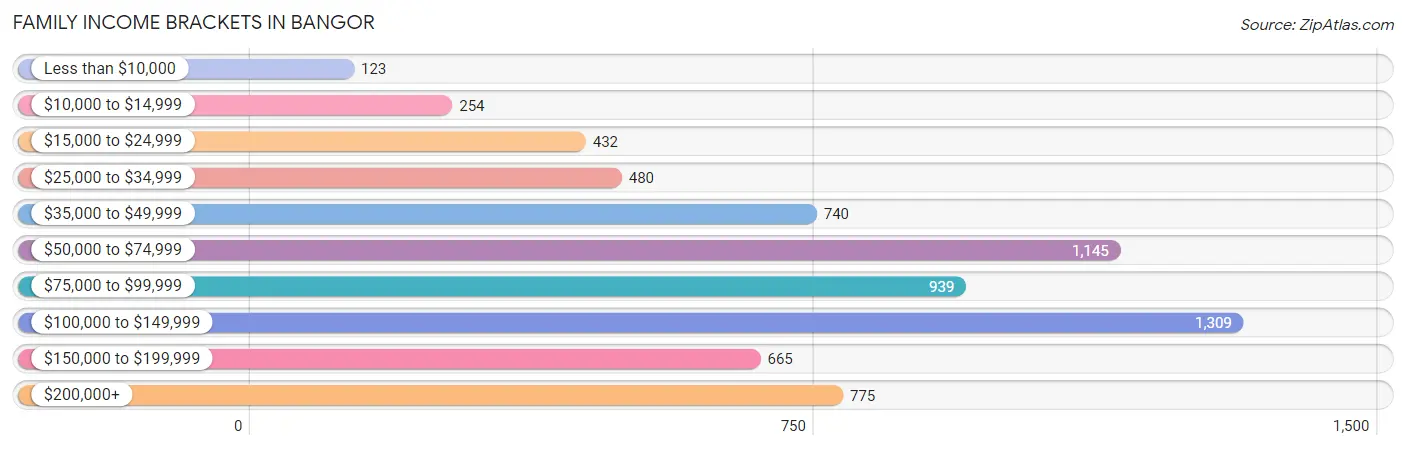
| Income Bracket | # Families | % Families |
| Less than $10,000 | 123 | 1.8% |
| $10,000 to $14,999 | 254 | 3.7% |
| $15,000 to $24,999 | 432 | 6.3% |
| $25,000 to $34,999 | 480 | 7.0% |
| $35,000 to $49,999 | 740 | 10.8% |
| $50,000 to $74,999 | 1,145 | 16.7% |
| $75,000 to $99,999 | 939 | 13.7% |
| $100,000 to $149,999 | 1,309 | 19.1% |
| $150,000 to $199,999 | 665 | 9.7% |
| $200,000+ | 775 | 11.3% |
Family Income by Famaliy Size in Bangor
6-person families (87 | 1.3%) account for the highest median family income in Bangor with $164,712 per family, while 4-person families (1,027 | 15.0%) have the highest median income of $34,869 per family member.
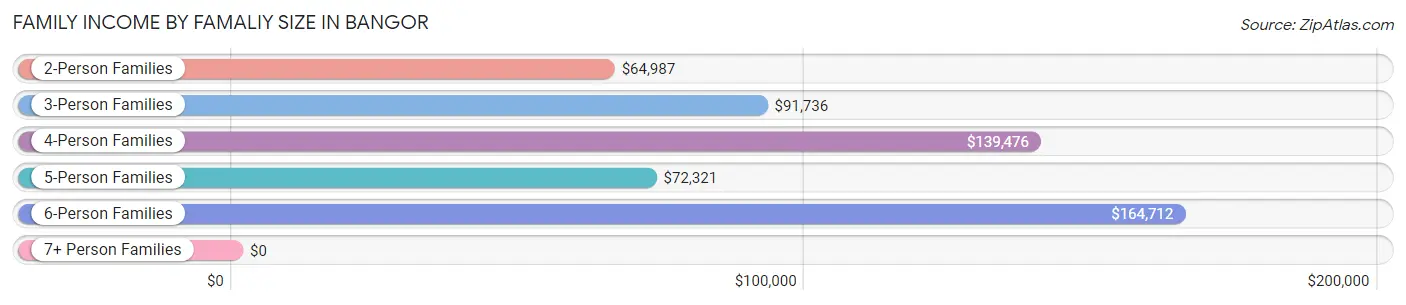
| Income Bracket | # Families | Median Income |
| 2-Person Families | 3,489 (50.9%) | $64,987 |
| 3-Person Families | 1,817 (26.5%) | $91,736 |
| 4-Person Families | 1,027 (15.0%) | $139,476 |
| 5-Person Families | 427 (6.2%) | $72,321 |
| 6-Person Families | 87 (1.3%) | $164,712 |
| 7+ Person Families | 8 (0.1%) | $0 |
| Total | 6,855 (100.0%) | $78,803 |
Family Income by Number of Earners in Bangor
The median family income in Bangor is $78,803, with families comprising 3+ earners (569) having the highest median family income of $178,408, while families with no earners (1,360) have the lowest median family income of $37,583, accounting for 8.3% and 19.8% of families, respectively.
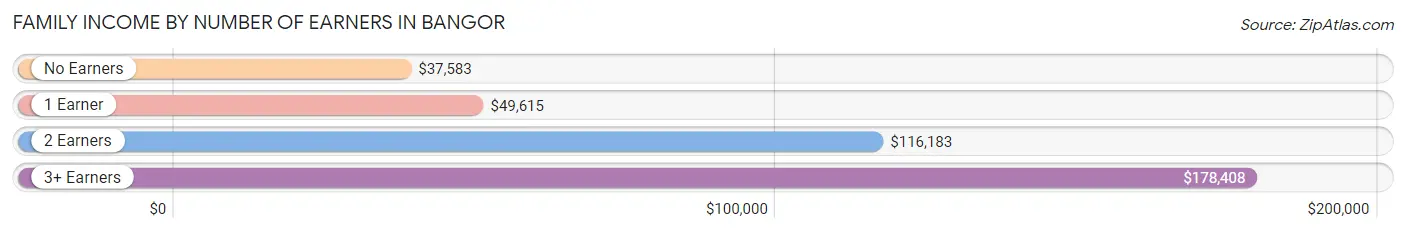
| Number of Earners | # Families | Median Income |
| No Earners | 1,360 (19.8%) | $37,583 |
| 1 Earner | 1,872 (27.3%) | $49,615 |
| 2 Earners | 3,054 (44.6%) | $116,183 |
| 3+ Earners | 569 (8.3%) | $178,408 |
| Total | 6,855 (100.0%) | $78,803 |
Household Income in Bangor
Household Income Brackets in Bangor
With 2,251 households falling in the category, the $50,000 to $74,999 income range is the most frequent in Bangor, accounting for 16.1% of all households. In contrast, only 797 households (5.7%) fall into the $150,000 to $199,999 income bracket, making it the least populous group.
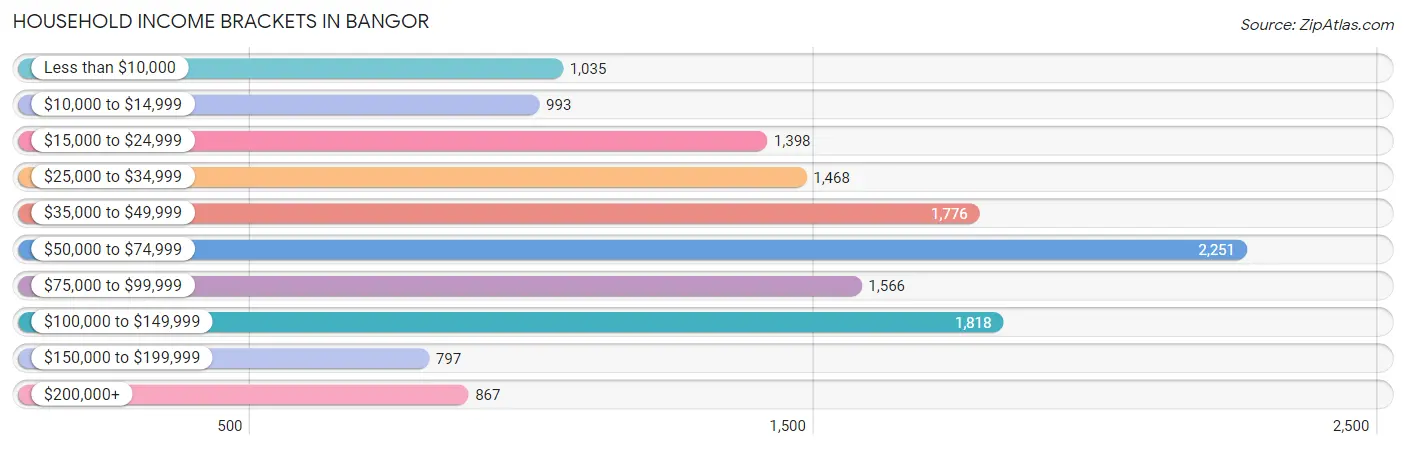
| Income Bracket | # Households | % Households |
| Less than $10,000 | 1,035 | 7.4% |
| $10,000 to $14,999 | 993 | 7.1% |
| $15,000 to $24,999 | 1,398 | 10.0% |
| $25,000 to $34,999 | 1,468 | 10.5% |
| $35,000 to $49,999 | 1,776 | 12.7% |
| $50,000 to $74,999 | 2,251 | 16.1% |
| $75,000 to $99,999 | 1,566 | 11.2% |
| $100,000 to $149,999 | 1,818 | 13.0% |
| $150,000 to $199,999 | 797 | 5.7% |
| $200,000+ | 867 | 6.2% |
Household Income by Householder Age in Bangor
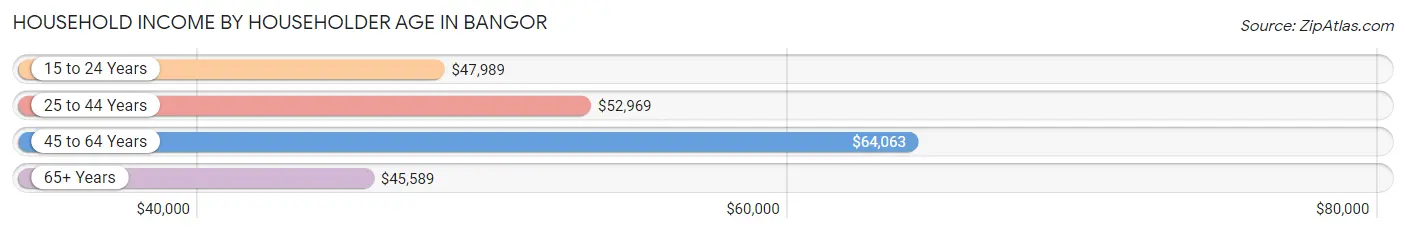
The median household income in Bangor is $52,438, with the highest median household income of $64,063 found in the 45 to 64 years age bracket for the primary householder. A total of 4,746 households (33.9%) fall into this category. Meanwhile, the 65+ years age bracket for the primary householder has the lowest median household income of $45,589, with 3,804 households (27.2%) in this group.
| Income Bracket | # Households | Median Income |
| 15 to 24 Years | 561 (4.0%) | $47,989 |
| 25 to 44 Years | 4,871 (34.8%) | $52,969 |
| 45 to 64 Years | 4,746 (33.9%) | $64,063 |
| 65+ Years | 3,804 (27.2%) | $45,589 |
| Total | 13,982 (100.0%) | $52,438 |
Poverty in Bangor
Income Below Poverty by Sex and Age in Bangor
With 11.7% poverty level for males and 18.2% for females among the residents of Bangor, 6 to 11 year old males and 5 year old females are the most vulnerable to poverty, with 168 males (20.6%) and 67 females (52.8%) in their respective age groups living below the poverty level.
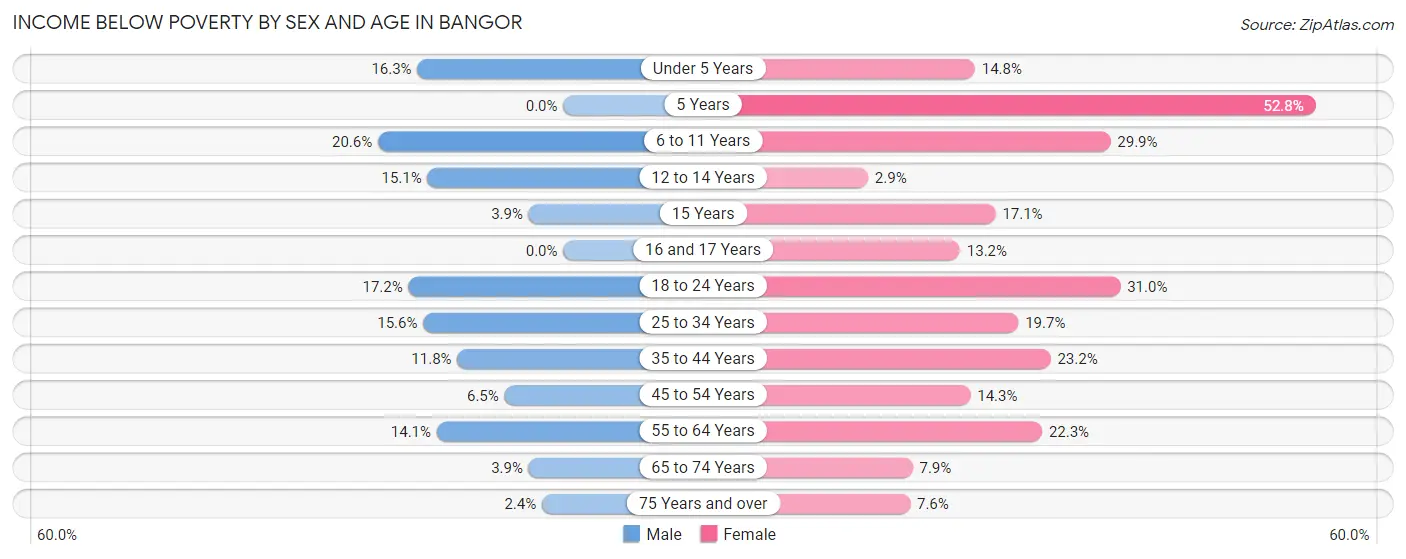
| Age Bracket | Male | Female |
| Under 5 Years | 85 (16.3%) | 130 (14.8%) |
| 5 Years | 0 (0.0%) | 67 (52.8%) |
| 6 to 11 Years | 168 (20.6%) | 259 (29.9%) |
| 12 to 14 Years | 78 (15.1%) | 8 (2.9%) |
| 15 Years | 7 (3.8%) | 26 (17.1%) |
| 16 and 17 Years | 0 (0.0%) | 81 (13.2%) |
| 18 to 24 Years | 217 (17.2%) | 365 (31.0%) |
| 25 to 34 Years | 416 (15.6%) | 473 (19.7%) |
| 35 to 44 Years | 185 (11.8%) | 496 (23.2%) |
| 45 to 54 Years | 123 (6.5%) | 301 (14.3%) |
| 55 to 64 Years | 267 (14.1%) | 455 (22.3%) |
| 65 to 74 Years | 49 (3.8%) | 142 (7.9%) |
| 75 Years and over | 23 (2.4%) | 101 (7.6%) |
| Total | 1,618 (11.7%) | 2,904 (18.2%) |
Income Above Poverty by Sex and Age in Bangor
According to the poverty statistics in Bangor, males aged 5 years and females aged 12 to 14 years are the age groups that are most secure financially, with 100.0% of males and 97.1% of females in these age groups living above the poverty line.
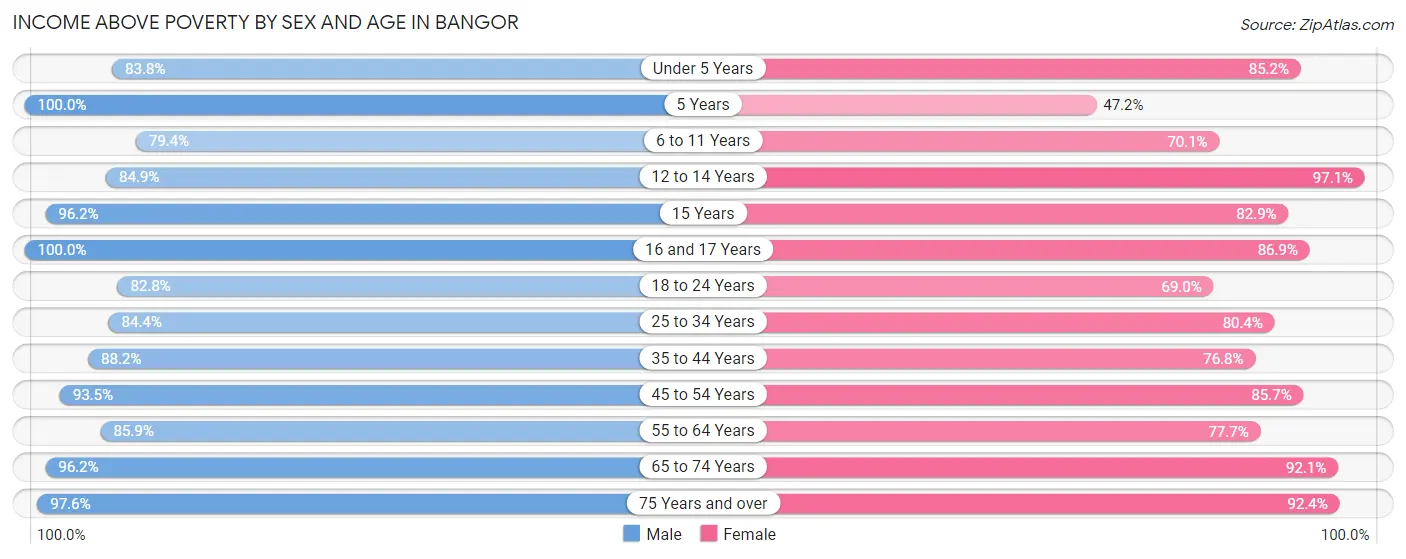
| Age Bracket | Male | Female |
| Under 5 Years | 438 (83.8%) | 748 (85.2%) |
| 5 Years | 22 (100.0%) | 60 (47.2%) |
| 6 to 11 Years | 646 (79.4%) | 607 (70.1%) |
| 12 to 14 Years | 438 (84.9%) | 267 (97.1%) |
| 15 Years | 175 (96.2%) | 126 (82.9%) |
| 16 and 17 Years | 284 (100.0%) | 535 (86.9%) |
| 18 to 24 Years | 1,042 (82.8%) | 812 (69.0%) |
| 25 to 34 Years | 2,250 (84.4%) | 1,934 (80.3%) |
| 35 to 44 Years | 1,383 (88.2%) | 1,638 (76.8%) |
| 45 to 54 Years | 1,758 (93.5%) | 1,803 (85.7%) |
| 55 to 64 Years | 1,628 (85.9%) | 1,586 (77.7%) |
| 65 to 74 Years | 1,224 (96.2%) | 1,660 (92.1%) |
| 75 Years and over | 949 (97.6%) | 1,228 (92.4%) |
| Total | 12,237 (88.3%) | 13,004 (81.8%) |
Income Below Poverty Among Married-Couple Families in Bangor
The poverty statistics for married-couple families in Bangor show that 1.3% or 62 of the total 4,655 families live below the poverty line. Families with no children have the highest poverty rate of 1.5%, comprising of 45 families. On the other hand, families with 3 or 4 children have the lowest poverty rate of 0.0%, which includes 0 families.
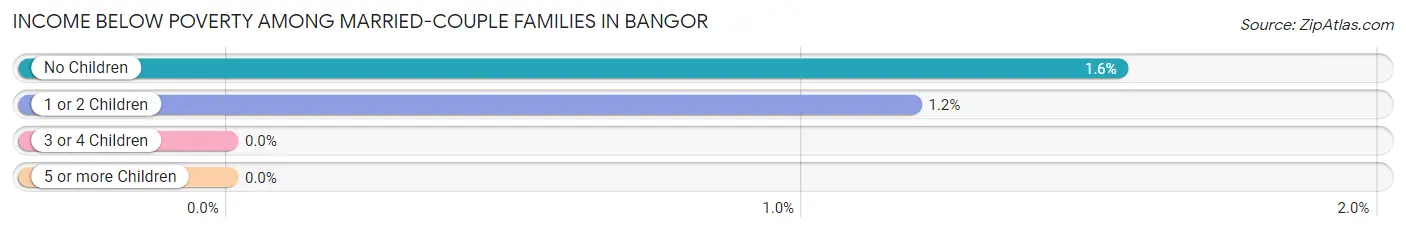
| Children | Above Poverty | Below Poverty |
| No Children | 2,863 (98.5%) | 45 (1.5%) |
| 1 or 2 Children | 1,417 (98.8%) | 17 (1.2%) |
| 3 or 4 Children | 305 (100.0%) | 0 (0.0%) |
| 5 or more Children | 8 (100.0%) | 0 (0.0%) |
| Total | 4,593 (98.7%) | 62 (1.3%) |
Income Below Poverty Among Single-Parent Households in Bangor
According to the poverty data in Bangor, 13.5% or 53 single-father households and 29.5% or 534 single-mother households are living below the poverty line. Among single-father households, those with 5 or more children have the highest poverty rate, with 8 households (100.0%) experiencing poverty. Likewise, among single-mother households, those with 3 or 4 children have the highest poverty rate, with 88 households (61.5%) falling below the poverty line.
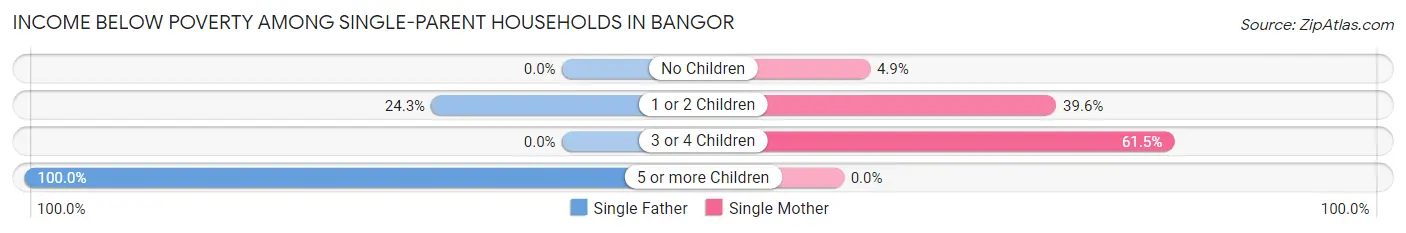
| Children | Single Father | Single Mother |
| No Children | 0 (0.0%) | 30 (4.9%) |
| 1 or 2 Children | 45 (24.3%) | 416 (39.6%) |
| 3 or 4 Children | 0 (0.0%) | 88 (61.5%) |
| 5 or more Children | 8 (100.0%) | 0 (0.0%) |
| Total | 53 (13.5%) | 534 (29.5%) |
Income Below Poverty Among Married-Couple vs Single-Parent Households in Bangor
The poverty data for Bangor shows that 62 of the married-couple family households (1.3%) and 587 of the single-parent households (26.7%) are living below the poverty level. Within the married-couple family households, those with no children have the highest poverty rate, with 45 households (1.5%) falling below the poverty line. Among the single-parent households, those with 5 or more children have the highest poverty rate, with 8 household (100.0%) living below poverty.
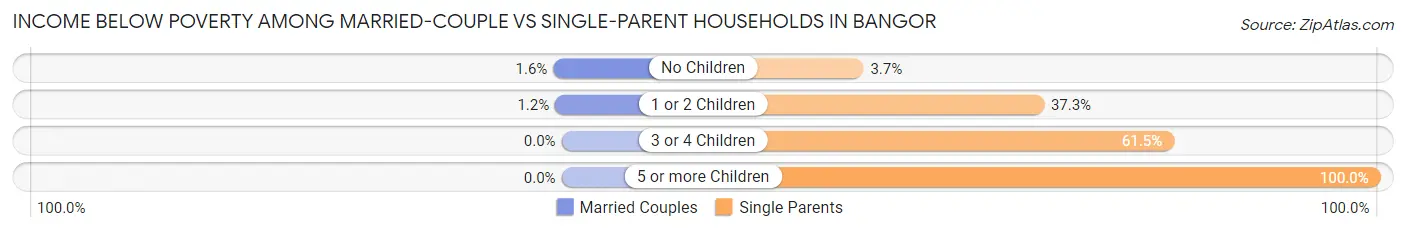
| Children | Married-Couple Families | Single-Parent Households |
| No Children | 45 (1.5%) | 30 (3.7%) |
| 1 or 2 Children | 17 (1.2%) | 461 (37.3%) |
| 3 or 4 Children | 0 (0.0%) | 88 (61.5%) |
| 5 or more Children | 0 (0.0%) | 8 (100.0%) |
| Total | 62 (1.3%) | 587 (26.7%) |
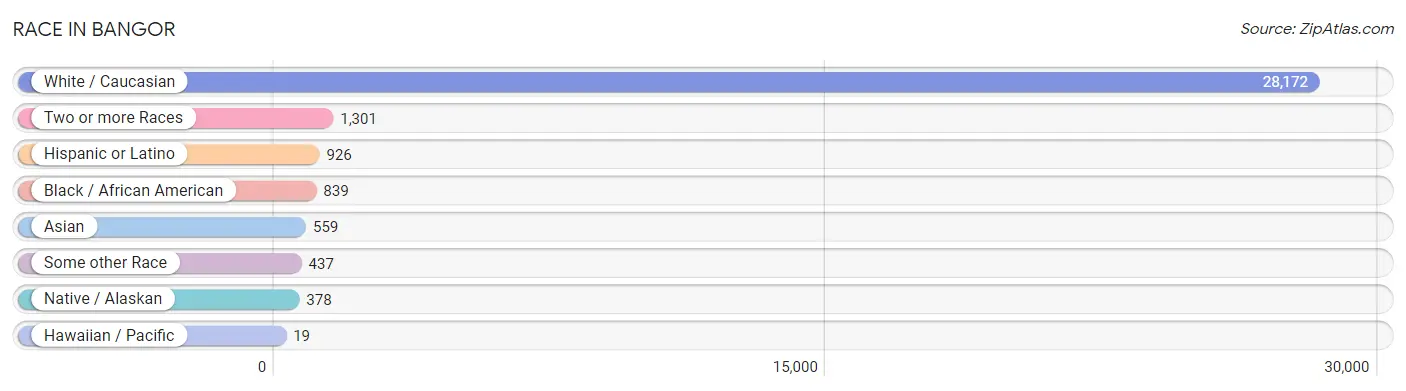
Race in Bangor
The most populous races in Bangor are White / Caucasian (28,172 | 88.9%), Two or more Races (1,301 | 4.1%), and Hispanic or Latino (926 | 2.9%).
| Race | # Population | % Population |
| Asian | 559 | 1.8% |
| Black / African American | 839 | 2.6% |
| Hawaiian / Pacific | 19 | 0.1% |
| Hispanic or Latino | 926 | 2.9% |
| Native / Alaskan | 378 | 1.2% |
| White / Caucasian | 28,172 | 88.9% |
| Two or more Races | 1,301 | 4.1% |
| Some other Race | 437 | 1.4% |
| Total | 31,705 | 100.0% |
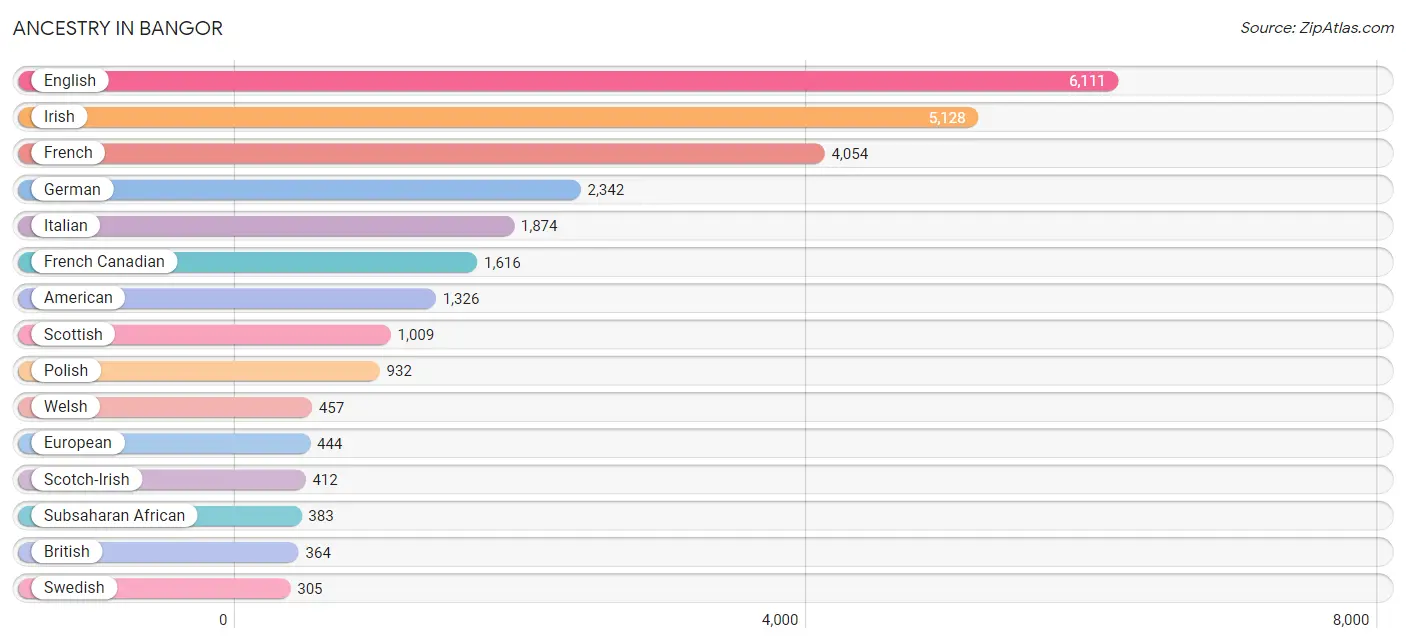
Ancestry in Bangor
The most populous ancestries reported in Bangor are English (6,111 | 19.3%), Irish (5,128 | 16.2%), French (4,054 | 12.8%), German (2,342 | 7.4%), and Italian (1,874 | 5.9%), together accounting for 61.5% of all Bangor residents.
| Ancestry | # Population | % Population |
| African | 109 | 0.3% |
| Albanian | 15 | 0.1% |
| American | 1,326 | 4.2% |
| Apache | 29 | 0.1% |
| Arab | 36 | 0.1% |
| Armenian | 17 | 0.1% |
| Australian | 11 | 0.0% |
| Austrian | 9 | 0.0% |
| Belgian | 8 | 0.0% |
| Blackfeet | 129 | 0.4% |
| Brazilian | 119 | 0.4% |
| British | 364 | 1.1% |
| Bulgarian | 38 | 0.1% |
| Burmese | 62 | 0.2% |
| Canadian | 214 | 0.7% |
| Celtic | 20 | 0.1% |
| Central American | 10 | 0.0% |
| Cherokee | 23 | 0.1% |
| Chinese | 10 | 0.0% |
| Colombian | 140 | 0.4% |
| Creek | 8 | 0.0% |
| Cuban | 13 | 0.0% |
| Czech | 40 | 0.1% |
| Czechoslovakian | 11 | 0.0% |
| Danish | 44 | 0.1% |
| Dominican | 18 | 0.1% |
| Dutch | 188 | 0.6% |
| Eastern European | 279 | 0.9% |
| Ecuadorian | 5 | 0.0% |
| English | 6,111 | 19.3% |
| Estonian | 12 | 0.0% |
| Ethiopian | 24 | 0.1% |
| European | 444 | 1.4% |
| Finnish | 76 | 0.2% |
| French | 4,054 | 12.8% |
| French American Indian | 6 | 0.0% |
| French Canadian | 1,616 | 5.1% |
| German | 2,342 | 7.4% |
| Greek | 131 | 0.4% |
| Haitian | 1 | 0.0% |
| Hungarian | 50 | 0.2% |
| Indian (Asian) | 209 | 0.7% |
| Iranian | 12 | 0.0% |
| Iraqi | 12 | 0.0% |
| Irish | 5,128 | 16.2% |
| Italian | 1,874 | 5.9% |
| Jamaican | 211 | 0.7% |
| Korean | 170 | 0.5% |
| Lebanese | 11 | 0.0% |
| Lithuanian | 194 | 0.6% |
| Mexican | 297 | 0.9% |
| Navajo | 14 | 0.0% |
| New Zealander | 23 | 0.1% |
| Nicaraguan | 10 | 0.0% |
| Nigerian | 185 | 0.6% |
| Northern European | 64 | 0.2% |
| Norwegian | 221 | 0.7% |
| Pakistani | 16 | 0.1% |
| Peruvian | 124 | 0.4% |
| Polish | 932 | 2.9% |
| Portuguese | 105 | 0.3% |
| Puerto Rican | 200 | 0.6% |
| Russian | 122 | 0.4% |
| Scandinavian | 110 | 0.4% |
| Scotch-Irish | 412 | 1.3% |
| Scottish | 1,009 | 3.2% |
| Sioux | 11 | 0.0% |
| Slavic | 20 | 0.1% |
| Slovak | 5 | 0.0% |
| Somali | 64 | 0.2% |
| South American | 278 | 0.9% |
| South American Indian | 12 | 0.0% |
| Spaniard | 30 | 0.1% |
| Spanish | 3 | 0.0% |
| Sri Lankan | 98 | 0.3% |
| Subsaharan African | 383 | 1.2% |
| Sudanese | 1 | 0.0% |
| Swedish | 305 | 1.0% |
| Swiss | 31 | 0.1% |
| Thai | 87 | 0.3% |
| Trinidadian and Tobagonian | 18 | 0.1% |
| Ukrainian | 116 | 0.4% |
| Uruguayan | 9 | 0.0% |
| Welsh | 457 | 1.4% | View All 84 Rows |
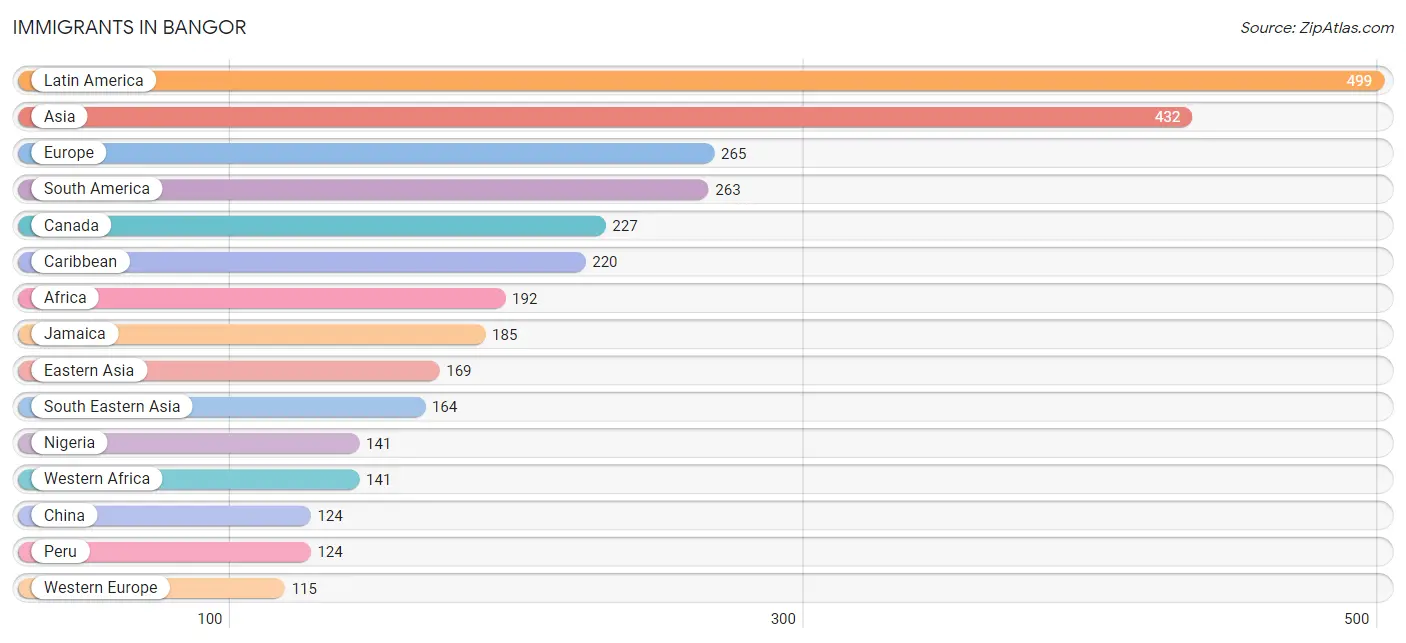
Immigrants in Bangor
The most numerous immigrant groups reported in Bangor came from Latin America (499 | 1.6%), Asia (432 | 1.4%), Europe (265 | 0.8%), South America (263 | 0.8%), and Canada (227 | 0.7%), together accounting for 5.3% of all Bangor residents.
| Immigration Origin | # Population | % Population |
| Africa | 192 | 0.6% |
| Asia | 432 | 1.4% |
| Australia | 11 | 0.0% |
| Azores | 22 | 0.1% |
| Brazil | 51 | 0.2% |
| Bulgaria | 16 | 0.1% |
| Canada | 227 | 0.7% |
| Caribbean | 220 | 0.7% |
| Central America | 16 | 0.1% |
| China | 124 | 0.4% |
| Colombia | 83 | 0.3% |
| Dominican Republic | 18 | 0.1% |
| Eastern Africa | 31 | 0.1% |
| Eastern Asia | 169 | 0.5% |
| Eastern Europe | 54 | 0.2% |
| Ecuador | 5 | 0.0% |
| Egypt | 13 | 0.0% |
| England | 9 | 0.0% |
| Ethiopia | 24 | 0.1% |
| Europe | 265 | 0.8% |
| France | 46 | 0.2% |
| Germany | 69 | 0.2% |
| Greece | 33 | 0.1% |
| Haiti | 11 | 0.0% |
| India | 51 | 0.2% |
| Italy | 9 | 0.0% |
| Jamaica | 185 | 0.6% |
| Kenya | 7 | 0.0% |
| Korea | 45 | 0.1% |
| Latin America | 499 | 1.6% |
| Mexico | 6 | 0.0% |
| Nicaragua | 10 | 0.0% |
| Nigeria | 141 | 0.4% |
| Northern Africa | 13 | 0.0% |
| Northern Europe | 25 | 0.1% |
| Oceania | 11 | 0.0% |
| Pakistan | 32 | 0.1% |
| Peru | 124 | 0.4% |
| Philippines | 69 | 0.2% |
| Poland | 28 | 0.1% |
| Portugal | 22 | 0.1% |
| Romania | 10 | 0.0% |
| South Africa | 7 | 0.0% |
| South America | 263 | 0.8% |
| South Central Asia | 83 | 0.3% |
| South Eastern Asia | 164 | 0.5% |
| Southern Europe | 71 | 0.2% |
| Spain | 7 | 0.0% |
| Thailand | 16 | 0.1% |
| Trinidad and Tobago | 6 | 0.0% |
| Vietnam | 79 | 0.3% |
| Western Africa | 141 | 0.4% |
| Western Asia | 16 | 0.1% |
| Western Europe | 115 | 0.4% | View All 54 Rows |
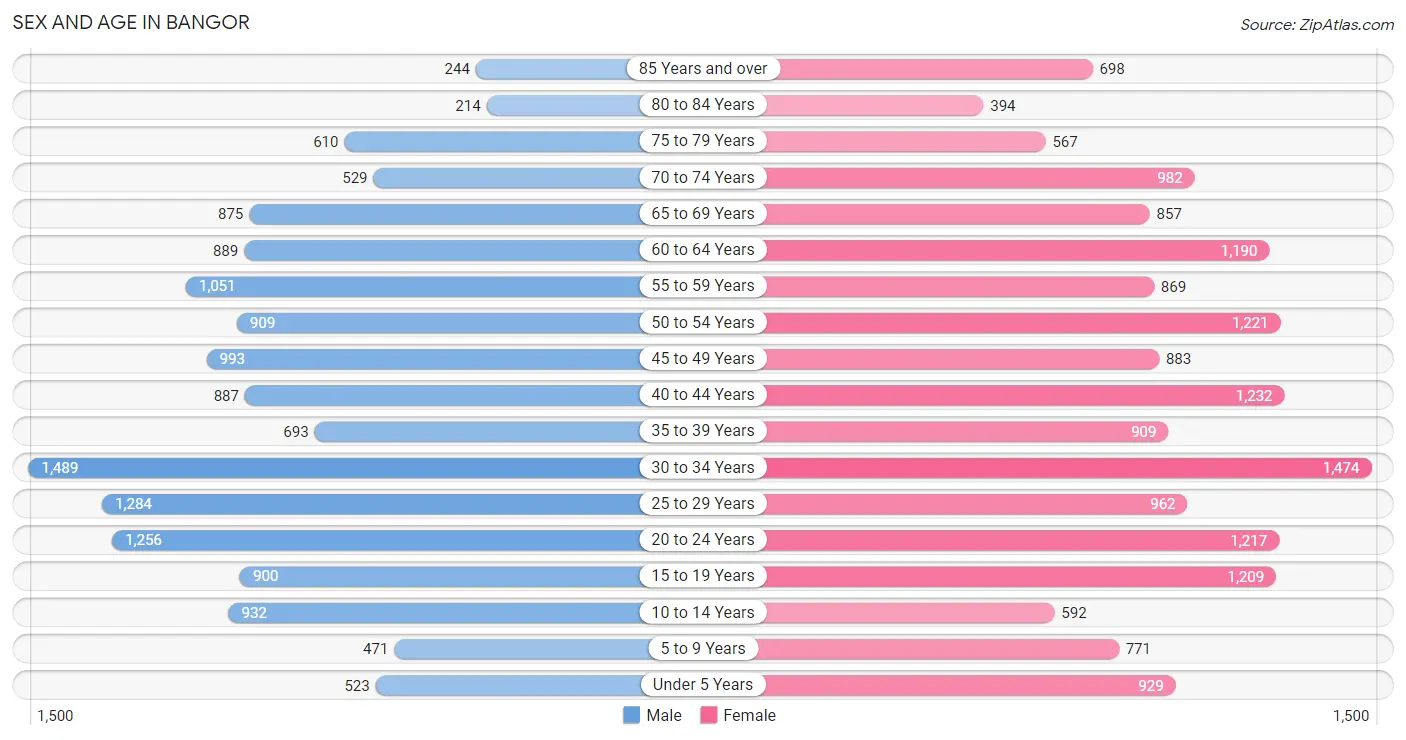
Sex and Age in Bangor
Sex and Age in Bangor
The most populous age groups in Bangor are 30 to 34 Years (1,489 | 10.1%) for men and 30 to 34 Years (1,474 | 8.7%) for women.
| Age Bracket | Male | Female |
| Under 5 Years | 523 (3.5%) | 929 (5.5%) |
| 5 to 9 Years | 471 (3.2%) | 771 (4.5%) |
| 10 to 14 Years | 932 (6.3%) | 592 (3.5%) |
| 15 to 19 Years | 900 (6.1%) | 1,209 (7.1%) |
| 20 to 24 Years | 1,256 (8.5%) | 1,217 (7.2%) |
| 25 to 29 Years | 1,284 (8.7%) | 962 (5.7%) |
| 30 to 34 Years | 1,489 (10.1%) | 1,474 (8.7%) |
| 35 to 39 Years | 693 (4.7%) | 909 (5.4%) |
| 40 to 44 Years | 887 (6.0%) | 1,232 (7.3%) |
| 45 to 49 Years | 993 (6.7%) | 883 (5.2%) |
| 50 to 54 Years | 909 (6.2%) | 1,221 (7.2%) |
| 55 to 59 Years | 1,051 (7.1%) | 869 (5.1%) |
| 60 to 64 Years | 889 (6.0%) | 1,190 (7.0%) |
| 65 to 69 Years | 875 (5.9%) | 857 (5.1%) |
| 70 to 74 Years | 529 (3.6%) | 982 (5.8%) |
| 75 to 79 Years | 610 (4.1%) | 567 (3.3%) |
| 80 to 84 Years | 214 (1.5%) | 394 (2.3%) |
| 85 Years and over | 244 (1.7%) | 698 (4.1%) |
| Total | 14,749 (100.0%) | 16,956 (100.0%) |
Families and Households in Bangor
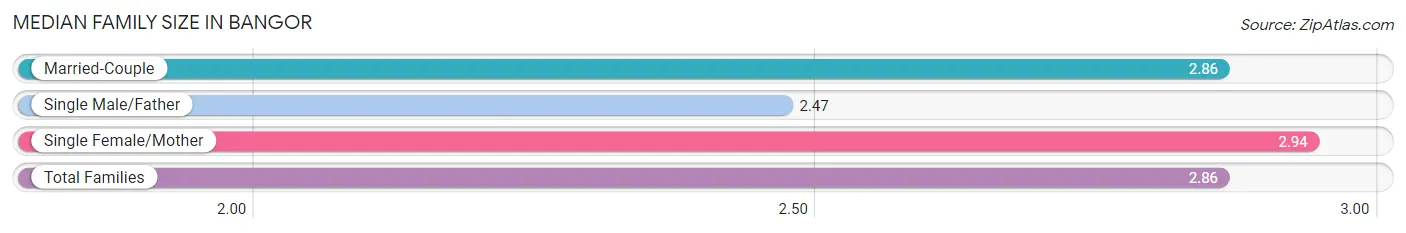
Median Family Size in Bangor
The median family size in Bangor is 2.86 persons per family, with single female/mother families (1,807 | 26.4%) accounting for the largest median family size of 2.94 persons per family. On the other hand, single male/father families (393 | 5.7%) represent the smallest median family size with 2.47 persons per family.
| Family Type | # Families | Family Size |
| Married-Couple | 4,655 (67.9%) | 2.86 |
| Single Male/Father | 393 (5.7%) | 2.47 |
| Single Female/Mother | 1,807 (26.4%) | 2.94 |
| Total Families | 6,855 (100.0%) | 2.86 |
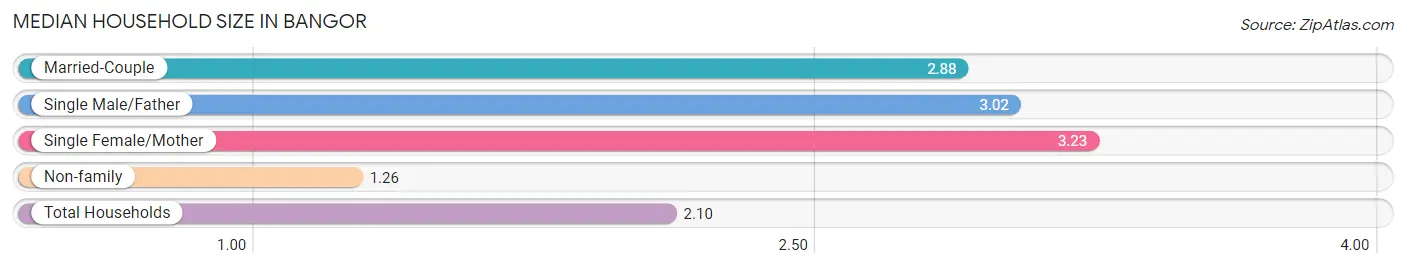
Median Household Size in Bangor
The median household size in Bangor is 2.10 persons per household, with single female/mother households (1,807 | 12.9%) accounting for the largest median household size of 3.23 persons per household. non-family households (7,127 | 51.0%) represent the smallest median household size with 1.26 persons per household.
| Household Type | # Households | Household Size |
| Married-Couple | 4,655 (33.3%) | 2.88 |
| Single Male/Father | 393 (2.8%) | 3.02 |
| Single Female/Mother | 1,807 (12.9%) | 3.23 |
| Non-family | 7,127 (51.0%) | 1.26 |
| Total Households | 13,982 (100.0%) | 2.10 |
Household Size by Marriage Status in Bangor
Out of a total of 13,982 households in Bangor, 6,855 (49.0%) are family households, while 7,127 (51.0%) are nonfamily households. The most numerous type of family households are 2-person households, comprising 3,143, and the most common type of nonfamily households are 1-person households, comprising 5,704.
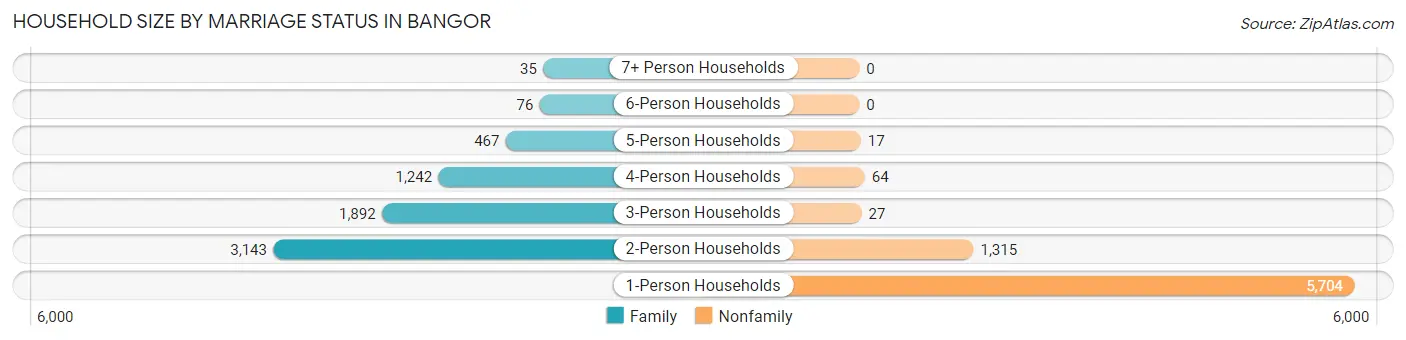
| Household Size | Family Households | Nonfamily Households |
| 1-Person Households | - | 5,704 (40.8%) |
| 2-Person Households | 3,143 (22.5%) | 1,315 (9.4%) |
| 3-Person Households | 1,892 (13.5%) | 27 (0.2%) |
| 4-Person Households | 1,242 (8.9%) | 64 (0.5%) |
| 5-Person Households | 467 (3.3%) | 17 (0.1%) |
| 6-Person Households | 76 (0.5%) | 0 (0.0%) |
| 7+ Person Households | 35 (0.3%) | 0 (0.0%) |
| Total | 6,855 (49.0%) | 7,127 (51.0%) |
Female Fertility in Bangor
Fertility by Age in Bangor
Average fertility rate in Bangor is 58.0 births per 1,000 women. Women in the age bracket of 20 to 34 years have the highest fertility rate with 84.0 births per 1,000 women. Women in the age bracket of 20 to 34 years acount for 65.7% of all women with births.
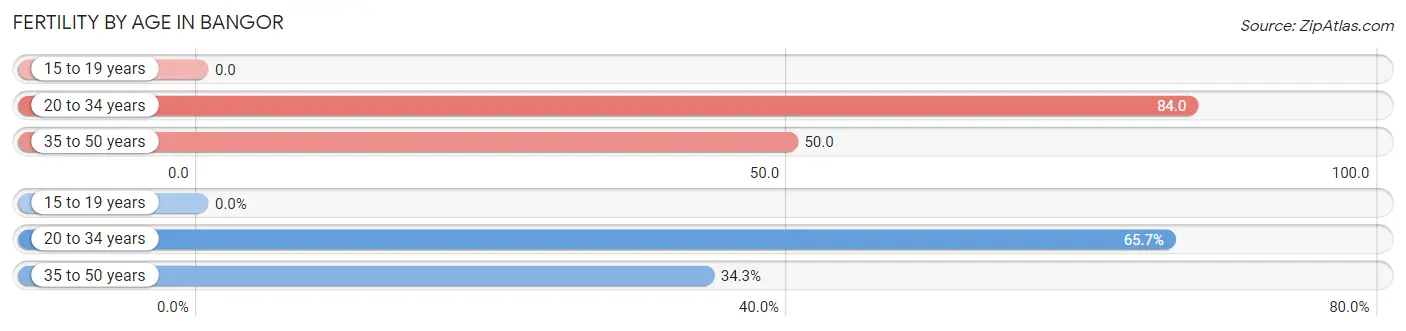
| Age Bracket | Women with Births | Births / 1,000 Women |
| 15 to 19 years | 0 (0.0%) | 0.0 |
| 20 to 34 years | 308 (65.7%) | 84.0 |
| 35 to 50 years | 161 (34.3%) | 50.0 |
| Total | 469 (100.0%) | 58.0 |
Fertility by Age by Marriage Status in Bangor
61.4% of women with births (469) in Bangor are married. The highest percentage of unmarried women with births falls into 35 to 50 years age bracket with 72.7% of them unmarried at the time of birth, while the lowest percentage of unmarried women with births belong to 20 to 34 years age bracket with 20.8% of them unmarried.
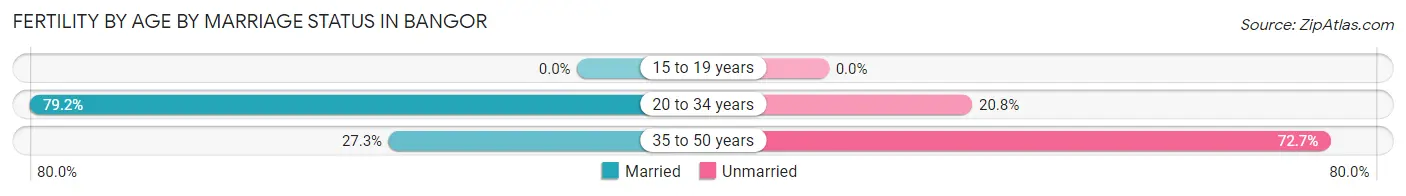
| Age Bracket | Married | Unmarried |
| 15 to 19 years | 0 (0.0%) | 0 (0.0%) |
| 20 to 34 years | 244 (79.2%) | 64 (20.8%) |
| 35 to 50 years | 44 (27.3%) | 117 (72.7%) |
| Total | 288 (61.4%) | 181 (38.6%) |
Fertility by Education in Bangor
Average fertility rate in Bangor is 58.0 births per 1,000 women. Women with the education attainment of graduate degree have the highest fertility rate of 102.0 births per 1,000 women, while women with the education attainment of bachelor's degree have the lowest fertility at 26.0 births per 1,000 women. Women with the education attainment of college or associate's degree represent 31.3% of all women with births.
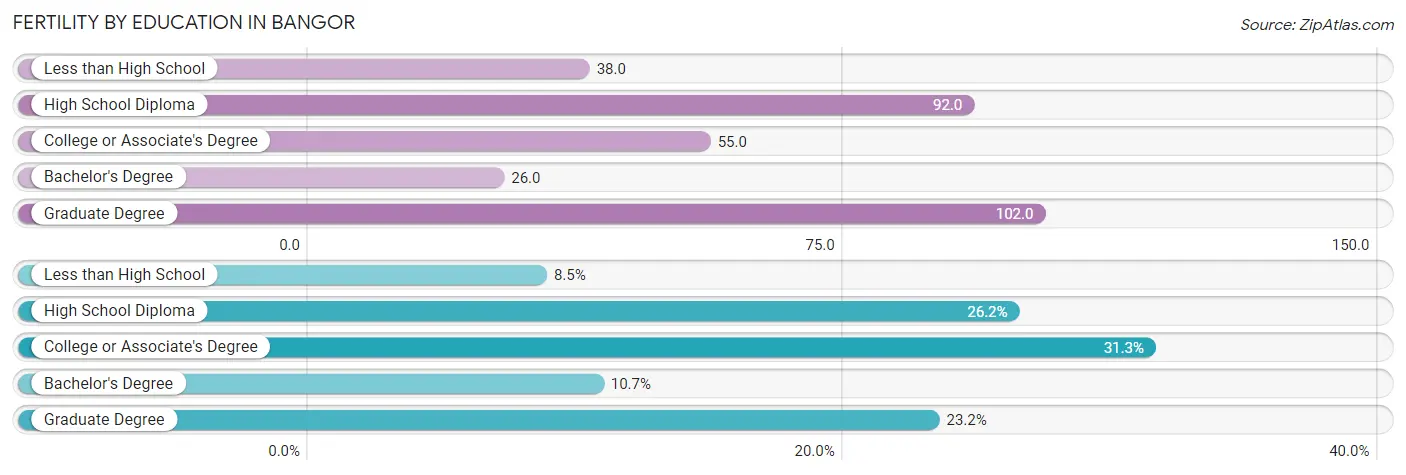
| Educational Attainment | Women with Births | Births / 1,000 Women |
| Less than High School | 40 (8.5%) | 38.0 |
| High School Diploma | 123 (26.2%) | 92.0 |
| College or Associate's Degree | 147 (31.3%) | 55.0 |
| Bachelor's Degree | 50 (10.7%) | 26.0 |
| Graduate Degree | 109 (23.2%) | 102.0 |
| Total | 469 (100.0%) | 58.0 |
Fertility by Education by Marriage Status in Bangor
38.6% of women with births in Bangor are unmarried. Women with the educational attainment of graduate degree are most likely to be married with 100.0% of them married at childbirth, while women with the educational attainment of bachelor's degree are least likely to be married with 74.0% of them unmarried at childbirth.
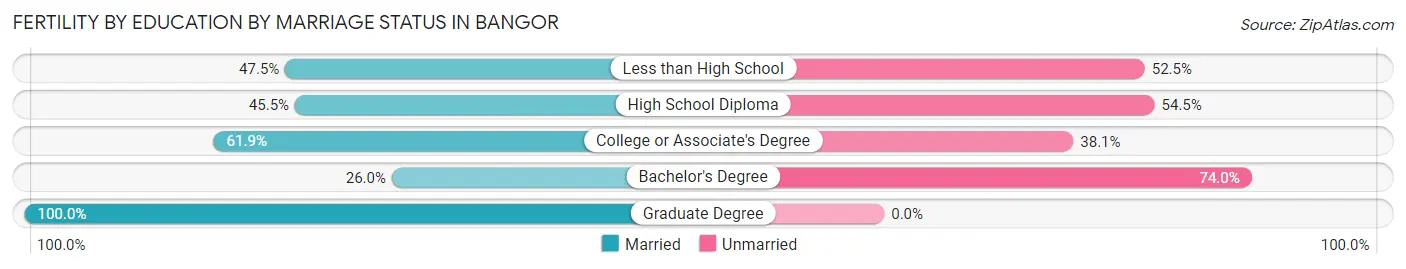
| Educational Attainment | Married | Unmarried |
| Less than High School | 19 (47.5%) | 21 (52.5%) |
| High School Diploma | 56 (45.5%) | 67 (54.5%) |
| College or Associate's Degree | 91 (61.9%) | 56 (38.1%) |
| Bachelor's Degree | 13 (26.0%) | 37 (74.0%) |
| Graduate Degree | 109 (100.0%) | 0 (0.0%) |
| Total | 288 (61.4%) | 181 (38.6%) |
Employment Characteristics in Bangor
Employment by Class of Employer in Bangor
Among the 15,047 employed individuals in Bangor, private company employees (8,961 | 59.6%), not-for-profit organizations (2,498 | 16.6%), and state government employees (1,101 | 7.3%) make up the most common classes of employment.
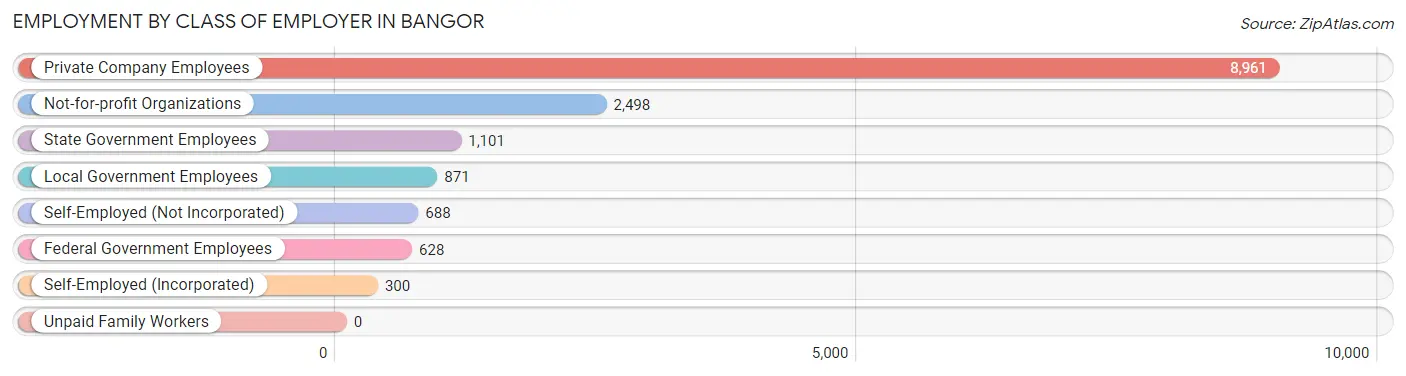
| Employer Class | # Employees | % Employees |
| Private Company Employees | 8,961 | 59.6% |
| Self-Employed (Incorporated) | 300 | 2.0% |
| Self-Employed (Not Incorporated) | 688 | 4.6% |
| Not-for-profit Organizations | 2,498 | 16.6% |
| Local Government Employees | 871 | 5.8% |
| State Government Employees | 1,101 | 7.3% |
| Federal Government Employees | 628 | 4.2% |
| Unpaid Family Workers | 0 | 0.0% |
| Total | 15,047 | 100.0% |
Employment Status by Age in Bangor
According to the labor force statistics for Bangor, out of the total population over 16 years of age (27,150), 59.9% or 16,263 individuals are in the labor force, with 4.5% or 732 of them unemployed. The age group with the highest labor force participation rate is 30 to 34 years, with 82.1% or 2,433 individuals in the labor force. Within the labor force, the 65 to 74 years age range has the highest percentage of unemployed individuals, with 14.5% or 123 of them being unemployed.
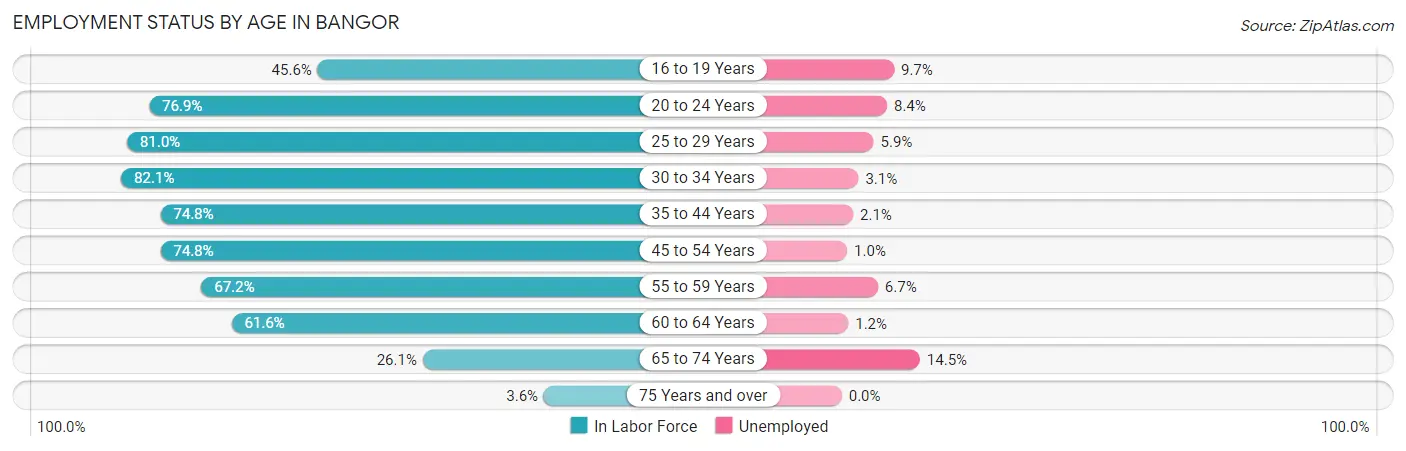
| Age Bracket | In Labor Force | Unemployed |
| 16 to 19 Years | 808 (45.6%) | 78 (9.7%) |
| 20 to 24 Years | 1,902 (76.9%) | 160 (8.4%) |
| 25 to 29 Years | 1,819 (81.0%) | 107 (5.9%) |
| 30 to 34 Years | 2,433 (82.1%) | 75 (3.1%) |
| 35 to 44 Years | 2,783 (74.8%) | 58 (2.1%) |
| 45 to 54 Years | 2,996 (74.8%) | 30 (1.0%) |
| 55 to 59 Years | 1,290 (67.2%) | 86 (6.7%) |
| 60 to 64 Years | 1,281 (61.6%) | 15 (1.2%) |
| 65 to 74 Years | 846 (26.1%) | 123 (14.5%) |
| 75 Years and over | 98 (3.6%) | 0 (0.0%) |
| Total | 16,263 (59.9%) | 732 (4.5%) |
Employment Status by Educational Attainment in Bangor
According to labor force statistics for Bangor, 74.4% of individuals (12,600) out of the total population between 25 and 64 years of age (16,935) are in the labor force, with 3.0% or 378 of them being unemployed. The group with the highest labor force participation rate are those with the educational attainment of bachelor's degree or higher, with 88.8% or 5,685 individuals in the labor force. Within the labor force, individuals with high school diploma education have the highest percentage of unemployment, with 6.1% or 185 of them being unemployed.
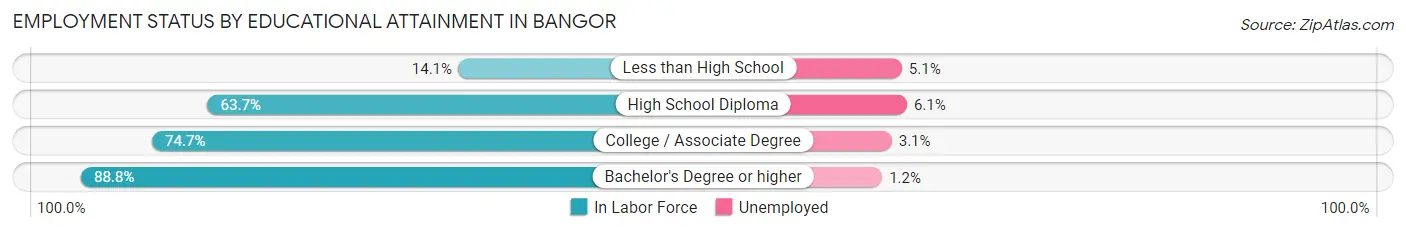
| Educational Attainment | In Labor Force | Unemployed |
| Less than High School | 99 (14.1%) | 36 (5.1%) |
| High School Diploma | 3,033 (63.7%) | 290 (6.1%) |
| College / Associate Degree | 3,788 (74.7%) | 157 (3.1%) |
| Bachelor's Degree or higher | 5,685 (88.8%) | 77 (1.2%) |
| Total | 12,600 (74.4%) | 508 (3.0%) |
Employment Occupations by Sex in Bangor
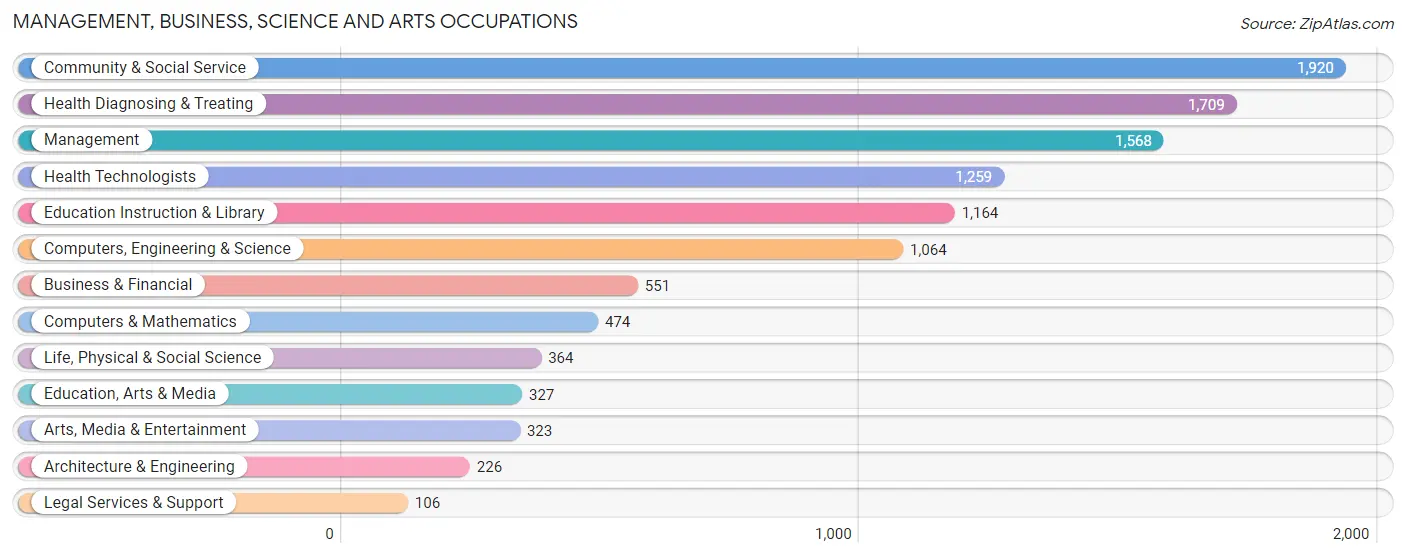
Management, Business, Science and Arts Occupations
The most common Management, Business, Science and Arts occupations in Bangor are Community & Social Service (1,920 | 12.4%), Health Diagnosing & Treating (1,709 | 11.1%), Management (1,568 | 10.1%), Health Technologists (1,259 | 8.1%), and Education Instruction & Library (1,164 | 7.5%).
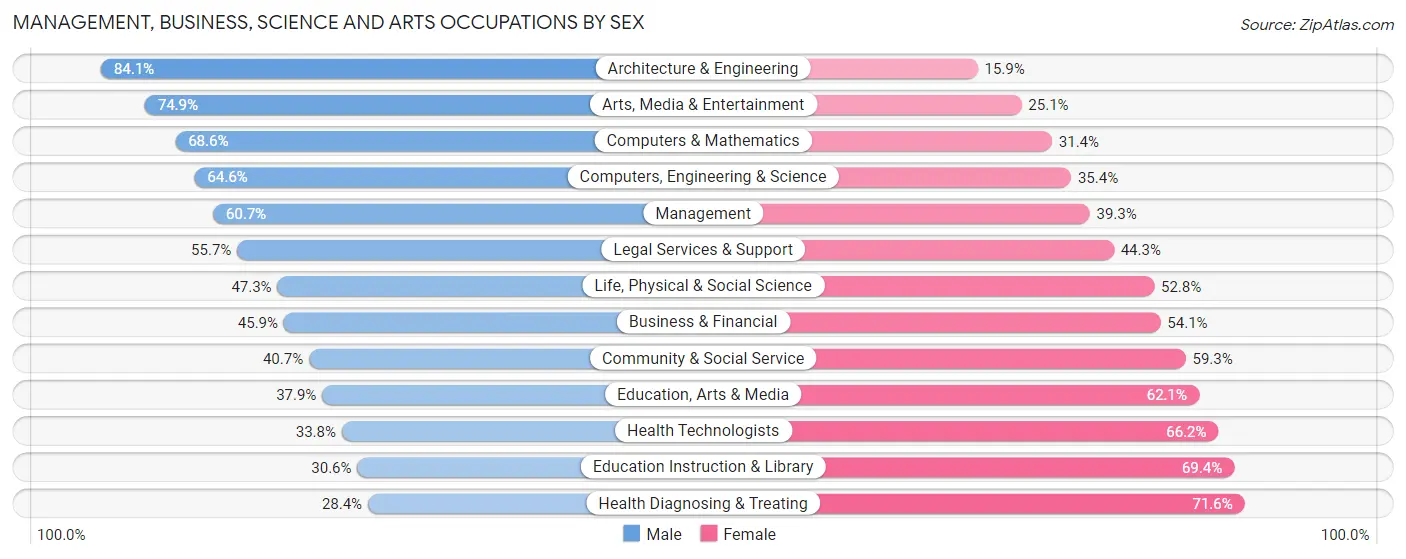
Management, Business, Science and Arts Occupations by Sex
Within the Management, Business, Science and Arts occupations in Bangor, the most male-oriented occupations are Architecture & Engineering (84.1%), Arts, Media & Entertainment (74.9%), and Computers & Mathematics (68.6%), while the most female-oriented occupations are Health Diagnosing & Treating (71.6%), Education Instruction & Library (69.4%), and Health Technologists (66.2%).
| Occupation | Male | Female |
| Management | 952 (60.7%) | 616 (39.3%) |
| Business & Financial | 253 (45.9%) | 298 (54.1%) |
| Computers, Engineering & Science | 687 (64.6%) | 377 (35.4%) |
| Computers & Mathematics | 325 (68.6%) | 149 (31.4%) |
| Architecture & Engineering | 190 (84.1%) | 36 (15.9%) |
| Life, Physical & Social Science | 172 (47.2%) | 192 (52.7%) |
| Community & Social Service | 781 (40.7%) | 1,139 (59.3%) |
| Education, Arts & Media | 124 (37.9%) | 203 (62.1%) |
| Legal Services & Support | 59 (55.7%) | 47 (44.3%) |
| Education Instruction & Library | 356 (30.6%) | 808 (69.4%) |
| Arts, Media & Entertainment | 242 (74.9%) | 81 (25.1%) |
| Health Diagnosing & Treating | 485 (28.4%) | 1,224 (71.6%) |
| Health Technologists | 426 (33.8%) | 833 (66.2%) |
| Total (Category) | 3,158 (46.4%) | 3,654 (53.6%) |
| Total (Overall) | 7,626 (49.3%) | 7,835 (50.7%) |
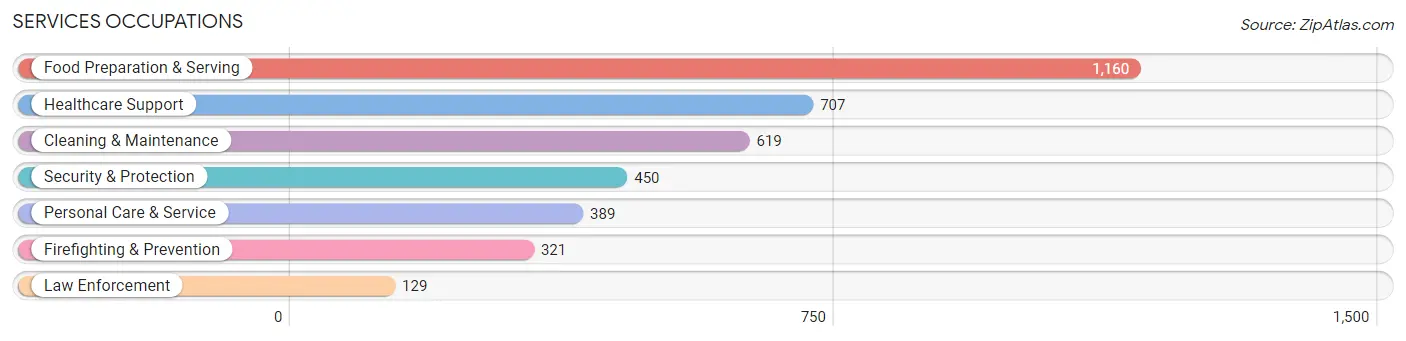
Services Occupations
The most common Services occupations in Bangor are Food Preparation & Serving (1,160 | 7.5%), Healthcare Support (707 | 4.6%), Cleaning & Maintenance (619 | 4.0%), Security & Protection (450 | 2.9%), and Personal Care & Service (389 | 2.5%).
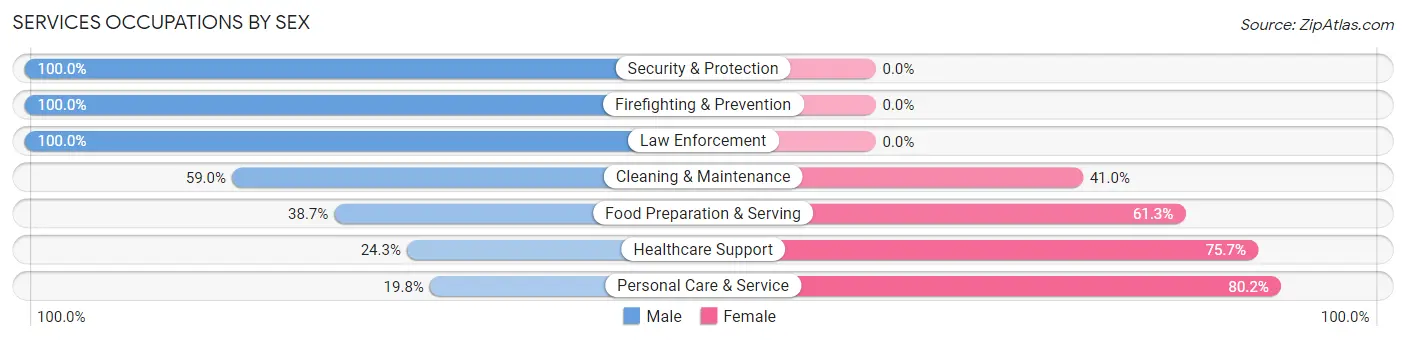
Services Occupations by Sex
Within the Services occupations in Bangor, the most male-oriented occupations are Security & Protection (100.0%), Firefighting & Prevention (100.0%), and Law Enforcement (100.0%), while the most female-oriented occupations are Personal Care & Service (80.2%), Healthcare Support (75.7%), and Food Preparation & Serving (61.3%).
| Occupation | Male | Female |
| Healthcare Support | 172 (24.3%) | 535 (75.7%) |
| Security & Protection | 450 (100.0%) | 0 (0.0%) |
| Firefighting & Prevention | 321 (100.0%) | 0 (0.0%) |
| Law Enforcement | 129 (100.0%) | 0 (0.0%) |
| Food Preparation & Serving | 449 (38.7%) | 711 (61.3%) |
| Cleaning & Maintenance | 365 (59.0%) | 254 (41.0%) |
| Personal Care & Service | 77 (19.8%) | 312 (80.2%) |
| Total (Category) | 1,513 (45.5%) | 1,812 (54.5%) |
| Total (Overall) | 7,626 (49.3%) | 7,835 (50.7%) |
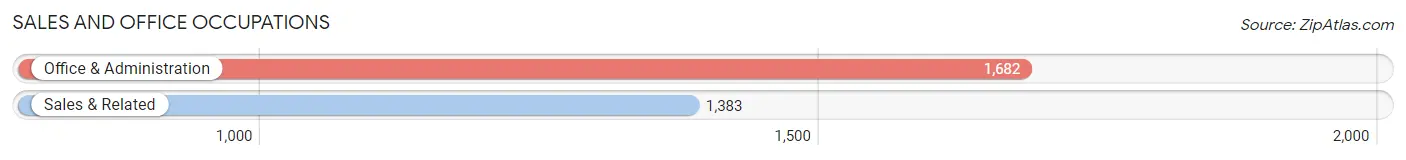
Sales and Office Occupations
The most common Sales and Office occupations in Bangor are Office & Administration (1,682 | 10.9%), and Sales & Related (1,383 | 8.9%).
Sales and Office Occupations by Sex
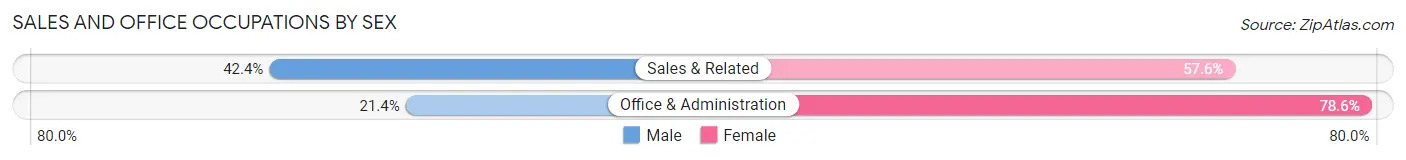
| Occupation | Male | Female |
| Sales & Related | 586 (42.4%) | 797 (57.6%) |
| Office & Administration | 360 (21.4%) | 1,322 (78.6%) |
| Total (Category) | 946 (30.9%) | 2,119 (69.1%) |
| Total (Overall) | 7,626 (49.3%) | 7,835 (50.7%) |
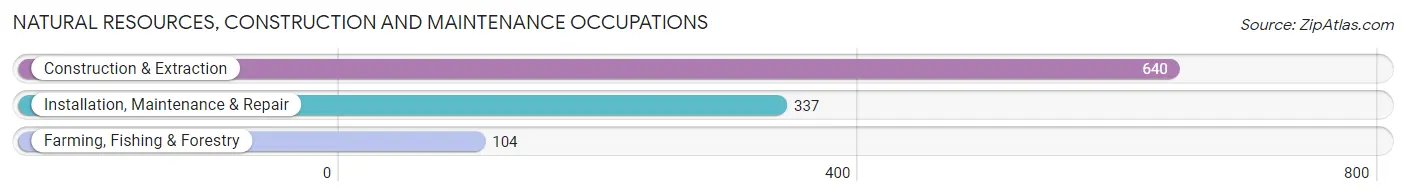
Natural Resources, Construction and Maintenance Occupations
The most common Natural Resources, Construction and Maintenance occupations in Bangor are Construction & Extraction (640 | 4.1%), Installation, Maintenance & Repair (337 | 2.2%), and Farming, Fishing & Forestry (104 | 0.7%).
Natural Resources, Construction and Maintenance Occupations by Sex
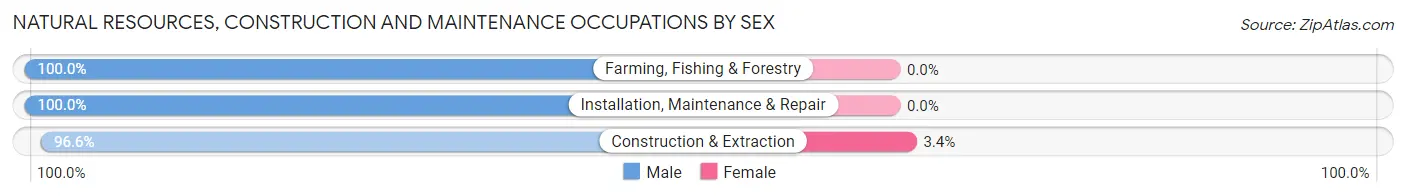
| Occupation | Male | Female |
| Farming, Fishing & Forestry | 104 (100.0%) | 0 (0.0%) |
| Construction & Extraction | 618 (96.6%) | 22 (3.4%) |
| Installation, Maintenance & Repair | 337 (100.0%) | 0 (0.0%) |
| Total (Category) | 1,059 (98.0%) | 22 (2.0%) |
| Total (Overall) | 7,626 (49.3%) | 7,835 (50.7%) |
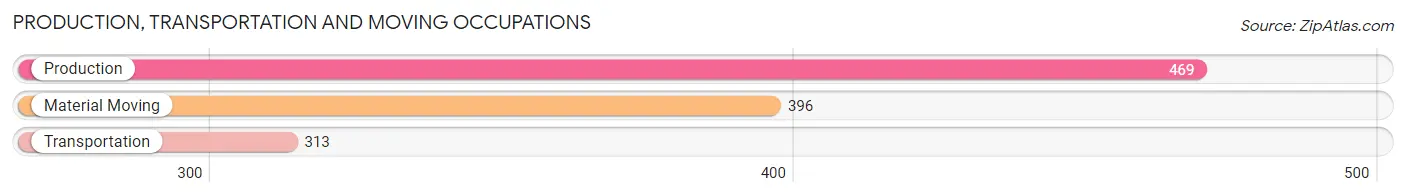
Production, Transportation and Moving Occupations
The most common Production, Transportation and Moving occupations in Bangor are Production (469 | 3.0%), Material Moving (396 | 2.6%), and Transportation (313 | 2.0%).
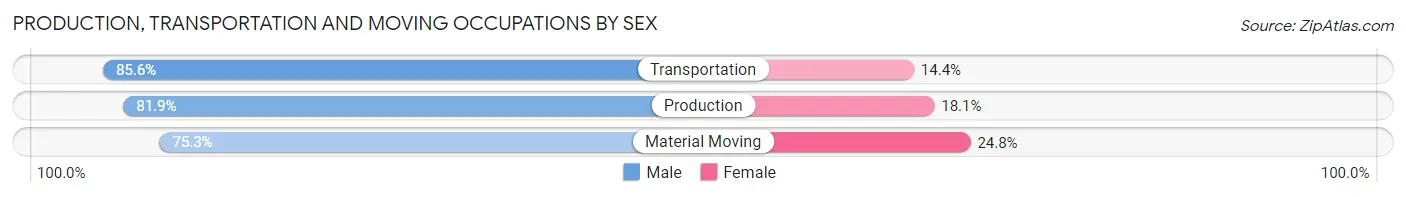
Production, Transportation and Moving Occupations by Sex
| Occupation | Male | Female |
| Production | 384 (81.9%) | 85 (18.1%) |
| Transportation | 268 (85.6%) | 45 (14.4%) |
| Material Moving | 298 (75.2%) | 98 (24.7%) |
| Total (Category) | 950 (80.6%) | 228 (19.4%) |
| Total (Overall) | 7,626 (49.3%) | 7,835 (50.7%) |
Employment Industries by Sex in Bangor
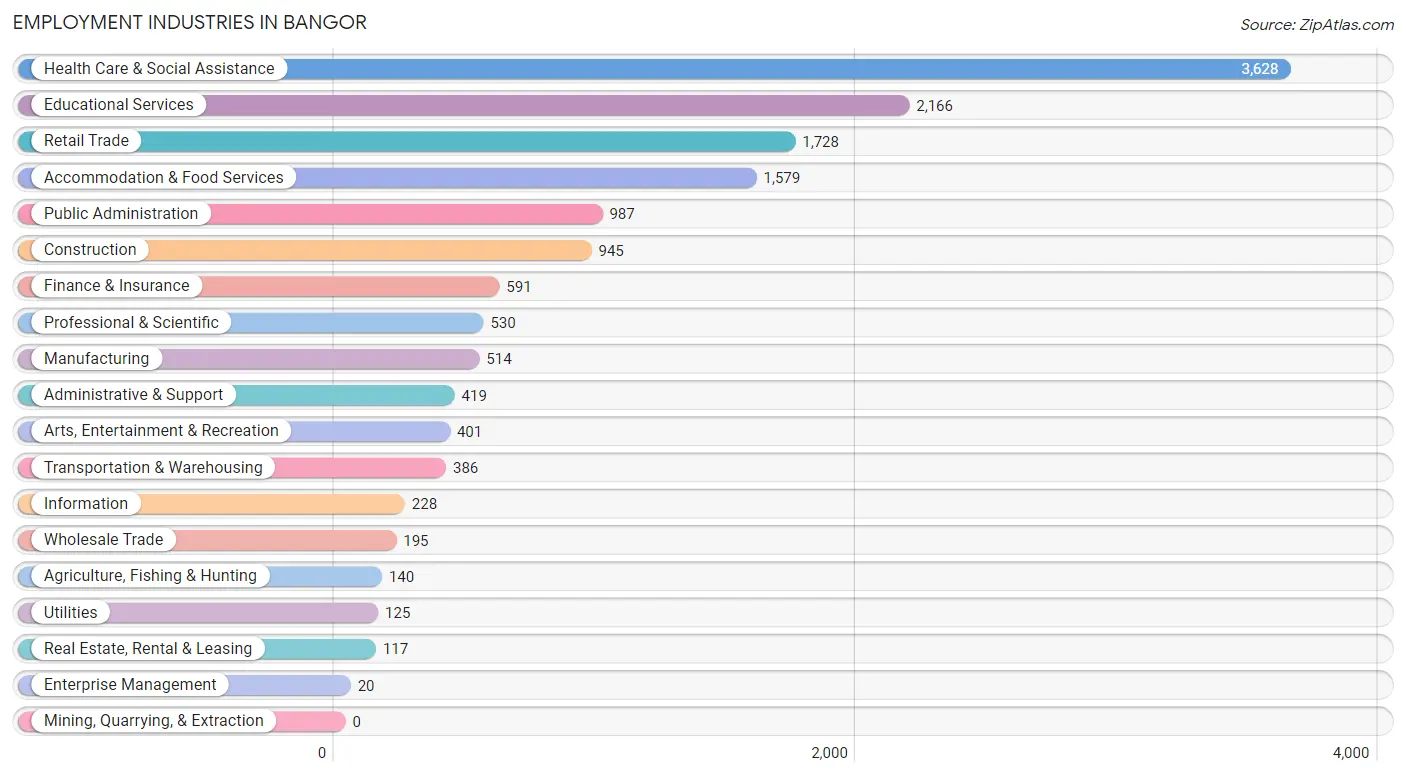
Employment Industries in Bangor
The major employment industries in Bangor include Health Care & Social Assistance (3,628 | 23.5%), Educational Services (2,166 | 14.0%), Retail Trade (1,728 | 11.2%), Accommodation & Food Services (1,579 | 10.2%), and Public Administration (987 | 6.4%).
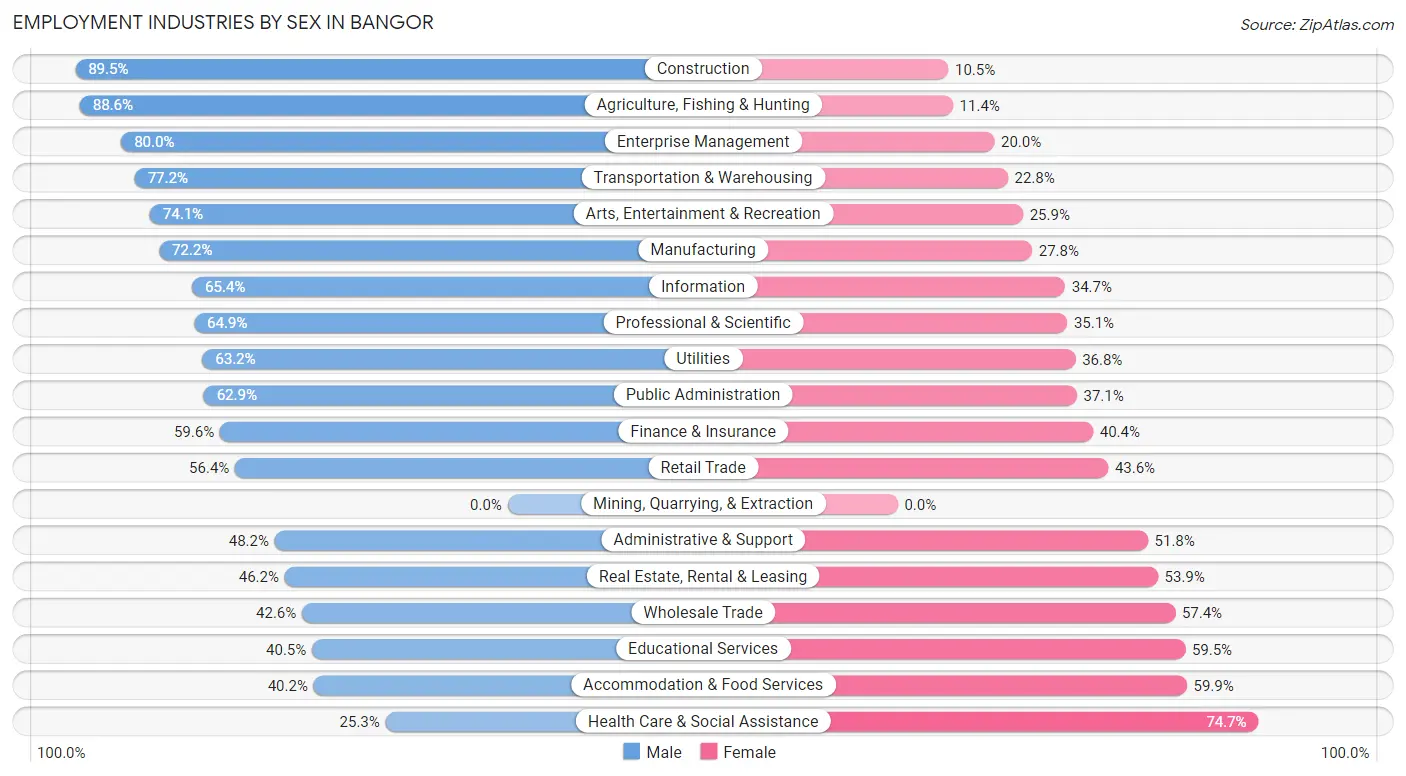
Employment Industries by Sex in Bangor
The Bangor industries that see more men than women are Construction (89.5%), Agriculture, Fishing & Hunting (88.6%), and Enterprise Management (80.0%), whereas the industries that tend to have a higher number of women are Health Care & Social Assistance (74.7%), Accommodation & Food Services (59.9%), and Educational Services (59.5%).
| Industry | Male | Female |
| Agriculture, Fishing & Hunting | 124 (88.6%) | 16 (11.4%) |
| Mining, Quarrying, & Extraction | 0 (0.0%) | 0 (0.0%) |
| Construction | 846 (89.5%) | 99 (10.5%) |
| Manufacturing | 371 (72.2%) | 143 (27.8%) |
| Wholesale Trade | 83 (42.6%) | 112 (57.4%) |
| Retail Trade | 975 (56.4%) | 753 (43.6%) |
| Transportation & Warehousing | 298 (77.2%) | 88 (22.8%) |
| Utilities | 79 (63.2%) | 46 (36.8%) |
| Information | 149 (65.3%) | 79 (34.6%) |
| Finance & Insurance | 352 (59.6%) | 239 (40.4%) |
| Real Estate, Rental & Leasing | 54 (46.2%) | 63 (53.8%) |
| Professional & Scientific | 344 (64.9%) | 186 (35.1%) |
| Enterprise Management | 16 (80.0%) | 4 (20.0%) |
| Administrative & Support | 202 (48.2%) | 217 (51.8%) |
| Educational Services | 877 (40.5%) | 1,289 (59.5%) |
| Health Care & Social Assistance | 917 (25.3%) | 2,711 (74.7%) |
| Arts, Entertainment & Recreation | 297 (74.1%) | 104 (25.9%) |
| Accommodation & Food Services | 634 (40.2%) | 945 (59.9%) |
| Public Administration | 621 (62.9%) | 366 (37.1%) |
| Total | 7,626 (49.3%) | 7,835 (50.7%) |
Education in Bangor
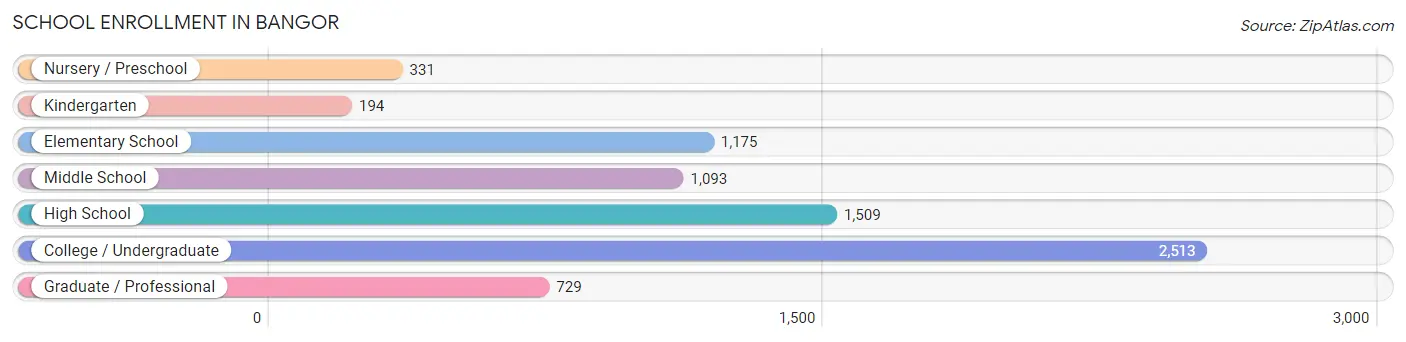
School Enrollment in Bangor
The most common levels of schooling among the 7,544 students in Bangor are college / undergraduate (2,513 | 33.3%), high school (1,509 | 20.0%), and elementary school (1,175 | 15.6%).
| School Level | # Students | % Students |
| Nursery / Preschool | 331 | 4.4% |
| Kindergarten | 194 | 2.6% |
| Elementary School | 1,175 | 15.6% |
| Middle School | 1,093 | 14.5% |
| High School | 1,509 | 20.0% |
| College / Undergraduate | 2,513 | 33.3% |
| Graduate / Professional | 729 | 9.7% |
| Total | 7,544 | 100.0% |
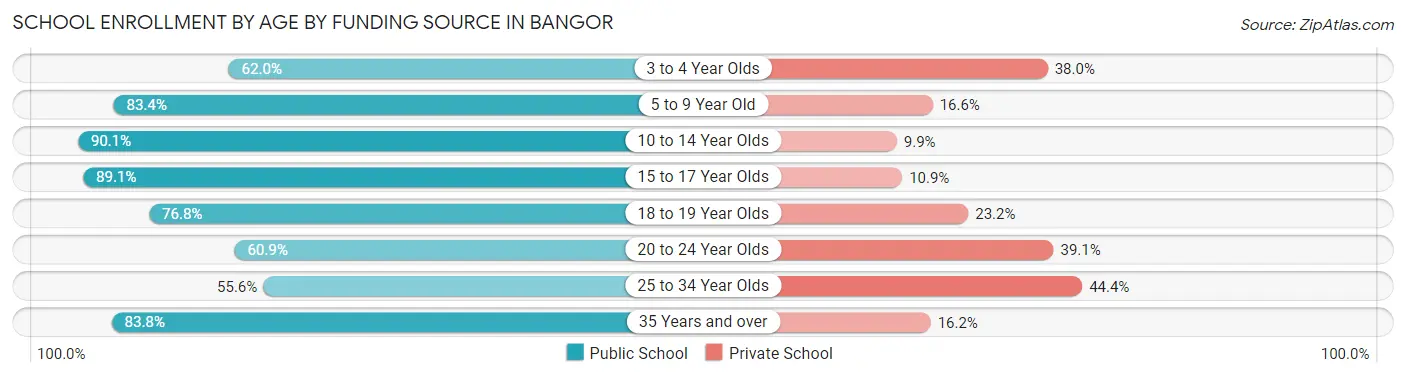
School Enrollment by Age by Funding Source in Bangor
Out of a total of 7,544 students who are enrolled in schools in Bangor, 1,788 (23.7%) attend a private institution, while the remaining 5,756 (76.3%) are enrolled in public schools. The age group of 25 to 34 year olds has the highest likelihood of being enrolled in private schools, with 491 (44.4% in the age bracket) enrolled. Conversely, the age group of 10 to 14 year olds has the lowest likelihood of being enrolled in a private school, with 1,373 (90.1% in the age bracket) attending a public institution.
| Age Bracket | Public School | Private School |
| 3 to 4 Year Olds | 168 (62.0%) | 103 (38.0%) |
| 5 to 9 Year Old | 966 (83.4%) | 192 (16.6%) |
| 10 to 14 Year Olds | 1,373 (90.1%) | 151 (9.9%) |
| 15 to 17 Year Olds | 1,005 (89.1%) | 123 (10.9%) |
| 18 to 19 Year Olds | 602 (76.8%) | 182 (23.2%) |
| 20 to 24 Year Olds | 782 (60.9%) | 502 (39.1%) |
| 25 to 34 Year Olds | 614 (55.6%) | 491 (44.4%) |
| 35 Years and over | 243 (83.8%) | 47 (16.2%) |
| Total | 5,756 (76.3%) | 1,788 (23.7%) |
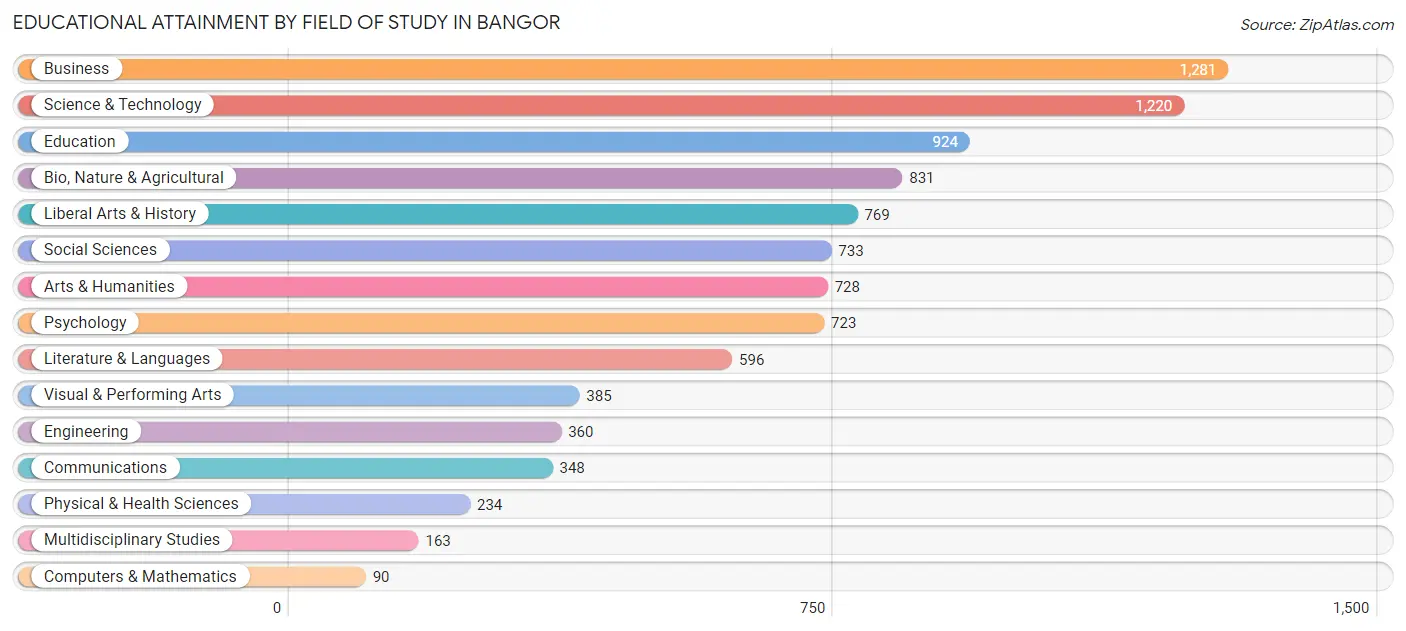
Educational Attainment by Field of Study in Bangor
Business (1,281 | 13.7%), science & technology (1,220 | 13.0%), education (924 | 9.9%), bio, nature & agricultural (831 | 8.8%), and liberal arts & history (769 | 8.2%) are the most common fields of study among 9,385 individuals in Bangor who have obtained a bachelor's degree or higher.
| Field of Study | # Graduates | % Graduates |
| Computers & Mathematics | 90 | 1.0% |
| Bio, Nature & Agricultural | 831 | 8.8% |
| Physical & Health Sciences | 234 | 2.5% |
| Psychology | 723 | 7.7% |
| Social Sciences | 733 | 7.8% |
| Engineering | 360 | 3.8% |
| Multidisciplinary Studies | 163 | 1.7% |
| Science & Technology | 1,220 | 13.0% |
| Business | 1,281 | 13.7% |
| Education | 924 | 9.9% |
| Literature & Languages | 596 | 6.4% |
| Liberal Arts & History | 769 | 8.2% |
| Visual & Performing Arts | 385 | 4.1% |
| Communications | 348 | 3.7% |
| Arts & Humanities | 728 | 7.8% |
| Total | 9,385 | 100.0% |
Transportation & Commute in Bangor
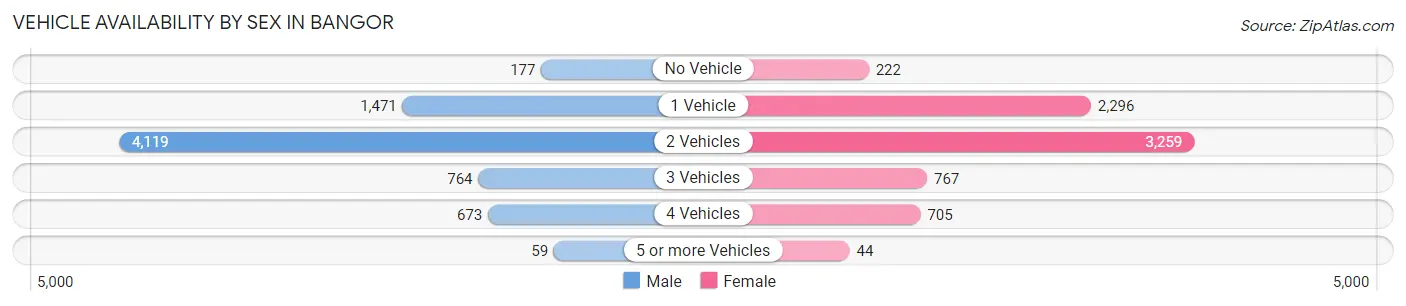
Vehicle Availability by Sex in Bangor
The most prevalent vehicle ownership categories in Bangor are males with 2 vehicles (4,119, accounting for 56.7%) and females with 2 vehicles (3,259, making up 56.5%).
| Vehicles Available | Male | Female |
| No Vehicle | 177 (2.4%) | 222 (3.0%) |
| 1 Vehicle | 1,471 (20.3%) | 2,296 (31.5%) |
| 2 Vehicles | 4,119 (56.7%) | 3,259 (44.7%) |
| 3 Vehicles | 764 (10.5%) | 767 (10.5%) |
| 4 Vehicles | 673 (9.3%) | 705 (9.7%) |
| 5 or more Vehicles | 59 (0.8%) | 44 (0.6%) |
| Total | 7,263 (100.0%) | 7,293 (100.0%) |
Commute Time in Bangor
The most frequently occuring commute durations in Bangor are 10 to 14 minutes (4,029 commuters, 29.6%), 5 to 9 minutes (3,170 commuters, 23.3%), and 15 to 19 minutes (3,028 commuters, 22.2%).
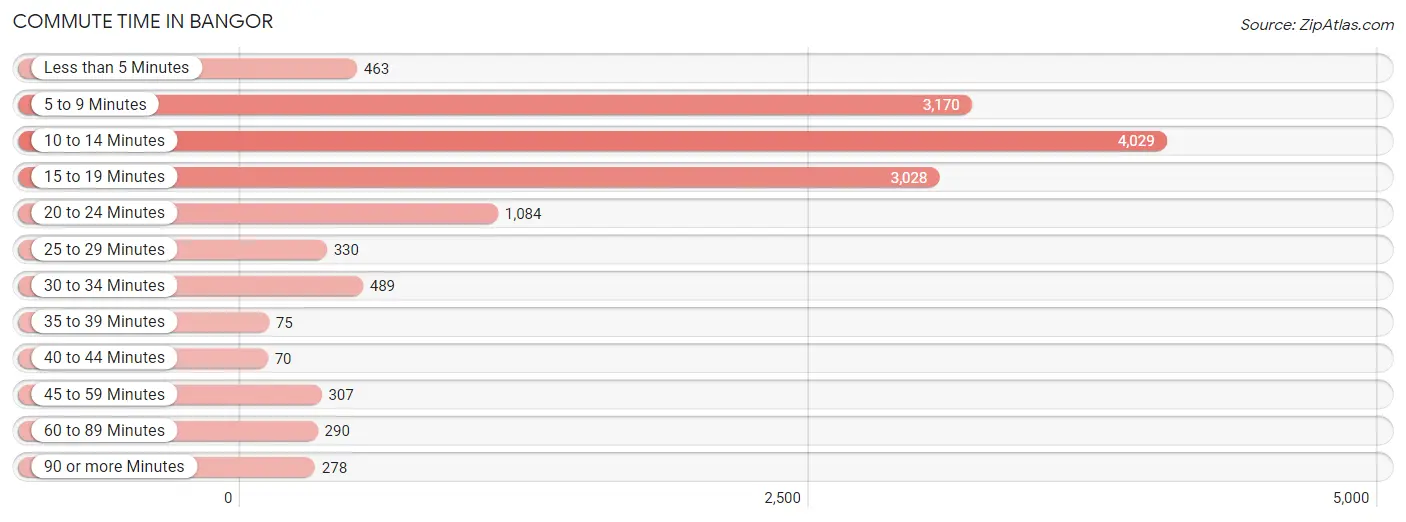
| Commute Time | # Commuters | % Commuters |
| Less than 5 Minutes | 463 | 3.4% |
| 5 to 9 Minutes | 3,170 | 23.3% |
| 10 to 14 Minutes | 4,029 | 29.6% |
| 15 to 19 Minutes | 3,028 | 22.2% |
| 20 to 24 Minutes | 1,084 | 8.0% |
| 25 to 29 Minutes | 330 | 2.4% |
| 30 to 34 Minutes | 489 | 3.6% |
| 35 to 39 Minutes | 75 | 0.5% |
| 40 to 44 Minutes | 70 | 0.5% |
| 45 to 59 Minutes | 307 | 2.3% |
| 60 to 89 Minutes | 290 | 2.1% |
| 90 or more Minutes | 278 | 2.0% |
Commute Time by Sex in Bangor
The most common commute times in Bangor are 10 to 14 minutes (1,865 commuters, 27.0%) for males and 10 to 14 minutes (2,164 commuters, 32.3%) for females.
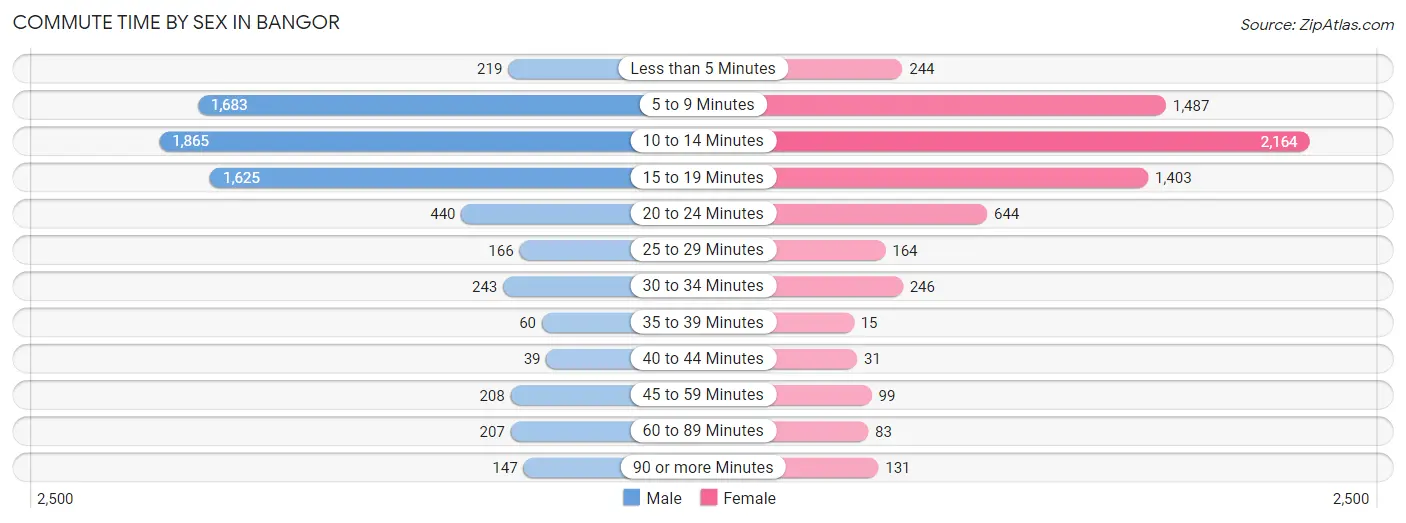
| Commute Time | Male | Female |
| Less than 5 Minutes | 219 (3.2%) | 244 (3.6%) |
| 5 to 9 Minutes | 1,683 (24.4%) | 1,487 (22.2%) |
| 10 to 14 Minutes | 1,865 (27.0%) | 2,164 (32.3%) |
| 15 to 19 Minutes | 1,625 (23.5%) | 1,403 (20.9%) |
| 20 to 24 Minutes | 440 (6.4%) | 644 (9.6%) |
| 25 to 29 Minutes | 166 (2.4%) | 164 (2.4%) |
| 30 to 34 Minutes | 243 (3.5%) | 246 (3.7%) |
| 35 to 39 Minutes | 60 (0.9%) | 15 (0.2%) |
| 40 to 44 Minutes | 39 (0.6%) | 31 (0.5%) |
| 45 to 59 Minutes | 208 (3.0%) | 99 (1.5%) |
| 60 to 89 Minutes | 207 (3.0%) | 83 (1.2%) |
| 90 or more Minutes | 147 (2.1%) | 131 (1.9%) |
Time of Departure to Work by Sex in Bangor
The most frequent times of departure to work in Bangor are 7:30 AM to 7:59 AM (1,142, 16.6%) for males and 7:30 AM to 7:59 AM (1,079, 16.1%) for females.
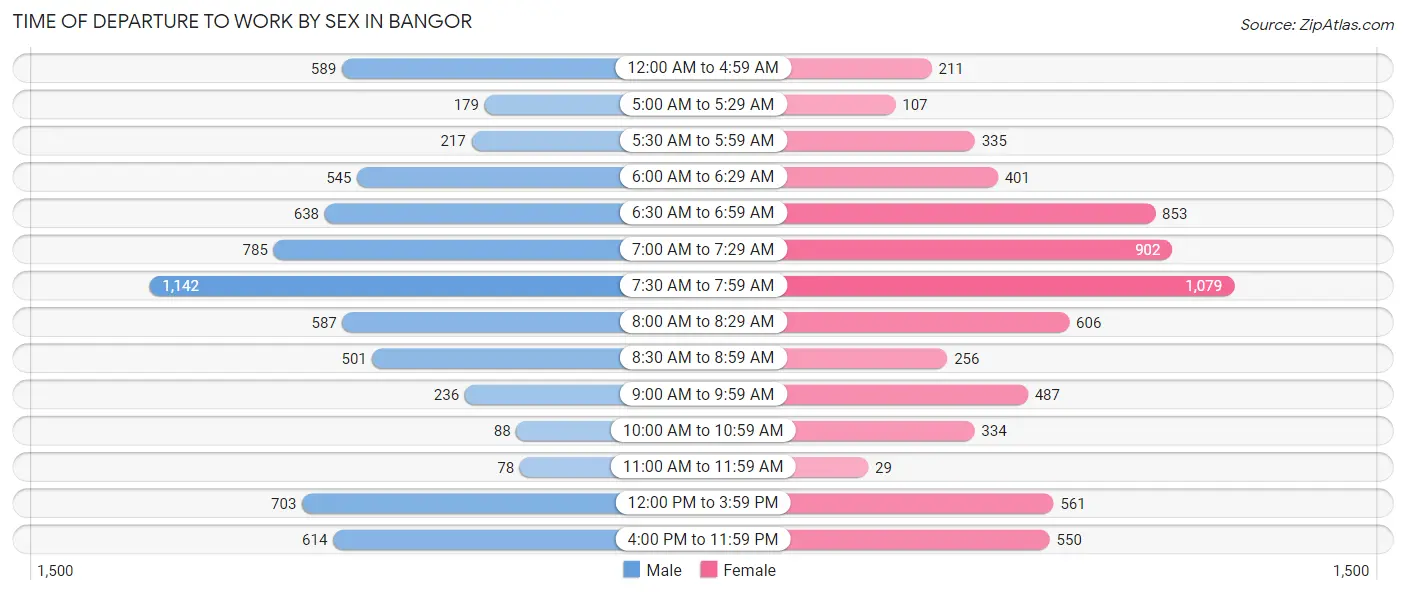
| Time of Departure | Male | Female |
| 12:00 AM to 4:59 AM | 589 (8.5%) | 211 (3.1%) |
| 5:00 AM to 5:29 AM | 179 (2.6%) | 107 (1.6%) |
| 5:30 AM to 5:59 AM | 217 (3.1%) | 335 (5.0%) |
| 6:00 AM to 6:29 AM | 545 (7.9%) | 401 (6.0%) |
| 6:30 AM to 6:59 AM | 638 (9.2%) | 853 (12.7%) |
| 7:00 AM to 7:29 AM | 785 (11.4%) | 902 (13.4%) |
| 7:30 AM to 7:59 AM | 1,142 (16.6%) | 1,079 (16.1%) |
| 8:00 AM to 8:29 AM | 587 (8.5%) | 606 (9.0%) |
| 8:30 AM to 8:59 AM | 501 (7.3%) | 256 (3.8%) |
| 9:00 AM to 9:59 AM | 236 (3.4%) | 487 (7.3%) |
| 10:00 AM to 10:59 AM | 88 (1.3%) | 334 (5.0%) |
| 11:00 AM to 11:59 AM | 78 (1.1%) | 29 (0.4%) |
| 12:00 PM to 3:59 PM | 703 (10.2%) | 561 (8.4%) |
| 4:00 PM to 11:59 PM | 614 (8.9%) | 550 (8.2%) |
| Total | 6,902 (100.0%) | 6,711 (100.0%) |
Housing Occupancy in Bangor
Occupancy by Ownership in Bangor
Of the total 13,982 dwellings in Bangor, owner-occupied units account for 6,491 (46.4%), while renter-occupied units make up 7,491 (53.6%).
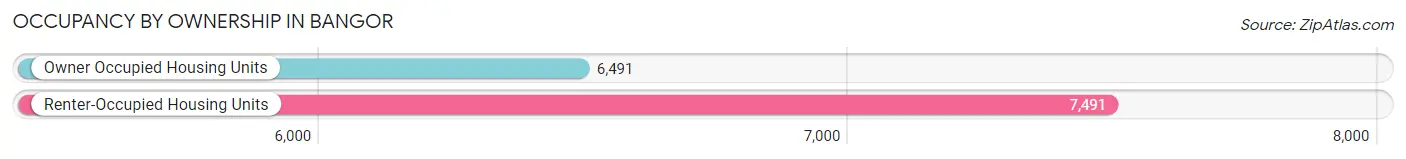
| Occupancy | # Housing Units | % Housing Units |
| Owner Occupied Housing Units | 6,491 | 46.4% |
| Renter-Occupied Housing Units | 7,491 | 53.6% |
| Total Occupied Housing Units | 13,982 | 100.0% |
Occupancy by Household Size in Bangor
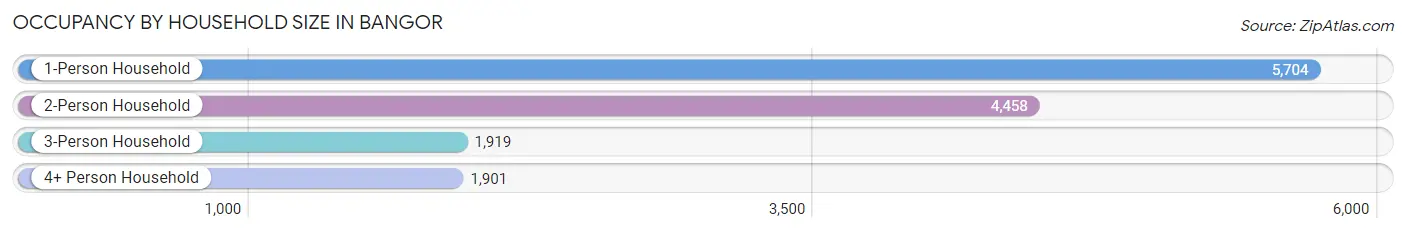
| Household Size | # Housing Units | % Housing Units |
| 1-Person Household | 5,704 | 40.8% |
| 2-Person Household | 4,458 | 31.9% |
| 3-Person Household | 1,919 | 13.7% |
| 4+ Person Household | 1,901 | 13.6% |
| Total Housing Units | 13,982 | 100.0% |
Occupancy by Ownership by Household Size in Bangor
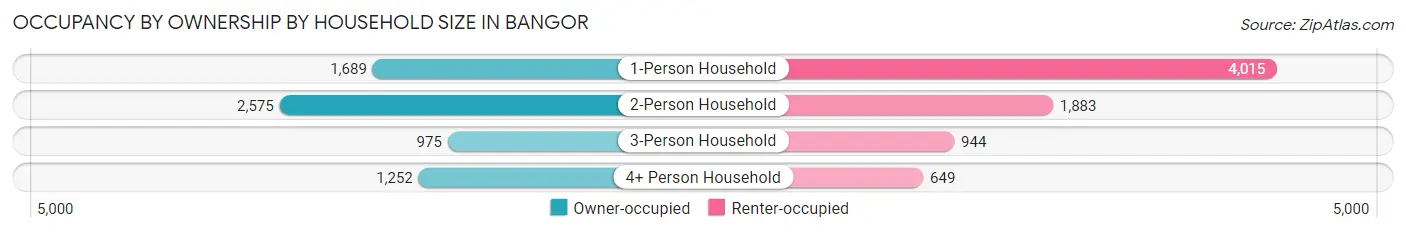
| Household Size | Owner-occupied | Renter-occupied |
| 1-Person Household | 1,689 (29.6%) | 4,015 (70.4%) |
| 2-Person Household | 2,575 (57.8%) | 1,883 (42.2%) |
| 3-Person Household | 975 (50.8%) | 944 (49.2%) |
| 4+ Person Household | 1,252 (65.9%) | 649 (34.1%) |
| Total Housing Units | 6,491 (46.4%) | 7,491 (53.6%) |
Occupancy by Educational Attainment in Bangor
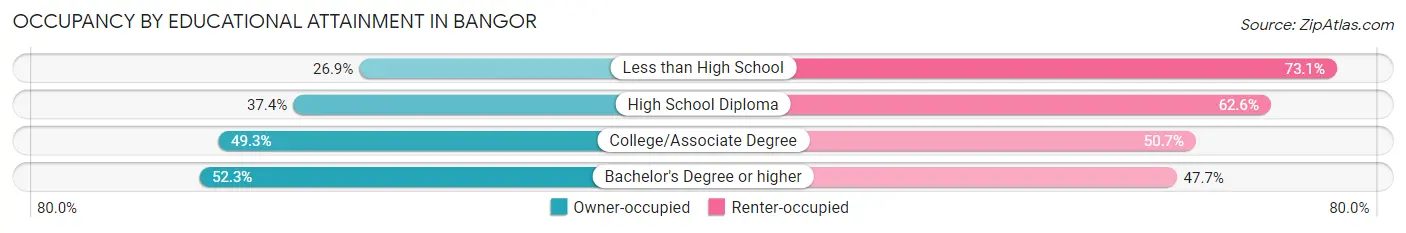
| Household Size | Owner-occupied | Renter-occupied |
| Less than High School | 153 (26.9%) | 415 (73.1%) |
| High School Diploma | 1,387 (37.4%) | 2,320 (62.6%) |
| College/Associate Degree | 2,103 (49.3%) | 2,163 (50.7%) |
| Bachelor's Degree or higher | 2,848 (52.3%) | 2,593 (47.7%) |
Occupancy by Age of Householder in Bangor
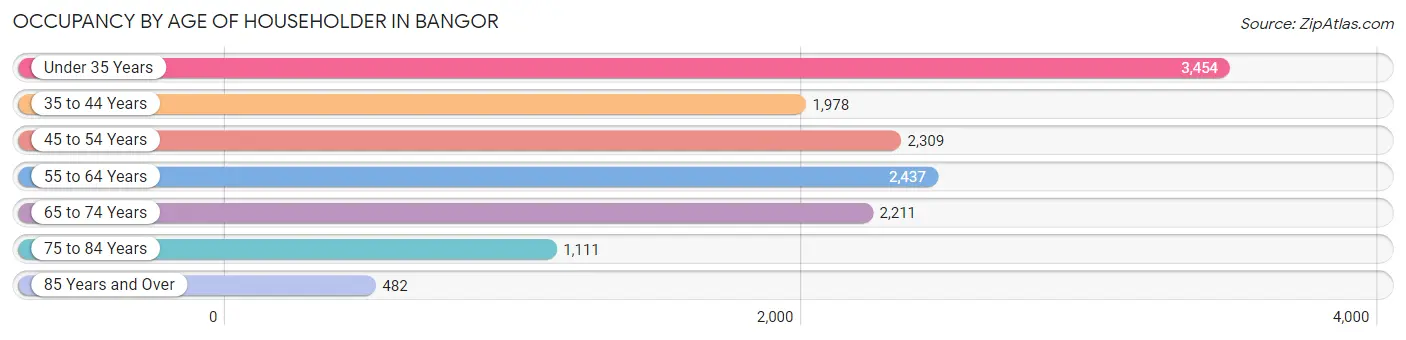
| Age Bracket | # Households | % Households |
| Under 35 Years | 3,454 | 24.7% |
| 35 to 44 Years | 1,978 | 14.1% |
| 45 to 54 Years | 2,309 | 16.5% |
| 55 to 64 Years | 2,437 | 17.4% |
| 65 to 74 Years | 2,211 | 15.8% |
| 75 to 84 Years | 1,111 | 8.0% |
| 85 Years and Over | 482 | 3.5% |
| Total | 13,982 | 100.0% |
Housing Finances in Bangor
Median Income by Occupancy in Bangor
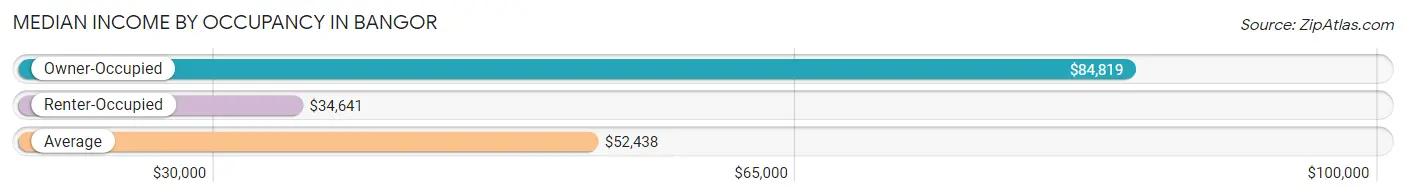
| Occupancy Type | # Households | Median Income |
| Owner-Occupied | 6,491 (46.4%) | $84,819 |
| Renter-Occupied | 7,491 (53.6%) | $34,641 |
| Average | 13,982 (100.0%) | $52,438 |
Occupancy by Householder Income Bracket in Bangor
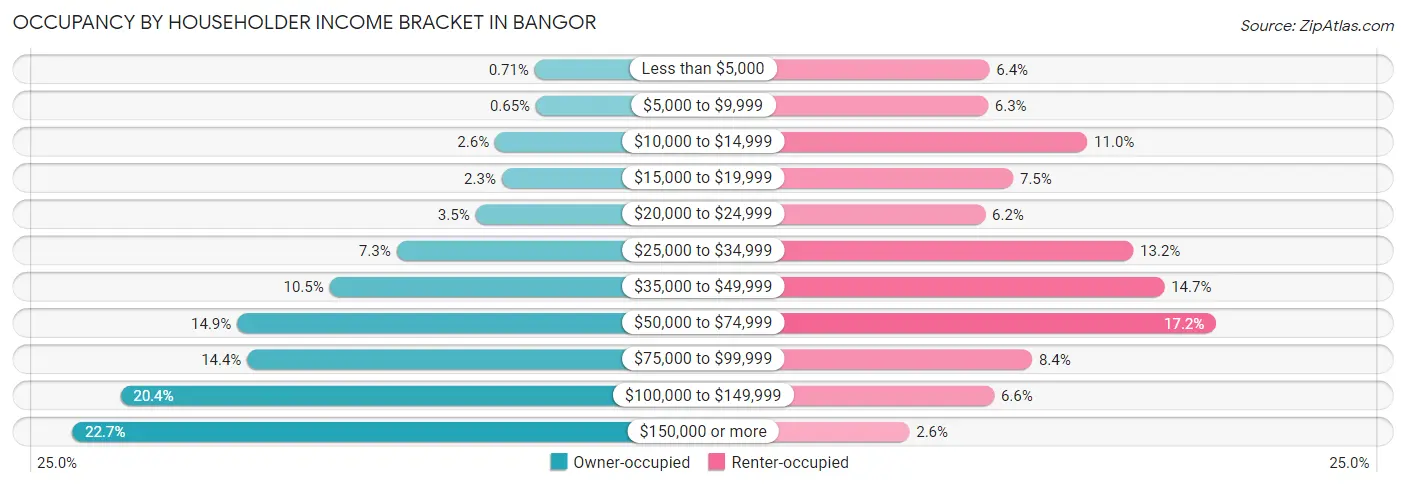
| Income Bracket | Owner-occupied | Renter-occupied |
| Less than $5,000 | 46 (0.7%) | 477 (6.4%) |
| $5,000 to $9,999 | 42 (0.6%) | 472 (6.3%) |
| $10,000 to $14,999 | 169 (2.6%) | 826 (11.0%) |
| $15,000 to $19,999 | 148 (2.3%) | 562 (7.5%) |
| $20,000 to $24,999 | 229 (3.5%) | 462 (6.2%) |
| $25,000 to $34,999 | 473 (7.3%) | 990 (13.2%) |
| $35,000 to $49,999 | 680 (10.5%) | 1,101 (14.7%) |
| $50,000 to $74,999 | 966 (14.9%) | 1,286 (17.2%) |
| $75,000 to $99,999 | 935 (14.4%) | 629 (8.4%) |
| $100,000 to $149,999 | 1,327 (20.4%) | 494 (6.6%) |
| $150,000 or more | 1,476 (22.7%) | 192 (2.6%) |
| Total | 6,491 (100.0%) | 7,491 (100.0%) |
Monthly Housing Cost Tiers in Bangor
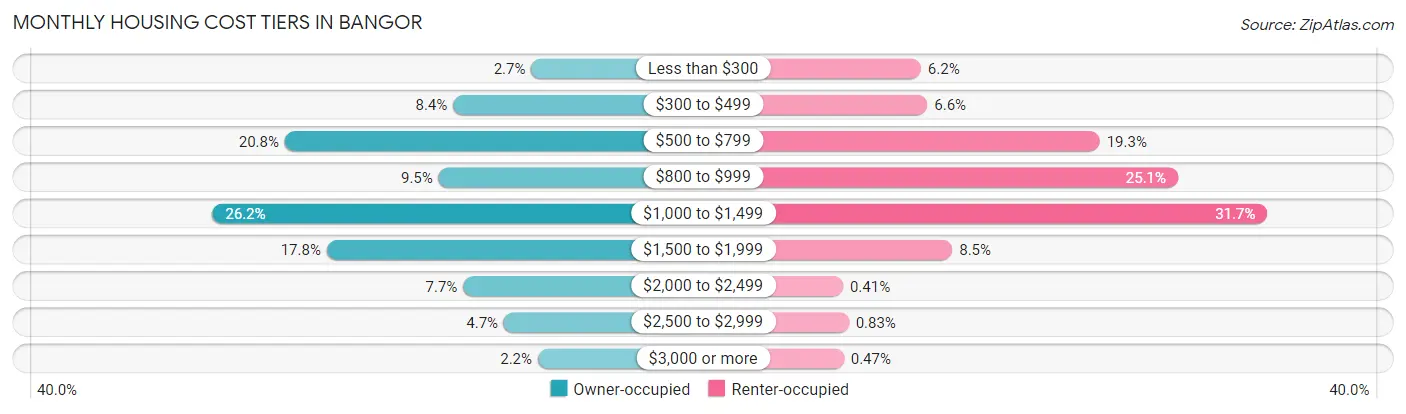
| Monthly Cost | Owner-occupied | Renter-occupied |
| Less than $300 | 174 (2.7%) | 461 (6.1%) |
| $300 to $499 | 548 (8.4%) | 496 (6.6%) |
| $500 to $799 | 1,353 (20.8%) | 1,447 (19.3%) |
| $800 to $999 | 617 (9.5%) | 1,878 (25.1%) |
| $1,000 to $1,499 | 1,699 (26.2%) | 2,372 (31.7%) |
| $1,500 to $1,999 | 1,152 (17.7%) | 634 (8.5%) |
| $2,000 to $2,499 | 500 (7.7%) | 31 (0.4%) |
| $2,500 to $2,999 | 305 (4.7%) | 62 (0.8%) |
| $3,000 or more | 143 (2.2%) | 35 (0.5%) |
| Total | 6,491 (100.0%) | 7,491 (100.0%) |
Physical Housing Characteristics in Bangor
Housing Structures in Bangor
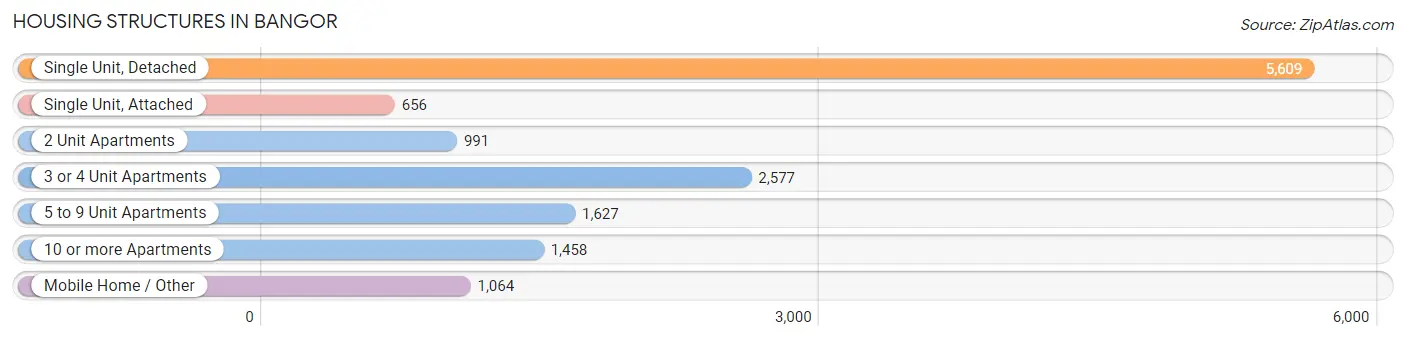
| Structure Type | # Housing Units | % Housing Units |
| Single Unit, Detached | 5,609 | 40.1% |
| Single Unit, Attached | 656 | 4.7% |
| 2 Unit Apartments | 991 | 7.1% |
| 3 or 4 Unit Apartments | 2,577 | 18.4% |
| 5 to 9 Unit Apartments | 1,627 | 11.6% |
| 10 or more Apartments | 1,458 | 10.4% |
| Mobile Home / Other | 1,064 | 7.6% |
| Total | 13,982 | 100.0% |
Housing Structures by Occupancy in Bangor
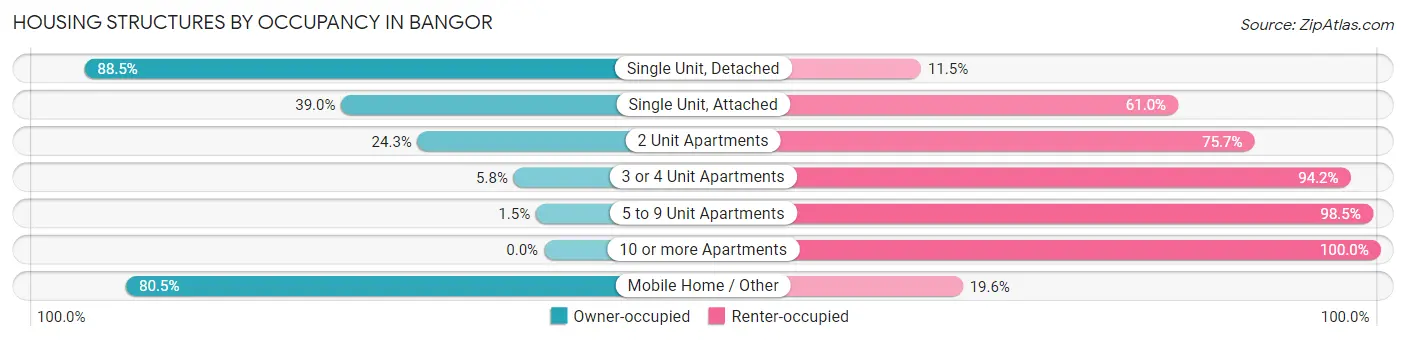
| Structure Type | Owner-occupied | Renter-occupied |
| Single Unit, Detached | 4,963 (88.5%) | 646 (11.5%) |
| Single Unit, Attached | 256 (39.0%) | 400 (61.0%) |
| 2 Unit Apartments | 241 (24.3%) | 750 (75.7%) |
| 3 or 4 Unit Apartments | 150 (5.8%) | 2,427 (94.2%) |
| 5 to 9 Unit Apartments | 25 (1.5%) | 1,602 (98.5%) |
| 10 or more Apartments | 0 (0.0%) | 1,458 (100.0%) |
| Mobile Home / Other | 856 (80.4%) | 208 (19.6%) |
| Total | 6,491 (46.4%) | 7,491 (53.6%) |
Housing Structures by Number of Rooms in Bangor
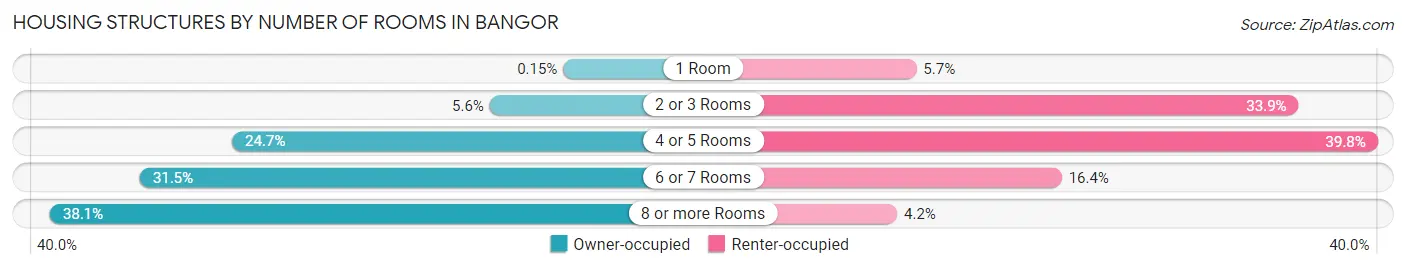
| Number of Rooms | Owner-occupied | Renter-occupied |
| 1 Room | 10 (0.2%) | 424 (5.7%) |
| 2 or 3 Rooms | 363 (5.6%) | 2,541 (33.9%) |
| 4 or 5 Rooms | 1,600 (24.6%) | 2,980 (39.8%) |
| 6 or 7 Rooms | 2,043 (31.5%) | 1,229 (16.4%) |
| 8 or more Rooms | 2,475 (38.1%) | 317 (4.2%) |
| Total | 6,491 (100.0%) | 7,491 (100.0%) |
Housing Structure by Heating Type in Bangor
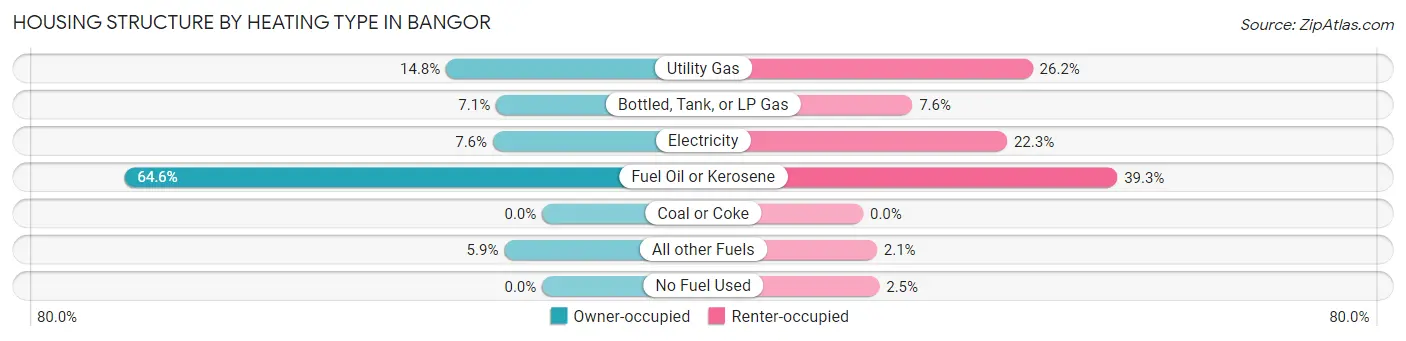
| Heating Type | Owner-occupied | Renter-occupied |
| Utility Gas | 963 (14.8%) | 1,964 (26.2%) |
| Bottled, Tank, or LP Gas | 463 (7.1%) | 569 (7.6%) |
| Electricity | 494 (7.6%) | 1,667 (22.3%) |
| Fuel Oil or Kerosene | 4,191 (64.6%) | 2,943 (39.3%) |
| Coal or Coke | 0 (0.0%) | 0 (0.0%) |
| All other Fuels | 380 (5.9%) | 160 (2.1%) |
| No Fuel Used | 0 (0.0%) | 188 (2.5%) |
| Total | 6,491 (100.0%) | 7,491 (100.0%) |
Household Vehicle Usage in Bangor
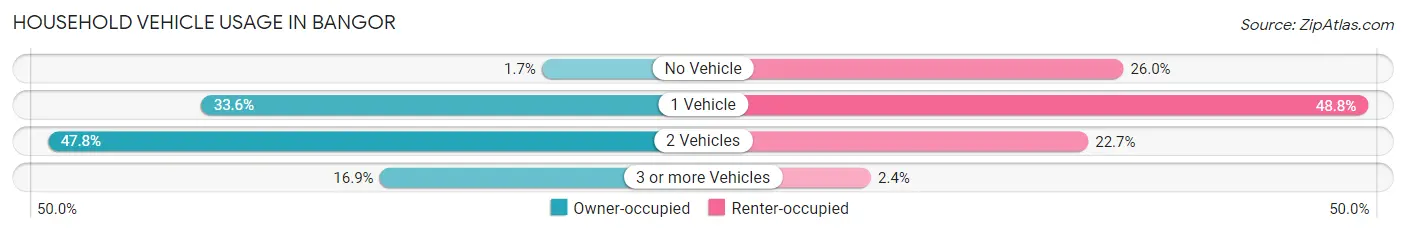
| Vehicles per Household | Owner-occupied | Renter-occupied |
| No Vehicle | 112 (1.7%) | 1,948 (26.0%) |
| 1 Vehicle | 2,178 (33.6%) | 3,658 (48.8%) |
| 2 Vehicles | 3,105 (47.8%) | 1,702 (22.7%) |
| 3 or more Vehicles | 1,096 (16.9%) | 183 (2.4%) |
| Total | 6,491 (100.0%) | 7,491 (100.0%) |
Real Estate & Mortgages in Bangor
Real Estate and Mortgage Overview in Bangor
| Characteristic | Without Mortgage | With Mortgage |
| Housing Units | 2,529 | 3,962 |
| Median Property Value | $164,800 | $199,900 |
| Median Household Income | $61,909 | $1,095 |
| Monthly Housing Costs | $663 | $143 |
| Real Estate Taxes | $2,567 | $52 |
Property Value by Mortgage Status in Bangor
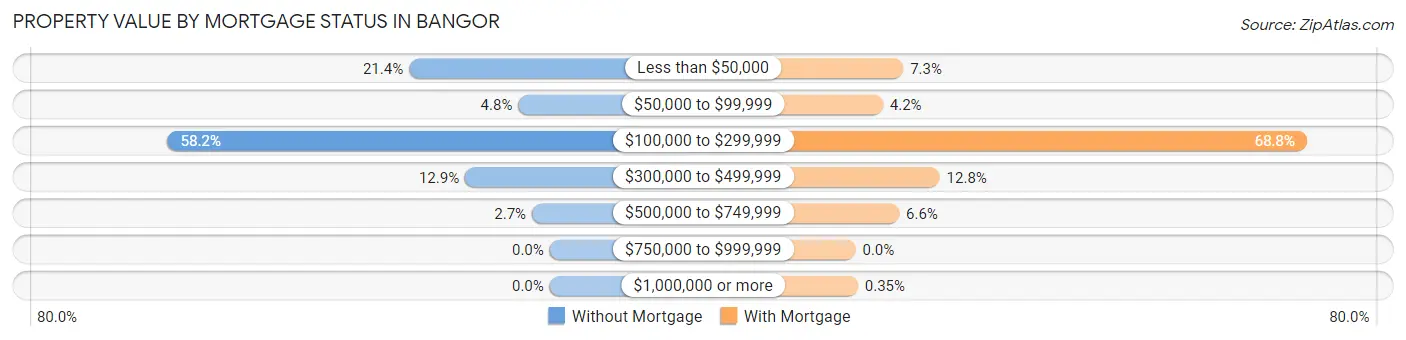
| Property Value | Without Mortgage | With Mortgage |
| Less than $50,000 | 542 (21.4%) | 288 (7.3%) |
| $50,000 to $99,999 | 121 (4.8%) | 165 (4.2%) |
| $100,000 to $299,999 | 1,472 (58.2%) | 2,724 (68.8%) |
| $300,000 to $499,999 | 326 (12.9%) | 508 (12.8%) |
| $500,000 to $749,999 | 68 (2.7%) | 263 (6.6%) |
| $750,000 to $999,999 | 0 (0.0%) | 0 (0.0%) |
| $1,000,000 or more | 0 (0.0%) | 14 (0.4%) |
| Total | 2,529 (100.0%) | 3,962 (100.0%) |
Household Income by Mortgage Status in Bangor
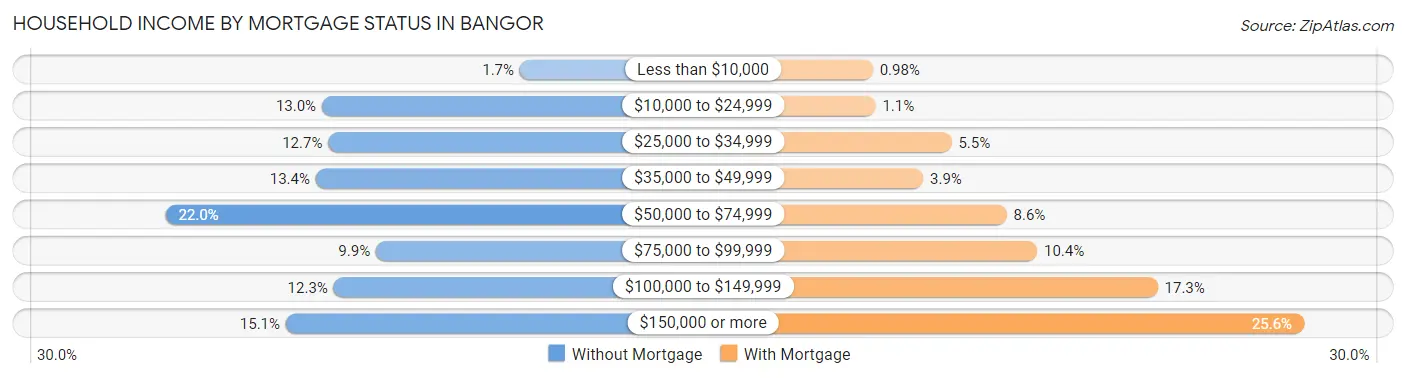
| Household Income | Without Mortgage | With Mortgage |
| Less than $10,000 | 43 (1.7%) | 39 (1.0%) |
| $10,000 to $24,999 | 329 (13.0%) | 45 (1.1%) |
| $25,000 to $34,999 | 320 (12.7%) | 217 (5.5%) |
| $35,000 to $49,999 | 338 (13.4%) | 153 (3.9%) |
| $50,000 to $74,999 | 555 (22.0%) | 342 (8.6%) |
| $75,000 to $99,999 | 251 (9.9%) | 411 (10.4%) |
| $100,000 to $149,999 | 312 (12.3%) | 684 (17.3%) |
| $150,000 or more | 381 (15.1%) | 1,015 (25.6%) |
| Total | 2,529 (100.0%) | 3,962 (100.0%) |
Property Value to Household Income Ratio in Bangor
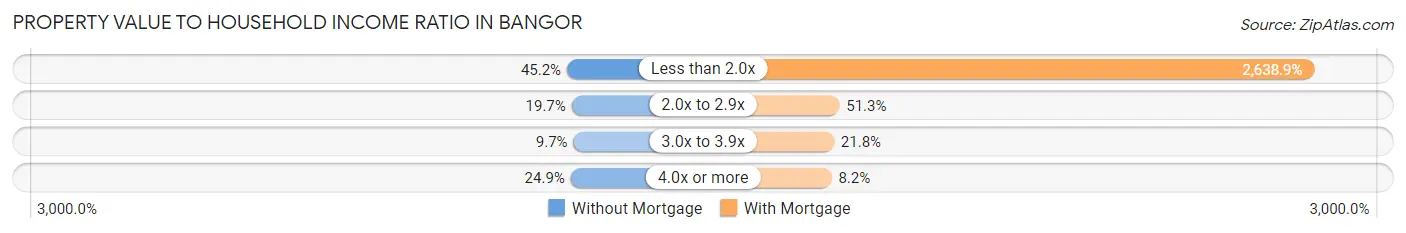
| Value-to-Income Ratio | Without Mortgage | With Mortgage |
| Less than 2.0x | 1,143 (45.2%) | 104,554 (2,638.9%) |
| 2.0x to 2.9x | 497 (19.7%) | 2,031 (51.3%) |
| 3.0x to 3.9x | 244 (9.7%) | 864 (21.8%) |
| 4.0x or more | 629 (24.9%) | 325 (8.2%) |
| Total | 2,529 (100.0%) | 3,962 (100.0%) |
Real Estate Taxes by Mortgage Status in Bangor
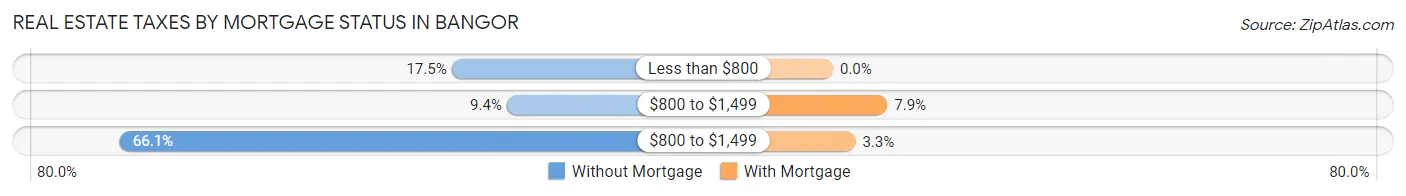
| Property Taxes | Without Mortgage | With Mortgage |
| Less than $800 | 442 (17.5%) | 0 (0.0%) |
| $800 to $1,499 | 238 (9.4%) | 314 (7.9%) |
| $800 to $1,499 | 1,671 (66.1%) | 130 (3.3%) |
| Total | 2,529 (100.0%) | 3,962 (100.0%) |
Health & Disability in Bangor
Health Insurance Coverage by Age in Bangor
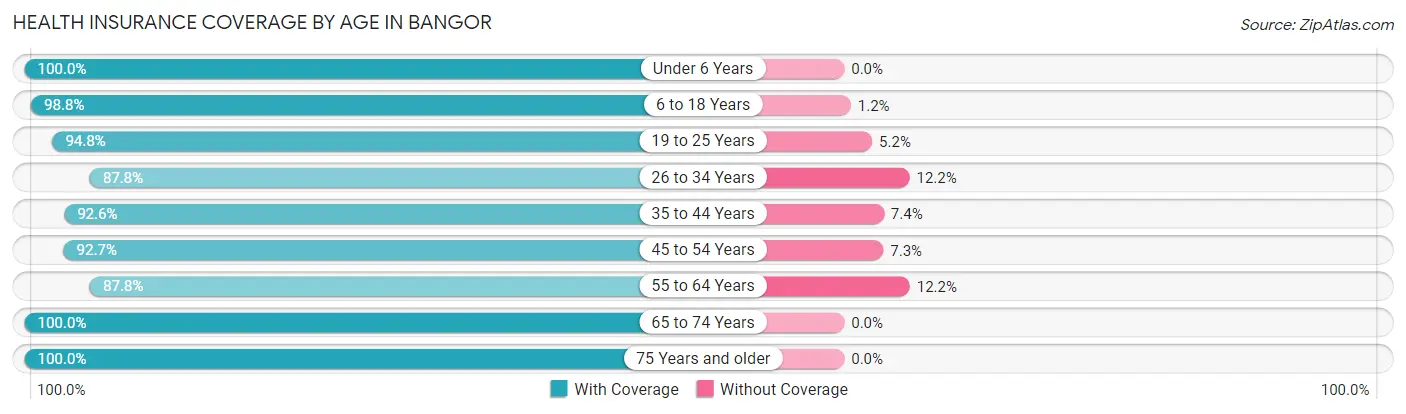
| Age Bracket | With Coverage | Without Coverage |
| Under 6 Years | 1,616 (100.0%) | 0 (0.0%) |
| 6 to 18 Years | 4,207 (98.8%) | 52 (1.2%) |
| 19 to 25 Years | 3,156 (94.8%) | 173 (5.2%) |
| 26 to 34 Years | 4,035 (87.8%) | 559 (12.2%) |
| 35 to 44 Years | 3,422 (92.6%) | 273 (7.4%) |
| 45 to 54 Years | 3,695 (92.7%) | 290 (7.3%) |
| 55 to 64 Years | 3,455 (87.8%) | 481 (12.2%) |
| 65 to 74 Years | 3,075 (100.0%) | 0 (0.0%) |
| 75 Years and older | 2,301 (100.0%) | 0 (0.0%) |
| Total | 28,962 (94.1%) | 1,828 (5.9%) |
Health Insurance Coverage by Citizenship Status in Bangor
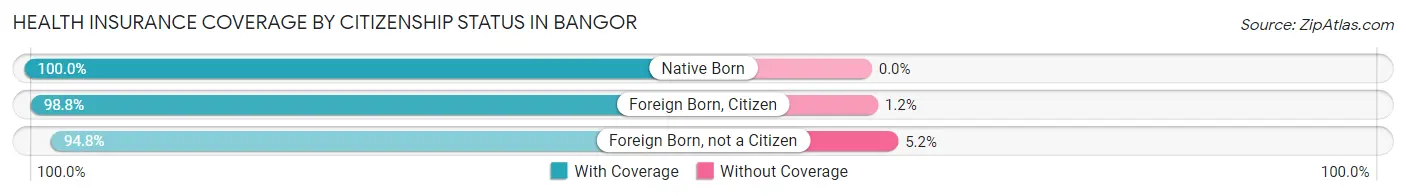
| Citizenship Status | With Coverage | Without Coverage |
| Native Born | 1,616 (100.0%) | 0 (0.0%) |
| Foreign Born, Citizen | 4,207 (98.8%) | 52 (1.2%) |
| Foreign Born, not a Citizen | 3,156 (94.8%) | 173 (5.2%) |
Health Insurance Coverage by Household Income in Bangor
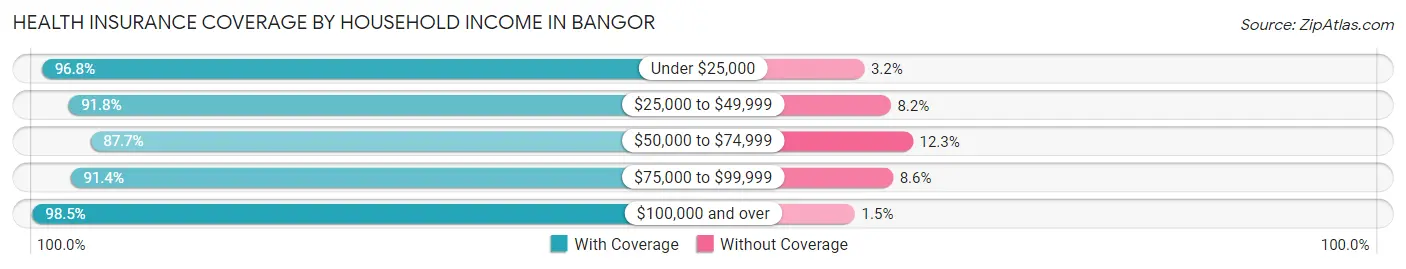
| Household Income | With Coverage | Without Coverage |
| Under $25,000 | 4,627 (96.8%) | 154 (3.2%) |
| $25,000 to $49,999 | 4,897 (91.8%) | 436 (8.2%) |
| $50,000 to $74,999 | 4,431 (87.7%) | 622 (12.3%) |
| $75,000 to $99,999 | 3,377 (91.4%) | 318 (8.6%) |
| $100,000 and over | 10,330 (98.5%) | 154 (1.5%) |
Public vs Private Health Insurance Coverage by Age in Bangor
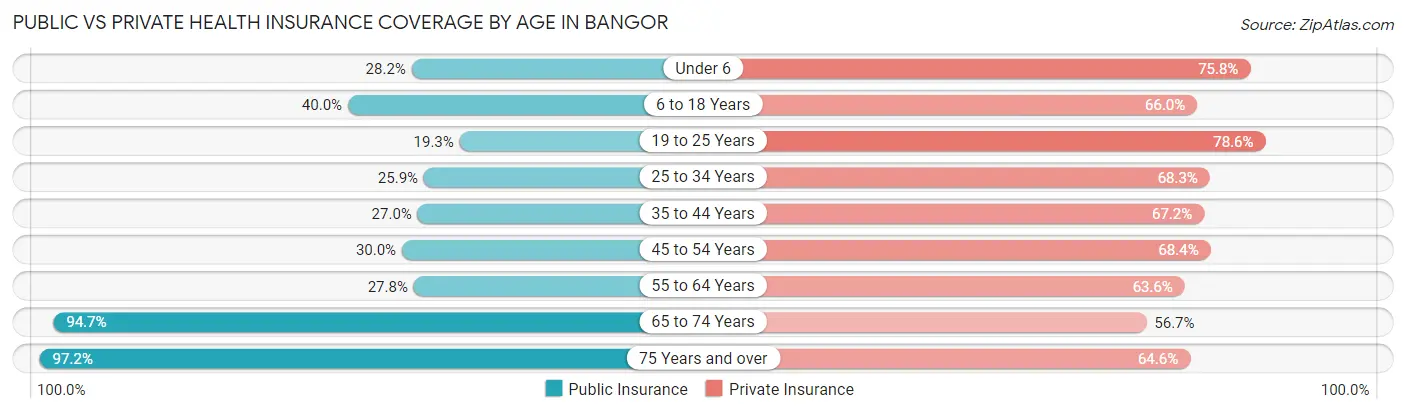
| Age Bracket | Public Insurance | Private Insurance |
| Under 6 | 455 (28.2%) | 1,225 (75.8%) |
| 6 to 18 Years | 1,703 (40.0%) | 2,809 (65.9%) |
| 19 to 25 Years | 641 (19.3%) | 2,617 (78.6%) |
| 25 to 34 Years | 1,189 (25.9%) | 3,137 (68.3%) |
| 35 to 44 Years | 999 (27.0%) | 2,484 (67.2%) |
| 45 to 54 Years | 1,194 (30.0%) | 2,727 (68.4%) |
| 55 to 64 Years | 1,093 (27.8%) | 2,505 (63.6%) |
| 65 to 74 Years | 2,911 (94.7%) | 1,744 (56.7%) |
| 75 Years and over | 2,237 (97.2%) | 1,487 (64.6%) |
| Total | 12,422 (40.3%) | 20,735 (67.3%) |
Disability Status by Sex by Age in Bangor
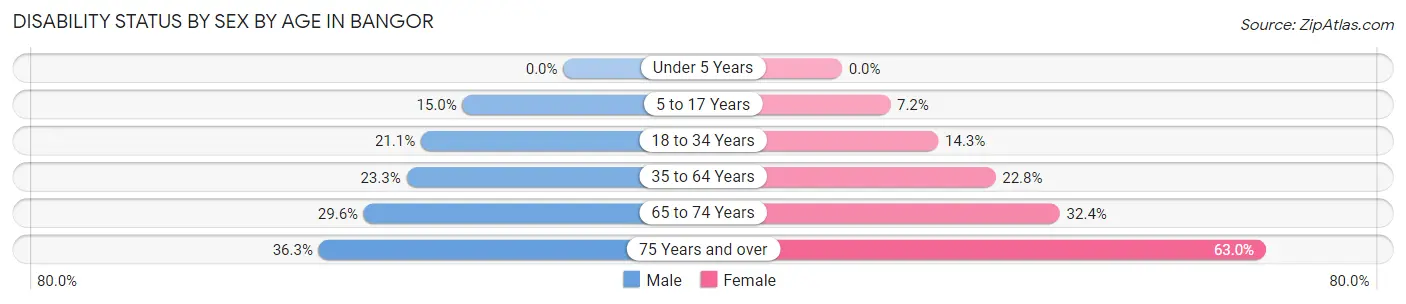
| Age Bracket | Male | Female |
| Under 5 Years | 0 (0.0%) | 0 (0.0%) |
| 5 to 17 Years | 281 (15.0%) | 152 (7.2%) |
| 18 to 34 Years | 905 (21.1%) | 581 (14.3%) |
| 35 to 64 Years | 1,243 (23.3%) | 1,431 (22.8%) |
| 65 to 74 Years | 377 (29.6%) | 583 (32.4%) |
| 75 Years and over | 353 (36.3%) | 837 (63.0%) |
Disability Class by Sex by Age in Bangor
Disability Class: Hearing Difficulty
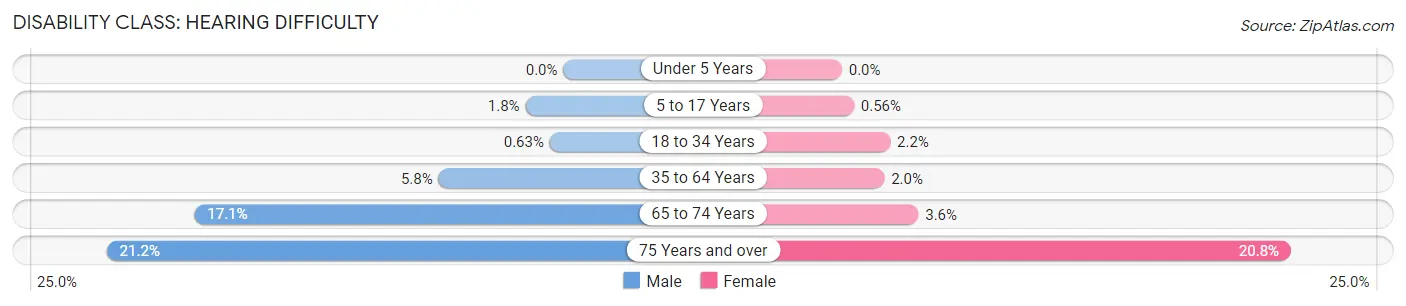
| Age Bracket | Male | Female |
| Under 5 Years | 0 (0.0%) | 0 (0.0%) |
| 5 to 17 Years | 33 (1.8%) | 12 (0.6%) |
| 18 to 34 Years | 27 (0.6%) | 91 (2.2%) |
| 35 to 64 Years | 309 (5.8%) | 124 (2.0%) |
| 65 to 74 Years | 218 (17.1%) | 64 (3.5%) |
| 75 Years and over | 206 (21.2%) | 277 (20.8%) |
Disability Class: Vision Difficulty
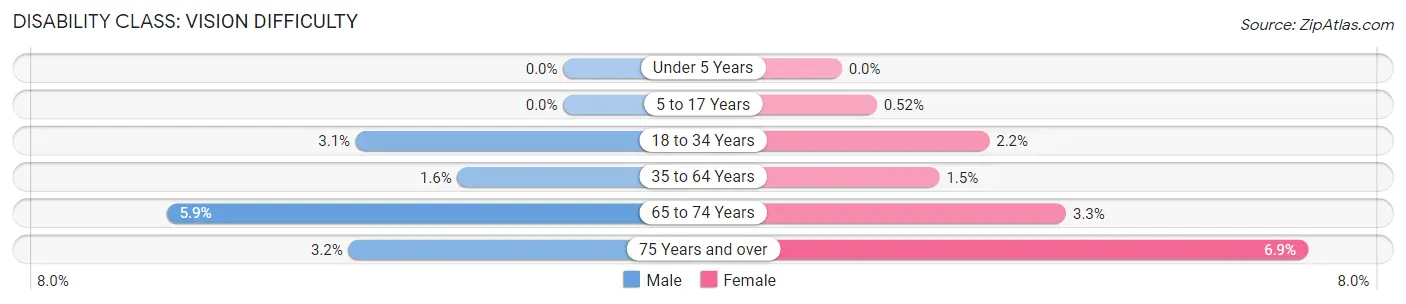
| Age Bracket | Male | Female |
| Under 5 Years | 0 (0.0%) | 0 (0.0%) |
| 5 to 17 Years | 0 (0.0%) | 11 (0.5%) |
| 18 to 34 Years | 132 (3.1%) | 89 (2.2%) |
| 35 to 64 Years | 84 (1.6%) | 91 (1.5%) |
| 65 to 74 Years | 75 (5.9%) | 60 (3.3%) |
| 75 Years and over | 31 (3.2%) | 92 (6.9%) |
Disability Class: Cognitive Difficulty
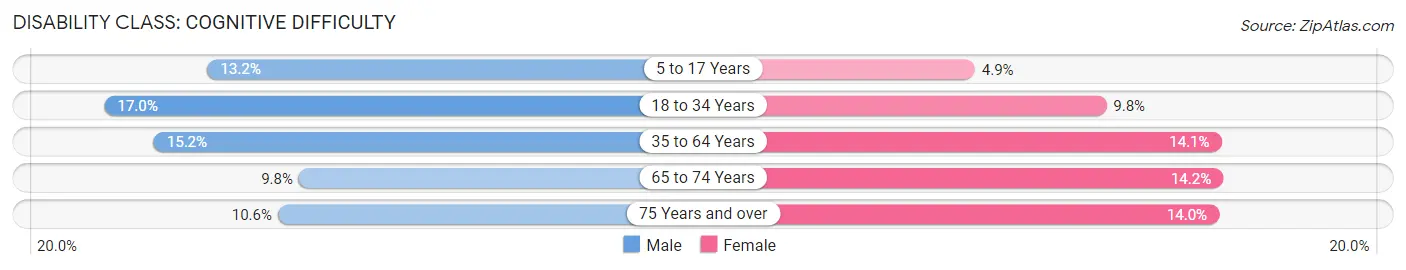
| Age Bracket | Male | Female |
| 5 to 17 Years | 248 (13.2%) | 105 (4.9%) |
| 18 to 34 Years | 729 (17.0%) | 399 (9.8%) |
| 35 to 64 Years | 811 (15.2%) | 885 (14.1%) |
| 65 to 74 Years | 125 (9.8%) | 255 (14.1%) |
| 75 Years and over | 103 (10.6%) | 186 (14.0%) |
Disability Class: Ambulatory Difficulty
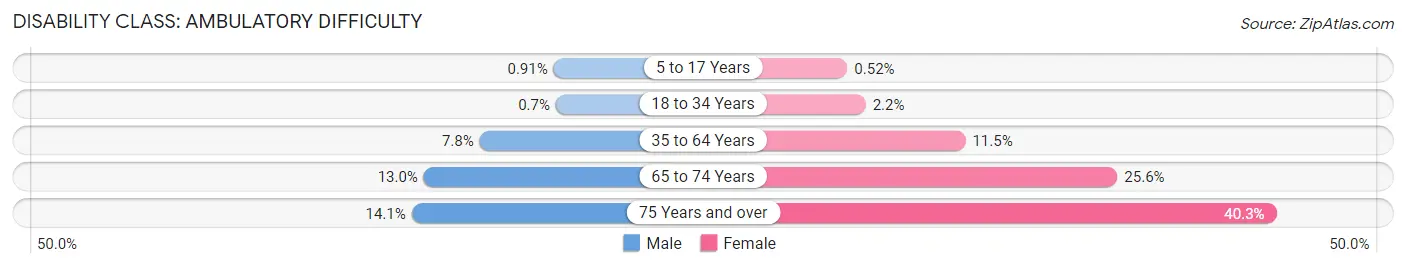
| Age Bracket | Male | Female |
| 5 to 17 Years | 17 (0.9%) | 11 (0.5%) |
| 18 to 34 Years | 30 (0.7%) | 90 (2.2%) |
| 35 to 64 Years | 415 (7.8%) | 721 (11.5%) |
| 65 to 74 Years | 165 (13.0%) | 461 (25.6%) |
| 75 Years and over | 137 (14.1%) | 536 (40.3%) |
Disability Class: Self-Care Difficulty
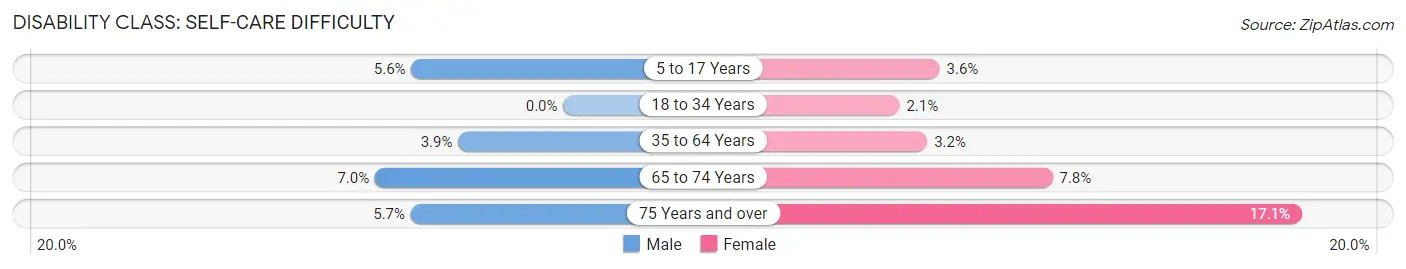
| Age Bracket | Male | Female |
| 5 to 17 Years | 106 (5.6%) | 77 (3.6%) |
| 18 to 34 Years | 0 (0.0%) | 87 (2.1%) |
| 35 to 64 Years | 208 (3.9%) | 199 (3.2%) |
| 65 to 74 Years | 89 (7.0%) | 141 (7.8%) |
| 75 Years and over | 55 (5.7%) | 227 (17.1%) |
Technology Access in Bangor
Computing Device Access in Bangor
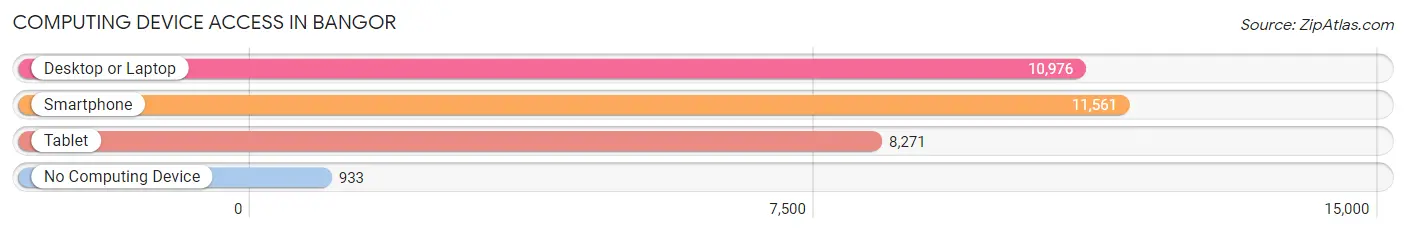
| Device Type | # Households | % Households |
| Desktop or Laptop | 10,976 | 78.5% |
| Smartphone | 11,561 | 82.7% |
| Tablet | 8,271 | 59.2% |
| No Computing Device | 933 | 6.7% |
| Total | 13,982 | 100.0% |
Internet Access in Bangor
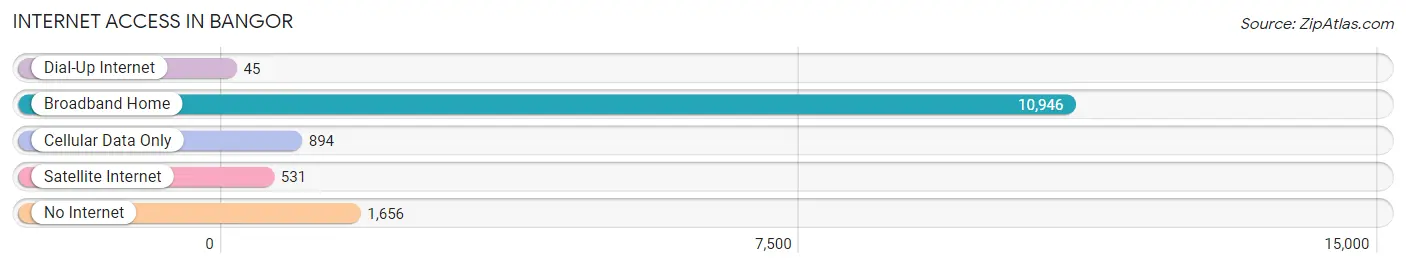
| Internet Type | # Households | % Households |
| Dial-Up Internet | 45 | 0.3% |
| Broadband Home | 10,946 | 78.3% |
| Cellular Data Only | 894 | 6.4% |
| Satellite Internet | 531 | 3.8% |
| No Internet | 1,656 | 11.8% |
| Total | 13,982 | 100.0% |
Bangor Summary
Bangor, Maine is a city located in Penobscot County, Maine, United States. It is the county seat of Penobscot County and the third-largest city in the state. The population of Bangor was 33,039 at the 2010 census, making it the most populous city in the state.
History
The area that is now Bangor was originally inhabited by the Penobscot people. The first European settlers arrived in the area in 1769, and the city was incorporated in 1791. The city was named after the biblical city of Bangor, which is mentioned in the Bible.
Bangor was an important port city during the 19th century, and it was a major lumbering center. The city was also a major shipbuilding center during the Civil War.
Geography
Bangor is located at the confluence of the Penobscot and Kenduskeag rivers. The city is situated on the eastern side of the Penobscot River, and it is bordered by the towns of Hermon, Hampden, and Brewer.
The city has a total area of 33.2 square miles, of which 32.2 square miles is land and 1.0 square mile is water.
Economy
Bangor is the economic and cultural center of the region. The city is home to several major employers, including Eastern Maine Medical Center, Bangor International Airport, and the University of Maine.
The city is also home to several major industries, including paper and wood products, health care, and tourism.
Demographics
As of the 2010 census, there were 33,039 people, 14,845 households, and 8,845 families residing in the city. The population density was 1,019.3 people per square mile. The racial makeup of the city was 94.2% White, 1.3% African American, 0.7% Native American, 1.2% Asian, 0.1% Pacific Islander, 0.7% from other races, and 1.9% from two or more races.
The median income for a household in the city was $37,837, and the median income for a family was $48,927. The per capita income for the city was $21,845. About 14.2% of families and 18.3% of the population were below the poverty line, including 25.2% of those under age 18 and 11.2% of those age 65 or over.
Bangor is a diverse city with a rich history and a vibrant economy. The city is home to a variety of industries, and it is a major cultural and economic center in the region. The city has a strong sense of community, and it is a great place to live and work.
Common Questions
What is Per Capita Income in Bangor?
Per Capita income in Bangor is $36,120.
What is the Median Family Income in Bangor?
Median Family Income in Bangor is $78,803.
What is the Median Household income in Bangor?
Median Household Income in Bangor is $52,438.
What is Income or Wage Gap in Bangor?
Income or Wage Gap in Bangor is 18.7%.
Women in Bangor earn 81.3 cents for every dollar earned by a man.
What is Family Income Deficit in Bangor?
Family Income Deficit in Bangor is $7,403.
Families that are below poverty line in Bangor earn $7,403 less on average than the poverty threshold level.
What is Inequality or Gini Index in Bangor?
Inequality or Gini Index in Bangor is 0.51.
What is the Total Population of Bangor?
Total Population of Bangor is 31,705.
What is the Total Male Population of Bangor?
Total Male Population of Bangor is 14,749.
What is the Total Female Population of Bangor?
Total Female Population of Bangor is 16,956.
What is the Ratio of Males per 100 Females in Bangor?
There are 86.98 Males per 100 Females in Bangor.
What is the Ratio of Females per 100 Males in Bangor?
There are 114.96 Females per 100 Males in Bangor.
What is the Median Population Age in Bangor?
Median Population Age in Bangor is 40.6 Years.
What is the Average Family Size in Bangor
Average Family Size in Bangor is 2.9 People.
What is the Average Household Size in Bangor
Average Household Size in Bangor is 2.1 People.
How Large is the Labor Force in Bangor?
There are 16,263 People in the Labor Forcein in Bangor.
What is the Percentage of People in the Labor Force in Bangor?
59.9% of People are in the Labor Force in Bangor.
What is the Unemployment Rate in Bangor?
Unemployment Rate in Bangor is 4.5%.