Kennebec County, ME Map & Demographics
Kennebec County Map
Kennebec County Overview
$36,009
PER CAPITA INCOME
$81,228
AVG FAMILY INCOME
$62,118
AVG HOUSEHOLD INCOME
19.2%
WAGE / INCOME GAP [ % ]
80.8¢/ $1
WAGE / INCOME GAP [ $ ]
$9,362
FAMILY INCOME DEFICIT
0.44
INEQUALITY / GINI INDEX
124,003
TOTAL POPULATION
60,678
MALE POPULATION
63,325
FEMALE POPULATION
95.82
MALES / 100 FEMALES
104.36
FEMALES / 100 MALES
44.3
MEDIAN AGE
2.8
AVG FAMILY SIZE
2.2
AVG HOUSEHOLD SIZE
63,075
LABOR FORCE [ PEOPLE ]
61.1%
PERCENT IN LABOR FORCE
4.1%
UNEMPLOYMENT RATE
Kennebec County Area Codes
Income in Kennebec County
Income Overview in Kennebec County
Per Capita Income in Kennebec County is $36,009, while median incomes of families and households are $81,228 and $62,118 respectively.
| Characteristic | Number | Measure |
| Per Capita Income | 124,003 | $36,009 |
| Median Family Income | 32,252 | $81,228 |
| Mean Family Income | 32,252 | $98,294 |
| Median Household Income | 53,452 | $62,118 |
| Mean Household Income | 53,452 | $81,937 |
| Income Deficit | 32,252 | $9,362 |
| Wage / Income Gap (%) | 124,003 | 19.21% |
| Wage / Income Gap ($) | 124,003 | 80.79¢ per $1 |
| Gini / Inequality Index | 124,003 | 0.44 |
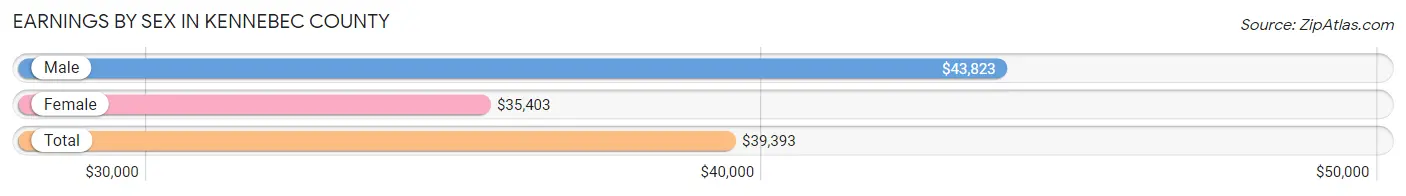
Earnings by Sex in Kennebec County
Average Earnings in Kennebec County are $39,393, $43,823 for men and $35,403 for women, a difference of 19.2%.
| Sex | Number | Average Earnings |
| Male | 34,323 (51.2%) | $43,823 |
| Female | 32,715 (48.8%) | $35,403 |
| Total | 67,038 (100.0%) | $39,393 |
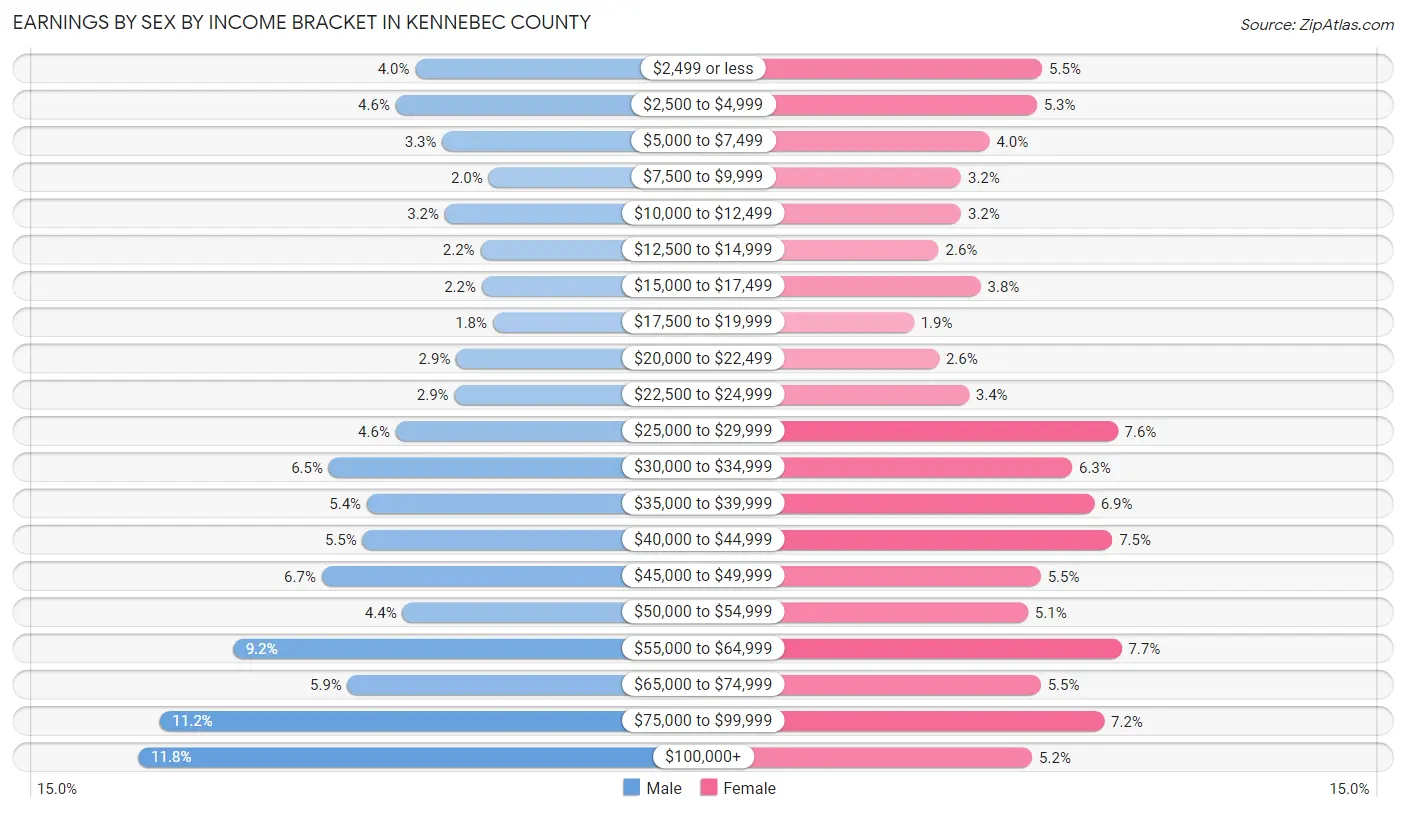
Earnings by Sex by Income Bracket in Kennebec County
The most common earnings brackets in Kennebec County are $100,000+ for men (4,055 | 11.8%) and $55,000 to $64,999 for women (2,527 | 7.7%).
| Income | Male | Female |
| $2,499 or less | 1,380 (4.0%) | 1,795 (5.5%) |
| $2,500 to $4,999 | 1,567 (4.6%) | 1,747 (5.3%) |
| $5,000 to $7,499 | 1,118 (3.3%) | 1,313 (4.0%) |
| $7,500 to $9,999 | 673 (2.0%) | 1,049 (3.2%) |
| $10,000 to $12,499 | 1,096 (3.2%) | 1,051 (3.2%) |
| $12,500 to $14,999 | 751 (2.2%) | 845 (2.6%) |
| $15,000 to $17,499 | 738 (2.1%) | 1,231 (3.8%) |
| $17,500 to $19,999 | 630 (1.8%) | 614 (1.9%) |
| $20,000 to $22,499 | 985 (2.9%) | 847 (2.6%) |
| $22,500 to $24,999 | 1,003 (2.9%) | 1,123 (3.4%) |
| $25,000 to $29,999 | 1,570 (4.6%) | 2,489 (7.6%) |
| $30,000 to $34,999 | 2,215 (6.5%) | 2,071 (6.3%) |
| $35,000 to $39,999 | 1,846 (5.4%) | 2,271 (6.9%) |
| $40,000 to $44,999 | 1,889 (5.5%) | 2,442 (7.5%) |
| $45,000 to $49,999 | 2,281 (6.7%) | 1,782 (5.4%) |
| $50,000 to $54,999 | 1,505 (4.4%) | 1,666 (5.1%) |
| $55,000 to $64,999 | 3,142 (9.1%) | 2,527 (7.7%) |
| $65,000 to $74,999 | 2,032 (5.9%) | 1,784 (5.4%) |
| $75,000 to $99,999 | 3,847 (11.2%) | 2,364 (7.2%) |
| $100,000+ | 4,055 (11.8%) | 1,704 (5.2%) |
| Total | 34,323 (100.0%) | 32,715 (100.0%) |
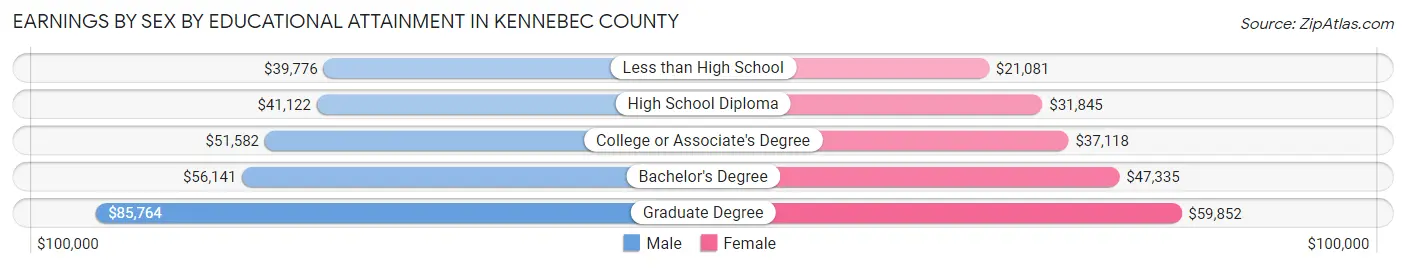
Earnings by Sex by Educational Attainment in Kennebec County
Average earnings in Kennebec County are $48,481 for men and $40,297 for women, a difference of 16.9%. Men with an educational attainment of graduate degree enjoy the highest average annual earnings of $85,764, while those with less than high school education earn the least with $39,776. Women with an educational attainment of graduate degree earn the most with the average annual earnings of $59,852, while those with less than high school education have the smallest earnings of $21,081.
| Educational Attainment | Male Income | Female Income |
| Less than High School | $39,776 | $21,081 |
| High School Diploma | $41,122 | $31,845 |
| College or Associate's Degree | $51,582 | $37,118 |
| Bachelor's Degree | $56,141 | $47,335 |
| Graduate Degree | $85,764 | $59,852 |
| Total | $48,481 | $40,297 |
Family Income in Kennebec County
Family Income Brackets in Kennebec County
According to the Kennebec County family income data, there are 7,257 families falling into the $100,000 to $149,999 income range, which is the most common income bracket and makes up 22.5% of all families. Conversely, the $10,000 to $14,999 income bracket is the least frequent group with only 419 families (1.3%) belonging to this category.
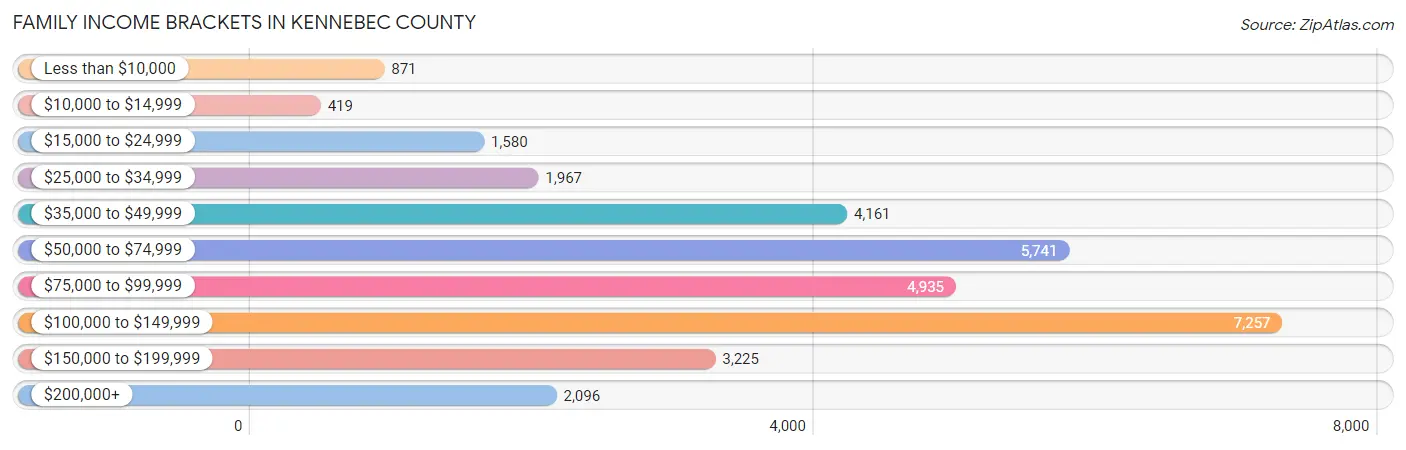
| Income Bracket | # Families | % Families |
| Less than $10,000 | 871 | 2.7% |
| $10,000 to $14,999 | 419 | 1.3% |
| $15,000 to $24,999 | 1,580 | 4.9% |
| $25,000 to $34,999 | 1,967 | 6.1% |
| $35,000 to $49,999 | 4,161 | 12.9% |
| $50,000 to $74,999 | 5,741 | 17.8% |
| $75,000 to $99,999 | 4,935 | 15.3% |
| $100,000 to $149,999 | 7,257 | 22.5% |
| $150,000 to $199,999 | 3,225 | 10.0% |
| $200,000+ | 2,096 | 6.5% |
Family Income by Famaliy Size in Kennebec County
4-person families (4,471 | 13.9%) account for the highest median family income in Kennebec County with $109,472 per family, while 2-person families (17,972 | 55.7%) have the highest median income of $37,470 per family member.
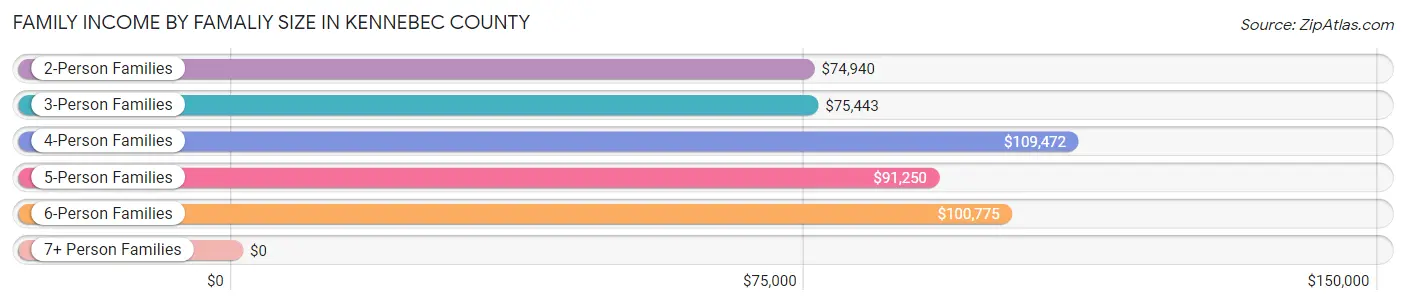
| Income Bracket | # Families | Median Income |
| 2-Person Families | 17,972 (55.7%) | $74,940 |
| 3-Person Families | 7,293 (22.6%) | $75,443 |
| 4-Person Families | 4,471 (13.9%) | $109,472 |
| 5-Person Families | 1,712 (5.3%) | $91,250 |
| 6-Person Families | 580 (1.8%) | $100,775 |
| 7+ Person Families | 224 (0.7%) | $0 |
| Total | 32,252 (100.0%) | $81,228 |
Family Income by Number of Earners in Kennebec County
The median family income in Kennebec County is $81,228, with families comprising 3+ earners (3,095) having the highest median family income of $138,858, while families with no earners (5,891) have the lowest median family income of $45,302, accounting for 9.6% and 18.3% of families, respectively.
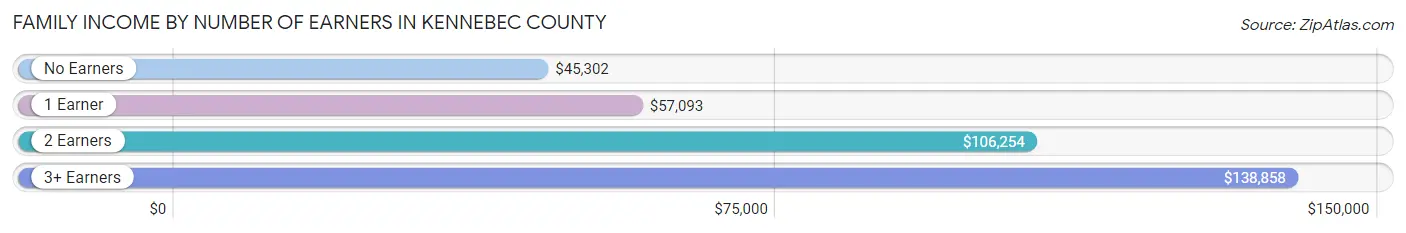
| Number of Earners | # Families | Median Income |
| No Earners | 5,891 (18.3%) | $45,302 |
| 1 Earner | 10,341 (32.1%) | $57,093 |
| 2 Earners | 12,925 (40.1%) | $106,254 |
| 3+ Earners | 3,095 (9.6%) | $138,858 |
| Total | 32,252 (100.0%) | $81,228 |
Household Income in Kennebec County
Household Income Brackets in Kennebec County
With 9,568 households falling in the category, the $50,000 to $74,999 income range is the most frequent in Kennebec County, accounting for 17.9% of all households. In contrast, only 2,085 households (3.9%) fall into the $10,000 to $14,999 income bracket, making it the least populous group.
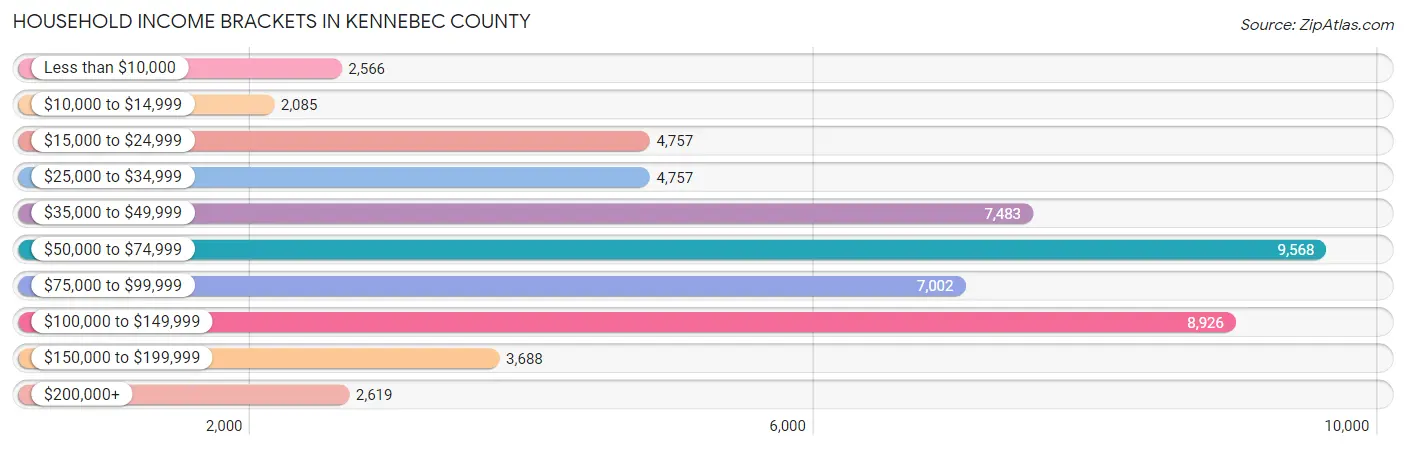
| Income Bracket | # Households | % Households |
| Less than $10,000 | 2,566 | 4.8% |
| $10,000 to $14,999 | 2,085 | 3.9% |
| $15,000 to $24,999 | 4,757 | 8.9% |
| $25,000 to $34,999 | 4,757 | 8.9% |
| $35,000 to $49,999 | 7,483 | 14.0% |
| $50,000 to $74,999 | 9,568 | 17.9% |
| $75,000 to $99,999 | 7,002 | 13.1% |
| $100,000 to $149,999 | 8,926 | 16.7% |
| $150,000 to $199,999 | 3,688 | 6.9% |
| $200,000+ | 2,619 | 4.9% |
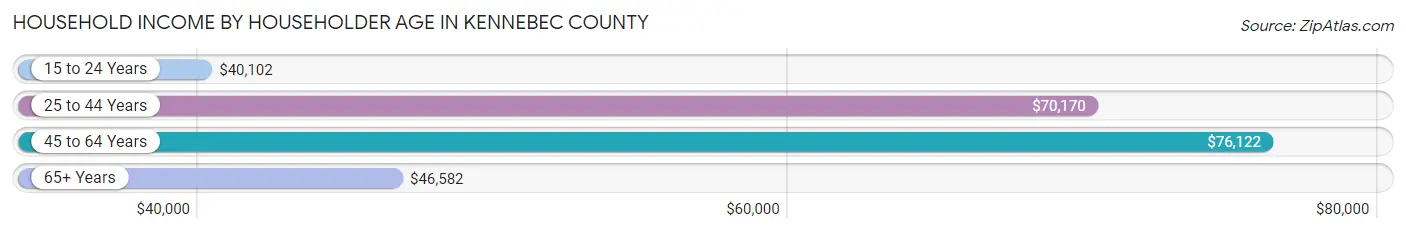
Household Income by Householder Age in Kennebec County
The median household income in Kennebec County is $62,118, with the highest median household income of $76,122 found in the 45 to 64 years age bracket for the primary householder. A total of 20,576 households (38.5%) fall into this category. Meanwhile, the 15 to 24 years age bracket for the primary householder has the lowest median household income of $40,102, with 1,864 households (3.5%) in this group.
| Income Bracket | # Households | Median Income |
| 15 to 24 Years | 1,864 (3.5%) | $40,102 |
| 25 to 44 Years | 14,836 (27.8%) | $70,170 |
| 45 to 64 Years | 20,576 (38.5%) | $76,122 |
| 65+ Years | 16,176 (30.3%) | $46,582 |
| Total | 53,452 (100.0%) | $62,118 |
Poverty in Kennebec County
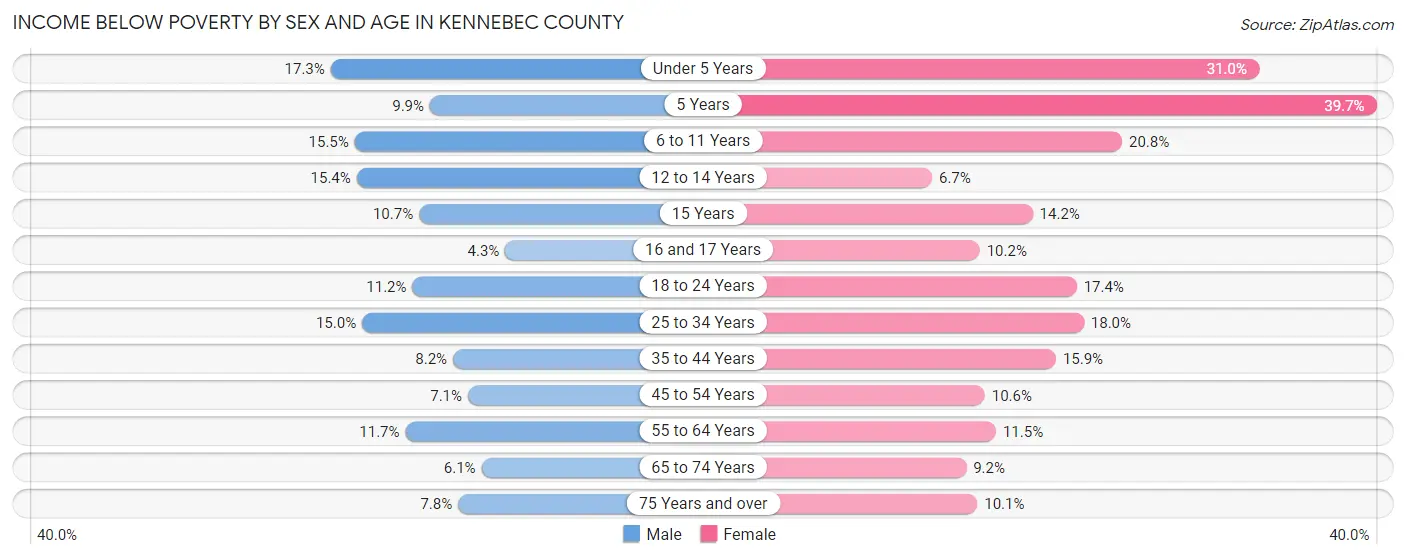
Income Below Poverty by Sex and Age in Kennebec County
With 10.5% poverty level for males and 14.2% for females among the residents of Kennebec County, under 5 year old males and 5 year old females are the most vulnerable to poverty, with 488 males (17.3%) and 233 females (39.7%) in their respective age groups living below the poverty level.
| Age Bracket | Male | Female |
| Under 5 Years | 488 (17.3%) | 914 (31.0%) |
| 5 Years | 78 (9.9%) | 233 (39.7%) |
| 6 to 11 Years | 564 (15.5%) | 772 (20.8%) |
| 12 to 14 Years | 352 (15.3%) | 145 (6.7%) |
| 15 Years | 85 (10.7%) | 87 (14.2%) |
| 16 and 17 Years | 57 (4.3%) | 151 (10.2%) |
| 18 to 24 Years | 500 (11.2%) | 721 (17.4%) |
| 25 to 34 Years | 1,081 (14.9%) | 1,279 (18.0%) |
| 35 to 44 Years | 594 (8.2%) | 1,189 (15.9%) |
| 45 to 54 Years | 554 (7.1%) | 844 (10.6%) |
| 55 to 64 Years | 1,108 (11.7%) | 1,131 (11.5%) |
| 65 to 74 Years | 437 (6.1%) | 739 (9.2%) |
| 75 Years and over | 297 (7.8%) | 538 (10.1%) |
| Total | 6,195 (10.5%) | 8,743 (14.2%) |
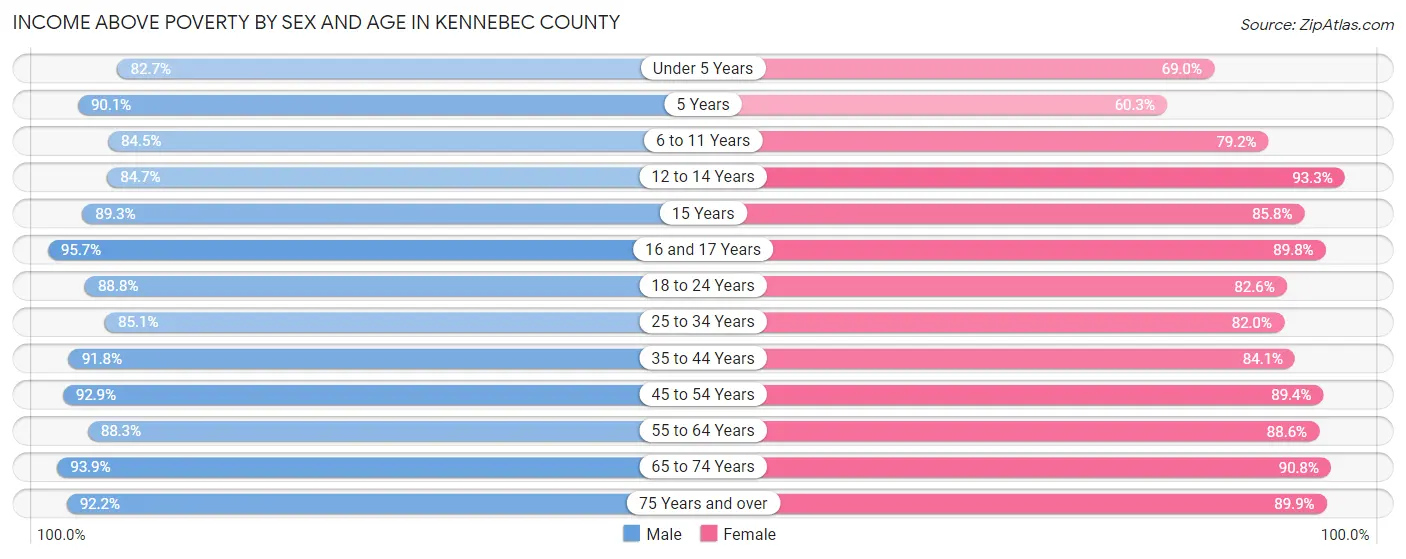
Income Above Poverty by Sex and Age in Kennebec County
According to the poverty statistics in Kennebec County, males aged 16 and 17 years and females aged 12 to 14 years are the age groups that are most secure financially, with 95.7% of males and 93.3% of females in these age groups living above the poverty line.
| Age Bracket | Male | Female |
| Under 5 Years | 2,336 (82.7%) | 2,038 (69.0%) |
| 5 Years | 709 (90.1%) | 354 (60.3%) |
| 6 to 11 Years | 3,074 (84.5%) | 2,937 (79.2%) |
| 12 to 14 Years | 1,941 (84.7%) | 2,018 (93.3%) |
| 15 Years | 708 (89.3%) | 527 (85.8%) |
| 16 and 17 Years | 1,262 (95.7%) | 1,324 (89.8%) |
| 18 to 24 Years | 3,960 (88.8%) | 3,414 (82.6%) |
| 25 to 34 Years | 6,152 (85.1%) | 5,839 (82.0%) |
| 35 to 44 Years | 6,646 (91.8%) | 6,288 (84.1%) |
| 45 to 54 Years | 7,261 (92.9%) | 7,100 (89.4%) |
| 55 to 64 Years | 8,335 (88.3%) | 8,745 (88.5%) |
| 65 to 74 Years | 6,753 (93.9%) | 7,259 (90.8%) |
| 75 Years and over | 3,499 (92.2%) | 4,812 (89.9%) |
| Total | 52,636 (89.5%) | 52,655 (85.8%) |
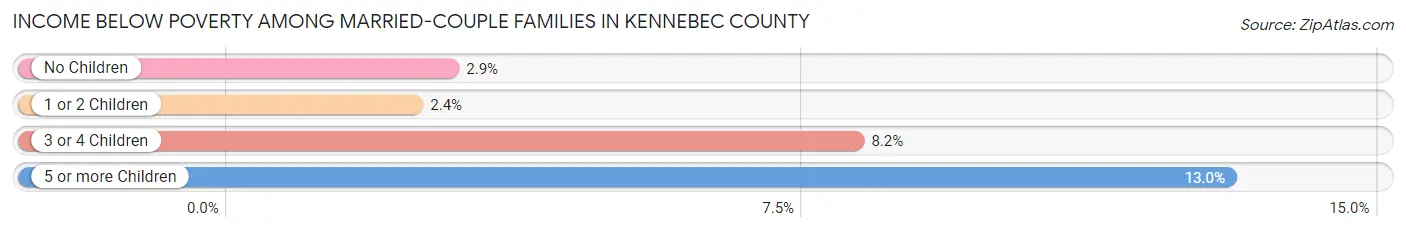
Income Below Poverty Among Married-Couple Families in Kennebec County
The poverty statistics for married-couple families in Kennebec County show that 3.1% or 747 of the total 23,970 families live below the poverty line. Families with 5 or more children have the highest poverty rate of 13.0%, comprising of 12 families. On the other hand, families with 1 or 2 children have the lowest poverty rate of 2.4%, which includes 153 families.
| Children | Above Poverty | Below Poverty |
| No Children | 15,683 (97.1%) | 467 (2.9%) |
| 1 or 2 Children | 6,169 (97.6%) | 153 (2.4%) |
| 3 or 4 Children | 1,291 (91.8%) | 115 (8.2%) |
| 5 or more Children | 80 (87.0%) | 12 (13.0%) |
| Total | 23,223 (96.9%) | 747 (3.1%) |
Income Below Poverty Among Single-Parent Households in Kennebec County
According to the poverty data in Kennebec County, 12.1% or 288 single-father households and 23.9% or 1,412 single-mother households are living below the poverty line. Among single-father households, those with 1 or 2 children have the highest poverty rate, with 200 households (13.9%) experiencing poverty. Likewise, among single-mother households, those with 3 or 4 children have the highest poverty rate, with 261 households (60.6%) falling below the poverty line.
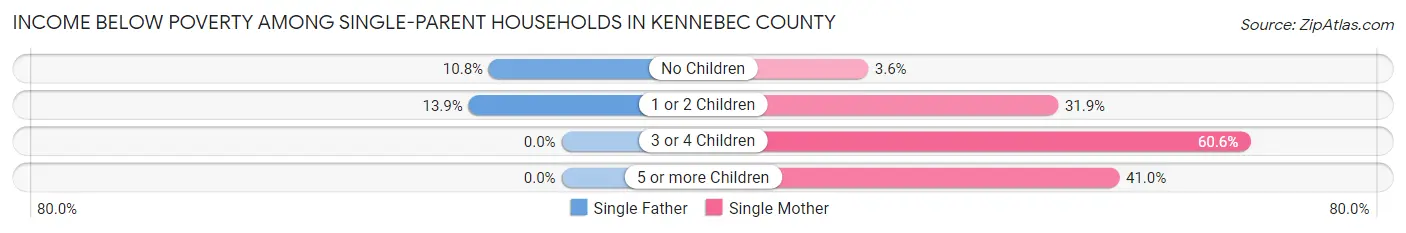
| Children | Single Father | Single Mother |
| No Children | 88 (10.8%) | 76 (3.6%) |
| 1 or 2 Children | 200 (13.9%) | 1,059 (31.9%) |
| 3 or 4 Children | 0 (0.0%) | 261 (60.6%) |
| 5 or more Children | 0 (0.0%) | 16 (41.0%) |
| Total | 288 (12.1%) | 1,412 (23.9%) |
Income Below Poverty Among Married-Couple vs Single-Parent Households in Kennebec County
The poverty data for Kennebec County shows that 747 of the married-couple family households (3.1%) and 1,700 of the single-parent households (20.5%) are living below the poverty level. Within the married-couple family households, those with 5 or more children have the highest poverty rate, with 12 households (13.0%) falling below the poverty line. Among the single-parent households, those with 3 or 4 children have the highest poverty rate, with 261 household (46.7%) living below poverty.
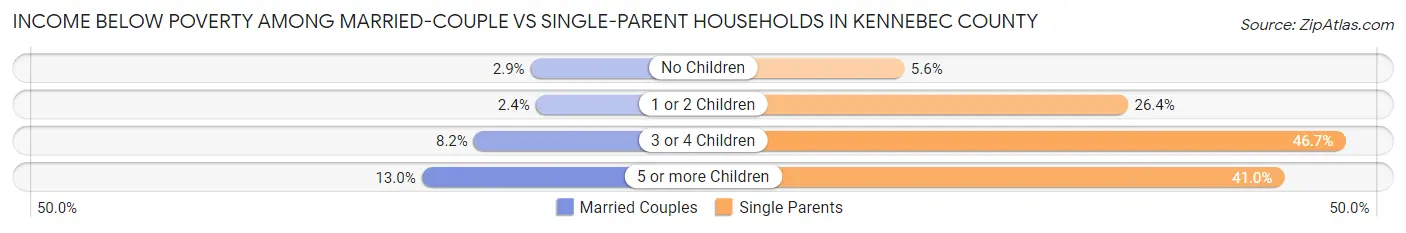
| Children | Married-Couple Families | Single-Parent Households |
| No Children | 467 (2.9%) | 164 (5.6%) |
| 1 or 2 Children | 153 (2.4%) | 1,259 (26.4%) |
| 3 or 4 Children | 115 (8.2%) | 261 (46.7%) |
| 5 or more Children | 12 (13.0%) | 16 (41.0%) |
| Total | 747 (3.1%) | 1,700 (20.5%) |
Race in Kennebec County
The most populous races in Kennebec County are White / Caucasian (116,633 | 94.1%), Two or more Races (4,381 | 3.5%), and Hispanic or Latino (2,203 | 1.8%).
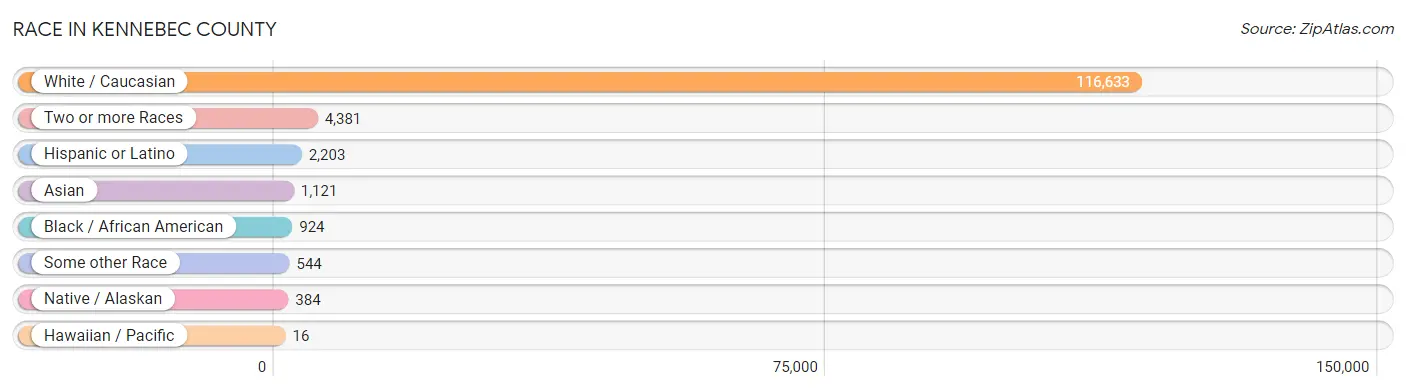
| Race | # Population | % Population |
| Asian | 1,121 | 0.9% |
| Black / African American | 924 | 0.7% |
| Hawaiian / Pacific | 16 | 0.0% |
| Hispanic or Latino | 2,203 | 1.8% |
| Native / Alaskan | 384 | 0.3% |
| White / Caucasian | 116,633 | 94.1% |
| Two or more Races | 4,381 | 3.5% |
| Some other Race | 544 | 0.4% |
| Total | 124,003 | 100.0% |
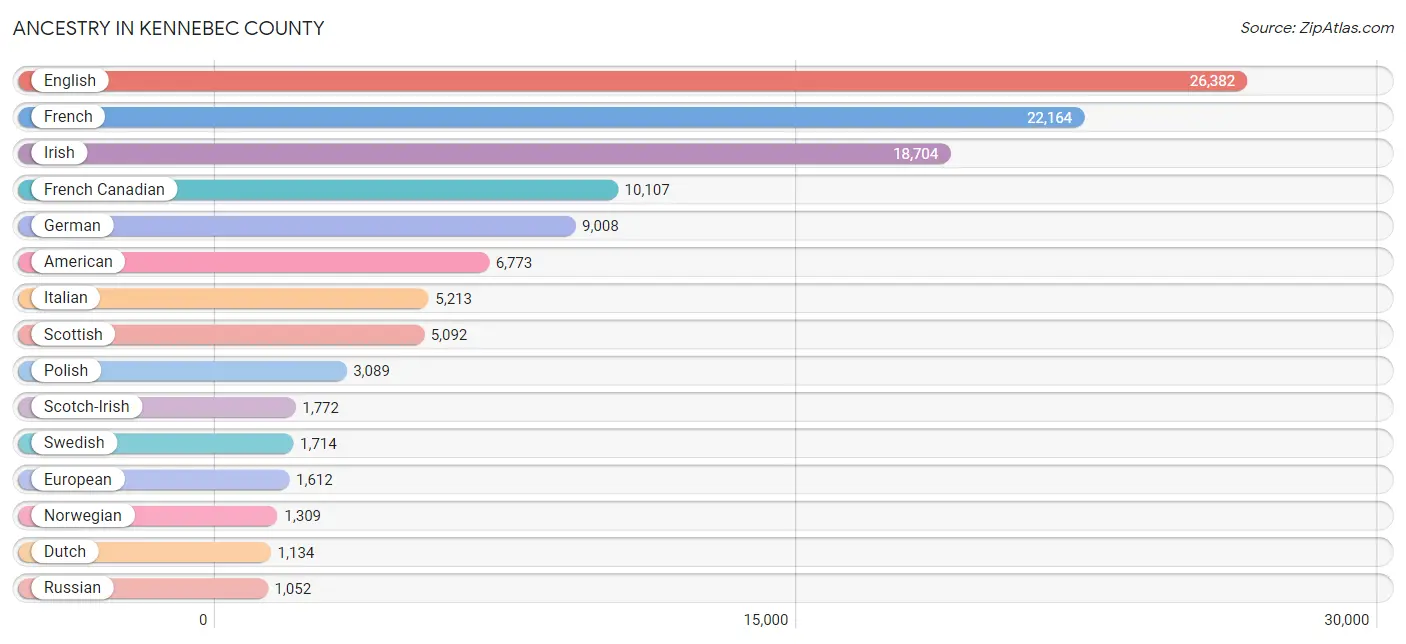
Ancestry in Kennebec County
The most populous ancestries reported in Kennebec County are English (26,382 | 21.3%), French (22,164 | 17.9%), Irish (18,704 | 15.1%), French Canadian (10,107 | 8.2%), and German (9,008 | 7.3%), together accounting for 69.6% of all Kennebec County residents.
| Ancestry | # Population | % Population |
| African | 85 | 0.1% |
| Albanian | 5 | 0.0% |
| Aleut | 7 | 0.0% |
| American | 6,773 | 5.5% |
| Apache | 16 | 0.0% |
| Arab | 557 | 0.4% |
| Argentinean | 7 | 0.0% |
| Armenian | 223 | 0.2% |
| Austrian | 164 | 0.1% |
| Barbadian | 19 | 0.0% |
| Belgian | 46 | 0.0% |
| Bhutanese | 86 | 0.1% |
| Blackfeet | 211 | 0.2% |
| Brazilian | 56 | 0.1% |
| British | 547 | 0.4% |
| British West Indian | 8 | 0.0% |
| Burmese | 152 | 0.1% |
| Cajun | 4 | 0.0% |
| Canadian | 929 | 0.7% |
| Cape Verdean | 32 | 0.0% |
| Celtic | 10 | 0.0% |
| Central American | 137 | 0.1% |
| Cherokee | 50 | 0.0% |
| Chilean | 13 | 0.0% |
| Chippewa | 14 | 0.0% |
| Choctaw | 56 | 0.1% |
| Colombian | 26 | 0.0% |
| Costa Rican | 21 | 0.0% |
| Cree | 52 | 0.0% |
| Croatian | 74 | 0.1% |
| Cuban | 141 | 0.1% |
| Czech | 336 | 0.3% |
| Czechoslovakian | 57 | 0.1% |
| Danish | 272 | 0.2% |
| Delaware | 7 | 0.0% |
| Dominican | 62 | 0.1% |
| Dutch | 1,134 | 0.9% |
| Eastern European | 519 | 0.4% |
| Ecuadorian | 41 | 0.0% |
| English | 26,382 | 21.3% |
| European | 1,612 | 1.3% |
| Filipino | 68 | 0.1% |
| Finnish | 314 | 0.3% |
| French | 22,164 | 17.9% |
| French American Indian | 36 | 0.0% |
| French Canadian | 10,107 | 8.2% |
| German | 9,008 | 7.3% |
| Greek | 234 | 0.2% |
| Guatemalan | 5 | 0.0% |
| Haitian | 18 | 0.0% |
| Hungarian | 581 | 0.5% |
| Icelander | 82 | 0.1% |
| Indian (Asian) | 514 | 0.4% |
| Indonesian | 6 | 0.0% |
| Inupiat | 12 | 0.0% |
| Iraqi | 37 | 0.0% |
| Irish | 18,704 | 15.1% |
| Iroquois | 11 | 0.0% |
| Israeli | 6 | 0.0% |
| Italian | 5,213 | 4.2% |
| Jamaican | 102 | 0.1% |
| Japanese | 18 | 0.0% |
| Korean | 306 | 0.3% |
| Laotian | 32 | 0.0% |
| Latvian | 14 | 0.0% |
| Lebanese | 484 | 0.4% |
| Lithuanian | 528 | 0.4% |
| Macedonian | 28 | 0.0% |
| Mexican | 456 | 0.4% |
| Moroccan | 16 | 0.0% |
| Navajo | 21 | 0.0% |
| Nigerian | 12 | 0.0% |
| Northern European | 133 | 0.1% |
| Norwegian | 1,309 | 1.1% |
| Pakistani | 47 | 0.0% |
| Panamanian | 40 | 0.0% |
| Pennsylvania German | 48 | 0.0% |
| Peruvian | 99 | 0.1% |
| Polish | 3,089 | 2.5% |
| Portuguese | 445 | 0.4% |
| Puerto Rican | 330 | 0.3% |
| Romanian | 34 | 0.0% |
| Russian | 1,052 | 0.9% |
| Salvadoran | 71 | 0.1% |
| Scandinavian | 957 | 0.8% |
| Scotch-Irish | 1,772 | 1.4% |
| Scottish | 5,092 | 4.1% |
| Serbian | 24 | 0.0% |
| Sioux | 9 | 0.0% |
| Slavic | 4 | 0.0% |
| Slovak | 176 | 0.1% |
| Slovene | 38 | 0.0% |
| Somali | 210 | 0.2% |
| South African | 26 | 0.0% |
| South American | 212 | 0.2% |
| Spaniard | 208 | 0.2% |
| Spanish | 82 | 0.1% |
| Sri Lankan | 298 | 0.2% |
| Subsaharan African | 375 | 0.3% |
| Sudanese | 7 | 0.0% |
| Swedish | 1,714 | 1.4% |
| Swiss | 136 | 0.1% |
| Syrian | 8 | 0.0% |
| Thai | 221 | 0.2% |
| Tlingit-Haida | 5 | 0.0% |
| Turkish | 310 | 0.3% |
| Ukrainian | 164 | 0.1% |
| Venezuelan | 9 | 0.0% |
| Welsh | 843 | 0.7% |
| West Indian | 8 | 0.0% |
| Yugoslavian | 12 | 0.0% | View All 111 Rows |
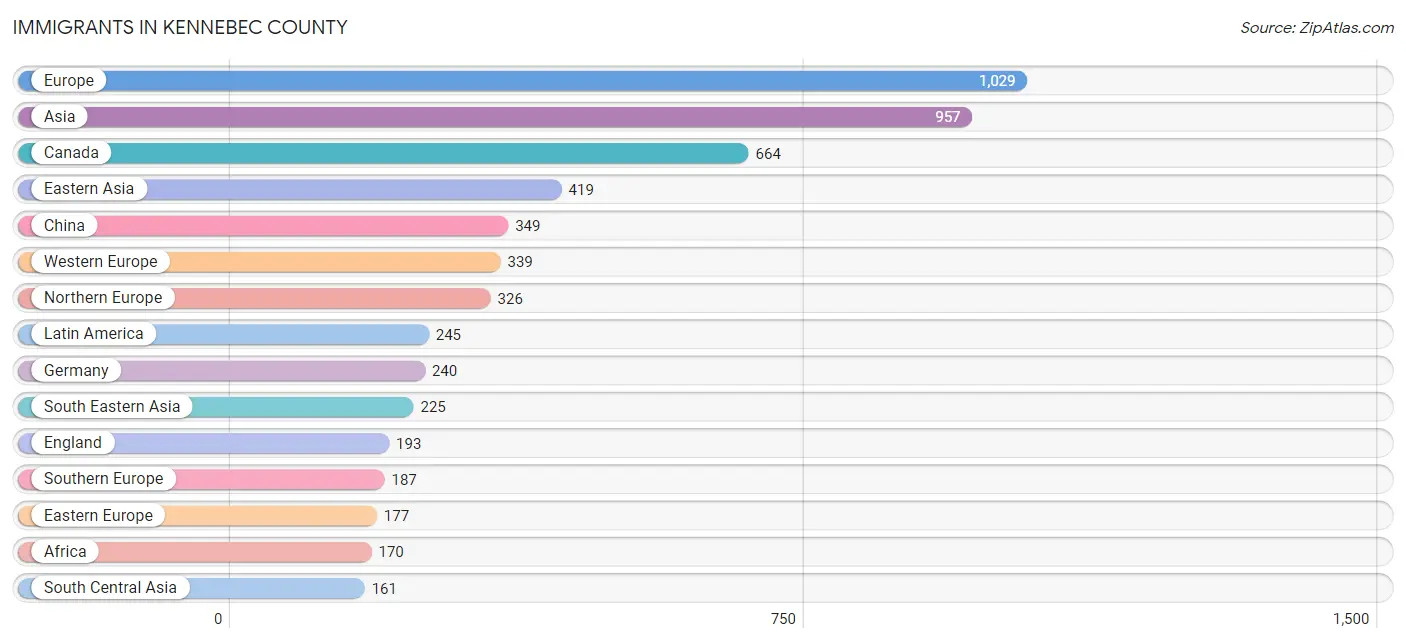
Immigrants in Kennebec County
The most numerous immigrant groups reported in Kennebec County came from Europe (1,029 | 0.8%), Asia (957 | 0.8%), Canada (664 | 0.5%), Eastern Asia (419 | 0.3%), and China (349 | 0.3%), together accounting for 2.8% of all Kennebec County residents.
| Immigration Origin | # Population | % Population |
| Africa | 170 | 0.1% |
| Argentina | 6 | 0.0% |
| Armenia | 56 | 0.1% |
| Asia | 957 | 0.8% |
| Austria | 4 | 0.0% |
| Bolivia | 8 | 0.0% |
| Brazil | 35 | 0.0% |
| Cambodia | 18 | 0.0% |
| Cameroon | 36 | 0.0% |
| Canada | 664 | 0.5% |
| Caribbean | 30 | 0.0% |
| Central America | 66 | 0.1% |
| Chile | 13 | 0.0% |
| China | 349 | 0.3% |
| Colombia | 13 | 0.0% |
| Czechoslovakia | 23 | 0.0% |
| Denmark | 17 | 0.0% |
| Eastern Africa | 73 | 0.1% |
| Eastern Asia | 419 | 0.3% |
| Eastern Europe | 177 | 0.1% |
| Ecuador | 25 | 0.0% |
| El Salvador | 27 | 0.0% |
| England | 193 | 0.2% |
| Ethiopia | 8 | 0.0% |
| Europe | 1,029 | 0.8% |
| France | 54 | 0.0% |
| Germany | 240 | 0.2% |
| Greece | 13 | 0.0% |
| Guatemala | 5 | 0.0% |
| Haiti | 18 | 0.0% |
| Hong Kong | 3 | 0.0% |
| India | 109 | 0.1% |
| Indonesia | 6 | 0.0% |
| Iraq | 37 | 0.0% |
| Italy | 43 | 0.0% |
| Jamaica | 12 | 0.0% |
| Japan | 11 | 0.0% |
| Kazakhstan | 25 | 0.0% |
| Korea | 59 | 0.1% |
| Latin America | 245 | 0.2% |
| Mexico | 34 | 0.0% |
| Middle Africa | 36 | 0.0% |
| Moldova | 12 | 0.0% |
| Netherlands | 41 | 0.0% |
| Northern Africa | 24 | 0.0% |
| Northern Europe | 326 | 0.3% |
| Norway | 15 | 0.0% |
| Oceania | 7 | 0.0% |
| Pakistan | 27 | 0.0% |
| Peru | 49 | 0.0% |
| Philippines | 92 | 0.1% |
| Poland | 34 | 0.0% |
| Portugal | 76 | 0.1% |
| Romania | 4 | 0.0% |
| Russia | 74 | 0.1% |
| Saudi Arabia | 42 | 0.0% |
| Scotland | 4 | 0.0% |
| Somalia | 62 | 0.1% |
| South Africa | 32 | 0.0% |
| South America | 149 | 0.1% |
| South Central Asia | 161 | 0.1% |
| South Eastern Asia | 225 | 0.2% |
| Southern Europe | 187 | 0.2% |
| Spain | 55 | 0.0% |
| Sudan | 24 | 0.0% |
| Sweden | 32 | 0.0% |
| Taiwan | 58 | 0.1% |
| Thailand | 3 | 0.0% |
| Turkey | 17 | 0.0% |
| Ukraine | 27 | 0.0% |
| Vietnam | 100 | 0.1% |
| Western Asia | 152 | 0.1% |
| Western Europe | 339 | 0.3% | View All 73 Rows |
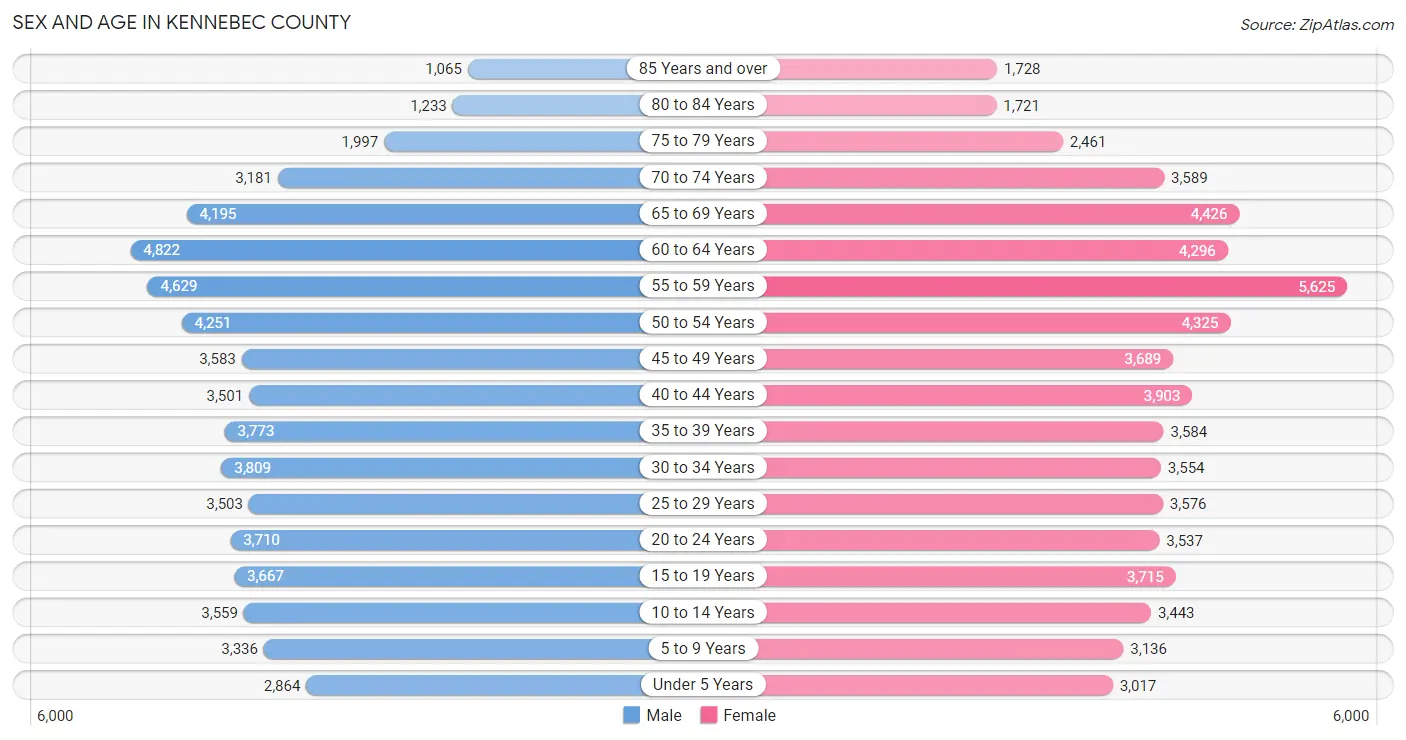
Sex and Age in Kennebec County
Sex and Age in Kennebec County
The most populous age groups in Kennebec County are 60 to 64 Years (4,822 | 8.0%) for men and 55 to 59 Years (5,625 | 8.9%) for women.
| Age Bracket | Male | Female |
| Under 5 Years | 2,864 (4.7%) | 3,017 (4.8%) |
| 5 to 9 Years | 3,336 (5.5%) | 3,136 (5.0%) |
| 10 to 14 Years | 3,559 (5.9%) | 3,443 (5.4%) |
| 15 to 19 Years | 3,667 (6.0%) | 3,715 (5.9%) |
| 20 to 24 Years | 3,710 (6.1%) | 3,537 (5.6%) |
| 25 to 29 Years | 3,503 (5.8%) | 3,576 (5.7%) |
| 30 to 34 Years | 3,809 (6.3%) | 3,554 (5.6%) |
| 35 to 39 Years | 3,773 (6.2%) | 3,584 (5.7%) |
| 40 to 44 Years | 3,501 (5.8%) | 3,903 (6.2%) |
| 45 to 49 Years | 3,583 (5.9%) | 3,689 (5.8%) |
| 50 to 54 Years | 4,251 (7.0%) | 4,325 (6.8%) |
| 55 to 59 Years | 4,629 (7.6%) | 5,625 (8.9%) |
| 60 to 64 Years | 4,822 (8.0%) | 4,296 (6.8%) |
| 65 to 69 Years | 4,195 (6.9%) | 4,426 (7.0%) |
| 70 to 74 Years | 3,181 (5.2%) | 3,589 (5.7%) |
| 75 to 79 Years | 1,997 (3.3%) | 2,461 (3.9%) |
| 80 to 84 Years | 1,233 (2.0%) | 1,721 (2.7%) |
| 85 Years and over | 1,065 (1.8%) | 1,728 (2.7%) |
| Total | 60,678 (100.0%) | 63,325 (100.0%) |
Families and Households in Kennebec County
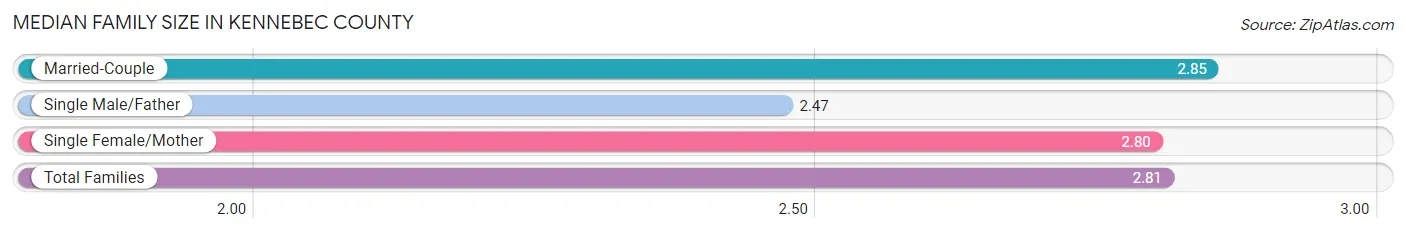
Median Family Size in Kennebec County
The median family size in Kennebec County is 2.81 persons per family, with married-couple families (23,970 | 74.3%) accounting for the largest median family size of 2.85 persons per family. On the other hand, single male/father families (2,386 | 7.4%) represent the smallest median family size with 2.47 persons per family.
| Family Type | # Families | Family Size |
| Married-Couple | 23,970 (74.3%) | 2.85 |
| Single Male/Father | 2,386 (7.4%) | 2.47 |
| Single Female/Mother | 5,896 (18.3%) | 2.80 |
| Total Families | 32,252 (100.0%) | 2.81 |
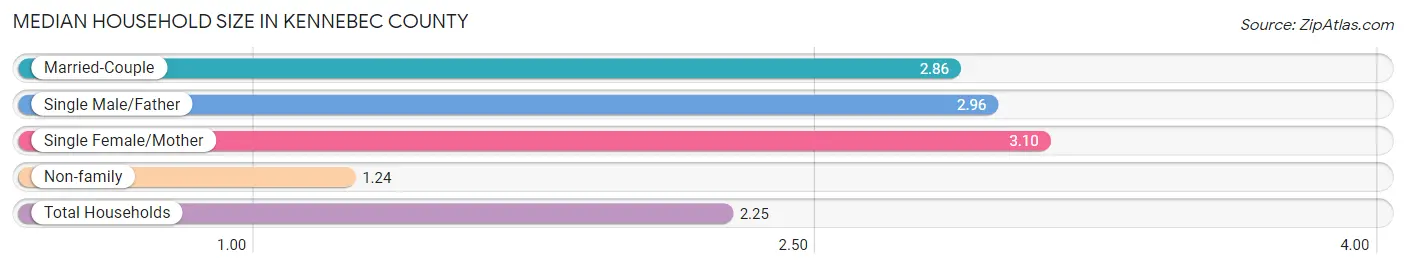
Median Household Size in Kennebec County
The median household size in Kennebec County is 2.25 persons per household, with single female/mother households (5,896 | 11.0%) accounting for the largest median household size of 3.1 persons per household. non-family households (21,200 | 39.7%) represent the smallest median household size with 1.24 persons per household.
| Household Type | # Households | Household Size |
| Married-Couple | 23,970 (44.8%) | 2.86 |
| Single Male/Father | 2,386 (4.5%) | 2.96 |
| Single Female/Mother | 5,896 (11.0%) | 3.10 |
| Non-family | 21,200 (39.7%) | 1.24 |
| Total Households | 53,452 (100.0%) | 2.25 |
Household Size by Marriage Status in Kennebec County
Out of a total of 53,452 households in Kennebec County, 32,252 (60.3%) are family households, while 21,200 (39.7%) are nonfamily households. The most numerous type of family households are 2-person households, comprising 16,537, and the most common type of nonfamily households are 1-person households, comprising 17,094.
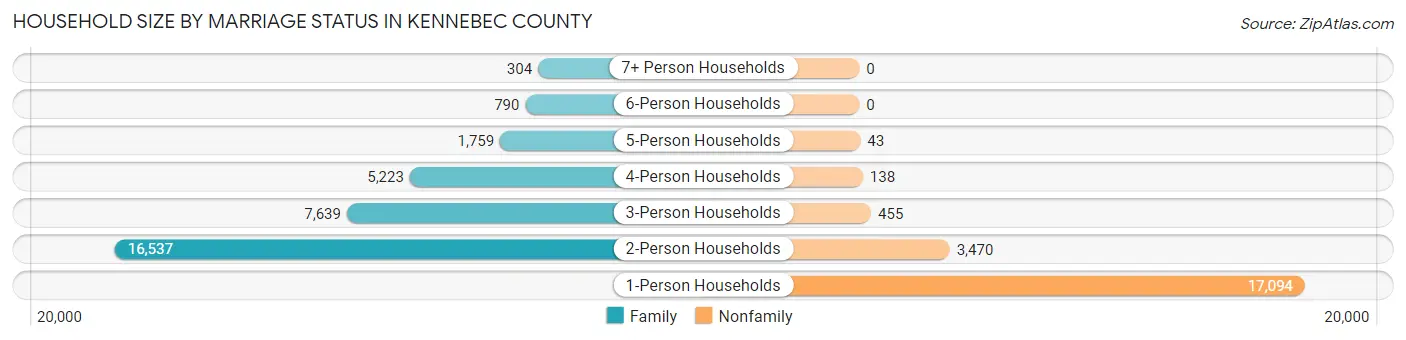
| Household Size | Family Households | Nonfamily Households |
| 1-Person Households | - | 17,094 (32.0%) |
| 2-Person Households | 16,537 (30.9%) | 3,470 (6.5%) |
| 3-Person Households | 7,639 (14.3%) | 455 (0.9%) |
| 4-Person Households | 5,223 (9.8%) | 138 (0.3%) |
| 5-Person Households | 1,759 (3.3%) | 43 (0.1%) |
| 6-Person Households | 790 (1.5%) | 0 (0.0%) |
| 7+ Person Households | 304 (0.6%) | 0 (0.0%) |
| Total | 32,252 (60.3%) | 21,200 (39.7%) |
Female Fertility in Kennebec County
Fertility by Age in Kennebec County
Average fertility rate in Kennebec County is 53.0 births per 1,000 women. Women in the age bracket of 20 to 34 years have the highest fertility rate with 107.0 births per 1,000 women. Women in the age bracket of 20 to 34 years acount for 81.0% of all women with births.
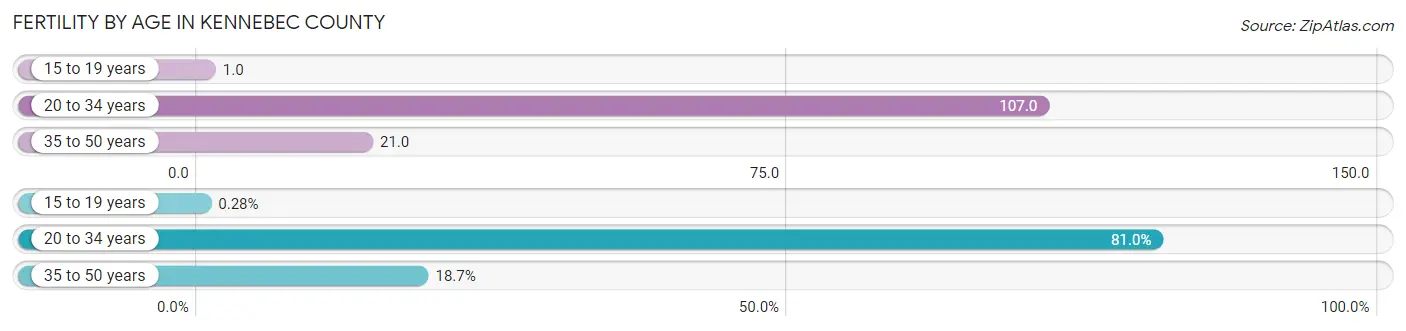
| Age Bracket | Women with Births | Births / 1,000 Women |
| 15 to 19 years | 4 (0.3%) | 1.0 |
| 20 to 34 years | 1,139 (81.0%) | 107.0 |
| 35 to 50 years | 263 (18.7%) | 21.0 |
| Total | 1,406 (100.0%) | 53.0 |
Fertility by Age by Marriage Status in Kennebec County
66.1% of women with births (1,406) in Kennebec County are married. The highest percentage of unmarried women with births falls into 20 to 34 years age bracket with 34.8% of them unmarried at the time of birth, while the lowest percentage of unmarried women with births belong to 15 to 19 years age bracket with 0.0% of them unmarried.
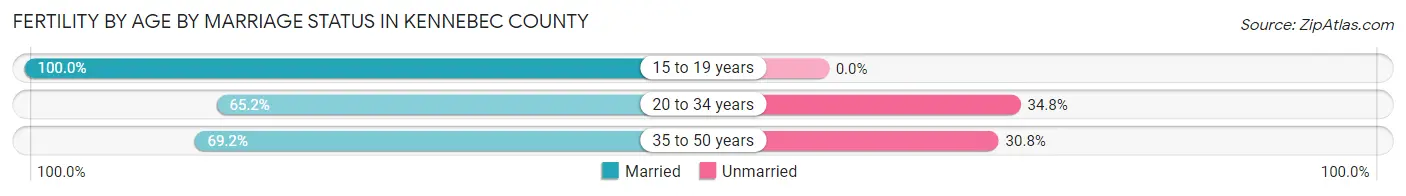
| Age Bracket | Married | Unmarried |
| 15 to 19 years | 4 (100.0%) | 0 (0.0%) |
| 20 to 34 years | 743 (65.2%) | 396 (34.8%) |
| 35 to 50 years | 182 (69.2%) | 81 (30.8%) |
| Total | 929 (66.1%) | 477 (33.9%) |
Fertility by Education in Kennebec County
Average fertility rate in Kennebec County is 53.0 births per 1,000 women. Women with the education attainment of bachelor's degree have the highest fertility rate of 65.0 births per 1,000 women, while women with the education attainment of less than high school have the lowest fertility at 15.0 births per 1,000 women. Women with the education attainment of college or associate's degree represent 40.3% of all women with births.
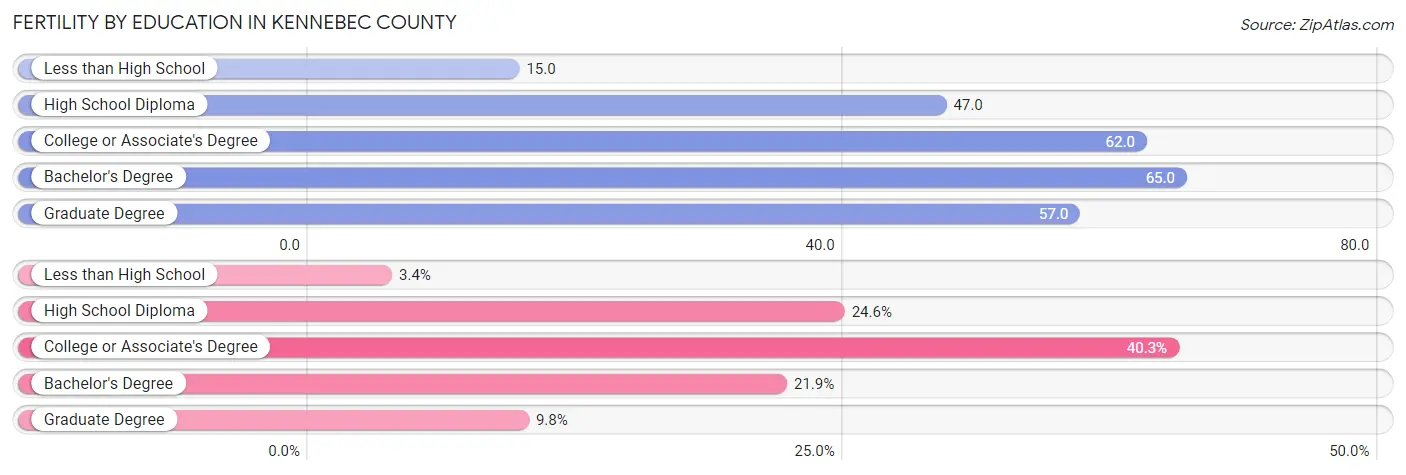
| Educational Attainment | Women with Births | Births / 1,000 Women |
| Less than High School | 48 (3.4%) | 15.0 |
| High School Diploma | 346 (24.6%) | 47.0 |
| College or Associate's Degree | 566 (40.3%) | 62.0 |
| Bachelor's Degree | 308 (21.9%) | 65.0 |
| Graduate Degree | 138 (9.8%) | 57.0 |
| Total | 1,406 (100.0%) | 53.0 |
Fertility by Education by Marriage Status in Kennebec County
33.9% of women with births in Kennebec County are unmarried. Women with the educational attainment of bachelor's degree are most likely to be married with 91.2% of them married at childbirth, while women with the educational attainment of high school diploma are least likely to be married with 56.1% of them unmarried at childbirth.
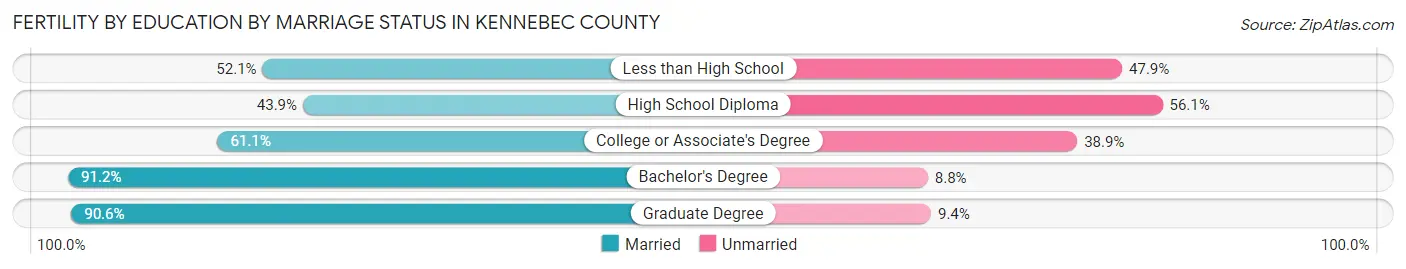
| Educational Attainment | Married | Unmarried |
| Less than High School | 25 (52.1%) | 23 (47.9%) |
| High School Diploma | 152 (43.9%) | 194 (56.1%) |
| College or Associate's Degree | 346 (61.1%) | 220 (38.9%) |
| Bachelor's Degree | 281 (91.2%) | 27 (8.8%) |
| Graduate Degree | 125 (90.6%) | 13 (9.4%) |
| Total | 929 (66.1%) | 477 (33.9%) |
Employment Characteristics in Kennebec County
Employment by Class of Employer in Kennebec County
Among the 59,235 employed individuals in Kennebec County, private company employees (33,708 | 56.9%), not-for-profit organizations (8,263 | 14.0%), and state government employees (4,921 | 8.3%) make up the most common classes of employment.
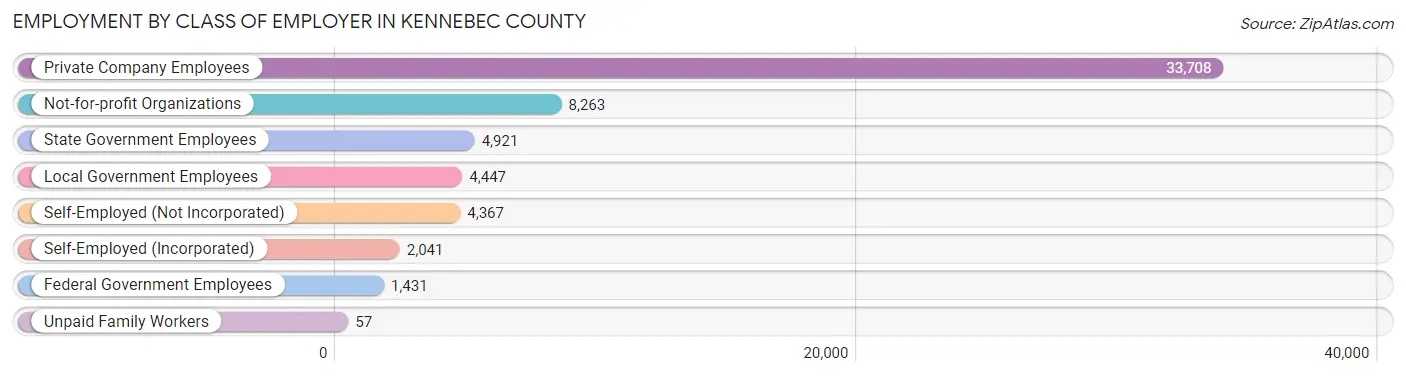
| Employer Class | # Employees | % Employees |
| Private Company Employees | 33,708 | 56.9% |
| Self-Employed (Incorporated) | 2,041 | 3.5% |
| Self-Employed (Not Incorporated) | 4,367 | 7.4% |
| Not-for-profit Organizations | 8,263 | 14.0% |
| Local Government Employees | 4,447 | 7.5% |
| State Government Employees | 4,921 | 8.3% |
| Federal Government Employees | 1,431 | 2.4% |
| Unpaid Family Workers | 57 | 0.1% |
| Total | 59,235 | 100.0% |
Employment Status by Age in Kennebec County
According to the labor force statistics for Kennebec County, out of the total population over 16 years of age (103,232), 61.1% or 63,075 individuals are in the labor force, with 4.1% or 2,586 of them unemployed. The age group with the highest labor force participation rate is 25 to 29 years, with 88.0% or 6,230 individuals in the labor force. Within the labor force, the 25 to 29 years age range has the highest percentage of unemployed individuals, with 11.6% or 723 of them being unemployed.
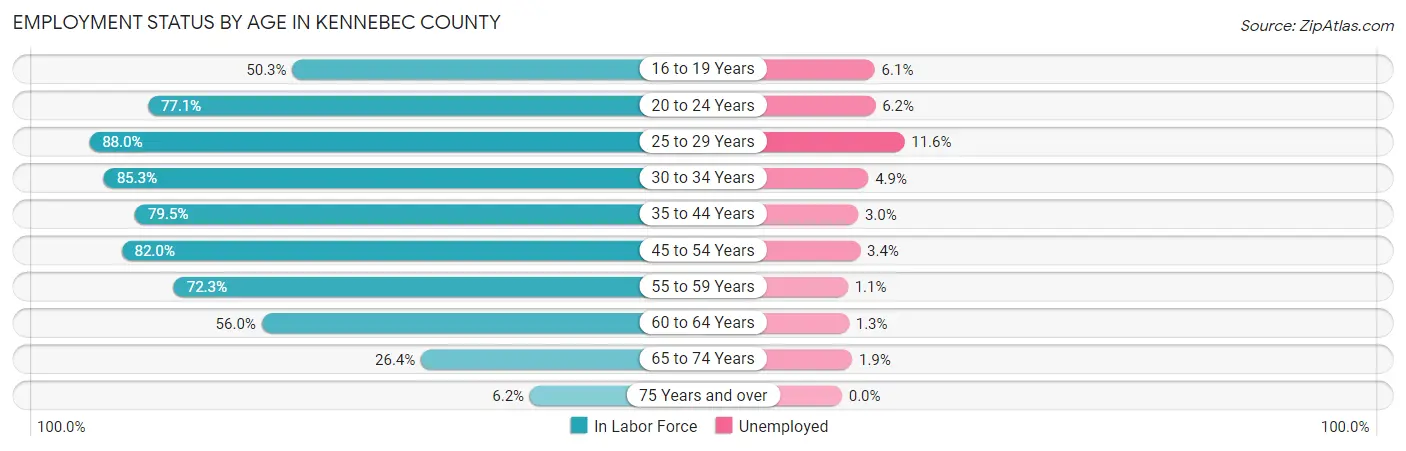
| Age Bracket | In Labor Force | Unemployed |
| 16 to 19 Years | 3,001 (50.3%) | 183 (6.1%) |
| 20 to 24 Years | 5,587 (77.1%) | 346 (6.2%) |
| 25 to 29 Years | 6,230 (88.0%) | 723 (11.6%) |
| 30 to 34 Years | 6,281 (85.3%) | 308 (4.9%) |
| 35 to 44 Years | 11,735 (79.5%) | 352 (3.0%) |
| 45 to 54 Years | 12,995 (82.0%) | 442 (3.4%) |
| 55 to 59 Years | 7,414 (72.3%) | 82 (1.1%) |
| 60 to 64 Years | 5,106 (56.0%) | 66 (1.3%) |
| 65 to 74 Years | 4,063 (26.4%) | 77 (1.9%) |
| 75 Years and over | 633 (6.2%) | 0 (0.0%) |
| Total | 63,075 (61.1%) | 2,586 (4.1%) |
Employment Status by Educational Attainment in Kennebec County
According to labor force statistics for Kennebec County, 77.2% of individuals (49,735) out of the total population between 25 and 64 years of age (64,423) are in the labor force, with 4.0% or 1,989 of them being unemployed. The group with the highest labor force participation rate are those with the educational attainment of bachelor's degree or higher, with 87.3% or 17,016 individuals in the labor force. Within the labor force, individuals with less than high school education have the highest percentage of unemployment, with 11.2% or 184 of them being unemployed.
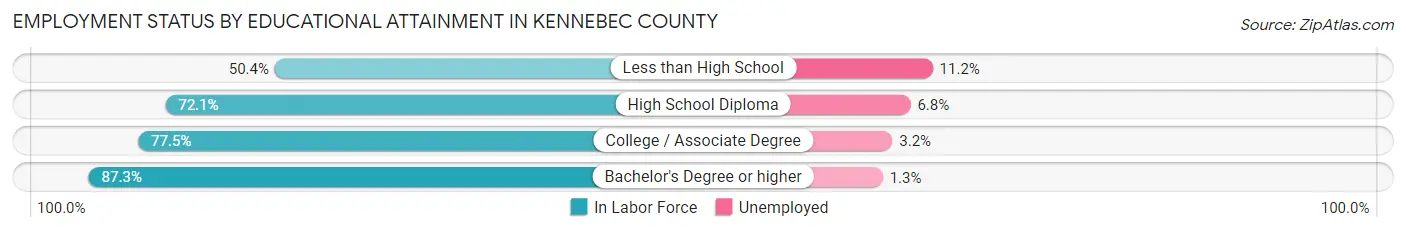
| Educational Attainment | In Labor Force | Unemployed |
| Less than High School | 1,639 (50.4%) | 364 (11.2%) |
| High School Diploma | 16,007 (72.1%) | 1,510 (6.8%) |
| College / Associate Degree | 15,097 (77.5%) | 623 (3.2%) |
| Bachelor's Degree or higher | 17,016 (87.3%) | 253 (1.3%) |
| Total | 49,735 (77.2%) | 2,577 (4.0%) |
Employment Occupations by Sex in Kennebec County
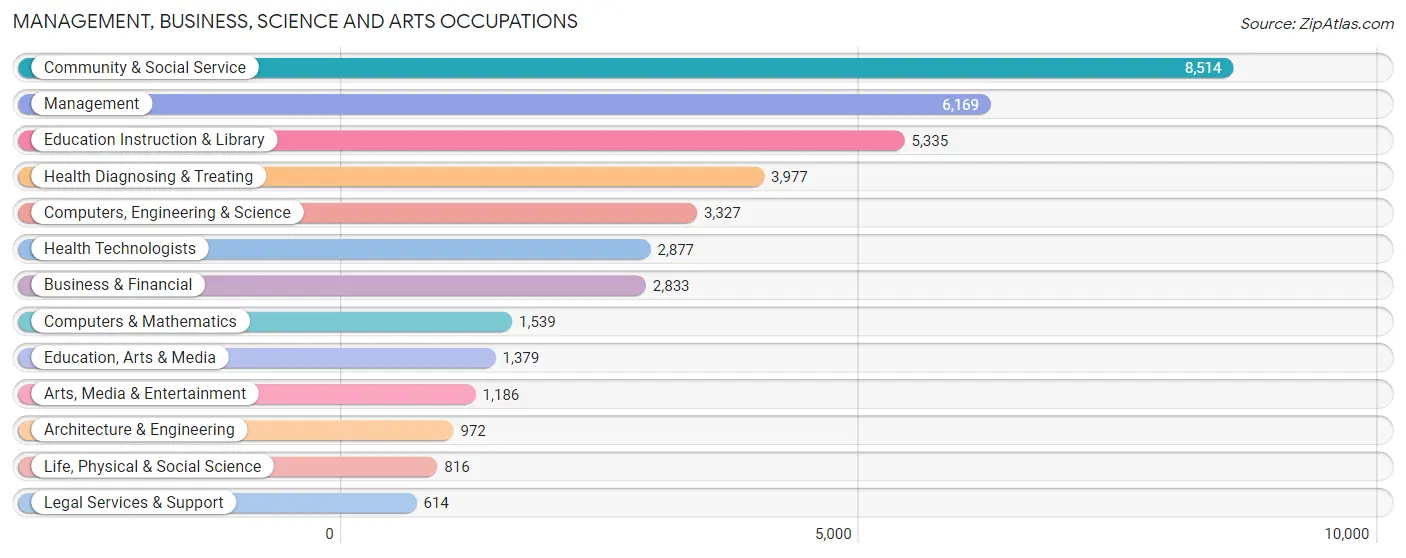
Management, Business, Science and Arts Occupations
The most common Management, Business, Science and Arts occupations in Kennebec County are Community & Social Service (8,514 | 14.1%), Management (6,169 | 10.2%), Education Instruction & Library (5,335 | 8.8%), Health Diagnosing & Treating (3,977 | 6.6%), and Computers, Engineering & Science (3,327 | 5.5%).
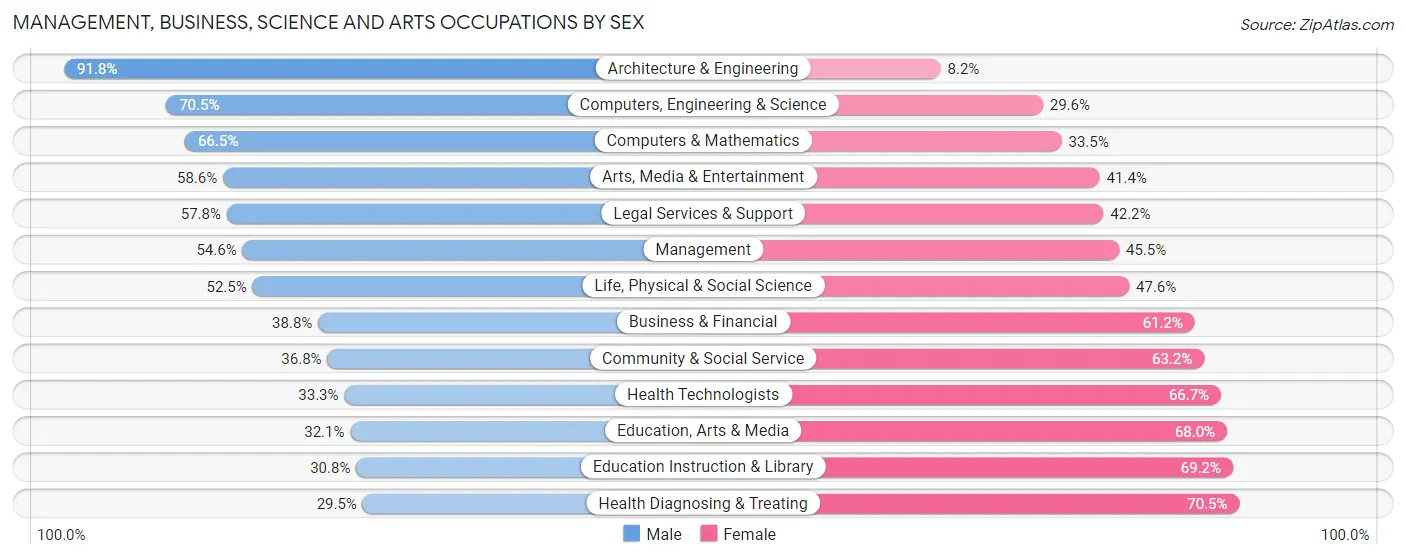
Management, Business, Science and Arts Occupations by Sex
Within the Management, Business, Science and Arts occupations in Kennebec County, the most male-oriented occupations are Architecture & Engineering (91.8%), Computers, Engineering & Science (70.5%), and Computers & Mathematics (66.5%), while the most female-oriented occupations are Health Diagnosing & Treating (70.5%), Education Instruction & Library (69.2%), and Education, Arts & Media (67.9%).
| Occupation | Male | Female |
| Management | 3,365 (54.5%) | 2,804 (45.5%) |
| Business & Financial | 1,098 (38.8%) | 1,735 (61.2%) |
| Computers, Engineering & Science | 2,344 (70.5%) | 983 (29.5%) |
| Computers & Mathematics | 1,024 (66.5%) | 515 (33.5%) |
| Architecture & Engineering | 892 (91.8%) | 80 (8.2%) |
| Life, Physical & Social Science | 428 (52.4%) | 388 (47.5%) |
| Community & Social Service | 3,136 (36.8%) | 5,378 (63.2%) |
| Education, Arts & Media | 442 (32.1%) | 937 (67.9%) |
| Legal Services & Support | 355 (57.8%) | 259 (42.2%) |
| Education Instruction & Library | 1,644 (30.8%) | 3,691 (69.2%) |
| Arts, Media & Entertainment | 695 (58.6%) | 491 (41.4%) |
| Health Diagnosing & Treating | 1,172 (29.5%) | 2,805 (70.5%) |
| Health Technologists | 958 (33.3%) | 1,919 (66.7%) |
| Total (Category) | 11,115 (44.8%) | 13,705 (55.2%) |
| Total (Overall) | 30,623 (50.8%) | 29,706 (49.2%) |
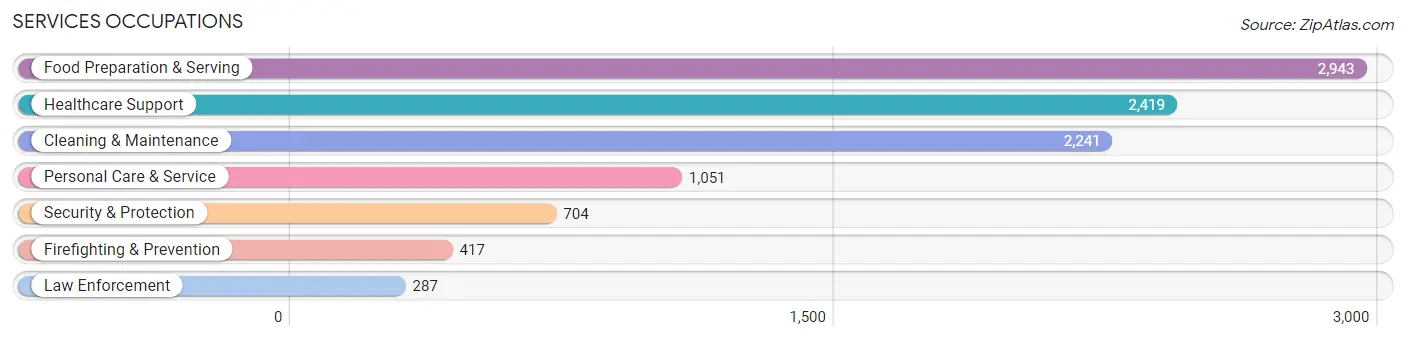
Services Occupations
The most common Services occupations in Kennebec County are Food Preparation & Serving (2,943 | 4.9%), Healthcare Support (2,419 | 4.0%), Cleaning & Maintenance (2,241 | 3.7%), Personal Care & Service (1,051 | 1.7%), and Security & Protection (704 | 1.2%).
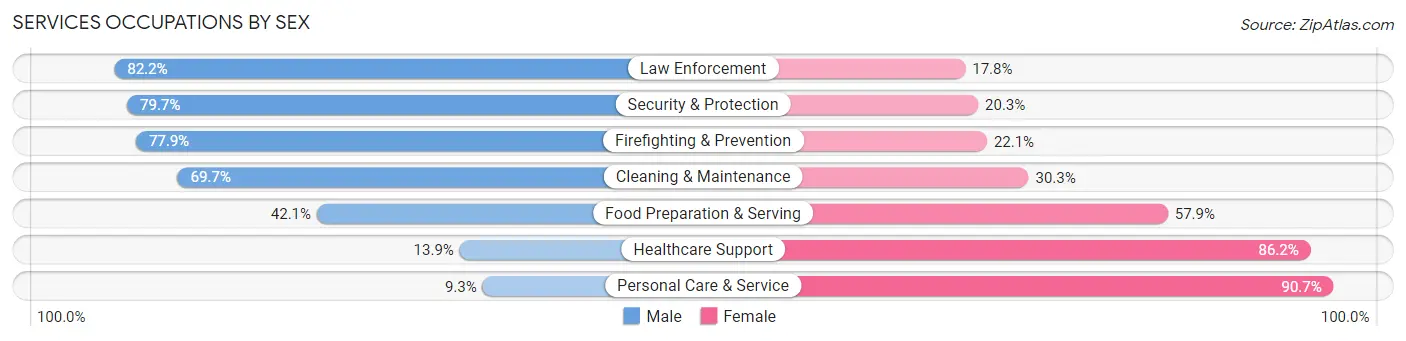
Services Occupations by Sex
Within the Services occupations in Kennebec County, the most male-oriented occupations are Law Enforcement (82.2%), Security & Protection (79.7%), and Firefighting & Prevention (77.9%), while the most female-oriented occupations are Personal Care & Service (90.7%), Healthcare Support (86.2%), and Food Preparation & Serving (57.9%).
| Occupation | Male | Female |
| Healthcare Support | 335 (13.9%) | 2,084 (86.2%) |
| Security & Protection | 561 (79.7%) | 143 (20.3%) |
| Firefighting & Prevention | 325 (77.9%) | 92 (22.1%) |
| Law Enforcement | 236 (82.2%) | 51 (17.8%) |
| Food Preparation & Serving | 1,240 (42.1%) | 1,703 (57.9%) |
| Cleaning & Maintenance | 1,562 (69.7%) | 679 (30.3%) |
| Personal Care & Service | 98 (9.3%) | 953 (90.7%) |
| Total (Category) | 3,796 (40.6%) | 5,562 (59.4%) |
| Total (Overall) | 30,623 (50.8%) | 29,706 (49.2%) |
Sales and Office Occupations
The most common Sales and Office occupations in Kennebec County are Office & Administration (7,039 | 11.7%), and Sales & Related (5,767 | 9.6%).

Sales and Office Occupations by Sex
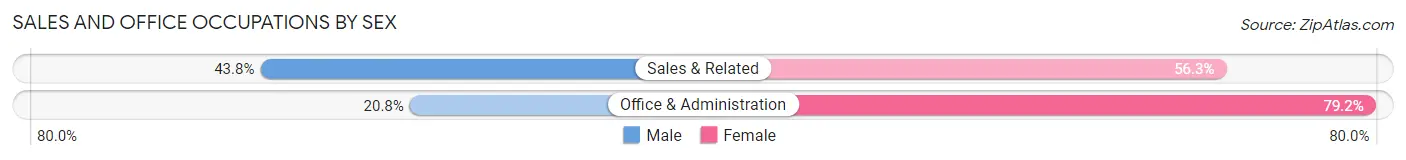
| Occupation | Male | Female |
| Sales & Related | 2,523 (43.8%) | 3,244 (56.2%) |
| Office & Administration | 1,462 (20.8%) | 5,577 (79.2%) |
| Total (Category) | 3,985 (31.1%) | 8,821 (68.9%) |
| Total (Overall) | 30,623 (50.8%) | 29,706 (49.2%) |
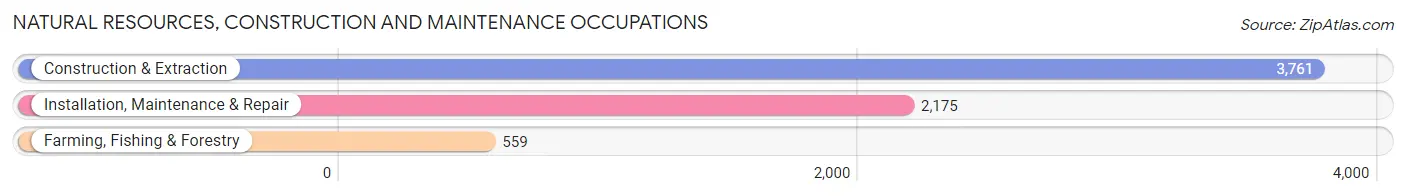
Natural Resources, Construction and Maintenance Occupations
The most common Natural Resources, Construction and Maintenance occupations in Kennebec County are Construction & Extraction (3,761 | 6.2%), Installation, Maintenance & Repair (2,175 | 3.6%), and Farming, Fishing & Forestry (559 | 0.9%).
Natural Resources, Construction and Maintenance Occupations by Sex
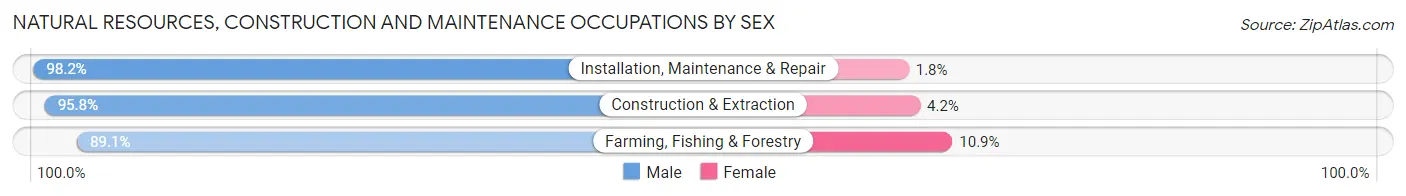
| Occupation | Male | Female |
| Farming, Fishing & Forestry | 498 (89.1%) | 61 (10.9%) |
| Construction & Extraction | 3,603 (95.8%) | 158 (4.2%) |
| Installation, Maintenance & Repair | 2,135 (98.2%) | 40 (1.8%) |
| Total (Category) | 6,236 (96.0%) | 259 (4.0%) |
| Total (Overall) | 30,623 (50.8%) | 29,706 (49.2%) |
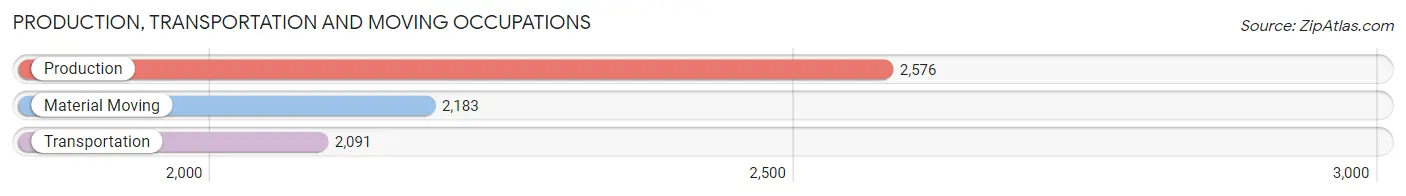
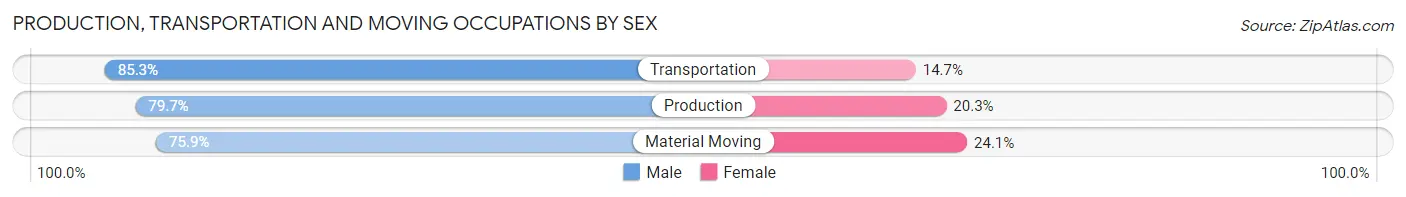
Production, Transportation and Moving Occupations
The most common Production, Transportation and Moving occupations in Kennebec County are Production (2,576 | 4.3%), Material Moving (2,183 | 3.6%), and Transportation (2,091 | 3.5%).
Production, Transportation and Moving Occupations by Sex
| Occupation | Male | Female |
| Production | 2,052 (79.7%) | 524 (20.3%) |
| Transportation | 1,783 (85.3%) | 308 (14.7%) |
| Material Moving | 1,656 (75.9%) | 527 (24.1%) |
| Total (Category) | 5,491 (80.2%) | 1,359 (19.8%) |
| Total (Overall) | 30,623 (50.8%) | 29,706 (49.2%) |
Employment Industries by Sex in Kennebec County
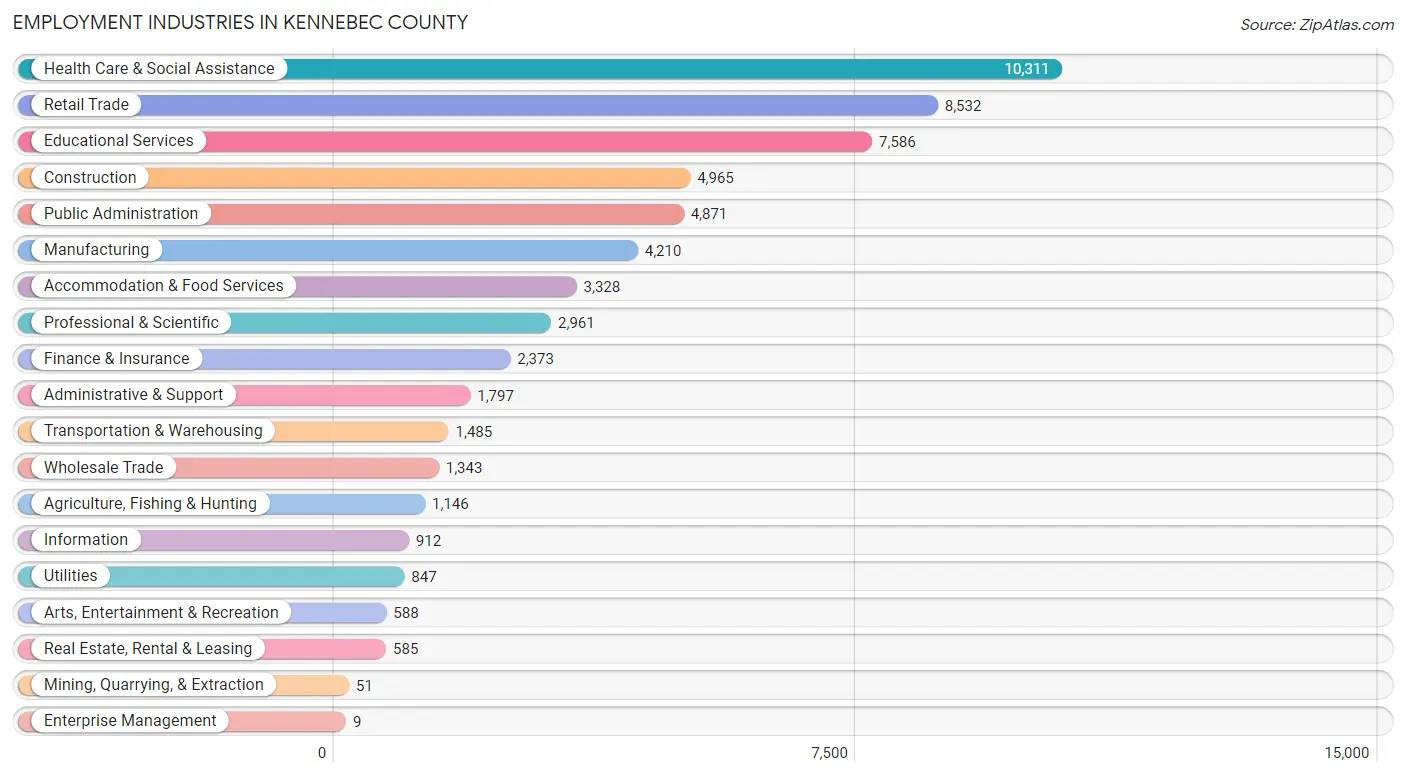
Employment Industries in Kennebec County
The major employment industries in Kennebec County include Health Care & Social Assistance (10,311 | 17.1%), Retail Trade (8,532 | 14.1%), Educational Services (7,586 | 12.6%), Construction (4,965 | 8.2%), and Public Administration (4,871 | 8.1%).
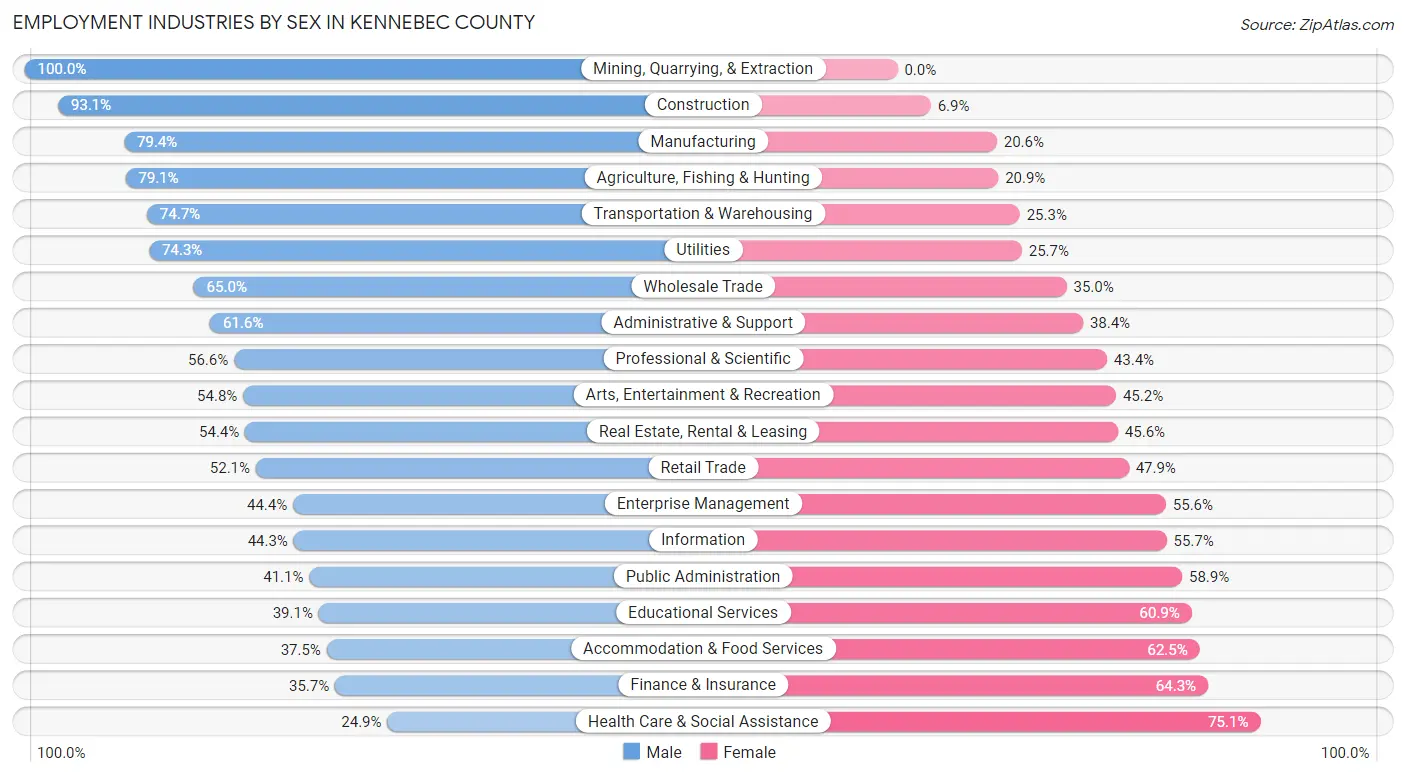
Employment Industries by Sex in Kennebec County
The Kennebec County industries that see more men than women are Mining, Quarrying, & Extraction (100.0%), Construction (93.1%), and Manufacturing (79.4%), whereas the industries that tend to have a higher number of women are Health Care & Social Assistance (75.1%), Finance & Insurance (64.3%), and Accommodation & Food Services (62.5%).
| Industry | Male | Female |
| Agriculture, Fishing & Hunting | 907 (79.1%) | 239 (20.9%) |
| Mining, Quarrying, & Extraction | 51 (100.0%) | 0 (0.0%) |
| Construction | 4,623 (93.1%) | 342 (6.9%) |
| Manufacturing | 3,344 (79.4%) | 866 (20.6%) |
| Wholesale Trade | 873 (65.0%) | 470 (35.0%) |
| Retail Trade | 4,448 (52.1%) | 4,084 (47.9%) |
| Transportation & Warehousing | 1,109 (74.7%) | 376 (25.3%) |
| Utilities | 629 (74.3%) | 218 (25.7%) |
| Information | 404 (44.3%) | 508 (55.7%) |
| Finance & Insurance | 848 (35.7%) | 1,525 (64.3%) |
| Real Estate, Rental & Leasing | 318 (54.4%) | 267 (45.6%) |
| Professional & Scientific | 1,677 (56.6%) | 1,284 (43.4%) |
| Enterprise Management | 4 (44.4%) | 5 (55.6%) |
| Administrative & Support | 1,107 (61.6%) | 690 (38.4%) |
| Educational Services | 2,968 (39.1%) | 4,618 (60.9%) |
| Health Care & Social Assistance | 2,568 (24.9%) | 7,743 (75.1%) |
| Arts, Entertainment & Recreation | 322 (54.8%) | 266 (45.2%) |
| Accommodation & Food Services | 1,247 (37.5%) | 2,081 (62.5%) |
| Public Administration | 2,001 (41.1%) | 2,870 (58.9%) |
| Total | 30,623 (50.8%) | 29,706 (49.2%) |
Education in Kennebec County
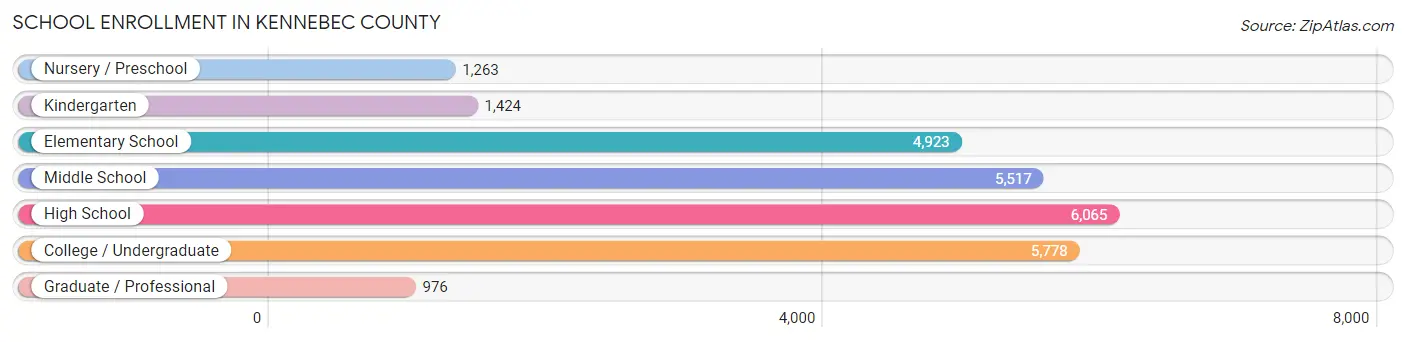
School Enrollment in Kennebec County
The most common levels of schooling among the 25,946 students in Kennebec County are high school (6,065 | 23.4%), college / undergraduate (5,778 | 22.3%), and middle school (5,517 | 21.3%).
| School Level | # Students | % Students |
| Nursery / Preschool | 1,263 | 4.9% |
| Kindergarten | 1,424 | 5.5% |
| Elementary School | 4,923 | 19.0% |
| Middle School | 5,517 | 21.3% |
| High School | 6,065 | 23.4% |
| College / Undergraduate | 5,778 | 22.3% |
| Graduate / Professional | 976 | 3.8% |
| Total | 25,946 | 100.0% |
School Enrollment by Age by Funding Source in Kennebec County
Out of a total of 25,946 students who are enrolled in schools in Kennebec County, 5,552 (21.4%) attend a private institution, while the remaining 20,394 (78.6%) are enrolled in public schools. The age group of 20 to 24 year olds has the highest likelihood of being enrolled in private schools, with 1,514 (51.5% in the age bracket) enrolled. Conversely, the age group of 10 to 14 year olds has the lowest likelihood of being enrolled in a private school, with 6,266 (90.2% in the age bracket) attending a public institution.
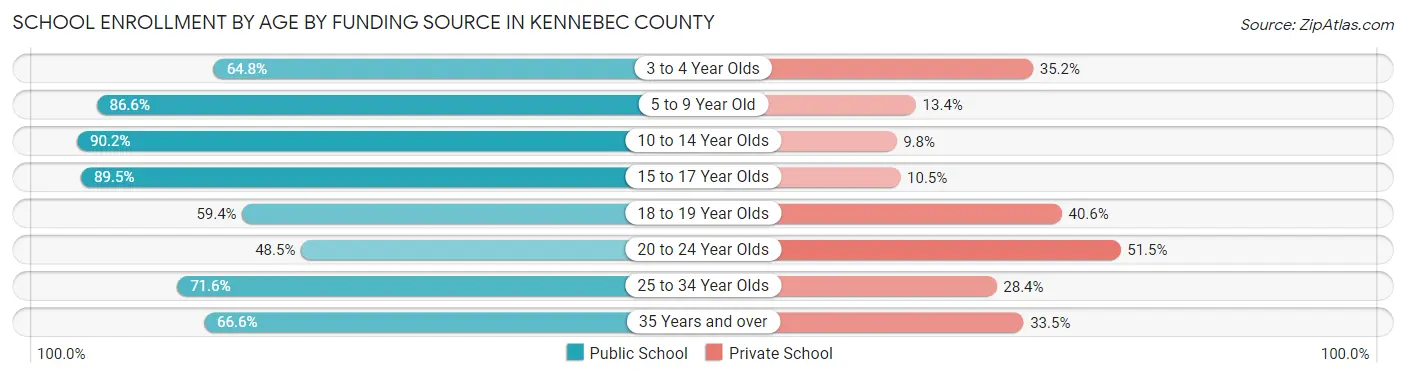
| Age Bracket | Public School | Private School |
| 3 to 4 Year Olds | 625 (64.8%) | 340 (35.2%) |
| 5 to 9 Year Old | 5,151 (86.6%) | 798 (13.4%) |
| 10 to 14 Year Olds | 6,266 (90.2%) | 680 (9.8%) |
| 15 to 17 Year Olds | 3,669 (89.5%) | 431 (10.5%) |
| 18 to 19 Year Olds | 1,378 (59.4%) | 941 (40.6%) |
| 20 to 24 Year Olds | 1,424 (48.5%) | 1,514 (51.5%) |
| 25 to 34 Year Olds | 941 (71.6%) | 374 (28.4%) |
| 35 Years and over | 941 (66.5%) | 473 (33.5%) |
| Total | 20,394 (78.6%) | 5,552 (21.4%) |
Educational Attainment by Field of Study in Kennebec County
Business (4,421 | 14.8%), education (4,186 | 14.0%), science & technology (3,628 | 12.1%), bio, nature & agricultural (2,304 | 7.7%), and social sciences (2,197 | 7.3%) are the most common fields of study among 29,960 individuals in Kennebec County who have obtained a bachelor's degree or higher.
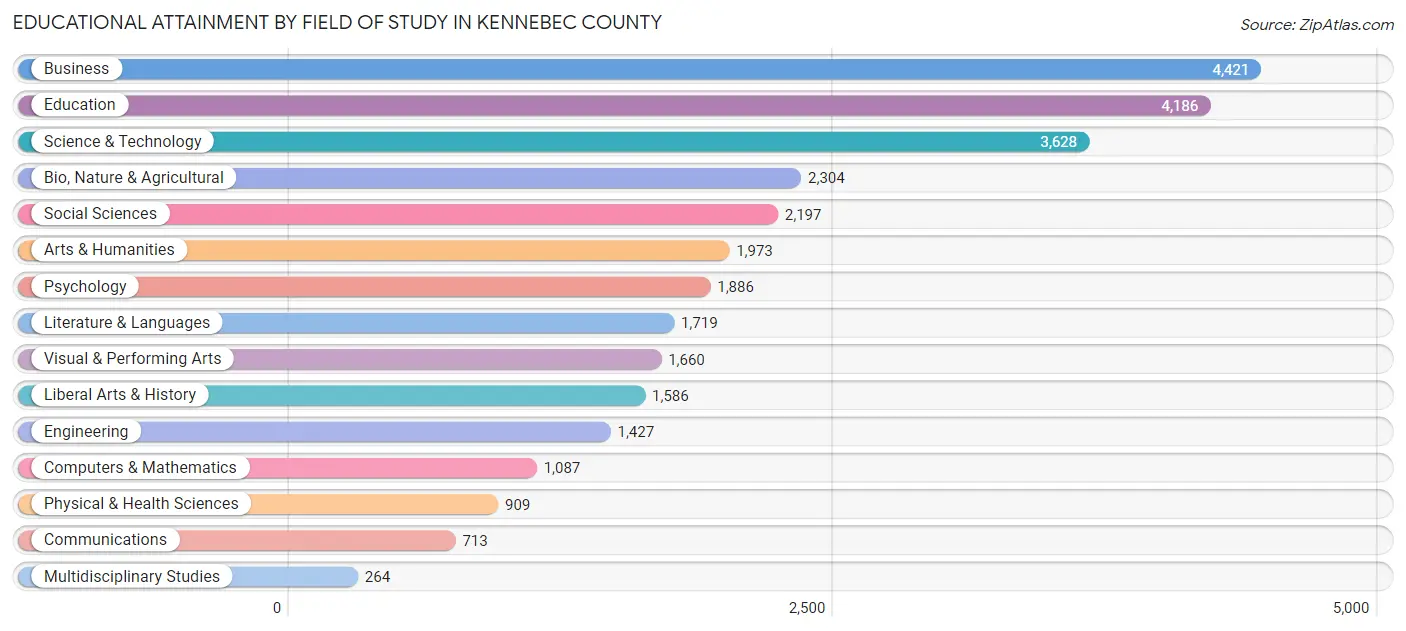
| Field of Study | # Graduates | % Graduates |
| Computers & Mathematics | 1,087 | 3.6% |
| Bio, Nature & Agricultural | 2,304 | 7.7% |
| Physical & Health Sciences | 909 | 3.0% |
| Psychology | 1,886 | 6.3% |
| Social Sciences | 2,197 | 7.3% |
| Engineering | 1,427 | 4.8% |
| Multidisciplinary Studies | 264 | 0.9% |
| Science & Technology | 3,628 | 12.1% |
| Business | 4,421 | 14.8% |
| Education | 4,186 | 14.0% |
| Literature & Languages | 1,719 | 5.7% |
| Liberal Arts & History | 1,586 | 5.3% |
| Visual & Performing Arts | 1,660 | 5.5% |
| Communications | 713 | 2.4% |
| Arts & Humanities | 1,973 | 6.6% |
| Total | 29,960 | 100.0% |
Transportation & Commute in Kennebec County
Vehicle Availability by Sex in Kennebec County
The most prevalent vehicle ownership categories in Kennebec County are males with 2 vehicles (13,688, accounting for 45.9%) and females with 2 vehicles (12,891, making up 47.9%).
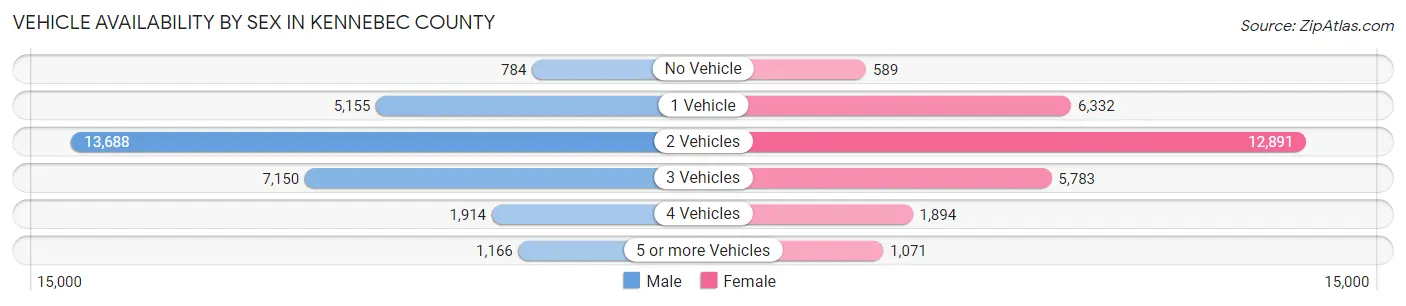
| Vehicles Available | Male | Female |
| No Vehicle | 784 (2.6%) | 589 (2.1%) |
| 1 Vehicle | 5,155 (17.3%) | 6,332 (22.2%) |
| 2 Vehicles | 13,688 (45.9%) | 12,891 (45.1%) |
| 3 Vehicles | 7,150 (23.9%) | 5,783 (20.3%) |
| 4 Vehicles | 1,914 (6.4%) | 1,894 (6.6%) |
| 5 or more Vehicles | 1,166 (3.9%) | 1,071 (3.7%) |
| Total | 29,857 (100.0%) | 28,560 (100.0%) |
Commute Time in Kennebec County
The most frequently occuring commute durations in Kennebec County are 15 to 19 minutes (7,827 commuters, 15.0%), 20 to 24 minutes (7,336 commuters, 14.1%), and 5 to 9 minutes (7,334 commuters, 14.1%).
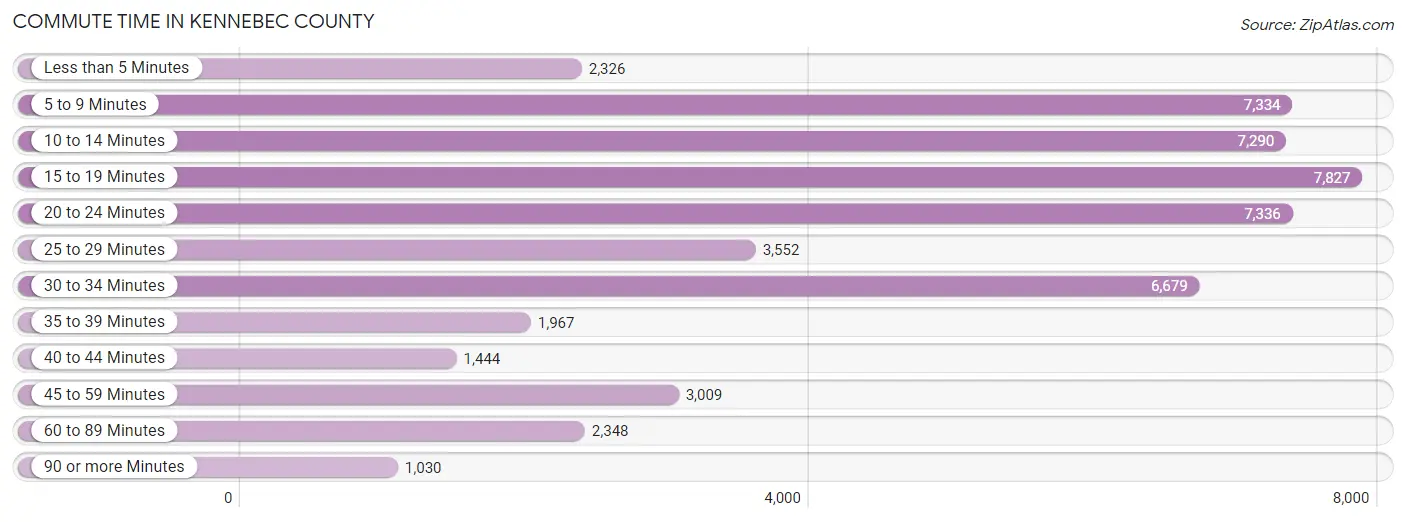
| Commute Time | # Commuters | % Commuters |
| Less than 5 Minutes | 2,326 | 4.5% |
| 5 to 9 Minutes | 7,334 | 14.1% |
| 10 to 14 Minutes | 7,290 | 14.0% |
| 15 to 19 Minutes | 7,827 | 15.0% |
| 20 to 24 Minutes | 7,336 | 14.1% |
| 25 to 29 Minutes | 3,552 | 6.8% |
| 30 to 34 Minutes | 6,679 | 12.8% |
| 35 to 39 Minutes | 1,967 | 3.8% |
| 40 to 44 Minutes | 1,444 | 2.8% |
| 45 to 59 Minutes | 3,009 | 5.8% |
| 60 to 89 Minutes | 2,348 | 4.5% |
| 90 or more Minutes | 1,030 | 2.0% |
Commute Time by Sex in Kennebec County
The most common commute times in Kennebec County are 30 to 34 minutes (3,954 commuters, 14.6%) for males and 15 to 19 minutes (4,282 commuters, 17.0%) for females.
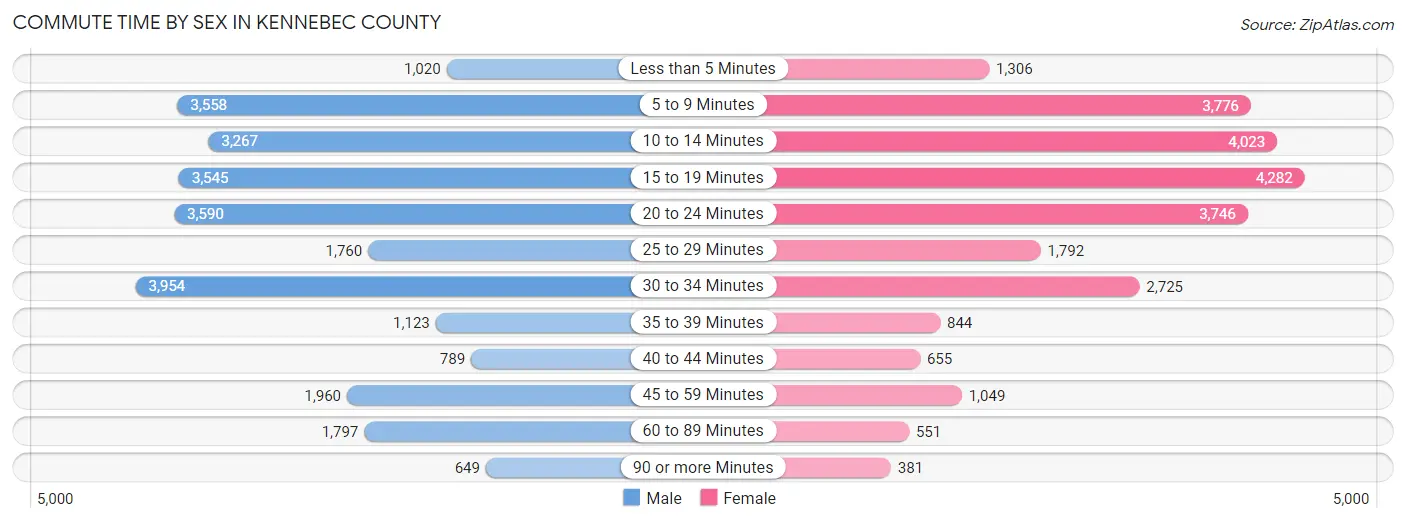
| Commute Time | Male | Female |
| Less than 5 Minutes | 1,020 (3.8%) | 1,306 (5.2%) |
| 5 to 9 Minutes | 3,558 (13.2%) | 3,776 (15.0%) |
| 10 to 14 Minutes | 3,267 (12.1%) | 4,023 (16.0%) |
| 15 to 19 Minutes | 3,545 (13.1%) | 4,282 (17.0%) |
| 20 to 24 Minutes | 3,590 (13.3%) | 3,746 (14.9%) |
| 25 to 29 Minutes | 1,760 (6.5%) | 1,792 (7.1%) |
| 30 to 34 Minutes | 3,954 (14.6%) | 2,725 (10.8%) |
| 35 to 39 Minutes | 1,123 (4.2%) | 844 (3.4%) |
| 40 to 44 Minutes | 789 (2.9%) | 655 (2.6%) |
| 45 to 59 Minutes | 1,960 (7.3%) | 1,049 (4.2%) |
| 60 to 89 Minutes | 1,797 (6.7%) | 551 (2.2%) |
| 90 or more Minutes | 649 (2.4%) | 381 (1.5%) |
Time of Departure to Work by Sex in Kennebec County
The most frequent times of departure to work in Kennebec County are 7:00 AM to 7:29 AM (4,193, 15.5%) for males and 7:00 AM to 7:29 AM (4,530, 18.0%) for females.
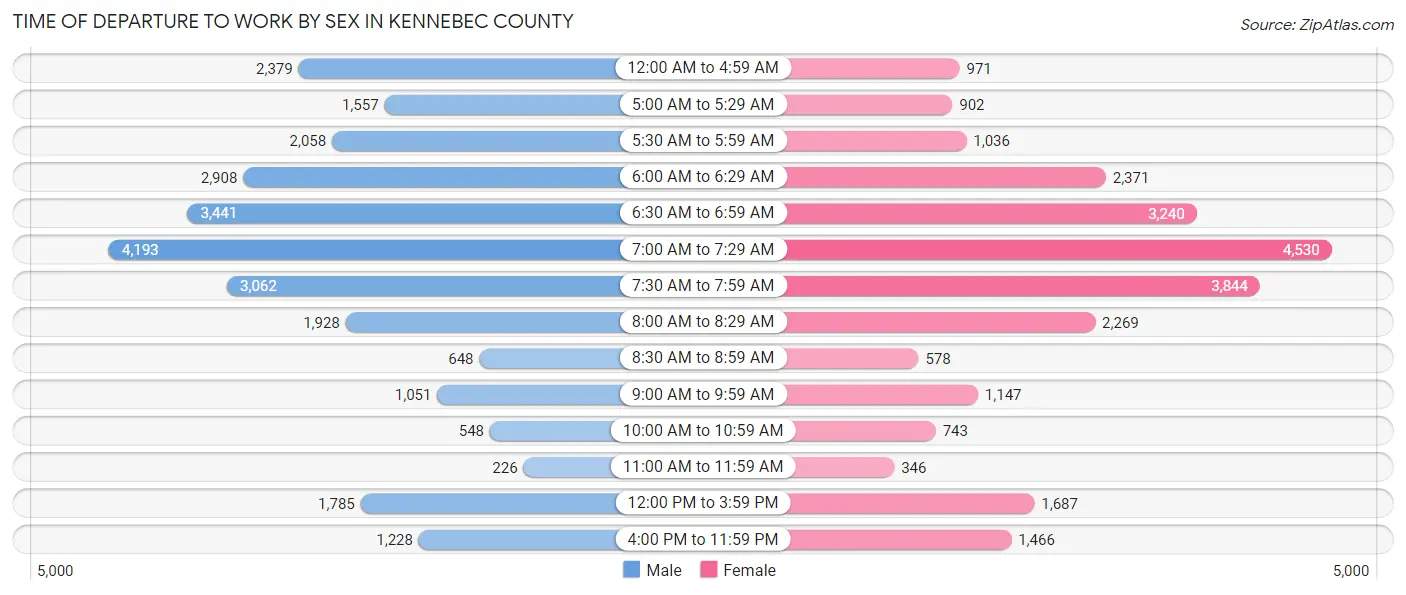
| Time of Departure | Male | Female |
| 12:00 AM to 4:59 AM | 2,379 (8.8%) | 971 (3.9%) |
| 5:00 AM to 5:29 AM | 1,557 (5.8%) | 902 (3.6%) |
| 5:30 AM to 5:59 AM | 2,058 (7.6%) | 1,036 (4.1%) |
| 6:00 AM to 6:29 AM | 2,908 (10.8%) | 2,371 (9.4%) |
| 6:30 AM to 6:59 AM | 3,441 (12.7%) | 3,240 (12.9%) |
| 7:00 AM to 7:29 AM | 4,193 (15.5%) | 4,530 (18.0%) |
| 7:30 AM to 7:59 AM | 3,062 (11.3%) | 3,844 (15.3%) |
| 8:00 AM to 8:29 AM | 1,928 (7.1%) | 2,269 (9.0%) |
| 8:30 AM to 8:59 AM | 648 (2.4%) | 578 (2.3%) |
| 9:00 AM to 9:59 AM | 1,051 (3.9%) | 1,147 (4.6%) |
| 10:00 AM to 10:59 AM | 548 (2.0%) | 743 (3.0%) |
| 11:00 AM to 11:59 AM | 226 (0.8%) | 346 (1.4%) |
| 12:00 PM to 3:59 PM | 1,785 (6.6%) | 1,687 (6.7%) |
| 4:00 PM to 11:59 PM | 1,228 (4.5%) | 1,466 (5.8%) |
| Total | 27,012 (100.0%) | 25,130 (100.0%) |
Housing Occupancy in Kennebec County
Occupancy by Ownership in Kennebec County
Of the total 53,452 dwellings in Kennebec County, owner-occupied units account for 38,739 (72.5%), while renter-occupied units make up 14,713 (27.5%).
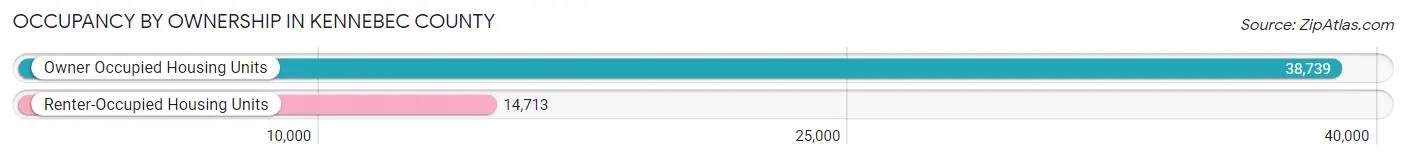
| Occupancy | # Housing Units | % Housing Units |
| Owner Occupied Housing Units | 38,739 | 72.5% |
| Renter-Occupied Housing Units | 14,713 | 27.5% |
| Total Occupied Housing Units | 53,452 | 100.0% |
Occupancy by Household Size in Kennebec County
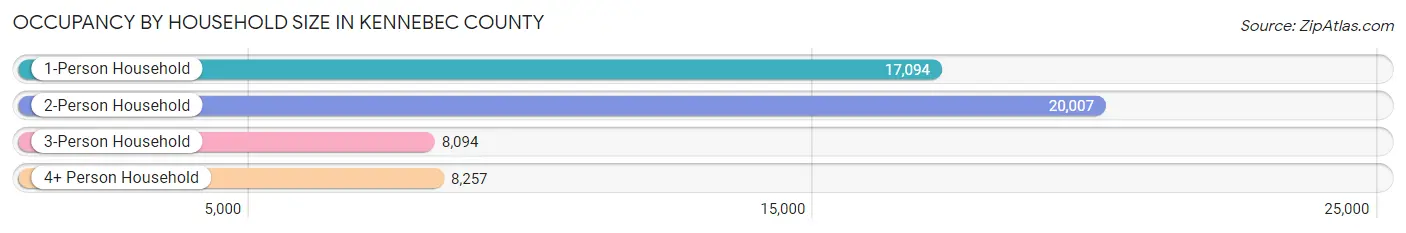
| Household Size | # Housing Units | % Housing Units |
| 1-Person Household | 17,094 | 32.0% |
| 2-Person Household | 20,007 | 37.4% |
| 3-Person Household | 8,094 | 15.1% |
| 4+ Person Household | 8,257 | 15.4% |
| Total Housing Units | 53,452 | 100.0% |
Occupancy by Ownership by Household Size in Kennebec County
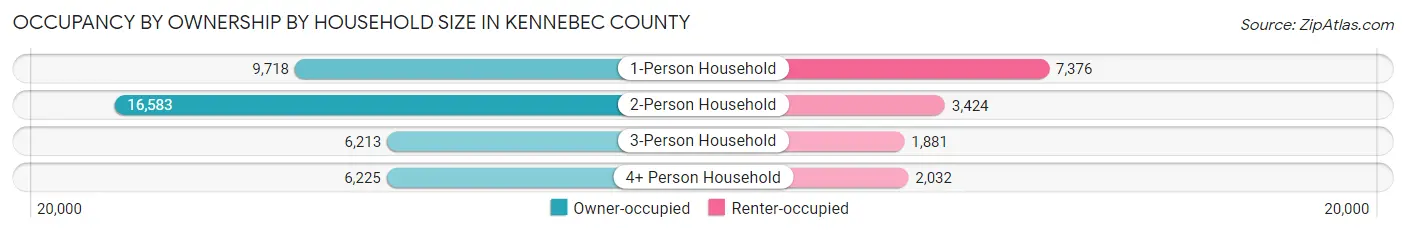
| Household Size | Owner-occupied | Renter-occupied |
| 1-Person Household | 9,718 (56.9%) | 7,376 (43.1%) |
| 2-Person Household | 16,583 (82.9%) | 3,424 (17.1%) |
| 3-Person Household | 6,213 (76.8%) | 1,881 (23.2%) |
| 4+ Person Household | 6,225 (75.4%) | 2,032 (24.6%) |
| Total Housing Units | 38,739 (72.5%) | 14,713 (27.5%) |
Occupancy by Educational Attainment in Kennebec County
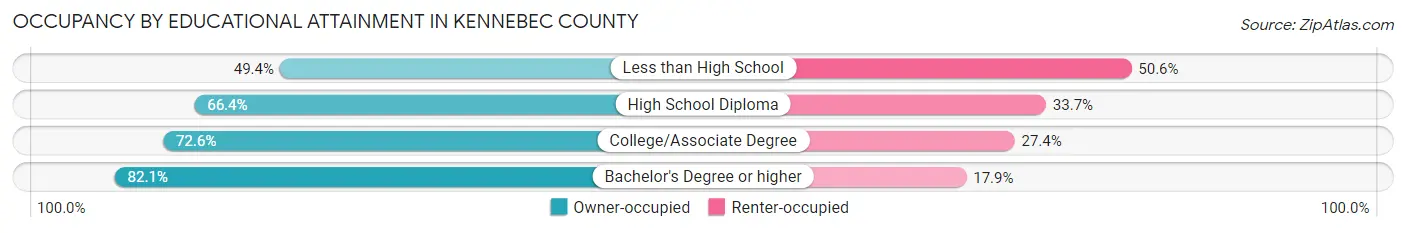
| Household Size | Owner-occupied | Renter-occupied |
| Less than High School | 1,224 (49.4%) | 1,253 (50.6%) |
| High School Diploma | 11,833 (66.3%) | 6,002 (33.7%) |
| College/Associate Degree | 11,660 (72.6%) | 4,409 (27.4%) |
| Bachelor's Degree or higher | 14,022 (82.1%) | 3,049 (17.9%) |
Occupancy by Age of Householder in Kennebec County
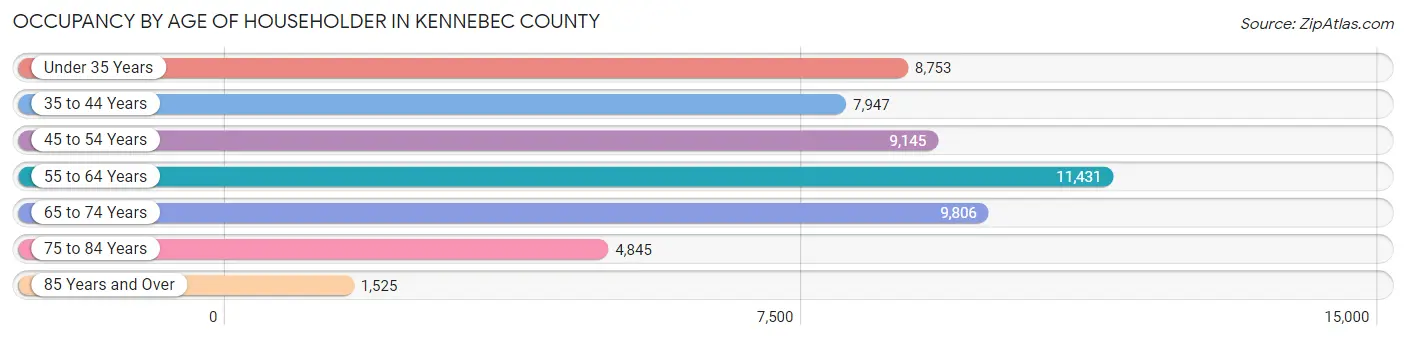
| Age Bracket | # Households | % Households |
| Under 35 Years | 8,753 | 16.4% |
| 35 to 44 Years | 7,947 | 14.9% |
| 45 to 54 Years | 9,145 | 17.1% |
| 55 to 64 Years | 11,431 | 21.4% |
| 65 to 74 Years | 9,806 | 18.3% |
| 75 to 84 Years | 4,845 | 9.1% |
| 85 Years and Over | 1,525 | 2.9% |
| Total | 53,452 | 100.0% |
Housing Finances in Kennebec County
Median Income by Occupancy in Kennebec County
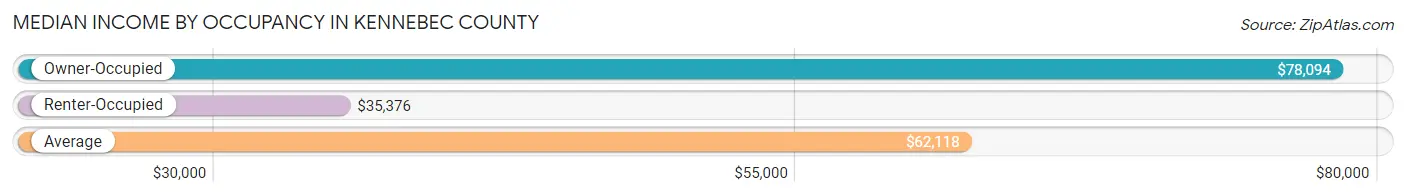
| Occupancy Type | # Households | Median Income |
| Owner-Occupied | 38,739 (72.5%) | $78,094 |
| Renter-Occupied | 14,713 (27.5%) | $35,376 |
| Average | 53,452 (100.0%) | $62,118 |
Occupancy by Householder Income Bracket in Kennebec County
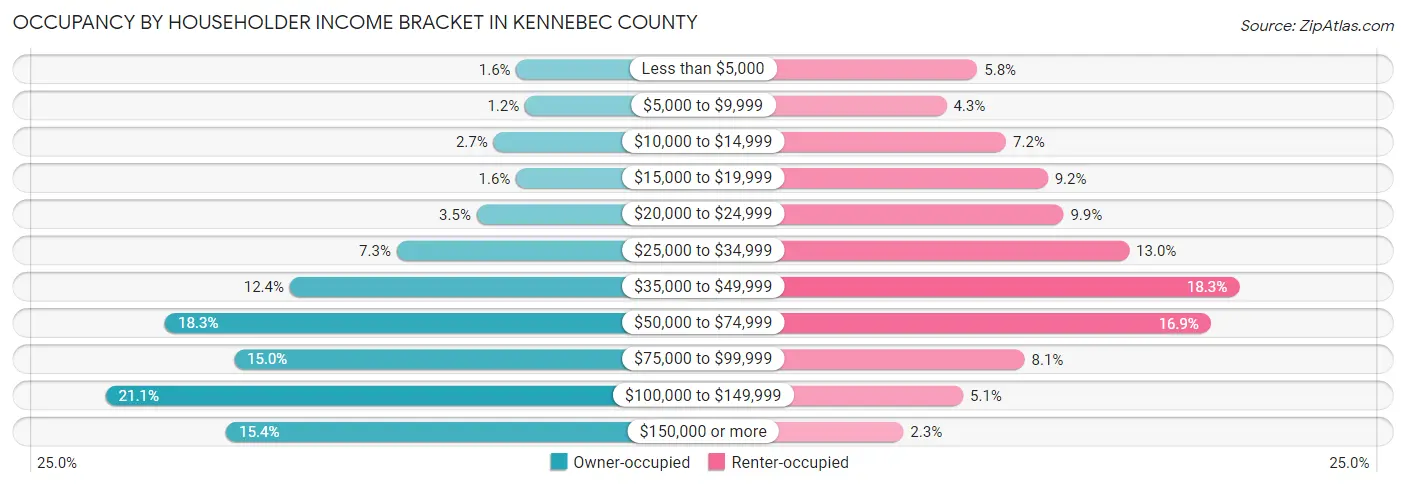
| Income Bracket | Owner-occupied | Renter-occupied |
| Less than $5,000 | 613 (1.6%) | 853 (5.8%) |
| $5,000 to $9,999 | 453 (1.2%) | 637 (4.3%) |
| $10,000 to $14,999 | 1,034 (2.7%) | 1,055 (7.2%) |
| $15,000 to $19,999 | 615 (1.6%) | 1,346 (9.1%) |
| $20,000 to $24,999 | 1,343 (3.5%) | 1,456 (9.9%) |
| $25,000 to $34,999 | 2,819 (7.3%) | 1,917 (13.0%) |
| $35,000 to $49,999 | 4,792 (12.4%) | 2,687 (18.3%) |
| $50,000 to $74,999 | 7,094 (18.3%) | 2,488 (16.9%) |
| $75,000 to $99,999 | 5,824 (15.0%) | 1,185 (8.1%) |
| $100,000 to $149,999 | 8,188 (21.1%) | 753 (5.1%) |
| $150,000 or more | 5,964 (15.4%) | 336 (2.3%) |
| Total | 38,739 (100.0%) | 14,713 (100.0%) |
Monthly Housing Cost Tiers in Kennebec County
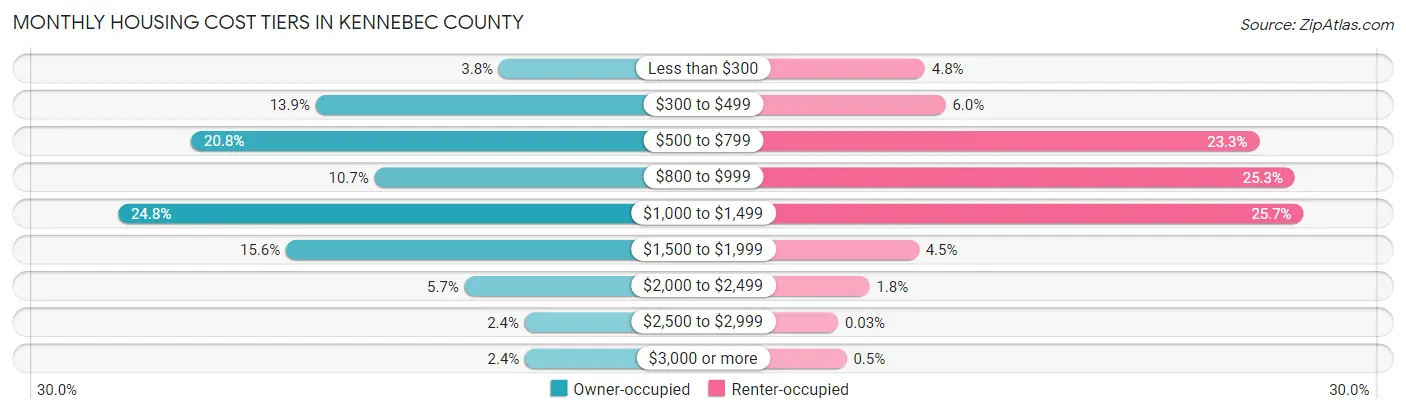
| Monthly Cost | Owner-occupied | Renter-occupied |
| Less than $300 | 1,471 (3.8%) | 711 (4.8%) |
| $300 to $499 | 5,394 (13.9%) | 878 (6.0%) |
| $500 to $799 | 8,056 (20.8%) | 3,428 (23.3%) |
| $800 to $999 | 4,135 (10.7%) | 3,717 (25.3%) |
| $1,000 to $1,499 | 9,624 (24.8%) | 3,787 (25.7%) |
| $1,500 to $1,999 | 6,028 (15.6%) | 660 (4.5%) |
| $2,000 to $2,499 | 2,203 (5.7%) | 261 (1.8%) |
| $2,500 to $2,999 | 919 (2.4%) | 4 (0.0%) |
| $3,000 or more | 909 (2.4%) | 74 (0.5%) |
| Total | 38,739 (100.0%) | 14,713 (100.0%) |
Physical Housing Characteristics in Kennebec County
Housing Structures in Kennebec County
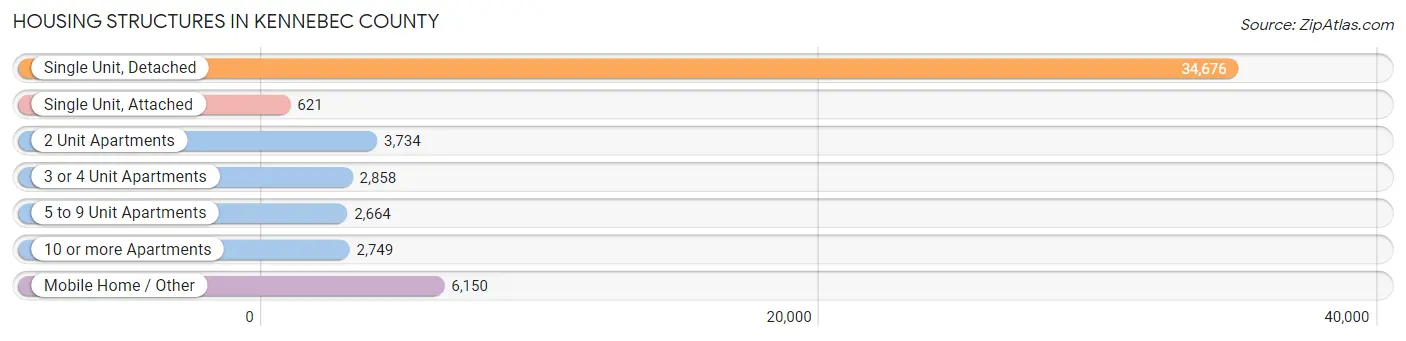
| Structure Type | # Housing Units | % Housing Units |
| Single Unit, Detached | 34,676 | 64.9% |
| Single Unit, Attached | 621 | 1.2% |
| 2 Unit Apartments | 3,734 | 7.0% |
| 3 or 4 Unit Apartments | 2,858 | 5.3% |
| 5 to 9 Unit Apartments | 2,664 | 5.0% |
| 10 or more Apartments | 2,749 | 5.1% |
| Mobile Home / Other | 6,150 | 11.5% |
| Total | 53,452 | 100.0% |
Housing Structures by Occupancy in Kennebec County
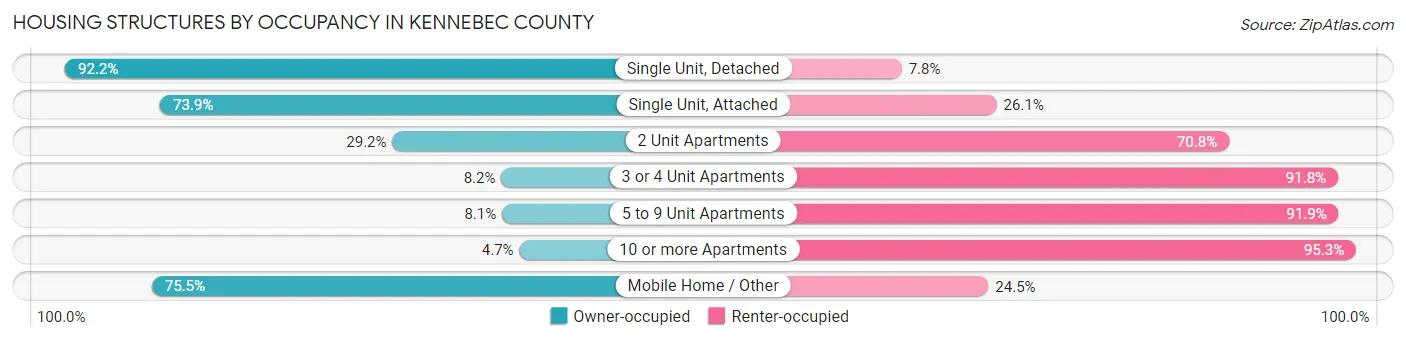
| Structure Type | Owner-occupied | Renter-occupied |
| Single Unit, Detached | 31,967 (92.2%) | 2,709 (7.8%) |
| Single Unit, Attached | 459 (73.9%) | 162 (26.1%) |
| 2 Unit Apartments | 1,090 (29.2%) | 2,644 (70.8%) |
| 3 or 4 Unit Apartments | 235 (8.2%) | 2,623 (91.8%) |
| 5 to 9 Unit Apartments | 215 (8.1%) | 2,449 (91.9%) |
| 10 or more Apartments | 130 (4.7%) | 2,619 (95.3%) |
| Mobile Home / Other | 4,643 (75.5%) | 1,507 (24.5%) |
| Total | 38,739 (72.5%) | 14,713 (27.5%) |
Housing Structures by Number of Rooms in Kennebec County
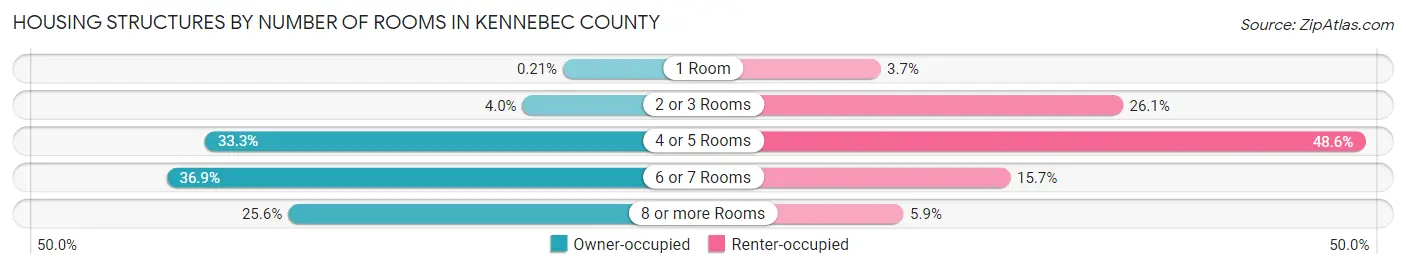
| Number of Rooms | Owner-occupied | Renter-occupied |
| 1 Room | 82 (0.2%) | 548 (3.7%) |
| 2 or 3 Rooms | 1,533 (4.0%) | 3,846 (26.1%) |
| 4 or 5 Rooms | 12,907 (33.3%) | 7,145 (48.6%) |
| 6 or 7 Rooms | 14,285 (36.9%) | 2,314 (15.7%) |
| 8 or more Rooms | 9,932 (25.6%) | 860 (5.9%) |
| Total | 38,739 (100.0%) | 14,713 (100.0%) |
Housing Structure by Heating Type in Kennebec County
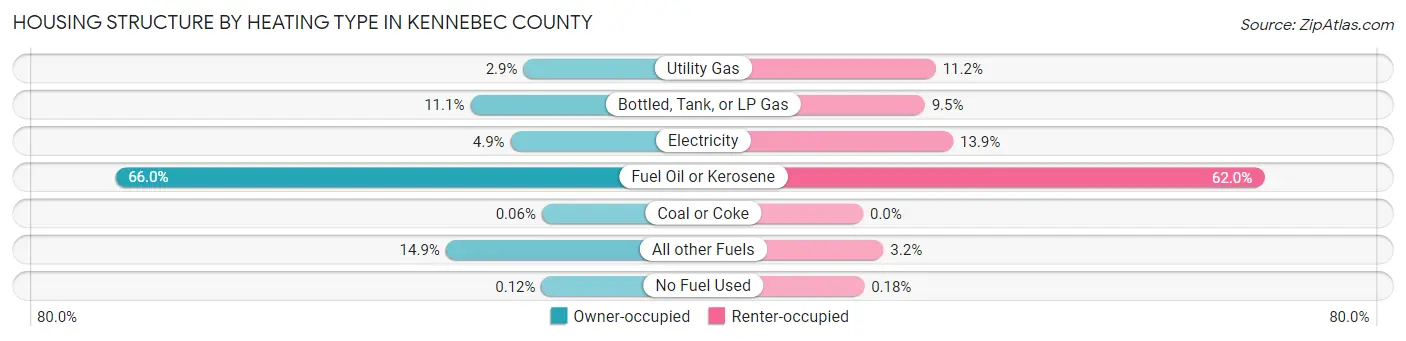
| Heating Type | Owner-occupied | Renter-occupied |
| Utility Gas | 1,126 (2.9%) | 1,654 (11.2%) |
| Bottled, Tank, or LP Gas | 4,304 (11.1%) | 1,403 (9.5%) |
| Electricity | 1,900 (4.9%) | 2,047 (13.9%) |
| Fuel Oil or Kerosene | 25,562 (66.0%) | 9,120 (62.0%) |
| Coal or Coke | 22 (0.1%) | 0 (0.0%) |
| All other Fuels | 5,777 (14.9%) | 463 (3.2%) |
| No Fuel Used | 48 (0.1%) | 26 (0.2%) |
| Total | 38,739 (100.0%) | 14,713 (100.0%) |
Household Vehicle Usage in Kennebec County
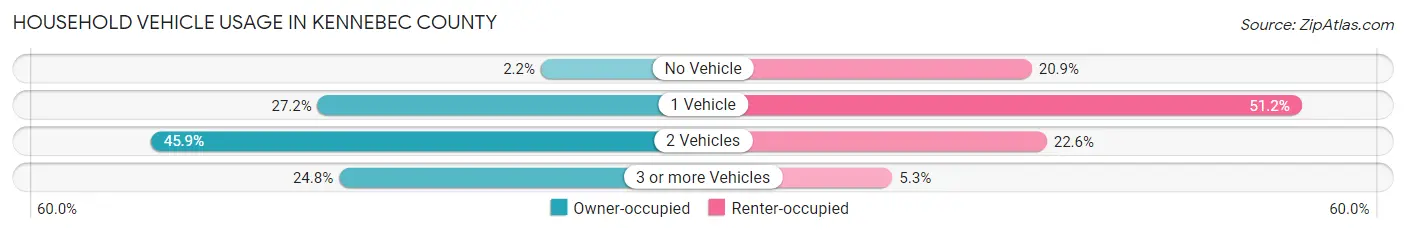
| Vehicles per Household | Owner-occupied | Renter-occupied |
| No Vehicle | 846 (2.2%) | 3,080 (20.9%) |
| 1 Vehicle | 10,529 (27.2%) | 7,525 (51.1%) |
| 2 Vehicles | 17,766 (45.9%) | 3,326 (22.6%) |
| 3 or more Vehicles | 9,598 (24.8%) | 782 (5.3%) |
| Total | 38,739 (100.0%) | 14,713 (100.0%) |
Real Estate & Mortgages in Kennebec County
Real Estate and Mortgage Overview in Kennebec County
| Characteristic | Without Mortgage | With Mortgage |
| Housing Units | 15,265 | 23,474 |
| Median Property Value | $185,000 | $204,000 |
| Median Household Income | $56,981 | $4,451 |
| Monthly Housing Costs | $536 | $909 |
| Real Estate Taxes | $2,363 | $238 |
Property Value by Mortgage Status in Kennebec County
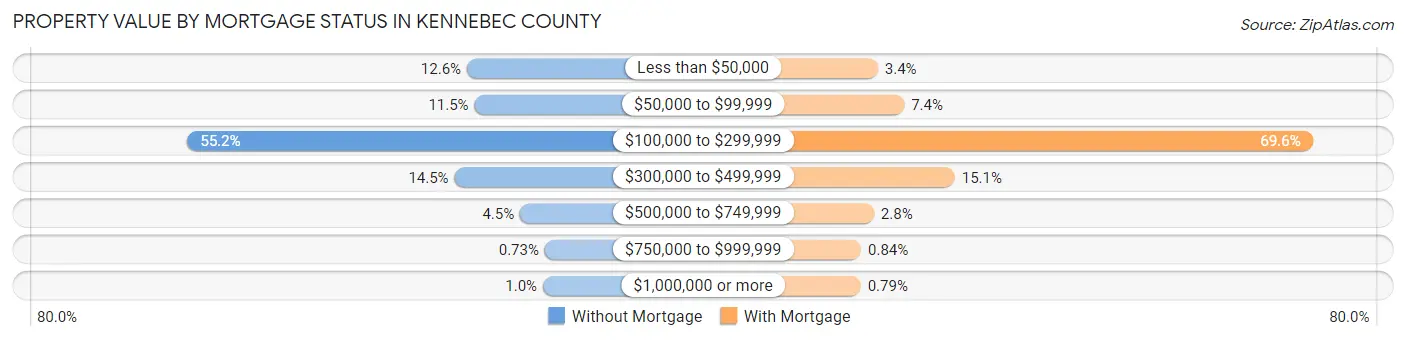
| Property Value | Without Mortgage | With Mortgage |
| Less than $50,000 | 1,923 (12.6%) | 798 (3.4%) |
| $50,000 to $99,999 | 1,748 (11.5%) | 1,741 (7.4%) |
| $100,000 to $299,999 | 8,427 (55.2%) | 16,345 (69.6%) |
| $300,000 to $499,999 | 2,214 (14.5%) | 3,549 (15.1%) |
| $500,000 to $749,999 | 687 (4.5%) | 658 (2.8%) |
| $750,000 to $999,999 | 111 (0.7%) | 198 (0.8%) |
| $1,000,000 or more | 155 (1.0%) | 185 (0.8%) |
| Total | 15,265 (100.0%) | 23,474 (100.0%) |
Household Income by Mortgage Status in Kennebec County
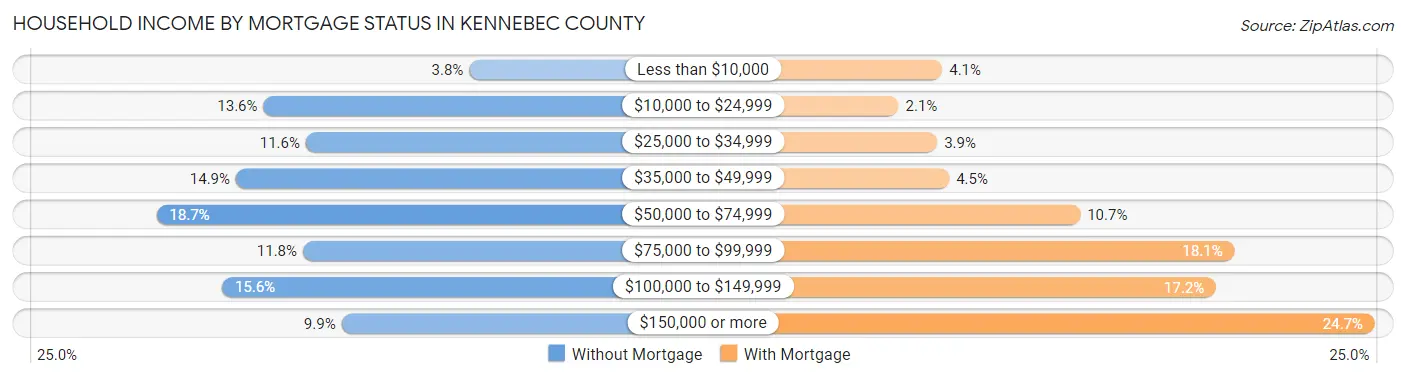
| Household Income | Without Mortgage | With Mortgage |
| Less than $10,000 | 585 (3.8%) | 970 (4.1%) |
| $10,000 to $24,999 | 2,080 (13.6%) | 481 (2.1%) |
| $25,000 to $34,999 | 1,772 (11.6%) | 912 (3.9%) |
| $35,000 to $49,999 | 2,281 (14.9%) | 1,047 (4.5%) |
| $50,000 to $74,999 | 2,858 (18.7%) | 2,511 (10.7%) |
| $75,000 to $99,999 | 1,794 (11.7%) | 4,236 (18.0%) |
| $100,000 to $149,999 | 2,382 (15.6%) | 4,030 (17.2%) |
| $150,000 or more | 1,513 (9.9%) | 5,806 (24.7%) |
| Total | 15,265 (100.0%) | 23,474 (100.0%) |
Property Value to Household Income Ratio in Kennebec County
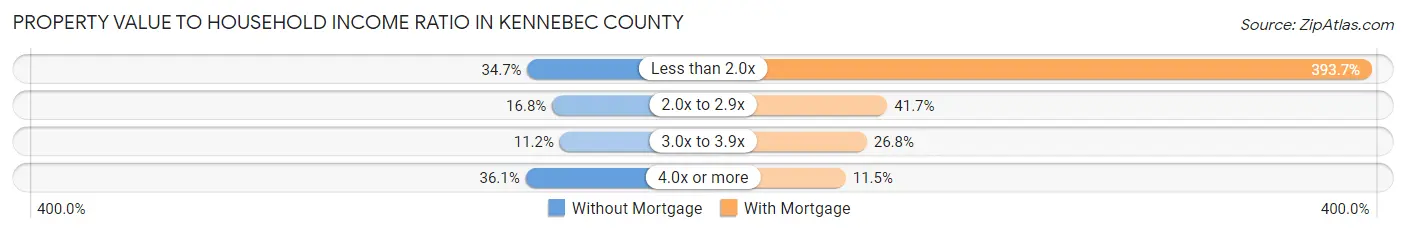
| Value-to-Income Ratio | Without Mortgage | With Mortgage |
| Less than 2.0x | 5,297 (34.7%) | 92,417 (393.7%) |
| 2.0x to 2.9x | 2,558 (16.8%) | 9,793 (41.7%) |
| 3.0x to 3.9x | 1,715 (11.2%) | 6,289 (26.8%) |
| 4.0x or more | 5,513 (36.1%) | 2,707 (11.5%) |
| Total | 15,265 (100.0%) | 23,474 (100.0%) |
Real Estate Taxes by Mortgage Status in Kennebec County
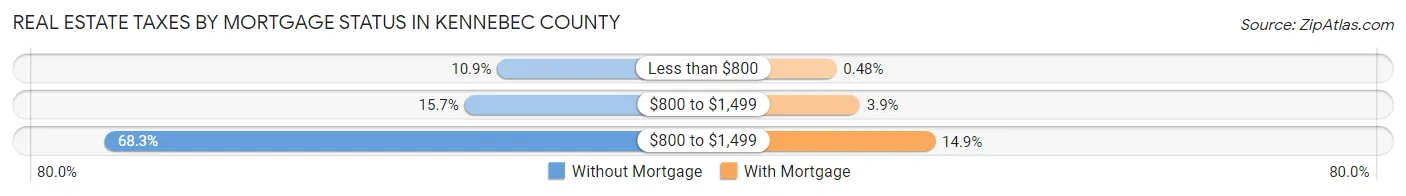
| Property Taxes | Without Mortgage | With Mortgage |
| Less than $800 | 1,668 (10.9%) | 112 (0.5%) |
| $800 to $1,499 | 2,398 (15.7%) | 918 (3.9%) |
| $800 to $1,499 | 10,422 (68.3%) | 3,499 (14.9%) |
| Total | 15,265 (100.0%) | 23,474 (100.0%) |
Health & Disability in Kennebec County
Health Insurance Coverage by Age in Kennebec County
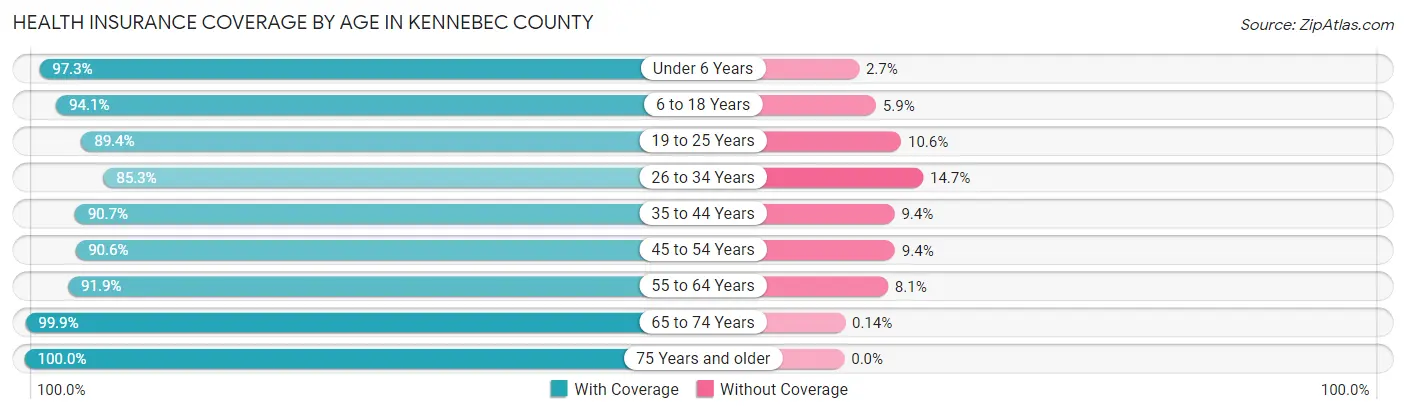
| Age Bracket | With Coverage | Without Coverage |
| Under 6 Years | 7,065 (97.3%) | 199 (2.7%) |
| 6 to 18 Years | 16,830 (94.1%) | 1,053 (5.9%) |
| 19 to 25 Years | 8,578 (89.4%) | 1,015 (10.6%) |
| 26 to 34 Years | 11,414 (85.3%) | 1,965 (14.7%) |
| 35 to 44 Years | 13,290 (90.6%) | 1,370 (9.3%) |
| 45 to 54 Years | 14,259 (90.6%) | 1,486 (9.4%) |
| 55 to 64 Years | 17,749 (91.9%) | 1,570 (8.1%) |
| 65 to 74 Years | 15,166 (99.9%) | 22 (0.1%) |
| 75 Years and older | 9,146 (100.0%) | 0 (0.0%) |
| Total | 113,497 (92.9%) | 8,680 (7.1%) |
Health Insurance Coverage by Citizenship Status in Kennebec County
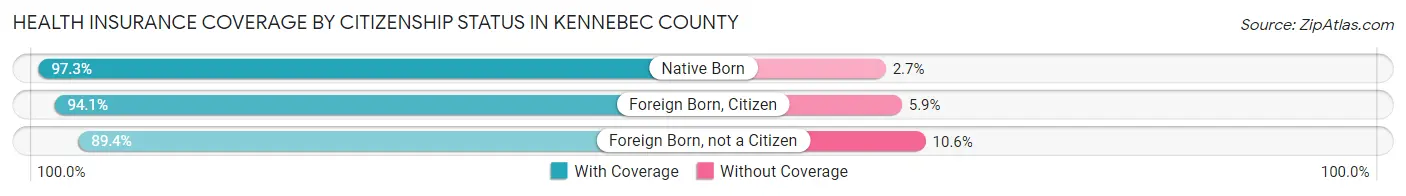
| Citizenship Status | With Coverage | Without Coverage |
| Native Born | 7,065 (97.3%) | 199 (2.7%) |
| Foreign Born, Citizen | 16,830 (94.1%) | 1,053 (5.9%) |
| Foreign Born, not a Citizen | 8,578 (89.4%) | 1,015 (10.6%) |
Health Insurance Coverage by Household Income in Kennebec County
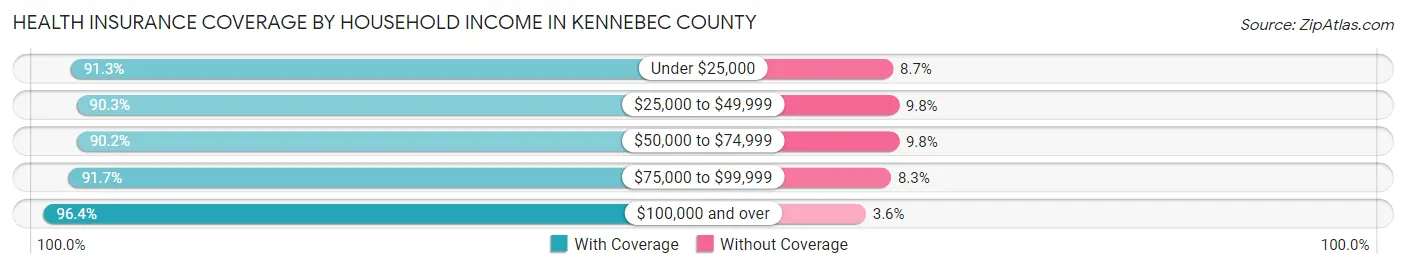
| Household Income | With Coverage | Without Coverage |
| Under $25,000 | 12,443 (91.3%) | 1,183 (8.7%) |
| $25,000 to $49,999 | 20,693 (90.2%) | 2,235 (9.8%) |
| $50,000 to $74,999 | 19,474 (90.2%) | 2,109 (9.8%) |
| $75,000 to $99,999 | 16,857 (91.7%) | 1,522 (8.3%) |
| $100,000 and over | 41,928 (96.4%) | 1,546 (3.6%) |
Public vs Private Health Insurance Coverage by Age in Kennebec County
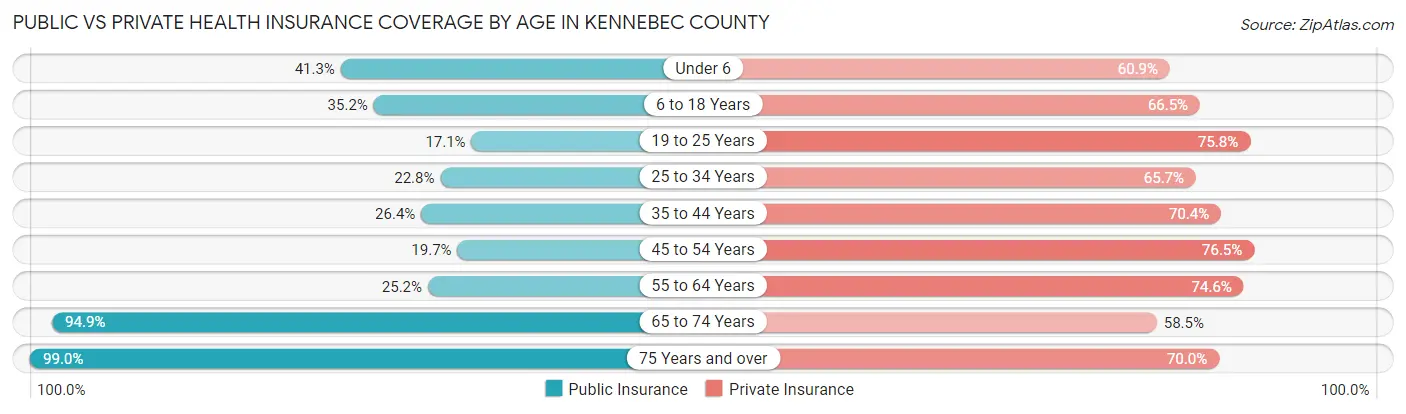
| Age Bracket | Public Insurance | Private Insurance |
| Under 6 | 3,002 (41.3%) | 4,423 (60.9%) |
| 6 to 18 Years | 6,296 (35.2%) | 11,887 (66.5%) |
| 19 to 25 Years | 1,637 (17.1%) | 7,269 (75.8%) |
| 25 to 34 Years | 3,056 (22.8%) | 8,791 (65.7%) |
| 35 to 44 Years | 3,869 (26.4%) | 10,319 (70.4%) |
| 45 to 54 Years | 3,095 (19.7%) | 12,048 (76.5%) |
| 55 to 64 Years | 4,859 (25.2%) | 14,409 (74.6%) |
| 65 to 74 Years | 14,411 (94.9%) | 8,880 (58.5%) |
| 75 Years and over | 9,052 (99.0%) | 6,405 (70.0%) |
| Total | 49,277 (40.3%) | 84,431 (69.1%) |
Disability Status by Sex by Age in Kennebec County
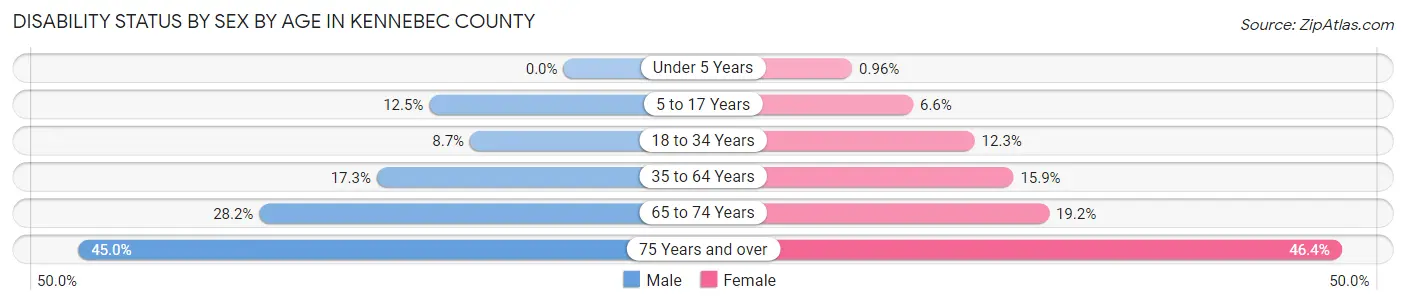
| Age Bracket | Male | Female |
| Under 5 Years | 0 (0.0%) | 29 (1.0%) |
| 5 to 17 Years | 1,121 (12.4%) | 573 (6.6%) |
| 18 to 34 Years | 1,071 (8.7%) | 1,506 (12.3%) |
| 35 to 64 Years | 4,230 (17.3%) | 4,031 (15.9%) |
| 65 to 74 Years | 2,030 (28.2%) | 1,538 (19.2%) |
| 75 Years and over | 1,709 (45.0%) | 2,481 (46.4%) |
Disability Class by Sex by Age in Kennebec County
Disability Class: Hearing Difficulty
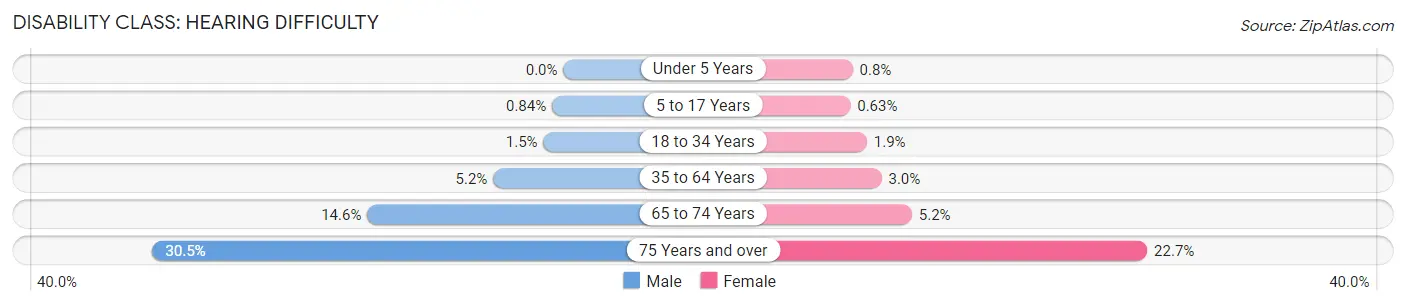
| Age Bracket | Male | Female |
| Under 5 Years | 0 (0.0%) | 24 (0.8%) |
| 5 to 17 Years | 76 (0.8%) | 55 (0.6%) |
| 18 to 34 Years | 183 (1.5%) | 227 (1.9%) |
| 35 to 64 Years | 1,272 (5.2%) | 745 (2.9%) |
| 65 to 74 Years | 1,047 (14.6%) | 416 (5.2%) |
| 75 Years and over | 1,158 (30.5%) | 1,213 (22.7%) |
Disability Class: Vision Difficulty
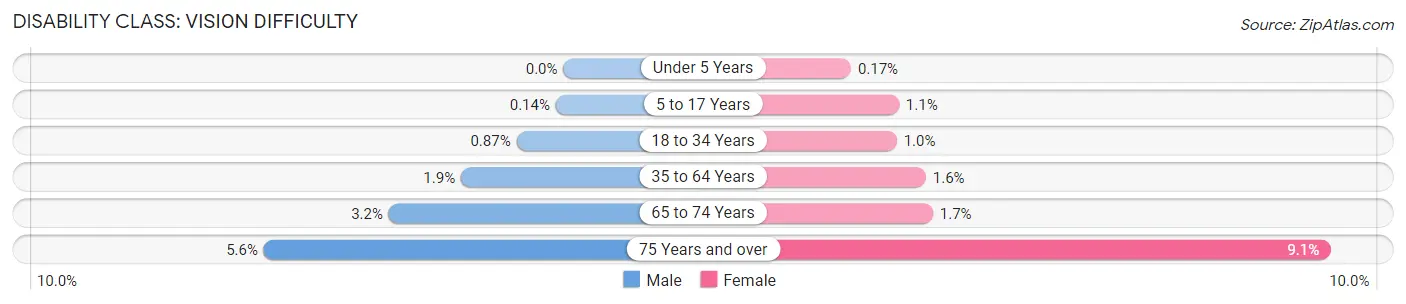
| Age Bracket | Male | Female |
| Under 5 Years | 0 (0.0%) | 5 (0.2%) |
| 5 to 17 Years | 13 (0.1%) | 92 (1.1%) |
| 18 to 34 Years | 107 (0.9%) | 125 (1.0%) |
| 35 to 64 Years | 464 (1.9%) | 395 (1.6%) |
| 65 to 74 Years | 233 (3.2%) | 135 (1.7%) |
| 75 Years and over | 211 (5.6%) | 486 (9.1%) |
Disability Class: Cognitive Difficulty
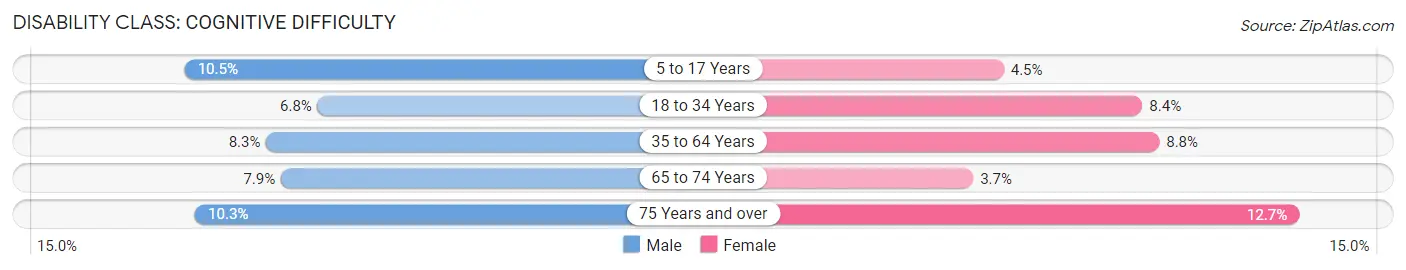
| Age Bracket | Male | Female |
| 5 to 17 Years | 949 (10.5%) | 391 (4.5%) |
| 18 to 34 Years | 844 (6.8%) | 1,022 (8.4%) |
| 35 to 64 Years | 2,020 (8.3%) | 2,236 (8.8%) |
| 65 to 74 Years | 565 (7.9%) | 293 (3.7%) |
| 75 Years and over | 389 (10.2%) | 681 (12.7%) |
Disability Class: Ambulatory Difficulty
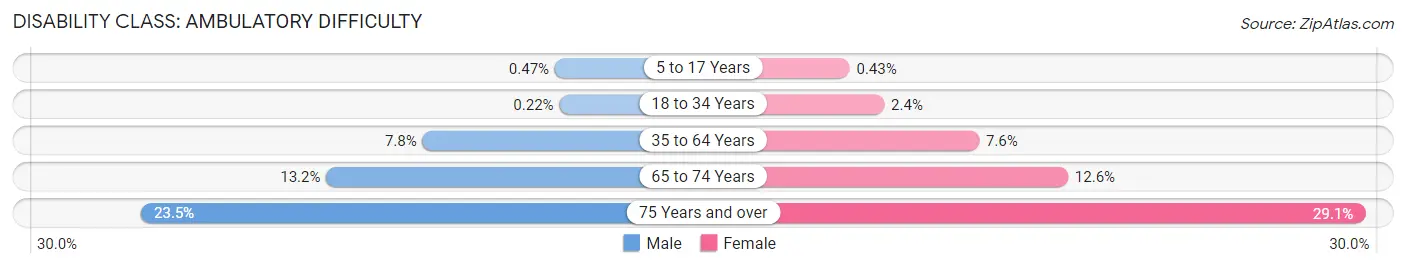
| Age Bracket | Male | Female |
| 5 to 17 Years | 42 (0.5%) | 37 (0.4%) |
| 18 to 34 Years | 27 (0.2%) | 288 (2.4%) |
| 35 to 64 Years | 1,916 (7.8%) | 1,932 (7.6%) |
| 65 to 74 Years | 949 (13.2%) | 1,007 (12.6%) |
| 75 Years and over | 893 (23.5%) | 1,559 (29.1%) |
Disability Class: Self-Care Difficulty
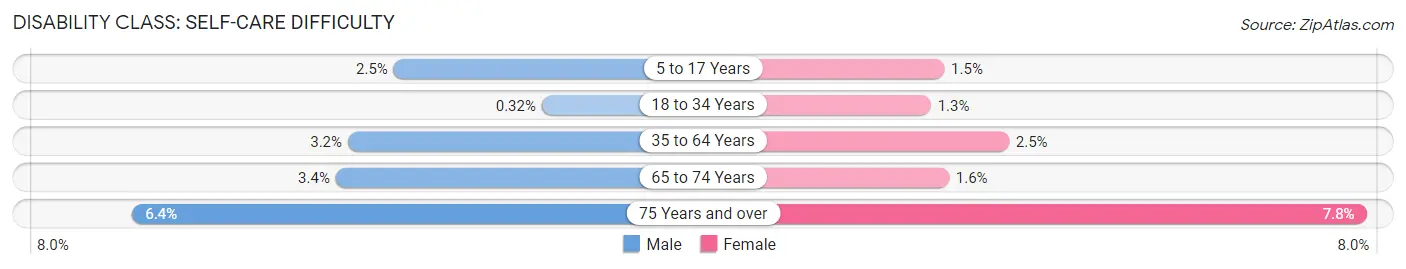
| Age Bracket | Male | Female |
| 5 to 17 Years | 227 (2.5%) | 132 (1.5%) |
| 18 to 34 Years | 40 (0.3%) | 161 (1.3%) |
| 35 to 64 Years | 782 (3.2%) | 628 (2.5%) |
| 65 to 74 Years | 243 (3.4%) | 127 (1.6%) |
| 75 Years and over | 243 (6.4%) | 417 (7.8%) |
Technology Access in Kennebec County
Computing Device Access in Kennebec County
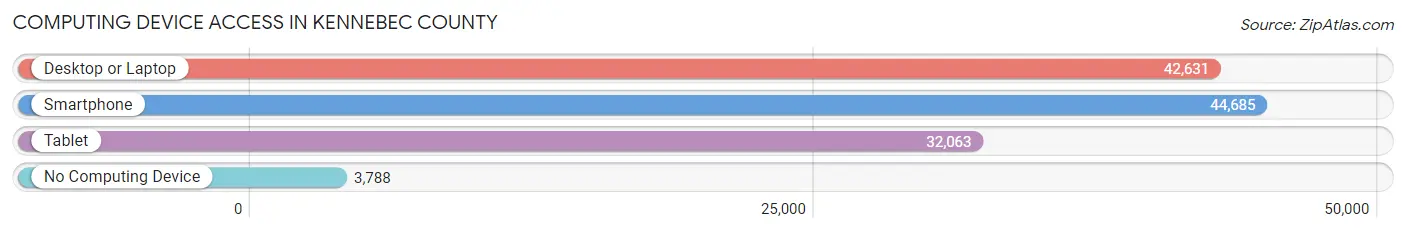
| Device Type | # Households | % Households |
| Desktop or Laptop | 42,631 | 79.8% |
| Smartphone | 44,685 | 83.6% |
| Tablet | 32,063 | 60.0% |
| No Computing Device | 3,788 | 7.1% |
| Total | 53,452 | 100.0% |
Internet Access in Kennebec County
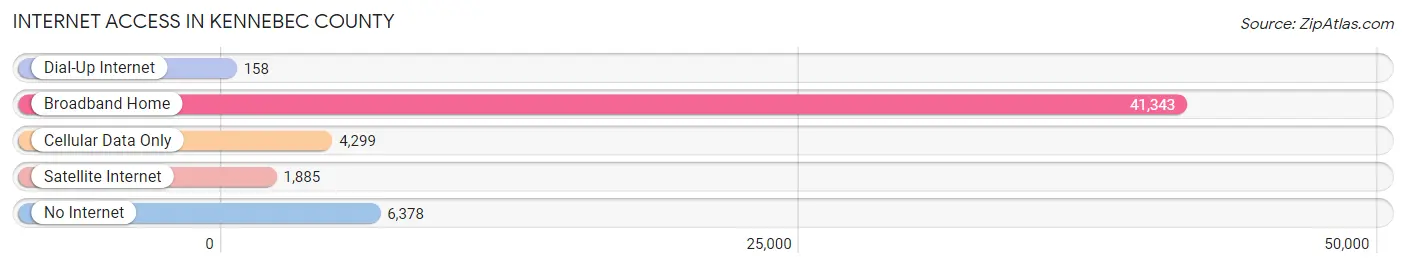
| Internet Type | # Households | % Households |
| Dial-Up Internet | 158 | 0.3% |
| Broadband Home | 41,343 | 77.3% |
| Cellular Data Only | 4,299 | 8.0% |
| Satellite Internet | 1,885 | 3.5% |
| No Internet | 6,378 | 11.9% |
| Total | 53,452 | 100.0% |
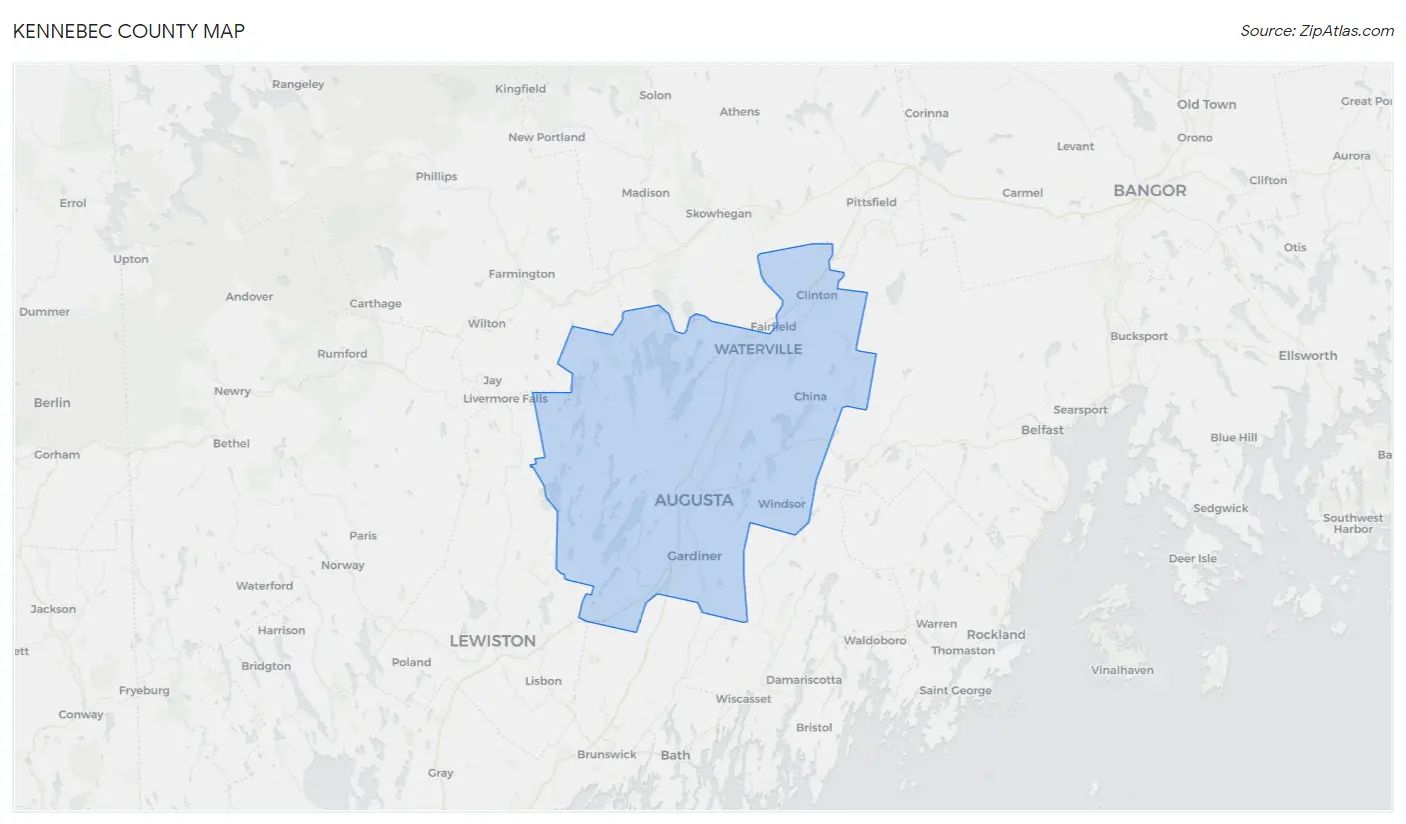
Kennebec County Summary
Kennebec County is located in the state of Maine, in the United States of America. It is the largest county in the state, covering an area of 2,569 square miles. The county seat is Augusta, the state capital. As of the 2010 census, the population of Kennebec County was 122,151.
History
Kennebec County was established in 1799, when Maine became a state. It was named after the Kennebec River, which runs through the county. The river was named by the Abenaki Indians, who called it “Kenebeke”, meaning “long, quiet water”.
The county was originally part of the District of Maine, which was a part of Massachusetts until 1820. During the American Revolution, the county was the site of several battles, including the Battle of Fort Halifax in 1775.
In the 19th century, the county was an important center for the lumber industry. The county was also home to several shipbuilding companies, which built ships for the Union Navy during the Civil War.
Geography
Kennebec County is located in the south-central part of Maine. It is bordered by Somerset County to the north, Lincoln County to the east, Waldo County to the south, and Franklin County to the west.
The county is mostly rural, with a few small towns and villages. The largest city is Augusta, the state capital, which is located in the center of the county. Other towns include Waterville, Winslow, Gardiner, and Skowhegan.
The Kennebec River runs through the county, and is a major source of recreation and tourism. The river is home to several species of fish, including salmon, trout, and bass.
The county is also home to several lakes, including Cobbosseecontee Lake, Great Pond, and Long Pond. These lakes are popular for fishing, swimming, and boating.
Economy
Kennebec County’s economy is largely based on agriculture and tourism. The county is home to several farms, which produce a variety of crops, including potatoes, corn, and hay.
The county is also home to several manufacturing companies, which produce a variety of products, including paper, furniture, and textiles.
Tourism is an important part of the county’s economy. The county is home to several state parks, including Sebago Lake State Park and Bradbury Mountain State Park. These parks attract visitors from all over the state and beyond.
Demographics
As of the 2010 census, the population of Kennebec County was 122,151. The population is mostly white (94.3%), with small percentages of African Americans (2.2%), Native Americans (0.7%), Asians (0.6%), and other races (2.2%).
The median household income in the county is $45,945, and the median family income is $54,945. The per capita income is $25,945.
The largest employers in the county are the state government, the health care industry, and the manufacturing industry. The unemployment rate in the county is 4.2%.
Conclusion
Kennebec County is a large county in the state of Maine. It is home to a variety of industries, including agriculture, manufacturing, and tourism. The county is also home to several state parks, which attract visitors from all over the state and beyond. The population of the county is mostly white, with small percentages of African Americans, Native Americans, Asians, and other races. The median household income in the county is $45,945, and the unemployment rate is 4.2%.
Common Questions
What is Per Capita Income in Kennebec County?
Per Capita income in Kennebec County is $36,009.
What is the Median Family Income in Kennebec County?
Median Family Income in Kennebec County is $81,228.
What is the Median Household income in Kennebec County?
Median Household Income in Kennebec County is $62,118.
What is Income or Wage Gap in Kennebec County?
Income or Wage Gap in Kennebec County is 19.2%.
Women in Kennebec County earn 80.8 cents for every dollar earned by a man.
What is Family Income Deficit in Kennebec County?
Family Income Deficit in Kennebec County is $9,362.
Families that are below poverty line in Kennebec County earn $9,362 less on average than the poverty threshold level.
What is Inequality or Gini Index in Kennebec County?
Inequality or Gini Index in Kennebec County is 0.44.
What is the Total Population of Kennebec County?
Total Population of Kennebec County is 124,003.
What is the Total Male Population of Kennebec County?
Total Male Population of Kennebec County is 60,678.
What is the Total Female Population of Kennebec County?
Total Female Population of Kennebec County is 63,325.
What is the Ratio of Males per 100 Females in Kennebec County?
There are 95.82 Males per 100 Females in Kennebec County.
What is the Ratio of Females per 100 Males in Kennebec County?
There are 104.36 Females per 100 Males in Kennebec County.
What is the Median Population Age in Kennebec County?
Median Population Age in Kennebec County is 44.3 Years.
What is the Average Family Size in Kennebec County
Average Family Size in Kennebec County is 2.8 People.
What is the Average Household Size in Kennebec County
Average Household Size in Kennebec County is 2.2 People.
How Large is the Labor Force in Kennebec County?
There are 63,075 People in the Labor Forcein in Kennebec County.
What is the Percentage of People in the Labor Force in Kennebec County?
61.1% of People are in the Labor Force in Kennebec County.
What is the Unemployment Rate in Kennebec County?
Unemployment Rate in Kennebec County is 4.1%.