Sagadahoc County, ME Map & Demographics
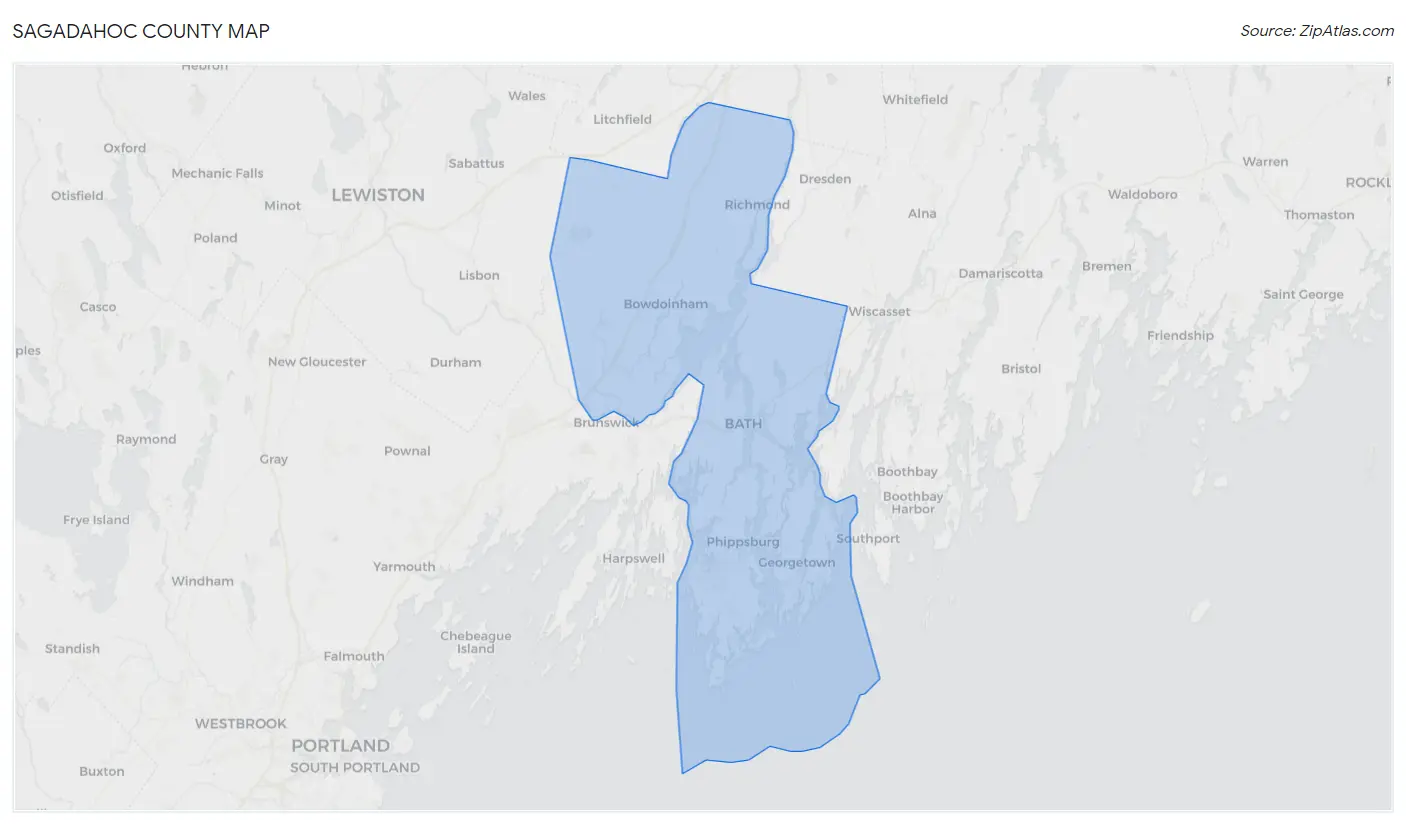
Sagadahoc County Map
Sagadahoc County Overview
$40,950
PER CAPITA INCOME
$91,645
AVG FAMILY INCOME
$77,591
AVG HOUSEHOLD INCOME
22.3%
WAGE / INCOME GAP [ % ]
77.7¢/ $1
WAGE / INCOME GAP [ $ ]
$8,623
FAMILY INCOME DEFICIT
0.42
INEQUALITY / GINI INDEX
36,868
TOTAL POPULATION
18,230
MALE POPULATION
18,638
FEMALE POPULATION
97.81
MALES / 100 FEMALES
102.24
FEMALES / 100 MALES
46.7
MEDIAN AGE
2.7
AVG FAMILY SIZE
2.3
AVG HOUSEHOLD SIZE
19,974
LABOR FORCE [ PEOPLE ]
64.4%
PERCENT IN LABOR FORCE
4.4%
UNEMPLOYMENT RATE
Sagadahoc County Area Codes
Income in Sagadahoc County
Income Overview in Sagadahoc County
Per Capita Income in Sagadahoc County is $40,950, while median incomes of families and households are $91,645 and $77,591 respectively.
| Characteristic | Number | Measure |
| Per Capita Income | 36,868 | $40,950 |
| Median Family Income | 10,651 | $91,645 |
| Mean Family Income | 10,651 | $107,988 |
| Median Household Income | 16,060 | $77,591 |
| Mean Household Income | 16,060 | $92,470 |
| Income Deficit | 10,651 | $8,623 |
| Wage / Income Gap (%) | 36,868 | 22.25% |
| Wage / Income Gap ($) | 36,868 | 77.75¢ per $1 |
| Gini / Inequality Index | 36,868 | 0.42 |
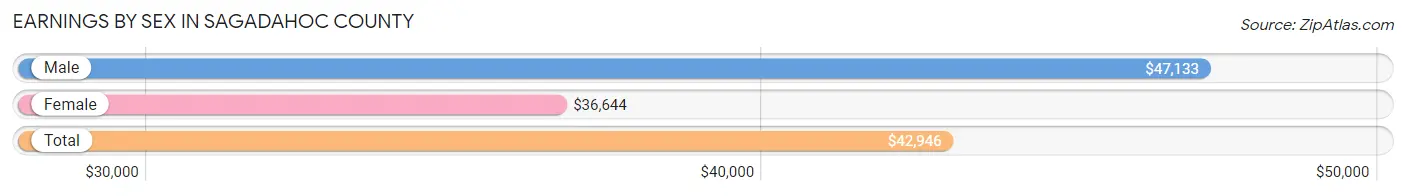
Earnings by Sex in Sagadahoc County
Average Earnings in Sagadahoc County are $42,946, $47,133 for men and $36,644 for women, a difference of 22.3%.
| Sex | Number | Average Earnings |
| Male | 10,935 (51.7%) | $47,133 |
| Female | 10,219 (48.3%) | $36,644 |
| Total | 21,154 (100.0%) | $42,946 |
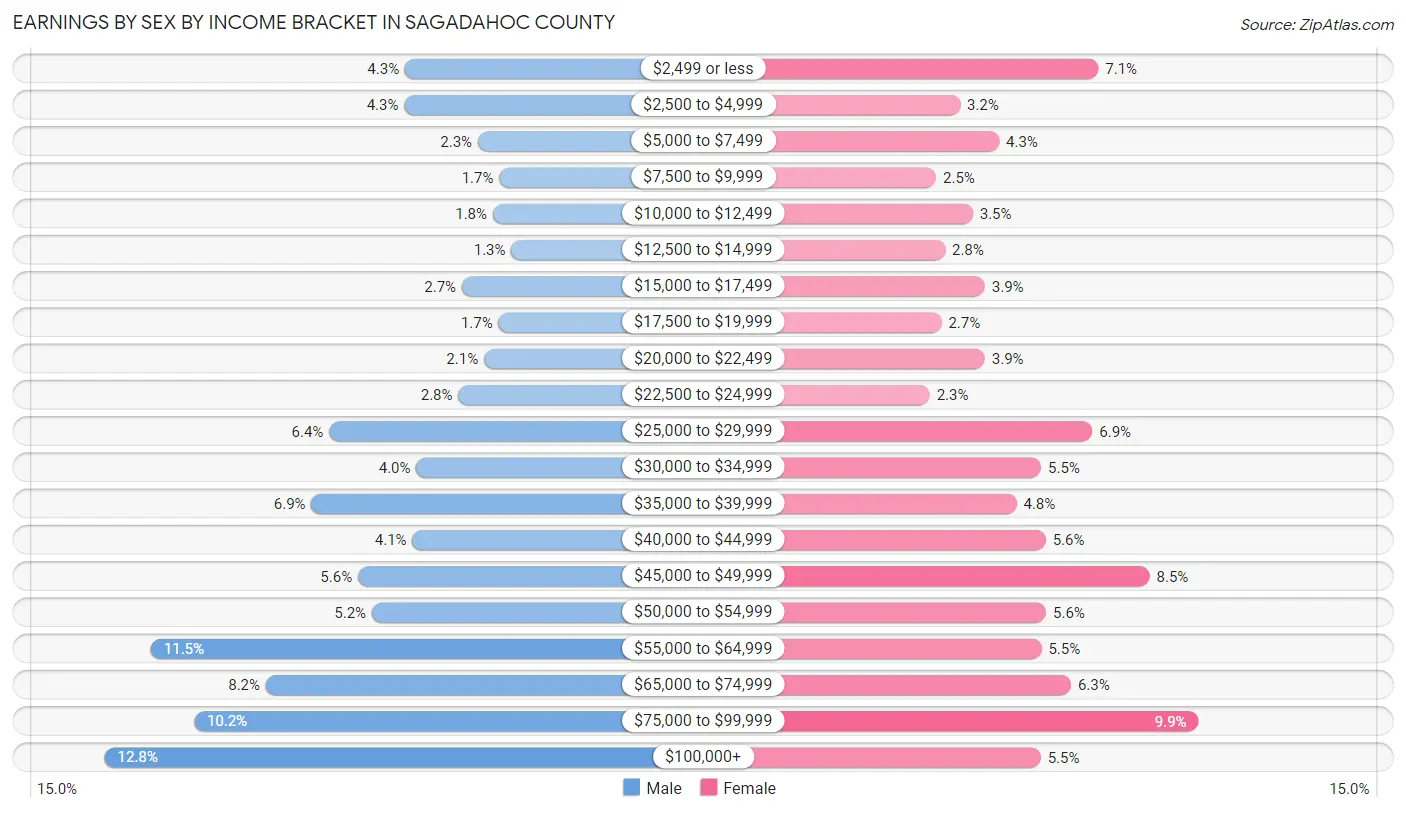
Earnings by Sex by Income Bracket in Sagadahoc County
The most common earnings brackets in Sagadahoc County are $100,000+ for men (1,394 | 12.8%) and $75,000 to $99,999 for women (1,010 | 9.9%).
| Income | Male | Female |
| $2,499 or less | 471 (4.3%) | 722 (7.1%) |
| $2,500 to $4,999 | 474 (4.3%) | 325 (3.2%) |
| $5,000 to $7,499 | 247 (2.3%) | 437 (4.3%) |
| $7,500 to $9,999 | 182 (1.7%) | 256 (2.5%) |
| $10,000 to $12,499 | 201 (1.8%) | 362 (3.5%) |
| $12,500 to $14,999 | 144 (1.3%) | 282 (2.8%) |
| $15,000 to $17,499 | 296 (2.7%) | 396 (3.9%) |
| $17,500 to $19,999 | 184 (1.7%) | 272 (2.7%) |
| $20,000 to $22,499 | 228 (2.1%) | 396 (3.9%) |
| $22,500 to $24,999 | 307 (2.8%) | 238 (2.3%) |
| $25,000 to $29,999 | 704 (6.4%) | 705 (6.9%) |
| $30,000 to $34,999 | 436 (4.0%) | 558 (5.5%) |
| $35,000 to $39,999 | 759 (6.9%) | 487 (4.8%) |
| $40,000 to $44,999 | 448 (4.1%) | 571 (5.6%) |
| $45,000 to $49,999 | 616 (5.6%) | 870 (8.5%) |
| $50,000 to $54,999 | 573 (5.2%) | 572 (5.6%) |
| $55,000 to $64,999 | 1,252 (11.5%) | 559 (5.5%) |
| $65,000 to $74,999 | 899 (8.2%) | 644 (6.3%) |
| $75,000 to $99,999 | 1,120 (10.2%) | 1,010 (9.9%) |
| $100,000+ | 1,394 (12.8%) | 557 (5.4%) |
| Total | 10,935 (100.0%) | 10,219 (100.0%) |
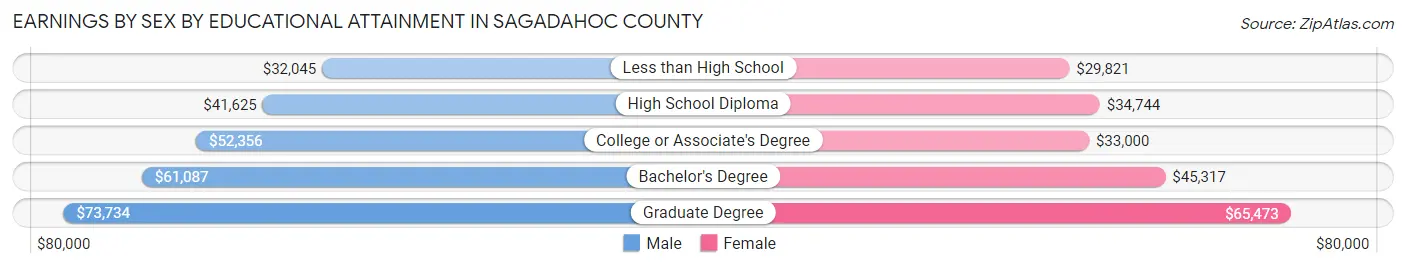
Earnings by Sex by Educational Attainment in Sagadahoc County
Average earnings in Sagadahoc County are $52,314 for men and $43,309 for women, a difference of 17.2%. Men with an educational attainment of graduate degree enjoy the highest average annual earnings of $73,734, while those with less than high school education earn the least with $32,045. Women with an educational attainment of graduate degree earn the most with the average annual earnings of $65,473, while those with less than high school education have the smallest earnings of $29,821.
| Educational Attainment | Male Income | Female Income |
| Less than High School | $32,045 | $29,821 |
| High School Diploma | $41,625 | $34,744 |
| College or Associate's Degree | $52,356 | $33,000 |
| Bachelor's Degree | $61,087 | $45,317 |
| Graduate Degree | $73,734 | $65,473 |
| Total | $52,314 | $43,309 |
Family Income in Sagadahoc County
Family Income Brackets in Sagadahoc County
According to the Sagadahoc County family income data, there are 2,854 families falling into the $100,000 to $149,999 income range, which is the most common income bracket and makes up 26.8% of all families. Conversely, the less than $10,000 income bracket is the least frequent group with only 245 families (2.3%) belonging to this category.
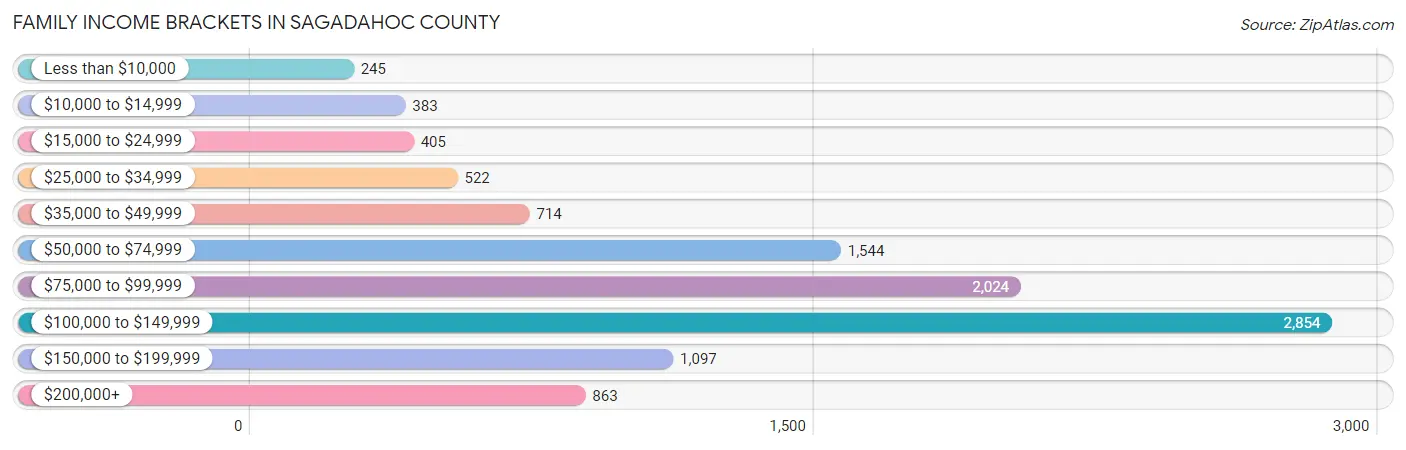
| Income Bracket | # Families | % Families |
| Less than $10,000 | 245 | 2.3% |
| $10,000 to $14,999 | 383 | 3.6% |
| $15,000 to $24,999 | 405 | 3.8% |
| $25,000 to $34,999 | 522 | 4.9% |
| $35,000 to $49,999 | 714 | 6.7% |
| $50,000 to $74,999 | 1,544 | 14.5% |
| $75,000 to $99,999 | 2,024 | 19.0% |
| $100,000 to $149,999 | 2,854 | 26.8% |
| $150,000 to $199,999 | 1,097 | 10.3% |
| $200,000+ | 863 | 8.1% |
Family Income by Famaliy Size in Sagadahoc County
3-person families (2,285 | 21.4%) account for the highest median family income in Sagadahoc County with $110,919 per family, while 2-person families (6,215 | 58.4%) have the highest median income of $44,173 per family member.
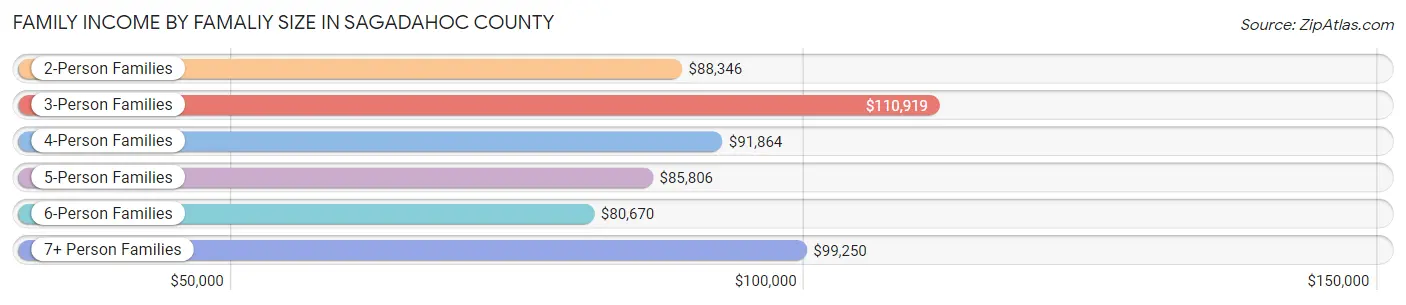
| Income Bracket | # Families | Median Income |
| 2-Person Families | 6,215 (58.4%) | $88,346 |
| 3-Person Families | 2,285 (21.4%) | $110,919 |
| 4-Person Families | 1,619 (15.2%) | $91,864 |
| 5-Person Families | 308 (2.9%) | $85,806 |
| 6-Person Families | 173 (1.6%) | $80,670 |
| 7+ Person Families | 51 (0.5%) | $99,250 |
| Total | 10,651 (100.0%) | $91,645 |
Family Income by Number of Earners in Sagadahoc County
The median family income in Sagadahoc County is $91,645, with families comprising 3+ earners (909) having the highest median family income of $146,094, while families with 1 earner (2,964) have the lowest median family income of $55,610, accounting for 8.5% and 27.8% of families, respectively.
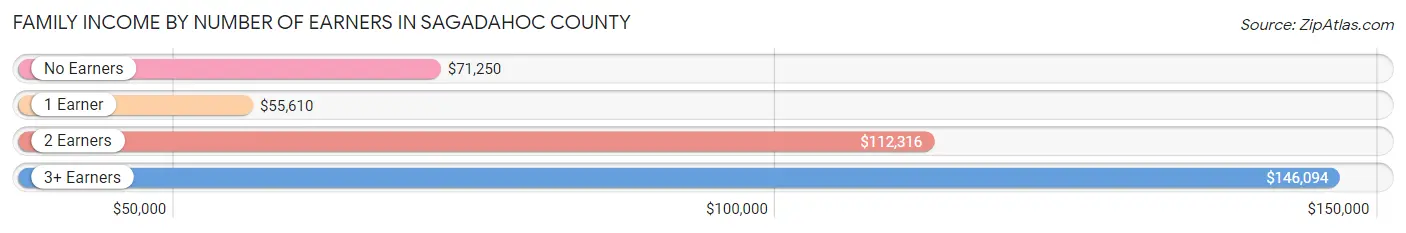
| Number of Earners | # Families | Median Income |
| No Earners | 1,892 (17.8%) | $71,250 |
| 1 Earner | 2,964 (27.8%) | $55,610 |
| 2 Earners | 4,886 (45.9%) | $112,316 |
| 3+ Earners | 909 (8.5%) | $146,094 |
| Total | 10,651 (100.0%) | $91,645 |
Household Income in Sagadahoc County
Household Income Brackets in Sagadahoc County
With 3,421 households falling in the category, the $100,000 to $149,999 income range is the most frequent in Sagadahoc County, accounting for 21.3% of all households. In contrast, only 642 households (4.0%) fall into the less than $10,000 income bracket, making it the least populous group.
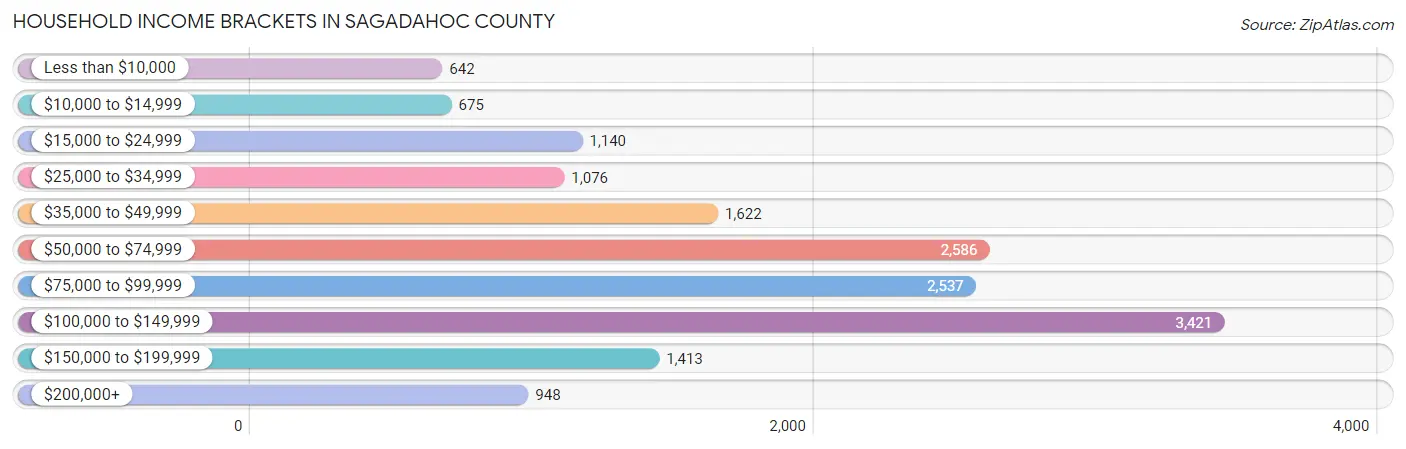
| Income Bracket | # Households | % Households |
| Less than $10,000 | 642 | 4.0% |
| $10,000 to $14,999 | 675 | 4.2% |
| $15,000 to $24,999 | 1,140 | 7.1% |
| $25,000 to $34,999 | 1,076 | 6.7% |
| $35,000 to $49,999 | 1,622 | 10.1% |
| $50,000 to $74,999 | 2,586 | 16.1% |
| $75,000 to $99,999 | 2,537 | 15.8% |
| $100,000 to $149,999 | 3,421 | 21.3% |
| $150,000 to $199,999 | 1,413 | 8.8% |
| $200,000+ | 948 | 5.9% |
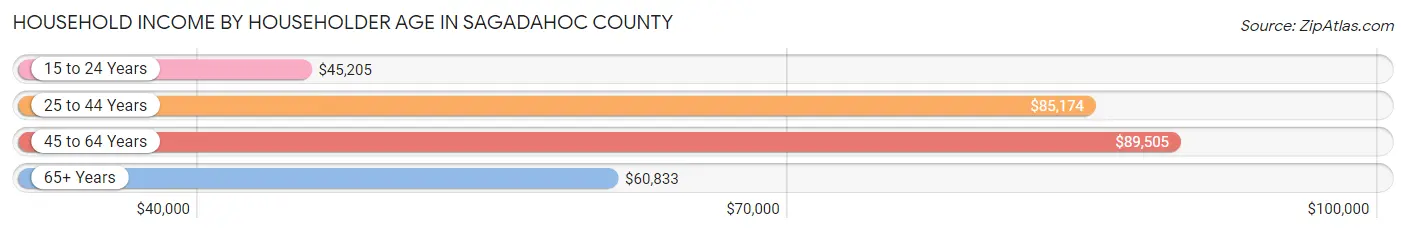
Household Income by Householder Age in Sagadahoc County
The median household income in Sagadahoc County is $77,591, with the highest median household income of $89,505 found in the 45 to 64 years age bracket for the primary householder. A total of 5,962 households (37.1%) fall into this category. Meanwhile, the 15 to 24 years age bracket for the primary householder has the lowest median household income of $45,205, with 508 households (3.2%) in this group.
| Income Bracket | # Households | Median Income |
| 15 to 24 Years | 508 (3.2%) | $45,205 |
| 25 to 44 Years | 4,410 (27.5%) | $85,174 |
| 45 to 64 Years | 5,962 (37.1%) | $89,505 |
| 65+ Years | 5,180 (32.3%) | $60,833 |
| Total | 16,060 (100.0%) | $77,591 |
Poverty in Sagadahoc County
Income Below Poverty by Sex and Age in Sagadahoc County
With 10.4% poverty level for males and 11.4% for females among the residents of Sagadahoc County, 6 to 11 year old males and 75 year old and over females are the most vulnerable to poverty, with 323 males (27.5%) and 425 females (22.4%) in their respective age groups living below the poverty level.
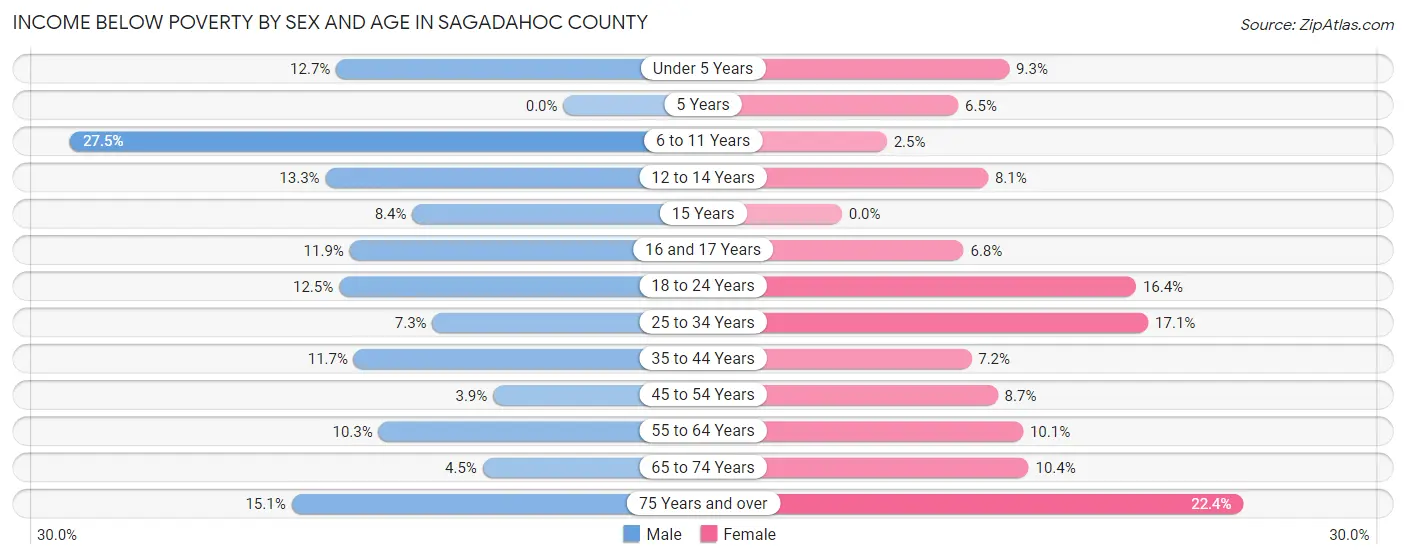
| Age Bracket | Male | Female |
| Under 5 Years | 109 (12.7%) | 73 (9.3%) |
| 5 Years | 0 (0.0%) | 14 (6.5%) |
| 6 to 11 Years | 323 (27.5%) | 23 (2.5%) |
| 12 to 14 Years | 90 (13.3%) | 46 (8.1%) |
| 15 Years | 18 (8.4%) | 0 (0.0%) |
| 16 and 17 Years | 50 (11.9%) | 33 (6.8%) |
| 18 to 24 Years | 144 (12.5%) | 179 (16.4%) |
| 25 to 34 Years | 173 (7.3%) | 377 (17.1%) |
| 35 to 44 Years | 250 (11.7%) | 152 (7.2%) |
| 45 to 54 Years | 89 (3.9%) | 201 (8.7%) |
| 55 to 64 Years | 289 (10.3%) | 304 (10.1%) |
| 65 to 74 Years | 107 (4.5%) | 275 (10.4%) |
| 75 Years and over | 235 (15.1%) | 425 (22.4%) |
| Total | 1,877 (10.4%) | 2,102 (11.4%) |
Income Above Poverty by Sex and Age in Sagadahoc County
According to the poverty statistics in Sagadahoc County, males aged 5 years and females aged 15 years are the age groups that are most secure financially, with 100.0% of males and 100.0% of females in these age groups living above the poverty line.
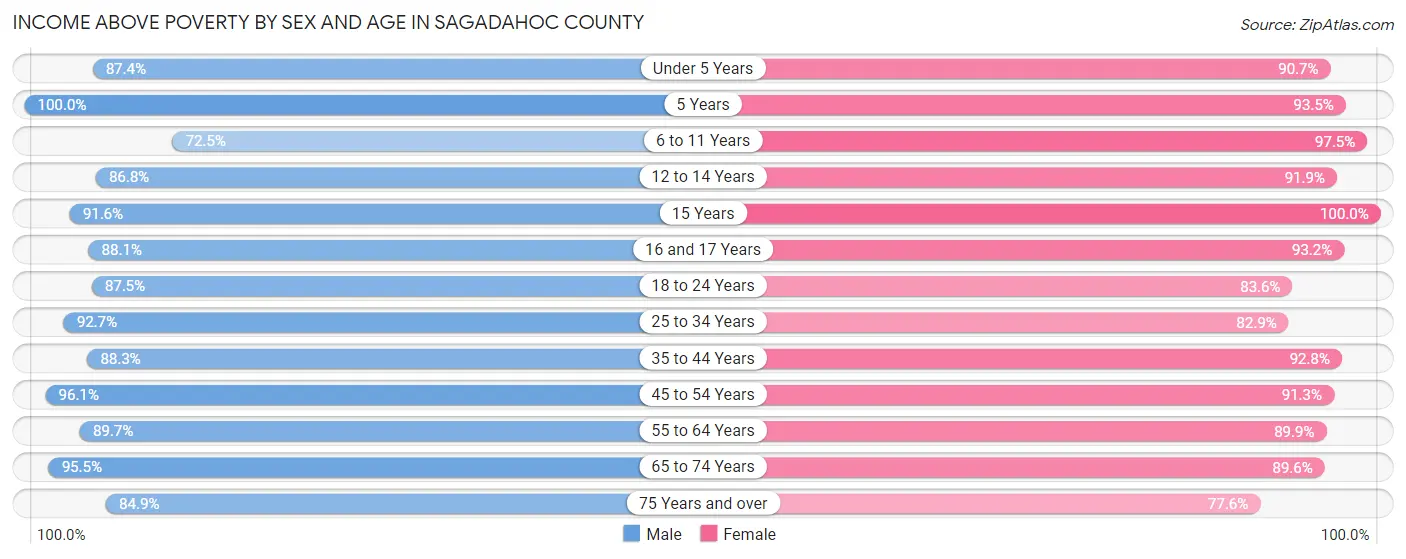
| Age Bracket | Male | Female |
| Under 5 Years | 753 (87.4%) | 710 (90.7%) |
| 5 Years | 84 (100.0%) | 202 (93.5%) |
| 6 to 11 Years | 853 (72.5%) | 896 (97.5%) |
| 12 to 14 Years | 589 (86.8%) | 519 (91.9%) |
| 15 Years | 196 (91.6%) | 146 (100.0%) |
| 16 and 17 Years | 370 (88.1%) | 454 (93.2%) |
| 18 to 24 Years | 1,009 (87.5%) | 914 (83.6%) |
| 25 to 34 Years | 2,201 (92.7%) | 1,833 (82.9%) |
| 35 to 44 Years | 1,892 (88.3%) | 1,957 (92.8%) |
| 45 to 54 Years | 2,187 (96.1%) | 2,115 (91.3%) |
| 55 to 64 Years | 2,519 (89.7%) | 2,710 (89.9%) |
| 65 to 74 Years | 2,277 (95.5%) | 2,369 (89.6%) |
| 75 Years and over | 1,317 (84.9%) | 1,476 (77.6%) |
| Total | 16,247 (89.6%) | 16,301 (88.6%) |
Income Below Poverty Among Married-Couple Families in Sagadahoc County
The poverty statistics for married-couple families in Sagadahoc County show that 4.6% or 397 of the total 8,586 families live below the poverty line. Families with no children have the highest poverty rate of 6.7%, comprising of 387 families. On the other hand, families with 3 or 4 children have the lowest poverty rate of 0.0%, which includes 0 families.
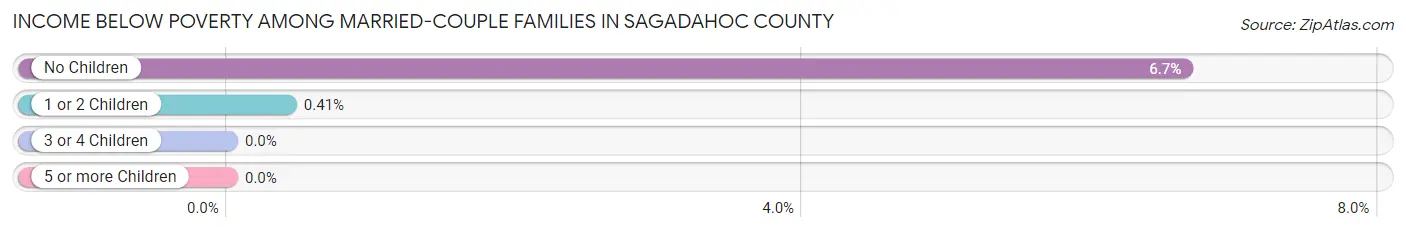
| Children | Above Poverty | Below Poverty |
| No Children | 5,429 (93.3%) | 387 (6.7%) |
| 1 or 2 Children | 2,441 (99.6%) | 10 (0.4%) |
| 3 or 4 Children | 311 (100.0%) | 0 (0.0%) |
| 5 or more Children | 8 (100.0%) | 0 (0.0%) |
| Total | 8,189 (95.4%) | 397 (4.6%) |
Income Below Poverty Among Single-Parent Households in Sagadahoc County
According to the poverty data in Sagadahoc County, 20.7% or 128 single-father households and 28.4% or 411 single-mother households are living below the poverty line. Among single-father households, those with no children have the highest poverty rate, with 62 households (23.1%) experiencing poverty. Likewise, among single-mother households, those with 3 or 4 children have the highest poverty rate, with 126 households (70.0%) falling below the poverty line.
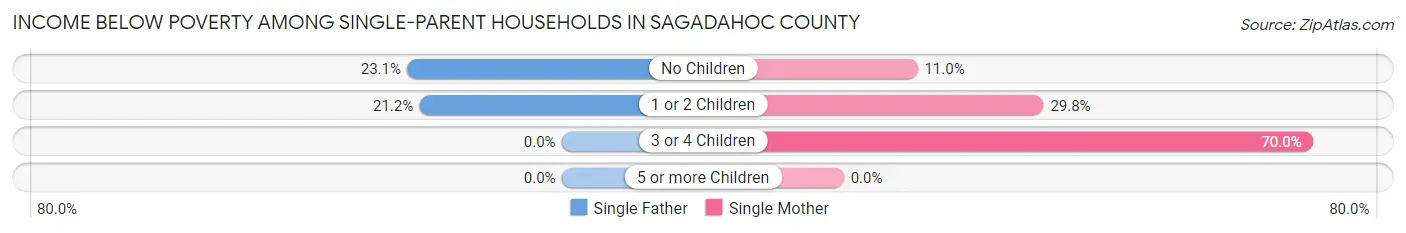
| Children | Single Father | Single Mother |
| No Children | 62 (23.1%) | 54 (11.0%) |
| 1 or 2 Children | 66 (21.2%) | 231 (29.8%) |
| 3 or 4 Children | 0 (0.0%) | 126 (70.0%) |
| 5 or more Children | 0 (0.0%) | 0 (0.0%) |
| Total | 128 (20.7%) | 411 (28.4%) |
Income Below Poverty Among Married-Couple vs Single-Parent Households in Sagadahoc County
The poverty data for Sagadahoc County shows that 397 of the married-couple family households (4.6%) and 539 of the single-parent households (26.1%) are living below the poverty level. Within the married-couple family households, those with no children have the highest poverty rate, with 387 households (6.7%) falling below the poverty line. Among the single-parent households, those with 3 or 4 children have the highest poverty rate, with 126 household (57.8%) living below poverty.
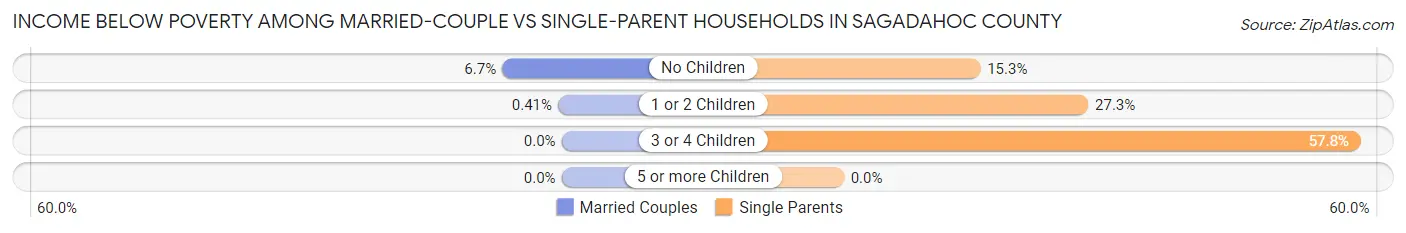
| Children | Married-Couple Families | Single-Parent Households |
| No Children | 387 (6.7%) | 116 (15.3%) |
| 1 or 2 Children | 10 (0.4%) | 297 (27.3%) |
| 3 or 4 Children | 0 (0.0%) | 126 (57.8%) |
| 5 or more Children | 0 (0.0%) | 0 (0.0%) |
| Total | 397 (4.6%) | 539 (26.1%) |
Race in Sagadahoc County
The most populous races in Sagadahoc County are White / Caucasian (34,878 | 94.6%), Two or more Races (1,228 | 3.3%), and Hispanic or Latino (729 | 2.0%).
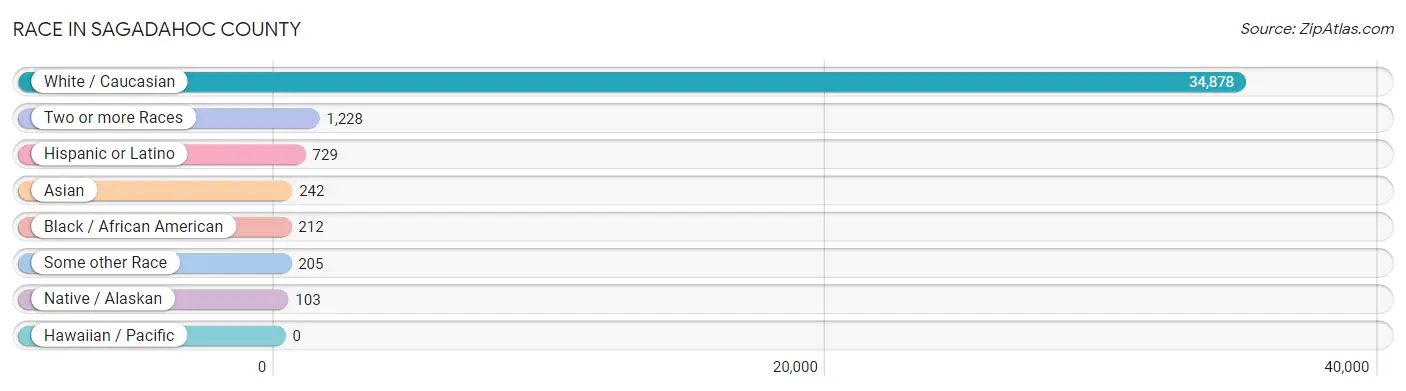
| Race | # Population | % Population |
| Asian | 242 | 0.7% |
| Black / African American | 212 | 0.6% |
| Hawaiian / Pacific | 0 | 0.0% |
| Hispanic or Latino | 729 | 2.0% |
| Native / Alaskan | 103 | 0.3% |
| White / Caucasian | 34,878 | 94.6% |
| Two or more Races | 1,228 | 3.3% |
| Some other Race | 205 | 0.6% |
| Total | 36,868 | 100.0% |
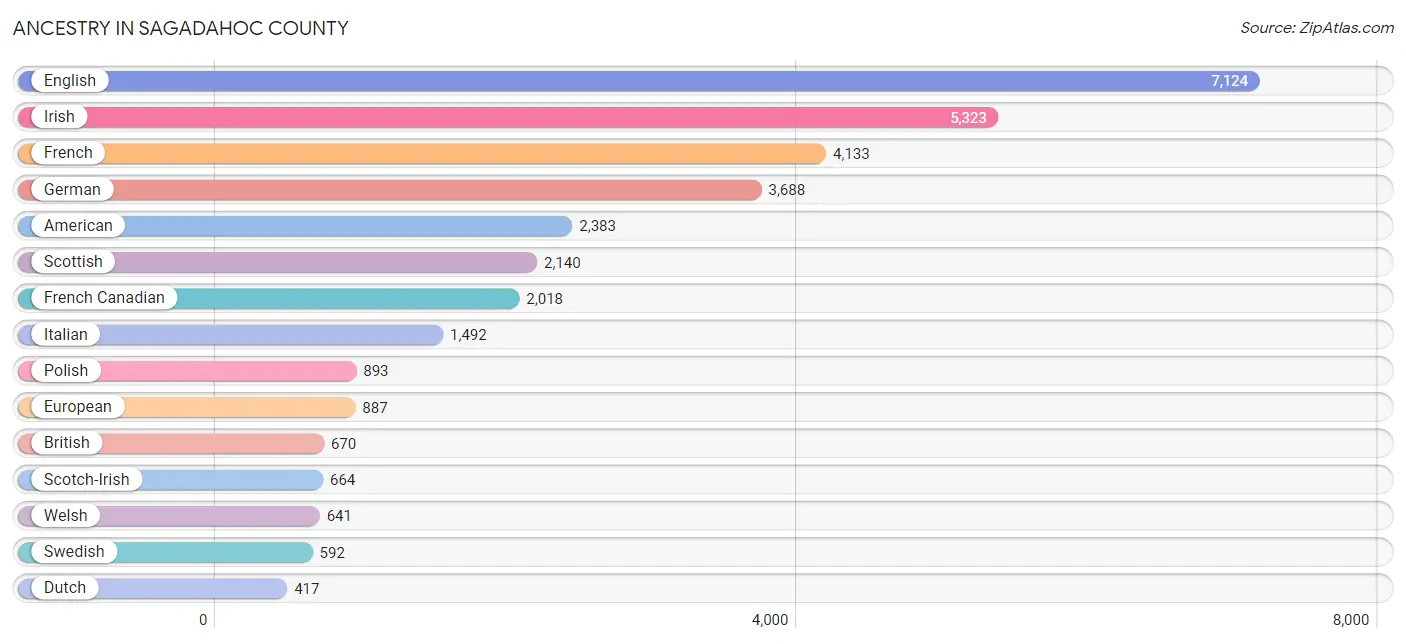
Ancestry in Sagadahoc County
The most populous ancestries reported in Sagadahoc County are English (7,124 | 19.3%), Irish (5,323 | 14.4%), French (4,133 | 11.2%), German (3,688 | 10.0%), and American (2,383 | 6.5%), together accounting for 61.4% of all Sagadahoc County residents.
| Ancestry | # Population | % Population |
| African | 39 | 0.1% |
| Alsatian | 3 | 0.0% |
| American | 2,383 | 6.5% |
| Arab | 47 | 0.1% |
| Armenian | 15 | 0.0% |
| Austrian | 16 | 0.0% |
| Belgian | 17 | 0.1% |
| Bhutanese | 49 | 0.1% |
| British | 670 | 1.8% |
| Burmese | 23 | 0.1% |
| Canadian | 288 | 0.8% |
| Central American | 27 | 0.1% |
| Central American Indian | 27 | 0.1% |
| Cherokee | 2 | 0.0% |
| Chilean | 5 | 0.0% |
| Choctaw | 3 | 0.0% |
| Croatian | 21 | 0.1% |
| Cuban | 40 | 0.1% |
| Czech | 258 | 0.7% |
| Czechoslovakian | 82 | 0.2% |
| Danish | 250 | 0.7% |
| Dutch | 417 | 1.1% |
| Eastern European | 124 | 0.3% |
| English | 7,124 | 19.3% |
| Estonian | 14 | 0.0% |
| European | 887 | 2.4% |
| Finnish | 153 | 0.4% |
| French | 4,133 | 11.2% |
| French Canadian | 2,018 | 5.5% |
| German | 3,688 | 10.0% |
| Greek | 235 | 0.6% |
| Guamanian / Chamorro | 98 | 0.3% |
| Guatemalan | 27 | 0.1% |
| Haitian | 55 | 0.2% |
| Hungarian | 69 | 0.2% |
| Indian (Asian) | 121 | 0.3% |
| Irish | 5,323 | 14.4% |
| Iroquois | 15 | 0.0% |
| Italian | 1,492 | 4.1% |
| Jamaican | 33 | 0.1% |
| Korean | 165 | 0.4% |
| Latvian | 19 | 0.1% |
| Lebanese | 43 | 0.1% |
| Lithuanian | 111 | 0.3% |
| Luxembourger | 2 | 0.0% |
| Mexican | 164 | 0.4% |
| Mexican American Indian | 14 | 0.0% |
| Northern European | 165 | 0.4% |
| Norwegian | 296 | 0.8% |
| Pakistani | 10 | 0.0% |
| Peruvian | 12 | 0.0% |
| Polish | 893 | 2.4% |
| Portuguese | 124 | 0.3% |
| Puerto Rican | 206 | 0.6% |
| Russian | 147 | 0.4% |
| Scandinavian | 173 | 0.5% |
| Scotch-Irish | 664 | 1.8% |
| Scottish | 2,140 | 5.8% |
| Slavic | 27 | 0.1% |
| Slovak | 51 | 0.1% |
| Slovene | 35 | 0.1% |
| South American | 17 | 0.1% |
| Spaniard | 16 | 0.0% |
| Spanish | 10 | 0.0% |
| Subsaharan African | 39 | 0.1% |
| Swedish | 592 | 1.6% |
| Swiss | 38 | 0.1% |
| Syrian | 4 | 0.0% |
| Thai | 68 | 0.2% |
| Trinidadian and Tobagonian | 25 | 0.1% |
| Turkish | 32 | 0.1% |
| Ukrainian | 79 | 0.2% |
| Welsh | 641 | 1.7% |
| Yugoslavian | 24 | 0.1% | View All 74 Rows |
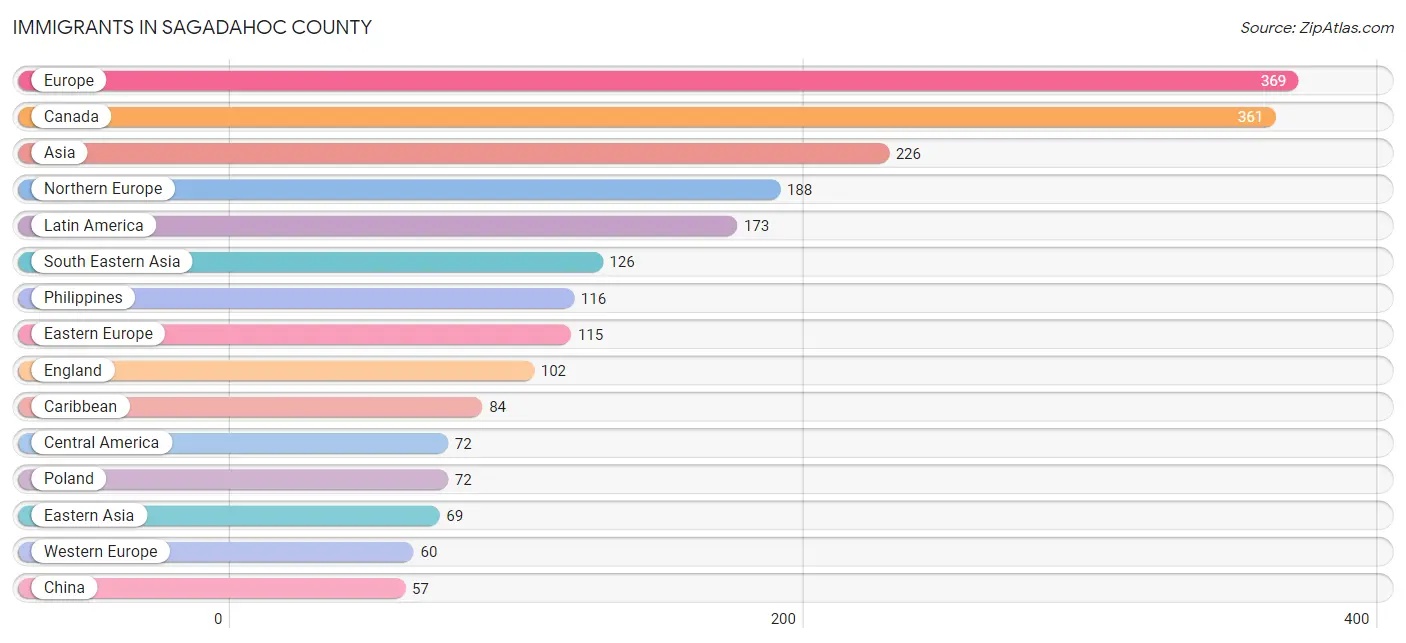
Immigrants in Sagadahoc County
The most numerous immigrant groups reported in Sagadahoc County came from Europe (369 | 1.0%), Canada (361 | 1.0%), Asia (226 | 0.6%), Northern Europe (188 | 0.5%), and Latin America (173 | 0.5%), together accounting for 3.6% of all Sagadahoc County residents.
| Immigration Origin | # Population | % Population |
| Africa | 13 | 0.0% |
| Asia | 226 | 0.6% |
| Belgium | 11 | 0.0% |
| Canada | 361 | 1.0% |
| Caribbean | 84 | 0.2% |
| Central America | 72 | 0.2% |
| Chile | 5 | 0.0% |
| China | 57 | 0.2% |
| Czechoslovakia | 26 | 0.1% |
| Denmark | 37 | 0.1% |
| Eastern Africa | 13 | 0.0% |
| Eastern Asia | 69 | 0.2% |
| Eastern Europe | 115 | 0.3% |
| England | 102 | 0.3% |
| Europe | 369 | 1.0% |
| France | 7 | 0.0% |
| Germany | 29 | 0.1% |
| Greece | 6 | 0.0% |
| Guatemala | 27 | 0.1% |
| Haiti | 55 | 0.2% |
| India | 14 | 0.0% |
| Ireland | 7 | 0.0% |
| Jamaica | 29 | 0.1% |
| Japan | 5 | 0.0% |
| Kenya | 11 | 0.0% |
| Korea | 7 | 0.0% |
| Latin America | 173 | 0.5% |
| Mexico | 45 | 0.1% |
| Netherlands | 13 | 0.0% |
| Northern Europe | 188 | 0.5% |
| Norway | 3 | 0.0% |
| Oceania | 7 | 0.0% |
| Peru | 12 | 0.0% |
| Philippines | 116 | 0.3% |
| Poland | 72 | 0.2% |
| South America | 17 | 0.1% |
| South Central Asia | 14 | 0.0% |
| South Eastern Asia | 126 | 0.3% |
| Southern Europe | 6 | 0.0% |
| Thailand | 10 | 0.0% |
| Turkey | 17 | 0.1% |
| Western Asia | 17 | 0.1% |
| Western Europe | 60 | 0.2% |
| Zimbabwe | 2 | 0.0% | View All 44 Rows |
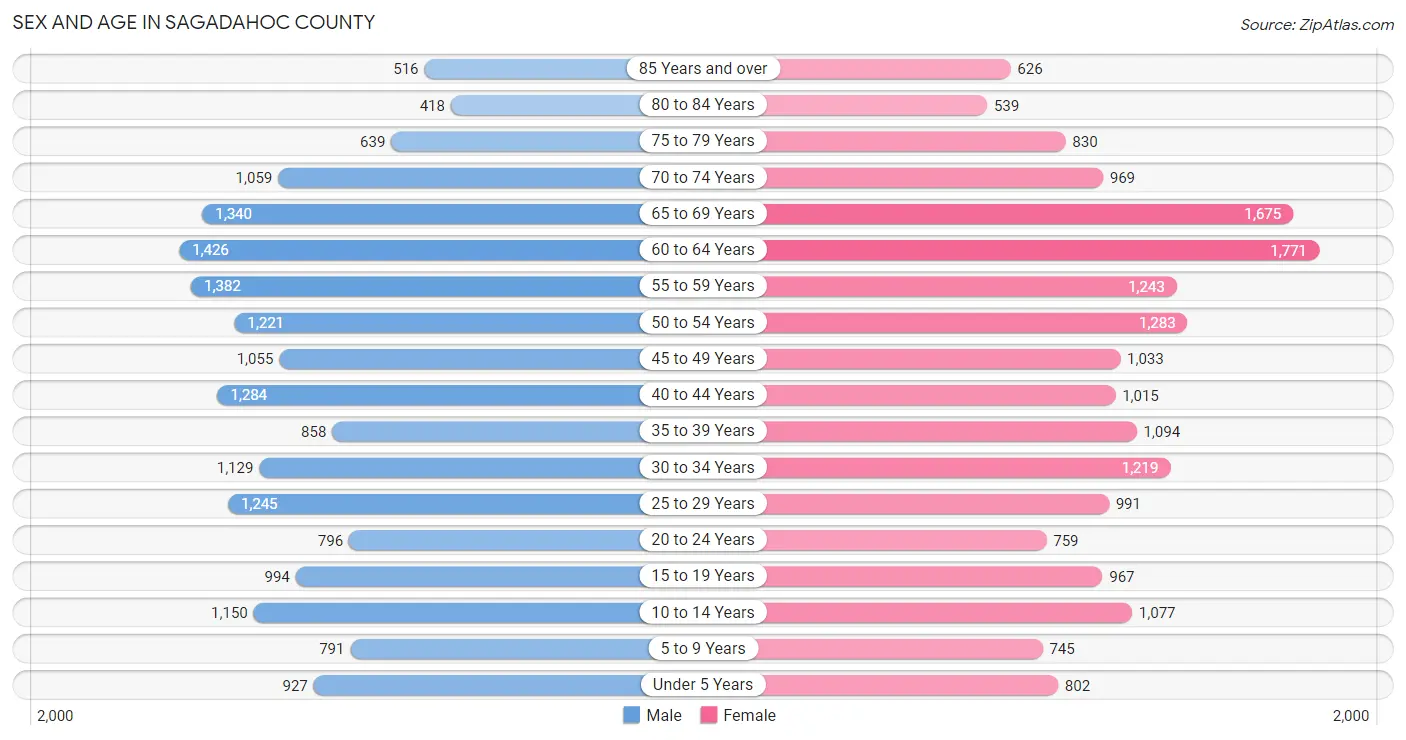
Sex and Age in Sagadahoc County
Sex and Age in Sagadahoc County
The most populous age groups in Sagadahoc County are 60 to 64 Years (1,426 | 7.8%) for men and 60 to 64 Years (1,771 | 9.5%) for women.
| Age Bracket | Male | Female |
| Under 5 Years | 927 (5.1%) | 802 (4.3%) |
| 5 to 9 Years | 791 (4.3%) | 745 (4.0%) |
| 10 to 14 Years | 1,150 (6.3%) | 1,077 (5.8%) |
| 15 to 19 Years | 994 (5.4%) | 967 (5.2%) |
| 20 to 24 Years | 796 (4.4%) | 759 (4.1%) |
| 25 to 29 Years | 1,245 (6.8%) | 991 (5.3%) |
| 30 to 34 Years | 1,129 (6.2%) | 1,219 (6.5%) |
| 35 to 39 Years | 858 (4.7%) | 1,094 (5.9%) |
| 40 to 44 Years | 1,284 (7.0%) | 1,015 (5.4%) |
| 45 to 49 Years | 1,055 (5.8%) | 1,033 (5.5%) |
| 50 to 54 Years | 1,221 (6.7%) | 1,283 (6.9%) |
| 55 to 59 Years | 1,382 (7.6%) | 1,243 (6.7%) |
| 60 to 64 Years | 1,426 (7.8%) | 1,771 (9.5%) |
| 65 to 69 Years | 1,340 (7.3%) | 1,675 (9.0%) |
| 70 to 74 Years | 1,059 (5.8%) | 969 (5.2%) |
| 75 to 79 Years | 639 (3.5%) | 830 (4.4%) |
| 80 to 84 Years | 418 (2.3%) | 539 (2.9%) |
| 85 Years and over | 516 (2.8%) | 626 (3.4%) |
| Total | 18,230 (100.0%) | 18,638 (100.0%) |
Families and Households in Sagadahoc County
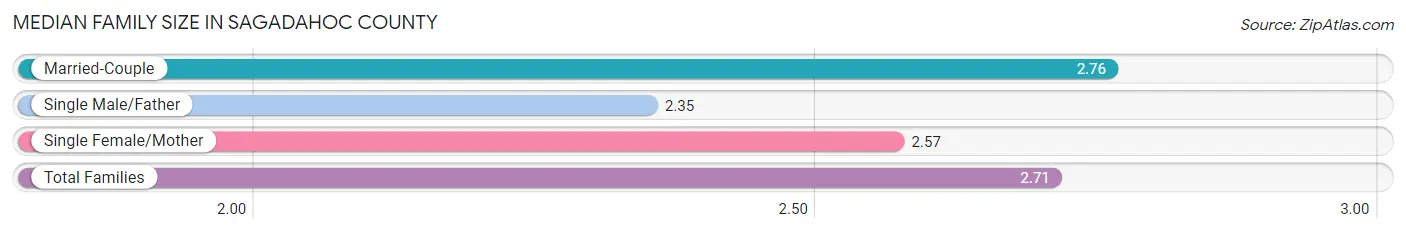
Median Family Size in Sagadahoc County
The median family size in Sagadahoc County is 2.71 persons per family, with married-couple families (8,586 | 80.6%) accounting for the largest median family size of 2.76 persons per family. On the other hand, single male/father families (618 | 5.8%) represent the smallest median family size with 2.35 persons per family.
| Family Type | # Families | Family Size |
| Married-Couple | 8,586 (80.6%) | 2.76 |
| Single Male/Father | 618 (5.8%) | 2.35 |
| Single Female/Mother | 1,447 (13.6%) | 2.57 |
| Total Families | 10,651 (100.0%) | 2.71 |
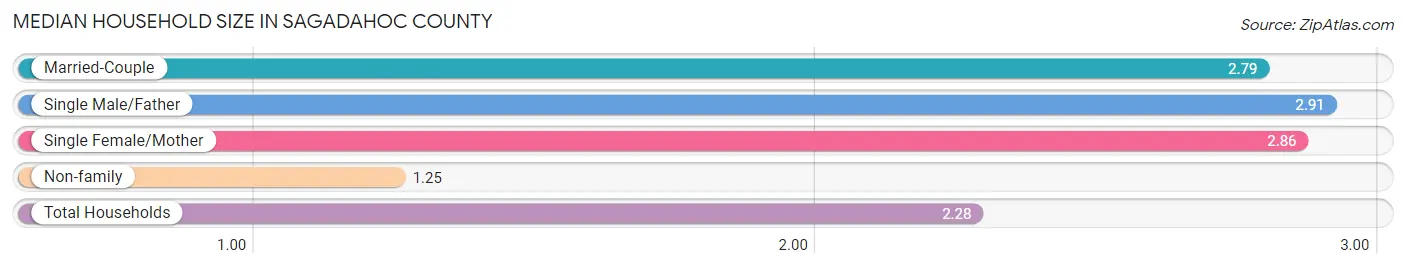
Median Household Size in Sagadahoc County
The median household size in Sagadahoc County is 2.28 persons per household, with single male/father households (618 | 3.8%) accounting for the largest median household size of 2.91 persons per household. non-family households (5,409 | 33.7%) represent the smallest median household size with 1.25 persons per household.
| Household Type | # Households | Household Size |
| Married-Couple | 8,586 (53.5%) | 2.79 |
| Single Male/Father | 618 (3.8%) | 2.91 |
| Single Female/Mother | 1,447 (9.0%) | 2.86 |
| Non-family | 5,409 (33.7%) | 1.25 |
| Total Households | 16,060 (100.0%) | 2.28 |
Household Size by Marriage Status in Sagadahoc County
Out of a total of 16,060 households in Sagadahoc County, 10,651 (66.3%) are family households, while 5,409 (33.7%) are nonfamily households. The most numerous type of family households are 2-person households, comprising 5,680, and the most common type of nonfamily households are 1-person households, comprising 4,124.
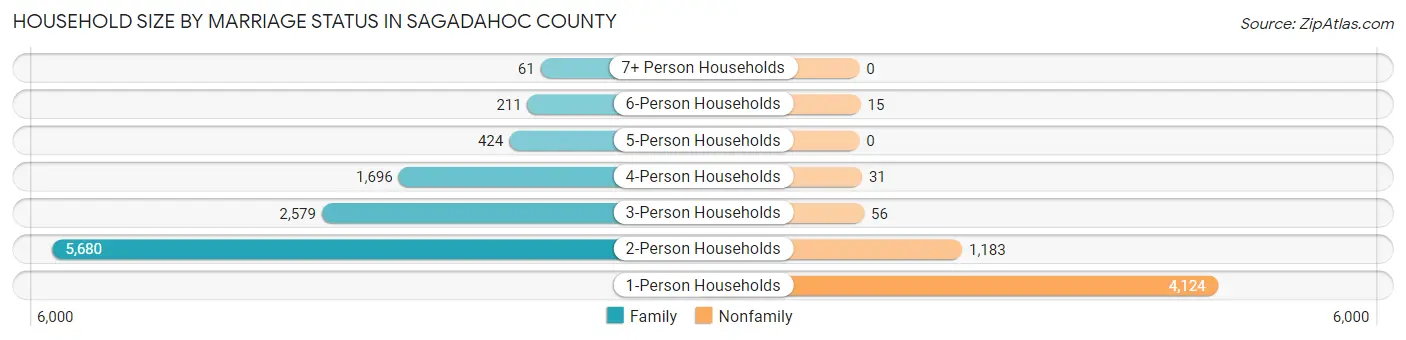
| Household Size | Family Households | Nonfamily Households |
| 1-Person Households | - | 4,124 (25.7%) |
| 2-Person Households | 5,680 (35.4%) | 1,183 (7.4%) |
| 3-Person Households | 2,579 (16.1%) | 56 (0.4%) |
| 4-Person Households | 1,696 (10.6%) | 31 (0.2%) |
| 5-Person Households | 424 (2.6%) | 0 (0.0%) |
| 6-Person Households | 211 (1.3%) | 15 (0.1%) |
| 7+ Person Households | 61 (0.4%) | 0 (0.0%) |
| Total | 10,651 (66.3%) | 5,409 (33.7%) |
Female Fertility in Sagadahoc County
Fertility by Age in Sagadahoc County
Average fertility rate in Sagadahoc County is 39.0 births per 1,000 women. Women in the age bracket of 20 to 34 years have the highest fertility rate with 67.0 births per 1,000 women. Women in the age bracket of 20 to 34 years acount for 69.7% of all women with births.
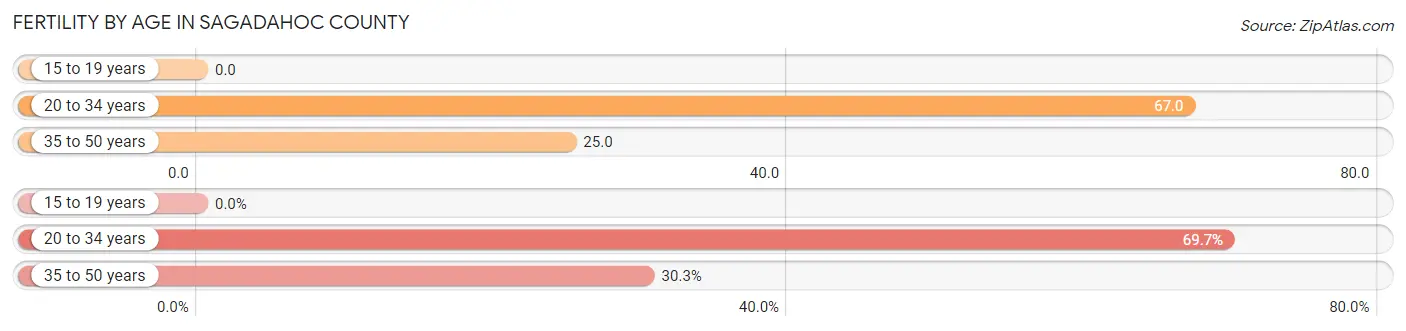
| Age Bracket | Women with Births | Births / 1,000 Women |
| 15 to 19 years | 0 (0.0%) | 0.0 |
| 20 to 34 years | 200 (69.7%) | 67.0 |
| 35 to 50 years | 87 (30.3%) | 25.0 |
| Total | 287 (100.0%) | 39.0 |
Fertility by Age by Marriage Status in Sagadahoc County
68.3% of women with births (287) in Sagadahoc County are married. The highest percentage of unmarried women with births falls into 20 to 34 years age bracket with 40.5% of them unmarried at the time of birth, while the lowest percentage of unmarried women with births belong to 35 to 50 years age bracket with 11.5% of them unmarried.
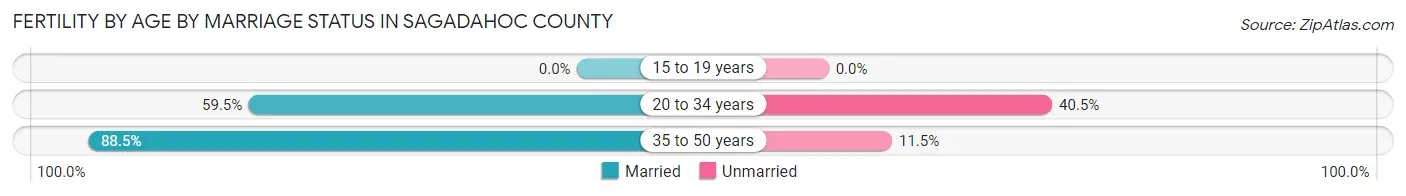
| Age Bracket | Married | Unmarried |
| 15 to 19 years | 0 (0.0%) | 0 (0.0%) |
| 20 to 34 years | 119 (59.5%) | 81 (40.5%) |
| 35 to 50 years | 77 (88.5%) | 10 (11.5%) |
| Total | 196 (68.3%) | 91 (31.7%) |
Fertility by Education in Sagadahoc County
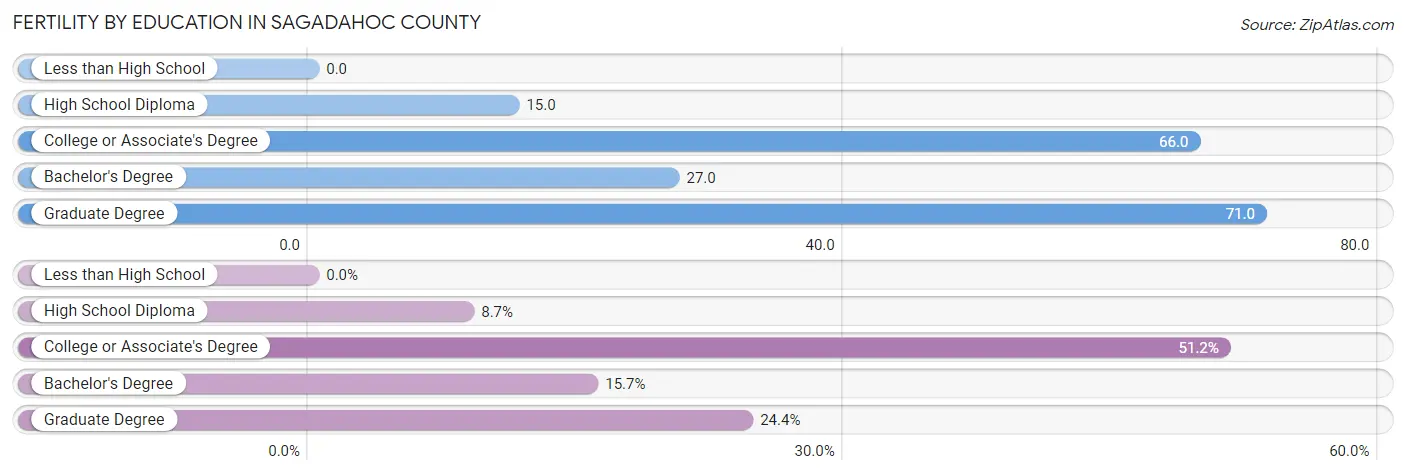
| Educational Attainment | Women with Births | Births / 1,000 Women |
| Less than High School | 0 (0.0%) | 0.0 |
| High School Diploma | 25 (8.7%) | 15.0 |
| College or Associate's Degree | 147 (51.2%) | 66.0 |
| Bachelor's Degree | 45 (15.7%) | 27.0 |
| Graduate Degree | 70 (24.4%) | 71.0 |
| Total | 287 (100.0%) | 39.0 |
Fertility by Education by Marriage Status in Sagadahoc County
31.7% of women with births in Sagadahoc County are unmarried. Women with the educational attainment of graduate degree are most likely to be married with 100.0% of them married at childbirth, while women with the educational attainment of high school diploma are least likely to be married with 100.0% of them unmarried at childbirth.
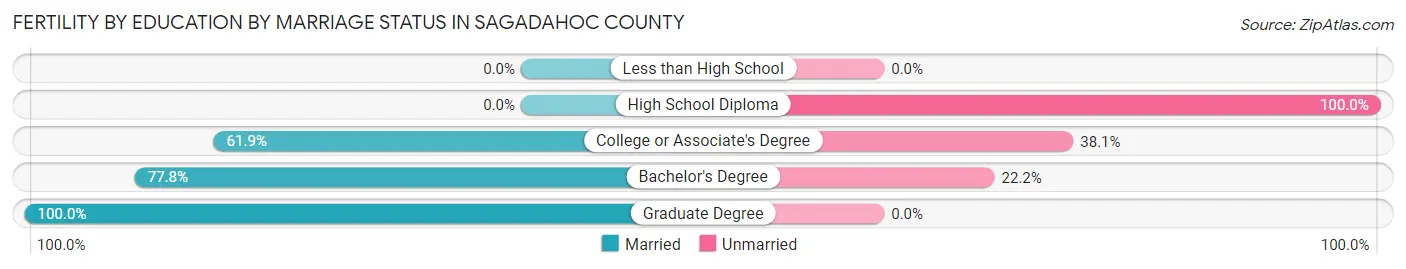
| Educational Attainment | Married | Unmarried |
| Less than High School | 0 (0.0%) | 0 (0.0%) |
| High School Diploma | 0 (0.0%) | 25 (100.0%) |
| College or Associate's Degree | 91 (61.9%) | 56 (38.1%) |
| Bachelor's Degree | 35 (77.8%) | 10 (22.2%) |
| Graduate Degree | 70 (100.0%) | 0 (0.0%) |
| Total | 196 (68.3%) | 91 (31.7%) |
Employment Characteristics in Sagadahoc County
Employment by Class of Employer in Sagadahoc County
Among the 18,551 employed individuals in Sagadahoc County, private company employees (11,455 | 61.8%), self-employed (not incorporated) (1,971 | 10.6%), and not-for-profit organizations (1,713 | 9.2%) make up the most common classes of employment.
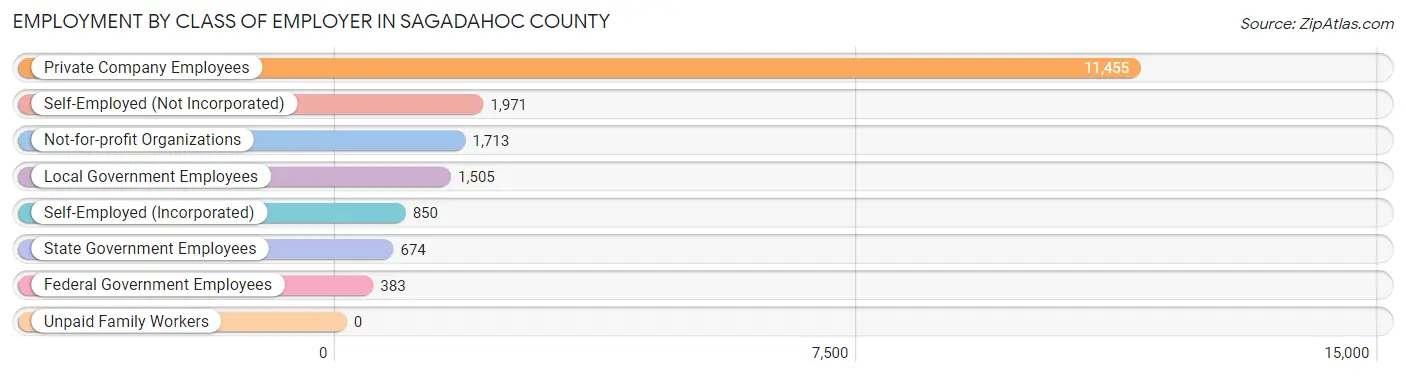
| Employer Class | # Employees | % Employees |
| Private Company Employees | 11,455 | 61.8% |
| Self-Employed (Incorporated) | 850 | 4.6% |
| Self-Employed (Not Incorporated) | 1,971 | 10.6% |
| Not-for-profit Organizations | 1,713 | 9.2% |
| Local Government Employees | 1,505 | 8.1% |
| State Government Employees | 674 | 3.6% |
| Federal Government Employees | 383 | 2.1% |
| Unpaid Family Workers | 0 | 0.0% |
| Total | 18,551 | 100.0% |
Employment Status by Age in Sagadahoc County
According to the labor force statistics for Sagadahoc County, out of the total population over 16 years of age (31,016), 64.4% or 19,974 individuals are in the labor force, with 4.4% or 879 of them unemployed. The age group with the highest labor force participation rate is 30 to 34 years, with 90.8% or 2,132 individuals in the labor force. Within the labor force, the 20 to 24 years age range has the highest percentage of unemployed individuals, with 13.4% or 169 of them being unemployed.
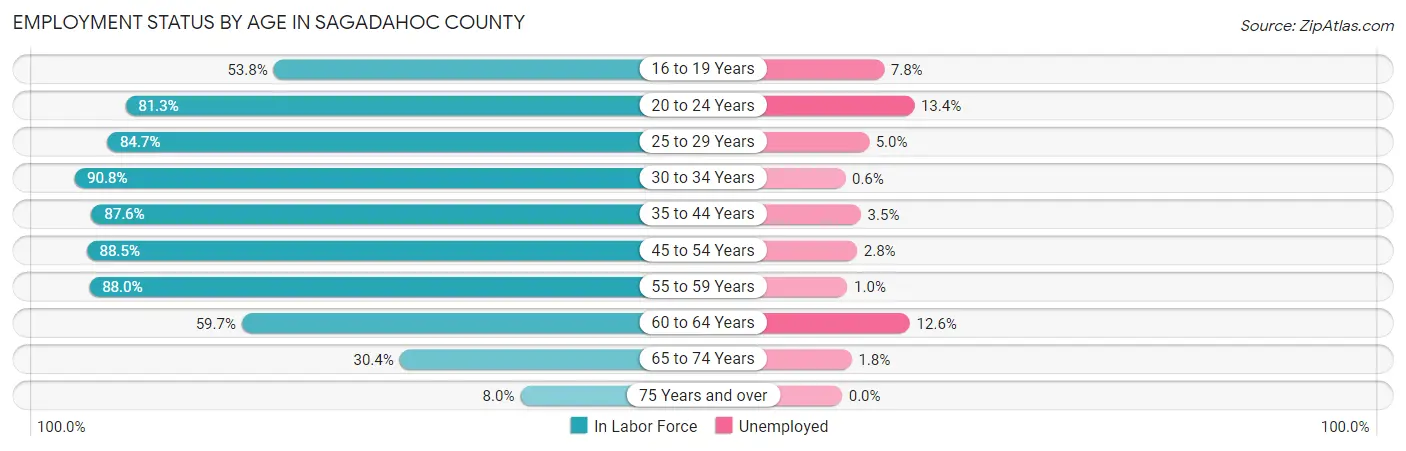
| Age Bracket | In Labor Force | Unemployed |
| 16 to 19 Years | 861 (53.8%) | 67 (7.8%) |
| 20 to 24 Years | 1,264 (81.3%) | 169 (13.4%) |
| 25 to 29 Years | 1,894 (84.7%) | 95 (5.0%) |
| 30 to 34 Years | 2,132 (90.8%) | 13 (0.6%) |
| 35 to 44 Years | 3,724 (87.6%) | 130 (3.5%) |
| 45 to 54 Years | 4,064 (88.5%) | 114 (2.8%) |
| 55 to 59 Years | 2,310 (88.0%) | 23 (1.0%) |
| 60 to 64 Years | 1,909 (59.7%) | 241 (12.6%) |
| 65 to 74 Years | 1,533 (30.4%) | 28 (1.8%) |
| 75 Years and over | 285 (8.0%) | 0 (0.0%) |
| Total | 19,974 (64.4%) | 879 (4.4%) |
Employment Status by Educational Attainment in Sagadahoc County
According to labor force statistics for Sagadahoc County, 83.3% of individuals (16,034) out of the total population between 25 and 64 years of age (19,249) are in the labor force, with 3.9% or 625 of them being unemployed. The group with the highest labor force participation rate are those with the educational attainment of bachelor's degree or higher, with 92.4% or 6,385 individuals in the labor force. Within the labor force, individuals with high school diploma education have the highest percentage of unemployment, with 8.9% or 366 of them being unemployed.
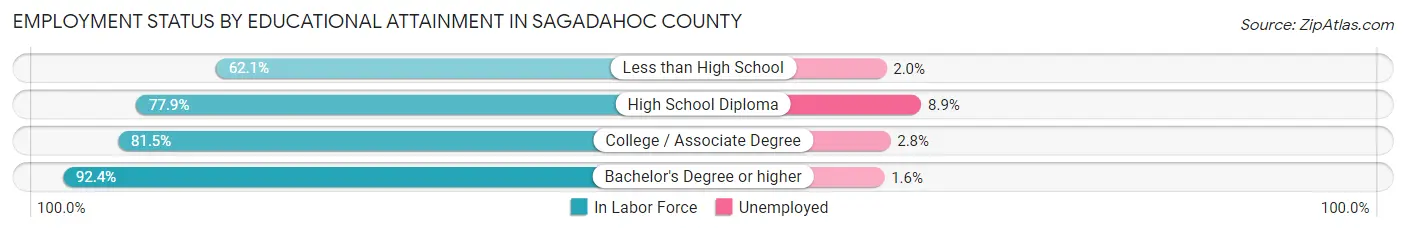
| Educational Attainment | In Labor Force | Unemployed |
| Less than High School | 710 (62.1%) | 23 (2.0%) |
| High School Diploma | 4,117 (77.9%) | 470 (8.9%) |
| College / Associate Degree | 4,817 (81.5%) | 166 (2.8%) |
| Bachelor's Degree or higher | 6,385 (92.4%) | 111 (1.6%) |
| Total | 16,034 (83.3%) | 751 (3.9%) |
Employment Occupations by Sex in Sagadahoc County
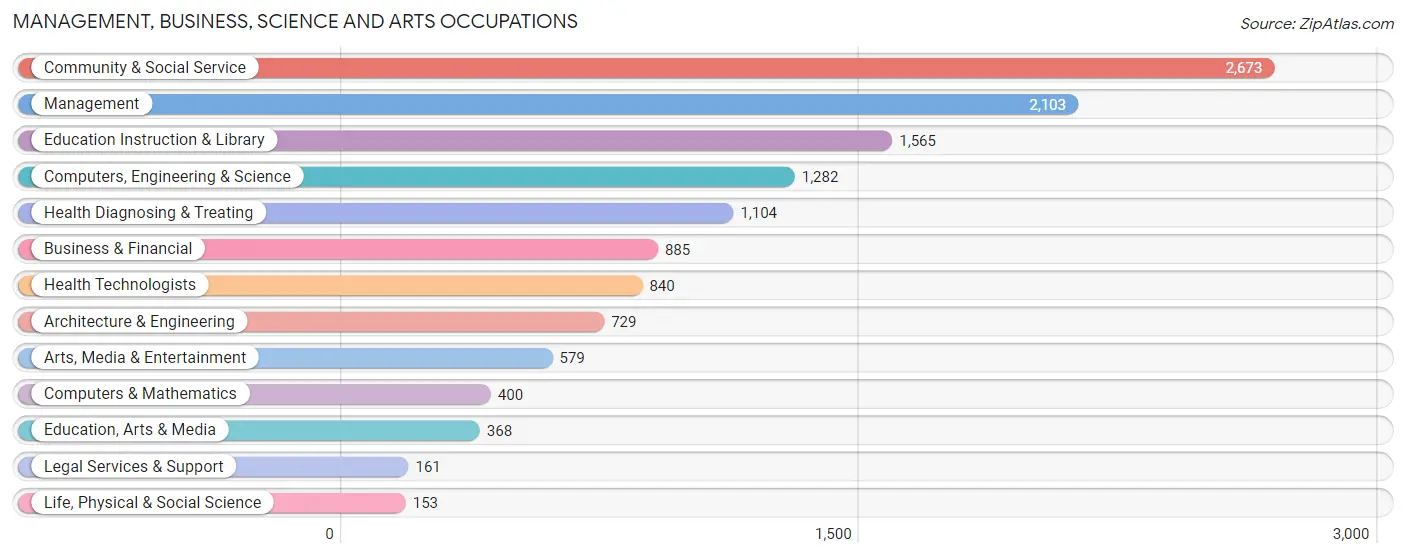
Management, Business, Science and Arts Occupations
The most common Management, Business, Science and Arts occupations in Sagadahoc County are Community & Social Service (2,673 | 14.0%), Management (2,103 | 11.0%), Education Instruction & Library (1,565 | 8.2%), Computers, Engineering & Science (1,282 | 6.7%), and Health Diagnosing & Treating (1,104 | 5.8%).
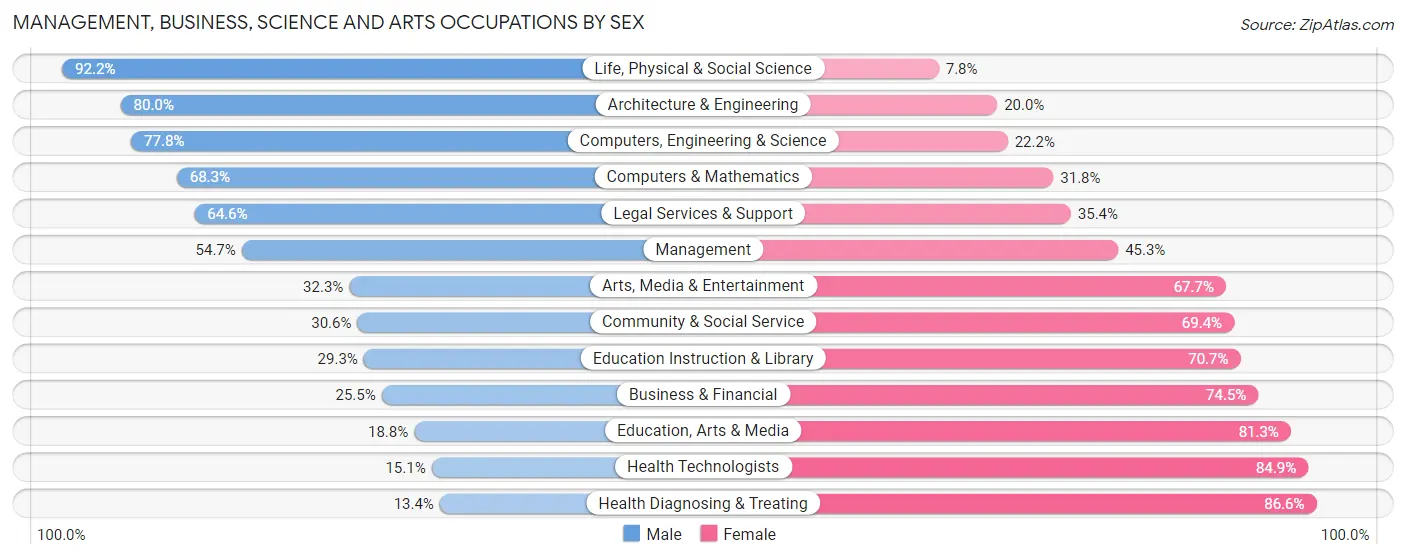
Management, Business, Science and Arts Occupations by Sex
Within the Management, Business, Science and Arts occupations in Sagadahoc County, the most male-oriented occupations are Life, Physical & Social Science (92.2%), Architecture & Engineering (80.0%), and Computers, Engineering & Science (77.8%), while the most female-oriented occupations are Health Diagnosing & Treating (86.6%), Health Technologists (84.9%), and Education, Arts & Media (81.2%).
| Occupation | Male | Female |
| Management | 1,151 (54.7%) | 952 (45.3%) |
| Business & Financial | 226 (25.5%) | 659 (74.5%) |
| Computers, Engineering & Science | 997 (77.8%) | 285 (22.2%) |
| Computers & Mathematics | 273 (68.2%) | 127 (31.8%) |
| Architecture & Engineering | 583 (80.0%) | 146 (20.0%) |
| Life, Physical & Social Science | 141 (92.2%) | 12 (7.8%) |
| Community & Social Service | 818 (30.6%) | 1,855 (69.4%) |
| Education, Arts & Media | 69 (18.8%) | 299 (81.2%) |
| Legal Services & Support | 104 (64.6%) | 57 (35.4%) |
| Education Instruction & Library | 458 (29.3%) | 1,107 (70.7%) |
| Arts, Media & Entertainment | 187 (32.3%) | 392 (67.7%) |
| Health Diagnosing & Treating | 148 (13.4%) | 956 (86.6%) |
| Health Technologists | 127 (15.1%) | 713 (84.9%) |
| Total (Category) | 3,340 (41.5%) | 4,707 (58.5%) |
| Total (Overall) | 9,758 (51.2%) | 9,309 (48.8%) |
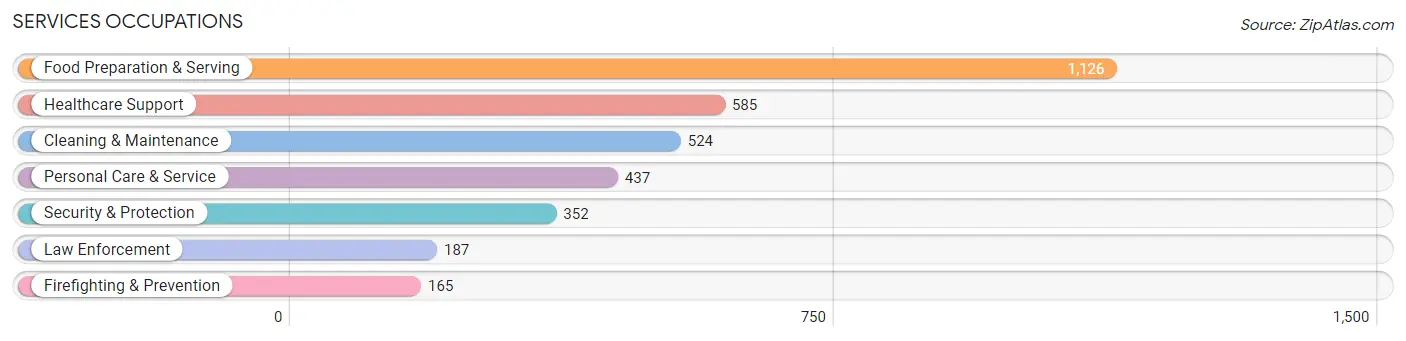
Services Occupations
The most common Services occupations in Sagadahoc County are Food Preparation & Serving (1,126 | 5.9%), Healthcare Support (585 | 3.1%), Cleaning & Maintenance (524 | 2.8%), Personal Care & Service (437 | 2.3%), and Security & Protection (352 | 1.8%).
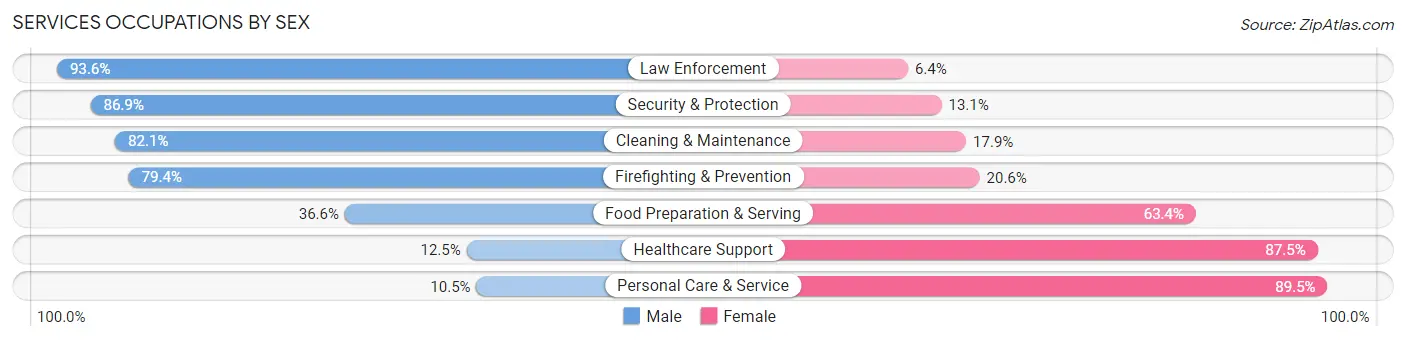
Services Occupations by Sex
Within the Services occupations in Sagadahoc County, the most male-oriented occupations are Law Enforcement (93.6%), Security & Protection (86.9%), and Cleaning & Maintenance (82.1%), while the most female-oriented occupations are Personal Care & Service (89.5%), Healthcare Support (87.5%), and Food Preparation & Serving (63.4%).
| Occupation | Male | Female |
| Healthcare Support | 73 (12.5%) | 512 (87.5%) |
| Security & Protection | 306 (86.9%) | 46 (13.1%) |
| Firefighting & Prevention | 131 (79.4%) | 34 (20.6%) |
| Law Enforcement | 175 (93.6%) | 12 (6.4%) |
| Food Preparation & Serving | 412 (36.6%) | 714 (63.4%) |
| Cleaning & Maintenance | 430 (82.1%) | 94 (17.9%) |
| Personal Care & Service | 46 (10.5%) | 391 (89.5%) |
| Total (Category) | 1,267 (41.9%) | 1,757 (58.1%) |
| Total (Overall) | 9,758 (51.2%) | 9,309 (48.8%) |
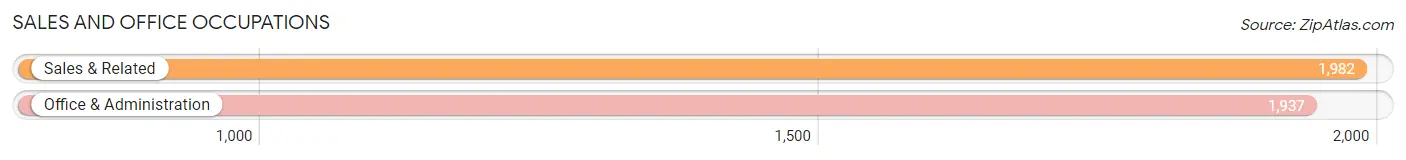
Sales and Office Occupations
The most common Sales and Office occupations in Sagadahoc County are Sales & Related (1,982 | 10.4%), and Office & Administration (1,937 | 10.2%).
Sales and Office Occupations by Sex
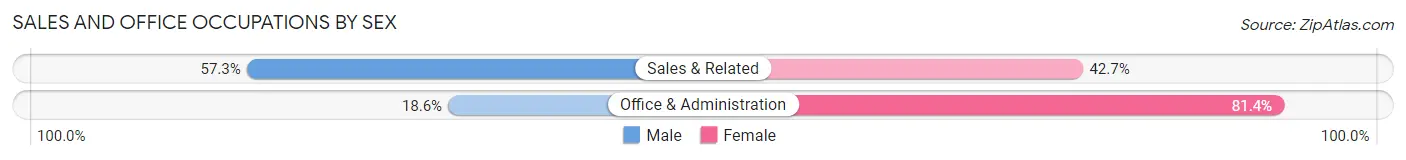
| Occupation | Male | Female |
| Sales & Related | 1,136 (57.3%) | 846 (42.7%) |
| Office & Administration | 360 (18.6%) | 1,577 (81.4%) |
| Total (Category) | 1,496 (38.2%) | 2,423 (61.8%) |
| Total (Overall) | 9,758 (51.2%) | 9,309 (48.8%) |
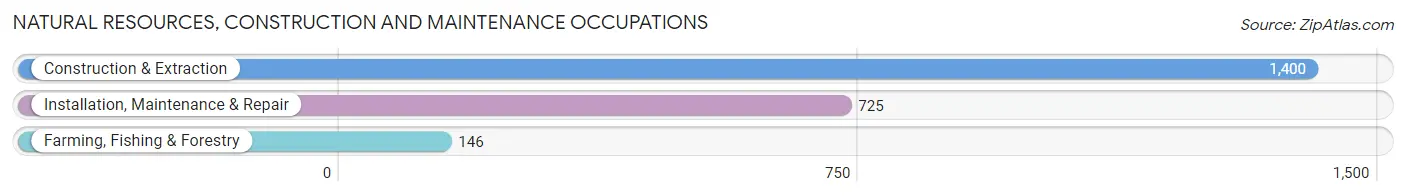
Natural Resources, Construction and Maintenance Occupations
The most common Natural Resources, Construction and Maintenance occupations in Sagadahoc County are Construction & Extraction (1,400 | 7.3%), Installation, Maintenance & Repair (725 | 3.8%), and Farming, Fishing & Forestry (146 | 0.8%).
Natural Resources, Construction and Maintenance Occupations by Sex
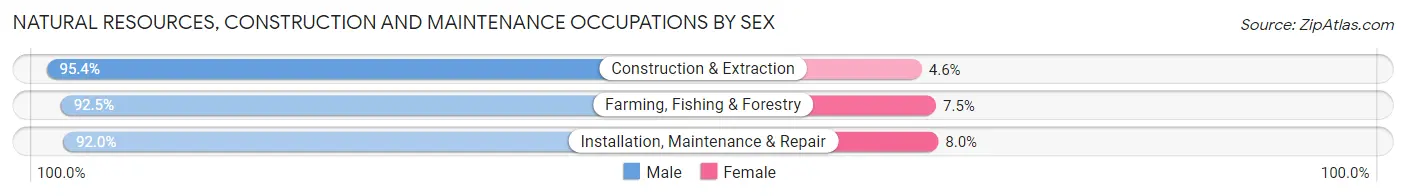
| Occupation | Male | Female |
| Farming, Fishing & Forestry | 135 (92.5%) | 11 (7.5%) |
| Construction & Extraction | 1,336 (95.4%) | 64 (4.6%) |
| Installation, Maintenance & Repair | 667 (92.0%) | 58 (8.0%) |
| Total (Category) | 2,138 (94.1%) | 133 (5.9%) |
| Total (Overall) | 9,758 (51.2%) | 9,309 (48.8%) |
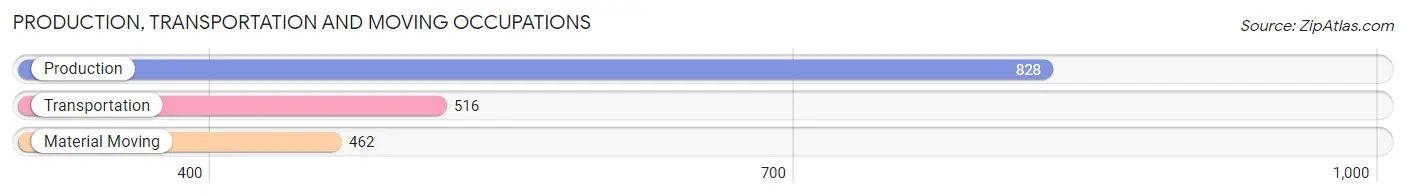
Production, Transportation and Moving Occupations
The most common Production, Transportation and Moving occupations in Sagadahoc County are Production (828 | 4.3%), Transportation (516 | 2.7%), and Material Moving (462 | 2.4%).
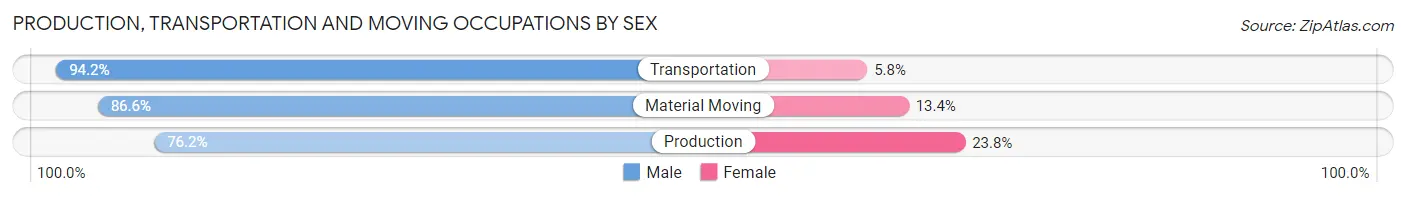
Production, Transportation and Moving Occupations by Sex
| Occupation | Male | Female |
| Production | 631 (76.2%) | 197 (23.8%) |
| Transportation | 486 (94.2%) | 30 (5.8%) |
| Material Moving | 400 (86.6%) | 62 (13.4%) |
| Total (Category) | 1,517 (84.0%) | 289 (16.0%) |
| Total (Overall) | 9,758 (51.2%) | 9,309 (48.8%) |
Employment Industries by Sex in Sagadahoc County
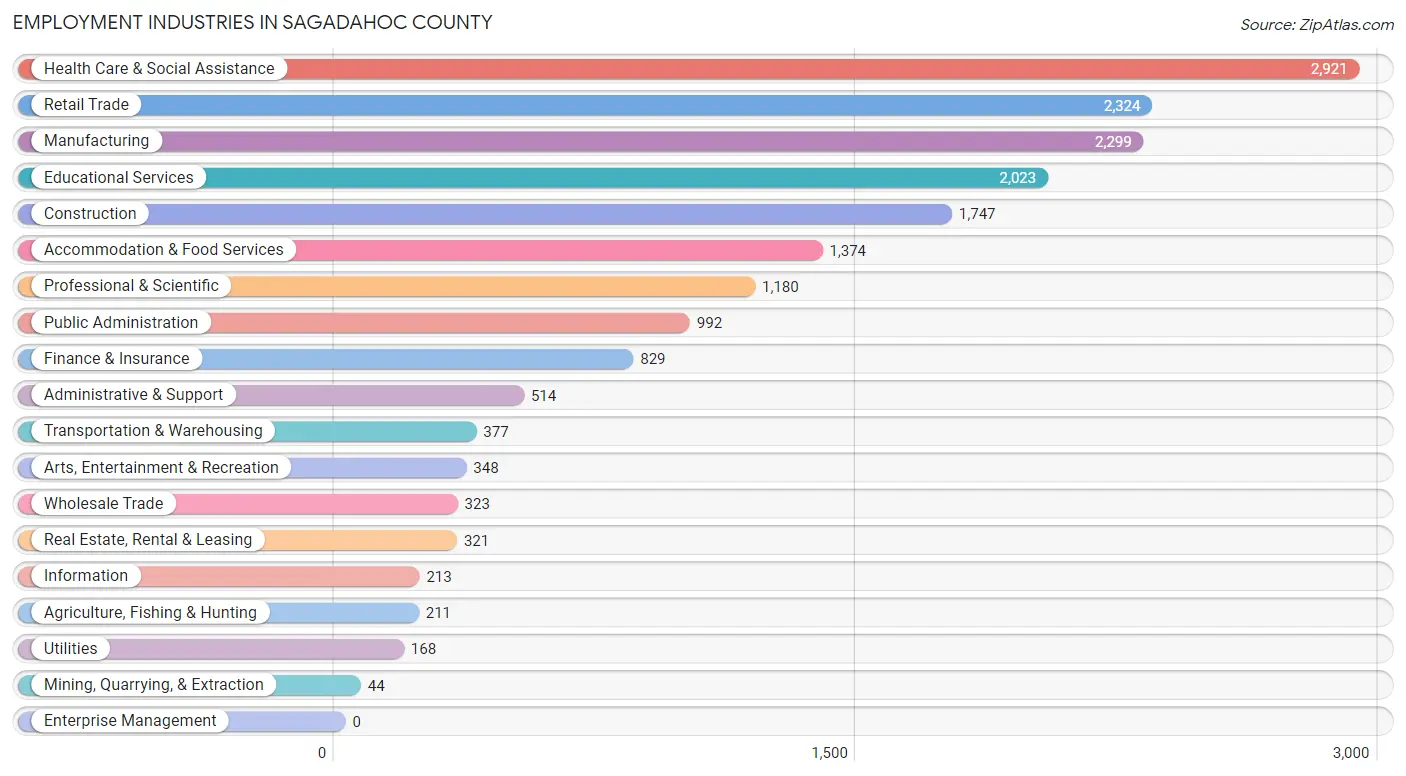
Employment Industries in Sagadahoc County
The major employment industries in Sagadahoc County include Health Care & Social Assistance (2,921 | 15.3%), Retail Trade (2,324 | 12.2%), Manufacturing (2,299 | 12.1%), Educational Services (2,023 | 10.6%), and Construction (1,747 | 9.2%).
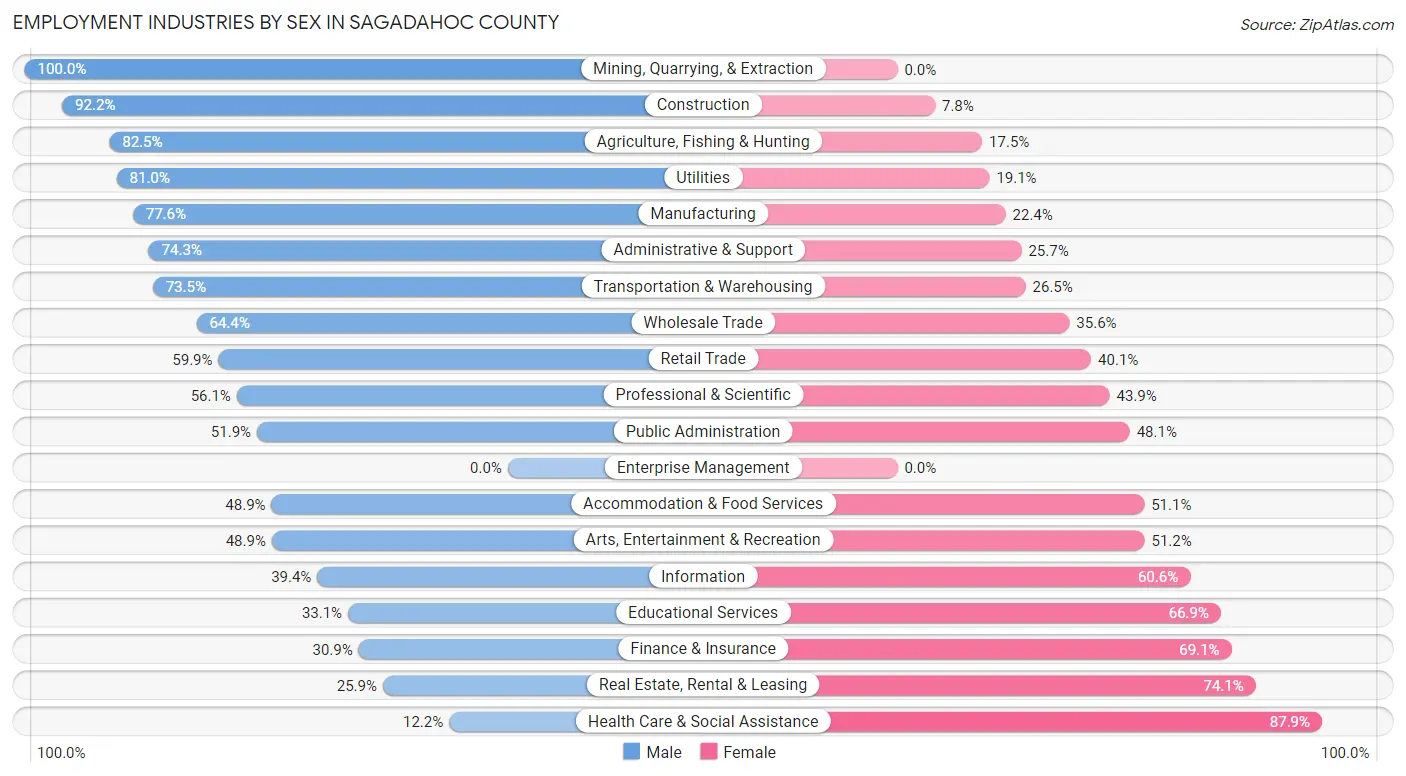
Employment Industries by Sex in Sagadahoc County
The Sagadahoc County industries that see more men than women are Mining, Quarrying, & Extraction (100.0%), Construction (92.2%), and Agriculture, Fishing & Hunting (82.5%), whereas the industries that tend to have a higher number of women are Health Care & Social Assistance (87.8%), Real Estate, Rental & Leasing (74.1%), and Finance & Insurance (69.1%).
| Industry | Male | Female |
| Agriculture, Fishing & Hunting | 174 (82.5%) | 37 (17.5%) |
| Mining, Quarrying, & Extraction | 44 (100.0%) | 0 (0.0%) |
| Construction | 1,611 (92.2%) | 136 (7.8%) |
| Manufacturing | 1,784 (77.6%) | 515 (22.4%) |
| Wholesale Trade | 208 (64.4%) | 115 (35.6%) |
| Retail Trade | 1,392 (59.9%) | 932 (40.1%) |
| Transportation & Warehousing | 277 (73.5%) | 100 (26.5%) |
| Utilities | 136 (80.9%) | 32 (19.1%) |
| Information | 84 (39.4%) | 129 (60.6%) |
| Finance & Insurance | 256 (30.9%) | 573 (69.1%) |
| Real Estate, Rental & Leasing | 83 (25.9%) | 238 (74.1%) |
| Professional & Scientific | 662 (56.1%) | 518 (43.9%) |
| Enterprise Management | 0 (0.0%) | 0 (0.0%) |
| Administrative & Support | 382 (74.3%) | 132 (25.7%) |
| Educational Services | 669 (33.1%) | 1,354 (66.9%) |
| Health Care & Social Assistance | 355 (12.1%) | 2,566 (87.8%) |
| Arts, Entertainment & Recreation | 170 (48.8%) | 178 (51.1%) |
| Accommodation & Food Services | 672 (48.9%) | 702 (51.1%) |
| Public Administration | 515 (51.9%) | 477 (48.1%) |
| Total | 9,758 (51.2%) | 9,309 (48.8%) |
Education in Sagadahoc County
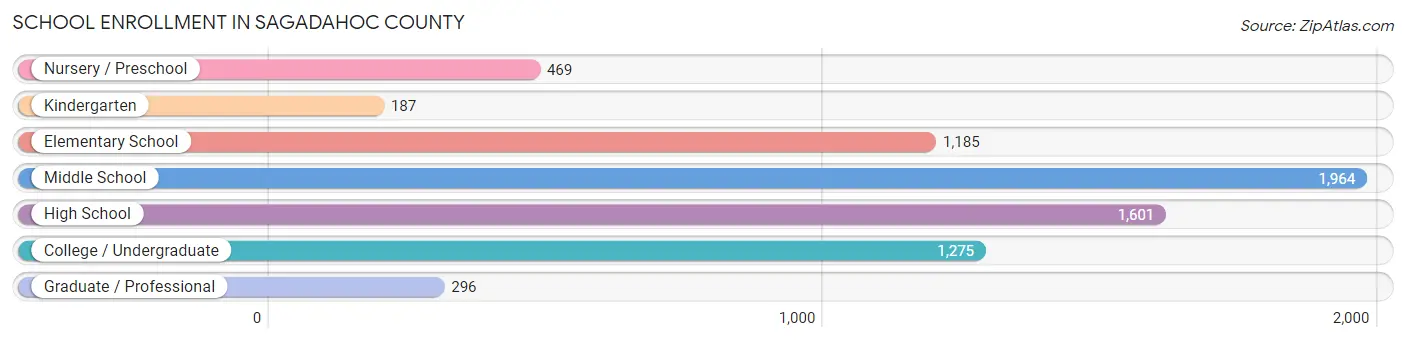
School Enrollment in Sagadahoc County
The most common levels of schooling among the 6,977 students in Sagadahoc County are middle school (1,964 | 28.1%), high school (1,601 | 23.0%), and college / undergraduate (1,275 | 18.3%).
| School Level | # Students | % Students |
| Nursery / Preschool | 469 | 6.7% |
| Kindergarten | 187 | 2.7% |
| Elementary School | 1,185 | 17.0% |
| Middle School | 1,964 | 28.1% |
| High School | 1,601 | 23.0% |
| College / Undergraduate | 1,275 | 18.3% |
| Graduate / Professional | 296 | 4.2% |
| Total | 6,977 | 100.0% |
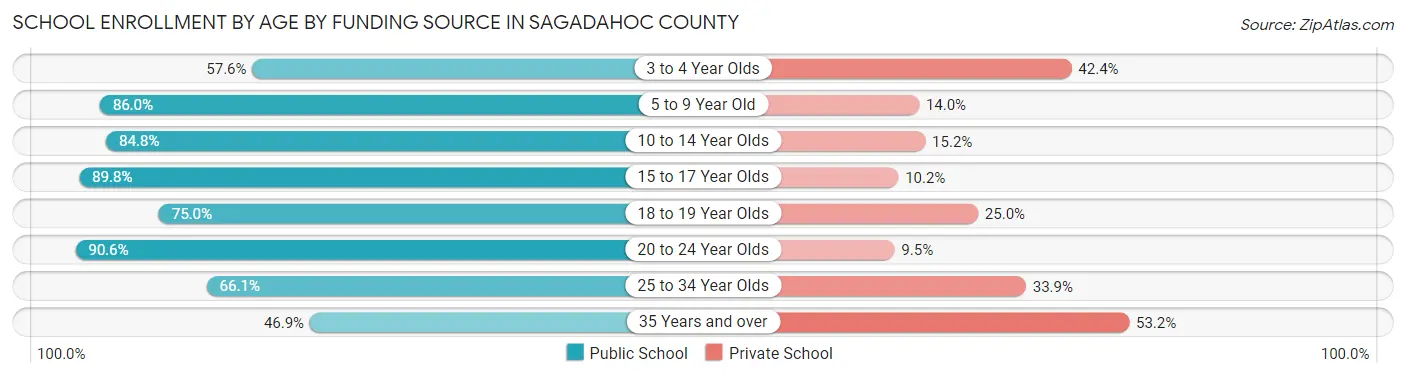
School Enrollment by Age by Funding Source in Sagadahoc County
Out of a total of 6,977 students who are enrolled in schools in Sagadahoc County, 1,333 (19.1%) attend a private institution, while the remaining 5,644 (80.9%) are enrolled in public schools. The age group of 35 years and over has the highest likelihood of being enrolled in private schools, with 245 (53.1% in the age bracket) enrolled. Conversely, the age group of 20 to 24 year olds has the lowest likelihood of being enrolled in a private school, with 345 (90.5% in the age bracket) attending a public institution.
| Age Bracket | Public School | Private School |
| 3 to 4 Year Olds | 152 (57.6%) | 112 (42.4%) |
| 5 to 9 Year Old | 1,263 (86.0%) | 206 (14.0%) |
| 10 to 14 Year Olds | 1,889 (84.8%) | 338 (15.2%) |
| 15 to 17 Year Olds | 1,141 (89.8%) | 129 (10.2%) |
| 18 to 19 Year Olds | 336 (75.0%) | 112 (25.0%) |
| 20 to 24 Year Olds | 345 (90.5%) | 36 (9.5%) |
| 25 to 34 Year Olds | 302 (66.1%) | 155 (33.9%) |
| 35 Years and over | 216 (46.9%) | 245 (53.1%) |
| Total | 5,644 (80.9%) | 1,333 (19.1%) |
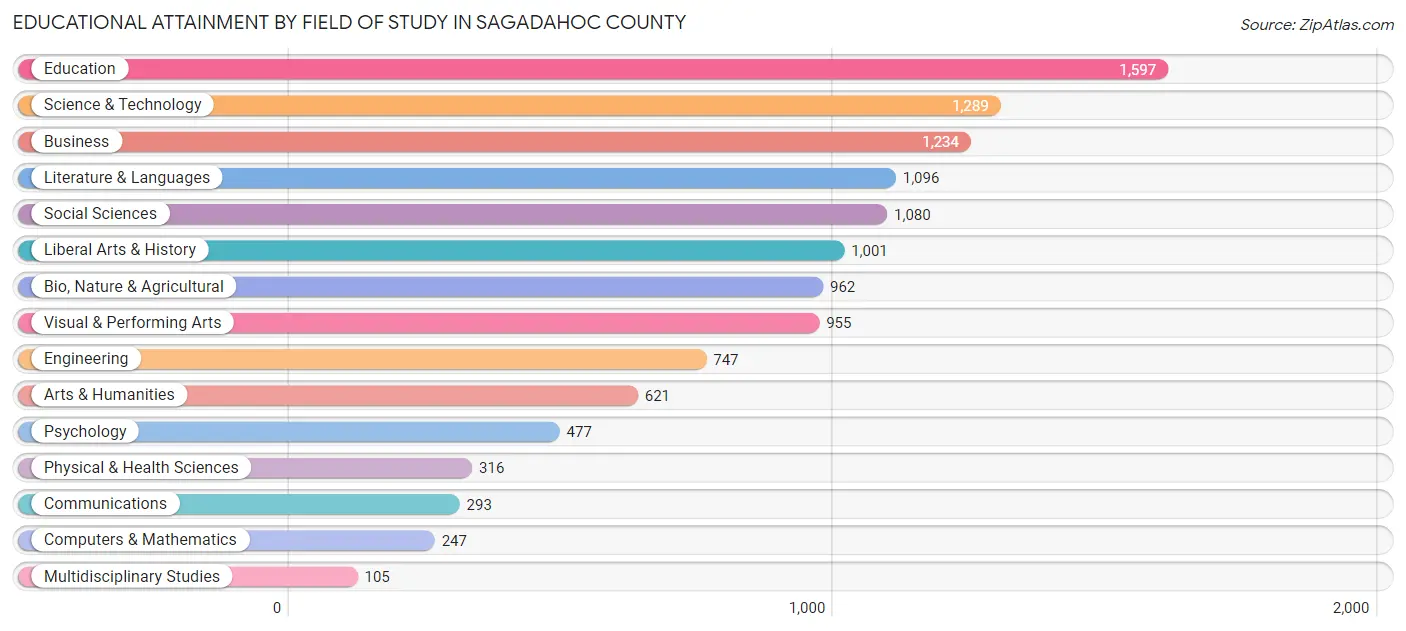
Educational Attainment by Field of Study in Sagadahoc County
Education (1,597 | 13.3%), science & technology (1,289 | 10.7%), business (1,234 | 10.3%), literature & languages (1,096 | 9.1%), and social sciences (1,080 | 9.0%) are the most common fields of study among 12,020 individuals in Sagadahoc County who have obtained a bachelor's degree or higher.
| Field of Study | # Graduates | % Graduates |
| Computers & Mathematics | 247 | 2.1% |
| Bio, Nature & Agricultural | 962 | 8.0% |
| Physical & Health Sciences | 316 | 2.6% |
| Psychology | 477 | 4.0% |
| Social Sciences | 1,080 | 9.0% |
| Engineering | 747 | 6.2% |
| Multidisciplinary Studies | 105 | 0.9% |
| Science & Technology | 1,289 | 10.7% |
| Business | 1,234 | 10.3% |
| Education | 1,597 | 13.3% |
| Literature & Languages | 1,096 | 9.1% |
| Liberal Arts & History | 1,001 | 8.3% |
| Visual & Performing Arts | 955 | 8.0% |
| Communications | 293 | 2.4% |
| Arts & Humanities | 621 | 5.2% |
| Total | 12,020 | 100.0% |
Transportation & Commute in Sagadahoc County
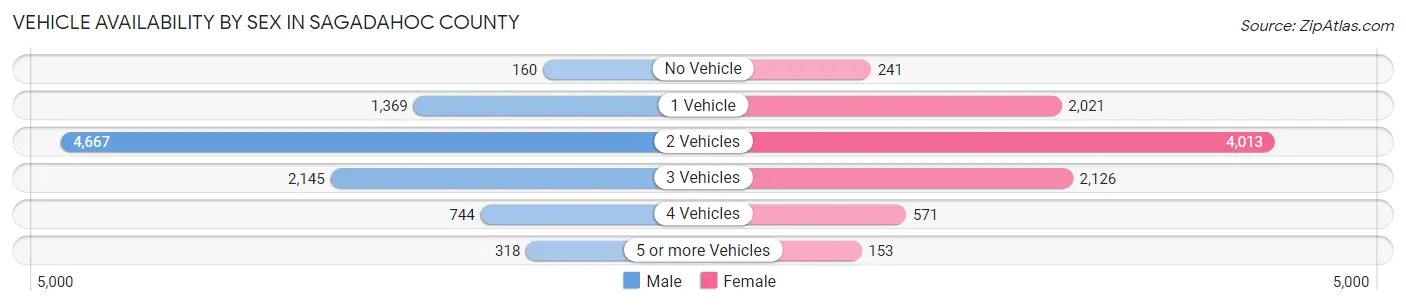
Vehicle Availability by Sex in Sagadahoc County
The most prevalent vehicle ownership categories in Sagadahoc County are males with 2 vehicles (4,667, accounting for 49.6%) and females with 2 vehicles (4,013, making up 51.1%).
| Vehicles Available | Male | Female |
| No Vehicle | 160 (1.7%) | 241 (2.6%) |
| 1 Vehicle | 1,369 (14.6%) | 2,021 (22.2%) |
| 2 Vehicles | 4,667 (49.6%) | 4,013 (44.0%) |
| 3 Vehicles | 2,145 (22.8%) | 2,126 (23.3%) |
| 4 Vehicles | 744 (7.9%) | 571 (6.3%) |
| 5 or more Vehicles | 318 (3.4%) | 153 (1.7%) |
| Total | 9,403 (100.0%) | 9,125 (100.0%) |
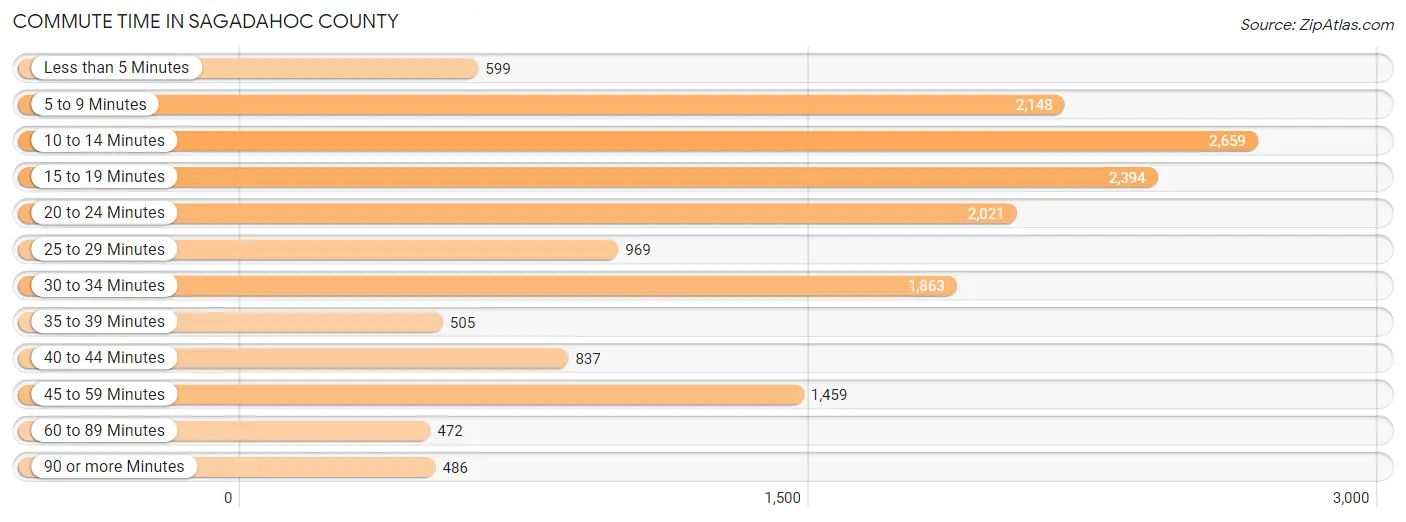
Commute Time in Sagadahoc County
The most frequently occuring commute durations in Sagadahoc County are 10 to 14 minutes (2,659 commuters, 16.2%), 15 to 19 minutes (2,394 commuters, 14.6%), and 5 to 9 minutes (2,148 commuters, 13.1%).
| Commute Time | # Commuters | % Commuters |
| Less than 5 Minutes | 599 | 3.6% |
| 5 to 9 Minutes | 2,148 | 13.1% |
| 10 to 14 Minutes | 2,659 | 16.2% |
| 15 to 19 Minutes | 2,394 | 14.6% |
| 20 to 24 Minutes | 2,021 | 12.3% |
| 25 to 29 Minutes | 969 | 5.9% |
| 30 to 34 Minutes | 1,863 | 11.4% |
| 35 to 39 Minutes | 505 | 3.1% |
| 40 to 44 Minutes | 837 | 5.1% |
| 45 to 59 Minutes | 1,459 | 8.9% |
| 60 to 89 Minutes | 472 | 2.9% |
| 90 or more Minutes | 486 | 3.0% |
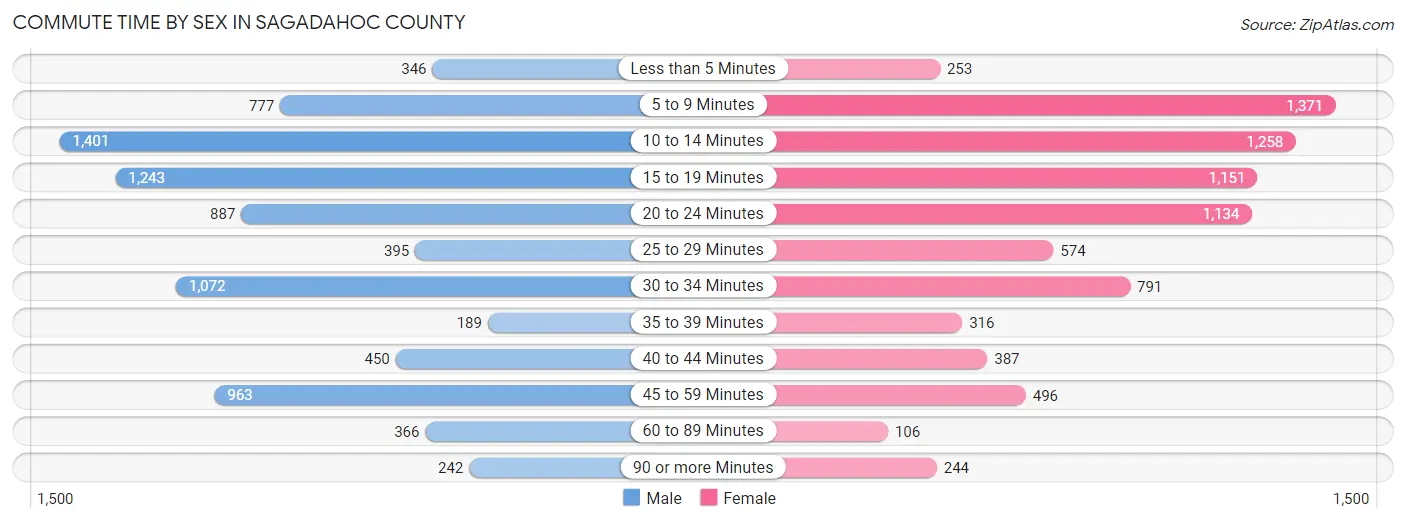
Commute Time by Sex in Sagadahoc County
The most common commute times in Sagadahoc County are 10 to 14 minutes (1,401 commuters, 16.8%) for males and 5 to 9 minutes (1,371 commuters, 17.0%) for females.
| Commute Time | Male | Female |
| Less than 5 Minutes | 346 (4.2%) | 253 (3.1%) |
| 5 to 9 Minutes | 777 (9.3%) | 1,371 (17.0%) |
| 10 to 14 Minutes | 1,401 (16.8%) | 1,258 (15.6%) |
| 15 to 19 Minutes | 1,243 (14.9%) | 1,151 (14.2%) |
| 20 to 24 Minutes | 887 (10.6%) | 1,134 (14.0%) |
| 25 to 29 Minutes | 395 (4.7%) | 574 (7.1%) |
| 30 to 34 Minutes | 1,072 (12.9%) | 791 (9.8%) |
| 35 to 39 Minutes | 189 (2.3%) | 316 (3.9%) |
| 40 to 44 Minutes | 450 (5.4%) | 387 (4.8%) |
| 45 to 59 Minutes | 963 (11.6%) | 496 (6.1%) |
| 60 to 89 Minutes | 366 (4.4%) | 106 (1.3%) |
| 90 or more Minutes | 242 (2.9%) | 244 (3.0%) |
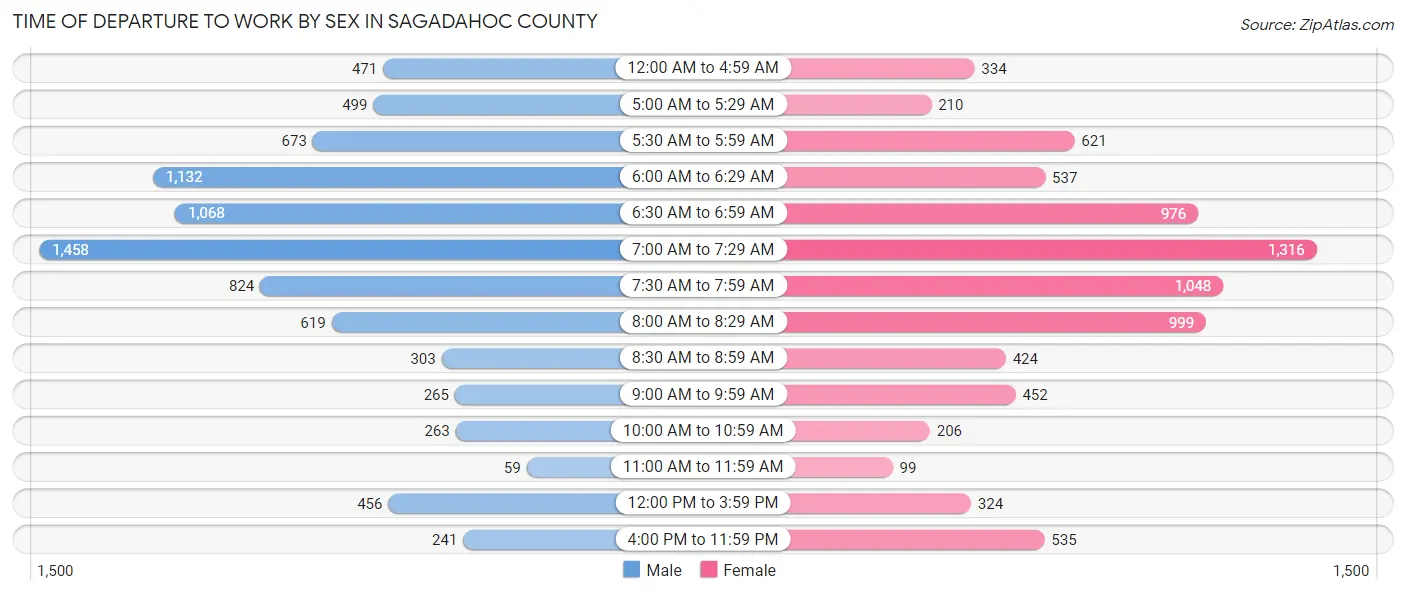
Time of Departure to Work by Sex in Sagadahoc County
The most frequent times of departure to work in Sagadahoc County are 7:00 AM to 7:29 AM (1,458, 17.5%) for males and 7:00 AM to 7:29 AM (1,316, 16.3%) for females.
| Time of Departure | Male | Female |
| 12:00 AM to 4:59 AM | 471 (5.7%) | 334 (4.1%) |
| 5:00 AM to 5:29 AM | 499 (6.0%) | 210 (2.6%) |
| 5:30 AM to 5:59 AM | 673 (8.1%) | 621 (7.7%) |
| 6:00 AM to 6:29 AM | 1,132 (13.6%) | 537 (6.7%) |
| 6:30 AM to 6:59 AM | 1,068 (12.8%) | 976 (12.1%) |
| 7:00 AM to 7:29 AM | 1,458 (17.5%) | 1,316 (16.3%) |
| 7:30 AM to 7:59 AM | 824 (9.9%) | 1,048 (13.0%) |
| 8:00 AM to 8:29 AM | 619 (7.4%) | 999 (12.4%) |
| 8:30 AM to 8:59 AM | 303 (3.6%) | 424 (5.2%) |
| 9:00 AM to 9:59 AM | 265 (3.2%) | 452 (5.6%) |
| 10:00 AM to 10:59 AM | 263 (3.2%) | 206 (2.5%) |
| 11:00 AM to 11:59 AM | 59 (0.7%) | 99 (1.2%) |
| 12:00 PM to 3:59 PM | 456 (5.5%) | 324 (4.0%) |
| 4:00 PM to 11:59 PM | 241 (2.9%) | 535 (6.6%) |
| Total | 8,331 (100.0%) | 8,081 (100.0%) |
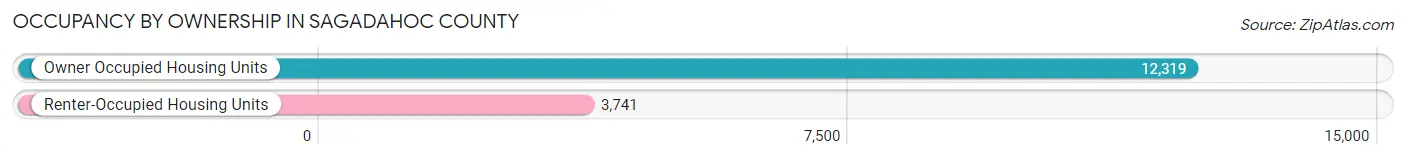
Housing Occupancy in Sagadahoc County
Occupancy by Ownership in Sagadahoc County
Of the total 16,060 dwellings in Sagadahoc County, owner-occupied units account for 12,319 (76.7%), while renter-occupied units make up 3,741 (23.3%).
| Occupancy | # Housing Units | % Housing Units |
| Owner Occupied Housing Units | 12,319 | 76.7% |
| Renter-Occupied Housing Units | 3,741 | 23.3% |
| Total Occupied Housing Units | 16,060 | 100.0% |
Occupancy by Household Size in Sagadahoc County
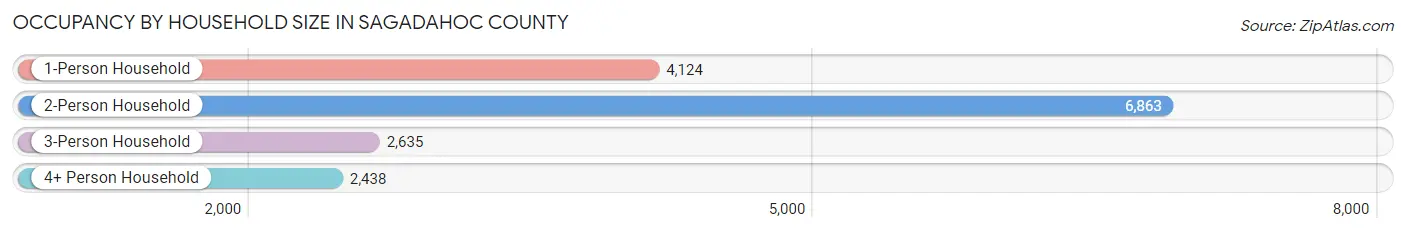
| Household Size | # Housing Units | % Housing Units |
| 1-Person Household | 4,124 | 25.7% |
| 2-Person Household | 6,863 | 42.7% |
| 3-Person Household | 2,635 | 16.4% |
| 4+ Person Household | 2,438 | 15.2% |
| Total Housing Units | 16,060 | 100.0% |
Occupancy by Ownership by Household Size in Sagadahoc County
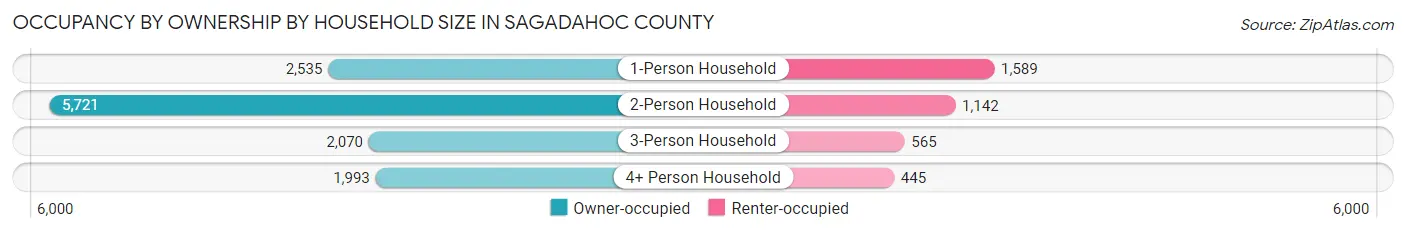
| Household Size | Owner-occupied | Renter-occupied |
| 1-Person Household | 2,535 (61.5%) | 1,589 (38.5%) |
| 2-Person Household | 5,721 (83.4%) | 1,142 (16.6%) |
| 3-Person Household | 2,070 (78.6%) | 565 (21.4%) |
| 4+ Person Household | 1,993 (81.8%) | 445 (18.2%) |
| Total Housing Units | 12,319 (76.7%) | 3,741 (23.3%) |
Occupancy by Educational Attainment in Sagadahoc County
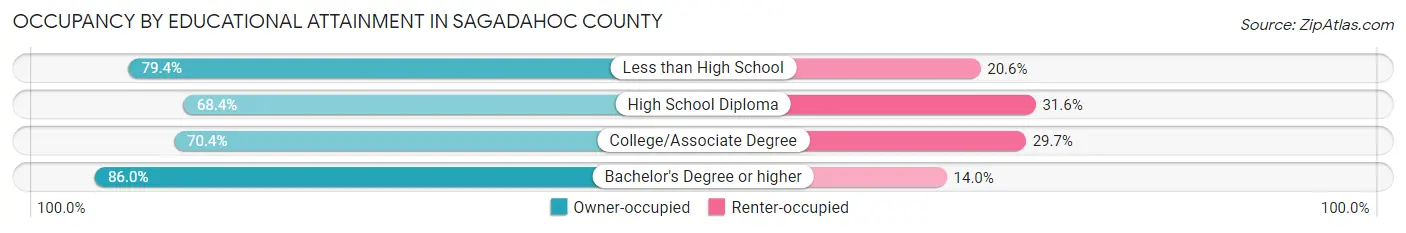
| Household Size | Owner-occupied | Renter-occupied |
| Less than High School | 715 (79.4%) | 186 (20.6%) |
| High School Diploma | 2,947 (68.4%) | 1,361 (31.6%) |
| College/Associate Degree | 3,047 (70.4%) | 1,284 (29.6%) |
| Bachelor's Degree or higher | 5,610 (86.0%) | 910 (14.0%) |
Occupancy by Age of Householder in Sagadahoc County
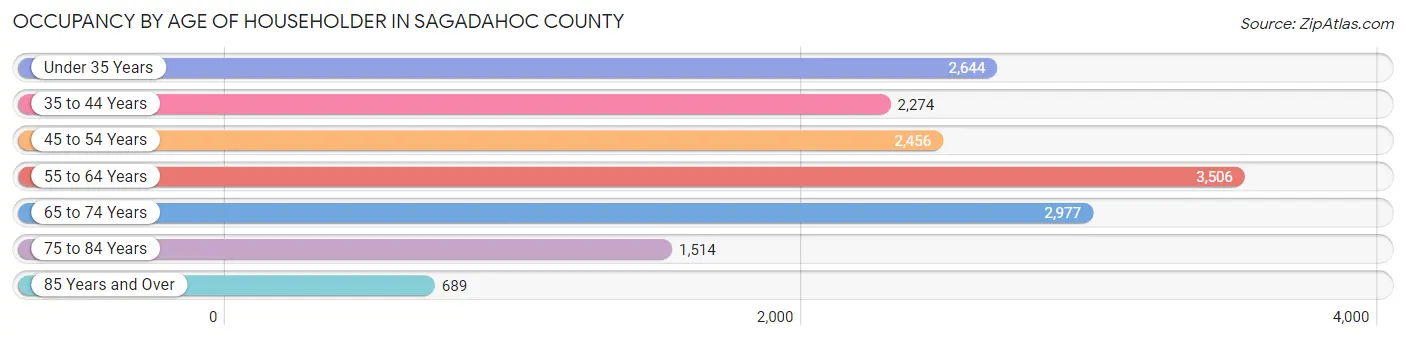
| Age Bracket | # Households | % Households |
| Under 35 Years | 2,644 | 16.5% |
| 35 to 44 Years | 2,274 | 14.2% |
| 45 to 54 Years | 2,456 | 15.3% |
| 55 to 64 Years | 3,506 | 21.8% |
| 65 to 74 Years | 2,977 | 18.5% |
| 75 to 84 Years | 1,514 | 9.4% |
| 85 Years and Over | 689 | 4.3% |
| Total | 16,060 | 100.0% |
Housing Finances in Sagadahoc County
Median Income by Occupancy in Sagadahoc County
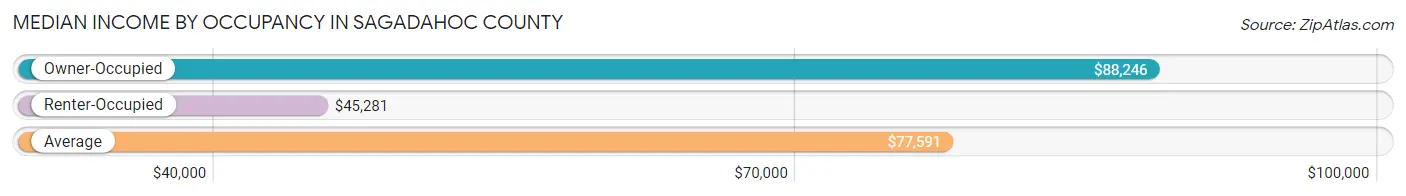
| Occupancy Type | # Households | Median Income |
| Owner-Occupied | 12,319 (76.7%) | $88,246 |
| Renter-Occupied | 3,741 (23.3%) | $45,281 |
| Average | 16,060 (100.0%) | $77,591 |
Occupancy by Householder Income Bracket in Sagadahoc County
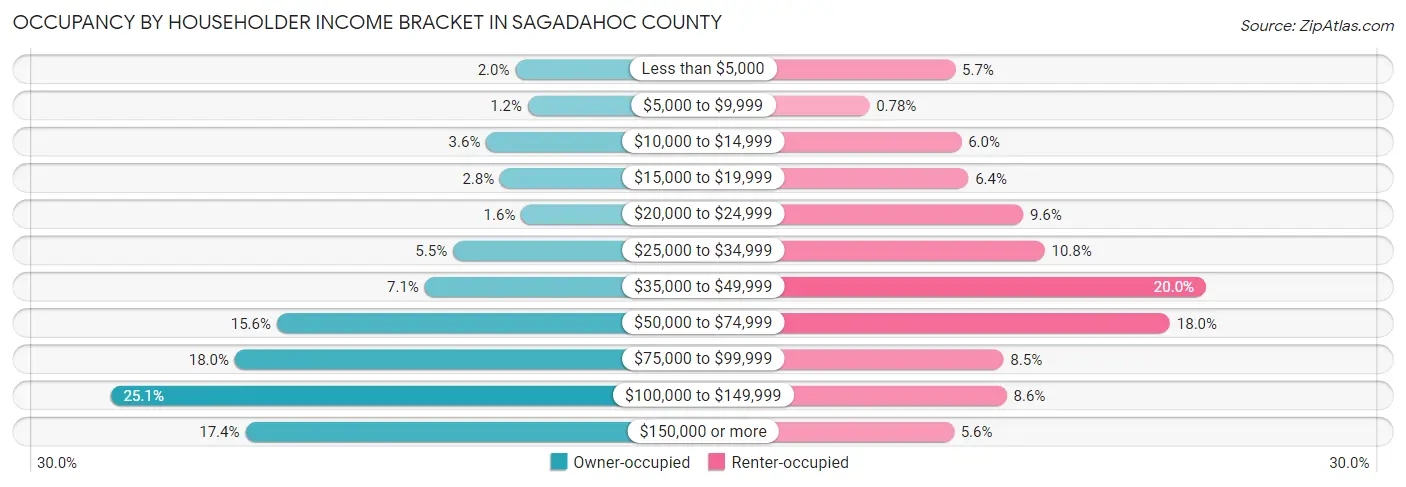
| Income Bracket | Owner-occupied | Renter-occupied |
| Less than $5,000 | 242 (2.0%) | 213 (5.7%) |
| $5,000 to $9,999 | 153 (1.2%) | 29 (0.8%) |
| $10,000 to $14,999 | 446 (3.6%) | 226 (6.0%) |
| $15,000 to $19,999 | 349 (2.8%) | 241 (6.4%) |
| $20,000 to $24,999 | 200 (1.6%) | 358 (9.6%) |
| $25,000 to $34,999 | 680 (5.5%) | 404 (10.8%) |
| $35,000 to $49,999 | 879 (7.1%) | 749 (20.0%) |
| $50,000 to $74,999 | 1,921 (15.6%) | 672 (18.0%) |
| $75,000 to $99,999 | 2,216 (18.0%) | 316 (8.5%) |
| $100,000 to $149,999 | 3,091 (25.1%) | 323 (8.6%) |
| $150,000 or more | 2,142 (17.4%) | 210 (5.6%) |
| Total | 12,319 (100.0%) | 3,741 (100.0%) |
Monthly Housing Cost Tiers in Sagadahoc County
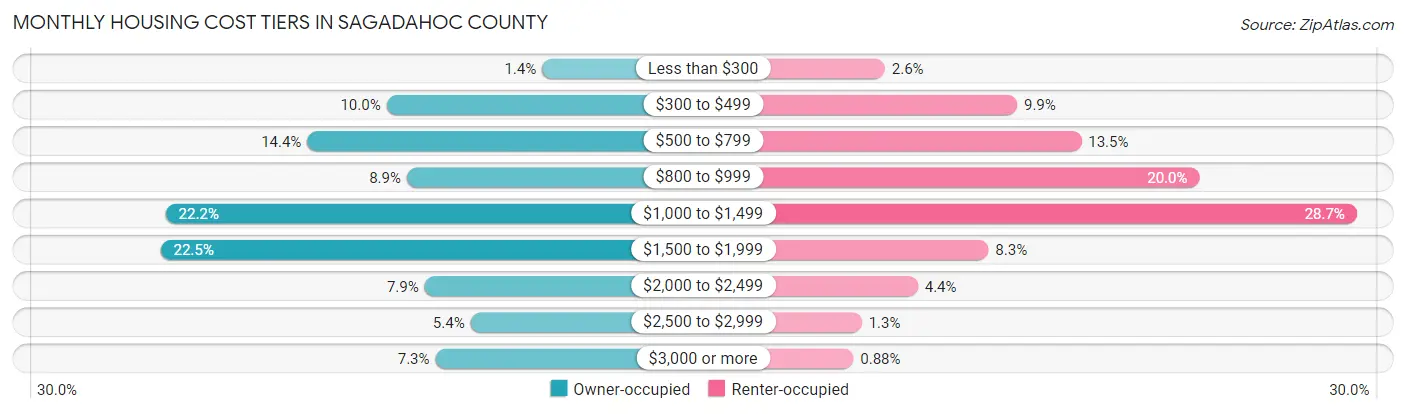
| Monthly Cost | Owner-occupied | Renter-occupied |
| Less than $300 | 175 (1.4%) | 98 (2.6%) |
| $300 to $499 | 1,233 (10.0%) | 371 (9.9%) |
| $500 to $799 | 1,773 (14.4%) | 504 (13.5%) |
| $800 to $999 | 1,095 (8.9%) | 748 (20.0%) |
| $1,000 to $1,499 | 2,736 (22.2%) | 1,073 (28.7%) |
| $1,500 to $1,999 | 2,771 (22.5%) | 312 (8.3%) |
| $2,000 to $2,499 | 975 (7.9%) | 166 (4.4%) |
| $2,500 to $2,999 | 661 (5.4%) | 50 (1.3%) |
| $3,000 or more | 900 (7.3%) | 33 (0.9%) |
| Total | 12,319 (100.0%) | 3,741 (100.0%) |
Physical Housing Characteristics in Sagadahoc County
Housing Structures in Sagadahoc County
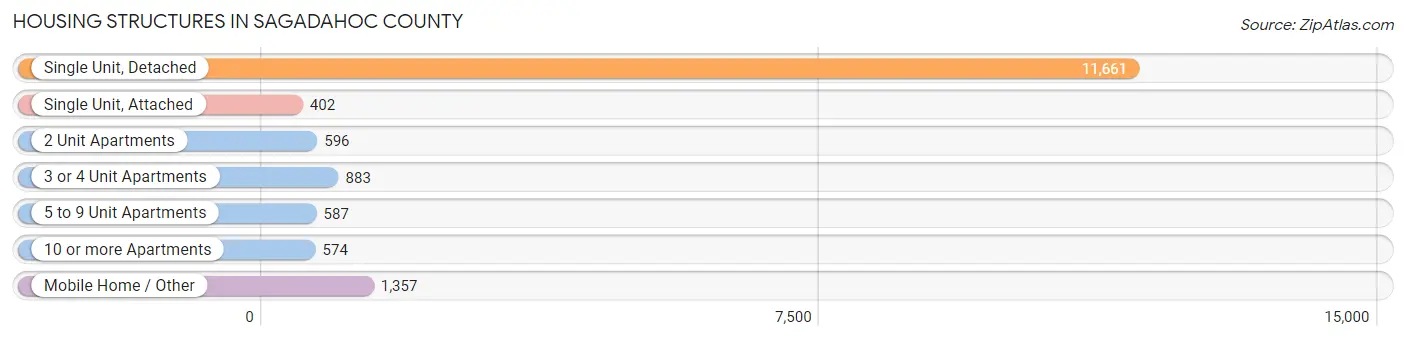
| Structure Type | # Housing Units | % Housing Units |
| Single Unit, Detached | 11,661 | 72.6% |
| Single Unit, Attached | 402 | 2.5% |
| 2 Unit Apartments | 596 | 3.7% |
| 3 or 4 Unit Apartments | 883 | 5.5% |
| 5 to 9 Unit Apartments | 587 | 3.7% |
| 10 or more Apartments | 574 | 3.6% |
| Mobile Home / Other | 1,357 | 8.5% |
| Total | 16,060 | 100.0% |
Housing Structures by Occupancy in Sagadahoc County
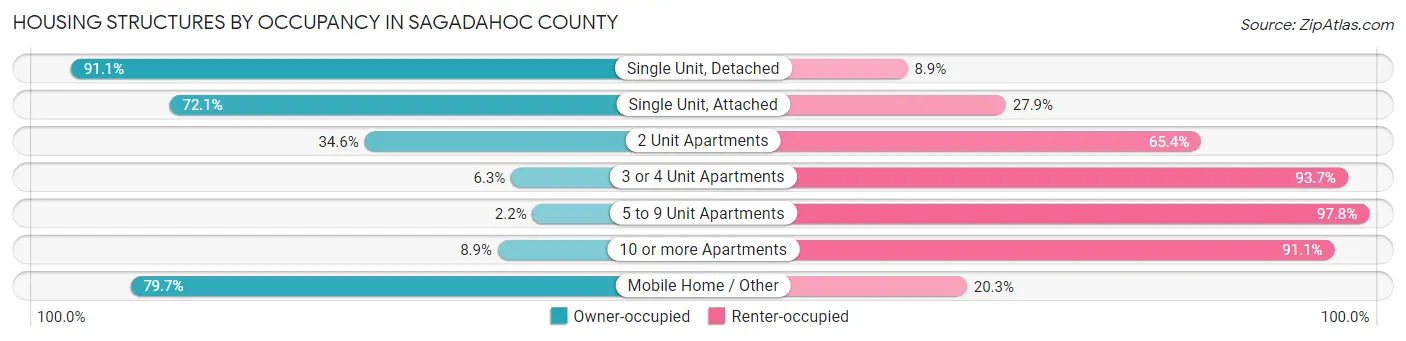
| Structure Type | Owner-occupied | Renter-occupied |
| Single Unit, Detached | 10,622 (91.1%) | 1,039 (8.9%) |
| Single Unit, Attached | 290 (72.1%) | 112 (27.9%) |
| 2 Unit Apartments | 206 (34.6%) | 390 (65.4%) |
| 3 or 4 Unit Apartments | 56 (6.3%) | 827 (93.7%) |
| 5 to 9 Unit Apartments | 13 (2.2%) | 574 (97.8%) |
| 10 or more Apartments | 51 (8.9%) | 523 (91.1%) |
| Mobile Home / Other | 1,081 (79.7%) | 276 (20.3%) |
| Total | 12,319 (76.7%) | 3,741 (23.3%) |
Housing Structures by Number of Rooms in Sagadahoc County
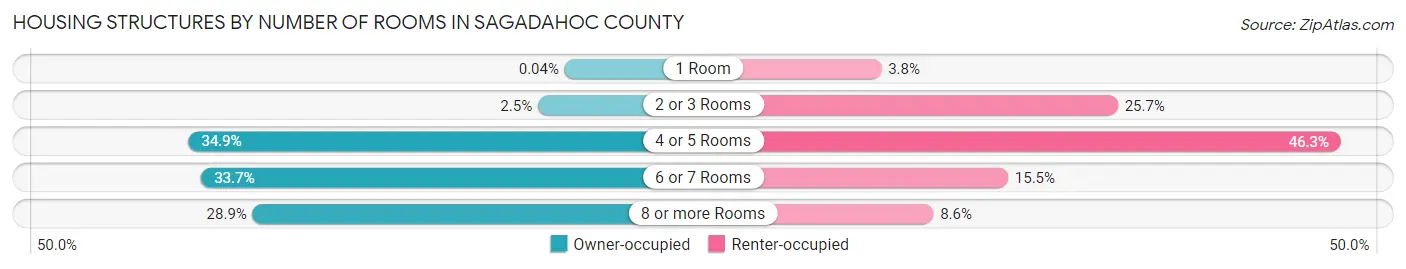
| Number of Rooms | Owner-occupied | Renter-occupied |
| 1 Room | 5 (0.0%) | 143 (3.8%) |
| 2 or 3 Rooms | 311 (2.5%) | 961 (25.7%) |
| 4 or 5 Rooms | 4,294 (34.9%) | 1,733 (46.3%) |
| 6 or 7 Rooms | 4,147 (33.7%) | 581 (15.5%) |
| 8 or more Rooms | 3,562 (28.9%) | 323 (8.6%) |
| Total | 12,319 (100.0%) | 3,741 (100.0%) |
Housing Structure by Heating Type in Sagadahoc County
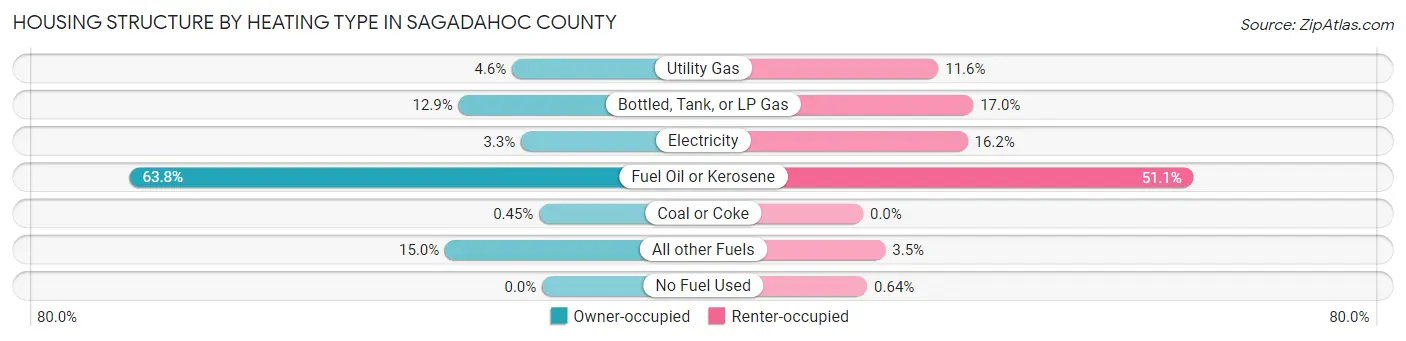
| Heating Type | Owner-occupied | Renter-occupied |
| Utility Gas | 571 (4.6%) | 435 (11.6%) |
| Bottled, Tank, or LP Gas | 1,591 (12.9%) | 637 (17.0%) |
| Electricity | 401 (3.3%) | 604 (16.2%) |
| Fuel Oil or Kerosene | 7,853 (63.7%) | 1,912 (51.1%) |
| Coal or Coke | 55 (0.4%) | 0 (0.0%) |
| All other Fuels | 1,848 (15.0%) | 129 (3.5%) |
| No Fuel Used | 0 (0.0%) | 24 (0.6%) |
| Total | 12,319 (100.0%) | 3,741 (100.0%) |
Household Vehicle Usage in Sagadahoc County
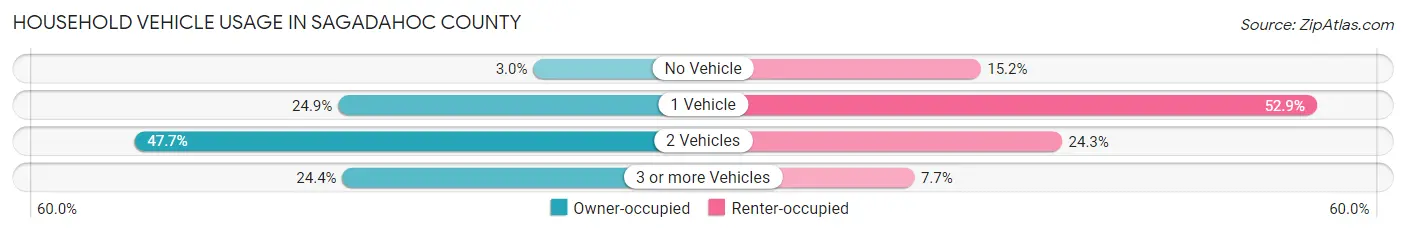
| Vehicles per Household | Owner-occupied | Renter-occupied |
| No Vehicle | 372 (3.0%) | 567 (15.2%) |
| 1 Vehicle | 3,065 (24.9%) | 1,977 (52.8%) |
| 2 Vehicles | 5,876 (47.7%) | 908 (24.3%) |
| 3 or more Vehicles | 3,006 (24.4%) | 289 (7.7%) |
| Total | 12,319 (100.0%) | 3,741 (100.0%) |
Real Estate & Mortgages in Sagadahoc County
Real Estate and Mortgage Overview in Sagadahoc County
| Characteristic | Without Mortgage | With Mortgage |
| Housing Units | 4,320 | 7,999 |
| Median Property Value | $249,600 | $279,300 |
| Median Household Income | $64,129 | $1,472 |
| Monthly Housing Costs | $641 | $870 |
| Real Estate Taxes | $3,194 | $5 |
Property Value by Mortgage Status in Sagadahoc County
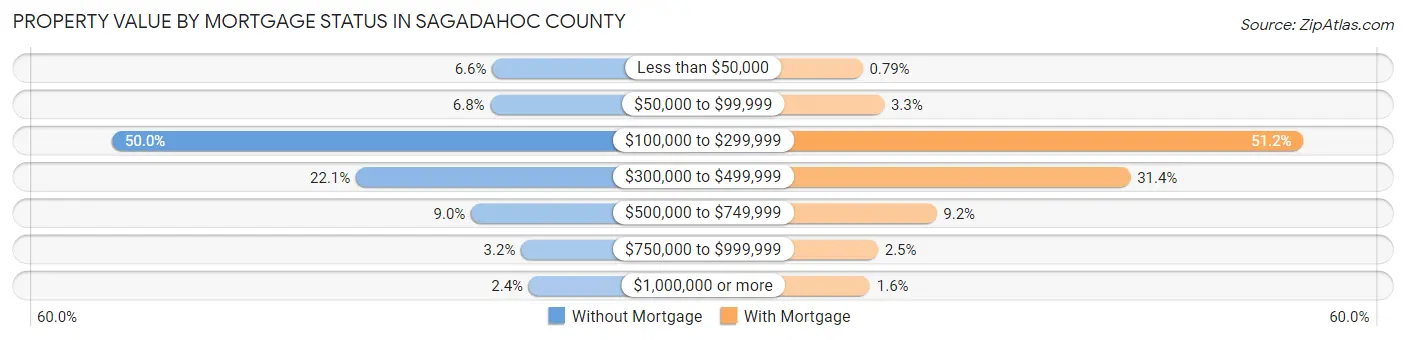
| Property Value | Without Mortgage | With Mortgage |
| Less than $50,000 | 283 (6.6%) | 63 (0.8%) |
| $50,000 to $99,999 | 292 (6.8%) | 260 (3.3%) |
| $100,000 to $299,999 | 2,161 (50.0%) | 4,094 (51.2%) |
| $300,000 to $499,999 | 955 (22.1%) | 2,511 (31.4%) |
| $500,000 to $749,999 | 387 (9.0%) | 738 (9.2%) |
| $750,000 to $999,999 | 140 (3.2%) | 203 (2.5%) |
| $1,000,000 or more | 102 (2.4%) | 130 (1.6%) |
| Total | 4,320 (100.0%) | 7,999 (100.0%) |
Household Income by Mortgage Status in Sagadahoc County
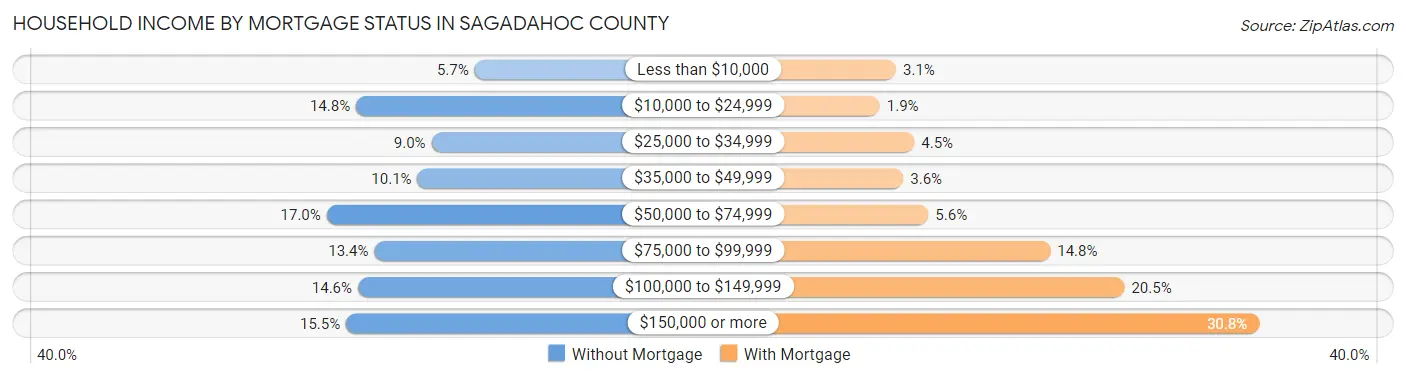
| Household Income | Without Mortgage | With Mortgage |
| Less than $10,000 | 247 (5.7%) | 247 (3.1%) |
| $10,000 to $24,999 | 637 (14.7%) | 148 (1.8%) |
| $25,000 to $34,999 | 389 (9.0%) | 358 (4.5%) |
| $35,000 to $49,999 | 435 (10.1%) | 291 (3.6%) |
| $50,000 to $74,999 | 734 (17.0%) | 444 (5.6%) |
| $75,000 to $99,999 | 577 (13.4%) | 1,187 (14.8%) |
| $100,000 to $149,999 | 631 (14.6%) | 1,639 (20.5%) |
| $150,000 or more | 670 (15.5%) | 2,460 (30.7%) |
| Total | 4,320 (100.0%) | 7,999 (100.0%) |
Property Value to Household Income Ratio in Sagadahoc County
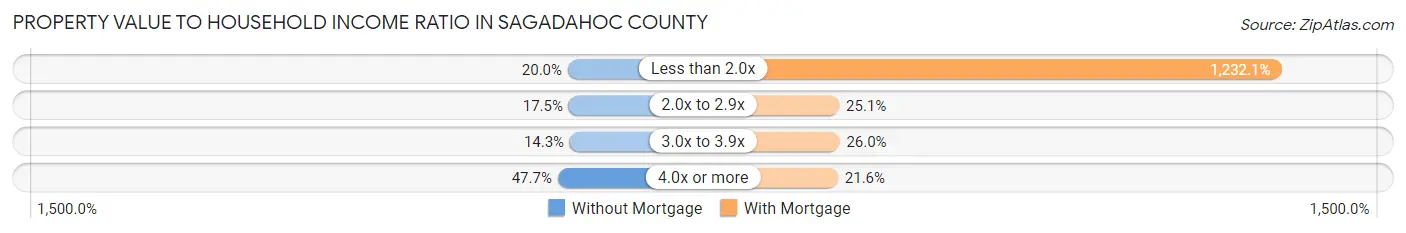
| Value-to-Income Ratio | Without Mortgage | With Mortgage |
| Less than 2.0x | 865 (20.0%) | 98,558 (1,232.1%) |
| 2.0x to 2.9x | 754 (17.4%) | 2,009 (25.1%) |
| 3.0x to 3.9x | 619 (14.3%) | 2,077 (26.0%) |
| 4.0x or more | 2,061 (47.7%) | 1,731 (21.6%) |
| Total | 4,320 (100.0%) | 7,999 (100.0%) |
Real Estate Taxes by Mortgage Status in Sagadahoc County
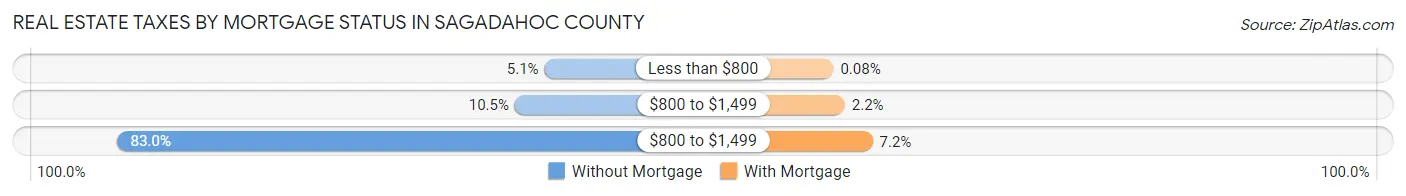
| Property Taxes | Without Mortgage | With Mortgage |
| Less than $800 | 218 (5.1%) | 6 (0.1%) |
| $800 to $1,499 | 452 (10.5%) | 173 (2.2%) |
| $800 to $1,499 | 3,586 (83.0%) | 578 (7.2%) |
| Total | 4,320 (100.0%) | 7,999 (100.0%) |
Health & Disability in Sagadahoc County
Health Insurance Coverage by Age in Sagadahoc County
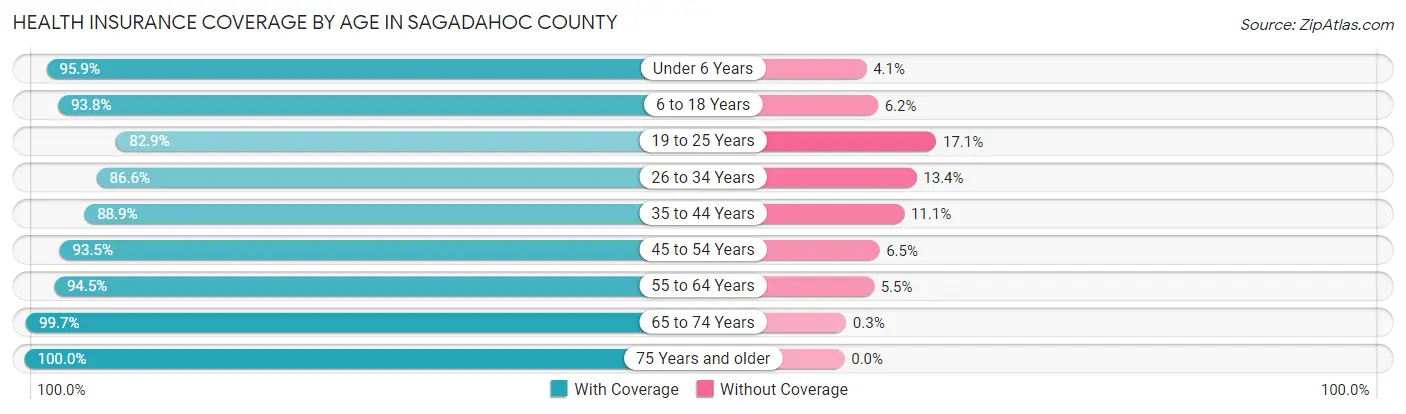
| Age Bracket | With Coverage | Without Coverage |
| Under 6 Years | 1,946 (95.9%) | 83 (4.1%) |
| 6 to 18 Years | 4,679 (93.8%) | 311 (6.2%) |
| 19 to 25 Years | 1,880 (82.9%) | 388 (17.1%) |
| 26 to 34 Years | 3,715 (86.6%) | 577 (13.4%) |
| 35 to 44 Years | 3,761 (88.9%) | 471 (11.1%) |
| 45 to 54 Years | 4,293 (93.5%) | 299 (6.5%) |
| 55 to 64 Years | 5,503 (94.5%) | 319 (5.5%) |
| 65 to 74 Years | 5,013 (99.7%) | 15 (0.3%) |
| 75 Years and older | 3,453 (100.0%) | 0 (0.0%) |
| Total | 34,243 (93.3%) | 2,463 (6.7%) |
Health Insurance Coverage by Citizenship Status in Sagadahoc County
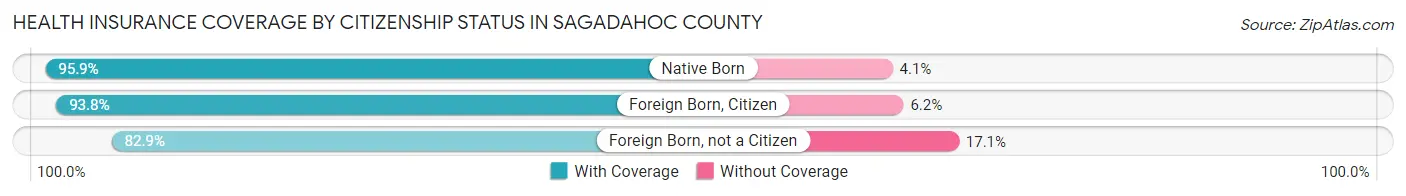
| Citizenship Status | With Coverage | Without Coverage |
| Native Born | 1,946 (95.9%) | 83 (4.1%) |
| Foreign Born, Citizen | 4,679 (93.8%) | 311 (6.2%) |
| Foreign Born, not a Citizen | 1,880 (82.9%) | 388 (17.1%) |
Health Insurance Coverage by Household Income in Sagadahoc County
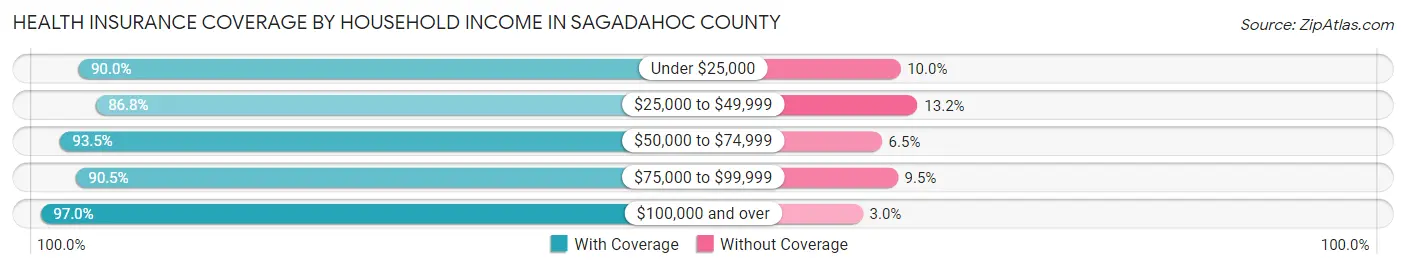
| Household Income | With Coverage | Without Coverage |
| Under $25,000 | 3,568 (90.0%) | 397 (10.0%) |
| $25,000 to $49,999 | 3,969 (86.8%) | 605 (13.2%) |
| $50,000 to $74,999 | 5,797 (93.5%) | 405 (6.5%) |
| $75,000 to $99,999 | 5,639 (90.5%) | 593 (9.5%) |
| $100,000 and over | 15,167 (97.0%) | 463 (3.0%) |
Public vs Private Health Insurance Coverage by Age in Sagadahoc County
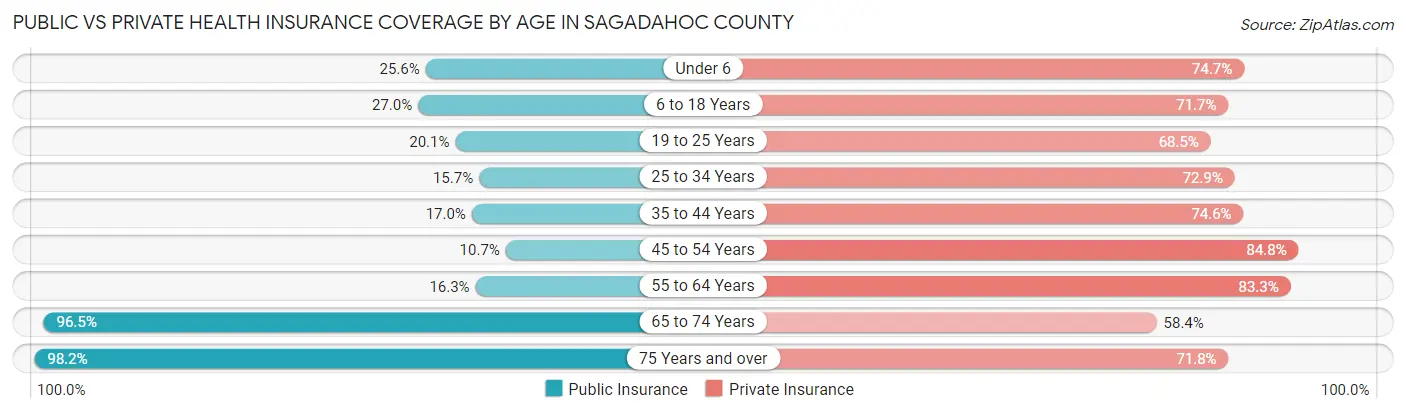
| Age Bracket | Public Insurance | Private Insurance |
| Under 6 | 519 (25.6%) | 1,515 (74.7%) |
| 6 to 18 Years | 1,346 (27.0%) | 3,580 (71.7%) |
| 19 to 25 Years | 455 (20.1%) | 1,553 (68.5%) |
| 25 to 34 Years | 672 (15.7%) | 3,130 (72.9%) |
| 35 to 44 Years | 720 (17.0%) | 3,155 (74.6%) |
| 45 to 54 Years | 492 (10.7%) | 3,893 (84.8%) |
| 55 to 64 Years | 950 (16.3%) | 4,849 (83.3%) |
| 65 to 74 Years | 4,851 (96.5%) | 2,938 (58.4%) |
| 75 Years and over | 3,391 (98.2%) | 2,478 (71.8%) |
| Total | 13,396 (36.5%) | 27,091 (73.8%) |
Disability Status by Sex by Age in Sagadahoc County
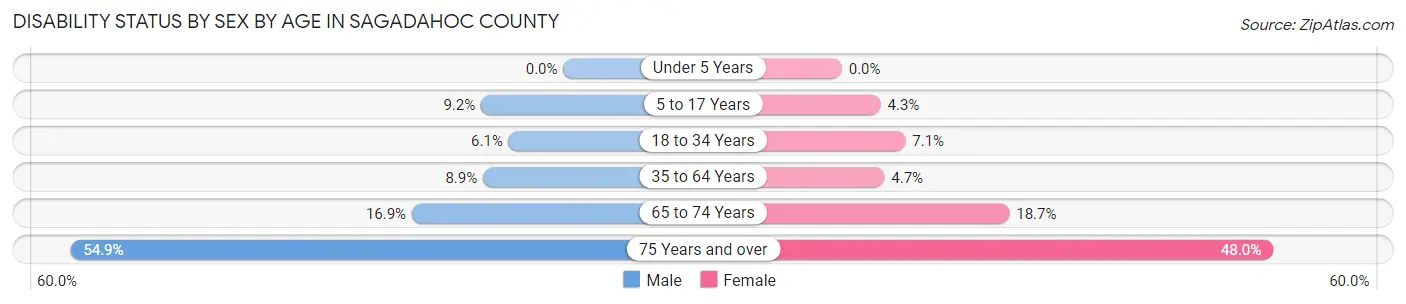
| Age Bracket | Male | Female |
| Under 5 Years | 0 (0.0%) | 0 (0.0%) |
| 5 to 17 Years | 236 (9.2%) | 106 (4.3%) |
| 18 to 34 Years | 214 (6.1%) | 234 (7.1%) |
| 35 to 64 Years | 646 (8.9%) | 352 (4.7%) |
| 65 to 74 Years | 402 (16.9%) | 493 (18.6%) |
| 75 Years and over | 852 (54.9%) | 913 (48.0%) |
Disability Class by Sex by Age in Sagadahoc County
Disability Class: Hearing Difficulty
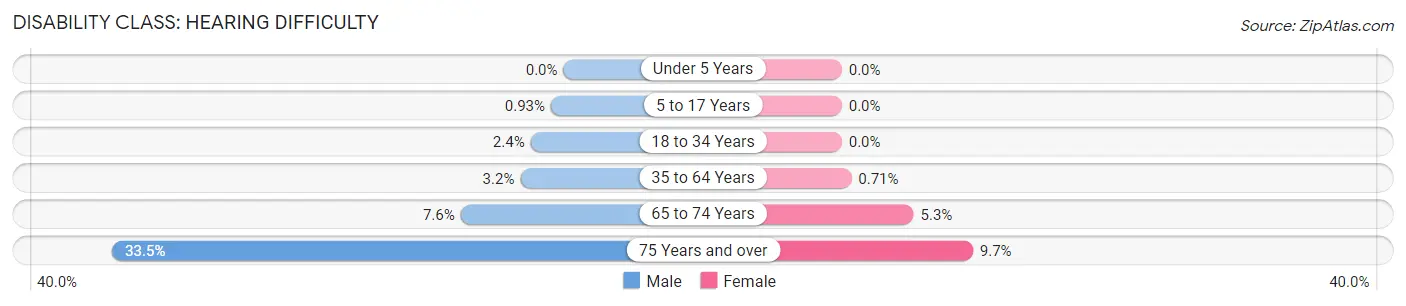
| Age Bracket | Male | Female |
| Under 5 Years | 0 (0.0%) | 0 (0.0%) |
| 5 to 17 Years | 24 (0.9%) | 0 (0.0%) |
| 18 to 34 Years | 86 (2.4%) | 0 (0.0%) |
| 35 to 64 Years | 231 (3.2%) | 53 (0.7%) |
| 65 to 74 Years | 182 (7.6%) | 141 (5.3%) |
| 75 Years and over | 520 (33.5%) | 185 (9.7%) |
Disability Class: Vision Difficulty
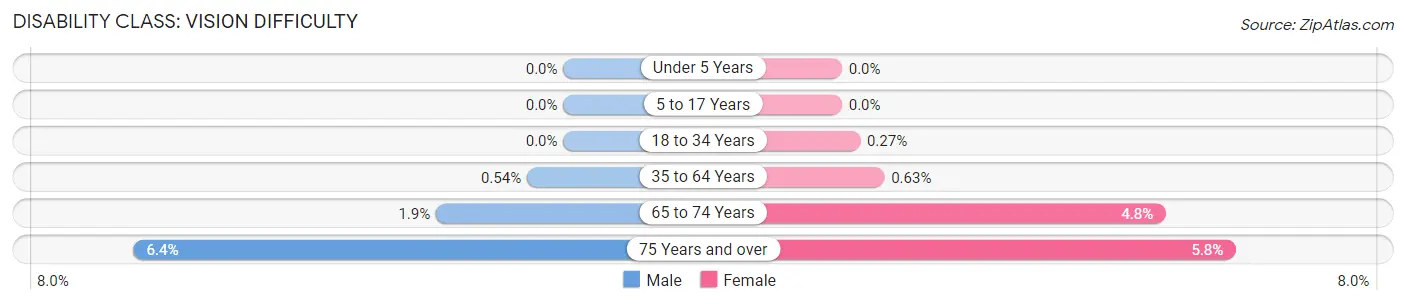
| Age Bracket | Male | Female |
| Under 5 Years | 0 (0.0%) | 0 (0.0%) |
| 5 to 17 Years | 0 (0.0%) | 0 (0.0%) |
| 18 to 34 Years | 0 (0.0%) | 9 (0.3%) |
| 35 to 64 Years | 39 (0.5%) | 47 (0.6%) |
| 65 to 74 Years | 45 (1.9%) | 127 (4.8%) |
| 75 Years and over | 99 (6.4%) | 111 (5.8%) |
Disability Class: Cognitive Difficulty
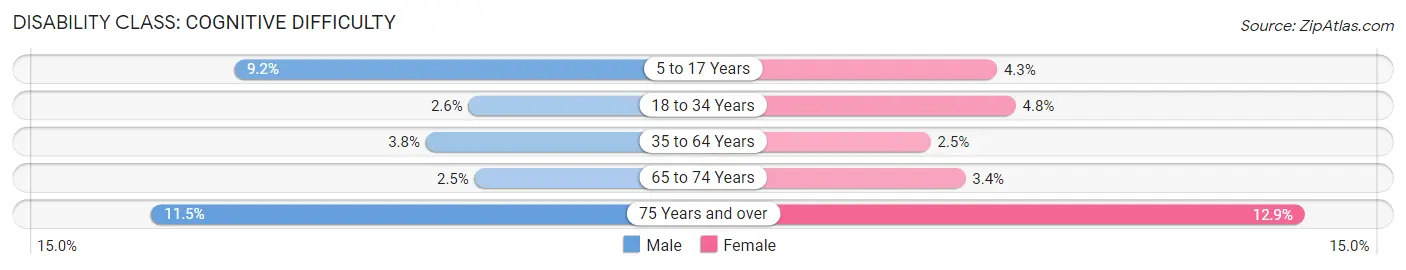
| Age Bracket | Male | Female |
| 5 to 17 Years | 236 (9.2%) | 106 (4.3%) |
| 18 to 34 Years | 93 (2.6%) | 160 (4.8%) |
| 35 to 64 Years | 277 (3.8%) | 183 (2.5%) |
| 65 to 74 Years | 59 (2.5%) | 91 (3.4%) |
| 75 Years and over | 178 (11.5%) | 245 (12.9%) |
Disability Class: Ambulatory Difficulty
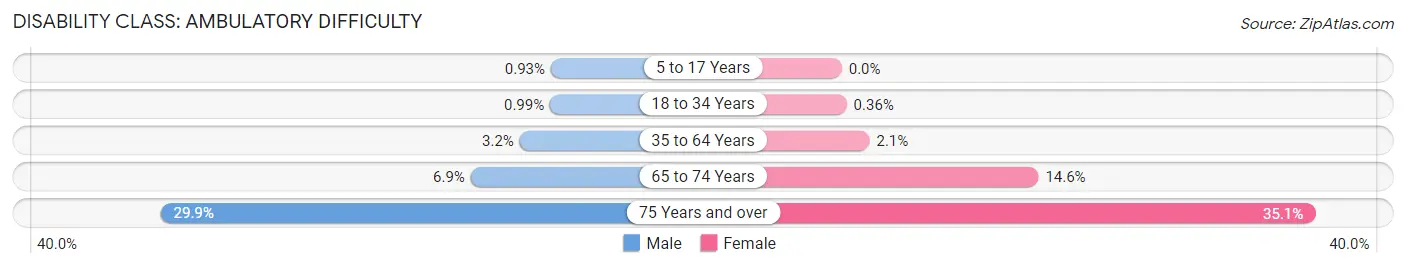
| Age Bracket | Male | Female |
| 5 to 17 Years | 24 (0.9%) | 0 (0.0%) |
| 18 to 34 Years | 35 (1.0%) | 12 (0.4%) |
| 35 to 64 Years | 234 (3.2%) | 153 (2.1%) |
| 65 to 74 Years | 164 (6.9%) | 386 (14.6%) |
| 75 Years and over | 464 (29.9%) | 668 (35.1%) |
Disability Class: Self-Care Difficulty
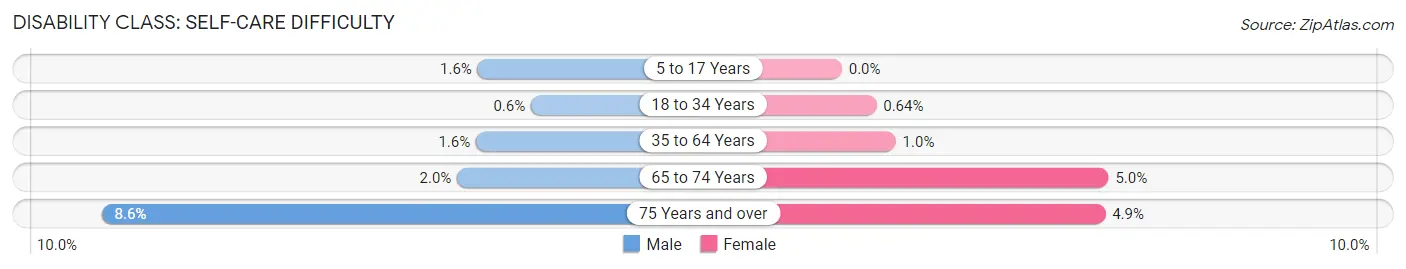
| Age Bracket | Male | Female |
| 5 to 17 Years | 41 (1.6%) | 0 (0.0%) |
| 18 to 34 Years | 21 (0.6%) | 21 (0.6%) |
| 35 to 64 Years | 117 (1.6%) | 74 (1.0%) |
| 65 to 74 Years | 47 (2.0%) | 131 (5.0%) |
| 75 Years and over | 133 (8.6%) | 93 (4.9%) |
Technology Access in Sagadahoc County
Computing Device Access in Sagadahoc County
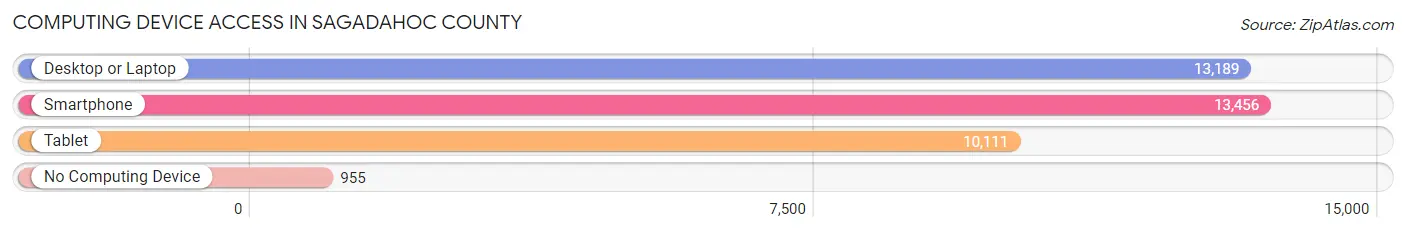
| Device Type | # Households | % Households |
| Desktop or Laptop | 13,189 | 82.1% |
| Smartphone | 13,456 | 83.8% |
| Tablet | 10,111 | 63.0% |
| No Computing Device | 955 | 5.9% |
| Total | 16,060 | 100.0% |
Internet Access in Sagadahoc County
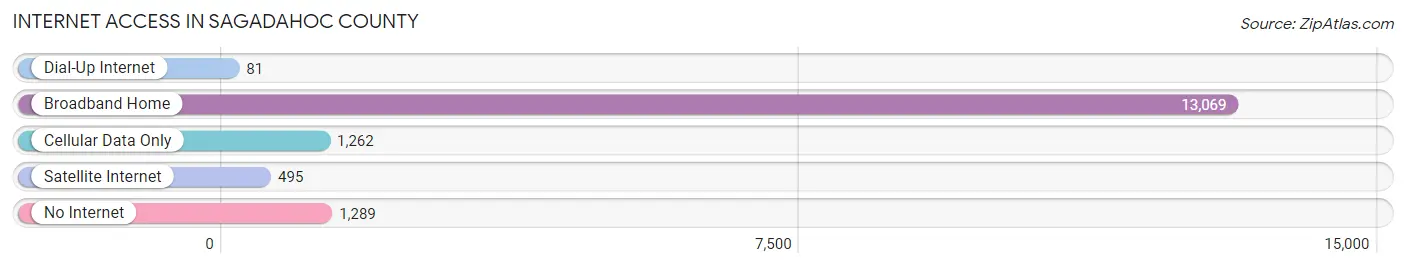
| Internet Type | # Households | % Households |
| Dial-Up Internet | 81 | 0.5% |
| Broadband Home | 13,069 | 81.4% |
| Cellular Data Only | 1,262 | 7.9% |
| Satellite Internet | 495 | 3.1% |
| No Internet | 1,289 | 8.0% |
| Total | 16,060 | 100.0% |
Sagadahoc County Summary
Sagadahoc County is located in the state of Maine, in the United States of America. It is bordered by the Atlantic Ocean to the east, Lincoln County to the south, Kennebec County to the west, and Androscoggin County to the north. The county seat is Bath, and the county has a total area of 517 square miles. As of the 2010 census, the population was 35,293.
Geography
Sagadahoc County is located in the Mid-Coast region of Maine. It is bordered by the Atlantic Ocean to the east, Lincoln County to the south, Kennebec County to the west, and Androscoggin County to the north. The county has a total area of 517 square miles, of which 486 square miles is land and 31 square miles is water. The highest point in the county is Mount Megunticook, which has an elevation of 1,385 feet.
The county is home to several rivers, including the Kennebec River, the Sheepscot River, the Androscoggin River, and the Cathance River. The county also contains several lakes, including Lake St. George, Lake Moxie, and Lake Cobbosseecontee.
The county is home to several state parks, including Reid State Park, Popham Beach State Park, and Bradbury Mountain State Park.
Demographics
As of the 2010 census, the population of Sagadahoc County was 35,293. The racial makeup of the county was 94.3% White, 1.3% African American, 0.5% Native American, 1.2% Asian, 0.1% Pacific Islander, 0.7% from other races, and 1.9% from two or more races. Hispanic or Latino of any race were 2.2% of the population.
The median income for a household in the county was $45,945, and the median income for a family was $54,945. The per capita income for the county was $25,945. About 8.3% of families and 11.2% of the population were below the poverty line, including 15.2% of those under age 18 and 8.2% of those age 65 or over.
Economy
Sagadahoc County is home to several industries, including manufacturing, tourism, and fishing. The county is home to several manufacturing companies, including Bath Iron Works, which produces naval vessels, and the Brunswick Naval Air Station, which produces aircraft.
The county is also home to several tourist attractions, including Reid State Park, Popham Beach State Park, and Bradbury Mountain State Park. The county is also home to several lighthouses, including the Pemaquid Point Lighthouse and the Seguin Island Lighthouse.
The county is also home to several fishing villages, including Boothbay Harbor, Port Clyde, and Tenants Harbor. The county is home to several seafood processing plants, including the Port Clyde Fresh Catch and the Tenants Harbor Lobster Co-op.
History
Sagadahoc County was established in 1854, and was named after the Sagadahoc River, which was named by the Abenaki Indians. The county was originally part of Lincoln County, and was created to provide better access to the county seat of Bath.
The county was home to several Native American tribes, including the Abenaki, Penobscot, and Passamaquoddy. The first European settlers arrived in the area in the 1620s, and the county was officially established in 1854.
The county was home to several shipbuilding companies, including Bath Iron Works, which was founded in 1884. The company is still in operation today, and is one of the largest employers in the county.
The county was also home to several military installations, including the Brunswick Naval Air Station, which was established in 1942. The base was closed in 2011, and is now home to the Brunswick Landing Marina.
The county is also home to several lighthouses, including the Pemaquid Point Lighthouse, which was built in 1827, and the Seguin Island Lighthouse, which was built in 1795.
Sagadahoc County is home to several tourist attractions, including Reid State Park, Popham Beach State Park, and Bradbury Mountain State Park. The county is also home to several fishing villages, including Boothbay Harbor, Port Clyde, and Tenants Harbor.
Common Questions
What is Per Capita Income in Sagadahoc County?
Per Capita income in Sagadahoc County is $40,950.
What is the Median Family Income in Sagadahoc County?
Median Family Income in Sagadahoc County is $91,645.
What is the Median Household income in Sagadahoc County?
Median Household Income in Sagadahoc County is $77,591.
What is Income or Wage Gap in Sagadahoc County?
Income or Wage Gap in Sagadahoc County is 22.3%.
Women in Sagadahoc County earn 77.7 cents for every dollar earned by a man.
What is Family Income Deficit in Sagadahoc County?
Family Income Deficit in Sagadahoc County is $8,623.
Families that are below poverty line in Sagadahoc County earn $8,623 less on average than the poverty threshold level.
What is Inequality or Gini Index in Sagadahoc County?
Inequality or Gini Index in Sagadahoc County is 0.42.
What is the Total Population of Sagadahoc County?
Total Population of Sagadahoc County is 36,868.
What is the Total Male Population of Sagadahoc County?
Total Male Population of Sagadahoc County is 18,230.
What is the Total Female Population of Sagadahoc County?
Total Female Population of Sagadahoc County is 18,638.
What is the Ratio of Males per 100 Females in Sagadahoc County?
There are 97.81 Males per 100 Females in Sagadahoc County.
What is the Ratio of Females per 100 Males in Sagadahoc County?
There are 102.24 Females per 100 Males in Sagadahoc County.
What is the Median Population Age in Sagadahoc County?
Median Population Age in Sagadahoc County is 46.7 Years.
What is the Average Family Size in Sagadahoc County
Average Family Size in Sagadahoc County is 2.7 People.
What is the Average Household Size in Sagadahoc County
Average Household Size in Sagadahoc County is 2.3 People.
How Large is the Labor Force in Sagadahoc County?
There are 19,974 People in the Labor Forcein in Sagadahoc County.
What is the Percentage of People in the Labor Force in Sagadahoc County?
64.4% of People are in the Labor Force in Sagadahoc County.
What is the Unemployment Rate in Sagadahoc County?
Unemployment Rate in Sagadahoc County is 4.4%.