Somerset County, ME Map & Demographics
Somerset County Overview
$31,348
PER CAPITA INCOME
$70,093
AVG FAMILY INCOME
$53,527
AVG HOUSEHOLD INCOME
34.6%
WAGE / INCOME GAP [ % ]
65.4¢/ $1
WAGE / INCOME GAP [ $ ]
$6,738
FAMILY INCOME DEFICIT
0.46
INEQUALITY / GINI INDEX
50,656
TOTAL POPULATION
25,290
MALE POPULATION
25,366
FEMALE POPULATION
99.70
MALES / 100 FEMALES
100.30
FEMALES / 100 MALES
47.0
MEDIAN AGE
2.8
AVG FAMILY SIZE
2.3
AVG HOUSEHOLD SIZE
23,643
LABOR FORCE [ PEOPLE ]
55.6%
PERCENT IN LABOR FORCE
4.2%
UNEMPLOYMENT RATE
Somerset County Area Codes
Income in Somerset County
Income Overview in Somerset County
Per Capita Income in Somerset County is $31,348, while median incomes of families and households are $70,093 and $53,527 respectively.
| Characteristic | Number | Measure |
| Per Capita Income | 50,656 | $31,348 |
| Median Family Income | 13,480 | $70,093 |
| Mean Family Income | 13,480 | $88,908 |
| Median Household Income | 22,074 | $53,527 |
| Mean Household Income | 22,074 | $71,414 |
| Income Deficit | 13,480 | $6,738 |
| Wage / Income Gap (%) | 50,656 | 34.55% |
| Wage / Income Gap ($) | 50,656 | 65.45¢ per $1 |
| Gini / Inequality Index | 50,656 | 0.46 |
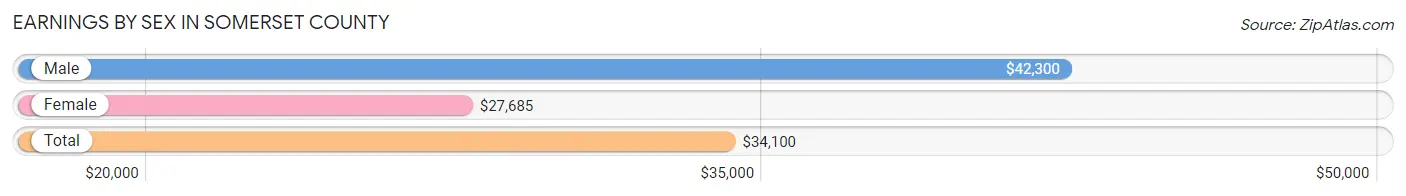
Earnings by Sex in Somerset County
Average Earnings in Somerset County are $34,100, $42,300 for men and $27,685 for women, a difference of 34.5%.
| Sex | Number | Average Earnings |
| Male | 13,520 (53.4%) | $42,300 |
| Female | 11,781 (46.6%) | $27,685 |
| Total | 25,301 (100.0%) | $34,100 |
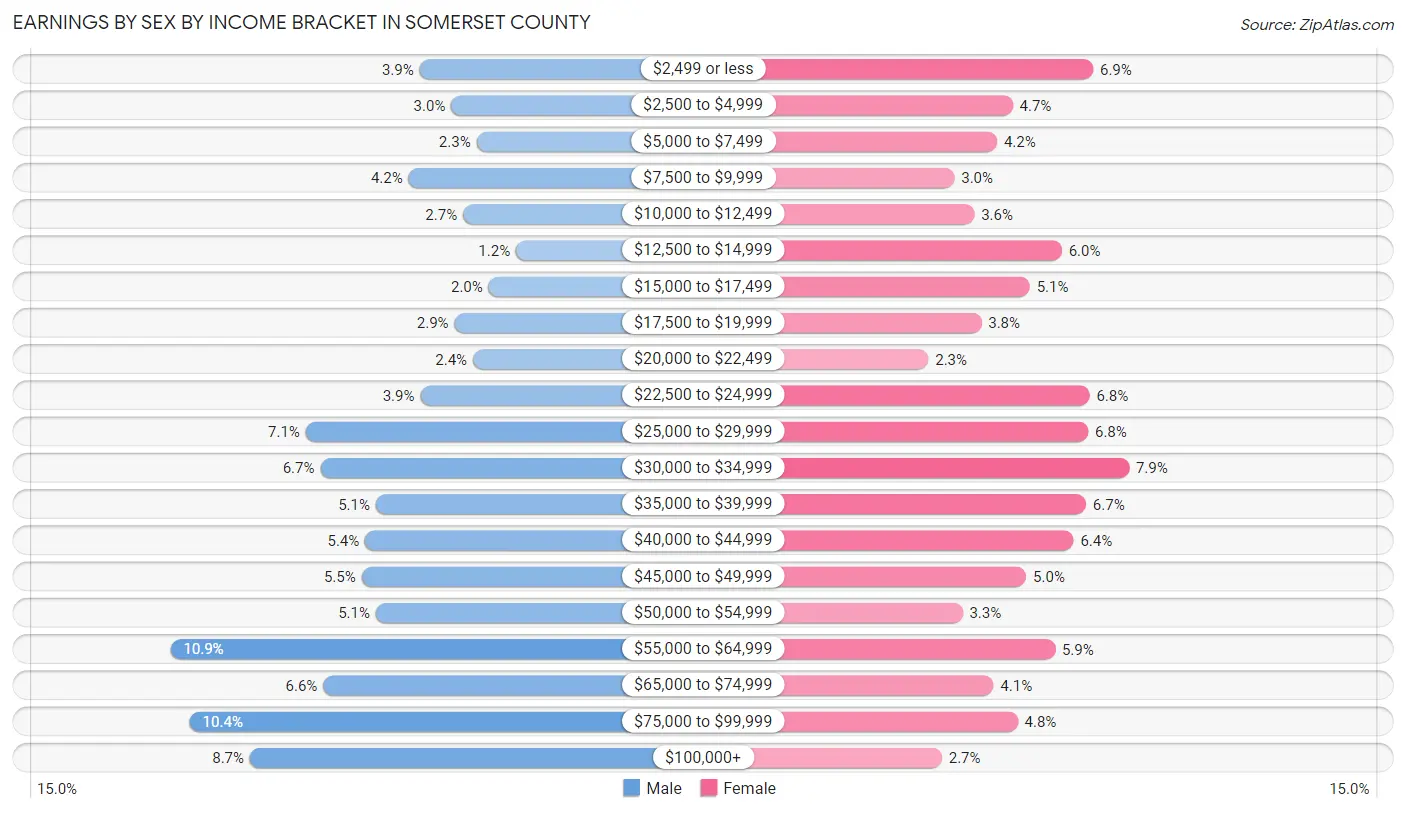
Earnings by Sex by Income Bracket in Somerset County
The most common earnings brackets in Somerset County are $55,000 to $64,999 for men (1,474 | 10.9%) and $30,000 to $34,999 for women (934 | 7.9%).
| Income | Male | Female |
| $2,499 or less | 527 (3.9%) | 815 (6.9%) |
| $2,500 to $4,999 | 407 (3.0%) | 549 (4.7%) |
| $5,000 to $7,499 | 311 (2.3%) | 497 (4.2%) |
| $7,500 to $9,999 | 569 (4.2%) | 356 (3.0%) |
| $10,000 to $12,499 | 362 (2.7%) | 422 (3.6%) |
| $12,500 to $14,999 | 161 (1.2%) | 711 (6.0%) |
| $15,000 to $17,499 | 265 (2.0%) | 605 (5.1%) |
| $17,500 to $19,999 | 395 (2.9%) | 445 (3.8%) |
| $20,000 to $22,499 | 325 (2.4%) | 270 (2.3%) |
| $22,500 to $24,999 | 524 (3.9%) | 803 (6.8%) |
| $25,000 to $29,999 | 960 (7.1%) | 799 (6.8%) |
| $30,000 to $34,999 | 905 (6.7%) | 934 (7.9%) |
| $35,000 to $39,999 | 693 (5.1%) | 792 (6.7%) |
| $40,000 to $44,999 | 734 (5.4%) | 751 (6.4%) |
| $45,000 to $49,999 | 748 (5.5%) | 594 (5.0%) |
| $50,000 to $54,999 | 694 (5.1%) | 383 (3.3%) |
| $55,000 to $64,999 | 1,474 (10.9%) | 689 (5.9%) |
| $65,000 to $74,999 | 894 (6.6%) | 485 (4.1%) |
| $75,000 to $99,999 | 1,400 (10.4%) | 566 (4.8%) |
| $100,000+ | 1,172 (8.7%) | 315 (2.7%) |
| Total | 13,520 (100.0%) | 11,781 (100.0%) |
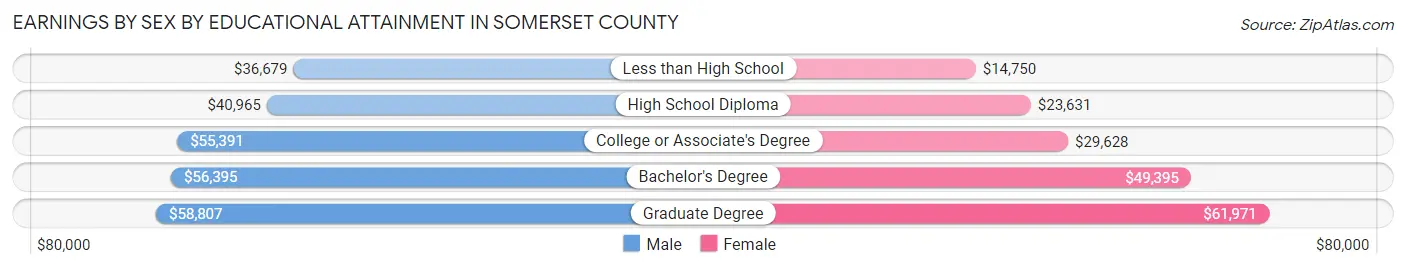
Earnings by Sex by Educational Attainment in Somerset County
Average earnings in Somerset County are $46,081 for men and $30,438 for women, a difference of 34.0%. Men with an educational attainment of graduate degree enjoy the highest average annual earnings of $58,807, while those with less than high school education earn the least with $36,679. Women with an educational attainment of graduate degree earn the most with the average annual earnings of $61,971, while those with less than high school education have the smallest earnings of $14,750.
| Educational Attainment | Male Income | Female Income |
| Less than High School | $36,679 | $14,750 |
| High School Diploma | $40,965 | $23,631 |
| College or Associate's Degree | $55,391 | $29,628 |
| Bachelor's Degree | $56,395 | $49,395 |
| Graduate Degree | $58,807 | $61,971 |
| Total | $46,081 | $30,438 |
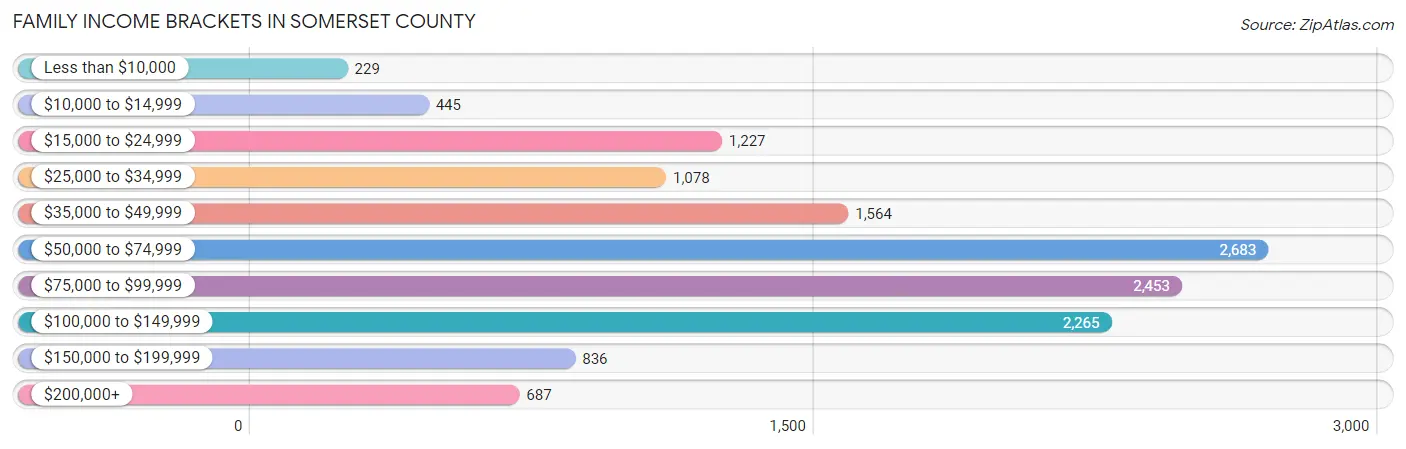
Family Income in Somerset County
Family Income Brackets in Somerset County
According to the Somerset County family income data, there are 2,683 families falling into the $50,000 to $74,999 income range, which is the most common income bracket and makes up 19.9% of all families. Conversely, the less than $10,000 income bracket is the least frequent group with only 229 families (1.7%) belonging to this category.
| Income Bracket | # Families | % Families |
| Less than $10,000 | 229 | 1.7% |
| $10,000 to $14,999 | 445 | 3.3% |
| $15,000 to $24,999 | 1,227 | 9.1% |
| $25,000 to $34,999 | 1,078 | 8.0% |
| $35,000 to $49,999 | 1,564 | 11.6% |
| $50,000 to $74,999 | 2,683 | 19.9% |
| $75,000 to $99,999 | 2,453 | 18.2% |
| $100,000 to $149,999 | 2,265 | 16.8% |
| $150,000 to $199,999 | 836 | 6.2% |
| $200,000+ | 687 | 5.1% |
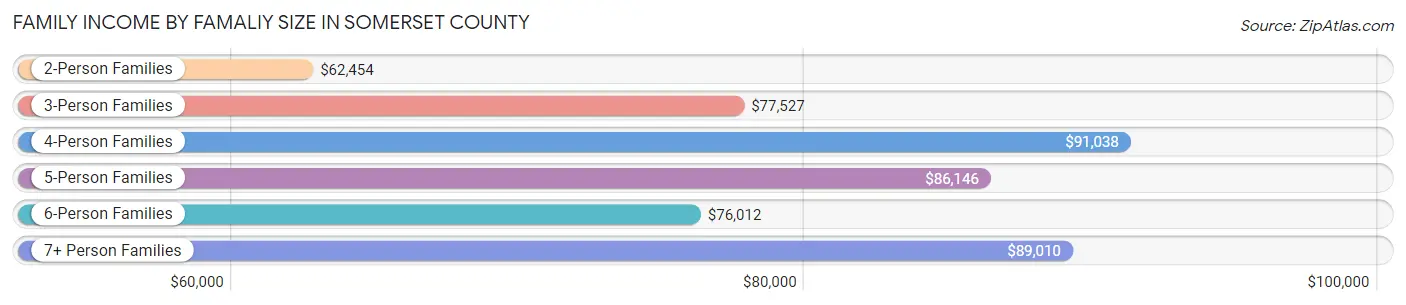
Family Income by Famaliy Size in Somerset County
4-person families (1,702 | 12.6%) account for the highest median family income in Somerset County with $91,038 per family, while 2-person families (7,870 | 58.4%) have the highest median income of $31,227 per family member.
| Income Bracket | # Families | Median Income |
| 2-Person Families | 7,870 (58.4%) | $62,454 |
| 3-Person Families | 2,960 (22.0%) | $77,527 |
| 4-Person Families | 1,702 (12.6%) | $91,038 |
| 5-Person Families | 574 (4.3%) | $86,146 |
| 6-Person Families | 256 (1.9%) | $76,012 |
| 7+ Person Families | 118 (0.9%) | $89,010 |
| Total | 13,480 (100.0%) | $70,093 |
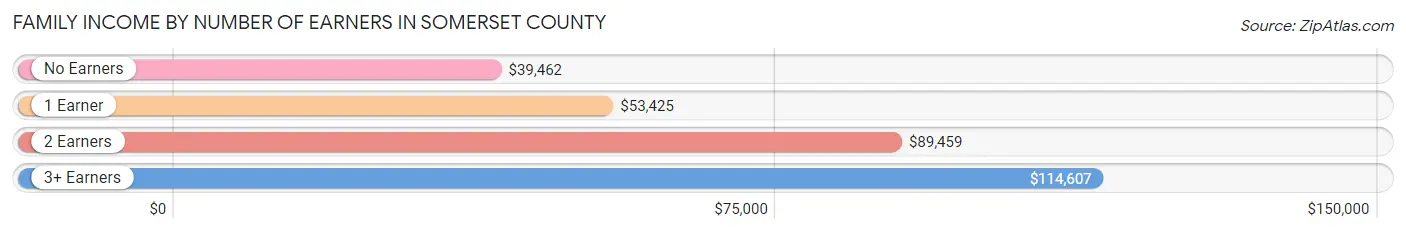
Family Income by Number of Earners in Somerset County
The median family income in Somerset County is $70,093, with families comprising 3+ earners (1,209) having the highest median family income of $114,607, while families with no earners (2,764) have the lowest median family income of $39,462, accounting for 9.0% and 20.5% of families, respectively.
| Number of Earners | # Families | Median Income |
| No Earners | 2,764 (20.5%) | $39,462 |
| 1 Earner | 4,386 (32.5%) | $53,425 |
| 2 Earners | 5,121 (38.0%) | $89,459 |
| 3+ Earners | 1,209 (9.0%) | $114,607 |
| Total | 13,480 (100.0%) | $70,093 |
Household Income in Somerset County
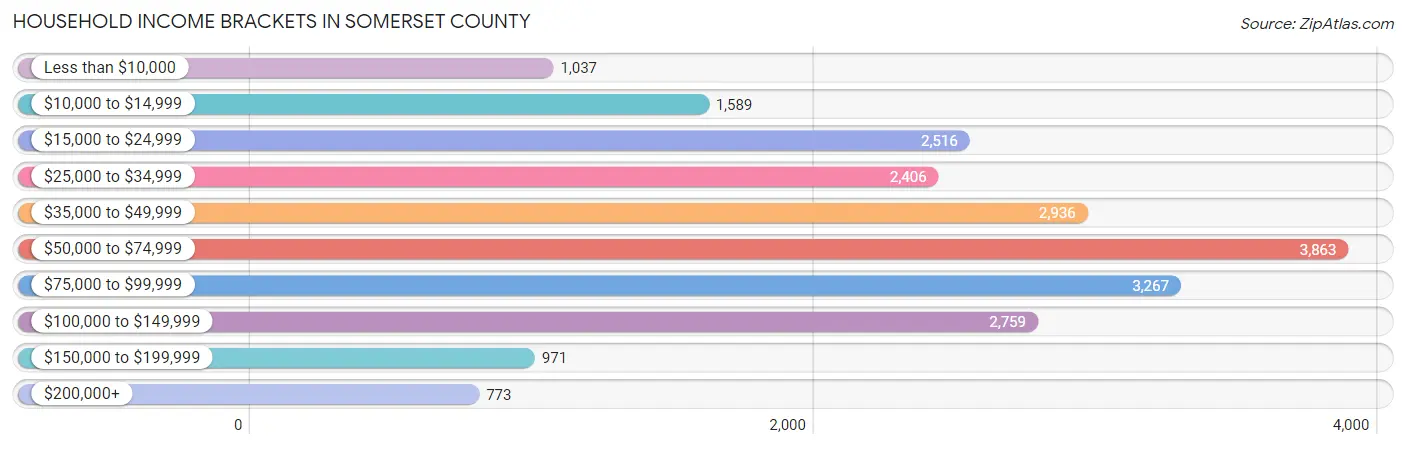
Household Income Brackets in Somerset County
With 3,863 households falling in the category, the $50,000 to $74,999 income range is the most frequent in Somerset County, accounting for 17.5% of all households. In contrast, only 773 households (3.5%) fall into the $200,000+ income bracket, making it the least populous group.
| Income Bracket | # Households | % Households |
| Less than $10,000 | 1,037 | 4.7% |
| $10,000 to $14,999 | 1,589 | 7.2% |
| $15,000 to $24,999 | 2,516 | 11.4% |
| $25,000 to $34,999 | 2,406 | 10.9% |
| $35,000 to $49,999 | 2,936 | 13.3% |
| $50,000 to $74,999 | 3,863 | 17.5% |
| $75,000 to $99,999 | 3,267 | 14.8% |
| $100,000 to $149,999 | 2,759 | 12.5% |
| $150,000 to $199,999 | 971 | 4.4% |
| $200,000+ | 773 | 3.5% |
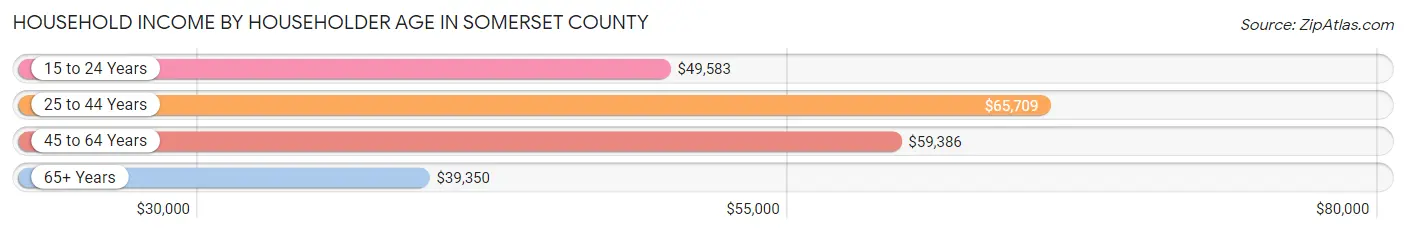
Household Income by Householder Age in Somerset County
The median household income in Somerset County is $53,527, with the highest median household income of $65,709 found in the 25 to 44 years age bracket for the primary householder. A total of 5,193 households (23.5%) fall into this category. Meanwhile, the 65+ years age bracket for the primary householder has the lowest median household income of $39,350, with 7,275 households (33.0%) in this group.
| Income Bracket | # Households | Median Income |
| 15 to 24 Years | 590 (2.7%) | $49,583 |
| 25 to 44 Years | 5,193 (23.5%) | $65,709 |
| 45 to 64 Years | 9,016 (40.8%) | $59,386 |
| 65+ Years | 7,275 (33.0%) | $39,350 |
| Total | 22,074 (100.0%) | $53,527 |
Poverty in Somerset County
Income Below Poverty by Sex and Age in Somerset County
With 15.2% poverty level for males and 18.4% for females among the residents of Somerset County, 15 year old males and 5 year old females are the most vulnerable to poverty, with 72 males (33.6%) and 154 females (37.0%) in their respective age groups living below the poverty level.
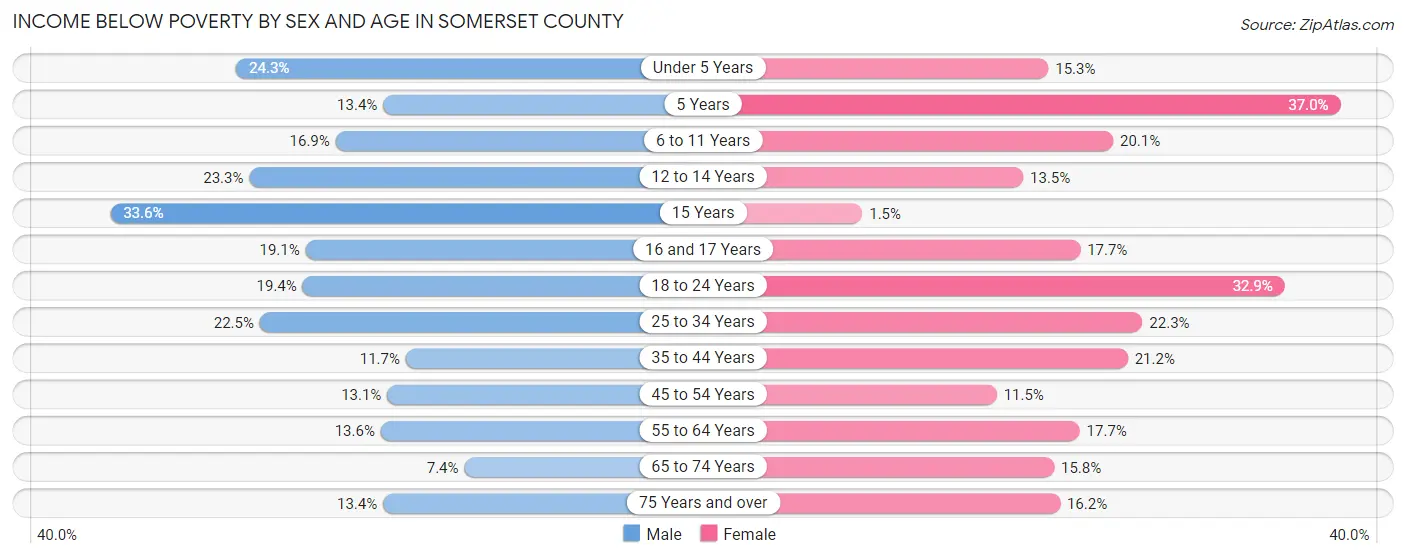
| Age Bracket | Male | Female |
| Under 5 Years | 282 (24.3%) | 178 (15.3%) |
| 5 Years | 38 (13.4%) | 154 (37.0%) |
| 6 to 11 Years | 250 (16.9%) | 254 (20.1%) |
| 12 to 14 Years | 201 (23.3%) | 88 (13.5%) |
| 15 Years | 72 (33.6%) | 4 (1.5%) |
| 16 and 17 Years | 124 (19.1%) | 108 (17.7%) |
| 18 to 24 Years | 341 (19.4%) | 530 (32.9%) |
| 25 to 34 Years | 629 (22.5%) | 606 (22.3%) |
| 35 to 44 Years | 321 (11.7%) | 606 (21.2%) |
| 45 to 54 Years | 459 (13.1%) | 404 (11.5%) |
| 55 to 64 Years | 560 (13.6%) | 729 (17.7%) |
| 65 to 74 Years | 251 (7.3%) | 529 (15.8%) |
| 75 Years and over | 244 (13.4%) | 369 (16.2%) |
| Total | 3,772 (15.2%) | 4,559 (18.4%) |
Income Above Poverty by Sex and Age in Somerset County
According to the poverty statistics in Somerset County, males aged 65 to 74 years and females aged 15 years are the age groups that are most secure financially, with 92.6% of males and 98.5% of females in these age groups living above the poverty line.
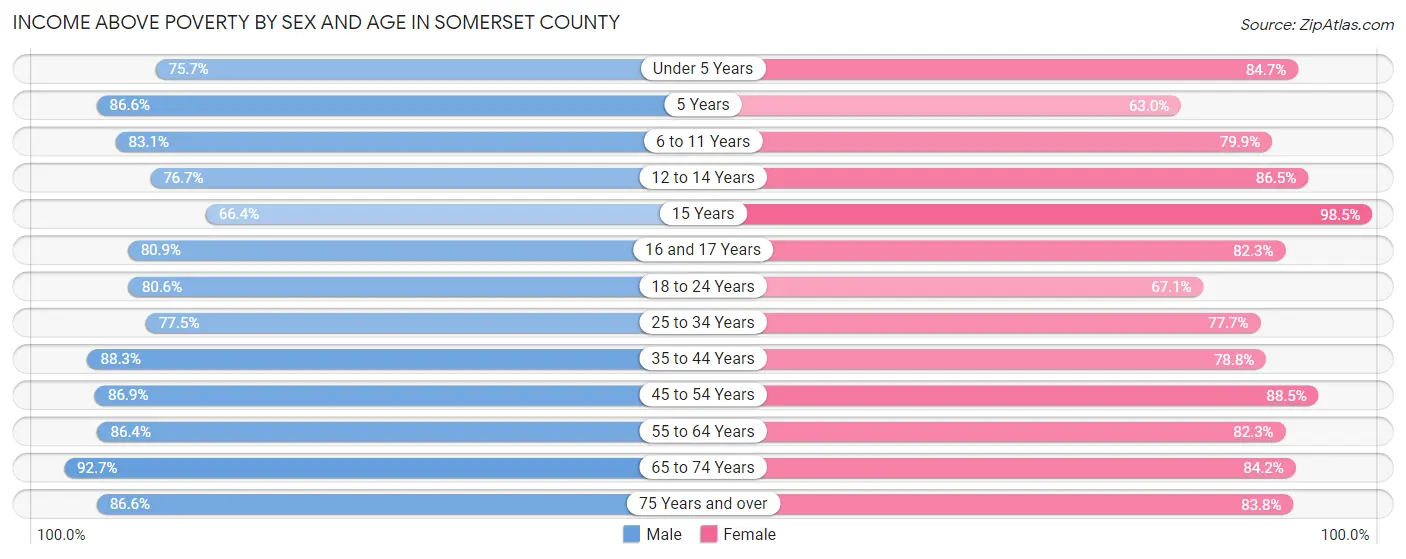
| Age Bracket | Male | Female |
| Under 5 Years | 879 (75.7%) | 983 (84.7%) |
| 5 Years | 246 (86.6%) | 262 (63.0%) |
| 6 to 11 Years | 1,228 (83.1%) | 1,007 (79.9%) |
| 12 to 14 Years | 661 (76.7%) | 566 (86.5%) |
| 15 Years | 142 (66.4%) | 260 (98.5%) |
| 16 and 17 Years | 524 (80.9%) | 502 (82.3%) |
| 18 to 24 Years | 1,420 (80.6%) | 1,082 (67.1%) |
| 25 to 34 Years | 2,162 (77.5%) | 2,109 (77.7%) |
| 35 to 44 Years | 2,423 (88.3%) | 2,248 (78.8%) |
| 45 to 54 Years | 3,050 (86.9%) | 3,109 (88.5%) |
| 55 to 64 Years | 3,569 (86.4%) | 3,399 (82.3%) |
| 65 to 74 Years | 3,165 (92.6%) | 2,828 (84.2%) |
| 75 Years and over | 1,578 (86.6%) | 1,909 (83.8%) |
| Total | 21,047 (84.8%) | 20,264 (81.6%) |
Income Below Poverty Among Married-Couple Families in Somerset County
The poverty statistics for married-couple families in Somerset County show that 5.8% or 624 of the total 10,686 families live below the poverty line. Families with 5 or more children have the highest poverty rate of 16.5%, comprising of 13 families. On the other hand, families with no children have the lowest poverty rate of 4.2%, which includes 311 families.
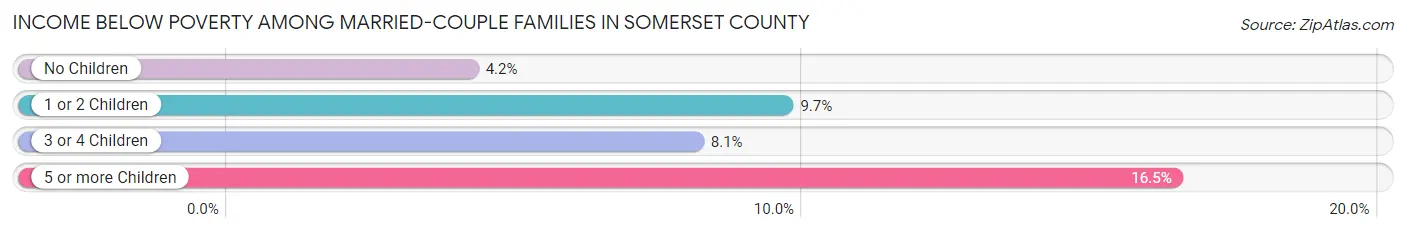
| Children | Above Poverty | Below Poverty |
| No Children | 7,115 (95.8%) | 311 (4.2%) |
| 1 or 2 Children | 2,439 (90.3%) | 261 (9.7%) |
| 3 or 4 Children | 442 (91.9%) | 39 (8.1%) |
| 5 or more Children | 66 (83.5%) | 13 (16.5%) |
| Total | 10,062 (94.2%) | 624 (5.8%) |
Income Below Poverty Among Single-Parent Households in Somerset County
According to the poverty data in Somerset County, 28.1% or 259 single-father households and 36.1% or 675 single-mother households are living below the poverty line. Among single-father households, those with 3 or 4 children have the highest poverty rate, with 31 households (38.8%) experiencing poverty. Likewise, among single-mother households, those with 5 or more children have the highest poverty rate, with 4 households (100.0%) falling below the poverty line.
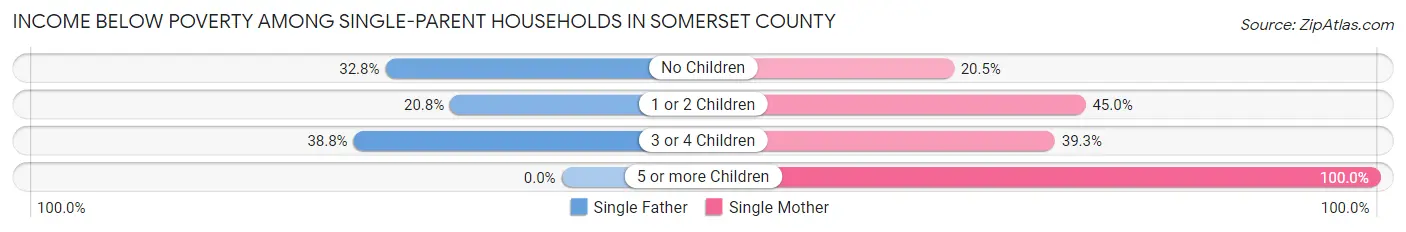
| Children | Single Father | Single Mother |
| No Children | 145 (32.8%) | 135 (20.5%) |
| 1 or 2 Children | 83 (20.7%) | 477 (45.0%) |
| 3 or 4 Children | 31 (38.8%) | 59 (39.3%) |
| 5 or more Children | 0 (0.0%) | 4 (100.0%) |
| Total | 259 (28.1%) | 675 (36.1%) |
Income Below Poverty Among Married-Couple vs Single-Parent Households in Somerset County
The poverty data for Somerset County shows that 624 of the married-couple family households (5.8%) and 934 of the single-parent households (33.4%) are living below the poverty level. Within the married-couple family households, those with 5 or more children have the highest poverty rate, with 13 households (16.5%) falling below the poverty line. Among the single-parent households, those with 5 or more children have the highest poverty rate, with 4 household (100.0%) living below poverty.
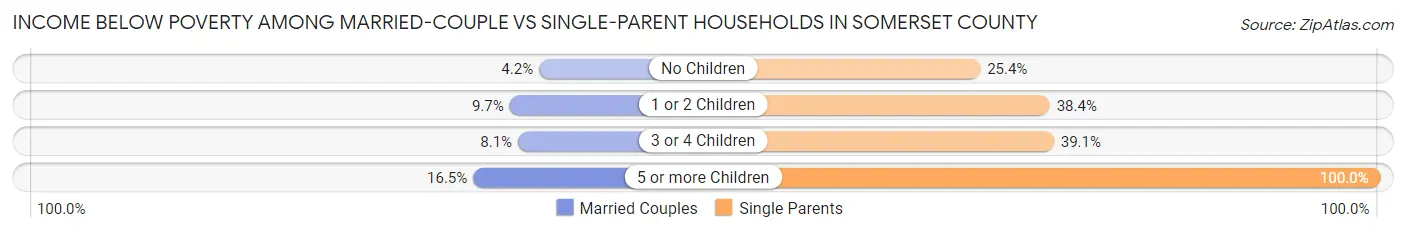
| Children | Married-Couple Families | Single-Parent Households |
| No Children | 311 (4.2%) | 280 (25.4%) |
| 1 or 2 Children | 261 (9.7%) | 560 (38.4%) |
| 3 or 4 Children | 39 (8.1%) | 90 (39.1%) |
| 5 or more Children | 13 (16.5%) | 4 (100.0%) |
| Total | 624 (5.8%) | 934 (33.4%) |
Race in Somerset County
The most populous races in Somerset County are White / Caucasian (48,441 | 95.6%), Two or more Races (1,530 | 3.0%), and Hispanic or Latino (648 | 1.3%).
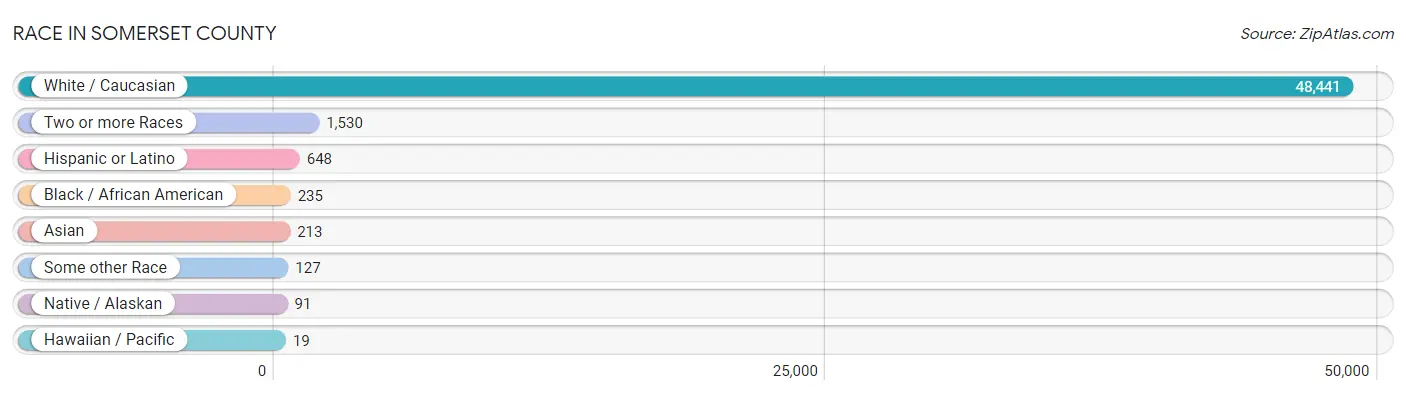
| Race | # Population | % Population |
| Asian | 213 | 0.4% |
| Black / African American | 235 | 0.5% |
| Hawaiian / Pacific | 19 | 0.0% |
| Hispanic or Latino | 648 | 1.3% |
| Native / Alaskan | 91 | 0.2% |
| White / Caucasian | 48,441 | 95.6% |
| Two or more Races | 1,530 | 3.0% |
| Some other Race | 127 | 0.3% |
| Total | 50,656 | 100.0% |
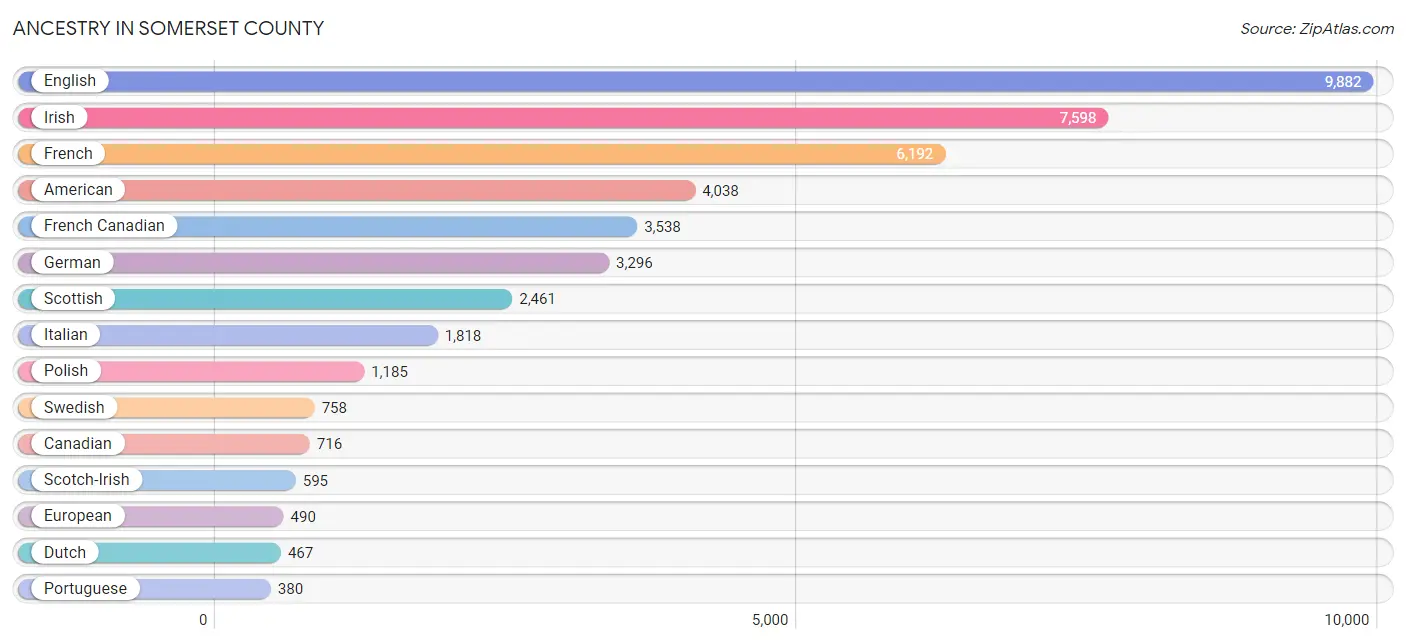
Ancestry in Somerset County
The most populous ancestries reported in Somerset County are English (9,882 | 19.5%), Irish (7,598 | 15.0%), French (6,192 | 12.2%), American (4,038 | 8.0%), and French Canadian (3,538 | 7.0%), together accounting for 61.7% of all Somerset County residents.
| Ancestry | # Population | % Population |
| African | 11 | 0.0% |
| American | 4,038 | 8.0% |
| Arab | 204 | 0.4% |
| Armenian | 105 | 0.2% |
| Assyrian / Chaldean / Syriac | 5 | 0.0% |
| Australian | 67 | 0.1% |
| Austrian | 48 | 0.1% |
| Belgian | 4 | 0.0% |
| Bhutanese | 9 | 0.0% |
| Blackfeet | 3 | 0.0% |
| British | 356 | 0.7% |
| Bulgarian | 8 | 0.0% |
| Burmese | 49 | 0.1% |
| Canadian | 716 | 1.4% |
| Celtic | 7 | 0.0% |
| Central American | 83 | 0.2% |
| Cherokee | 49 | 0.1% |
| Cheyenne | 13 | 0.0% |
| Chickasaw | 4 | 0.0% |
| Chippewa | 48 | 0.1% |
| Comanche | 3 | 0.0% |
| Croatian | 6 | 0.0% |
| Cuban | 29 | 0.1% |
| Czech | 18 | 0.0% |
| Czechoslovakian | 156 | 0.3% |
| Danish | 105 | 0.2% |
| Dutch | 467 | 0.9% |
| Eastern European | 62 | 0.1% |
| English | 9,882 | 19.5% |
| Estonian | 6 | 0.0% |
| European | 490 | 1.0% |
| Fijian | 1 | 0.0% |
| Finnish | 262 | 0.5% |
| French | 6,192 | 12.2% |
| French American Indian | 49 | 0.1% |
| French Canadian | 3,538 | 7.0% |
| German | 3,296 | 6.5% |
| Greek | 70 | 0.1% |
| Guatemalan | 62 | 0.1% |
| Hungarian | 76 | 0.2% |
| Indian (Asian) | 87 | 0.2% |
| Irish | 7,598 | 15.0% |
| Italian | 1,818 | 3.6% |
| Japanese | 8 | 0.0% |
| Korean | 237 | 0.5% |
| Lebanese | 175 | 0.4% |
| Lithuanian | 96 | 0.2% |
| Mexican | 227 | 0.4% |
| Moroccan | 5 | 0.0% |
| Native Hawaiian | 40 | 0.1% |
| Northern European | 20 | 0.0% |
| Norwegian | 291 | 0.6% |
| Pakistani | 29 | 0.1% |
| Peruvian | 3 | 0.0% |
| Polish | 1,185 | 2.3% |
| Portuguese | 380 | 0.7% |
| Puerto Rican | 198 | 0.4% |
| Romanian | 22 | 0.0% |
| Russian | 157 | 0.3% |
| Salvadoran | 21 | 0.0% |
| Scandinavian | 266 | 0.5% |
| Scotch-Irish | 595 | 1.2% |
| Scottish | 2,461 | 4.9% |
| Slavic | 7 | 0.0% |
| Slovak | 51 | 0.1% |
| South American | 3 | 0.0% |
| South American Indian | 3 | 0.0% |
| Spaniard | 30 | 0.1% |
| Spanish | 1 | 0.0% |
| Spanish American Indian | 5 | 0.0% |
| Sri Lankan | 5 | 0.0% |
| Subsaharan African | 56 | 0.1% |
| Swedish | 758 | 1.5% |
| Swiss | 12 | 0.0% |
| Syrian | 7 | 0.0% |
| Thai | 17 | 0.0% |
| Trinidadian and Tobagonian | 3 | 0.0% |
| Ukrainian | 84 | 0.2% |
| Welsh | 359 | 0.7% |
| Yugoslavian | 8 | 0.0% | View All 80 Rows |
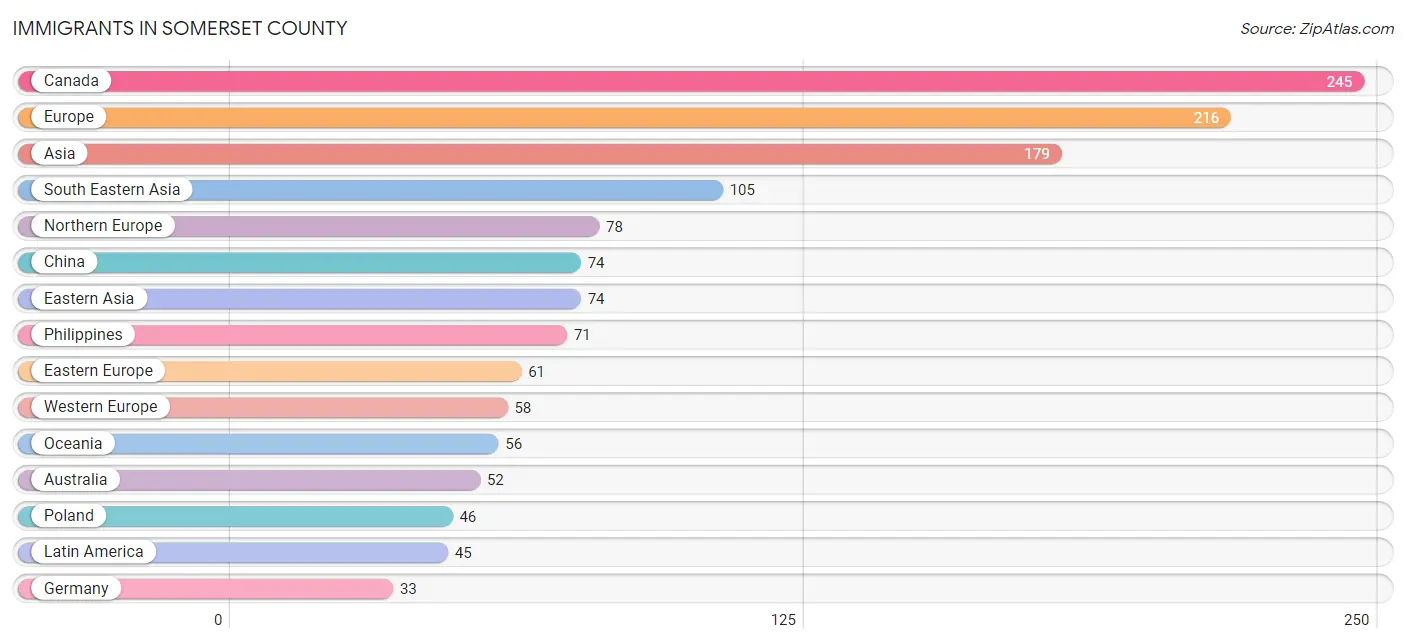
Immigrants in Somerset County
The most numerous immigrant groups reported in Somerset County came from Canada (245 | 0.5%), Europe (216 | 0.4%), Asia (179 | 0.4%), South Eastern Asia (105 | 0.2%), and Northern Europe (78 | 0.2%), together accounting for 1.6% of all Somerset County residents.
| Immigration Origin | # Population | % Population |
| Africa | 32 | 0.1% |
| Asia | 179 | 0.4% |
| Australia | 52 | 0.1% |
| Cambodia | 2 | 0.0% |
| Canada | 245 | 0.5% |
| Caribbean | 21 | 0.0% |
| Central America | 21 | 0.0% |
| China | 74 | 0.2% |
| Croatia | 15 | 0.0% |
| Cuba | 3 | 0.0% |
| Eastern Africa | 32 | 0.1% |
| Eastern Asia | 74 | 0.2% |
| Eastern Europe | 61 | 0.1% |
| England | 21 | 0.0% |
| Europe | 216 | 0.4% |
| France | 20 | 0.0% |
| Germany | 33 | 0.1% |
| Italy | 8 | 0.0% |
| Latin America | 45 | 0.1% |
| Mexico | 21 | 0.0% |
| Netherlands | 5 | 0.0% |
| Northern Europe | 78 | 0.2% |
| Norway | 17 | 0.0% |
| Oceania | 56 | 0.1% |
| Peru | 3 | 0.0% |
| Philippines | 71 | 0.1% |
| Poland | 46 | 0.1% |
| South America | 3 | 0.0% |
| South Eastern Asia | 105 | 0.2% |
| Southern Europe | 19 | 0.0% |
| Spain | 11 | 0.0% |
| Taiwan | 30 | 0.1% |
| Thailand | 29 | 0.1% |
| Trinidad and Tobago | 3 | 0.0% |
| Western Europe | 58 | 0.1% | View All 35 Rows |
Sex and Age in Somerset County
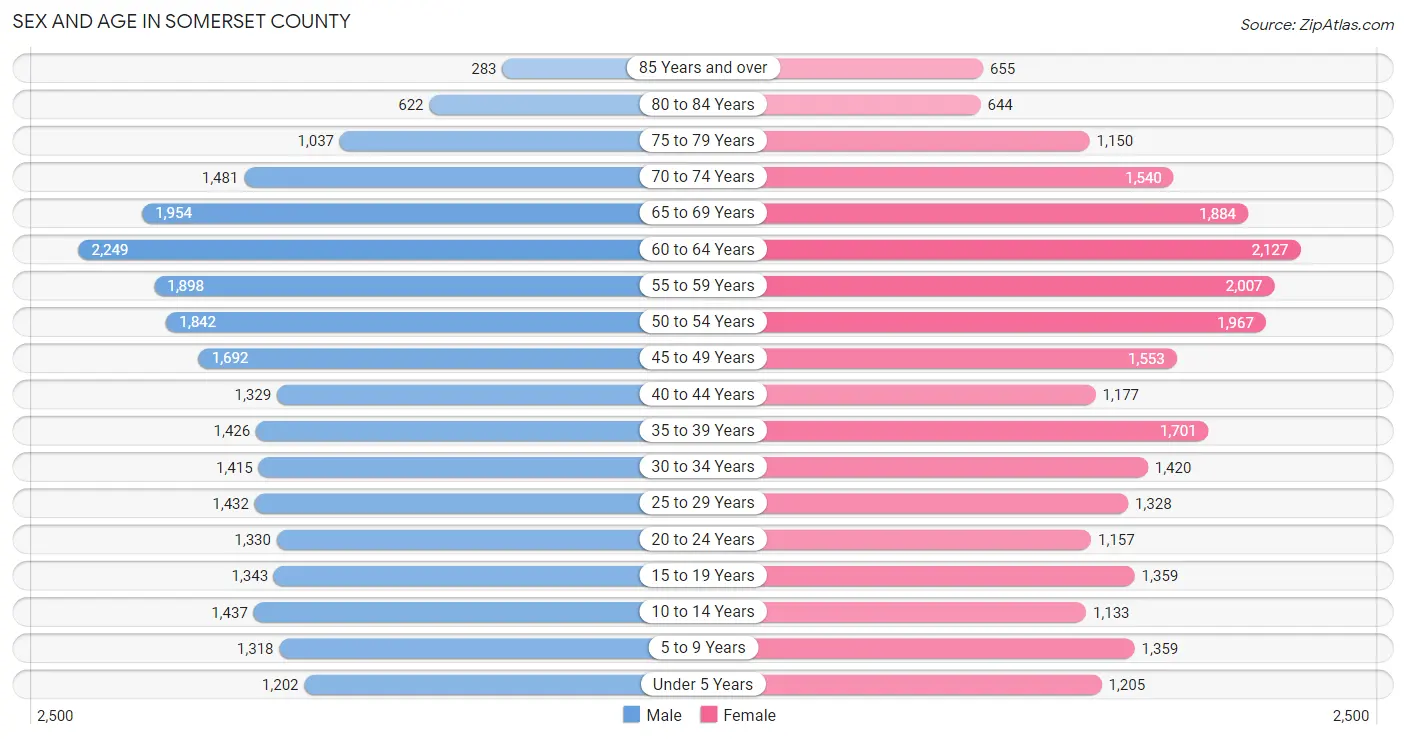
Sex and Age in Somerset County
The most populous age groups in Somerset County are 60 to 64 Years (2,249 | 8.9%) for men and 60 to 64 Years (2,127 | 8.4%) for women.
| Age Bracket | Male | Female |
| Under 5 Years | 1,202 (4.8%) | 1,205 (4.8%) |
| 5 to 9 Years | 1,318 (5.2%) | 1,359 (5.4%) |
| 10 to 14 Years | 1,437 (5.7%) | 1,133 (4.5%) |
| 15 to 19 Years | 1,343 (5.3%) | 1,359 (5.4%) |
| 20 to 24 Years | 1,330 (5.3%) | 1,157 (4.6%) |
| 25 to 29 Years | 1,432 (5.7%) | 1,328 (5.2%) |
| 30 to 34 Years | 1,415 (5.6%) | 1,420 (5.6%) |
| 35 to 39 Years | 1,426 (5.6%) | 1,701 (6.7%) |
| 40 to 44 Years | 1,329 (5.3%) | 1,177 (4.6%) |
| 45 to 49 Years | 1,692 (6.7%) | 1,553 (6.1%) |
| 50 to 54 Years | 1,842 (7.3%) | 1,967 (7.7%) |
| 55 to 59 Years | 1,898 (7.5%) | 2,007 (7.9%) |
| 60 to 64 Years | 2,249 (8.9%) | 2,127 (8.4%) |
| 65 to 69 Years | 1,954 (7.7%) | 1,884 (7.4%) |
| 70 to 74 Years | 1,481 (5.9%) | 1,540 (6.1%) |
| 75 to 79 Years | 1,037 (4.1%) | 1,150 (4.5%) |
| 80 to 84 Years | 622 (2.5%) | 644 (2.5%) |
| 85 Years and over | 283 (1.1%) | 655 (2.6%) |
| Total | 25,290 (100.0%) | 25,366 (100.0%) |
Families and Households in Somerset County
Median Family Size in Somerset County
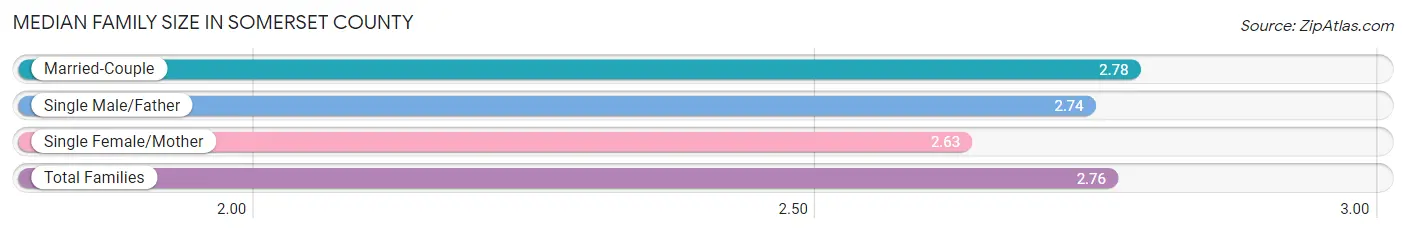
The median family size in Somerset County is 2.76 persons per family, with married-couple families (10,686 | 79.3%) accounting for the largest median family size of 2.78 persons per family. On the other hand, single female/mother families (1,872 | 13.9%) represent the smallest median family size with 2.63 persons per family.
| Family Type | # Families | Family Size |
| Married-Couple | 10,686 (79.3%) | 2.78 |
| Single Male/Father | 922 (6.8%) | 2.74 |
| Single Female/Mother | 1,872 (13.9%) | 2.63 |
| Total Families | 13,480 (100.0%) | 2.76 |
Median Household Size in Somerset County
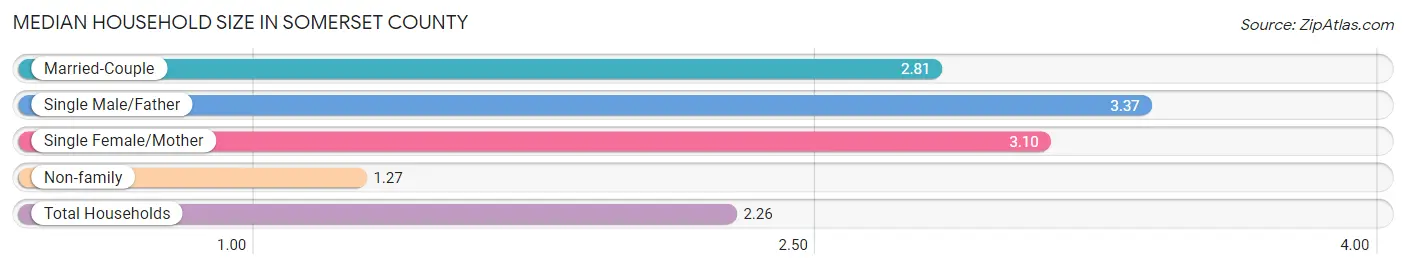
The median household size in Somerset County is 2.26 persons per household, with single male/father households (922 | 4.2%) accounting for the largest median household size of 3.37 persons per household. non-family households (8,594 | 38.9%) represent the smallest median household size with 1.27 persons per household.
| Household Type | # Households | Household Size |
| Married-Couple | 10,686 (48.4%) | 2.81 |
| Single Male/Father | 922 (4.2%) | 3.37 |
| Single Female/Mother | 1,872 (8.5%) | 3.10 |
| Non-family | 8,594 (38.9%) | 1.27 |
| Total Households | 22,074 (100.0%) | 2.26 |
Household Size by Marriage Status in Somerset County
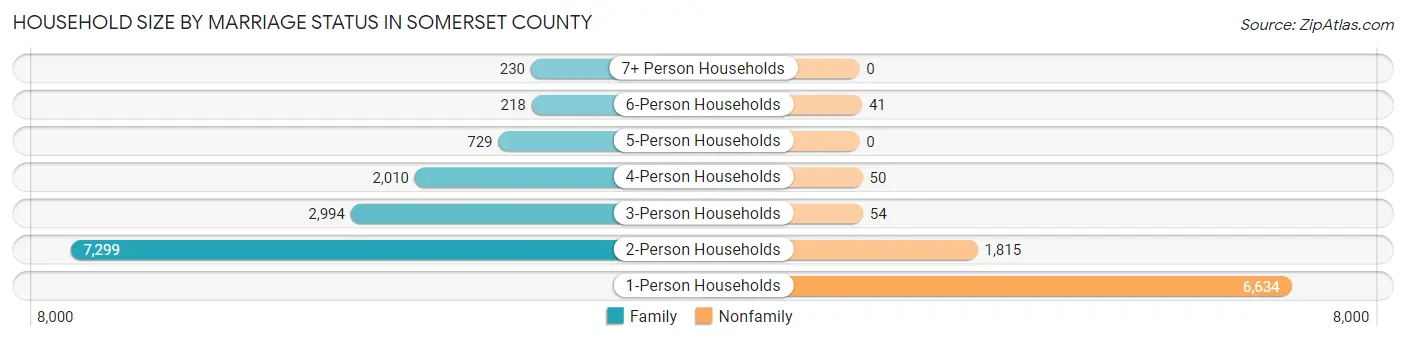
Out of a total of 22,074 households in Somerset County, 13,480 (61.1%) are family households, while 8,594 (38.9%) are nonfamily households. The most numerous type of family households are 2-person households, comprising 7,299, and the most common type of nonfamily households are 1-person households, comprising 6,634.
| Household Size | Family Households | Nonfamily Households |
| 1-Person Households | - | 6,634 (30.0%) |
| 2-Person Households | 7,299 (33.1%) | 1,815 (8.2%) |
| 3-Person Households | 2,994 (13.6%) | 54 (0.2%) |
| 4-Person Households | 2,010 (9.1%) | 50 (0.2%) |
| 5-Person Households | 729 (3.3%) | 0 (0.0%) |
| 6-Person Households | 218 (1.0%) | 41 (0.2%) |
| 7+ Person Households | 230 (1.0%) | 0 (0.0%) |
| Total | 13,480 (61.1%) | 8,594 (38.9%) |
Female Fertility in Somerset County
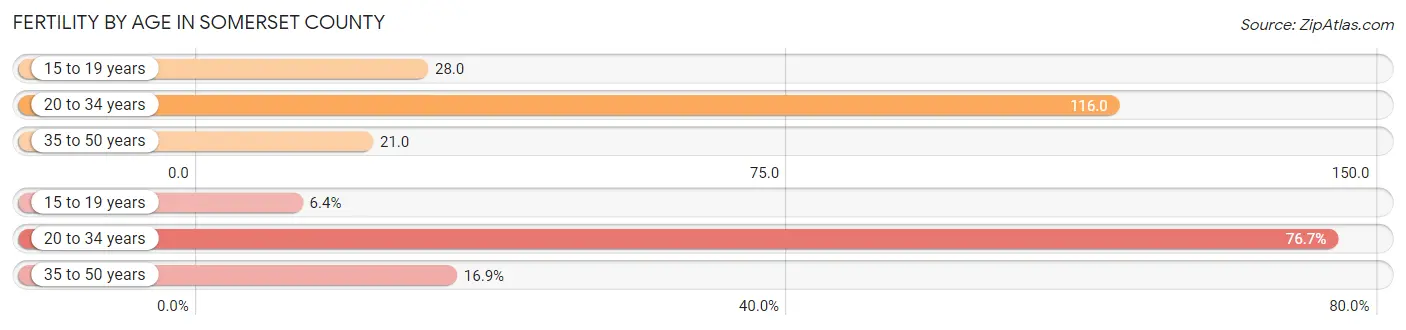
Fertility by Age in Somerset County
Average fertility rate in Somerset County is 59.0 births per 1,000 women. Women in the age bracket of 20 to 34 years have the highest fertility rate with 116.0 births per 1,000 women. Women in the age bracket of 20 to 34 years acount for 76.7% of all women with births.
| Age Bracket | Women with Births | Births / 1,000 Women |
| 15 to 19 years | 38 (6.4%) | 28.0 |
| 20 to 34 years | 454 (76.7%) | 116.0 |
| 35 to 50 years | 100 (16.9%) | 21.0 |
| Total | 592 (100.0%) | 59.0 |
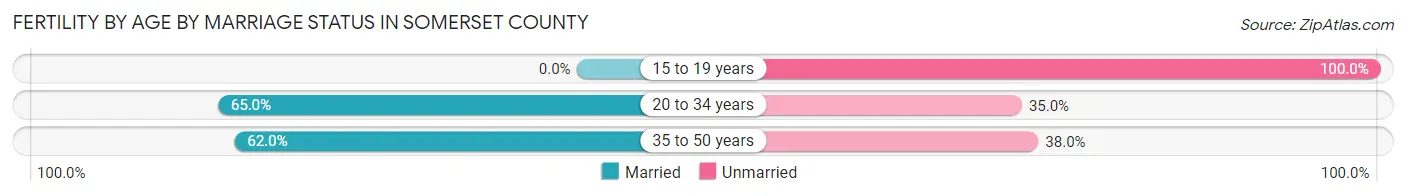
Fertility by Age by Marriage Status in Somerset County
60.3% of women with births (592) in Somerset County are married. The highest percentage of unmarried women with births falls into 15 to 19 years age bracket with 100.0% of them unmarried at the time of birth, while the lowest percentage of unmarried women with births belong to 20 to 34 years age bracket with 35.0% of them unmarried.
| Age Bracket | Married | Unmarried |
| 15 to 19 years | 0 (0.0%) | 38 (100.0%) |
| 20 to 34 years | 295 (65.0%) | 159 (35.0%) |
| 35 to 50 years | 62 (62.0%) | 38 (38.0%) |
| Total | 357 (60.3%) | 235 (39.7%) |
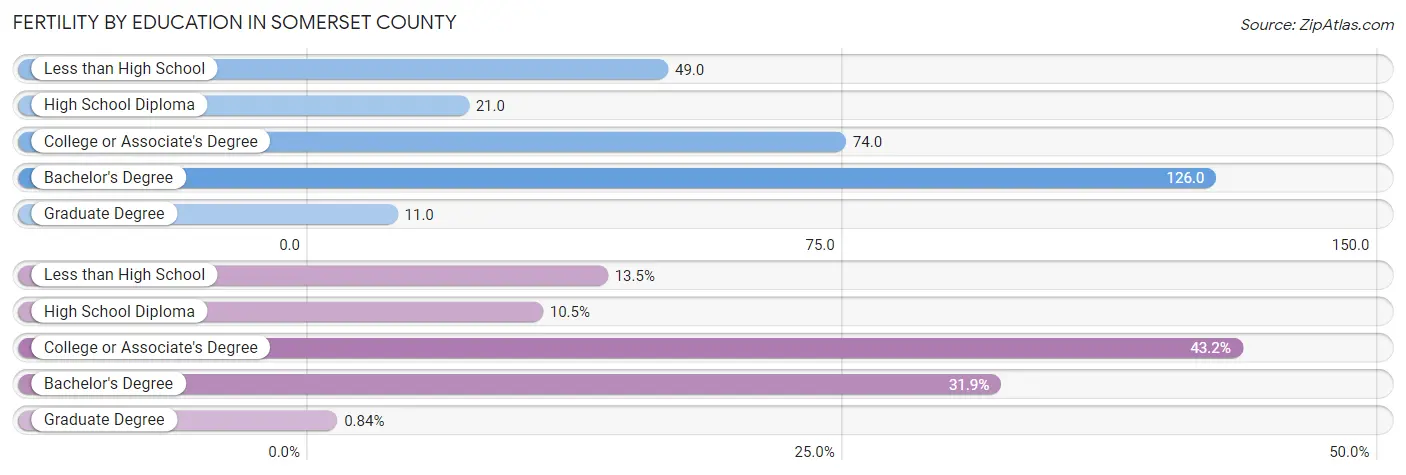
Fertility by Education in Somerset County
Average fertility rate in Somerset County is 59.0 births per 1,000 women. Women with the education attainment of bachelor's degree have the highest fertility rate of 126.0 births per 1,000 women, while women with the education attainment of graduate degree have the lowest fertility at 11.0 births per 1,000 women. Women with the education attainment of college or associate's degree represent 43.2% of all women with births.
| Educational Attainment | Women with Births | Births / 1,000 Women |
| Less than High School | 80 (13.5%) | 49.0 |
| High School Diploma | 62 (10.5%) | 21.0 |
| College or Associate's Degree | 256 (43.2%) | 74.0 |
| Bachelor's Degree | 189 (31.9%) | 126.0 |
| Graduate Degree | 5 (0.8%) | 11.0 |
| Total | 592 (100.0%) | 59.0 |
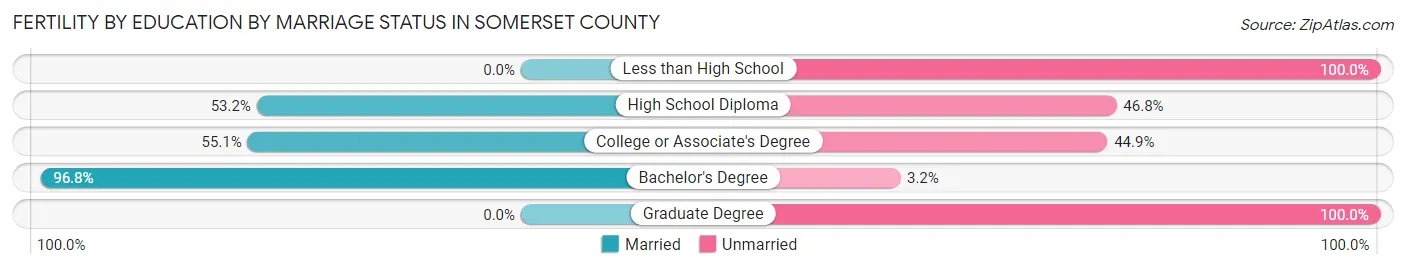
Fertility by Education by Marriage Status in Somerset County
39.7% of women with births in Somerset County are unmarried. Women with the educational attainment of bachelor's degree are most likely to be married with 96.8% of them married at childbirth, while women with the educational attainment of less than high school are least likely to be married with 100.0% of them unmarried at childbirth.
| Educational Attainment | Married | Unmarried |
| Less than High School | 0 (0.0%) | 80 (100.0%) |
| High School Diploma | 33 (53.2%) | 29 (46.8%) |
| College or Associate's Degree | 141 (55.1%) | 115 (44.9%) |
| Bachelor's Degree | 183 (96.8%) | 6 (3.2%) |
| Graduate Degree | 0 (0.0%) | 5 (100.0%) |
| Total | 357 (60.3%) | 235 (39.7%) |
Employment Characteristics in Somerset County
Employment by Class of Employer in Somerset County
Among the 22,146 employed individuals in Somerset County, private company employees (13,669 | 61.7%), not-for-profit organizations (2,551 | 11.5%), and self-employed (not incorporated) (1,938 | 8.7%) make up the most common classes of employment.
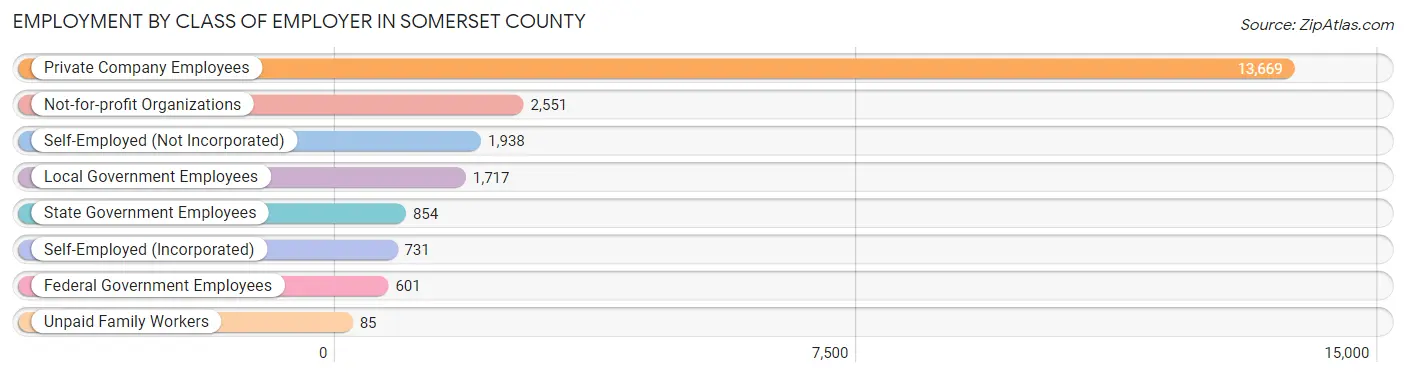
| Employer Class | # Employees | % Employees |
| Private Company Employees | 13,669 | 61.7% |
| Self-Employed (Incorporated) | 731 | 3.3% |
| Self-Employed (Not Incorporated) | 1,938 | 8.7% |
| Not-for-profit Organizations | 2,551 | 11.5% |
| Local Government Employees | 1,717 | 7.7% |
| State Government Employees | 854 | 3.9% |
| Federal Government Employees | 601 | 2.7% |
| Unpaid Family Workers | 85 | 0.4% |
| Total | 22,146 | 100.0% |
Employment Status by Age in Somerset County
According to the labor force statistics for Somerset County, out of the total population over 16 years of age (42,523), 55.6% or 23,643 individuals are in the labor force, with 4.2% or 993 of them unemployed. The age group with the highest labor force participation rate is 30 to 34 years, with 81.4% or 2,308 individuals in the labor force. Within the labor force, the 16 to 19 years age range has the highest percentage of unemployed individuals, with 19.7% or 204 of them being unemployed.
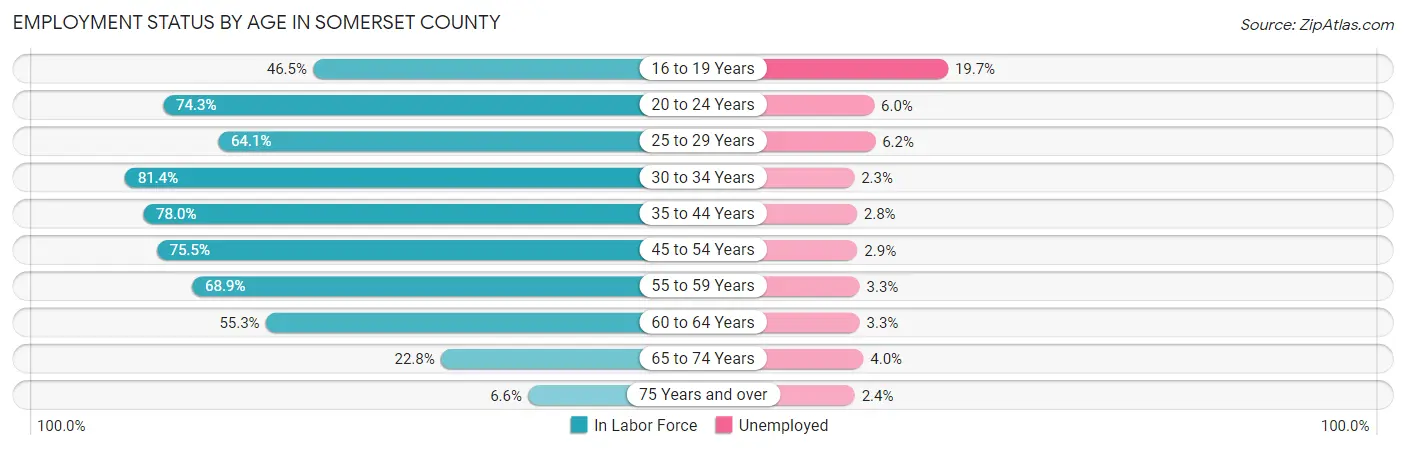
| Age Bracket | In Labor Force | Unemployed |
| 16 to 19 Years | 1,034 (46.5%) | 204 (19.7%) |
| 20 to 24 Years | 1,848 (74.3%) | 111 (6.0%) |
| 25 to 29 Years | 1,769 (64.1%) | 110 (6.2%) |
| 30 to 34 Years | 2,308 (81.4%) | 53 (2.3%) |
| 35 to 44 Years | 4,394 (78.0%) | 123 (2.8%) |
| 45 to 54 Years | 5,326 (75.5%) | 154 (2.9%) |
| 55 to 59 Years | 2,691 (68.9%) | 89 (3.3%) |
| 60 to 64 Years | 2,420 (55.3%) | 80 (3.3%) |
| 65 to 74 Years | 1,564 (22.8%) | 63 (4.0%) |
| 75 Years and over | 290 (6.6%) | 7 (2.4%) |
| Total | 23,643 (55.6%) | 993 (4.2%) |
Employment Status by Educational Attainment in Somerset County
According to labor force statistics for Somerset County, 71.1% of individuals (18,886) out of the total population between 25 and 64 years of age (26,563) are in the labor force, with 3.2% or 604 of them being unemployed. The group with the highest labor force participation rate are those with the educational attainment of bachelor's degree or higher, with 83.5% or 4,407 individuals in the labor force. Within the labor force, individuals with less than high school education have the highest percentage of unemployment, with 14.4% or 124 of them being unemployed.
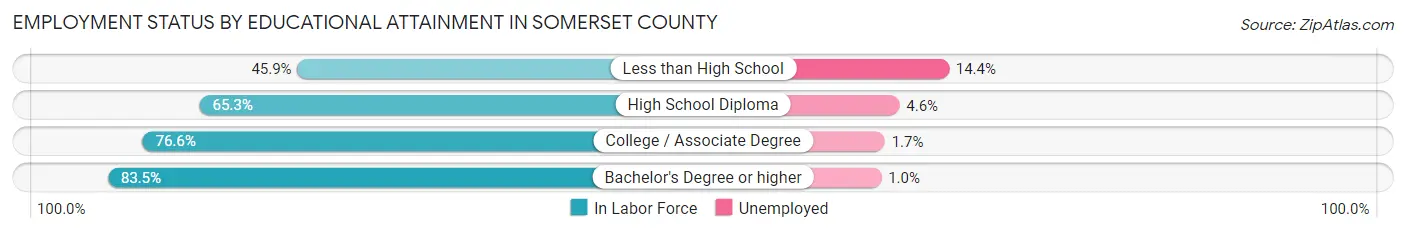
| Educational Attainment | In Labor Force | Unemployed |
| Less than High School | 864 (45.9%) | 271 (14.4%) |
| High School Diploma | 7,140 (65.3%) | 503 (4.6%) |
| College / Associate Degree | 6,486 (76.6%) | 144 (1.7%) |
| Bachelor's Degree or higher | 4,407 (83.5%) | 53 (1.0%) |
| Total | 18,886 (71.1%) | 850 (3.2%) |
Employment Occupations by Sex in Somerset County
Management, Business, Science and Arts Occupations
The most common Management, Business, Science and Arts occupations in Somerset County are Community & Social Service (2,236 | 9.9%), Management (1,781 | 7.9%), Education Instruction & Library (1,477 | 6.5%), Health Diagnosing & Treating (1,156 | 5.1%), and Business & Financial (790 | 3.5%).
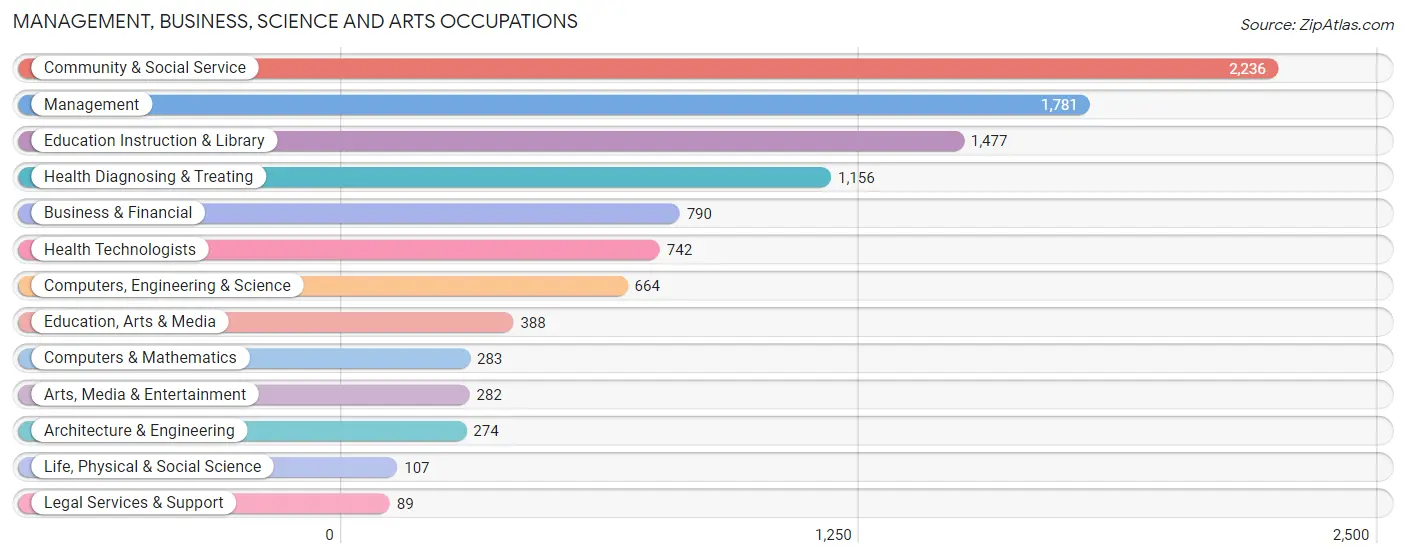
Management, Business, Science and Arts Occupations by Sex
Within the Management, Business, Science and Arts occupations in Somerset County, the most male-oriented occupations are Architecture & Engineering (100.0%), Computers, Engineering & Science (85.1%), and Computers & Mathematics (75.6%), while the most female-oriented occupations are Health Technologists (87.2%), Health Diagnosing & Treating (83.0%), and Education Instruction & Library (82.4%).
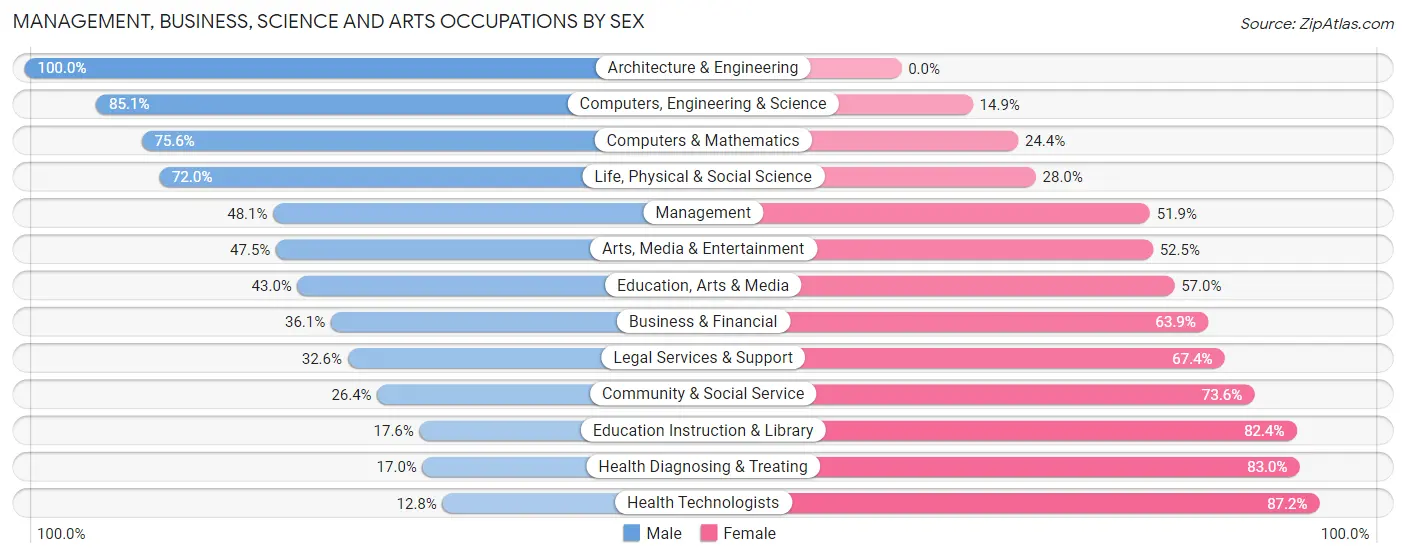
| Occupation | Male | Female |
| Management | 857 (48.1%) | 924 (51.9%) |
| Business & Financial | 285 (36.1%) | 505 (63.9%) |
| Computers, Engineering & Science | 565 (85.1%) | 99 (14.9%) |
| Computers & Mathematics | 214 (75.6%) | 69 (24.4%) |
| Architecture & Engineering | 274 (100.0%) | 0 (0.0%) |
| Life, Physical & Social Science | 77 (72.0%) | 30 (28.0%) |
| Community & Social Service | 590 (26.4%) | 1,646 (73.6%) |
| Education, Arts & Media | 167 (43.0%) | 221 (57.0%) |
| Legal Services & Support | 29 (32.6%) | 60 (67.4%) |
| Education Instruction & Library | 260 (17.6%) | 1,217 (82.4%) |
| Arts, Media & Entertainment | 134 (47.5%) | 148 (52.5%) |
| Health Diagnosing & Treating | 196 (17.0%) | 960 (83.0%) |
| Health Technologists | 95 (12.8%) | 647 (87.2%) |
| Total (Category) | 2,493 (37.6%) | 4,134 (62.4%) |
| Total (Overall) | 12,058 (53.4%) | 10,517 (46.6%) |
Services Occupations
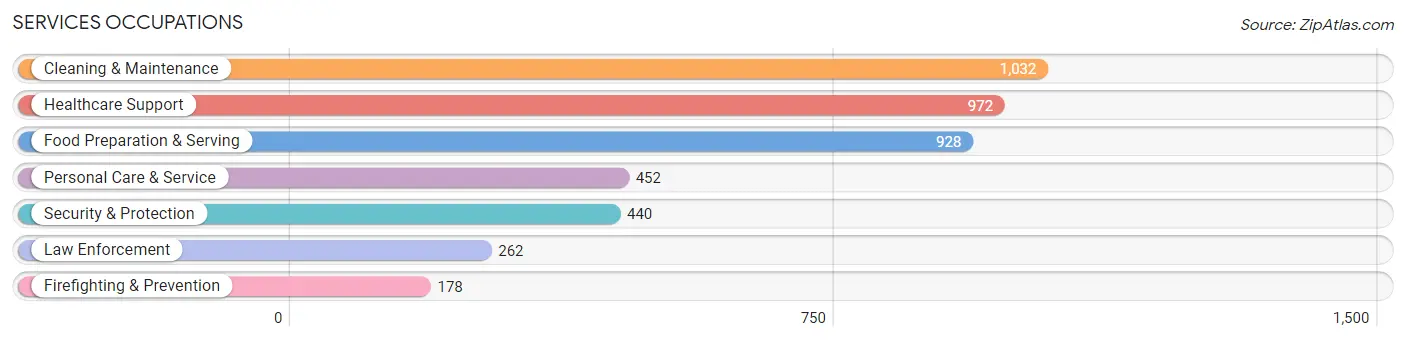
The most common Services occupations in Somerset County are Cleaning & Maintenance (1,032 | 4.6%), Healthcare Support (972 | 4.3%), Food Preparation & Serving (928 | 4.1%), Personal Care & Service (452 | 2.0%), and Security & Protection (440 | 1.9%).
Services Occupations by Sex
Within the Services occupations in Somerset County, the most male-oriented occupations are Law Enforcement (92.7%), Security & Protection (90.2%), and Firefighting & Prevention (86.5%), while the most female-oriented occupations are Healthcare Support (91.7%), Food Preparation & Serving (89.8%), and Personal Care & Service (72.4%).
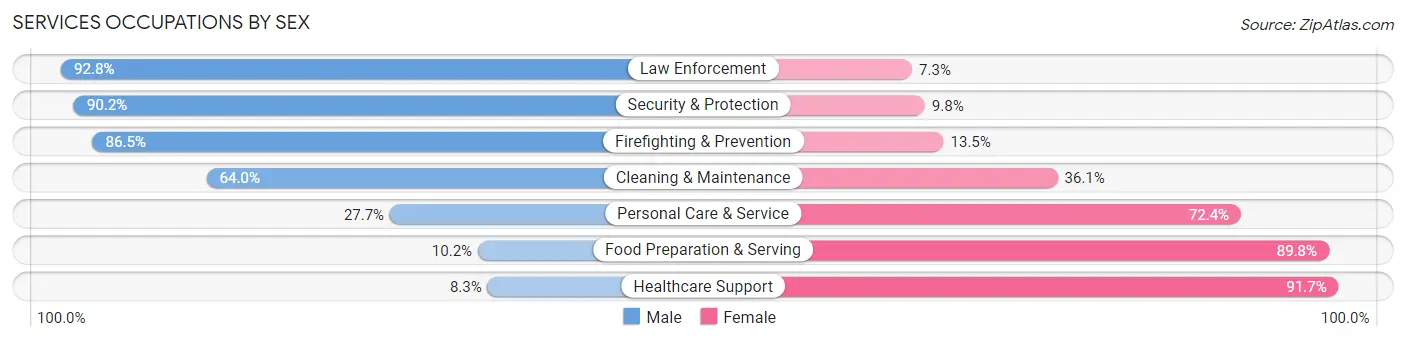
| Occupation | Male | Female |
| Healthcare Support | 81 (8.3%) | 891 (91.7%) |
| Security & Protection | 397 (90.2%) | 43 (9.8%) |
| Firefighting & Prevention | 154 (86.5%) | 24 (13.5%) |
| Law Enforcement | 243 (92.7%) | 19 (7.2%) |
| Food Preparation & Serving | 95 (10.2%) | 833 (89.8%) |
| Cleaning & Maintenance | 660 (63.9%) | 372 (36.0%) |
| Personal Care & Service | 125 (27.7%) | 327 (72.4%) |
| Total (Category) | 1,358 (35.5%) | 2,466 (64.5%) |
| Total (Overall) | 12,058 (53.4%) | 10,517 (46.6%) |
Sales and Office Occupations
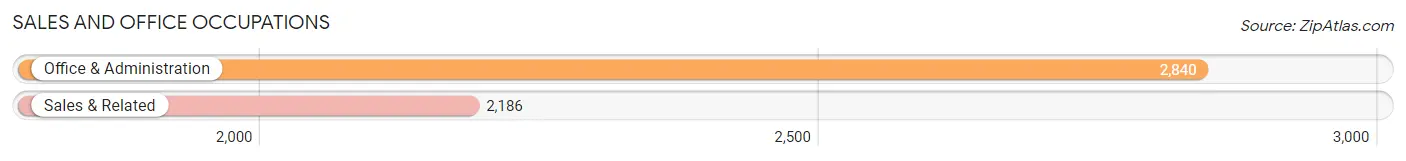
The most common Sales and Office occupations in Somerset County are Office & Administration (2,840 | 12.6%), and Sales & Related (2,186 | 9.7%).
Sales and Office Occupations by Sex
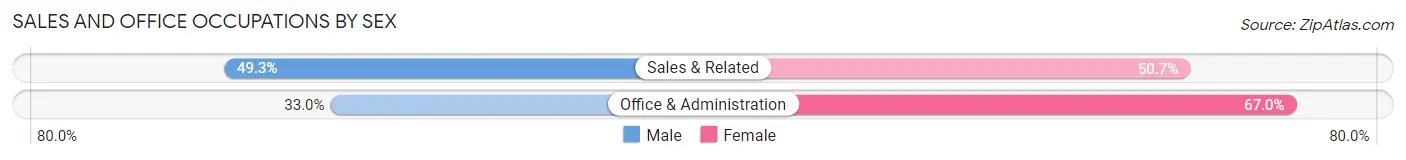
| Occupation | Male | Female |
| Sales & Related | 1,078 (49.3%) | 1,108 (50.7%) |
| Office & Administration | 936 (33.0%) | 1,904 (67.0%) |
| Total (Category) | 2,014 (40.1%) | 3,012 (59.9%) |
| Total (Overall) | 12,058 (53.4%) | 10,517 (46.6%) |
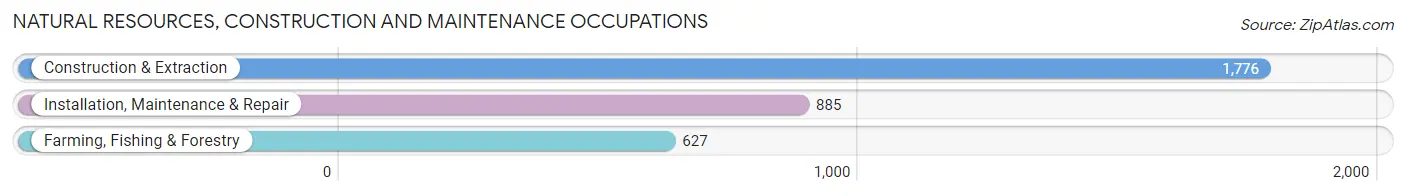
Natural Resources, Construction and Maintenance Occupations
The most common Natural Resources, Construction and Maintenance occupations in Somerset County are Construction & Extraction (1,776 | 7.9%), Installation, Maintenance & Repair (885 | 3.9%), and Farming, Fishing & Forestry (627 | 2.8%).
Natural Resources, Construction and Maintenance Occupations by Sex
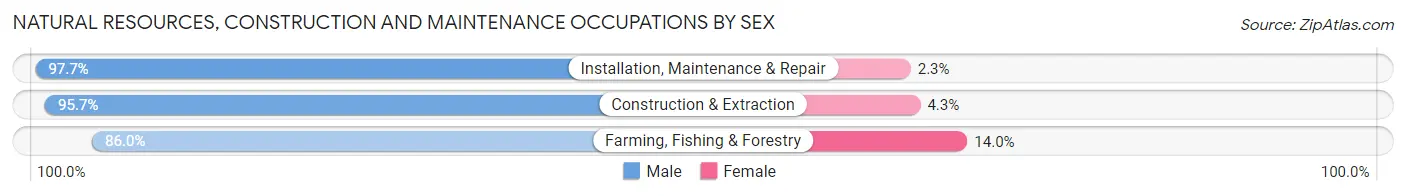
| Occupation | Male | Female |
| Farming, Fishing & Forestry | 539 (86.0%) | 88 (14.0%) |
| Construction & Extraction | 1,700 (95.7%) | 76 (4.3%) |
| Installation, Maintenance & Repair | 865 (97.7%) | 20 (2.3%) |
| Total (Category) | 3,104 (94.4%) | 184 (5.6%) |
| Total (Overall) | 12,058 (53.4%) | 10,517 (46.6%) |
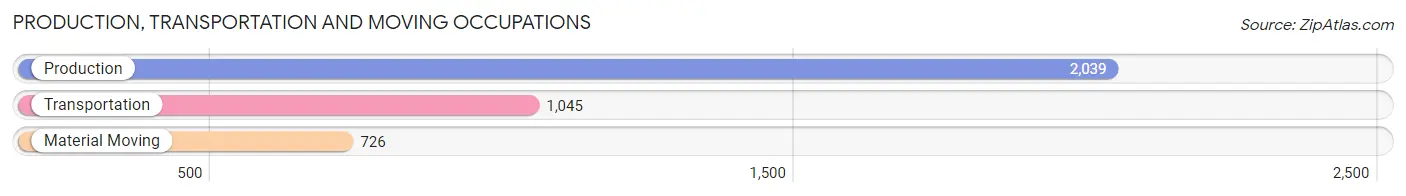
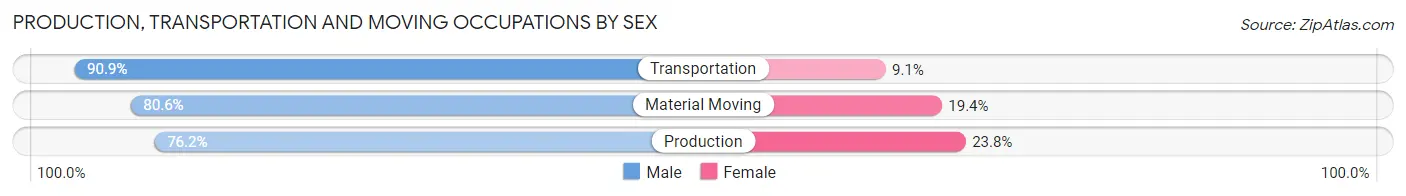
Production, Transportation and Moving Occupations
The most common Production, Transportation and Moving occupations in Somerset County are Production (2,039 | 9.0%), Transportation (1,045 | 4.6%), and Material Moving (726 | 3.2%).
Production, Transportation and Moving Occupations by Sex
| Occupation | Male | Female |
| Production | 1,554 (76.2%) | 485 (23.8%) |
| Transportation | 950 (90.9%) | 95 (9.1%) |
| Material Moving | 585 (80.6%) | 141 (19.4%) |
| Total (Category) | 3,089 (81.1%) | 721 (18.9%) |
| Total (Overall) | 12,058 (53.4%) | 10,517 (46.6%) |
Employment Industries by Sex in Somerset County
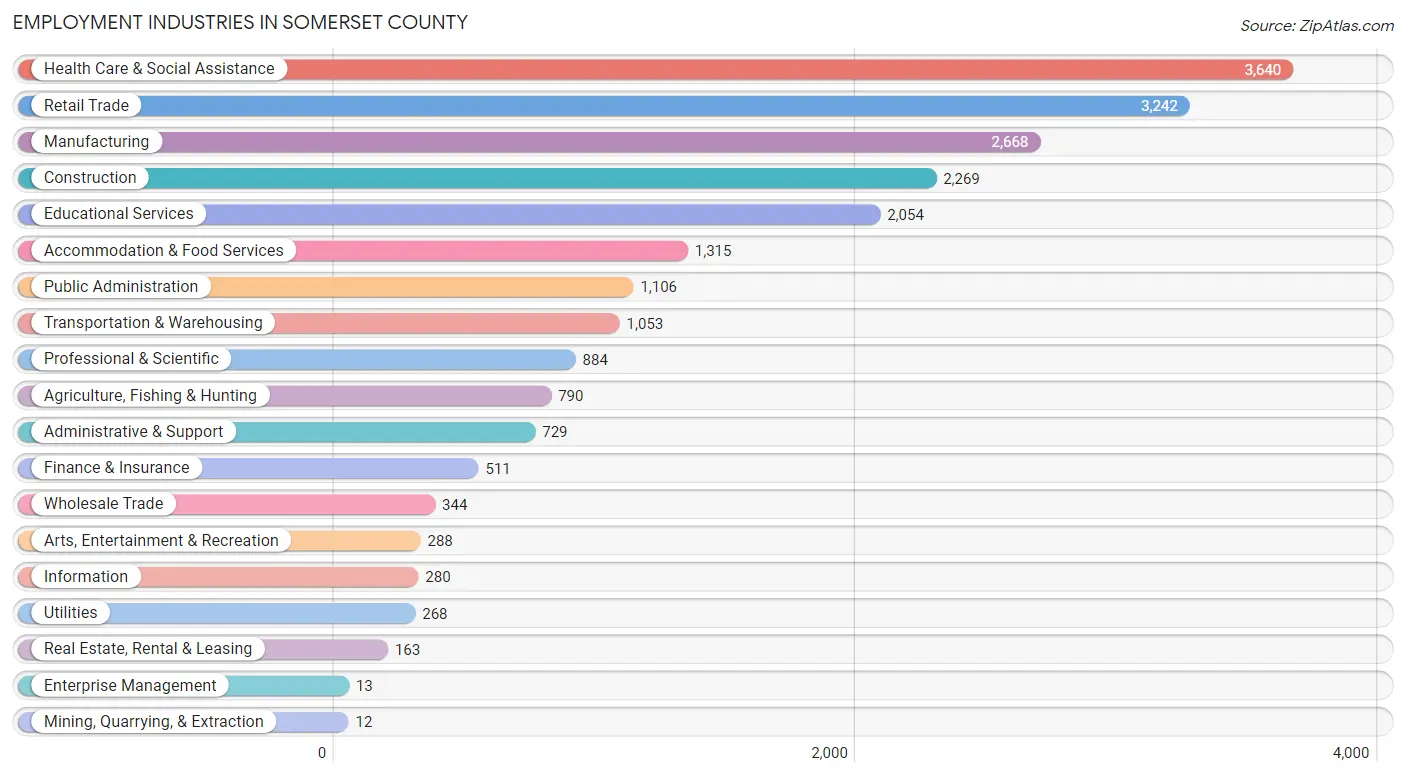
Employment Industries in Somerset County
The major employment industries in Somerset County include Health Care & Social Assistance (3,640 | 16.1%), Retail Trade (3,242 | 14.4%), Manufacturing (2,668 | 11.8%), Construction (2,269 | 10.1%), and Educational Services (2,054 | 9.1%).
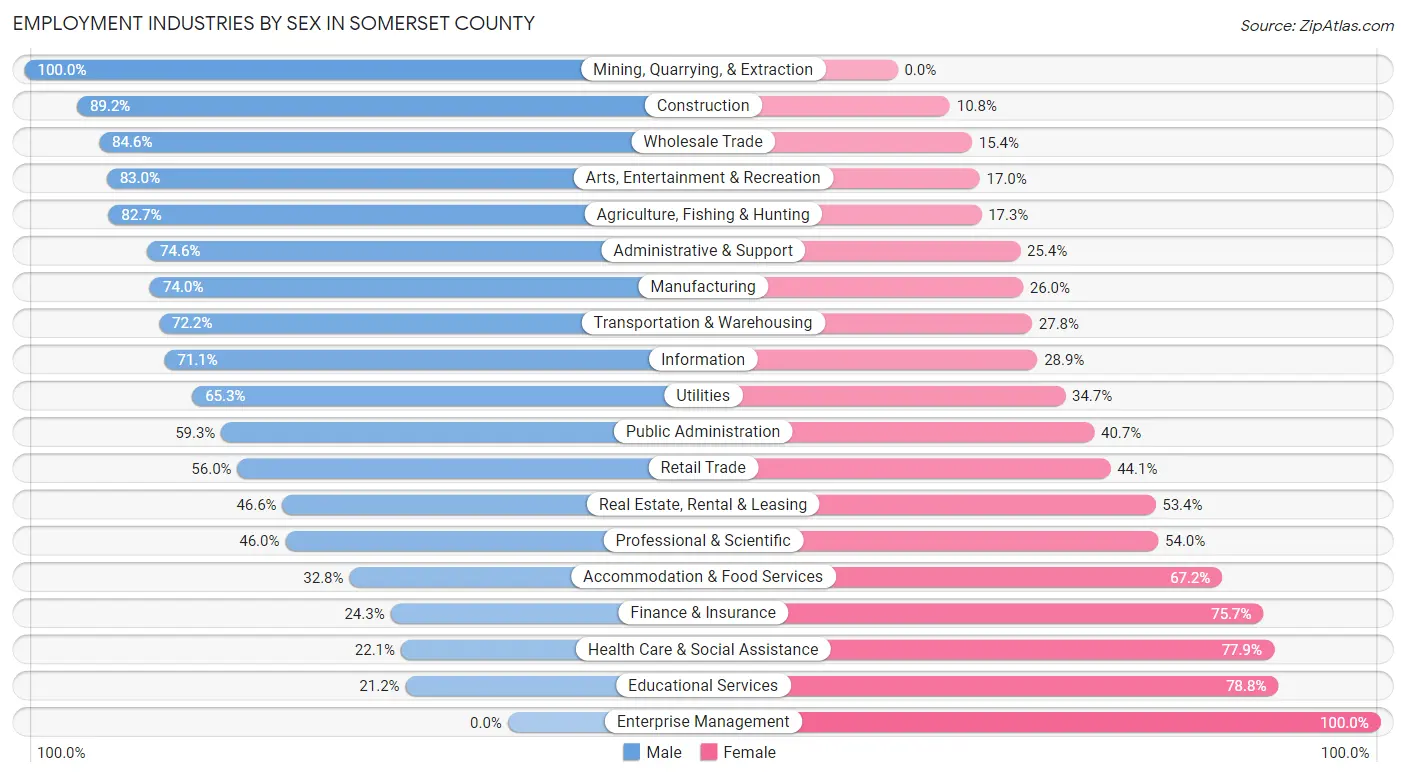
Employment Industries by Sex in Somerset County
The Somerset County industries that see more men than women are Mining, Quarrying, & Extraction (100.0%), Construction (89.2%), and Wholesale Trade (84.6%), whereas the industries that tend to have a higher number of women are Enterprise Management (100.0%), Educational Services (78.8%), and Health Care & Social Assistance (77.9%).
| Industry | Male | Female |
| Agriculture, Fishing & Hunting | 653 (82.7%) | 137 (17.3%) |
| Mining, Quarrying, & Extraction | 12 (100.0%) | 0 (0.0%) |
| Construction | 2,023 (89.2%) | 246 (10.8%) |
| Manufacturing | 1,975 (74.0%) | 693 (26.0%) |
| Wholesale Trade | 291 (84.6%) | 53 (15.4%) |
| Retail Trade | 1,814 (55.9%) | 1,428 (44.1%) |
| Transportation & Warehousing | 760 (72.2%) | 293 (27.8%) |
| Utilities | 175 (65.3%) | 93 (34.7%) |
| Information | 199 (71.1%) | 81 (28.9%) |
| Finance & Insurance | 124 (24.3%) | 387 (75.7%) |
| Real Estate, Rental & Leasing | 76 (46.6%) | 87 (53.4%) |
| Professional & Scientific | 407 (46.0%) | 477 (54.0%) |
| Enterprise Management | 0 (0.0%) | 13 (100.0%) |
| Administrative & Support | 544 (74.6%) | 185 (25.4%) |
| Educational Services | 435 (21.2%) | 1,619 (78.8%) |
| Health Care & Social Assistance | 805 (22.1%) | 2,835 (77.9%) |
| Arts, Entertainment & Recreation | 239 (83.0%) | 49 (17.0%) |
| Accommodation & Food Services | 431 (32.8%) | 884 (67.2%) |
| Public Administration | 656 (59.3%) | 450 (40.7%) |
| Total | 12,058 (53.4%) | 10,517 (46.6%) |
Education in Somerset County
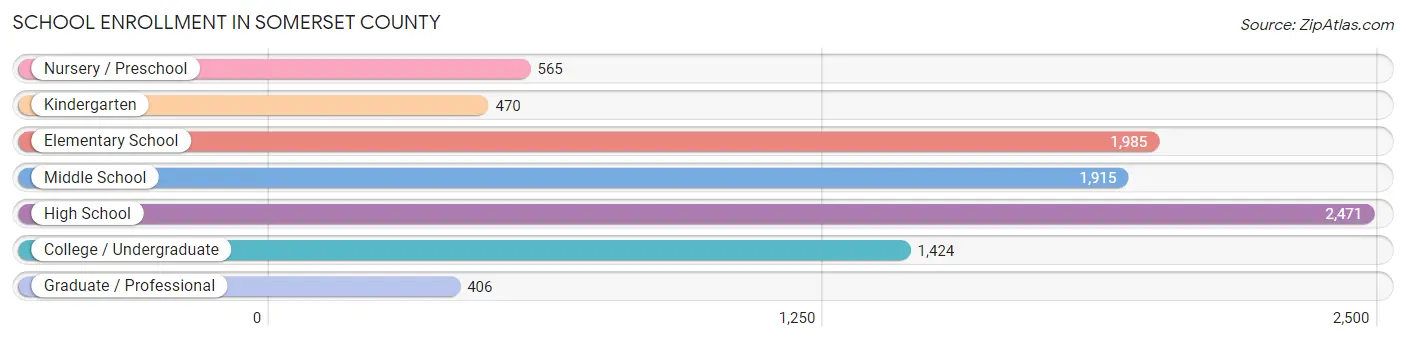
School Enrollment in Somerset County
The most common levels of schooling among the 9,236 students in Somerset County are high school (2,471 | 26.8%), elementary school (1,985 | 21.5%), and middle school (1,915 | 20.7%).
| School Level | # Students | % Students |
| Nursery / Preschool | 565 | 6.1% |
| Kindergarten | 470 | 5.1% |
| Elementary School | 1,985 | 21.5% |
| Middle School | 1,915 | 20.7% |
| High School | 2,471 | 26.8% |
| College / Undergraduate | 1,424 | 15.4% |
| Graduate / Professional | 406 | 4.4% |
| Total | 9,236 | 100.0% |
School Enrollment by Age by Funding Source in Somerset County
Out of a total of 9,236 students who are enrolled in schools in Somerset County, 1,367 (14.8%) attend a private institution, while the remaining 7,869 (85.2%) are enrolled in public schools. The age group of 3 to 4 year olds has the highest likelihood of being enrolled in private schools, with 142 (36.2% in the age bracket) enrolled. Conversely, the age group of 10 to 14 year olds has the lowest likelihood of being enrolled in a private school, with 2,200 (88.2% in the age bracket) attending a public institution.
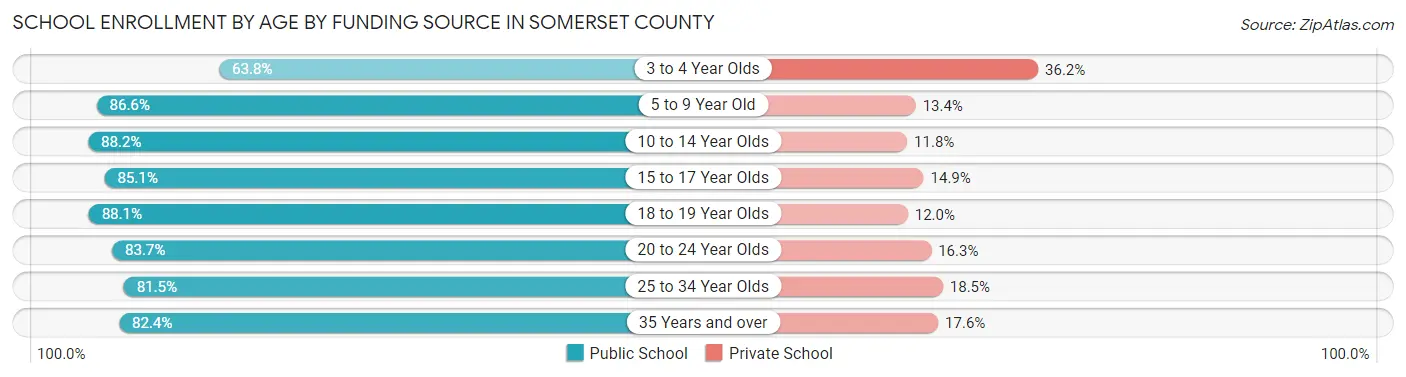
| Age Bracket | Public School | Private School |
| 3 to 4 Year Olds | 250 (63.8%) | 142 (36.2%) |
| 5 to 9 Year Old | 2,103 (86.6%) | 326 (13.4%) |
| 10 to 14 Year Olds | 2,200 (88.2%) | 295 (11.8%) |
| 15 to 17 Year Olds | 1,406 (85.1%) | 246 (14.9%) |
| 18 to 19 Year Olds | 560 (88.0%) | 76 (11.9%) |
| 20 to 24 Year Olds | 508 (83.7%) | 99 (16.3%) |
| 25 to 34 Year Olds | 340 (81.5%) | 77 (18.5%) |
| 35 Years and over | 501 (82.4%) | 107 (17.6%) |
| Total | 7,869 (85.2%) | 1,367 (14.8%) |
Educational Attainment by Field of Study in Somerset County
Education (1,425 | 17.4%), business (1,160 | 14.1%), science & technology (1,022 | 12.4%), bio, nature & agricultural (832 | 10.1%), and engineering (712 | 8.7%) are the most common fields of study among 8,207 individuals in Somerset County who have obtained a bachelor's degree or higher.
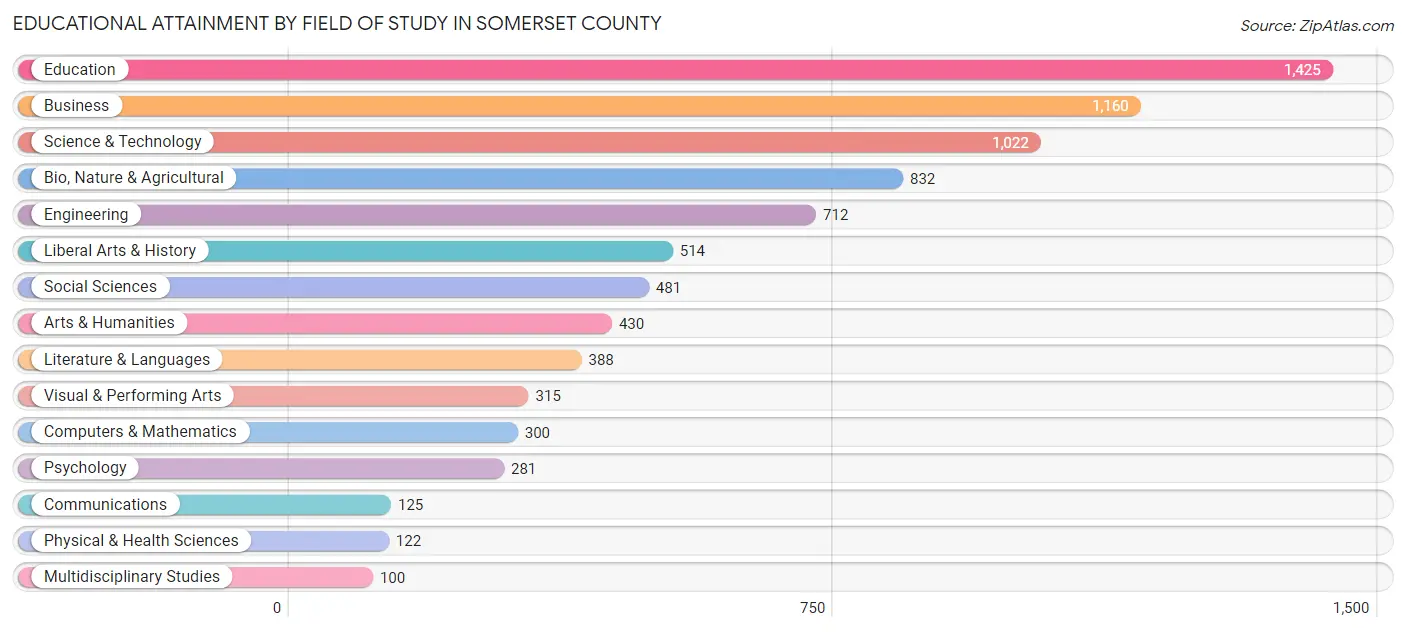
| Field of Study | # Graduates | % Graduates |
| Computers & Mathematics | 300 | 3.7% |
| Bio, Nature & Agricultural | 832 | 10.1% |
| Physical & Health Sciences | 122 | 1.5% |
| Psychology | 281 | 3.4% |
| Social Sciences | 481 | 5.9% |
| Engineering | 712 | 8.7% |
| Multidisciplinary Studies | 100 | 1.2% |
| Science & Technology | 1,022 | 12.4% |
| Business | 1,160 | 14.1% |
| Education | 1,425 | 17.4% |
| Literature & Languages | 388 | 4.7% |
| Liberal Arts & History | 514 | 6.3% |
| Visual & Performing Arts | 315 | 3.8% |
| Communications | 125 | 1.5% |
| Arts & Humanities | 430 | 5.2% |
| Total | 8,207 | 100.0% |
Transportation & Commute in Somerset County
Vehicle Availability by Sex in Somerset County
The most prevalent vehicle ownership categories in Somerset County are males with 2 vehicles (5,296, accounting for 44.5%) and females with 2 vehicles (4,537, making up 52.0%).
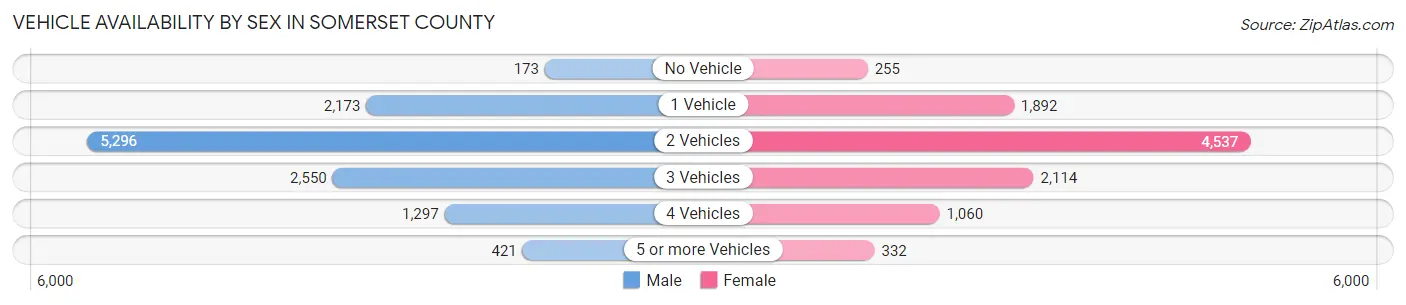
| Vehicles Available | Male | Female |
| No Vehicle | 173 (1.5%) | 255 (2.5%) |
| 1 Vehicle | 2,173 (18.2%) | 1,892 (18.6%) |
| 2 Vehicles | 5,296 (44.5%) | 4,537 (44.5%) |
| 3 Vehicles | 2,550 (21.4%) | 2,114 (20.7%) |
| 4 Vehicles | 1,297 (10.9%) | 1,060 (10.4%) |
| 5 or more Vehicles | 421 (3.5%) | 332 (3.3%) |
| Total | 11,910 (100.0%) | 10,190 (100.0%) |
Commute Time in Somerset County
The most frequently occuring commute durations in Somerset County are 20 to 24 minutes (2,570 commuters, 12.9%), 5 to 9 minutes (2,479 commuters, 12.4%), and 30 to 34 minutes (2,389 commuters, 12.0%).
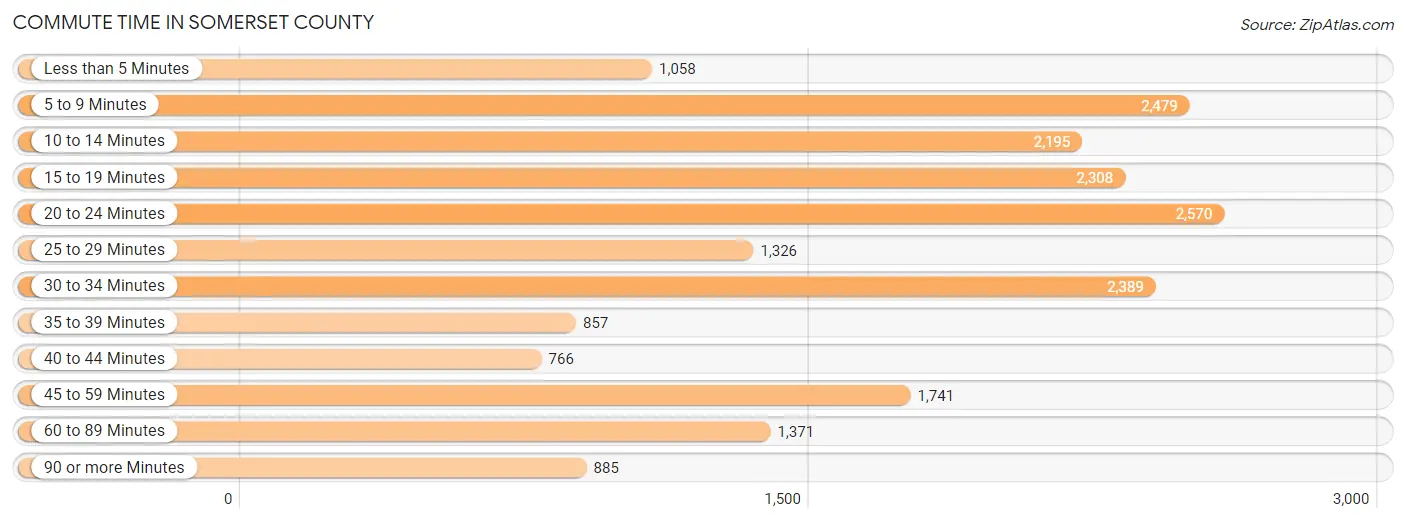
| Commute Time | # Commuters | % Commuters |
| Less than 5 Minutes | 1,058 | 5.3% |
| 5 to 9 Minutes | 2,479 | 12.4% |
| 10 to 14 Minutes | 2,195 | 11.0% |
| 15 to 19 Minutes | 2,308 | 11.6% |
| 20 to 24 Minutes | 2,570 | 12.9% |
| 25 to 29 Minutes | 1,326 | 6.7% |
| 30 to 34 Minutes | 2,389 | 12.0% |
| 35 to 39 Minutes | 857 | 4.3% |
| 40 to 44 Minutes | 766 | 3.8% |
| 45 to 59 Minutes | 1,741 | 8.7% |
| 60 to 89 Minutes | 1,371 | 6.9% |
| 90 or more Minutes | 885 | 4.4% |
Commute Time by Sex in Somerset County
The most common commute times in Somerset County are 20 to 24 minutes (1,381 commuters, 12.8%) for males and 15 to 19 minutes (1,251 commuters, 13.7%) for females.
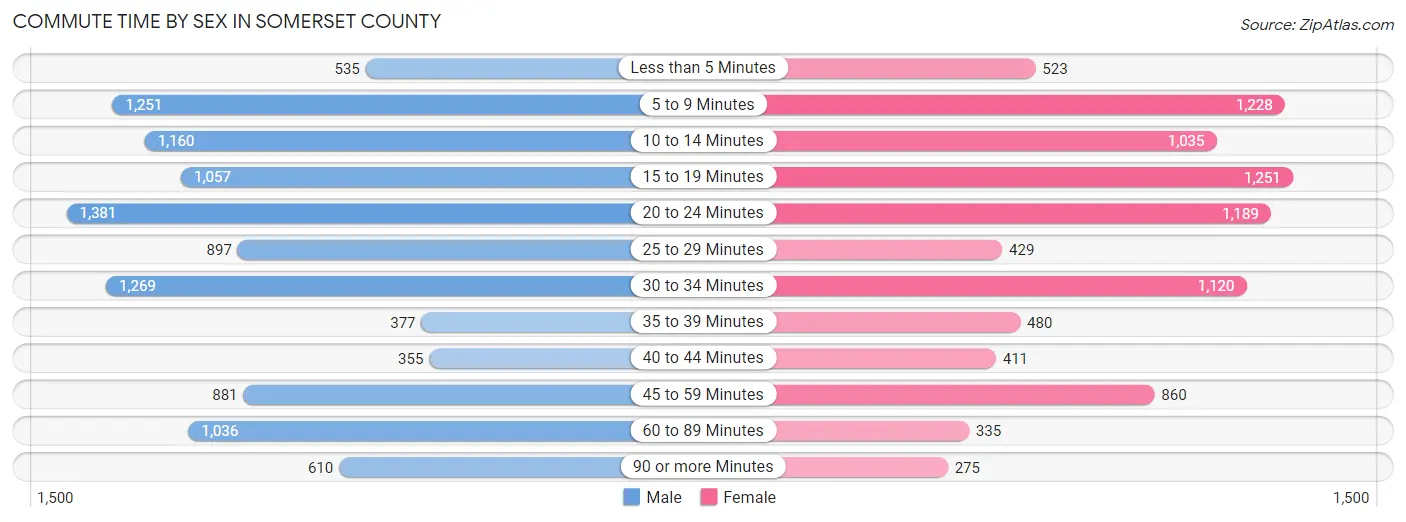
| Commute Time | Male | Female |
| Less than 5 Minutes | 535 (5.0%) | 523 (5.7%) |
| 5 to 9 Minutes | 1,251 (11.6%) | 1,228 (13.4%) |
| 10 to 14 Minutes | 1,160 (10.7%) | 1,035 (11.3%) |
| 15 to 19 Minutes | 1,057 (9.8%) | 1,251 (13.7%) |
| 20 to 24 Minutes | 1,381 (12.8%) | 1,189 (13.0%) |
| 25 to 29 Minutes | 897 (8.3%) | 429 (4.7%) |
| 30 to 34 Minutes | 1,269 (11.7%) | 1,120 (12.3%) |
| 35 to 39 Minutes | 377 (3.5%) | 480 (5.2%) |
| 40 to 44 Minutes | 355 (3.3%) | 411 (4.5%) |
| 45 to 59 Minutes | 881 (8.2%) | 860 (9.4%) |
| 60 to 89 Minutes | 1,036 (9.6%) | 335 (3.7%) |
| 90 or more Minutes | 610 (5.6%) | 275 (3.0%) |
Time of Departure to Work by Sex in Somerset County
The most frequent times of departure to work in Somerset County are 12:00 AM to 4:59 AM (1,492, 13.8%) for males and 7:00 AM to 7:29 AM (1,576, 17.2%) for females.
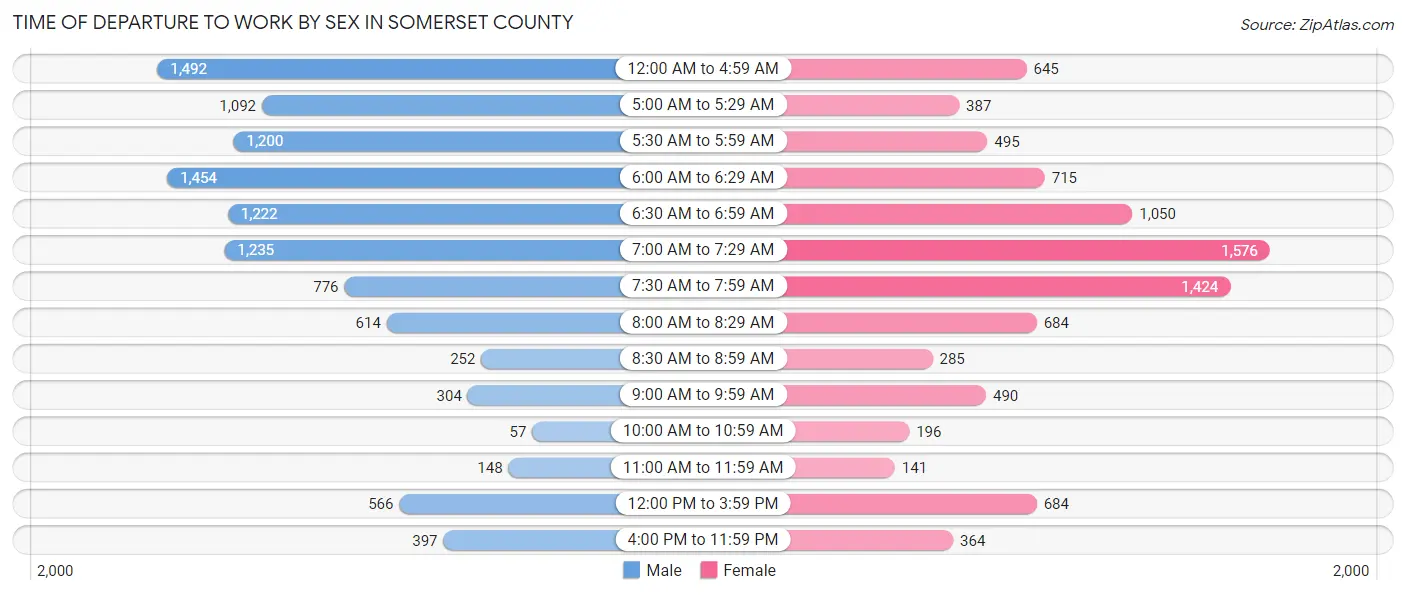
| Time of Departure | Male | Female |
| 12:00 AM to 4:59 AM | 1,492 (13.8%) | 645 (7.1%) |
| 5:00 AM to 5:29 AM | 1,092 (10.1%) | 387 (4.2%) |
| 5:30 AM to 5:59 AM | 1,200 (11.1%) | 495 (5.4%) |
| 6:00 AM to 6:29 AM | 1,454 (13.5%) | 715 (7.8%) |
| 6:30 AM to 6:59 AM | 1,222 (11.3%) | 1,050 (11.5%) |
| 7:00 AM to 7:29 AM | 1,235 (11.4%) | 1,576 (17.2%) |
| 7:30 AM to 7:59 AM | 776 (7.2%) | 1,424 (15.6%) |
| 8:00 AM to 8:29 AM | 614 (5.7%) | 684 (7.5%) |
| 8:30 AM to 8:59 AM | 252 (2.3%) | 285 (3.1%) |
| 9:00 AM to 9:59 AM | 304 (2.8%) | 490 (5.4%) |
| 10:00 AM to 10:59 AM | 57 (0.5%) | 196 (2.1%) |
| 11:00 AM to 11:59 AM | 148 (1.4%) | 141 (1.5%) |
| 12:00 PM to 3:59 PM | 566 (5.2%) | 684 (7.5%) |
| 4:00 PM to 11:59 PM | 397 (3.7%) | 364 (4.0%) |
| Total | 10,809 (100.0%) | 9,136 (100.0%) |
Housing Occupancy in Somerset County
Occupancy by Ownership in Somerset County
Of the total 22,074 dwellings in Somerset County, owner-occupied units account for 16,954 (76.8%), while renter-occupied units make up 5,120 (23.2%).
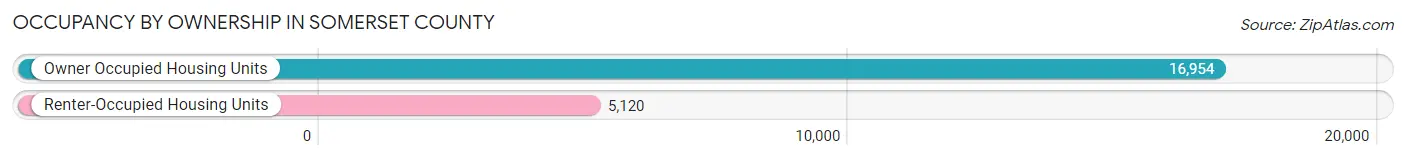
| Occupancy | # Housing Units | % Housing Units |
| Owner Occupied Housing Units | 16,954 | 76.8% |
| Renter-Occupied Housing Units | 5,120 | 23.2% |
| Total Occupied Housing Units | 22,074 | 100.0% |
Occupancy by Household Size in Somerset County
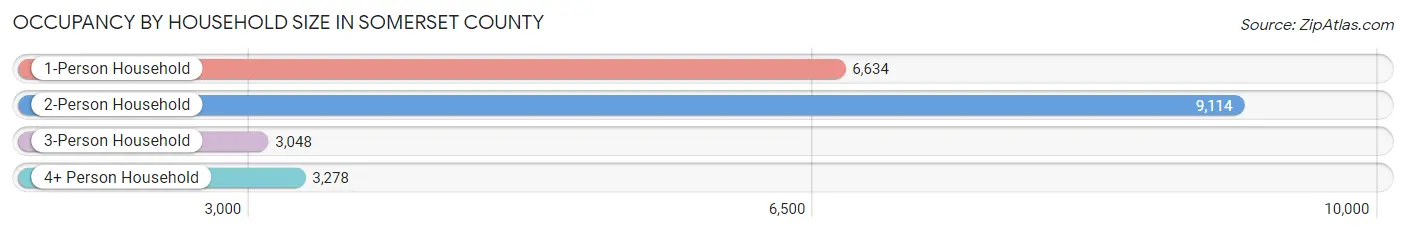
| Household Size | # Housing Units | % Housing Units |
| 1-Person Household | 6,634 | 30.0% |
| 2-Person Household | 9,114 | 41.3% |
| 3-Person Household | 3,048 | 13.8% |
| 4+ Person Household | 3,278 | 14.8% |
| Total Housing Units | 22,074 | 100.0% |
Occupancy by Ownership by Household Size in Somerset County
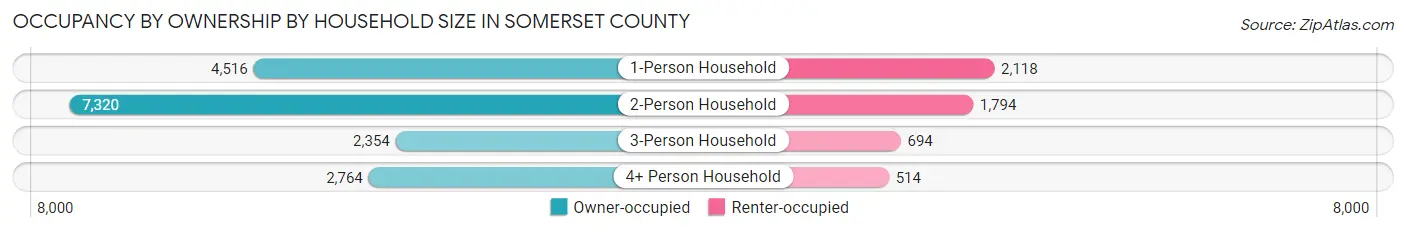
| Household Size | Owner-occupied | Renter-occupied |
| 1-Person Household | 4,516 (68.1%) | 2,118 (31.9%) |
| 2-Person Household | 7,320 (80.3%) | 1,794 (19.7%) |
| 3-Person Household | 2,354 (77.2%) | 694 (22.8%) |
| 4+ Person Household | 2,764 (84.3%) | 514 (15.7%) |
| Total Housing Units | 16,954 (76.8%) | 5,120 (23.2%) |
Occupancy by Educational Attainment in Somerset County
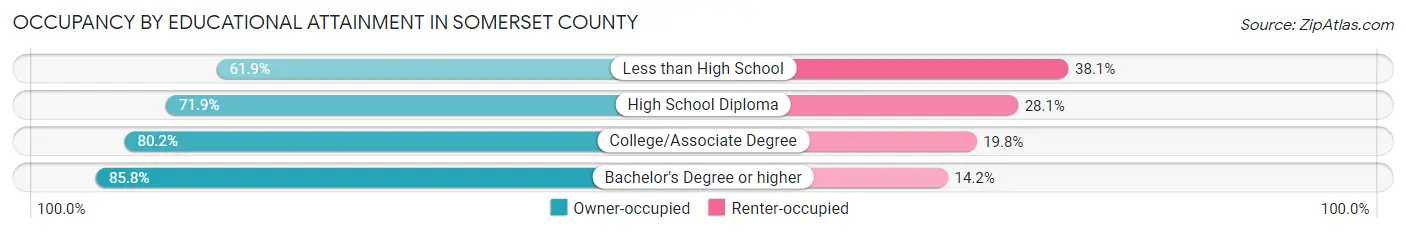
| Household Size | Owner-occupied | Renter-occupied |
| Less than High School | 1,043 (61.9%) | 641 (38.1%) |
| High School Diploma | 6,116 (71.9%) | 2,385 (28.1%) |
| College/Associate Degree | 5,801 (80.2%) | 1,435 (19.8%) |
| Bachelor's Degree or higher | 3,994 (85.8%) | 659 (14.2%) |
Occupancy by Age of Householder in Somerset County
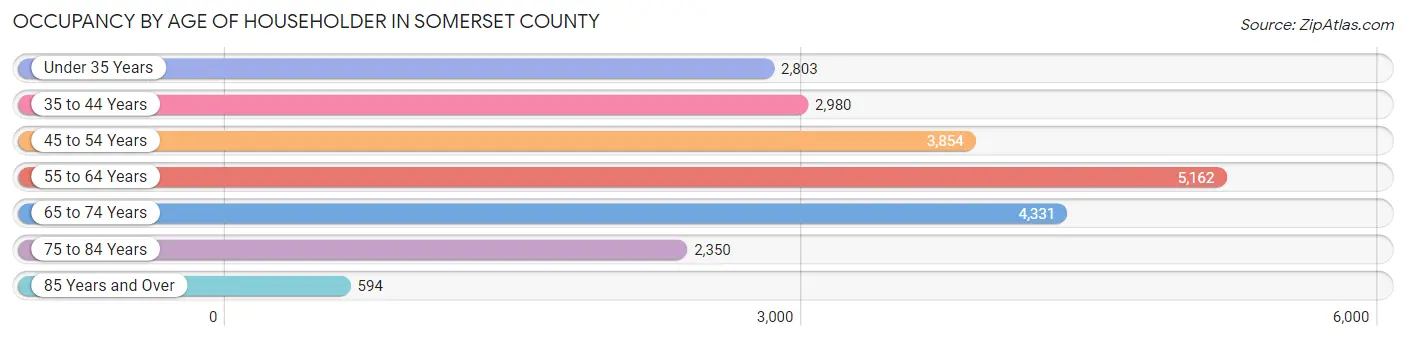
| Age Bracket | # Households | % Households |
| Under 35 Years | 2,803 | 12.7% |
| 35 to 44 Years | 2,980 | 13.5% |
| 45 to 54 Years | 3,854 | 17.5% |
| 55 to 64 Years | 5,162 | 23.4% |
| 65 to 74 Years | 4,331 | 19.6% |
| 75 to 84 Years | 2,350 | 10.6% |
| 85 Years and Over | 594 | 2.7% |
| Total | 22,074 | 100.0% |
Housing Finances in Somerset County
Median Income by Occupancy in Somerset County
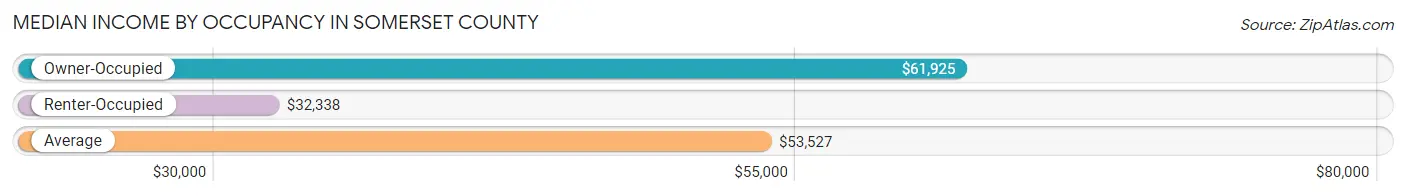
| Occupancy Type | # Households | Median Income |
| Owner-Occupied | 16,954 (76.8%) | $61,925 |
| Renter-Occupied | 5,120 (23.2%) | $32,338 |
| Average | 22,074 (100.0%) | $53,527 |
Occupancy by Householder Income Bracket in Somerset County
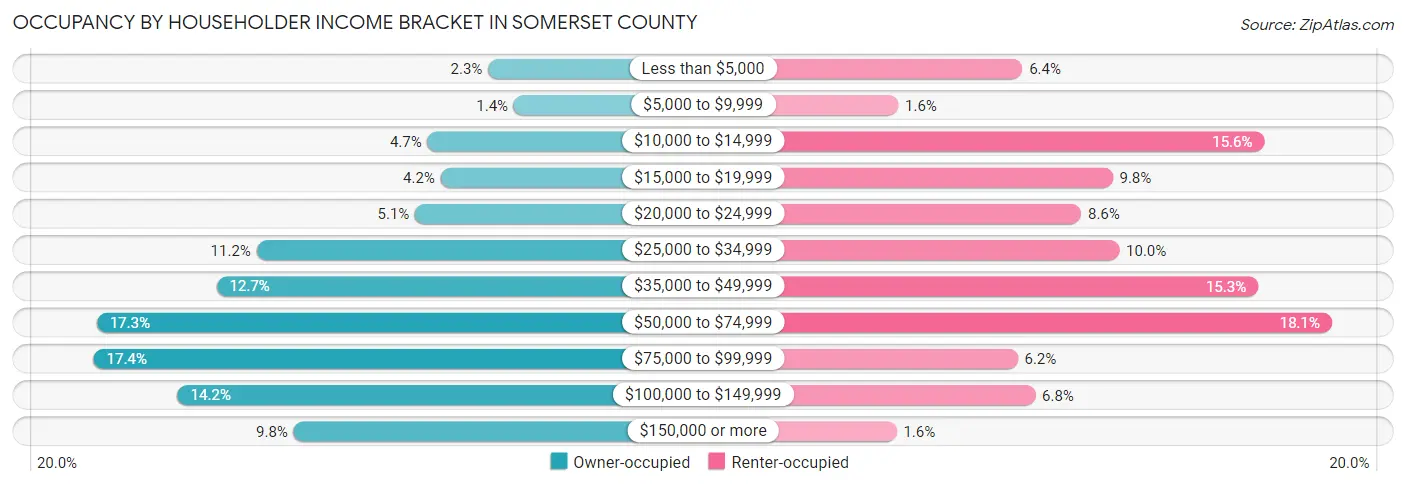
| Income Bracket | Owner-occupied | Renter-occupied |
| Less than $5,000 | 396 (2.3%) | 325 (6.4%) |
| $5,000 to $9,999 | 230 (1.4%) | 83 (1.6%) |
| $10,000 to $14,999 | 788 (4.6%) | 797 (15.6%) |
| $15,000 to $19,999 | 703 (4.2%) | 501 (9.8%) |
| $20,000 to $24,999 | 868 (5.1%) | 440 (8.6%) |
| $25,000 to $34,999 | 1,892 (11.2%) | 514 (10.0%) |
| $35,000 to $49,999 | 2,152 (12.7%) | 785 (15.3%) |
| $50,000 to $74,999 | 2,924 (17.2%) | 929 (18.1%) |
| $75,000 to $99,999 | 2,945 (17.4%) | 316 (6.2%) |
| $100,000 to $149,999 | 2,403 (14.2%) | 350 (6.8%) |
| $150,000 or more | 1,653 (9.8%) | 80 (1.6%) |
| Total | 16,954 (100.0%) | 5,120 (100.0%) |
Monthly Housing Cost Tiers in Somerset County
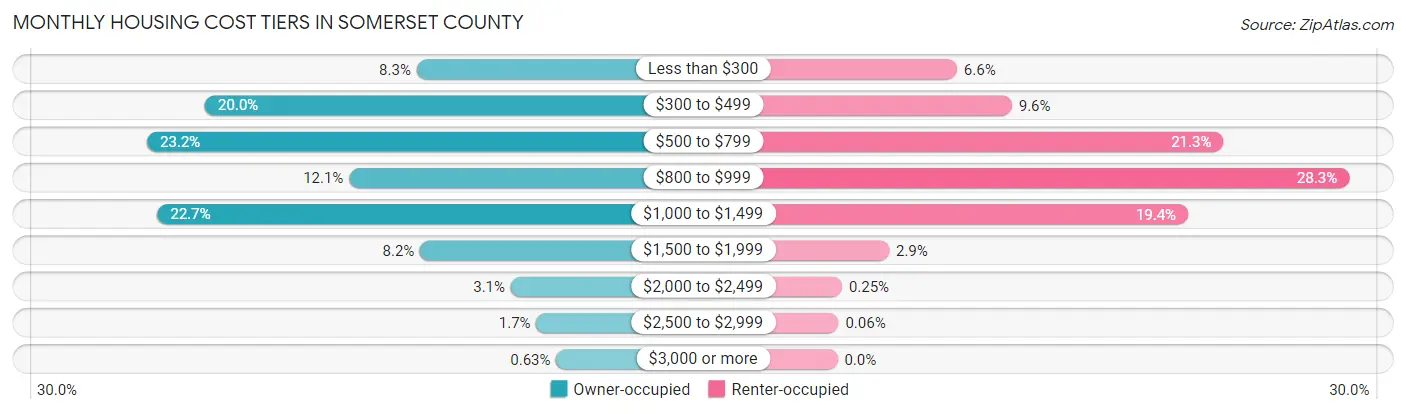
| Monthly Cost | Owner-occupied | Renter-occupied |
| Less than $300 | 1,414 (8.3%) | 338 (6.6%) |
| $300 to $499 | 3,397 (20.0%) | 493 (9.6%) |
| $500 to $799 | 3,940 (23.2%) | 1,091 (21.3%) |
| $800 to $999 | 2,047 (12.1%) | 1,447 (28.3%) |
| $1,000 to $1,499 | 3,843 (22.7%) | 991 (19.4%) |
| $1,500 to $1,999 | 1,382 (8.2%) | 146 (2.9%) |
| $2,000 to $2,499 | 532 (3.1%) | 13 (0.3%) |
| $2,500 to $2,999 | 293 (1.7%) | 3 (0.1%) |
| $3,000 or more | 106 (0.6%) | 0 (0.0%) |
| Total | 16,954 (100.0%) | 5,120 (100.0%) |
Physical Housing Characteristics in Somerset County
Housing Structures in Somerset County
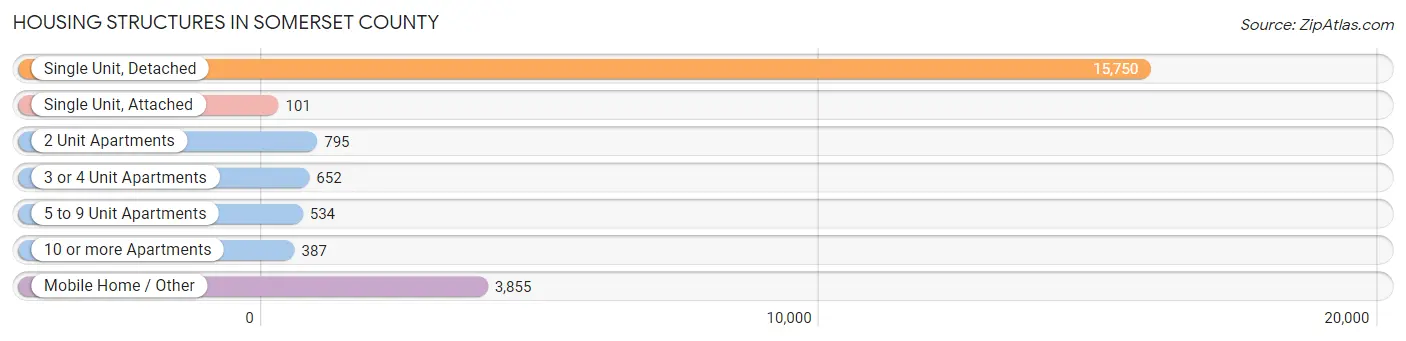
| Structure Type | # Housing Units | % Housing Units |
| Single Unit, Detached | 15,750 | 71.4% |
| Single Unit, Attached | 101 | 0.5% |
| 2 Unit Apartments | 795 | 3.6% |
| 3 or 4 Unit Apartments | 652 | 2.9% |
| 5 to 9 Unit Apartments | 534 | 2.4% |
| 10 or more Apartments | 387 | 1.8% |
| Mobile Home / Other | 3,855 | 17.5% |
| Total | 22,074 | 100.0% |
Housing Structures by Occupancy in Somerset County
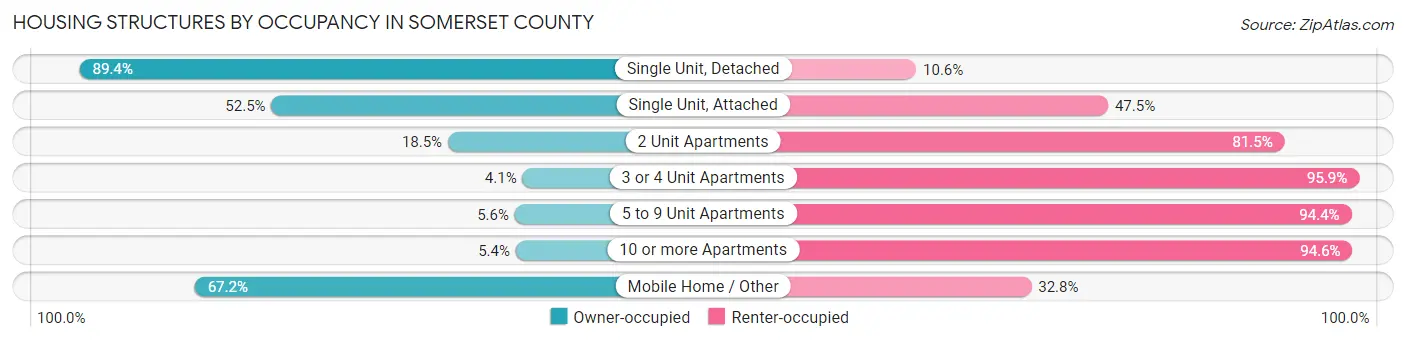
| Structure Type | Owner-occupied | Renter-occupied |
| Single Unit, Detached | 14,084 (89.4%) | 1,666 (10.6%) |
| Single Unit, Attached | 53 (52.5%) | 48 (47.5%) |
| 2 Unit Apartments | 147 (18.5%) | 648 (81.5%) |
| 3 or 4 Unit Apartments | 27 (4.1%) | 625 (95.9%) |
| 5 to 9 Unit Apartments | 30 (5.6%) | 504 (94.4%) |
| 10 or more Apartments | 21 (5.4%) | 366 (94.6%) |
| Mobile Home / Other | 2,592 (67.2%) | 1,263 (32.8%) |
| Total | 16,954 (76.8%) | 5,120 (23.2%) |
Housing Structures by Number of Rooms in Somerset County
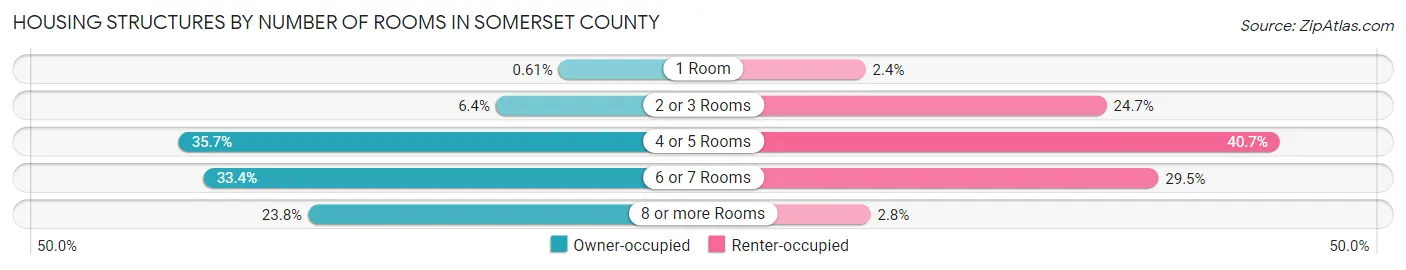
| Number of Rooms | Owner-occupied | Renter-occupied |
| 1 Room | 104 (0.6%) | 122 (2.4%) |
| 2 or 3 Rooms | 1,089 (6.4%) | 1,263 (24.7%) |
| 4 or 5 Rooms | 6,059 (35.7%) | 2,082 (40.7%) |
| 6 or 7 Rooms | 5,667 (33.4%) | 1,508 (29.4%) |
| 8 or more Rooms | 4,035 (23.8%) | 145 (2.8%) |
| Total | 16,954 (100.0%) | 5,120 (100.0%) |
Housing Structure by Heating Type in Somerset County
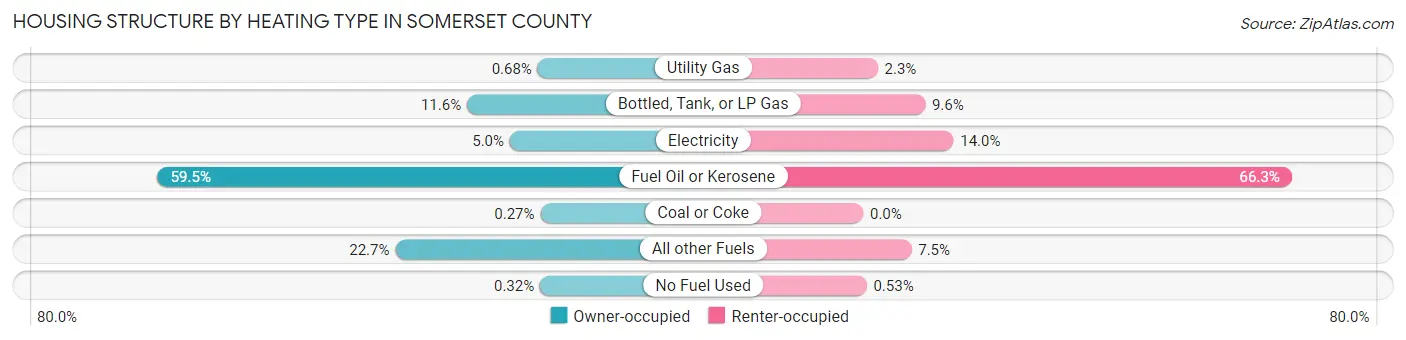
| Heating Type | Owner-occupied | Renter-occupied |
| Utility Gas | 115 (0.7%) | 115 (2.2%) |
| Bottled, Tank, or LP Gas | 1,968 (11.6%) | 490 (9.6%) |
| Electricity | 845 (5.0%) | 714 (14.0%) |
| Fuel Oil or Kerosene | 10,079 (59.5%) | 3,392 (66.2%) |
| Coal or Coke | 45 (0.3%) | 0 (0.0%) |
| All other Fuels | 3,847 (22.7%) | 382 (7.5%) |
| No Fuel Used | 55 (0.3%) | 27 (0.5%) |
| Total | 16,954 (100.0%) | 5,120 (100.0%) |
Household Vehicle Usage in Somerset County
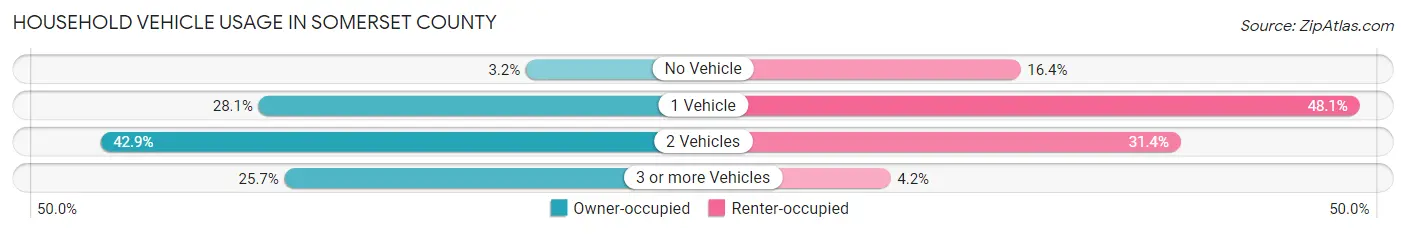
| Vehicles per Household | Owner-occupied | Renter-occupied |
| No Vehicle | 540 (3.2%) | 838 (16.4%) |
| 1 Vehicle | 4,771 (28.1%) | 2,460 (48.0%) |
| 2 Vehicles | 7,280 (42.9%) | 1,605 (31.4%) |
| 3 or more Vehicles | 4,363 (25.7%) | 217 (4.2%) |
| Total | 16,954 (100.0%) | 5,120 (100.0%) |
Real Estate & Mortgages in Somerset County
Real Estate and Mortgage Overview in Somerset County
| Characteristic | Without Mortgage | With Mortgage |
| Housing Units | 8,060 | 8,894 |
| Median Property Value | $134,500 | $160,400 |
| Median Household Income | $44,167 | $1,172 |
| Monthly Housing Costs | $463 | $106 |
| Real Estate Taxes | $1,691 | $217 |
Property Value by Mortgage Status in Somerset County
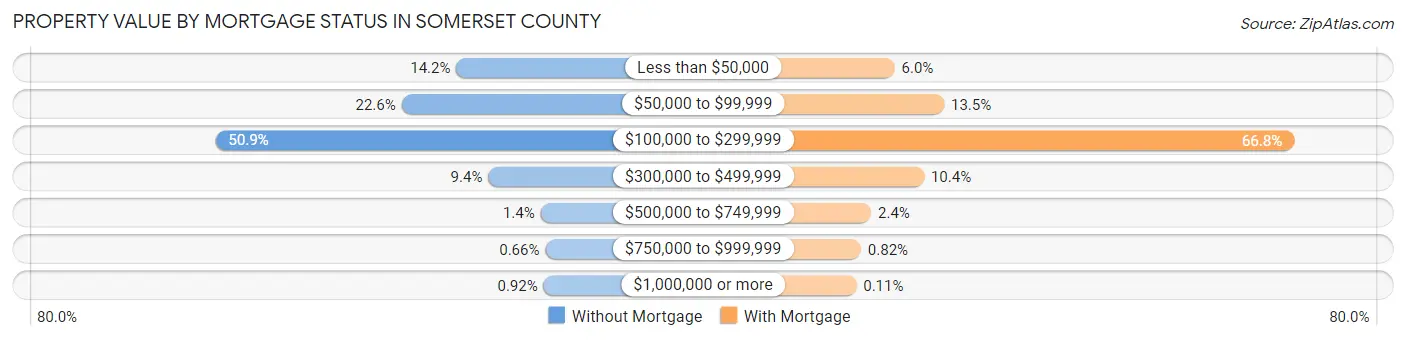
| Property Value | Without Mortgage | With Mortgage |
| Less than $50,000 | 1,146 (14.2%) | 529 (5.9%) |
| $50,000 to $99,999 | 1,818 (22.6%) | 1,199 (13.5%) |
| $100,000 to $299,999 | 4,104 (50.9%) | 5,944 (66.8%) |
| $300,000 to $499,999 | 754 (9.3%) | 928 (10.4%) |
| $500,000 to $749,999 | 111 (1.4%) | 211 (2.4%) |
| $750,000 to $999,999 | 53 (0.7%) | 73 (0.8%) |
| $1,000,000 or more | 74 (0.9%) | 10 (0.1%) |
| Total | 8,060 (100.0%) | 8,894 (100.0%) |
Household Income by Mortgage Status in Somerset County
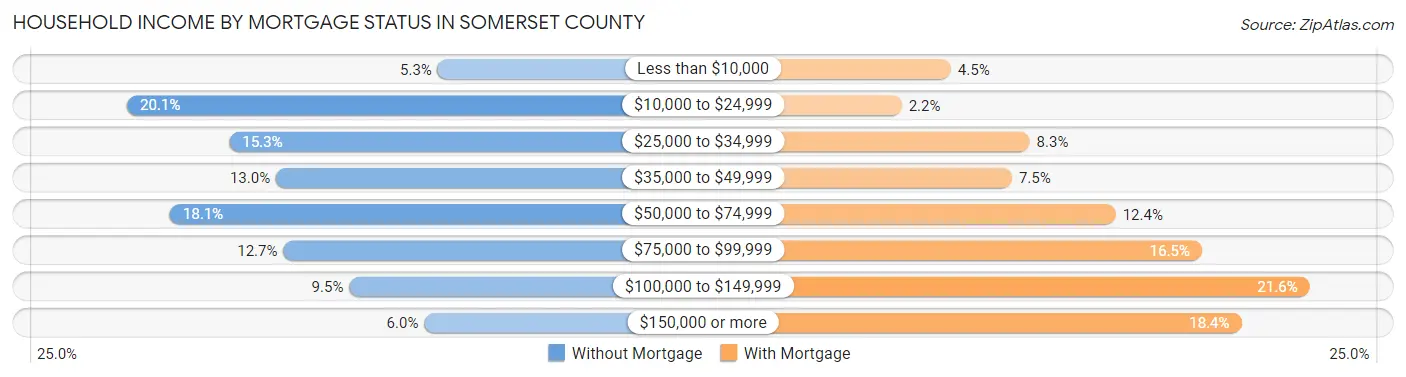
| Household Income | Without Mortgage | With Mortgage |
| Less than $10,000 | 430 (5.3%) | 404 (4.5%) |
| $10,000 to $24,999 | 1,622 (20.1%) | 196 (2.2%) |
| $25,000 to $34,999 | 1,229 (15.2%) | 737 (8.3%) |
| $35,000 to $49,999 | 1,050 (13.0%) | 663 (7.4%) |
| $50,000 to $74,999 | 1,457 (18.1%) | 1,102 (12.4%) |
| $75,000 to $99,999 | 1,022 (12.7%) | 1,467 (16.5%) |
| $100,000 to $149,999 | 769 (9.5%) | 1,923 (21.6%) |
| $150,000 or more | 481 (6.0%) | 1,634 (18.4%) |
| Total | 8,060 (100.0%) | 8,894 (100.0%) |
Property Value to Household Income Ratio in Somerset County
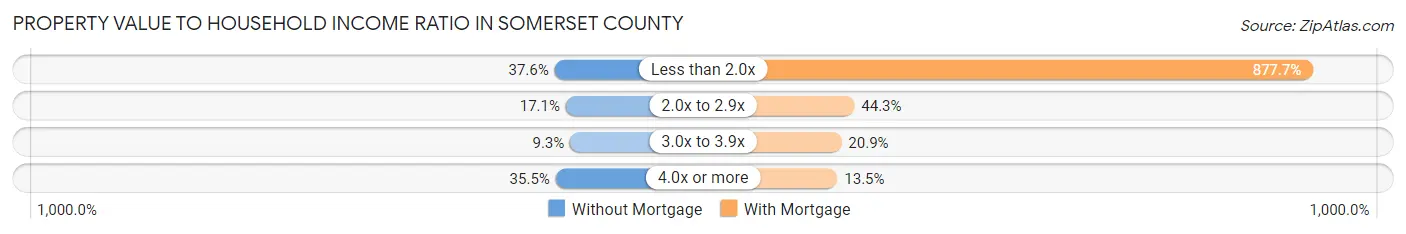
| Value-to-Income Ratio | Without Mortgage | With Mortgage |
| Less than 2.0x | 3,030 (37.6%) | 78,060 (877.7%) |
| 2.0x to 2.9x | 1,380 (17.1%) | 3,944 (44.3%) |
| 3.0x to 3.9x | 747 (9.3%) | 1,856 (20.9%) |
| 4.0x or more | 2,862 (35.5%) | 1,204 (13.5%) |
| Total | 8,060 (100.0%) | 8,894 (100.0%) |
Real Estate Taxes by Mortgage Status in Somerset County
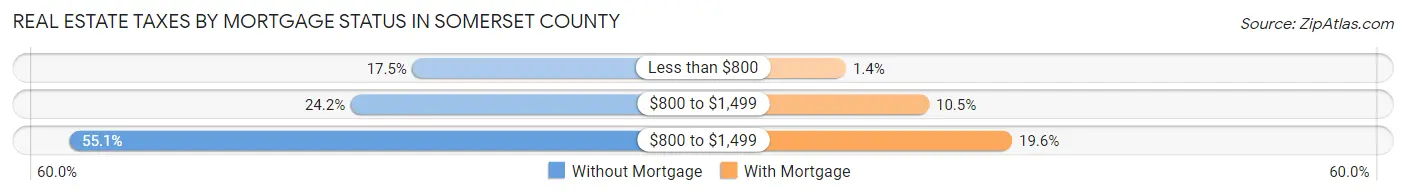
| Property Taxes | Without Mortgage | With Mortgage |
| Less than $800 | 1,408 (17.5%) | 126 (1.4%) |
| $800 to $1,499 | 1,953 (24.2%) | 936 (10.5%) |
| $800 to $1,499 | 4,443 (55.1%) | 1,745 (19.6%) |
| Total | 8,060 (100.0%) | 8,894 (100.0%) |
Health & Disability in Somerset County
Health Insurance Coverage by Age in Somerset County
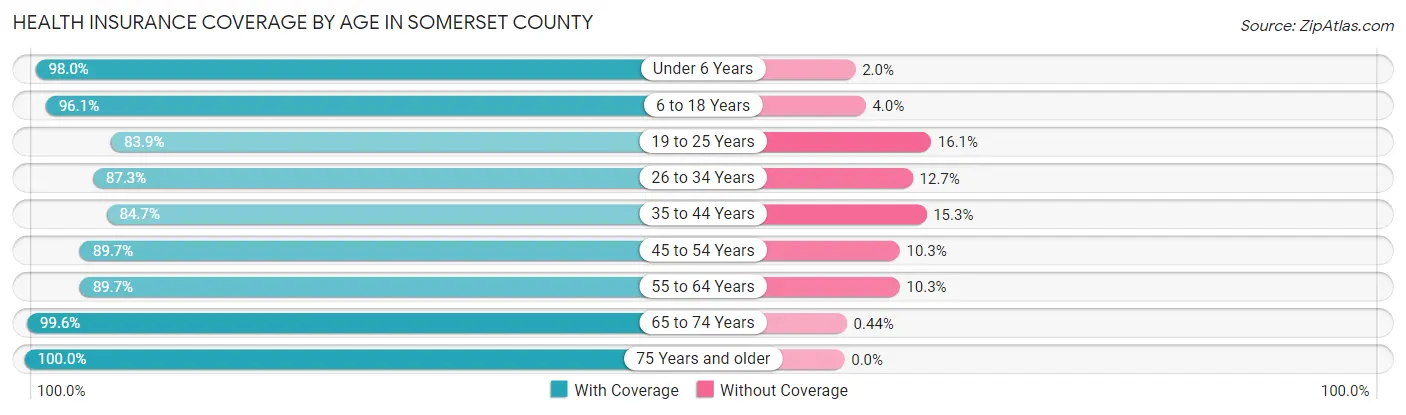
| Age Bracket | With Coverage | Without Coverage |
| Under 6 Years | 3,044 (98.0%) | 63 (2.0%) |
| 6 to 18 Years | 6,495 (96.1%) | 267 (4.0%) |
| 19 to 25 Years | 3,003 (83.9%) | 578 (16.1%) |
| 26 to 34 Years | 4,220 (87.3%) | 616 (12.7%) |
| 35 to 44 Years | 4,723 (84.7%) | 852 (15.3%) |
| 45 to 54 Years | 6,298 (89.7%) | 724 (10.3%) |
| 55 to 64 Years | 7,408 (89.7%) | 849 (10.3%) |
| 65 to 74 Years | 6,743 (99.6%) | 30 (0.4%) |
| 75 Years and older | 4,100 (100.0%) | 0 (0.0%) |
| Total | 46,034 (92.0%) | 3,979 (8.0%) |
Health Insurance Coverage by Citizenship Status in Somerset County
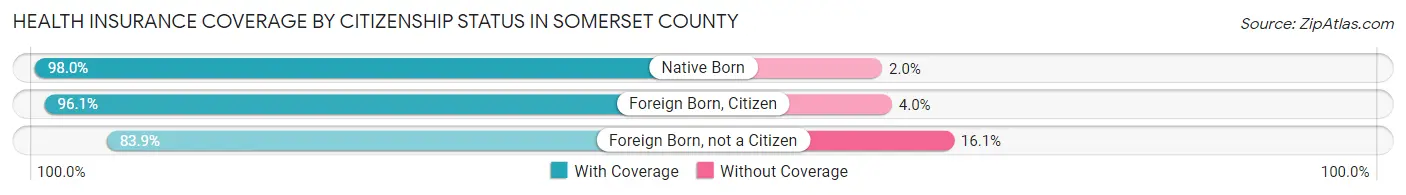
| Citizenship Status | With Coverage | Without Coverage |
| Native Born | 3,044 (98.0%) | 63 (2.0%) |
| Foreign Born, Citizen | 6,495 (96.1%) | 267 (4.0%) |
| Foreign Born, not a Citizen | 3,003 (83.9%) | 578 (16.1%) |
Health Insurance Coverage by Household Income in Somerset County
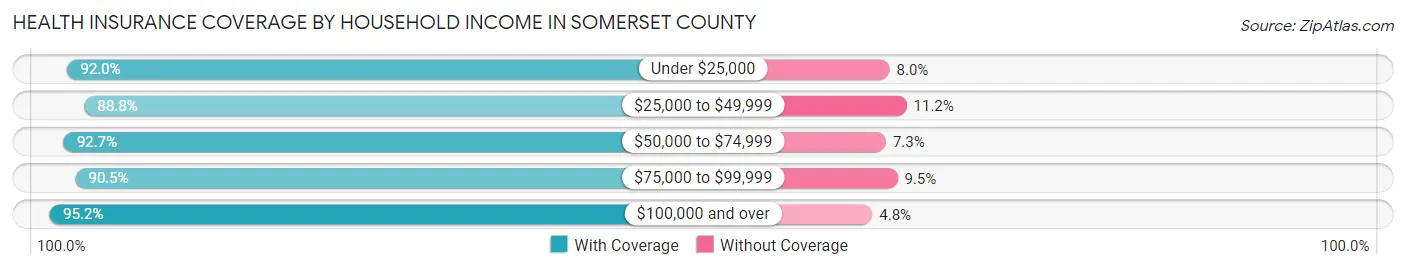
| Household Income | With Coverage | Without Coverage |
| Under $25,000 | 7,486 (92.0%) | 653 (8.0%) |
| $25,000 to $49,999 | 9,028 (88.8%) | 1,140 (11.2%) |
| $50,000 to $74,999 | 8,893 (92.7%) | 704 (7.3%) |
| $75,000 to $99,999 | 8,004 (90.5%) | 840 (9.5%) |
| $100,000 and over | 12,421 (95.2%) | 624 (4.8%) |
Public vs Private Health Insurance Coverage by Age in Somerset County
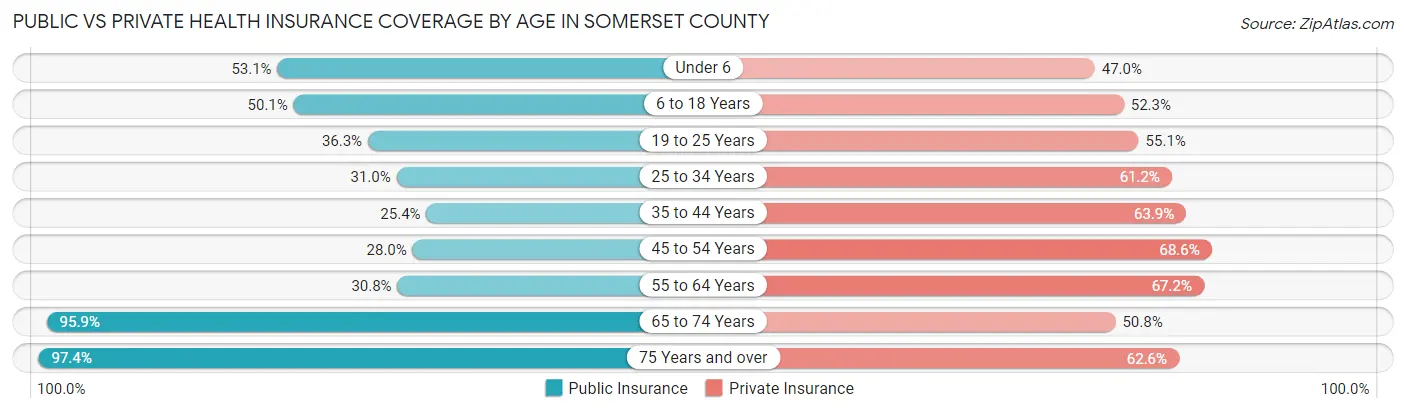
| Age Bracket | Public Insurance | Private Insurance |
| Under 6 | 1,649 (53.1%) | 1,459 (47.0%) |
| 6 to 18 Years | 3,386 (50.1%) | 3,539 (52.3%) |
| 19 to 25 Years | 1,299 (36.3%) | 1,973 (55.1%) |
| 25 to 34 Years | 1,497 (31.0%) | 2,961 (61.2%) |
| 35 to 44 Years | 1,417 (25.4%) | 3,562 (63.9%) |
| 45 to 54 Years | 1,965 (28.0%) | 4,819 (68.6%) |
| 55 to 64 Years | 2,542 (30.8%) | 5,547 (67.2%) |
| 65 to 74 Years | 6,496 (95.9%) | 3,441 (50.8%) |
| 75 Years and over | 3,994 (97.4%) | 2,565 (62.6%) |
| Total | 24,245 (48.5%) | 29,866 (59.7%) |
Disability Status by Sex by Age in Somerset County
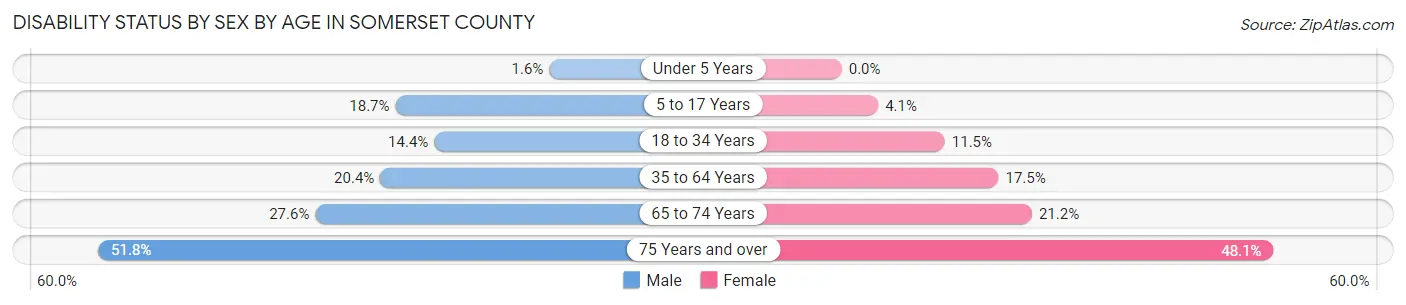
| Age Bracket | Male | Female |
| Under 5 Years | 19 (1.6%) | 0 (0.0%) |
| 5 to 17 Years | 676 (18.7%) | 137 (4.1%) |
| 18 to 34 Years | 654 (14.4%) | 499 (11.5%) |
| 35 to 64 Years | 2,113 (20.4%) | 1,832 (17.5%) |
| 65 to 74 Years | 944 (27.6%) | 711 (21.2%) |
| 75 Years and over | 944 (51.8%) | 1,095 (48.1%) |
Disability Class by Sex by Age in Somerset County
Disability Class: Hearing Difficulty
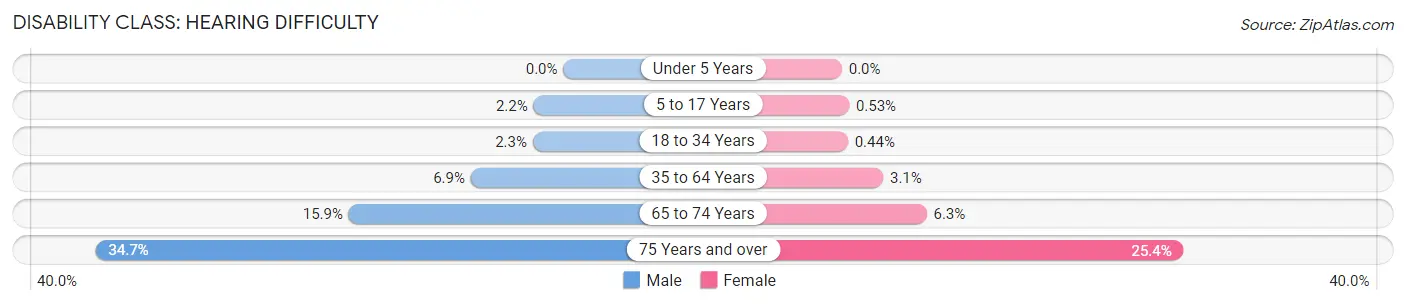
| Age Bracket | Male | Female |
| Under 5 Years | 0 (0.0%) | 0 (0.0%) |
| 5 to 17 Years | 80 (2.2%) | 18 (0.5%) |
| 18 to 34 Years | 103 (2.3%) | 19 (0.4%) |
| 35 to 64 Years | 712 (6.9%) | 321 (3.1%) |
| 65 to 74 Years | 544 (15.9%) | 211 (6.3%) |
| 75 Years and over | 633 (34.7%) | 578 (25.4%) |
Disability Class: Vision Difficulty
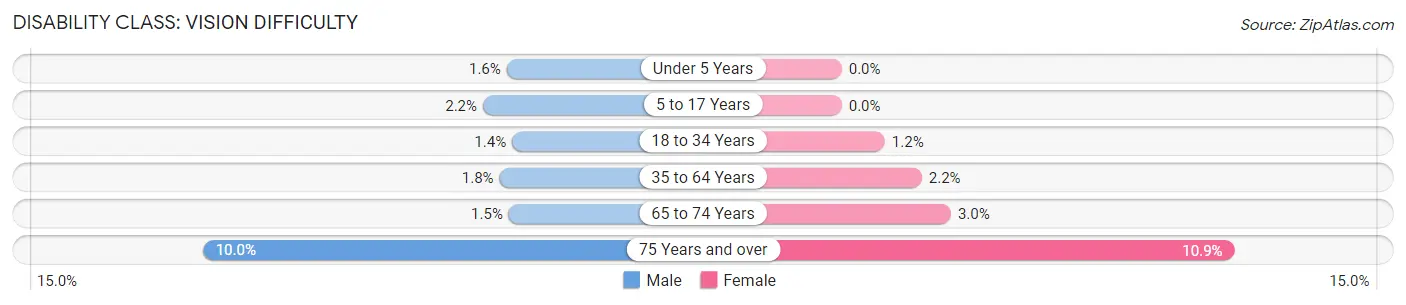
| Age Bracket | Male | Female |
| Under 5 Years | 19 (1.6%) | 0 (0.0%) |
| 5 to 17 Years | 81 (2.2%) | 0 (0.0%) |
| 18 to 34 Years | 65 (1.4%) | 52 (1.2%) |
| 35 to 64 Years | 184 (1.8%) | 234 (2.2%) |
| 65 to 74 Years | 52 (1.5%) | 102 (3.0%) |
| 75 Years and over | 183 (10.0%) | 249 (10.9%) |
Disability Class: Cognitive Difficulty
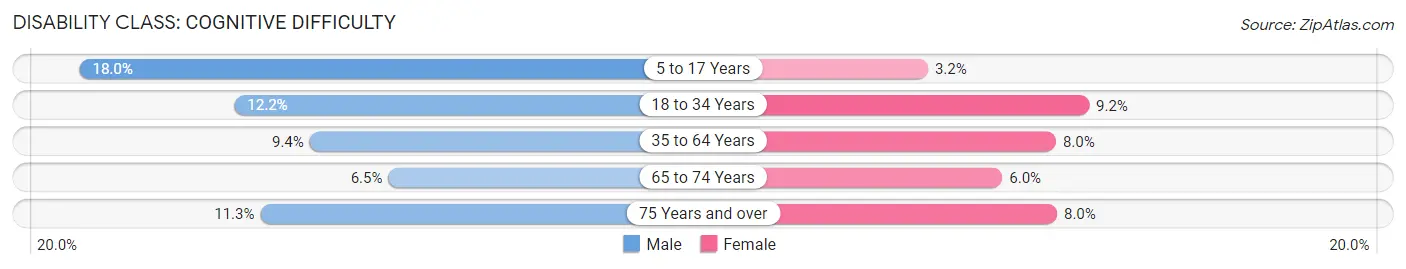
| Age Bracket | Male | Female |
| 5 to 17 Years | 649 (18.0%) | 108 (3.2%) |
| 18 to 34 Years | 555 (12.2%) | 399 (9.2%) |
| 35 to 64 Years | 976 (9.4%) | 834 (8.0%) |
| 65 to 74 Years | 222 (6.5%) | 200 (6.0%) |
| 75 Years and over | 205 (11.3%) | 182 (8.0%) |
Disability Class: Ambulatory Difficulty
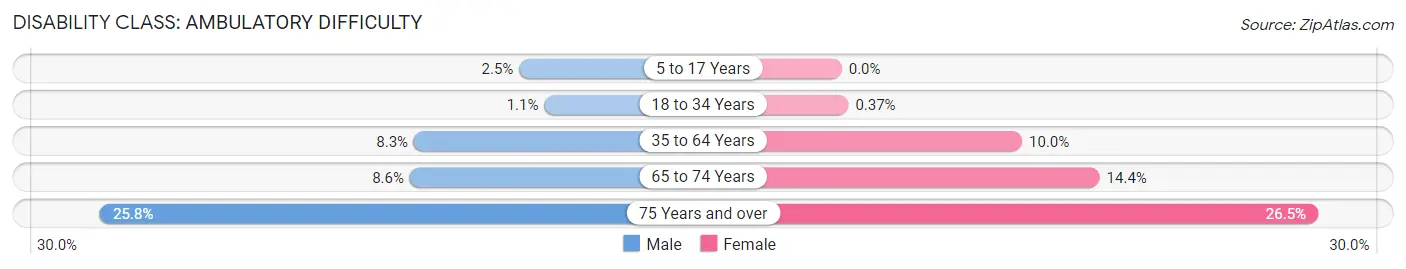
| Age Bracket | Male | Female |
| 5 to 17 Years | 89 (2.5%) | 0 (0.0%) |
| 18 to 34 Years | 48 (1.1%) | 16 (0.4%) |
| 35 to 64 Years | 862 (8.3%) | 1,054 (10.0%) |
| 65 to 74 Years | 292 (8.6%) | 482 (14.4%) |
| 75 Years and over | 470 (25.8%) | 604 (26.5%) |
Disability Class: Self-Care Difficulty
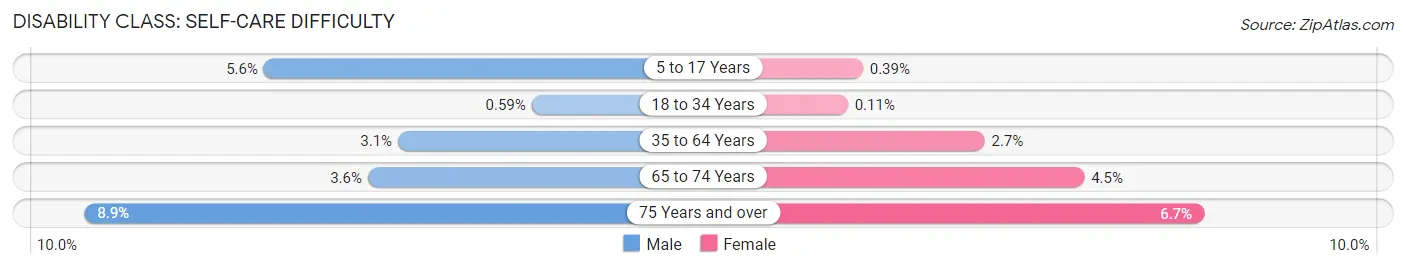
| Age Bracket | Male | Female |
| 5 to 17 Years | 201 (5.6%) | 13 (0.4%) |
| 18 to 34 Years | 27 (0.6%) | 5 (0.1%) |
| 35 to 64 Years | 318 (3.1%) | 278 (2.6%) |
| 65 to 74 Years | 124 (3.6%) | 151 (4.5%) |
| 75 Years and over | 162 (8.9%) | 153 (6.7%) |
Technology Access in Somerset County
Computing Device Access in Somerset County
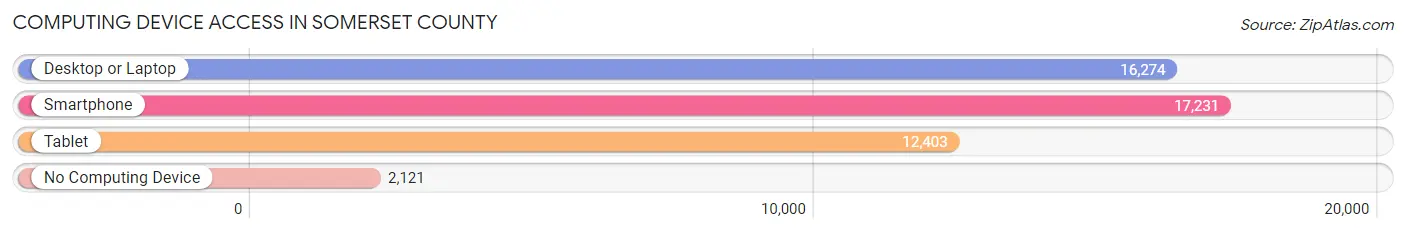
| Device Type | # Households | % Households |
| Desktop or Laptop | 16,274 | 73.7% |
| Smartphone | 17,231 | 78.1% |
| Tablet | 12,403 | 56.2% |
| No Computing Device | 2,121 | 9.6% |
| Total | 22,074 | 100.0% |
Internet Access in Somerset County
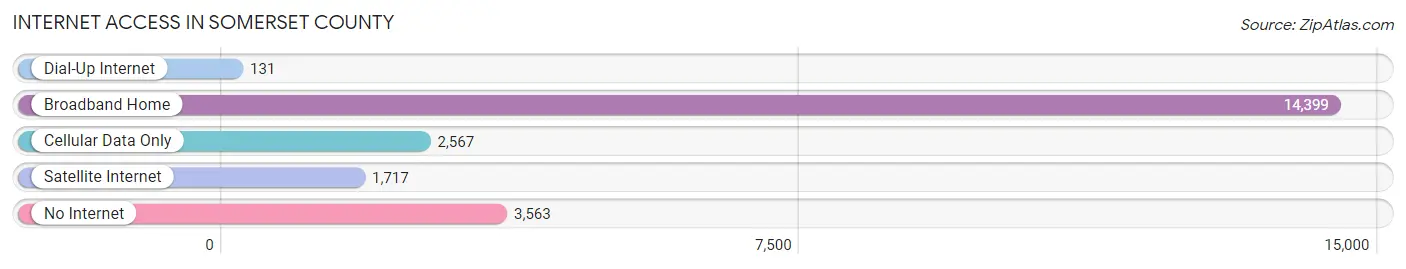
| Internet Type | # Households | % Households |
| Dial-Up Internet | 131 | 0.6% |
| Broadband Home | 14,399 | 65.2% |
| Cellular Data Only | 2,567 | 11.6% |
| Satellite Internet | 1,717 | 7.8% |
| No Internet | 3,563 | 16.1% |
| Total | 22,074 | 100.0% |
Somerset County Summary
Somerset County is a county located in the state of Maine, in the United States. As of the 2010 census, the population was 52,228. Its county seat is Skowhegan. The county was established on March 1, 1809 from a portion of Kennebec County and named after Somerset County in England.
Geography
Somerset County is located in the state of Maine, in the United States. It is bordered by Kennebec County to the east, Franklin County to the south, and Aroostook County to the north. The county has a total area of 2,845 square miles, of which 2,717 square miles is land and 128 square miles is water. The highest point in the county is Mount Bigelow, at an elevation of 3,945 feet.
The county is home to several rivers, including the Kennebec River, the Dead River, the Sandy River, and the St. John River. The county also contains several lakes, including Moosehead Lake, Flagstaff Lake, and Seboomook Lake.
Demographics
As of the 2010 census, there were 52,228 people, 20,845 households, and 14,717 families residing in the county. The population density was 19.2 people per square mile. The racial makeup of the county was 95.3% White, 0.7% African American, 1.2% Native American, 0.5% Asian, 0.1% Pacific Islander, 0.5% from other races, and 1.7% from two or more races. Hispanic or Latino of any race were 1.3% of the population.
The median income for a household in the county was $37,845, and the median income for a family was $45,945. The per capita income for the county was $19,845. About 11.3% of families and 15.2% of the population were below the poverty line, including 20.2% of those under age 18 and 11.2% of those age 65 or over.
Economy
Somerset County is home to a variety of industries, including agriculture, forestry, manufacturing, and tourism. The county is home to several large employers, including Sappi Fine Paper, Huber Engineered Woods, and Maine Wood Products.
Agriculture is an important part of the county's economy. The county is home to several large farms, including the Maine Potato Company, which produces potatoes for the potato chip industry. The county is also home to several dairy farms, as well as several apple orchards.
The county is home to several large forestry companies, including Weyerhaeuser and Plum Creek. These companies harvest timber from the county's forests and process it into lumber and other wood products.
Manufacturing is also an important part of the county's economy. The county is home to several large manufacturing companies, including Huber Engineered Woods, which produces engineered wood products, and Maine Wood Products, which produces furniture and other wood products.
Tourism is also an important part of the county's economy. The county is home to several popular tourist attractions, including Moosehead Lake, the Appalachian Trail, and the Kennebec River.
Conclusion
Somerset County is a county located in the state of Maine, in the United States. As of the 2010 census, the population was 52,228. Its county seat is Skowhegan. The county was established on March 1, 1809 from a portion of Kennebec County and named after Somerset County in England. The county has a total area of 2,845 square miles, of which 2,717 square miles is land and 128 square miles is water. The county is home to several industries, including agriculture, forestry, manufacturing, and tourism. The county is home to several large employers, including Sappi Fine Paper, Huber Engineered Woods, and Maine Wood Products. Tourism is also an important part of the county's economy, with several popular tourist attractions, including Moosehead Lake, the Appalachian Trail, and the Kennebec River.
Common Questions
What is Per Capita Income in Somerset County?
Per Capita income in Somerset County is $31,348.
What is the Median Family Income in Somerset County?
Median Family Income in Somerset County is $70,093.
What is the Median Household income in Somerset County?
Median Household Income in Somerset County is $53,527.
What is Income or Wage Gap in Somerset County?
Income or Wage Gap in Somerset County is 34.6%.
Women in Somerset County earn 65.4 cents for every dollar earned by a man.
What is Family Income Deficit in Somerset County?
Family Income Deficit in Somerset County is $6,738.
Families that are below poverty line in Somerset County earn $6,738 less on average than the poverty threshold level.
What is Inequality or Gini Index in Somerset County?
Inequality or Gini Index in Somerset County is 0.46.
What is the Total Population of Somerset County?
Total Population of Somerset County is 50,656.
What is the Total Male Population of Somerset County?
Total Male Population of Somerset County is 25,290.
What is the Total Female Population of Somerset County?
Total Female Population of Somerset County is 25,366.
What is the Ratio of Males per 100 Females in Somerset County?
There are 99.70 Males per 100 Females in Somerset County.
What is the Ratio of Females per 100 Males in Somerset County?
There are 100.30 Females per 100 Males in Somerset County.
What is the Median Population Age in Somerset County?
Median Population Age in Somerset County is 47.0 Years.
What is the Average Family Size in Somerset County
Average Family Size in Somerset County is 2.8 People.
What is the Average Household Size in Somerset County
Average Household Size in Somerset County is 2.3 People.
How Large is the Labor Force in Somerset County?
There are 23,643 People in the Labor Forcein in Somerset County.
What is the Percentage of People in the Labor Force in Somerset County?
55.6% of People are in the Labor Force in Somerset County.
What is the Unemployment Rate in Somerset County?
Unemployment Rate in Somerset County is 4.2%.