Old Orchard Beach, ME Map & Demographics
Old Orchard Beach Map
Old Orchard Beach Overview
$44,604
PER CAPITA INCOME
$100,213
AVG FAMILY INCOME
$62,335
AVG HOUSEHOLD INCOME
0.2%
WAGE / INCOME GAP [ % ]
99.8¢/ $1
WAGE / INCOME GAP [ $ ]
0.45
INEQUALITY / GINI INDEX
9,040
TOTAL POPULATION
4,385
MALE POPULATION
4,655
FEMALE POPULATION
94.20
MALES / 100 FEMALES
106.16
FEMALES / 100 MALES
57.5
MEDIAN AGE
2.4
AVG FAMILY SIZE
1.7
AVG HOUSEHOLD SIZE
5,213
LABOR FORCE [ PEOPLE ]
61.3%
PERCENT IN LABOR FORCE
5.6%
UNEMPLOYMENT RATE
Old Orchard Beach Zip Codes
Old Orchard Beach Area Codes
Income in Old Orchard Beach
Income Overview in Old Orchard Beach
Per Capita Income in Old Orchard Beach is $44,604, while median incomes of families and households are $100,213 and $62,335 respectively.
| Characteristic | Number | Measure |
| Per Capita Income | 9,040 | $44,604 |
| Median Family Income | 2,208 | $100,213 |
| Mean Family Income | 2,208 | $107,422 |
| Median Household Income | 5,224 | $62,335 |
| Mean Household Income | 5,224 | $78,285 |
| Income Deficit | 2,208 | $0 |
| Wage / Income Gap (%) | 9,040 | 0.15% |
| Wage / Income Gap ($) | 9,040 | 99.85¢ per $1 |
| Gini / Inequality Index | 9,040 | 0.45 |
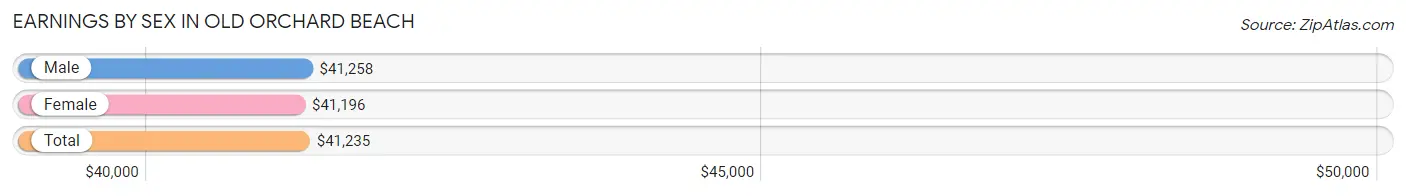
Earnings by Sex in Old Orchard Beach
Average Earnings in Old Orchard Beach are $41,235, $41,258 for men and $41,196 for women, a difference of 0.2%.
| Sex | Number | Average Earnings |
| Male | 3,089 (55.7%) | $41,258 |
| Female | 2,452 (44.3%) | $41,196 |
| Total | 5,541 (100.0%) | $41,235 |
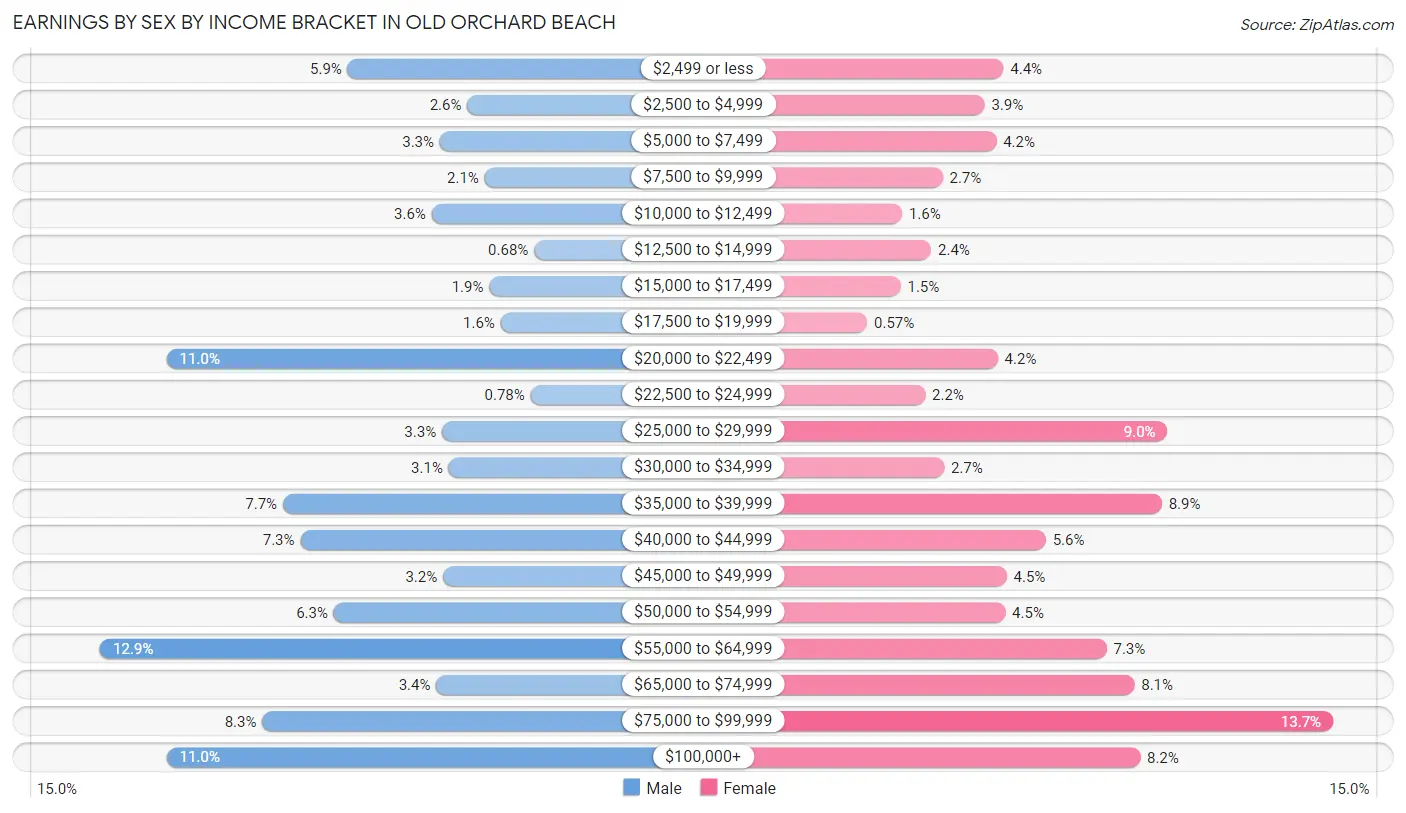
Earnings by Sex by Income Bracket in Old Orchard Beach
The most common earnings brackets in Old Orchard Beach are $55,000 to $64,999 for men (398 | 12.9%) and $75,000 to $99,999 for women (335 | 13.7%).
| Income | Male | Female |
| $2,499 or less | 183 (5.9%) | 108 (4.4%) |
| $2,500 to $4,999 | 79 (2.6%) | 95 (3.9%) |
| $5,000 to $7,499 | 103 (3.3%) | 103 (4.2%) |
| $7,500 to $9,999 | 64 (2.1%) | 66 (2.7%) |
| $10,000 to $12,499 | 110 (3.6%) | 38 (1.5%) |
| $12,500 to $14,999 | 21 (0.7%) | 58 (2.4%) |
| $15,000 to $17,499 | 60 (1.9%) | 37 (1.5%) |
| $17,500 to $19,999 | 50 (1.6%) | 14 (0.6%) |
| $20,000 to $22,499 | 340 (11.0%) | 104 (4.2%) |
| $22,500 to $24,999 | 24 (0.8%) | 54 (2.2%) |
| $25,000 to $29,999 | 101 (3.3%) | 221 (9.0%) |
| $30,000 to $34,999 | 95 (3.1%) | 67 (2.7%) |
| $35,000 to $39,999 | 239 (7.7%) | 217 (8.8%) |
| $40,000 to $44,999 | 224 (7.2%) | 137 (5.6%) |
| $45,000 to $49,999 | 100 (3.2%) | 110 (4.5%) |
| $50,000 to $54,999 | 195 (6.3%) | 109 (4.4%) |
| $55,000 to $64,999 | 398 (12.9%) | 179 (7.3%) |
| $65,000 to $74,999 | 106 (3.4%) | 198 (8.1%) |
| $75,000 to $99,999 | 257 (8.3%) | 335 (13.7%) |
| $100,000+ | 340 (11.0%) | 202 (8.2%) |
| Total | 3,089 (100.0%) | 2,452 (100.0%) |
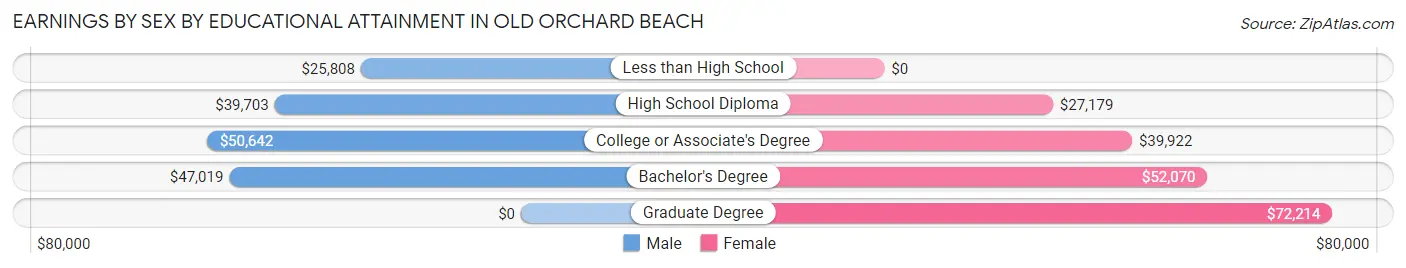
Earnings by Sex by Educational Attainment in Old Orchard Beach
Average earnings in Old Orchard Beach are $44,566 for men and $43,722 for women, a difference of 1.9%. Men with an educational attainment of college or associate's degree enjoy the highest average annual earnings of $50,642, while those with less than high school education earn the least with $25,808. Women with an educational attainment of graduate degree earn the most with the average annual earnings of $72,214, while those with high school diploma education have the smallest earnings of $27,179.
| Educational Attainment | Male Income | Female Income |
| Less than High School | $25,808 | $0 |
| High School Diploma | $39,703 | $27,179 |
| College or Associate's Degree | $50,642 | $39,922 |
| Bachelor's Degree | $47,019 | $52,070 |
| Graduate Degree | - | - |
| Total | $44,566 | $43,722 |
Family Income in Old Orchard Beach
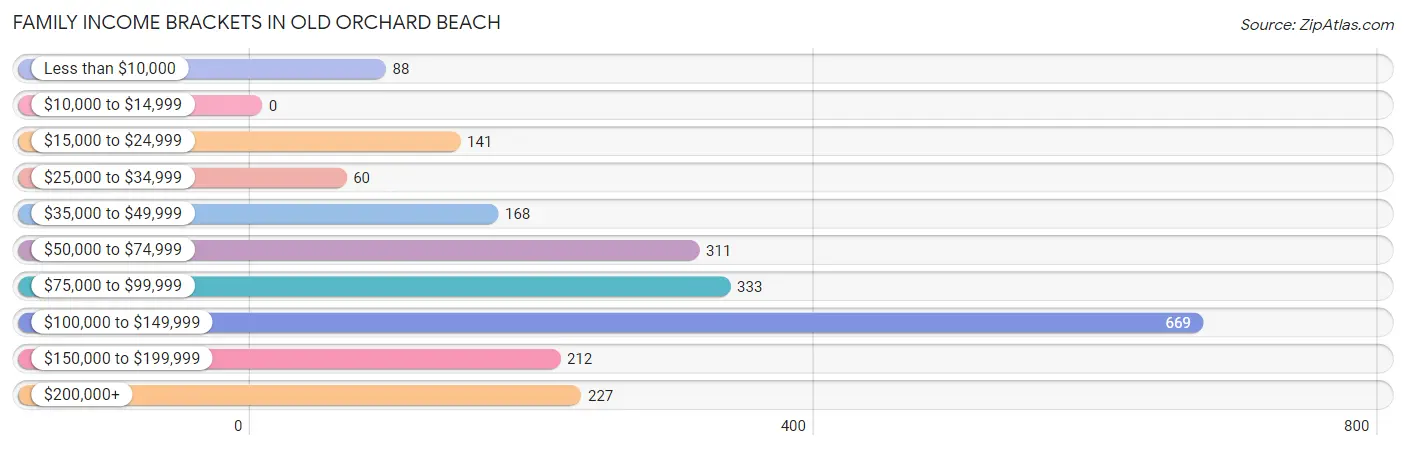
Family Income Brackets in Old Orchard Beach
According to the Old Orchard Beach family income data, there are 669 families falling into the $100,000 to $149,999 income range, which is the most common income bracket and makes up 30.3% of all families.
| Income Bracket | # Families | % Families |
| Less than $10,000 | 88 | 4.0% |
| $10,000 to $14,999 | 0 | 0.0% |
| $15,000 to $24,999 | 141 | 6.4% |
| $25,000 to $34,999 | 60 | 2.7% |
| $35,000 to $49,999 | 168 | 7.6% |
| $50,000 to $74,999 | 311 | 14.1% |
| $75,000 to $99,999 | 333 | 15.1% |
| $100,000 to $149,999 | 669 | 30.3% |
| $150,000 to $199,999 | 212 | 9.6% |
| $200,000+ | 227 | 10.3% |
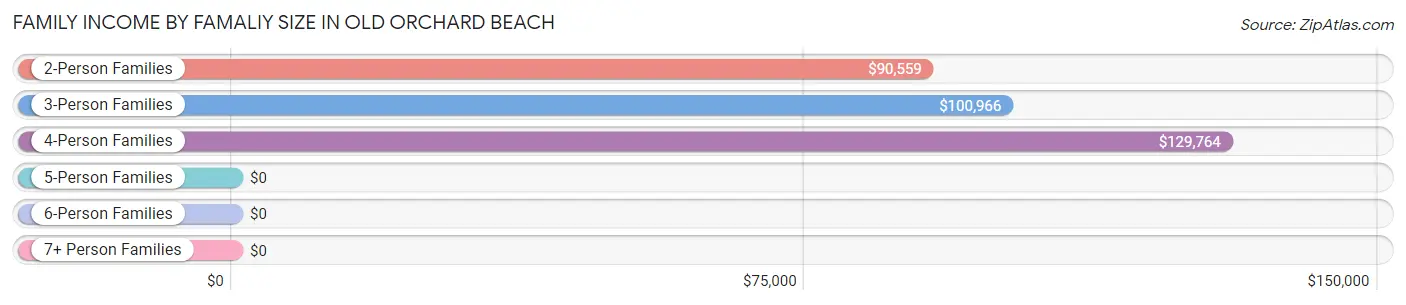
Family Income by Famaliy Size in Old Orchard Beach
4-person families (263 | 11.9%) account for the highest median family income in Old Orchard Beach with $129,764 per family, while 2-person families (1,563 | 70.8%) have the highest median income of $45,280 per family member.
| Income Bracket | # Families | Median Income |
| 2-Person Families | 1,563 (70.8%) | $90,559 |
| 3-Person Families | 363 (16.4%) | $100,966 |
| 4-Person Families | 263 (11.9%) | $129,764 |
| 5-Person Families | 0 (0.0%) | $0 |
| 6-Person Families | 19 (0.9%) | $0 |
| 7+ Person Families | 0 (0.0%) | $0 |
| Total | 2,208 (100.0%) | $100,213 |
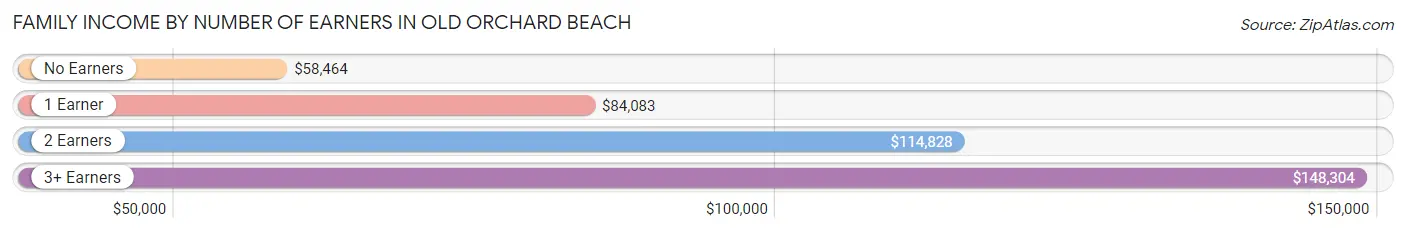
Family Income by Number of Earners in Old Orchard Beach
The median family income in Old Orchard Beach is $100,213, with families comprising 3+ earners (249) having the highest median family income of $148,304, while families with no earners (435) have the lowest median family income of $58,464, accounting for 11.3% and 19.7% of families, respectively.
| Number of Earners | # Families | Median Income |
| No Earners | 435 (19.7%) | $58,464 |
| 1 Earner | 682 (30.9%) | $84,083 |
| 2 Earners | 842 (38.1%) | $114,828 |
| 3+ Earners | 249 (11.3%) | $148,304 |
| Total | 2,208 (100.0%) | $100,213 |
Household Income in Old Orchard Beach
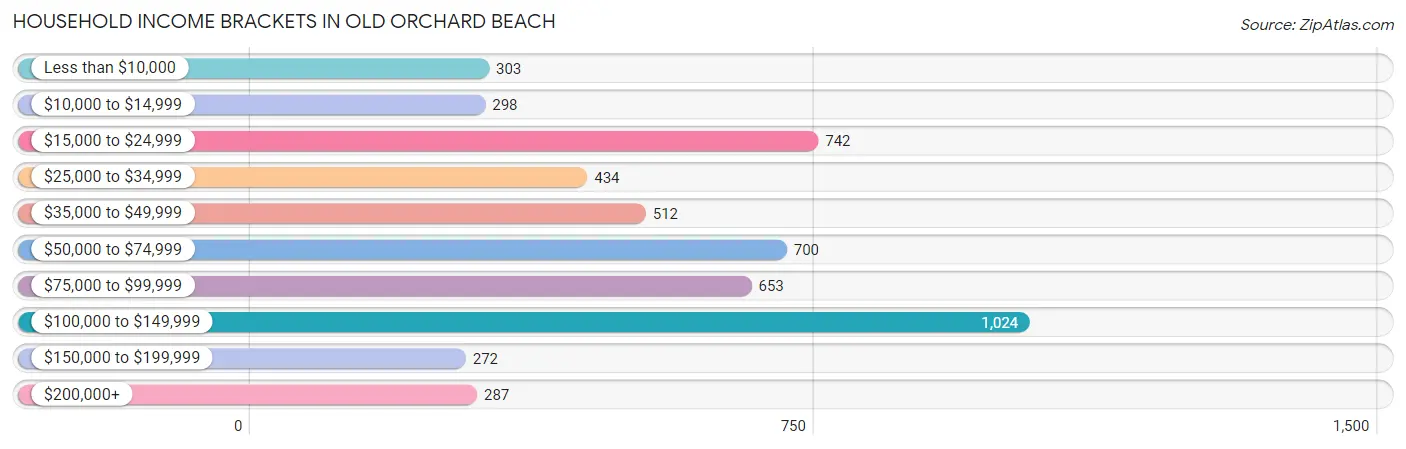
Household Income Brackets in Old Orchard Beach
With 1,024 households falling in the category, the $100,000 to $149,999 income range is the most frequent in Old Orchard Beach, accounting for 19.6% of all households. In contrast, only 272 households (5.2%) fall into the $150,000 to $199,999 income bracket, making it the least populous group.
| Income Bracket | # Households | % Households |
| Less than $10,000 | 303 | 5.8% |
| $10,000 to $14,999 | 298 | 5.7% |
| $15,000 to $24,999 | 742 | 14.2% |
| $25,000 to $34,999 | 434 | 8.3% |
| $35,000 to $49,999 | 512 | 9.8% |
| $50,000 to $74,999 | 700 | 13.4% |
| $75,000 to $99,999 | 653 | 12.5% |
| $100,000 to $149,999 | 1,024 | 19.6% |
| $150,000 to $199,999 | 272 | 5.2% |
| $200,000+ | 287 | 5.5% |
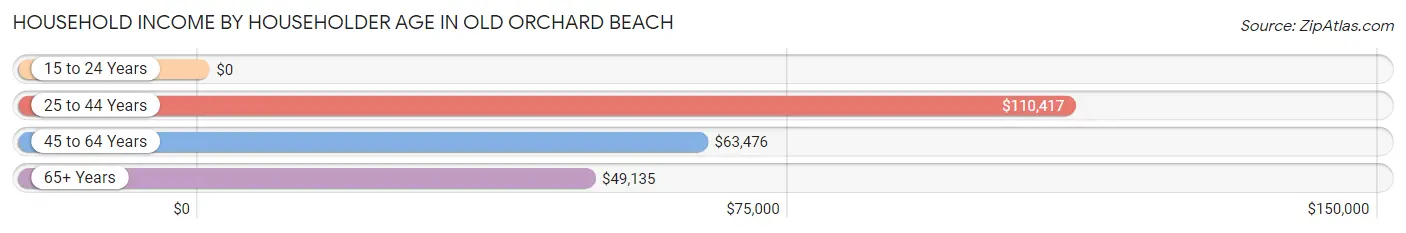
Household Income by Householder Age in Old Orchard Beach
The median household income in Old Orchard Beach is $62,335, with the highest median household income of $110,417 found in the 25 to 44 years age bracket for the primary householder. A total of 940 households (18.0%) fall into this category. Meanwhile, the 15 to 24 years age bracket for the primary householder has the lowest median household income of $0, with 144 households (2.8%) in this group.
| Income Bracket | # Households | Median Income |
| 15 to 24 Years | 144 (2.8%) | $0 |
| 25 to 44 Years | 940 (18.0%) | $110,417 |
| 45 to 64 Years | 2,311 (44.2%) | $63,476 |
| 65+ Years | 1,829 (35.0%) | $49,135 |
| Total | 5,224 (100.0%) | $62,335 |
Poverty in Old Orchard Beach
Income Below Poverty by Sex and Age in Old Orchard Beach
With 10.9% poverty level for males and 13.9% for females among the residents of Old Orchard Beach, 6 to 11 year old males and 12 to 14 year old females are the most vulnerable to poverty, with 40 males (39.2%) and 35 females (74.5%) in their respective age groups living below the poverty level.
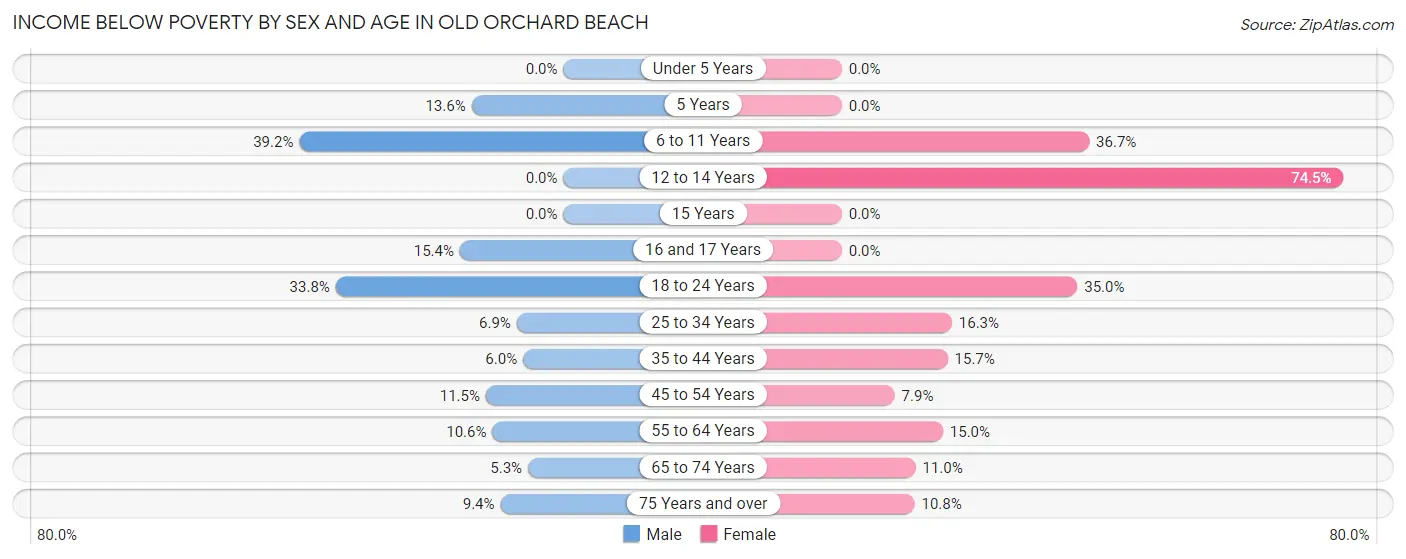
| Age Bracket | Male | Female |
| Under 5 Years | 0 (0.0%) | 0 (0.0%) |
| 5 Years | 6 (13.6%) | 0 (0.0%) |
| 6 to 11 Years | 40 (39.2%) | 36 (36.7%) |
| 12 to 14 Years | 0 (0.0%) | 35 (74.5%) |
| 15 Years | 0 (0.0%) | 0 (0.0%) |
| 16 and 17 Years | 12 (15.4%) | 0 (0.0%) |
| 18 to 24 Years | 95 (33.8%) | 50 (35.0%) |
| 25 to 34 Years | 42 (6.9%) | 92 (16.3%) |
| 35 to 44 Years | 29 (6.0%) | 60 (15.7%) |
| 45 to 54 Years | 63 (11.5%) | 47 (7.9%) |
| 55 to 64 Years | 121 (10.5%) | 142 (15.0%) |
| 65 to 74 Years | 35 (5.3%) | 138 (11.0%) |
| 75 Years and over | 33 (9.3%) | 46 (10.8%) |
| Total | 476 (10.9%) | 646 (13.9%) |
Income Above Poverty by Sex and Age in Old Orchard Beach
According to the poverty statistics in Old Orchard Beach, males aged under 5 years and females aged under 5 years are the age groups that are most secure financially, with 100.0% of males and 100.0% of females in these age groups living above the poverty line.
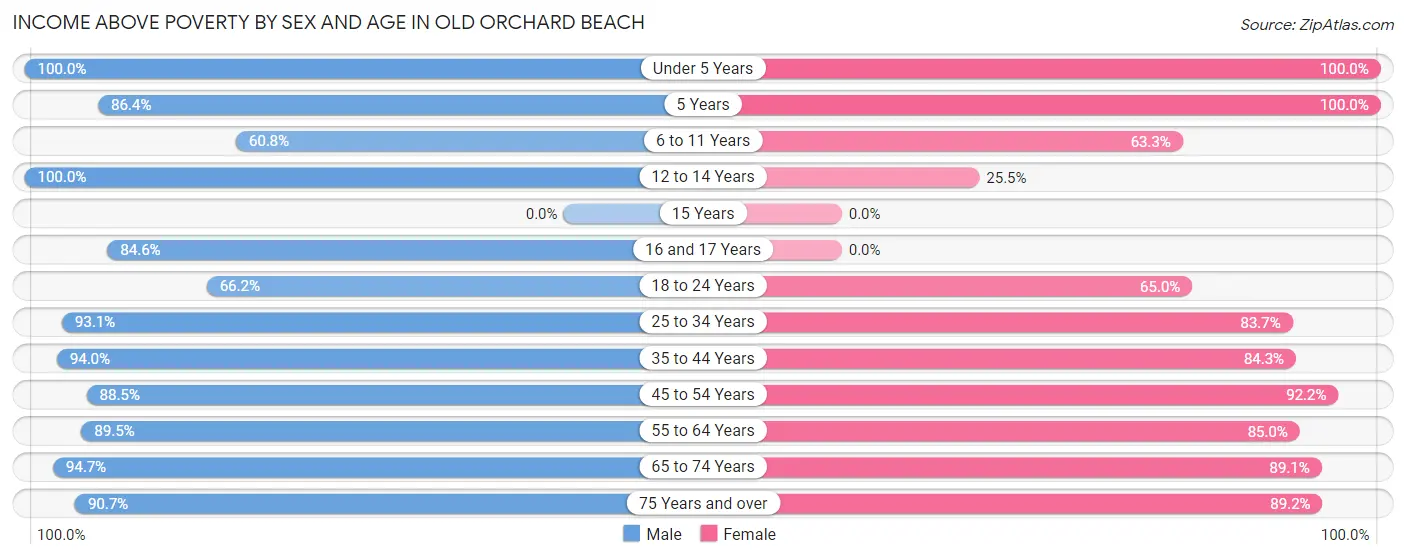
| Age Bracket | Male | Female |
| Under 5 Years | 13 (100.0%) | 112 (100.0%) |
| 5 Years | 38 (86.4%) | 58 (100.0%) |
| 6 to 11 Years | 62 (60.8%) | 62 (63.3%) |
| 12 to 14 Years | 62 (100.0%) | 12 (25.5%) |
| 15 Years | 0 (0.0%) | 0 (0.0%) |
| 16 and 17 Years | 66 (84.6%) | 0 (0.0%) |
| 18 to 24 Years | 186 (66.2%) | 93 (65.0%) |
| 25 to 34 Years | 564 (93.1%) | 471 (83.7%) |
| 35 to 44 Years | 455 (94.0%) | 322 (84.3%) |
| 45 to 54 Years | 484 (88.5%) | 552 (92.1%) |
| 55 to 64 Years | 1,026 (89.4%) | 804 (85.0%) |
| 65 to 74 Years | 630 (94.7%) | 1,122 (89.0%) |
| 75 Years and over | 320 (90.6%) | 380 (89.2%) |
| Total | 3,906 (89.1%) | 3,988 (86.1%) |
Income Below Poverty Among Married-Couple Families in Old Orchard Beach
The poverty statistics for married-couple families in Old Orchard Beach show that 1.7% or 28 of the total 1,658 families live below the poverty line. Families with no children have the highest poverty rate of 2.0%, comprising of 28 families. On the other hand, families with 1 or 2 children have the lowest poverty rate of 0.0%, which includes 0 families.
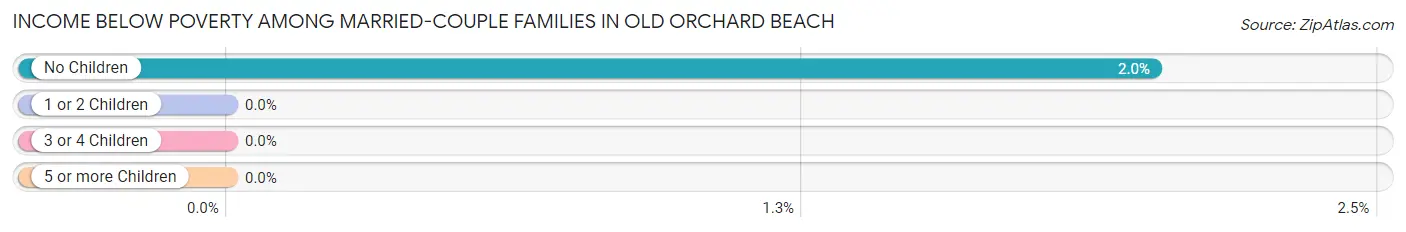
| Children | Above Poverty | Below Poverty |
| No Children | 1,364 (98.0%) | 28 (2.0%) |
| 1 or 2 Children | 266 (100.0%) | 0 (0.0%) |
| 3 or 4 Children | 0 (0.0%) | 0 (0.0%) |
| 5 or more Children | 0 (0.0%) | 0 (0.0%) |
| Total | 1,630 (98.3%) | 28 (1.7%) |
Income Below Poverty Among Single-Parent Households in Old Orchard Beach
According to the poverty data in Old Orchard Beach, 11.1% or 36 single-father households and 32.9% or 74 single-mother households are living below the poverty line. Among single-father households, those with 1 or 2 children have the highest poverty rate, with 25 households (51.0%) experiencing poverty. Likewise, among single-mother households, those with 1 or 2 children have the highest poverty rate, with 74 households (66.7%) falling below the poverty line.
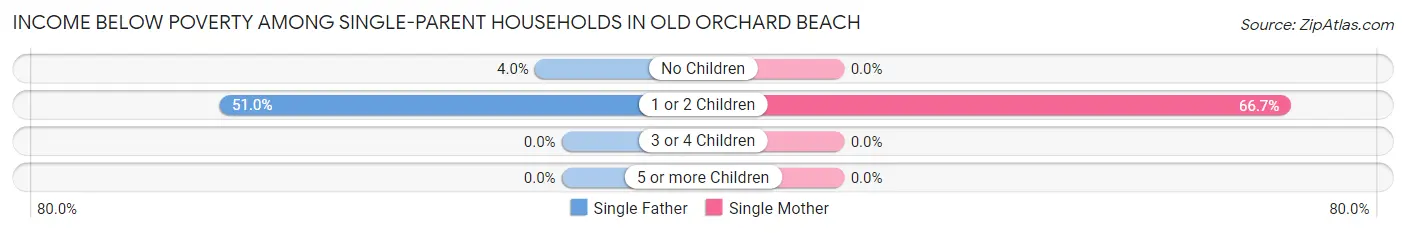
| Children | Single Father | Single Mother |
| No Children | 11 (4.0%) | 0 (0.0%) |
| 1 or 2 Children | 25 (51.0%) | 74 (66.7%) |
| 3 or 4 Children | 0 (0.0%) | 0 (0.0%) |
| 5 or more Children | 0 (0.0%) | 0 (0.0%) |
| Total | 36 (11.1%) | 74 (32.9%) |
Income Below Poverty Among Married-Couple vs Single-Parent Households in Old Orchard Beach
The poverty data for Old Orchard Beach shows that 28 of the married-couple family households (1.7%) and 110 of the single-parent households (20.0%) are living below the poverty level. Within the married-couple family households, those with no children have the highest poverty rate, with 28 households (2.0%) falling below the poverty line. Among the single-parent households, those with 1 or 2 children have the highest poverty rate, with 99 household (61.9%) living below poverty.
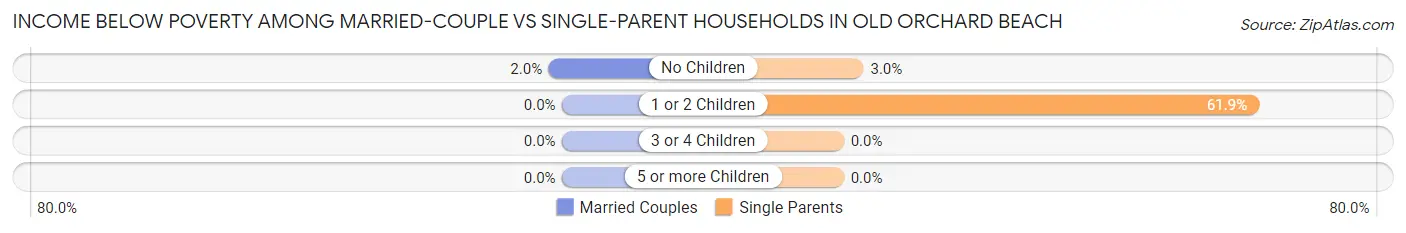
| Children | Married-Couple Families | Single-Parent Households |
| No Children | 28 (2.0%) | 11 (3.0%) |
| 1 or 2 Children | 0 (0.0%) | 99 (61.9%) |
| 3 or 4 Children | 0 (0.0%) | 0 (0.0%) |
| 5 or more Children | 0 (0.0%) | 0 (0.0%) |
| Total | 28 (1.7%) | 110 (20.0%) |
Race in Old Orchard Beach
The most populous races in Old Orchard Beach are White / Caucasian (8,397 | 92.9%), Two or more Races (460 | 5.1%), and Hispanic or Latino (201 | 2.2%).
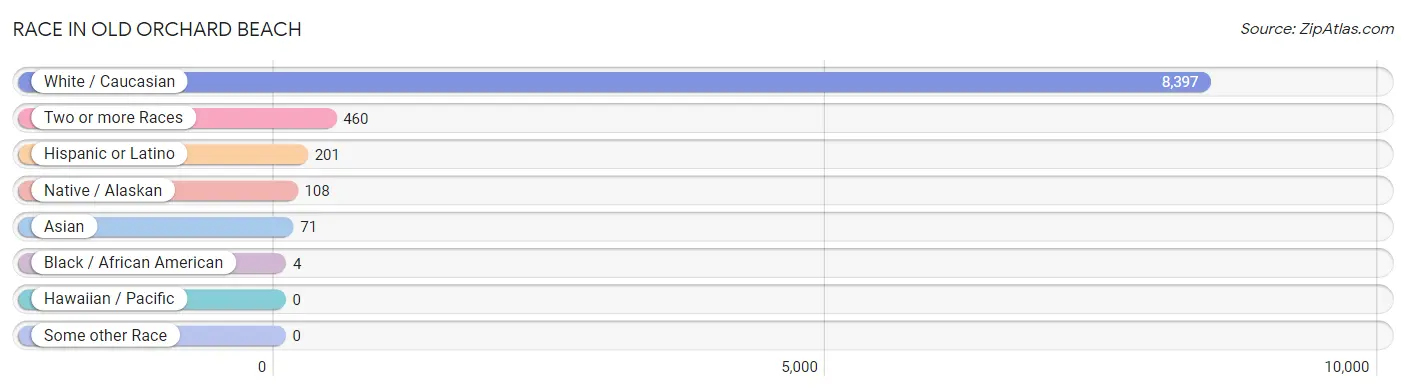
| Race | # Population | % Population |
| Asian | 71 | 0.8% |
| Black / African American | 4 | 0.0% |
| Hawaiian / Pacific | 0 | 0.0% |
| Hispanic or Latino | 201 | 2.2% |
| Native / Alaskan | 108 | 1.2% |
| White / Caucasian | 8,397 | 92.9% |
| Two or more Races | 460 | 5.1% |
| Some other Race | 0 | 0.0% |
| Total | 9,040 | 100.0% |
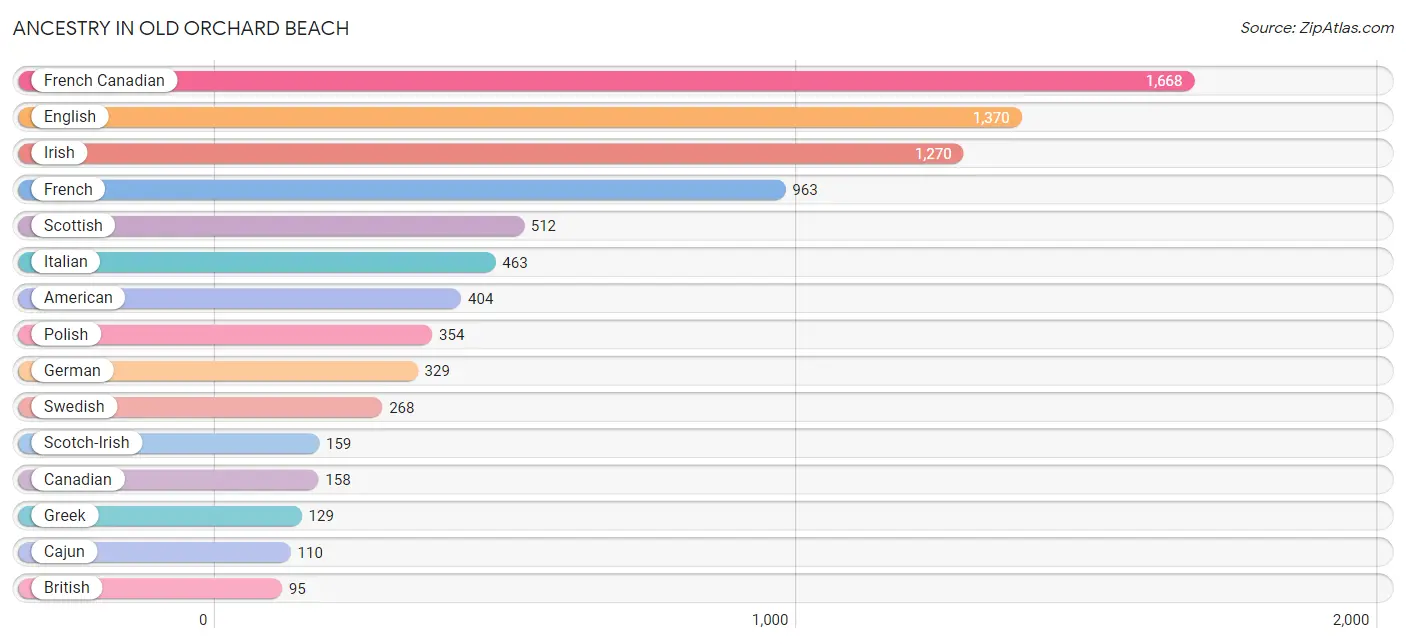
Ancestry in Old Orchard Beach
The most populous ancestries reported in Old Orchard Beach are French Canadian (1,668 | 18.4%), English (1,370 | 15.1%), Irish (1,270 | 14.1%), French (963 | 10.6%), and Scottish (512 | 5.7%), together accounting for 64.0% of all Old Orchard Beach residents.
| Ancestry | # Population | % Population |
| Albanian | 10 | 0.1% |
| American | 404 | 4.5% |
| Armenian | 13 | 0.1% |
| Austrian | 3 | 0.0% |
| Bhutanese | 8 | 0.1% |
| British | 95 | 1.1% |
| Cajun | 110 | 1.2% |
| Canadian | 158 | 1.8% |
| Cherokee | 13 | 0.1% |
| Cuban | 6 | 0.1% |
| Czech | 12 | 0.1% |
| Danish | 67 | 0.7% |
| Dutch | 29 | 0.3% |
| Eastern European | 59 | 0.6% |
| English | 1,370 | 15.1% |
| European | 77 | 0.9% |
| Filipino | 1 | 0.0% |
| French | 963 | 10.6% |
| French Canadian | 1,668 | 18.4% |
| German | 329 | 3.6% |
| Greek | 129 | 1.4% |
| Hungarian | 25 | 0.3% |
| Indian (Asian) | 62 | 0.7% |
| Irish | 1,270 | 14.1% |
| Italian | 463 | 5.1% |
| Jamaican | 2 | 0.0% |
| Korean | 29 | 0.3% |
| Lithuanian | 48 | 0.5% |
| Mexican | 94 | 1.0% |
| Native Hawaiian | 8 | 0.1% |
| Northern European | 11 | 0.1% |
| Norwegian | 58 | 0.6% |
| Polish | 354 | 3.9% |
| Portuguese | 39 | 0.4% |
| Puerto Rican | 11 | 0.1% |
| Russian | 73 | 0.8% |
| Scandinavian | 43 | 0.5% |
| Scotch-Irish | 159 | 1.8% |
| Scottish | 512 | 5.7% |
| Slovak | 76 | 0.8% |
| Spanish | 88 | 1.0% |
| Sri Lankan | 41 | 0.4% |
| Swedish | 268 | 3.0% |
| Ukrainian | 78 | 0.9% |
| Welsh | 75 | 0.8% | View All 45 Rows |
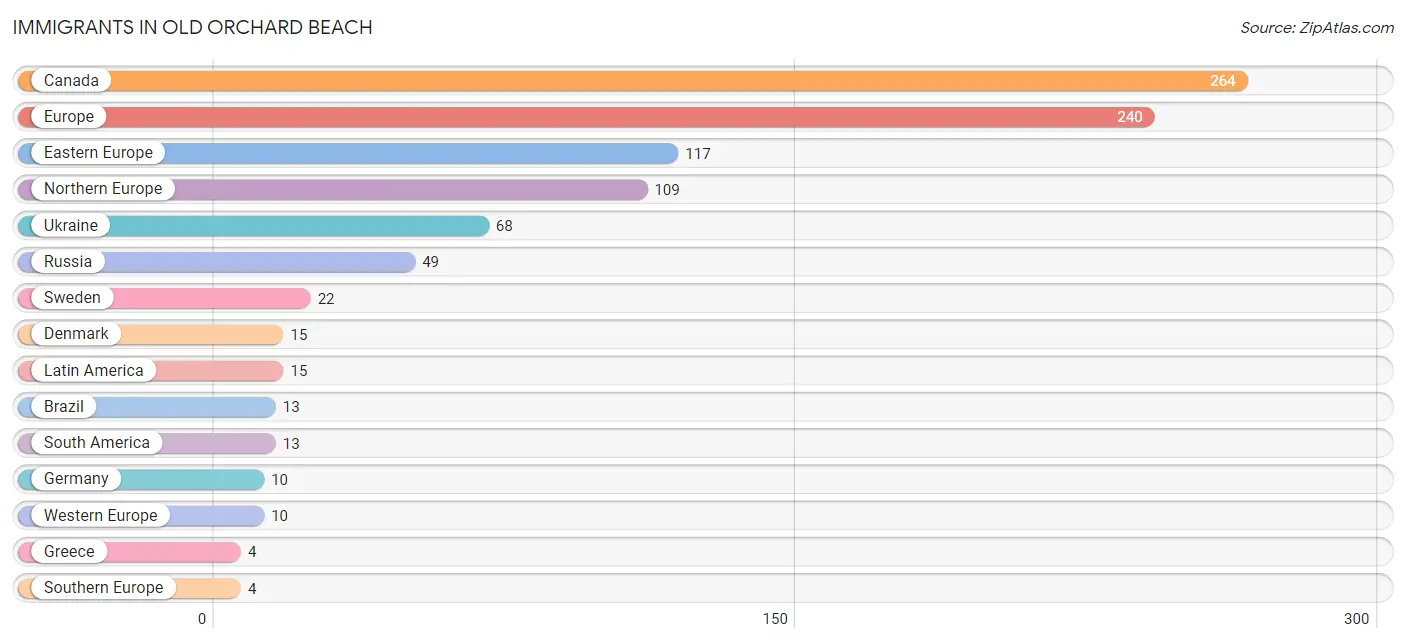
Immigrants in Old Orchard Beach
The most numerous immigrant groups reported in Old Orchard Beach came from Canada (264 | 2.9%), Europe (240 | 2.6%), Eastern Europe (117 | 1.3%), Northern Europe (109 | 1.2%), and Ukraine (68 | 0.7%), together accounting for 8.8% of all Old Orchard Beach residents.
| Immigration Origin | # Population | % Population |
| Asia | 1 | 0.0% |
| Brazil | 13 | 0.1% |
| Canada | 264 | 2.9% |
| Caribbean | 2 | 0.0% |
| China | 1 | 0.0% |
| Denmark | 15 | 0.2% |
| Eastern Asia | 1 | 0.0% |
| Eastern Europe | 117 | 1.3% |
| Europe | 240 | 2.6% |
| Germany | 10 | 0.1% |
| Greece | 4 | 0.0% |
| Jamaica | 2 | 0.0% |
| Latin America | 15 | 0.2% |
| Northern Europe | 109 | 1.2% |
| Russia | 49 | 0.5% |
| South America | 13 | 0.1% |
| Southern Europe | 4 | 0.0% |
| Sweden | 22 | 0.2% |
| Taiwan | 1 | 0.0% |
| Ukraine | 68 | 0.7% |
| Western Europe | 10 | 0.1% | View All 21 Rows |
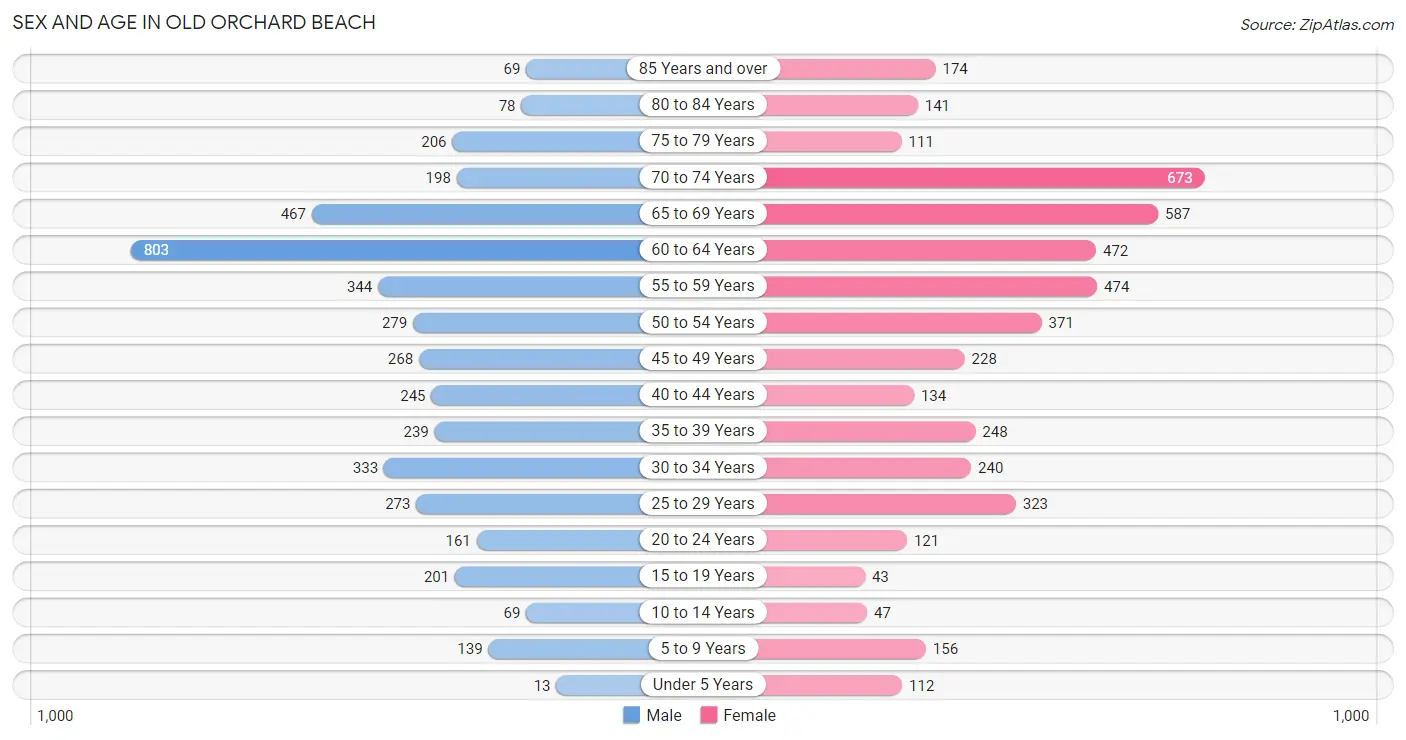
Sex and Age in Old Orchard Beach
Sex and Age in Old Orchard Beach
The most populous age groups in Old Orchard Beach are 60 to 64 Years (803 | 18.3%) for men and 70 to 74 Years (673 | 14.5%) for women.
| Age Bracket | Male | Female |
| Under 5 Years | 13 (0.3%) | 112 (2.4%) |
| 5 to 9 Years | 139 (3.2%) | 156 (3.4%) |
| 10 to 14 Years | 69 (1.6%) | 47 (1.0%) |
| 15 to 19 Years | 201 (4.6%) | 43 (0.9%) |
| 20 to 24 Years | 161 (3.7%) | 121 (2.6%) |
| 25 to 29 Years | 273 (6.2%) | 323 (6.9%) |
| 30 to 34 Years | 333 (7.6%) | 240 (5.2%) |
| 35 to 39 Years | 239 (5.4%) | 248 (5.3%) |
| 40 to 44 Years | 245 (5.6%) | 134 (2.9%) |
| 45 to 49 Years | 268 (6.1%) | 228 (4.9%) |
| 50 to 54 Years | 279 (6.4%) | 371 (8.0%) |
| 55 to 59 Years | 344 (7.8%) | 474 (10.2%) |
| 60 to 64 Years | 803 (18.3%) | 472 (10.1%) |
| 65 to 69 Years | 467 (10.6%) | 587 (12.6%) |
| 70 to 74 Years | 198 (4.5%) | 673 (14.5%) |
| 75 to 79 Years | 206 (4.7%) | 111 (2.4%) |
| 80 to 84 Years | 78 (1.8%) | 141 (3.0%) |
| 85 Years and over | 69 (1.6%) | 174 (3.7%) |
| Total | 4,385 (100.0%) | 4,655 (100.0%) |
Families and Households in Old Orchard Beach
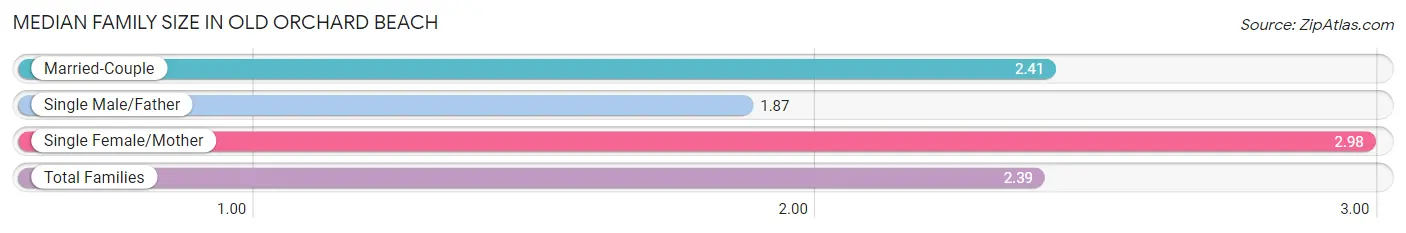
Median Family Size in Old Orchard Beach
The median family size in Old Orchard Beach is 2.39 persons per family, with single female/mother families (225 | 10.2%) accounting for the largest median family size of 2.98 persons per family. On the other hand, single male/father families (325 | 14.7%) represent the smallest median family size with 1.87 persons per family.
| Family Type | # Families | Family Size |
| Married-Couple | 1,658 (75.1%) | 2.41 |
| Single Male/Father | 325 (14.7%) | 1.87 |
| Single Female/Mother | 225 (10.2%) | 2.98 |
| Total Families | 2,208 (100.0%) | 2.39 |
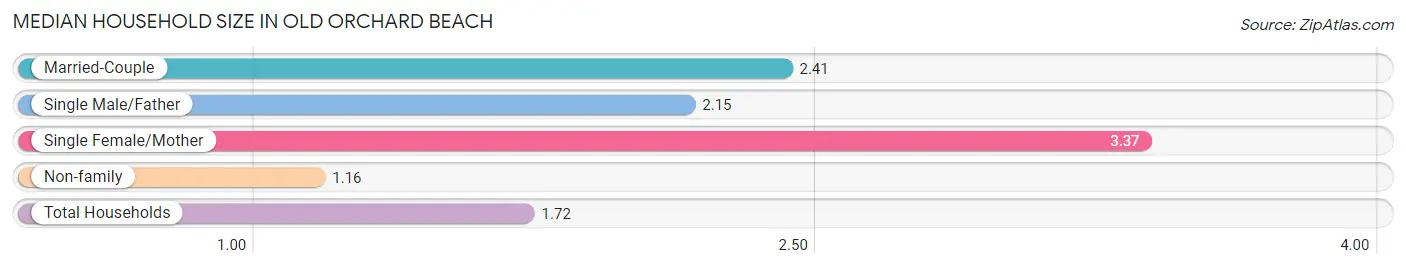
Median Household Size in Old Orchard Beach
The median household size in Old Orchard Beach is 1.72 persons per household, with single female/mother households (225 | 4.3%) accounting for the largest median household size of 3.37 persons per household. non-family households (3,016 | 57.7%) represent the smallest median household size with 1.16 persons per household.
| Household Type | # Households | Household Size |
| Married-Couple | 1,658 (31.7%) | 2.41 |
| Single Male/Father | 325 (6.2%) | 2.15 |
| Single Female/Mother | 225 (4.3%) | 3.37 |
| Non-family | 3,016 (57.7%) | 1.16 |
| Total Households | 5,224 (100.0%) | 1.72 |
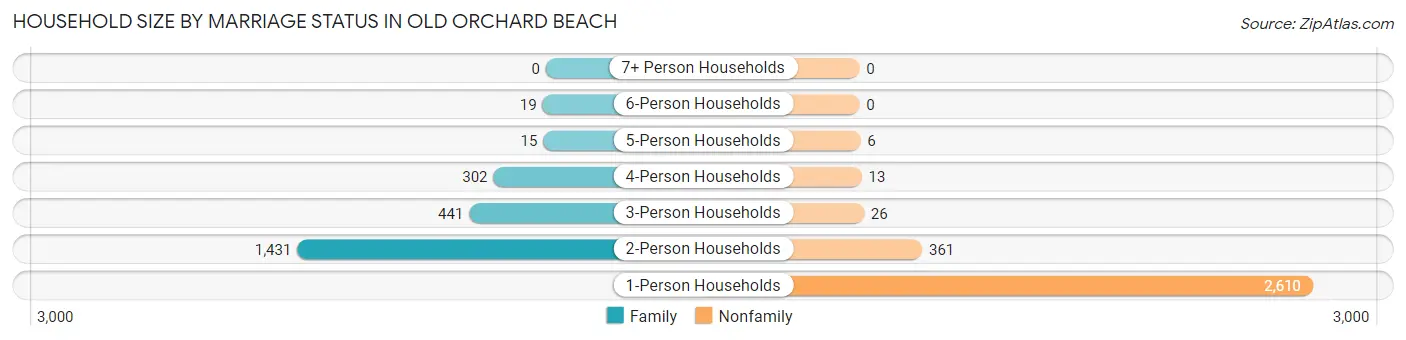
Household Size by Marriage Status in Old Orchard Beach
Out of a total of 5,224 households in Old Orchard Beach, 2,208 (42.3%) are family households, while 3,016 (57.7%) are nonfamily households. The most numerous type of family households are 2-person households, comprising 1,431, and the most common type of nonfamily households are 1-person households, comprising 2,610.
| Household Size | Family Households | Nonfamily Households |
| 1-Person Households | - | 2,610 (50.0%) |
| 2-Person Households | 1,431 (27.4%) | 361 (6.9%) |
| 3-Person Households | 441 (8.4%) | 26 (0.5%) |
| 4-Person Households | 302 (5.8%) | 13 (0.3%) |
| 5-Person Households | 15 (0.3%) | 6 (0.1%) |
| 6-Person Households | 19 (0.4%) | 0 (0.0%) |
| 7+ Person Households | 0 (0.0%) | 0 (0.0%) |
| Total | 2,208 (42.3%) | 3,016 (57.7%) |
Female Fertility in Old Orchard Beach
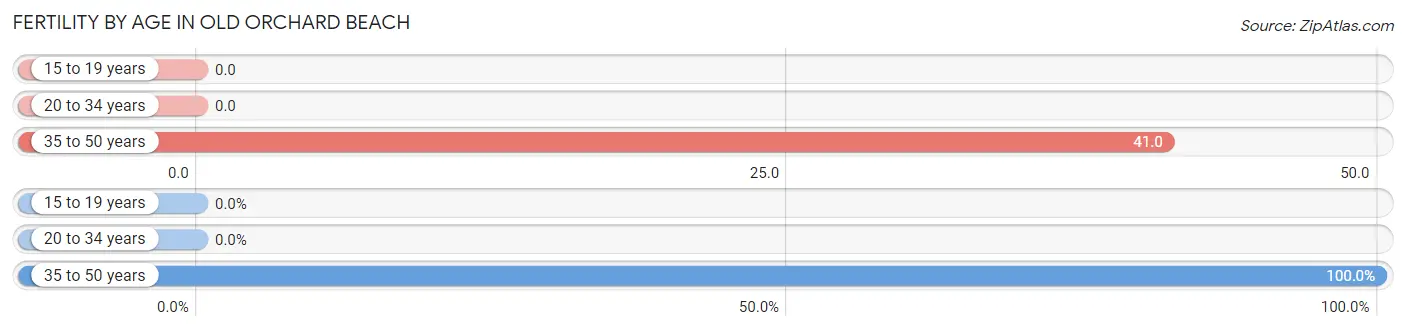
Fertility by Age in Old Orchard Beach
Average fertility rate in Old Orchard Beach is 20.0 births per 1,000 women. Women in the age bracket of 35 to 50 years have the highest fertility rate with 41.0 births per 1,000 women. Women in the age bracket of 35 to 50 years acount for 100.0% of all women with births.
| Age Bracket | Women with Births | Births / 1,000 Women |
| 15 to 19 years | 0 (0.0%) | 0.0 |
| 20 to 34 years | 0 (0.0%) | 0.0 |
| 35 to 50 years | 28 (100.0%) | 41.0 |
| Total | 28 (100.0%) | 20.0 |
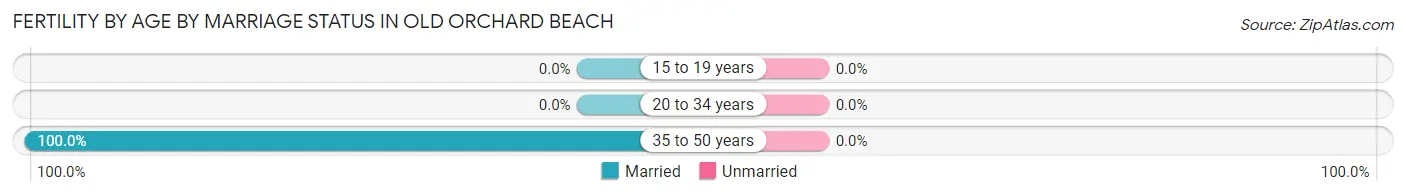
Fertility by Age by Marriage Status in Old Orchard Beach
| Age Bracket | Married | Unmarried |
| 15 to 19 years | 0 (0.0%) | 0 (0.0%) |
| 20 to 34 years | 0 (0.0%) | 0 (0.0%) |
| 35 to 50 years | 28 (100.0%) | 0 (0.0%) |
| Total | 28 (100.0%) | 0 (0.0%) |
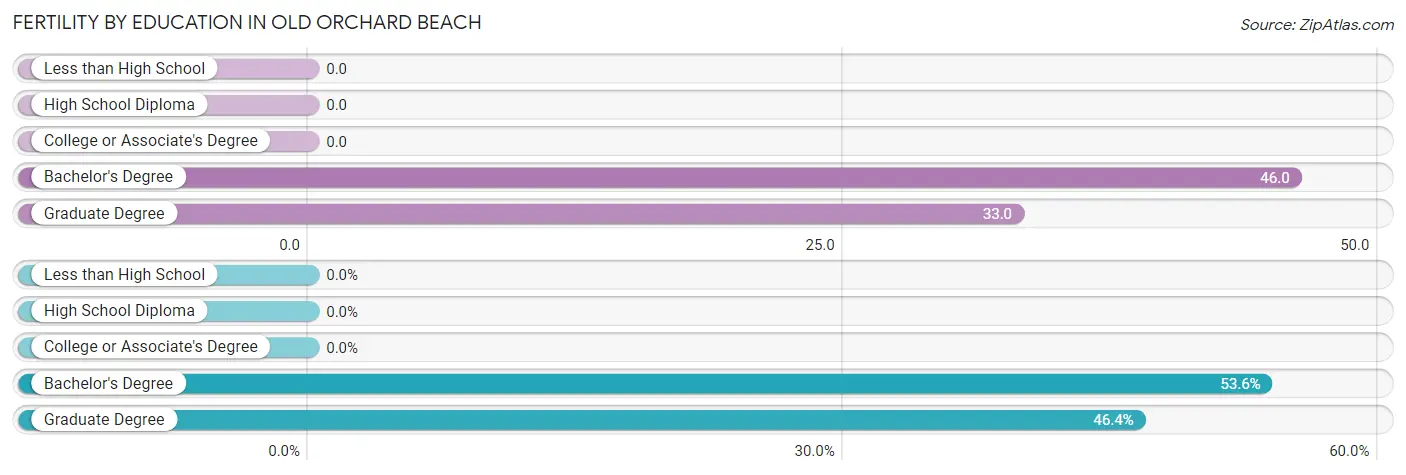
Fertility by Education in Old Orchard Beach
| Educational Attainment | Women with Births | Births / 1,000 Women |
| Less than High School | 0 (0.0%) | 0.0 |
| High School Diploma | 0 (0.0%) | 0.0 |
| College or Associate's Degree | 0 (0.0%) | 0.0 |
| Bachelor's Degree | 15 (53.6%) | 46.0 |
| Graduate Degree | 13 (46.4%) | 33.0 |
| Total | 28 (100.0%) | 20.0 |
Fertility by Education by Marriage Status in Old Orchard Beach
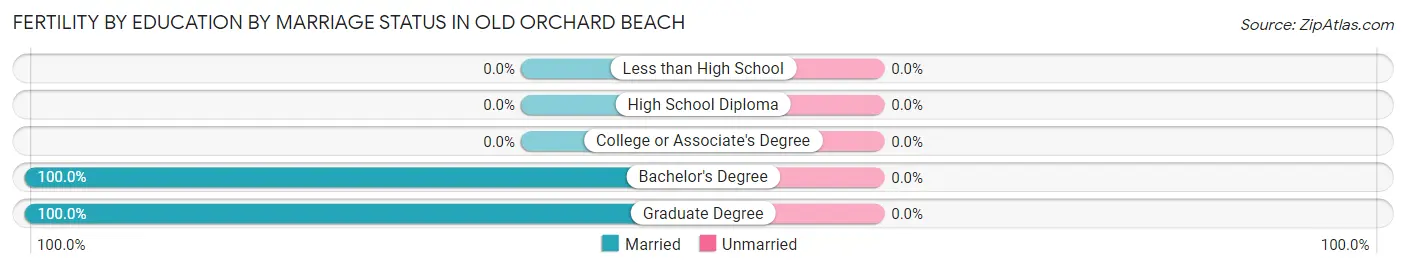
| Educational Attainment | Married | Unmarried |
| Less than High School | 0 (0.0%) | 0 (0.0%) |
| High School Diploma | 0 (0.0%) | 0 (0.0%) |
| College or Associate's Degree | 0 (0.0%) | 0 (0.0%) |
| Bachelor's Degree | 15 (100.0%) | 0 (0.0%) |
| Graduate Degree | 13 (100.0%) | 0 (0.0%) |
| Total | 28 (100.0%) | 0 (0.0%) |
Employment Characteristics in Old Orchard Beach
Employment by Class of Employer in Old Orchard Beach
Among the 4,867 employed individuals in Old Orchard Beach, private company employees (2,707 | 55.6%), not-for-profit organizations (752 | 15.4%), and local government employees (653 | 13.4%) make up the most common classes of employment.
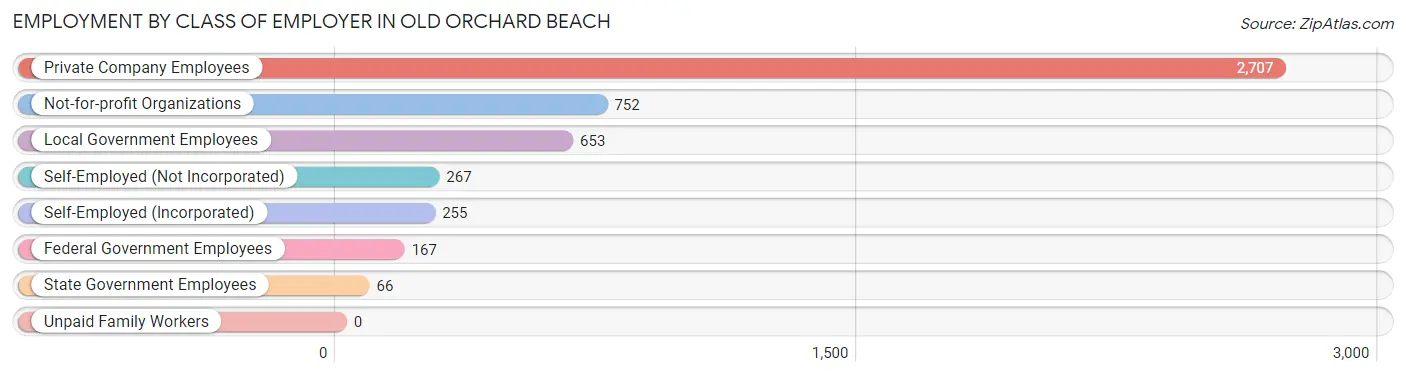
| Employer Class | # Employees | % Employees |
| Private Company Employees | 2,707 | 55.6% |
| Self-Employed (Incorporated) | 255 | 5.2% |
| Self-Employed (Not Incorporated) | 267 | 5.5% |
| Not-for-profit Organizations | 752 | 15.4% |
| Local Government Employees | 653 | 13.4% |
| State Government Employees | 66 | 1.4% |
| Federal Government Employees | 167 | 3.4% |
| Unpaid Family Workers | 0 | 0.0% |
| Total | 4,867 | 100.0% |
Employment Status by Age in Old Orchard Beach
According to the labor force statistics for Old Orchard Beach, out of the total population over 16 years of age (8,504), 61.3% or 5,213 individuals are in the labor force, with 5.6% or 292 of them unemployed. The age group with the highest labor force participation rate is 30 to 34 years, with 97.6% or 559 individuals in the labor force. Within the labor force, the 75 years and over age range has the highest percentage of unemployed individuals, with 17.6% or 16 of them being unemployed.
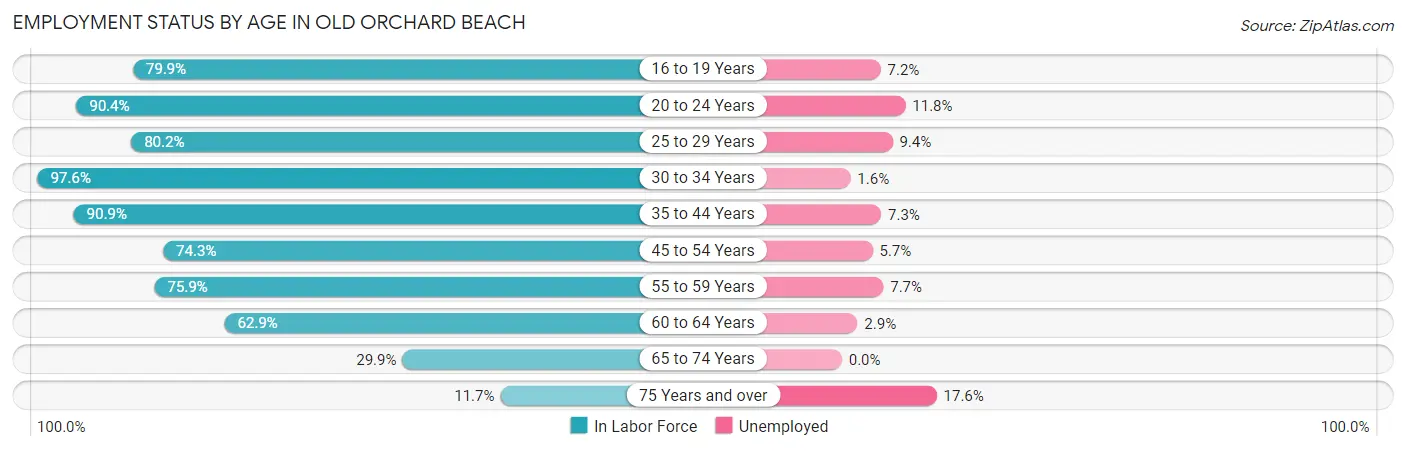
| Age Bracket | In Labor Force | Unemployed |
| 16 to 19 Years | 195 (79.9%) | 14 (7.2%) |
| 20 to 24 Years | 255 (90.4%) | 30 (11.8%) |
| 25 to 29 Years | 478 (80.2%) | 45 (9.4%) |
| 30 to 34 Years | 559 (97.6%) | 9 (1.6%) |
| 35 to 44 Years | 787 (90.9%) | 57 (7.3%) |
| 45 to 54 Years | 851 (74.3%) | 49 (5.7%) |
| 55 to 59 Years | 621 (75.9%) | 48 (7.7%) |
| 60 to 64 Years | 802 (62.9%) | 23 (2.9%) |
| 65 to 74 Years | 576 (29.9%) | 0 (0.0%) |
| 75 Years and over | 91 (11.7%) | 16 (17.6%) |
| Total | 5,213 (61.3%) | 292 (5.6%) |
Employment Status by Educational Attainment in Old Orchard Beach
According to labor force statistics for Old Orchard Beach, 77.7% of individuals (4,098) out of the total population between 25 and 64 years of age (5,274) are in the labor force, with 5.6% or 229 of them being unemployed. The group with the highest labor force participation rate are those with the educational attainment of bachelor's degree or higher, with 82.6% or 1,605 individuals in the labor force. Within the labor force, individuals with college / associate degree education have the highest percentage of unemployment, with 10.3% or 135 of them being unemployed.
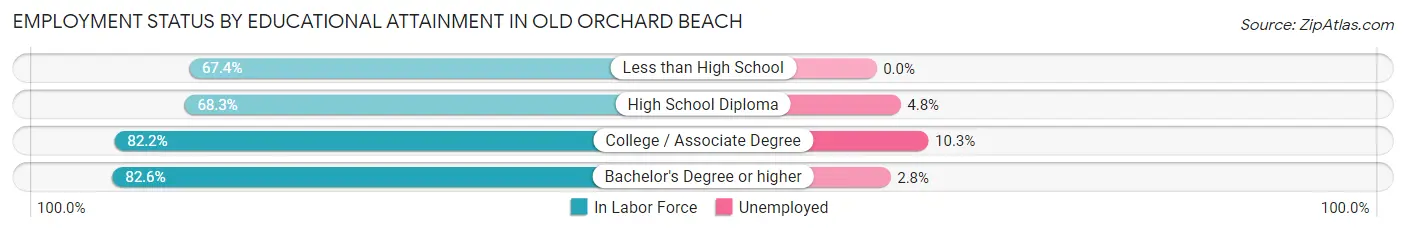
| Educational Attainment | In Labor Force | Unemployed |
| Less than High School | 118 (67.4%) | 0 (0.0%) |
| High School Diploma | 1,070 (68.3%) | 75 (4.8%) |
| College / Associate Degree | 1,306 (82.2%) | 164 (10.3%) |
| Bachelor's Degree or higher | 1,605 (82.6%) | 54 (2.8%) |
| Total | 4,098 (77.7%) | 295 (5.6%) |
Employment Occupations by Sex in Old Orchard Beach
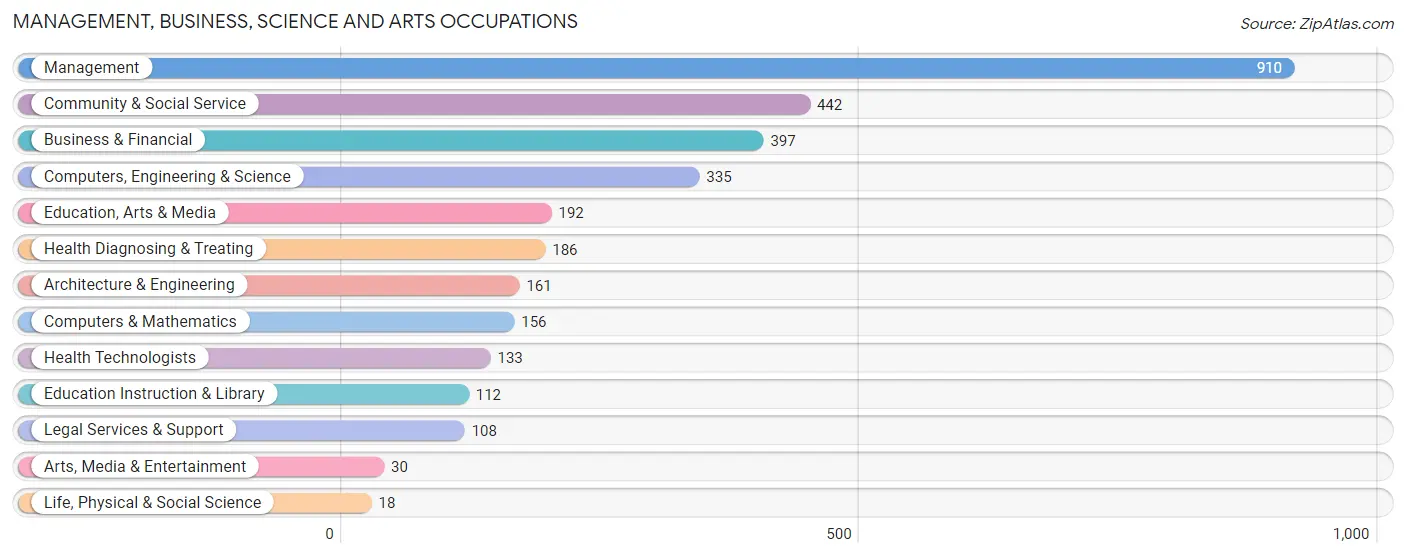
Management, Business, Science and Arts Occupations
The most common Management, Business, Science and Arts occupations in Old Orchard Beach are Management (910 | 18.6%), Community & Social Service (442 | 9.0%), Business & Financial (397 | 8.1%), Computers, Engineering & Science (335 | 6.8%), and Education, Arts & Media (192 | 3.9%).
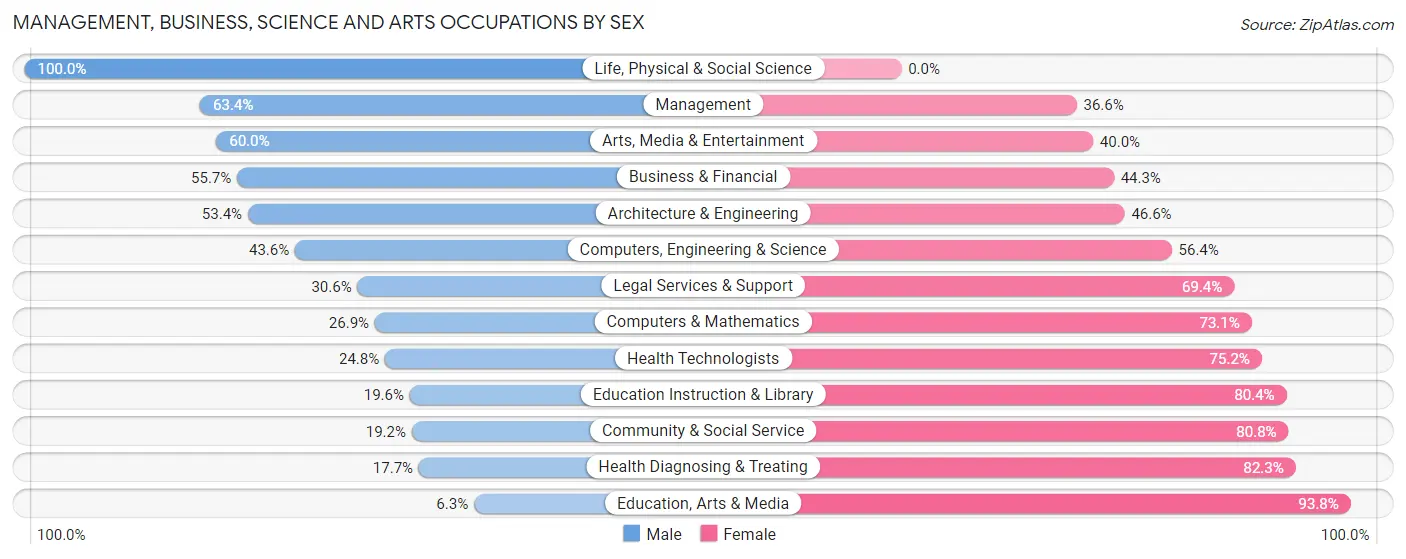
Management, Business, Science and Arts Occupations by Sex
Within the Management, Business, Science and Arts occupations in Old Orchard Beach, the most male-oriented occupations are Life, Physical & Social Science (100.0%), Management (63.4%), and Arts, Media & Entertainment (60.0%), while the most female-oriented occupations are Education, Arts & Media (93.8%), Health Diagnosing & Treating (82.3%), and Community & Social Service (80.8%).
| Occupation | Male | Female |
| Management | 577 (63.4%) | 333 (36.6%) |
| Business & Financial | 221 (55.7%) | 176 (44.3%) |
| Computers, Engineering & Science | 146 (43.6%) | 189 (56.4%) |
| Computers & Mathematics | 42 (26.9%) | 114 (73.1%) |
| Architecture & Engineering | 86 (53.4%) | 75 (46.6%) |
| Life, Physical & Social Science | 18 (100.0%) | 0 (0.0%) |
| Community & Social Service | 85 (19.2%) | 357 (80.8%) |
| Education, Arts & Media | 12 (6.2%) | 180 (93.8%) |
| Legal Services & Support | 33 (30.6%) | 75 (69.4%) |
| Education Instruction & Library | 22 (19.6%) | 90 (80.4%) |
| Arts, Media & Entertainment | 18 (60.0%) | 12 (40.0%) |
| Health Diagnosing & Treating | 33 (17.7%) | 153 (82.3%) |
| Health Technologists | 33 (24.8%) | 100 (75.2%) |
| Total (Category) | 1,062 (46.8%) | 1,208 (53.2%) |
| Total (Overall) | 2,773 (56.6%) | 2,124 (43.4%) |
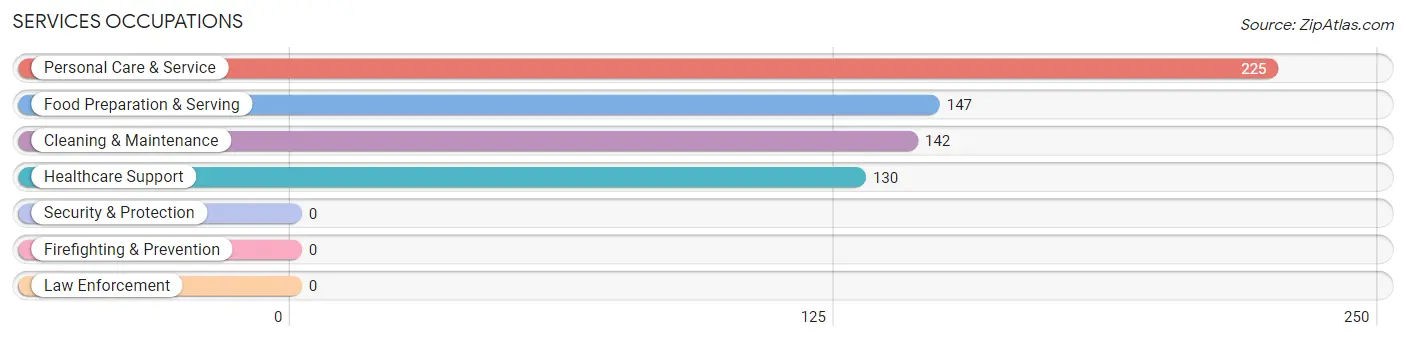
Services Occupations
The most common Services occupations in Old Orchard Beach are Personal Care & Service (225 | 4.6%), Food Preparation & Serving (147 | 3.0%), Cleaning & Maintenance (142 | 2.9%), and Healthcare Support (130 | 2.6%).
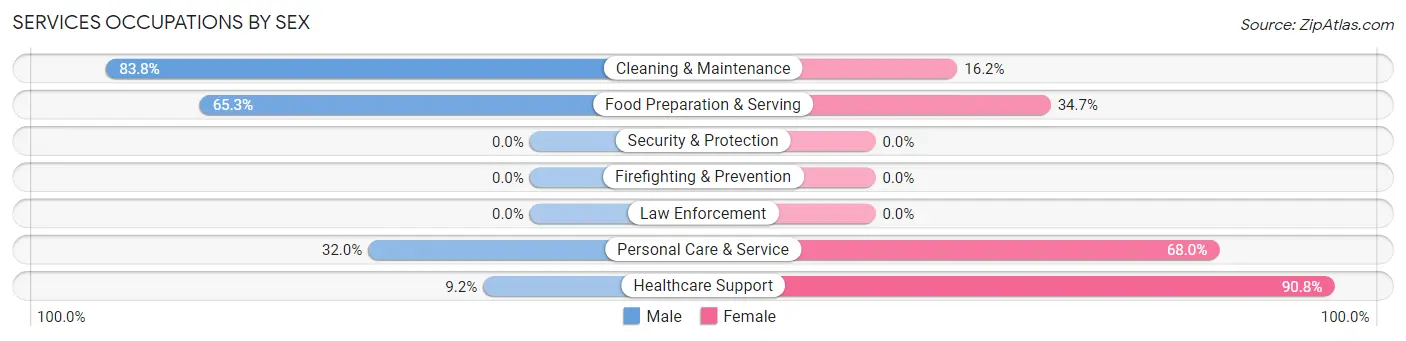
Services Occupations by Sex
Within the Services occupations in Old Orchard Beach, the most male-oriented occupations are Cleaning & Maintenance (83.8%), Food Preparation & Serving (65.3%), and Personal Care & Service (32.0%), while the most female-oriented occupations are Healthcare Support (90.8%), Personal Care & Service (68.0%), and Food Preparation & Serving (34.7%).
| Occupation | Male | Female |
| Healthcare Support | 12 (9.2%) | 118 (90.8%) |
| Security & Protection | 0 (0.0%) | 0 (0.0%) |
| Firefighting & Prevention | 0 (0.0%) | 0 (0.0%) |
| Law Enforcement | 0 (0.0%) | 0 (0.0%) |
| Food Preparation & Serving | 96 (65.3%) | 51 (34.7%) |
| Cleaning & Maintenance | 119 (83.8%) | 23 (16.2%) |
| Personal Care & Service | 72 (32.0%) | 153 (68.0%) |
| Total (Category) | 299 (46.4%) | 345 (53.6%) |
| Total (Overall) | 2,773 (56.6%) | 2,124 (43.4%) |
Sales and Office Occupations
The most common Sales and Office occupations in Old Orchard Beach are Office & Administration (464 | 9.5%), and Sales & Related (360 | 7.3%).
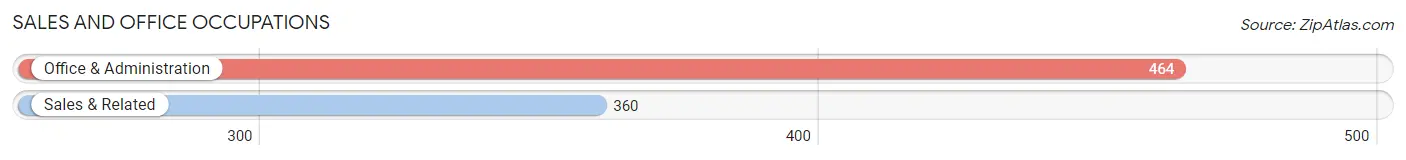
Sales and Office Occupations by Sex

| Occupation | Male | Female |
| Sales & Related | 189 (52.5%) | 171 (47.5%) |
| Office & Administration | 91 (19.6%) | 373 (80.4%) |
| Total (Category) | 280 (34.0%) | 544 (66.0%) |
| Total (Overall) | 2,773 (56.6%) | 2,124 (43.4%) |
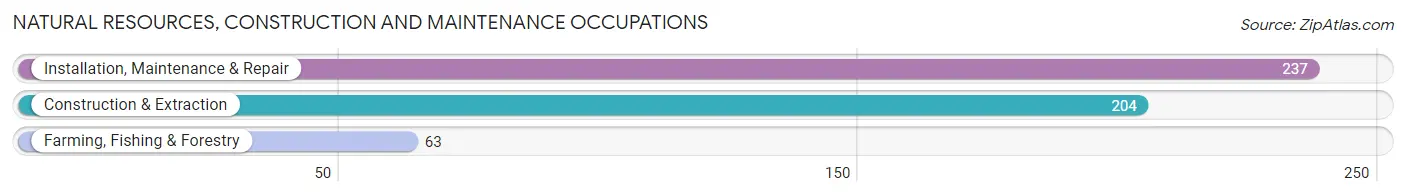
Natural Resources, Construction and Maintenance Occupations
The most common Natural Resources, Construction and Maintenance occupations in Old Orchard Beach are Installation, Maintenance & Repair (237 | 4.8%), Construction & Extraction (204 | 4.2%), and Farming, Fishing & Forestry (63 | 1.3%).
Natural Resources, Construction and Maintenance Occupations by Sex
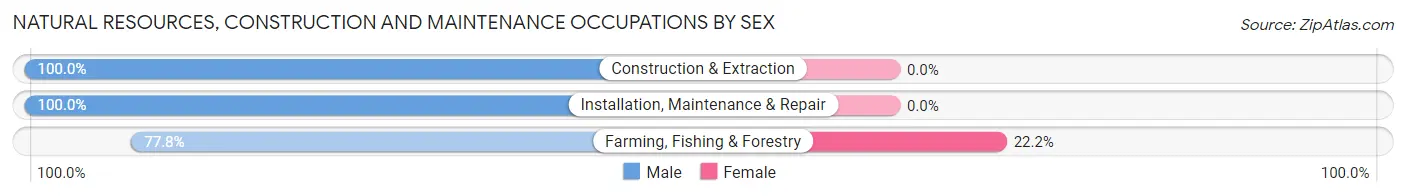
| Occupation | Male | Female |
| Farming, Fishing & Forestry | 49 (77.8%) | 14 (22.2%) |
| Construction & Extraction | 204 (100.0%) | 0 (0.0%) |
| Installation, Maintenance & Repair | 237 (100.0%) | 0 (0.0%) |
| Total (Category) | 490 (97.2%) | 14 (2.8%) |
| Total (Overall) | 2,773 (56.6%) | 2,124 (43.4%) |
Production, Transportation and Moving Occupations
The most common Production, Transportation and Moving occupations in Old Orchard Beach are Transportation (460 | 9.4%), Material Moving (139 | 2.8%), and Production (56 | 1.1%).
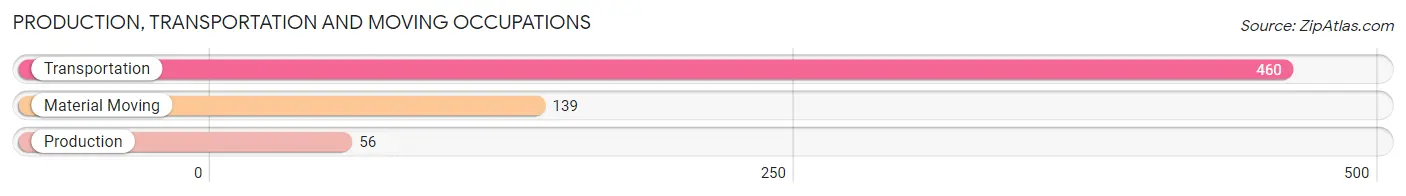
Production, Transportation and Moving Occupations by Sex
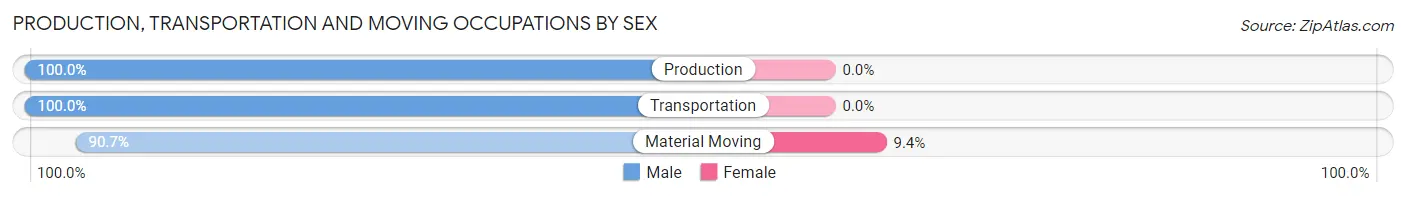
| Occupation | Male | Female |
| Production | 56 (100.0%) | 0 (0.0%) |
| Transportation | 460 (100.0%) | 0 (0.0%) |
| Material Moving | 126 (90.6%) | 13 (9.3%) |
| Total (Category) | 642 (98.0%) | 13 (2.0%) |
| Total (Overall) | 2,773 (56.6%) | 2,124 (43.4%) |
Employment Industries by Sex in Old Orchard Beach
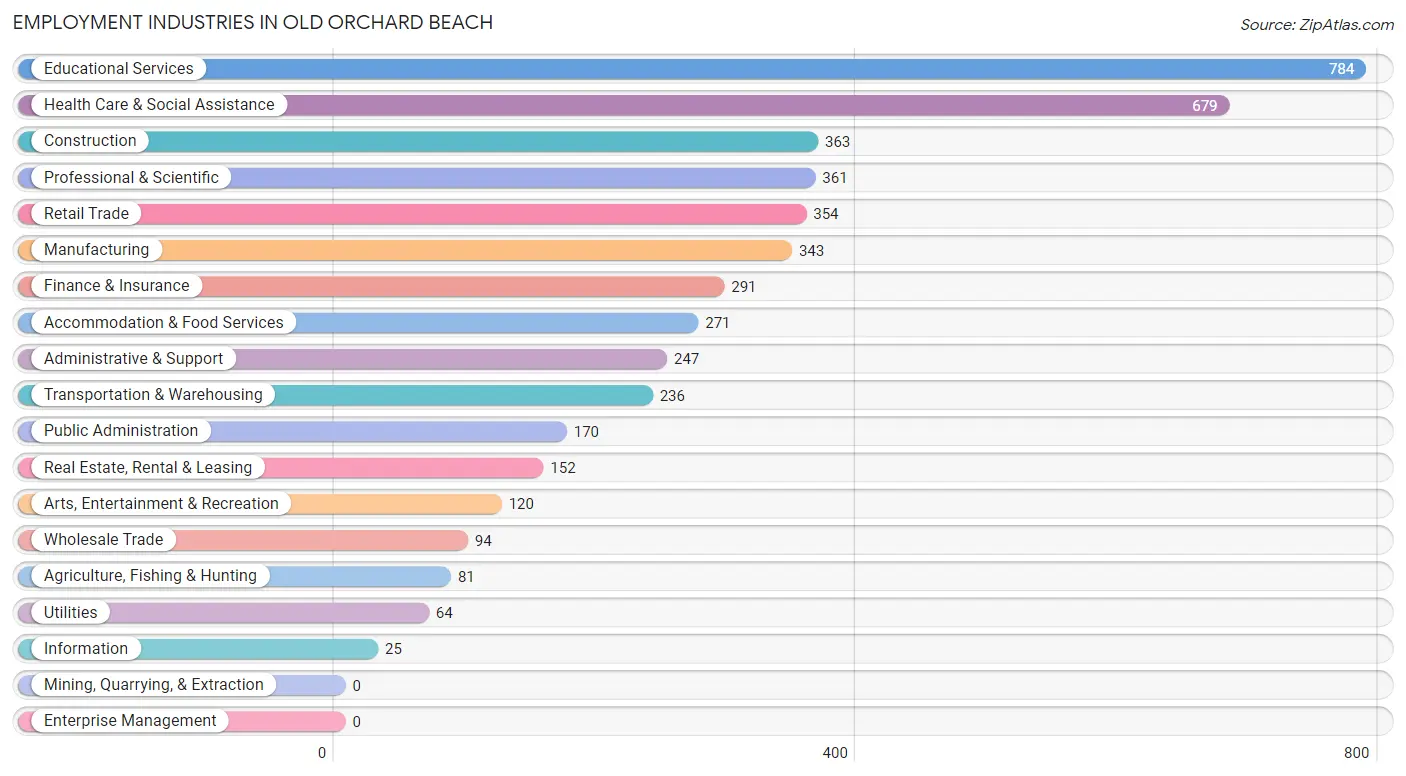
Employment Industries in Old Orchard Beach
The major employment industries in Old Orchard Beach include Educational Services (784 | 16.0%), Health Care & Social Assistance (679 | 13.9%), Construction (363 | 7.4%), Professional & Scientific (361 | 7.4%), and Retail Trade (354 | 7.2%).
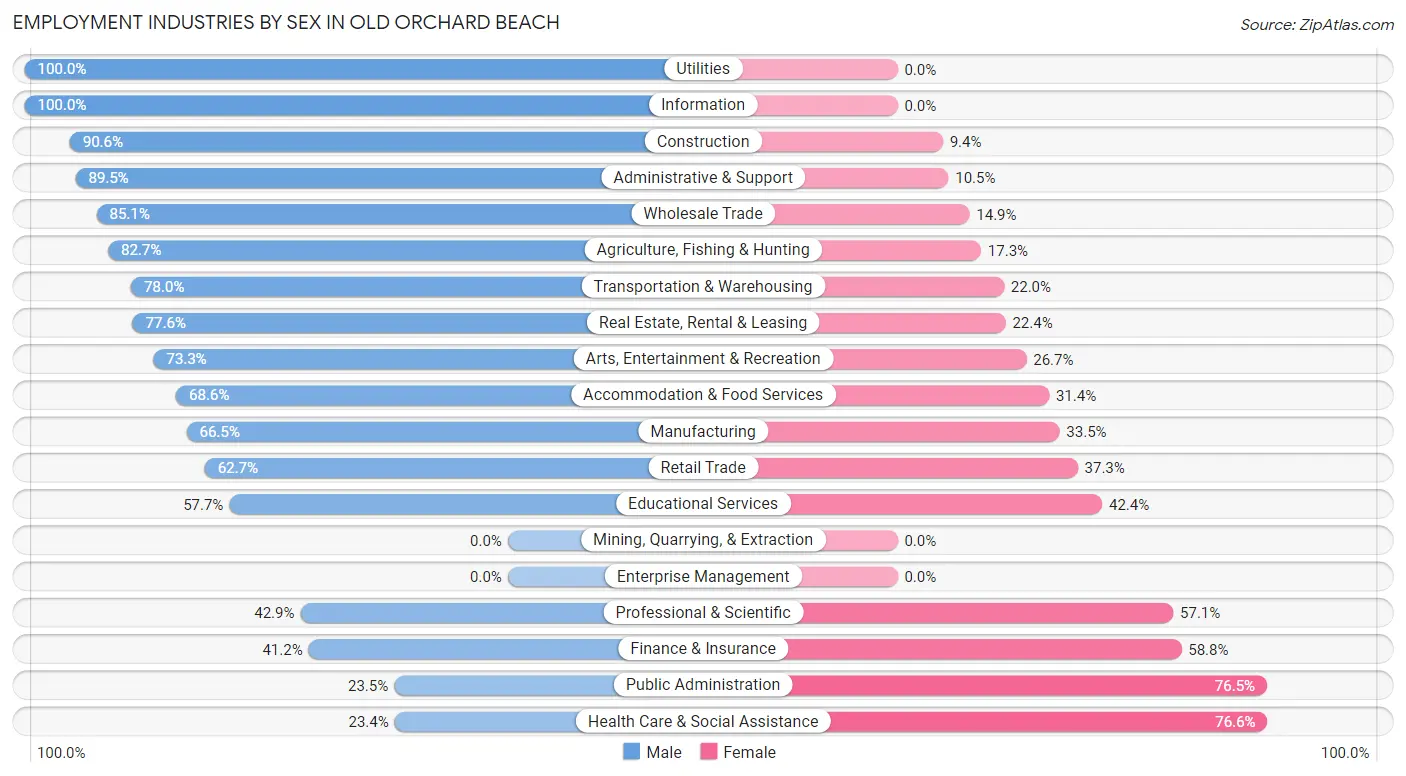
Employment Industries by Sex in Old Orchard Beach
The Old Orchard Beach industries that see more men than women are Utilities (100.0%), Information (100.0%), and Construction (90.6%), whereas the industries that tend to have a higher number of women are Health Care & Social Assistance (76.6%), Public Administration (76.5%), and Finance & Insurance (58.8%).
| Industry | Male | Female |
| Agriculture, Fishing & Hunting | 67 (82.7%) | 14 (17.3%) |
| Mining, Quarrying, & Extraction | 0 (0.0%) | 0 (0.0%) |
| Construction | 329 (90.6%) | 34 (9.4%) |
| Manufacturing | 228 (66.5%) | 115 (33.5%) |
| Wholesale Trade | 80 (85.1%) | 14 (14.9%) |
| Retail Trade | 222 (62.7%) | 132 (37.3%) |
| Transportation & Warehousing | 184 (78.0%) | 52 (22.0%) |
| Utilities | 64 (100.0%) | 0 (0.0%) |
| Information | 25 (100.0%) | 0 (0.0%) |
| Finance & Insurance | 120 (41.2%) | 171 (58.8%) |
| Real Estate, Rental & Leasing | 118 (77.6%) | 34 (22.4%) |
| Professional & Scientific | 155 (42.9%) | 206 (57.1%) |
| Enterprise Management | 0 (0.0%) | 0 (0.0%) |
| Administrative & Support | 221 (89.5%) | 26 (10.5%) |
| Educational Services | 452 (57.7%) | 332 (42.3%) |
| Health Care & Social Assistance | 159 (23.4%) | 520 (76.6%) |
| Arts, Entertainment & Recreation | 88 (73.3%) | 32 (26.7%) |
| Accommodation & Food Services | 186 (68.6%) | 85 (31.4%) |
| Public Administration | 40 (23.5%) | 130 (76.5%) |
| Total | 2,773 (56.6%) | 2,124 (43.4%) |
Education in Old Orchard Beach
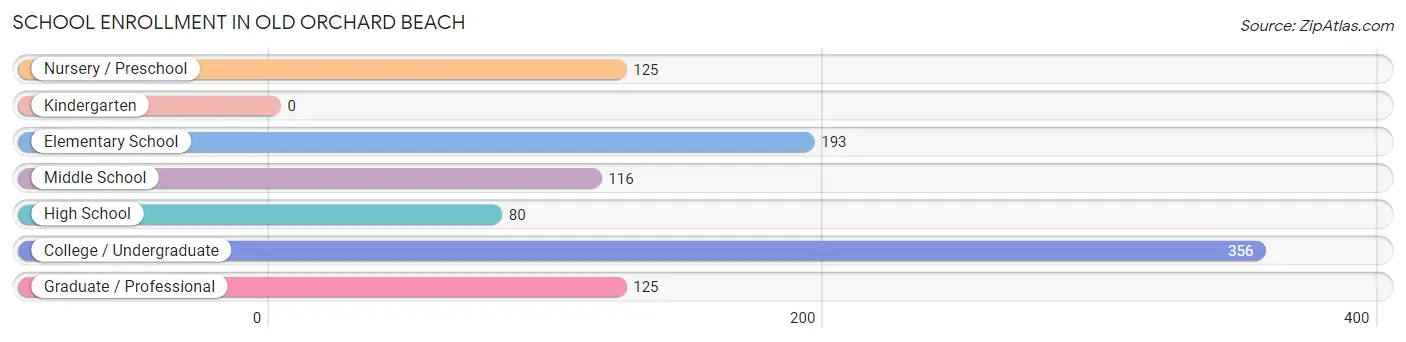
School Enrollment in Old Orchard Beach
The most common levels of schooling among the 995 students in Old Orchard Beach are college / undergraduate (356 | 35.8%), elementary school (193 | 19.4%), and nursery / preschool (125 | 12.6%).
| School Level | # Students | % Students |
| Nursery / Preschool | 125 | 12.6% |
| Kindergarten | 0 | 0.0% |
| Elementary School | 193 | 19.4% |
| Middle School | 116 | 11.7% |
| High School | 80 | 8.0% |
| College / Undergraduate | 356 | 35.8% |
| Graduate / Professional | 125 | 12.6% |
| Total | 995 | 100.0% |
School Enrollment by Age by Funding Source in Old Orchard Beach
Out of a total of 995 students who are enrolled in schools in Old Orchard Beach, 287 (28.8%) attend a private institution, while the remaining 708 (71.2%) are enrolled in public schools. The age group of 3 to 4 year olds has the highest likelihood of being enrolled in private schools, with 23 (100.0% in the age bracket) enrolled. Conversely, the age group of 10 to 14 year olds has the lowest likelihood of being enrolled in a private school, with 116 (100.0% in the age bracket) attending a public institution.
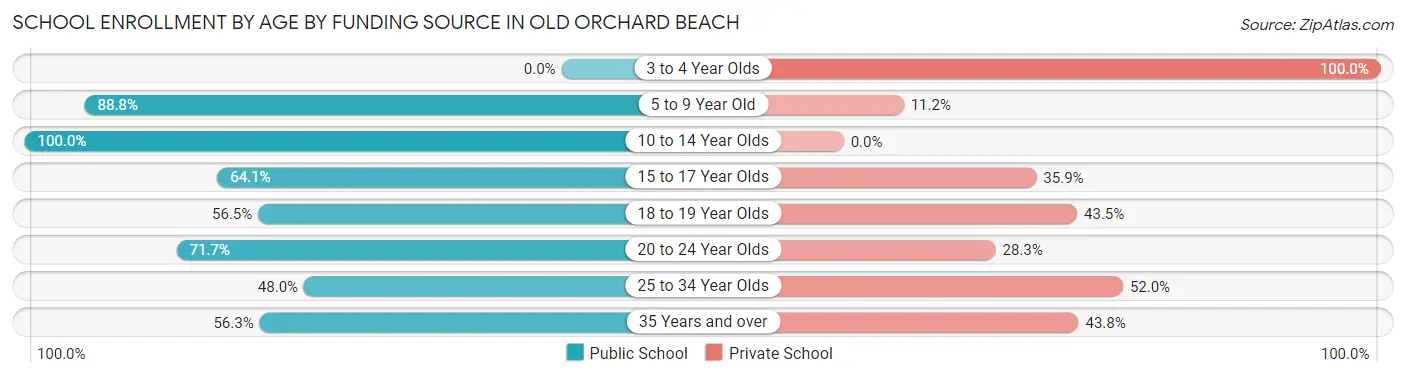
| Age Bracket | Public School | Private School |
| 3 to 4 Year Olds | 0 (0.0%) | 23 (100.0%) |
| 5 to 9 Year Old | 262 (88.8%) | 33 (11.2%) |
| 10 to 14 Year Olds | 116 (100.0%) | 0 (0.0%) |
| 15 to 17 Year Olds | 50 (64.1%) | 28 (35.9%) |
| 18 to 19 Year Olds | 26 (56.5%) | 20 (43.5%) |
| 20 to 24 Year Olds | 114 (71.7%) | 45 (28.3%) |
| 25 to 34 Year Olds | 95 (48.0%) | 103 (52.0%) |
| 35 Years and over | 45 (56.2%) | 35 (43.8%) |
| Total | 708 (71.2%) | 287 (28.8%) |
Educational Attainment by Field of Study in Old Orchard Beach
Business (601 | 17.6%), education (583 | 17.0%), arts & humanities (404 | 11.8%), social sciences (402 | 11.7%), and science & technology (264 | 7.7%) are the most common fields of study among 3,421 individuals in Old Orchard Beach who have obtained a bachelor's degree or higher.
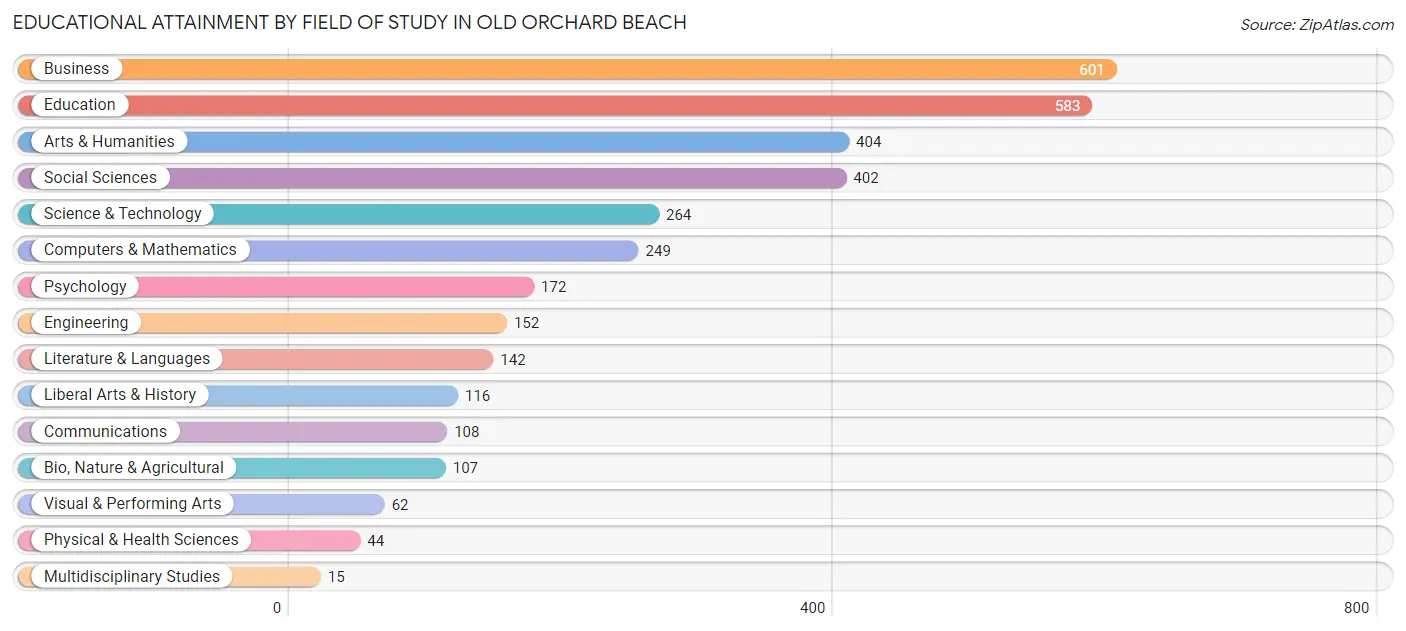
| Field of Study | # Graduates | % Graduates |
| Computers & Mathematics | 249 | 7.3% |
| Bio, Nature & Agricultural | 107 | 3.1% |
| Physical & Health Sciences | 44 | 1.3% |
| Psychology | 172 | 5.0% |
| Social Sciences | 402 | 11.7% |
| Engineering | 152 | 4.4% |
| Multidisciplinary Studies | 15 | 0.4% |
| Science & Technology | 264 | 7.7% |
| Business | 601 | 17.6% |
| Education | 583 | 17.0% |
| Literature & Languages | 142 | 4.2% |
| Liberal Arts & History | 116 | 3.4% |
| Visual & Performing Arts | 62 | 1.8% |
| Communications | 108 | 3.2% |
| Arts & Humanities | 404 | 11.8% |
| Total | 3,421 | 100.0% |
Transportation & Commute in Old Orchard Beach
Vehicle Availability by Sex in Old Orchard Beach
The most prevalent vehicle ownership categories in Old Orchard Beach are males with 2 vehicles (1,086, accounting for 39.7%) and females with 2 vehicles (705, making up 51.3%).
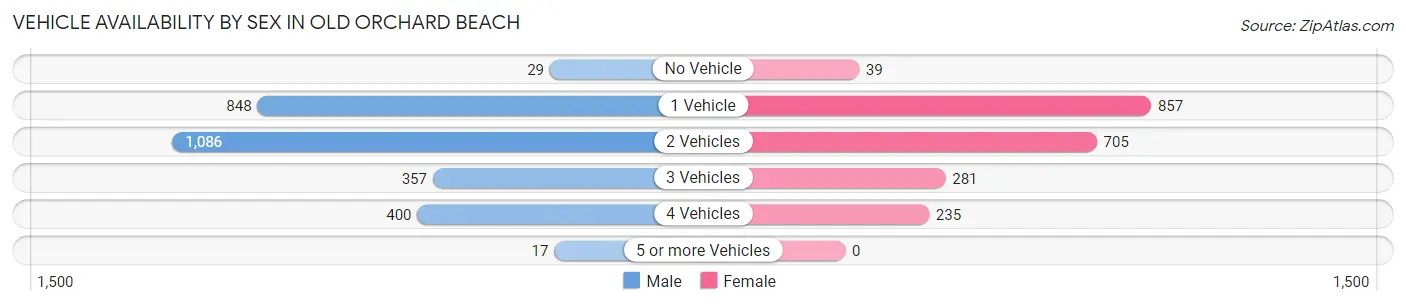
| Vehicles Available | Male | Female |
| No Vehicle | 29 (1.1%) | 39 (1.8%) |
| 1 Vehicle | 848 (31.0%) | 857 (40.5%) |
| 2 Vehicles | 1,086 (39.7%) | 705 (33.3%) |
| 3 Vehicles | 357 (13.0%) | 281 (13.3%) |
| 4 Vehicles | 400 (14.6%) | 235 (11.1%) |
| 5 or more Vehicles | 17 (0.6%) | 0 (0.0%) |
| Total | 2,737 (100.0%) | 2,117 (100.0%) |
Commute Time in Old Orchard Beach
The most frequently occuring commute durations in Old Orchard Beach are 20 to 24 minutes (955 commuters, 21.7%), 15 to 19 minutes (929 commuters, 21.1%), and 10 to 14 minutes (480 commuters, 10.9%).
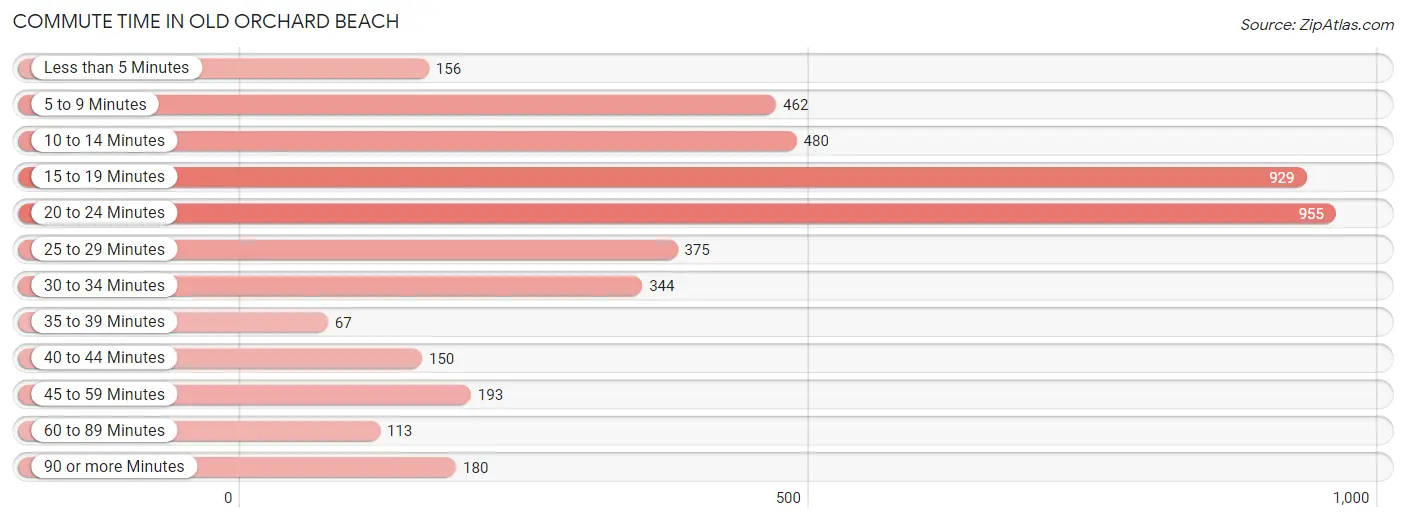
| Commute Time | # Commuters | % Commuters |
| Less than 5 Minutes | 156 | 3.5% |
| 5 to 9 Minutes | 462 | 10.5% |
| 10 to 14 Minutes | 480 | 10.9% |
| 15 to 19 Minutes | 929 | 21.1% |
| 20 to 24 Minutes | 955 | 21.7% |
| 25 to 29 Minutes | 375 | 8.5% |
| 30 to 34 Minutes | 344 | 7.8% |
| 35 to 39 Minutes | 67 | 1.5% |
| 40 to 44 Minutes | 150 | 3.4% |
| 45 to 59 Minutes | 193 | 4.4% |
| 60 to 89 Minutes | 113 | 2.6% |
| 90 or more Minutes | 180 | 4.1% |
Commute Time by Sex in Old Orchard Beach
The most common commute times in Old Orchard Beach are 15 to 19 minutes (603 commuters, 23.3%) for males and 20 to 24 minutes (430 commuters, 23.7%) for females.
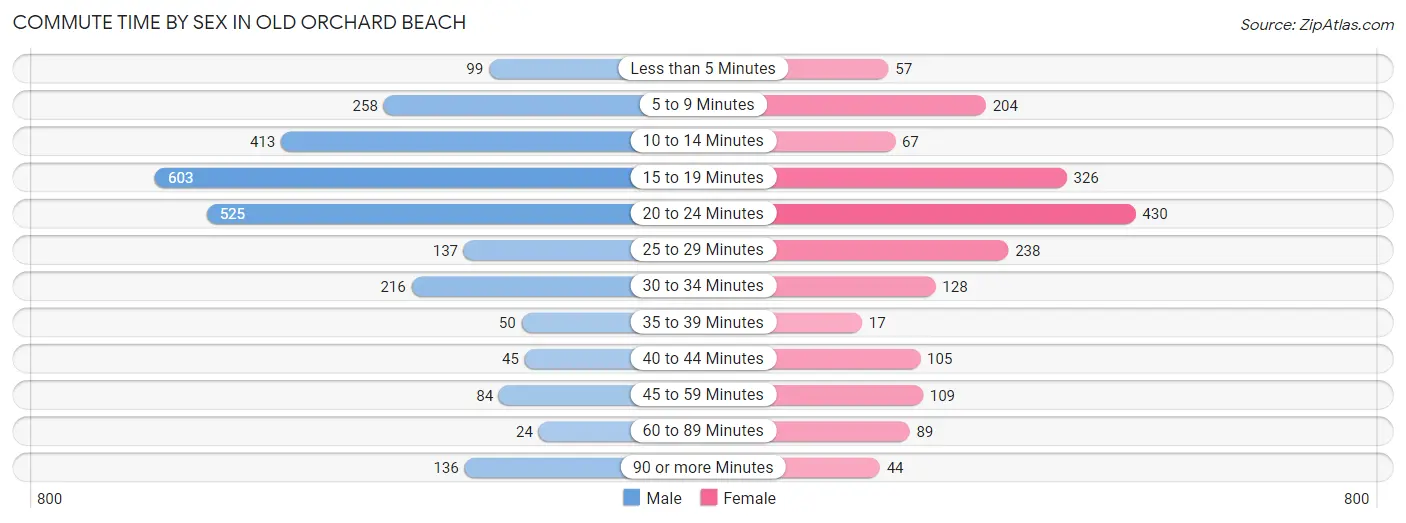
| Commute Time | Male | Female |
| Less than 5 Minutes | 99 (3.8%) | 57 (3.1%) |
| 5 to 9 Minutes | 258 (10.0%) | 204 (11.3%) |
| 10 to 14 Minutes | 413 (16.0%) | 67 (3.7%) |
| 15 to 19 Minutes | 603 (23.3%) | 326 (18.0%) |
| 20 to 24 Minutes | 525 (20.3%) | 430 (23.7%) |
| 25 to 29 Minutes | 137 (5.3%) | 238 (13.1%) |
| 30 to 34 Minutes | 216 (8.3%) | 128 (7.1%) |
| 35 to 39 Minutes | 50 (1.9%) | 17 (0.9%) |
| 40 to 44 Minutes | 45 (1.7%) | 105 (5.8%) |
| 45 to 59 Minutes | 84 (3.2%) | 109 (6.0%) |
| 60 to 89 Minutes | 24 (0.9%) | 89 (4.9%) |
| 90 or more Minutes | 136 (5.2%) | 44 (2.4%) |
Time of Departure to Work by Sex in Old Orchard Beach
The most frequent times of departure to work in Old Orchard Beach are 8:00 AM to 8:29 AM (549, 21.2%) for males and 7:30 AM to 7:59 AM (356, 19.6%) for females.
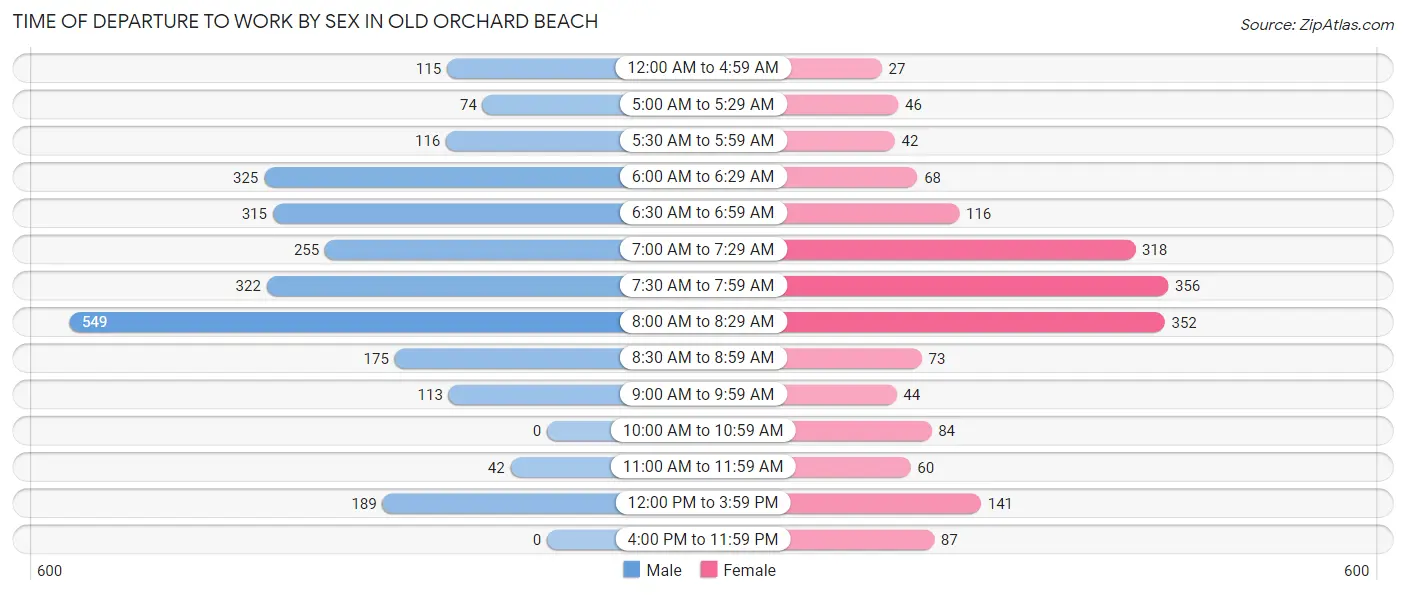
| Time of Departure | Male | Female |
| 12:00 AM to 4:59 AM | 115 (4.4%) | 27 (1.5%) |
| 5:00 AM to 5:29 AM | 74 (2.9%) | 46 (2.5%) |
| 5:30 AM to 5:59 AM | 116 (4.5%) | 42 (2.3%) |
| 6:00 AM to 6:29 AM | 325 (12.6%) | 68 (3.7%) |
| 6:30 AM to 6:59 AM | 315 (12.2%) | 116 (6.4%) |
| 7:00 AM to 7:29 AM | 255 (9.9%) | 318 (17.5%) |
| 7:30 AM to 7:59 AM | 322 (12.4%) | 356 (19.6%) |
| 8:00 AM to 8:29 AM | 549 (21.2%) | 352 (19.4%) |
| 8:30 AM to 8:59 AM | 175 (6.8%) | 73 (4.0%) |
| 9:00 AM to 9:59 AM | 113 (4.4%) | 44 (2.4%) |
| 10:00 AM to 10:59 AM | 0 (0.0%) | 84 (4.6%) |
| 11:00 AM to 11:59 AM | 42 (1.6%) | 60 (3.3%) |
| 12:00 PM to 3:59 PM | 189 (7.3%) | 141 (7.8%) |
| 4:00 PM to 11:59 PM | 0 (0.0%) | 87 (4.8%) |
| Total | 2,590 (100.0%) | 1,814 (100.0%) |
Housing Occupancy in Old Orchard Beach
Occupancy by Ownership in Old Orchard Beach
Of the total 5,224 dwellings in Old Orchard Beach, owner-occupied units account for 3,693 (70.7%), while renter-occupied units make up 1,531 (29.3%).
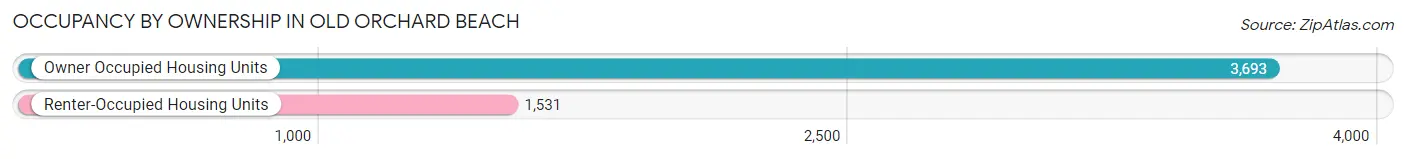
| Occupancy | # Housing Units | % Housing Units |
| Owner Occupied Housing Units | 3,693 | 70.7% |
| Renter-Occupied Housing Units | 1,531 | 29.3% |
| Total Occupied Housing Units | 5,224 | 100.0% |
Occupancy by Household Size in Old Orchard Beach
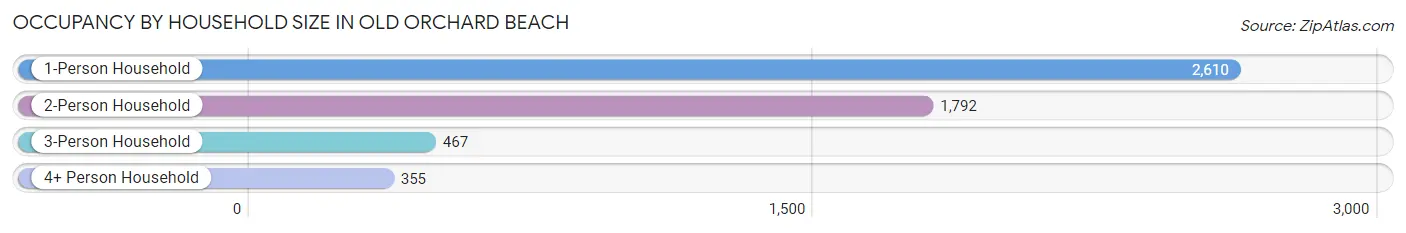
| Household Size | # Housing Units | % Housing Units |
| 1-Person Household | 2,610 | 50.0% |
| 2-Person Household | 1,792 | 34.3% |
| 3-Person Household | 467 | 8.9% |
| 4+ Person Household | 355 | 6.8% |
| Total Housing Units | 5,224 | 100.0% |
Occupancy by Ownership by Household Size in Old Orchard Beach
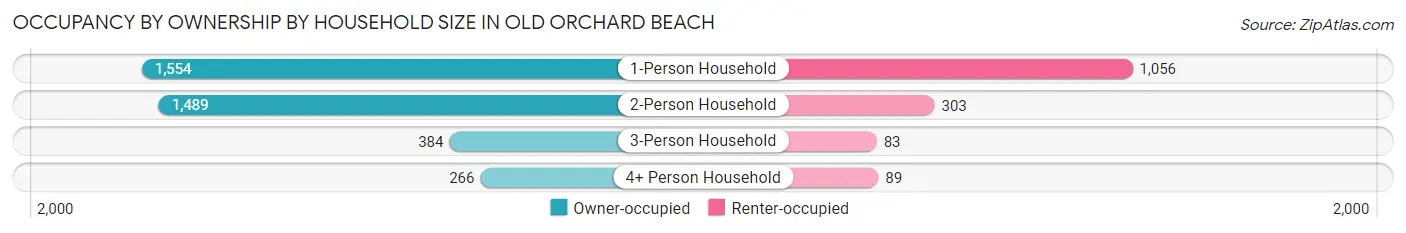
| Household Size | Owner-occupied | Renter-occupied |
| 1-Person Household | 1,554 (59.5%) | 1,056 (40.5%) |
| 2-Person Household | 1,489 (83.1%) | 303 (16.9%) |
| 3-Person Household | 384 (82.2%) | 83 (17.8%) |
| 4+ Person Household | 266 (74.9%) | 89 (25.1%) |
| Total Housing Units | 3,693 (70.7%) | 1,531 (29.3%) |
Occupancy by Educational Attainment in Old Orchard Beach
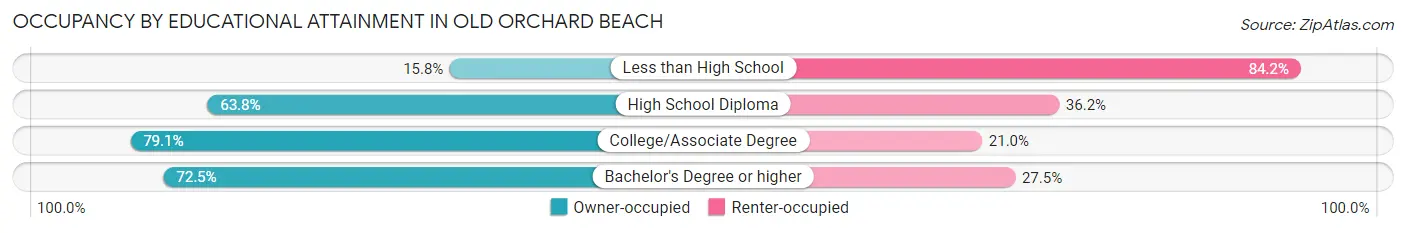
| Household Size | Owner-occupied | Renter-occupied |
| Less than High School | 28 (15.8%) | 149 (84.2%) |
| High School Diploma | 762 (63.8%) | 433 (36.2%) |
| College/Associate Degree | 1,336 (79.0%) | 354 (20.9%) |
| Bachelor's Degree or higher | 1,567 (72.5%) | 595 (27.5%) |
Occupancy by Age of Householder in Old Orchard Beach
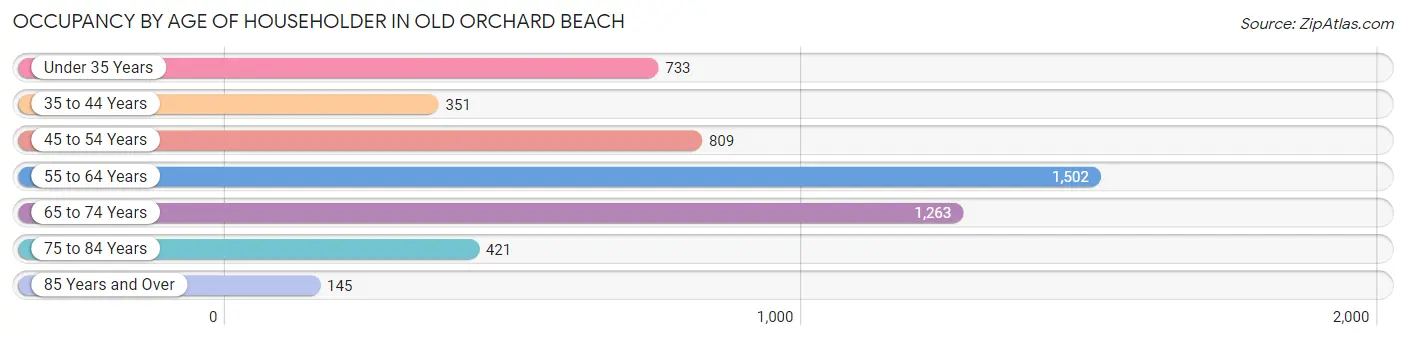
| Age Bracket | # Households | % Households |
| Under 35 Years | 733 | 14.0% |
| 35 to 44 Years | 351 | 6.7% |
| 45 to 54 Years | 809 | 15.5% |
| 55 to 64 Years | 1,502 | 28.7% |
| 65 to 74 Years | 1,263 | 24.2% |
| 75 to 84 Years | 421 | 8.1% |
| 85 Years and Over | 145 | 2.8% |
| Total | 5,224 | 100.0% |
Housing Finances in Old Orchard Beach
Median Income by Occupancy in Old Orchard Beach
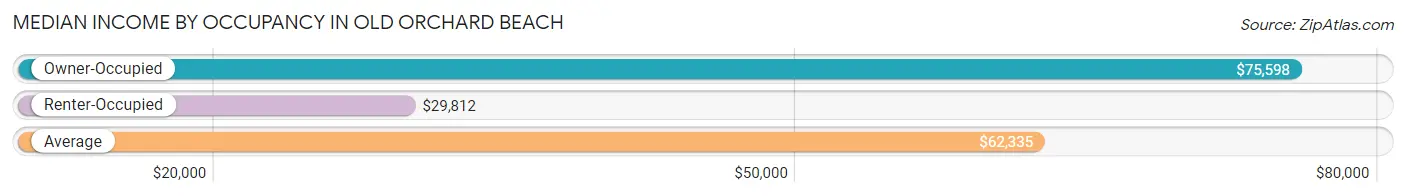
| Occupancy Type | # Households | Median Income |
| Owner-Occupied | 3,693 (70.7%) | $75,598 |
| Renter-Occupied | 1,531 (29.3%) | $29,812 |
| Average | 5,224 (100.0%) | $62,335 |
Occupancy by Householder Income Bracket in Old Orchard Beach
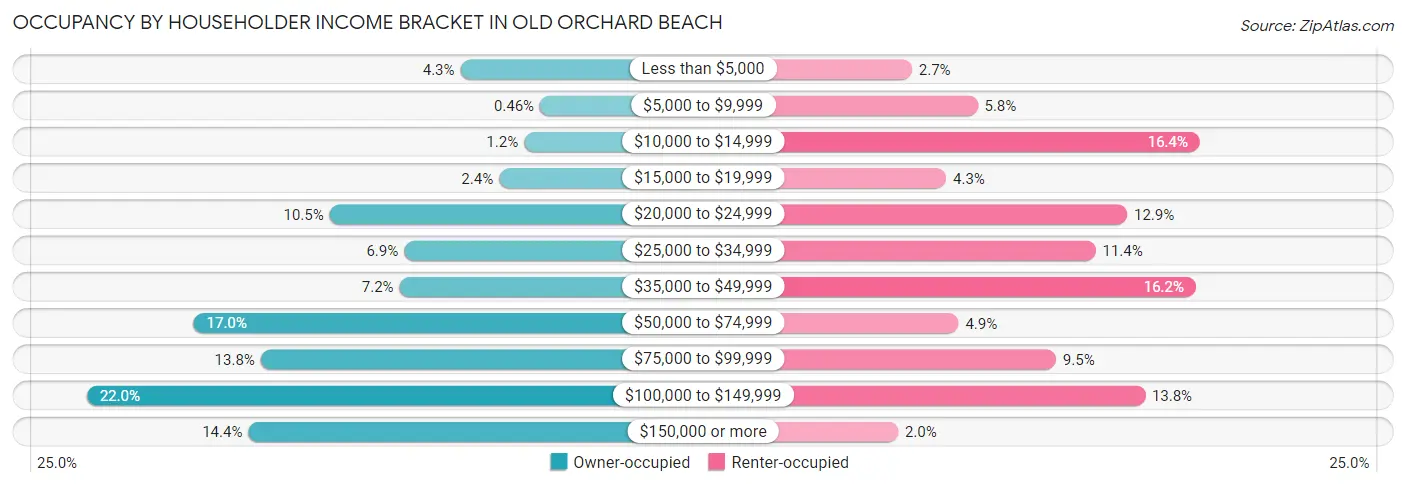
| Income Bracket | Owner-occupied | Renter-occupied |
| Less than $5,000 | 157 (4.3%) | 41 (2.7%) |
| $5,000 to $9,999 | 17 (0.5%) | 89 (5.8%) |
| $10,000 to $14,999 | 45 (1.2%) | 251 (16.4%) |
| $15,000 to $19,999 | 89 (2.4%) | 66 (4.3%) |
| $20,000 to $24,999 | 387 (10.5%) | 198 (12.9%) |
| $25,000 to $34,999 | 256 (6.9%) | 175 (11.4%) |
| $35,000 to $49,999 | 264 (7.1%) | 248 (16.2%) |
| $50,000 to $74,999 | 626 (17.0%) | 75 (4.9%) |
| $75,000 to $99,999 | 508 (13.8%) | 146 (9.5%) |
| $100,000 to $149,999 | 814 (22.0%) | 211 (13.8%) |
| $150,000 or more | 530 (14.3%) | 31 (2.0%) |
| Total | 3,693 (100.0%) | 1,531 (100.0%) |
Monthly Housing Cost Tiers in Old Orchard Beach
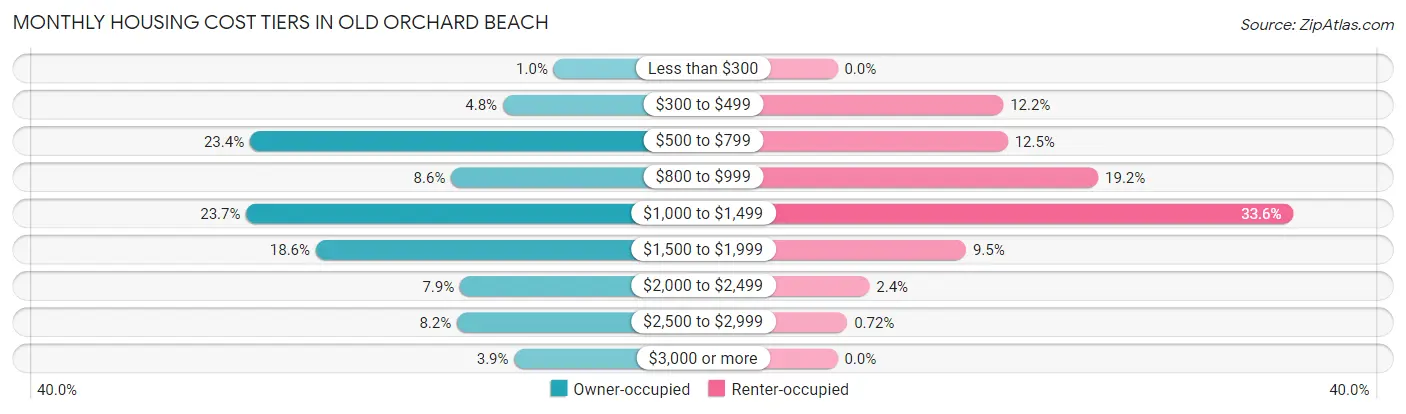
| Monthly Cost | Owner-occupied | Renter-occupied |
| Less than $300 | 38 (1.0%) | 0 (0.0%) |
| $300 to $499 | 176 (4.8%) | 187 (12.2%) |
| $500 to $799 | 864 (23.4%) | 192 (12.5%) |
| $800 to $999 | 317 (8.6%) | 294 (19.2%) |
| $1,000 to $1,499 | 874 (23.7%) | 514 (33.6%) |
| $1,500 to $1,999 | 685 (18.5%) | 145 (9.5%) |
| $2,000 to $2,499 | 293 (7.9%) | 36 (2.4%) |
| $2,500 to $2,999 | 301 (8.2%) | 11 (0.7%) |
| $3,000 or more | 145 (3.9%) | 0 (0.0%) |
| Total | 3,693 (100.0%) | 1,531 (100.0%) |
Physical Housing Characteristics in Old Orchard Beach
Housing Structures in Old Orchard Beach
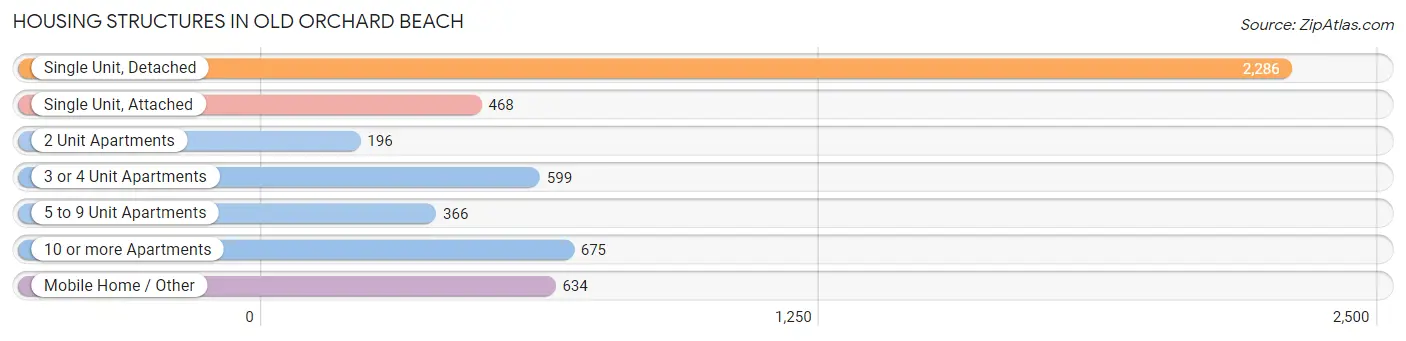
| Structure Type | # Housing Units | % Housing Units |
| Single Unit, Detached | 2,286 | 43.8% |
| Single Unit, Attached | 468 | 9.0% |
| 2 Unit Apartments | 196 | 3.7% |
| 3 or 4 Unit Apartments | 599 | 11.5% |
| 5 to 9 Unit Apartments | 366 | 7.0% |
| 10 or more Apartments | 675 | 12.9% |
| Mobile Home / Other | 634 | 12.1% |
| Total | 5,224 | 100.0% |
Housing Structures by Occupancy in Old Orchard Beach
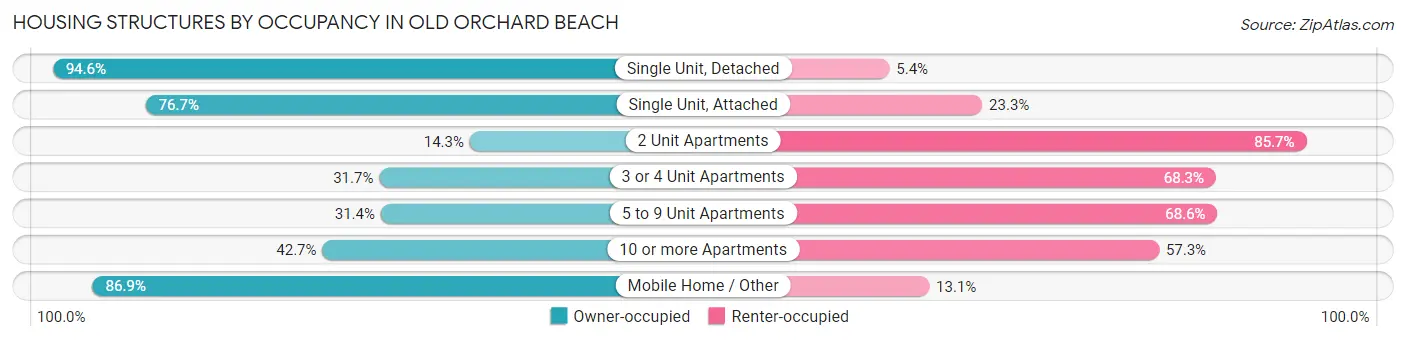
| Structure Type | Owner-occupied | Renter-occupied |
| Single Unit, Detached | 2,162 (94.6%) | 124 (5.4%) |
| Single Unit, Attached | 359 (76.7%) | 109 (23.3%) |
| 2 Unit Apartments | 28 (14.3%) | 168 (85.7%) |
| 3 or 4 Unit Apartments | 190 (31.7%) | 409 (68.3%) |
| 5 to 9 Unit Apartments | 115 (31.4%) | 251 (68.6%) |
| 10 or more Apartments | 288 (42.7%) | 387 (57.3%) |
| Mobile Home / Other | 551 (86.9%) | 83 (13.1%) |
| Total | 3,693 (70.7%) | 1,531 (29.3%) |
Housing Structures by Number of Rooms in Old Orchard Beach
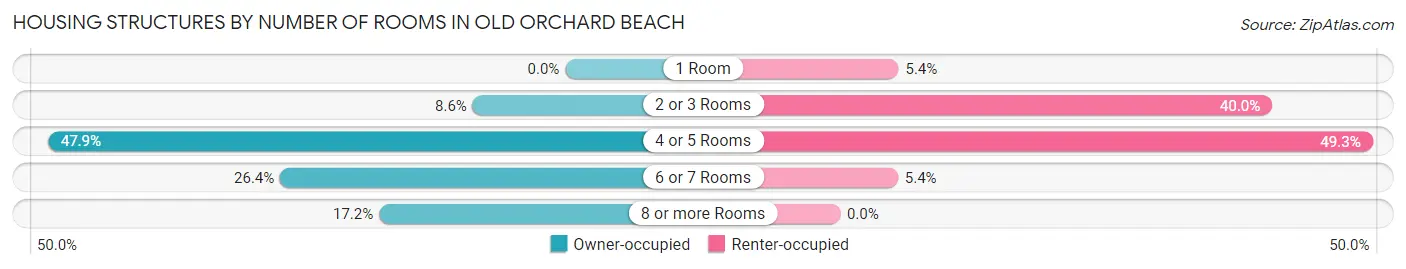
| Number of Rooms | Owner-occupied | Renter-occupied |
| 1 Room | 0 (0.0%) | 83 (5.4%) |
| 2 or 3 Rooms | 316 (8.6%) | 612 (40.0%) |
| 4 or 5 Rooms | 1,767 (47.8%) | 754 (49.2%) |
| 6 or 7 Rooms | 974 (26.4%) | 82 (5.4%) |
| 8 or more Rooms | 636 (17.2%) | 0 (0.0%) |
| Total | 3,693 (100.0%) | 1,531 (100.0%) |
Housing Structure by Heating Type in Old Orchard Beach
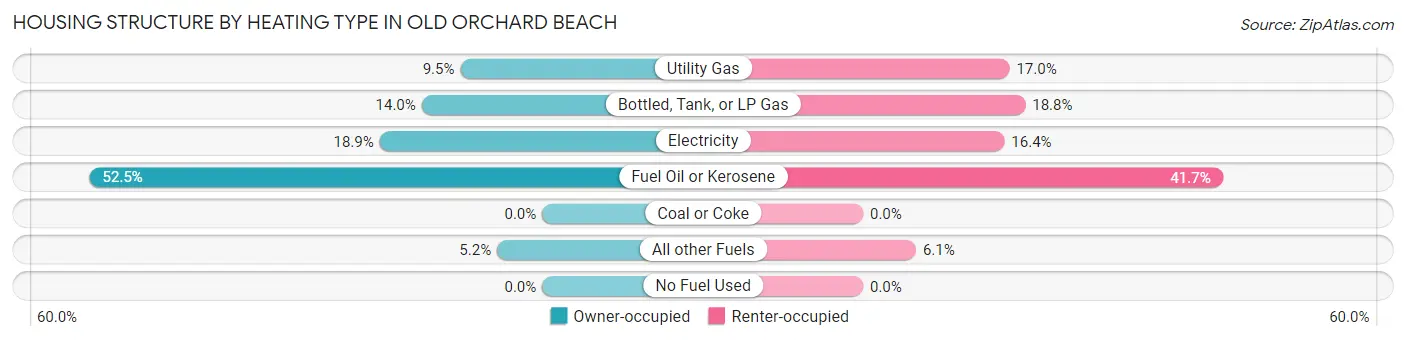
| Heating Type | Owner-occupied | Renter-occupied |
| Utility Gas | 350 (9.5%) | 260 (17.0%) |
| Bottled, Tank, or LP Gas | 516 (14.0%) | 288 (18.8%) |
| Electricity | 696 (18.9%) | 251 (16.4%) |
| Fuel Oil or Kerosene | 1,938 (52.5%) | 638 (41.7%) |
| Coal or Coke | 0 (0.0%) | 0 (0.0%) |
| All other Fuels | 193 (5.2%) | 94 (6.1%) |
| No Fuel Used | 0 (0.0%) | 0 (0.0%) |
| Total | 3,693 (100.0%) | 1,531 (100.0%) |
Household Vehicle Usage in Old Orchard Beach
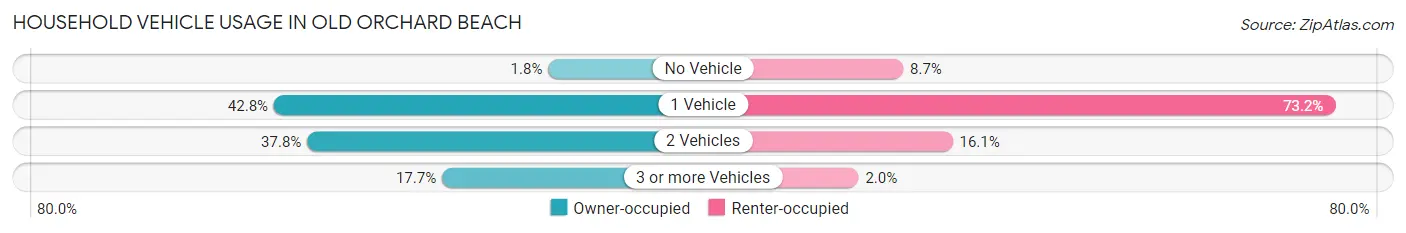
| Vehicles per Household | Owner-occupied | Renter-occupied |
| No Vehicle | 66 (1.8%) | 133 (8.7%) |
| 1 Vehicle | 1,579 (42.8%) | 1,121 (73.2%) |
| 2 Vehicles | 1,396 (37.8%) | 246 (16.1%) |
| 3 or more Vehicles | 652 (17.7%) | 31 (2.0%) |
| Total | 3,693 (100.0%) | 1,531 (100.0%) |
Real Estate & Mortgages in Old Orchard Beach
Real Estate and Mortgage Overview in Old Orchard Beach
| Characteristic | Without Mortgage | With Mortgage |
| Housing Units | 1,576 | 2,117 |
| Median Property Value | $319,700 | $286,700 |
| Median Household Income | $54,792 | $342 |
| Monthly Housing Costs | $743 | $145 |
| Real Estate Taxes | $3,420 | $12 |
Property Value by Mortgage Status in Old Orchard Beach
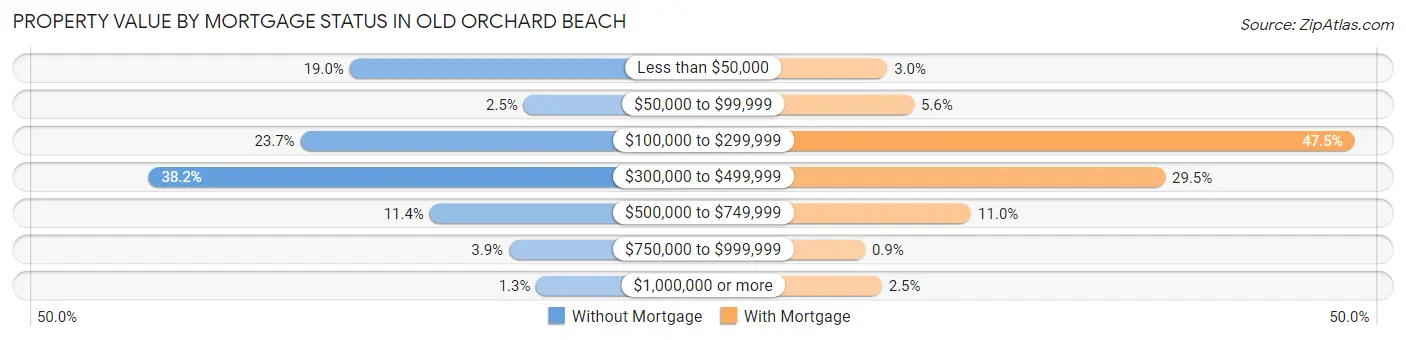
| Property Value | Without Mortgage | With Mortgage |
| Less than $50,000 | 300 (19.0%) | 64 (3.0%) |
| $50,000 to $99,999 | 39 (2.5%) | 118 (5.6%) |
| $100,000 to $299,999 | 374 (23.7%) | 1,006 (47.5%) |
| $300,000 to $499,999 | 602 (38.2%) | 624 (29.5%) |
| $500,000 to $749,999 | 180 (11.4%) | 233 (11.0%) |
| $750,000 to $999,999 | 61 (3.9%) | 19 (0.9%) |
| $1,000,000 or more | 20 (1.3%) | 53 (2.5%) |
| Total | 1,576 (100.0%) | 2,117 (100.0%) |
Household Income by Mortgage Status in Old Orchard Beach
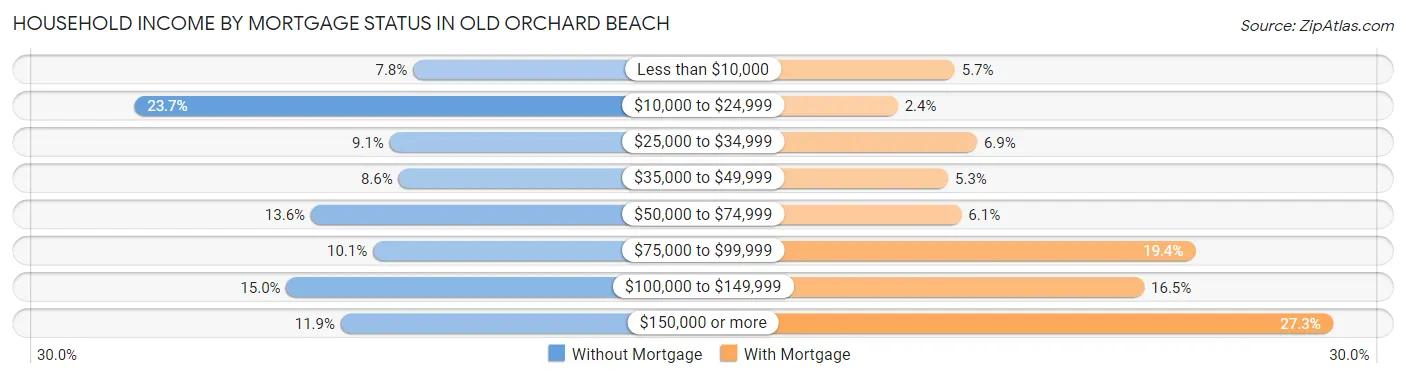
| Household Income | Without Mortgage | With Mortgage |
| Less than $10,000 | 123 (7.8%) | 120 (5.7%) |
| $10,000 to $24,999 | 374 (23.7%) | 51 (2.4%) |
| $25,000 to $34,999 | 144 (9.1%) | 147 (6.9%) |
| $35,000 to $49,999 | 136 (8.6%) | 112 (5.3%) |
| $50,000 to $74,999 | 215 (13.6%) | 128 (6.0%) |
| $75,000 to $99,999 | 159 (10.1%) | 411 (19.4%) |
| $100,000 to $149,999 | 237 (15.0%) | 349 (16.5%) |
| $150,000 or more | 188 (11.9%) | 577 (27.3%) |
| Total | 1,576 (100.0%) | 2,117 (100.0%) |
Property Value to Household Income Ratio in Old Orchard Beach
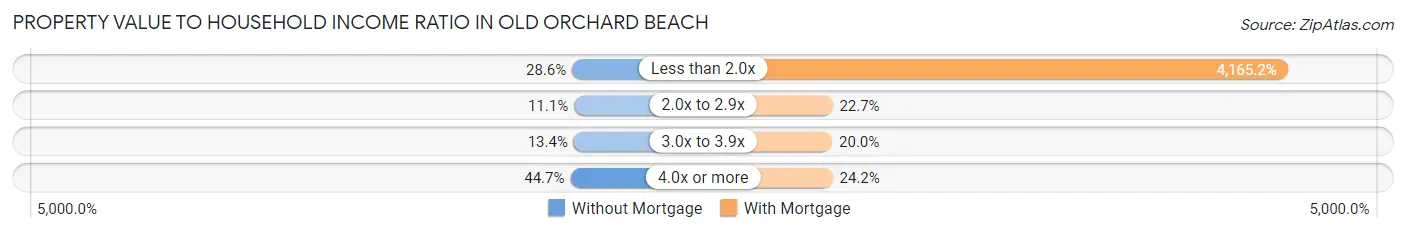
| Value-to-Income Ratio | Without Mortgage | With Mortgage |
| Less than 2.0x | 451 (28.6%) | 88,177 (4,165.2%) |
| 2.0x to 2.9x | 175 (11.1%) | 481 (22.7%) |
| 3.0x to 3.9x | 211 (13.4%) | 424 (20.0%) |
| 4.0x or more | 704 (44.7%) | 512 (24.2%) |
| Total | 1,576 (100.0%) | 2,117 (100.0%) |
Real Estate Taxes by Mortgage Status in Old Orchard Beach
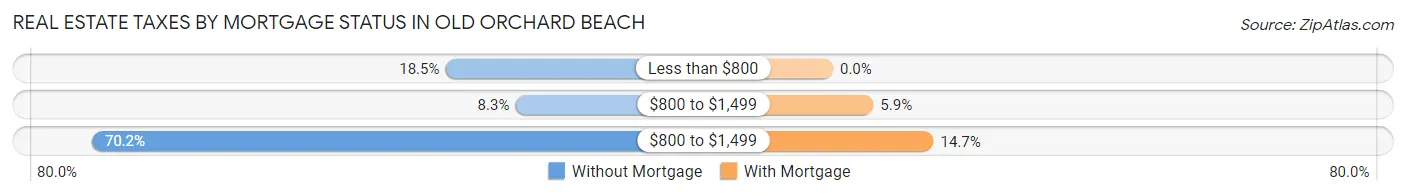
| Property Taxes | Without Mortgage | With Mortgage |
| Less than $800 | 292 (18.5%) | 0 (0.0%) |
| $800 to $1,499 | 131 (8.3%) | 125 (5.9%) |
| $800 to $1,499 | 1,106 (70.2%) | 311 (14.7%) |
| Total | 1,576 (100.0%) | 2,117 (100.0%) |
Health & Disability in Old Orchard Beach
Health Insurance Coverage by Age in Old Orchard Beach
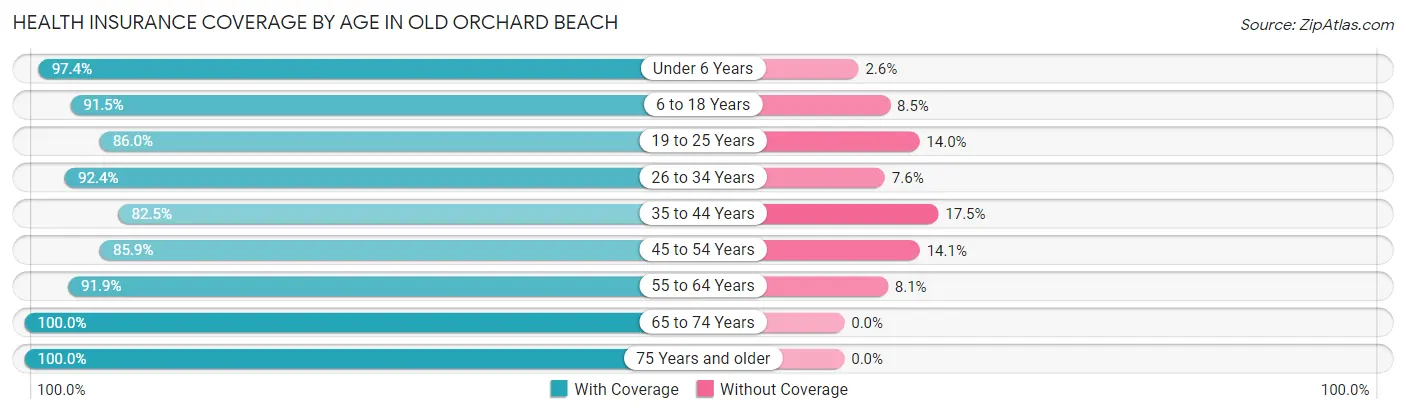
| Age Bracket | With Coverage | Without Coverage |
| Under 6 Years | 221 (97.4%) | 6 (2.6%) |
| 6 to 18 Years | 439 (91.5%) | 41 (8.5%) |
| 19 to 25 Years | 356 (86.0%) | 58 (14.0%) |
| 26 to 34 Years | 1,026 (92.4%) | 84 (7.6%) |
| 35 to 44 Years | 705 (82.5%) | 150 (17.5%) |
| 45 to 54 Years | 971 (85.9%) | 159 (14.1%) |
| 55 to 64 Years | 1,923 (91.9%) | 170 (8.1%) |
| 65 to 74 Years | 1,925 (100.0%) | 0 (0.0%) |
| 75 Years and older | 779 (100.0%) | 0 (0.0%) |
| Total | 8,345 (92.6%) | 668 (7.4%) |
Health Insurance Coverage by Citizenship Status in Old Orchard Beach
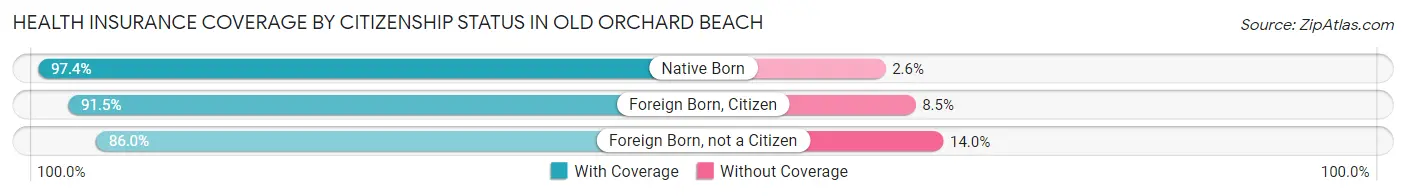
| Citizenship Status | With Coverage | Without Coverage |
| Native Born | 221 (97.4%) | 6 (2.6%) |
| Foreign Born, Citizen | 439 (91.5%) | 41 (8.5%) |
| Foreign Born, not a Citizen | 356 (86.0%) | 58 (14.0%) |
Health Insurance Coverage by Household Income in Old Orchard Beach
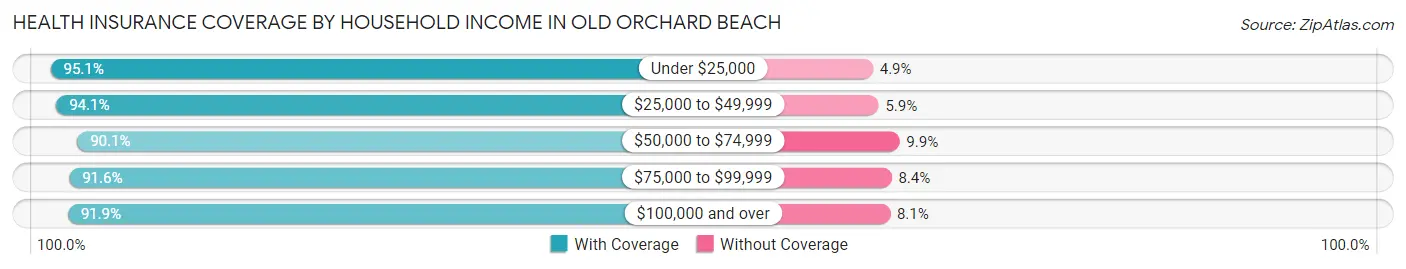
| Household Income | With Coverage | Without Coverage |
| Under $25,000 | 1,542 (95.1%) | 79 (4.9%) |
| $25,000 to $49,999 | 1,190 (94.1%) | 75 (5.9%) |
| $50,000 to $74,999 | 978 (90.1%) | 107 (9.9%) |
| $75,000 to $99,999 | 1,117 (91.6%) | 102 (8.4%) |
| $100,000 and over | 3,452 (91.9%) | 304 (8.1%) |
Public vs Private Health Insurance Coverage by Age in Old Orchard Beach
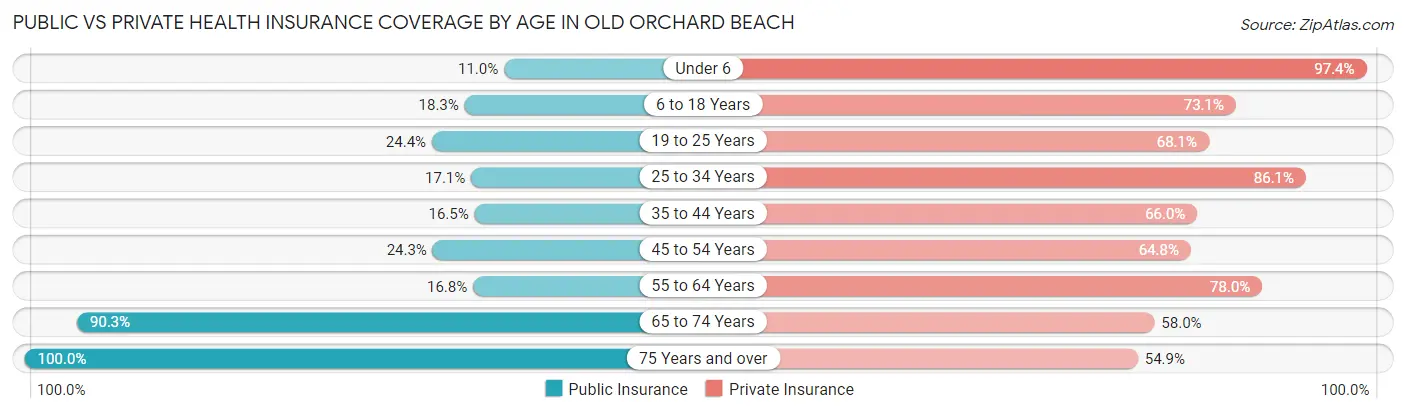
| Age Bracket | Public Insurance | Private Insurance |
| Under 6 | 25 (11.0%) | 221 (97.4%) |
| 6 to 18 Years | 88 (18.3%) | 351 (73.1%) |
| 19 to 25 Years | 101 (24.4%) | 282 (68.1%) |
| 25 to 34 Years | 190 (17.1%) | 956 (86.1%) |
| 35 to 44 Years | 141 (16.5%) | 564 (66.0%) |
| 45 to 54 Years | 274 (24.2%) | 732 (64.8%) |
| 55 to 64 Years | 351 (16.8%) | 1,633 (78.0%) |
| 65 to 74 Years | 1,738 (90.3%) | 1,117 (58.0%) |
| 75 Years and over | 779 (100.0%) | 428 (54.9%) |
| Total | 3,687 (40.9%) | 6,284 (69.7%) |
Disability Status by Sex by Age in Old Orchard Beach
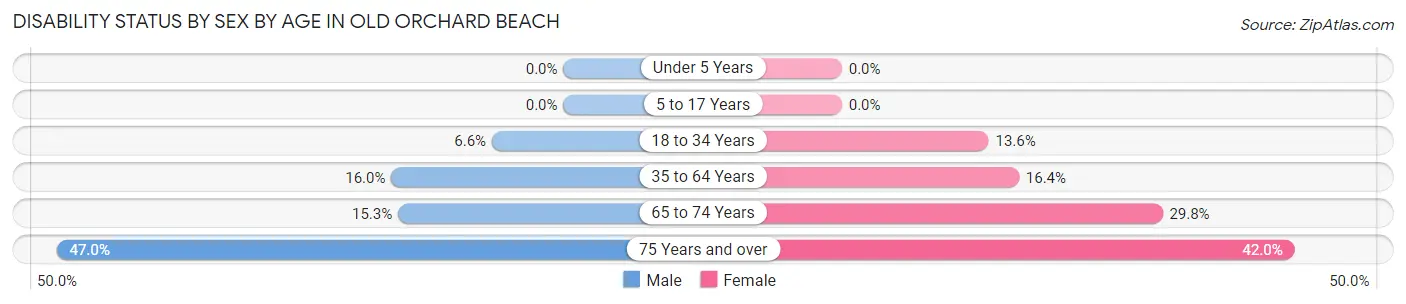
| Age Bracket | Male | Female |
| Under 5 Years | 0 (0.0%) | 0 (0.0%) |
| 5 to 17 Years | 0 (0.0%) | 0 (0.0%) |
| 18 to 34 Years | 59 (6.6%) | 99 (13.6%) |
| 35 to 64 Years | 346 (16.0%) | 314 (16.4%) |
| 65 to 74 Years | 102 (15.3%) | 375 (29.8%) |
| 75 Years and over | 166 (47.0%) | 179 (42.0%) |
Disability Class by Sex by Age in Old Orchard Beach
Disability Class: Hearing Difficulty
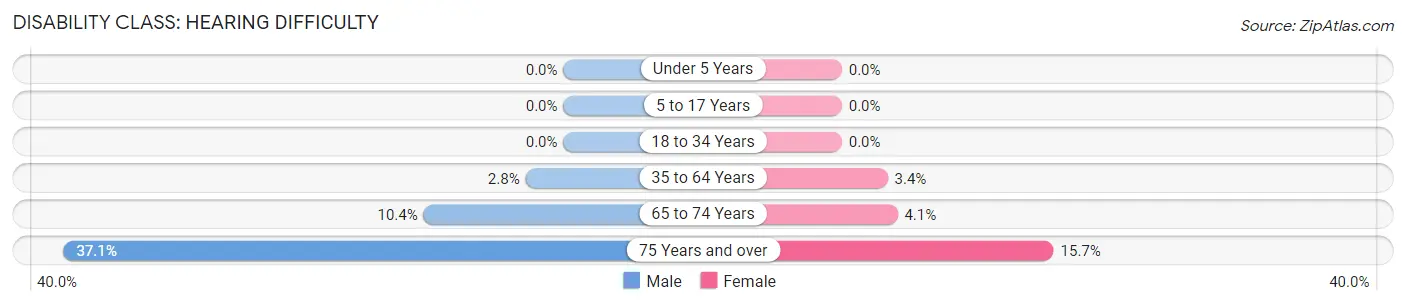
| Age Bracket | Male | Female |
| Under 5 Years | 0 (0.0%) | 0 (0.0%) |
| 5 to 17 Years | 0 (0.0%) | 0 (0.0%) |
| 18 to 34 Years | 0 (0.0%) | 0 (0.0%) |
| 35 to 64 Years | 61 (2.8%) | 65 (3.4%) |
| 65 to 74 Years | 69 (10.4%) | 52 (4.1%) |
| 75 Years and over | 131 (37.1%) | 67 (15.7%) |
Disability Class: Vision Difficulty
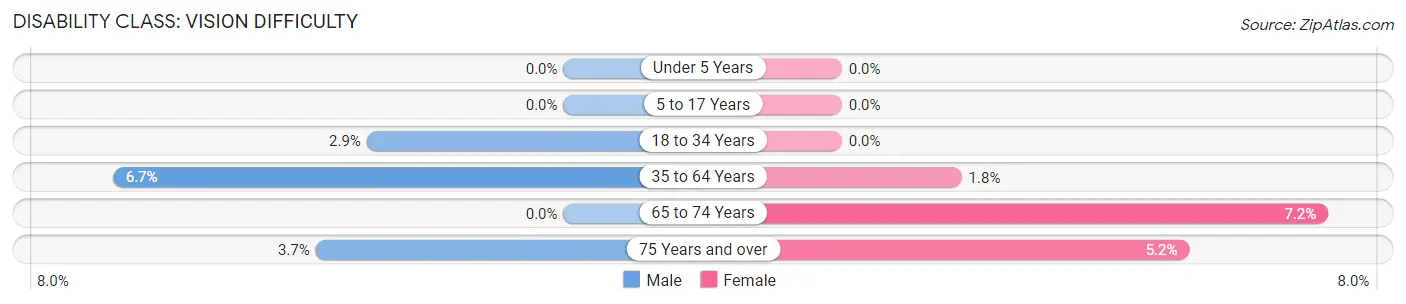
| Age Bracket | Male | Female |
| Under 5 Years | 0 (0.0%) | 0 (0.0%) |
| 5 to 17 Years | 0 (0.0%) | 0 (0.0%) |
| 18 to 34 Years | 26 (2.9%) | 0 (0.0%) |
| 35 to 64 Years | 145 (6.7%) | 34 (1.8%) |
| 65 to 74 Years | 0 (0.0%) | 91 (7.2%) |
| 75 Years and over | 13 (3.7%) | 22 (5.2%) |
Disability Class: Cognitive Difficulty
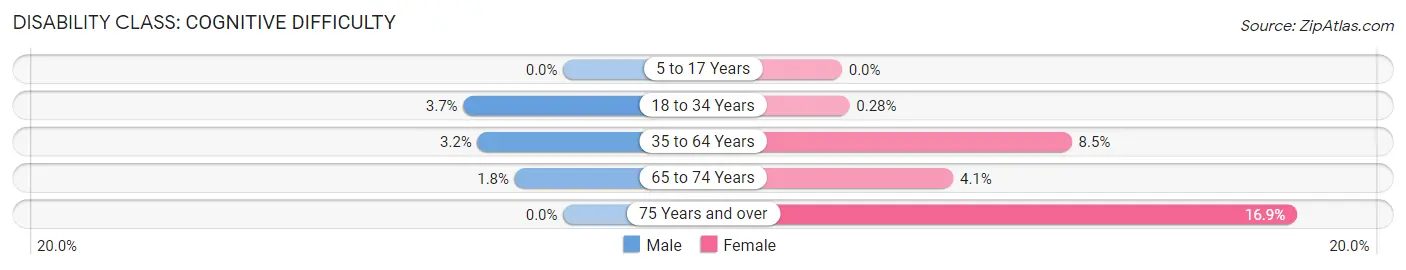
| Age Bracket | Male | Female |
| 5 to 17 Years | 0 (0.0%) | 0 (0.0%) |
| 18 to 34 Years | 33 (3.7%) | 2 (0.3%) |
| 35 to 64 Years | 69 (3.2%) | 163 (8.5%) |
| 65 to 74 Years | 12 (1.8%) | 52 (4.1%) |
| 75 Years and over | 0 (0.0%) | 72 (16.9%) |
Disability Class: Ambulatory Difficulty
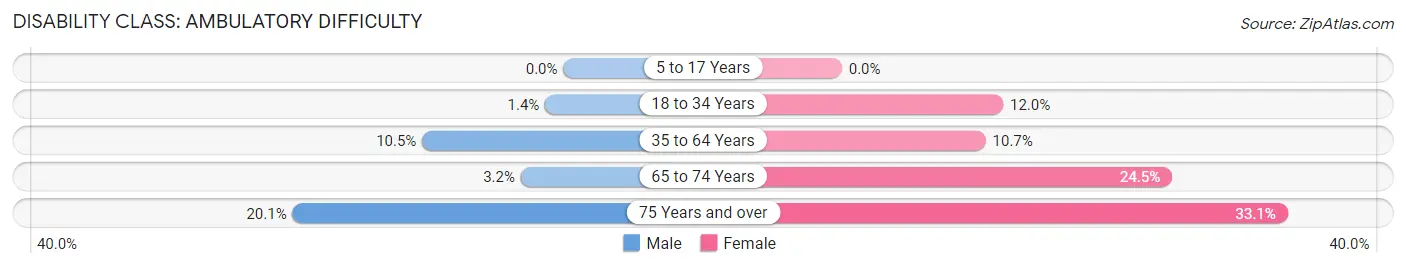
| Age Bracket | Male | Female |
| 5 to 17 Years | 0 (0.0%) | 0 (0.0%) |
| 18 to 34 Years | 12 (1.3%) | 87 (12.0%) |
| 35 to 64 Years | 227 (10.5%) | 204 (10.7%) |
| 65 to 74 Years | 21 (3.2%) | 309 (24.5%) |
| 75 Years and over | 71 (20.1%) | 141 (33.1%) |
Disability Class: Self-Care Difficulty
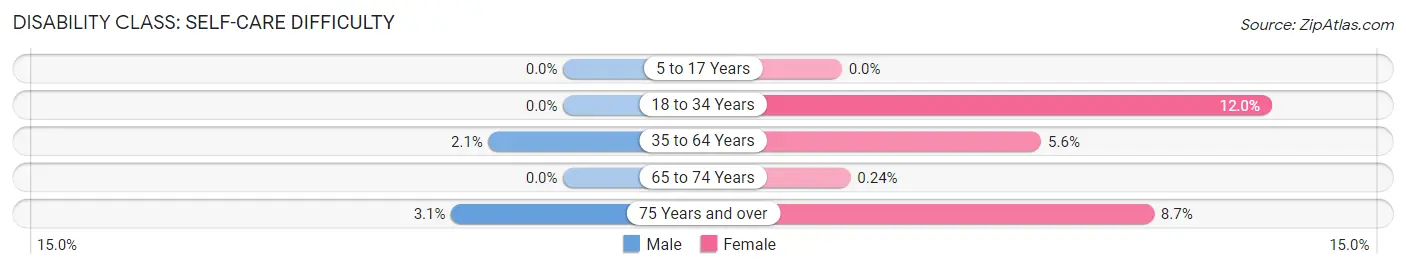
| Age Bracket | Male | Female |
| 5 to 17 Years | 0 (0.0%) | 0 (0.0%) |
| 18 to 34 Years | 0 (0.0%) | 87 (12.0%) |
| 35 to 64 Years | 45 (2.1%) | 106 (5.6%) |
| 65 to 74 Years | 0 (0.0%) | 3 (0.2%) |
| 75 Years and over | 11 (3.1%) | 37 (8.7%) |
Technology Access in Old Orchard Beach
Computing Device Access in Old Orchard Beach
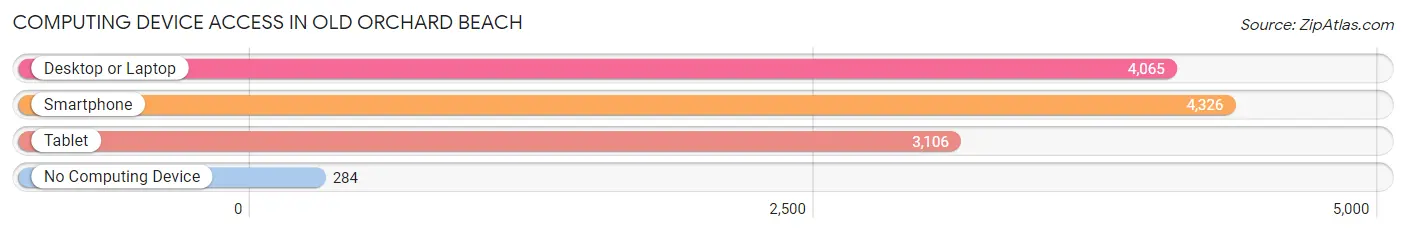
| Device Type | # Households | % Households |
| Desktop or Laptop | 4,065 | 77.8% |
| Smartphone | 4,326 | 82.8% |
| Tablet | 3,106 | 59.5% |
| No Computing Device | 284 | 5.4% |
| Total | 5,224 | 100.0% |
Internet Access in Old Orchard Beach
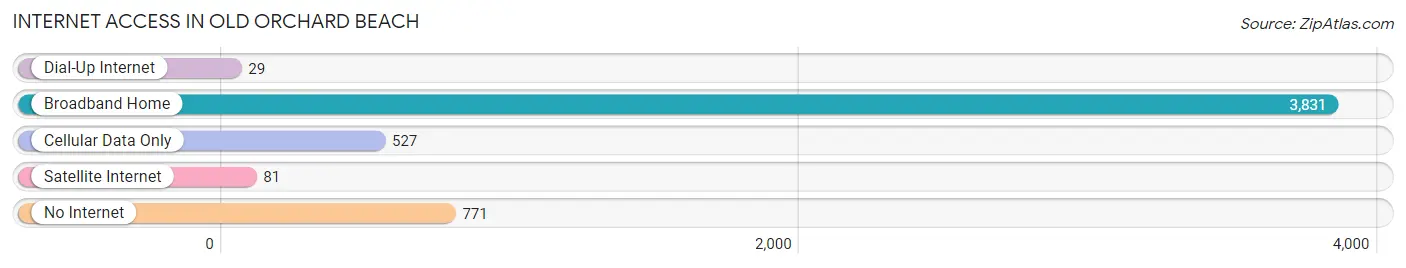
| Internet Type | # Households | % Households |
| Dial-Up Internet | 29 | 0.6% |
| Broadband Home | 3,831 | 73.3% |
| Cellular Data Only | 527 | 10.1% |
| Satellite Internet | 81 | 1.5% |
| No Internet | 771 | 14.8% |
| Total | 5,224 | 100.0% |
Old Orchard Beach Summary
Old Orchard Beach is a town located in York County, Maine, United States. It is situated along the Atlantic Ocean, approximately seven miles south of Portland. The town is a popular summer destination, known for its seven miles of sandy beaches, amusement park, and pier. As of the 2010 census, the town had a population of 8,624.
History
The area that is now Old Orchard Beach was originally inhabited by the Abenaki people. The first European settlers arrived in the area in the late 1600s, and the town was officially incorporated in 1883. The town was named after a grove of apple trees that were planted by the first settlers.
In the late 1800s, Old Orchard Beach became a popular summer destination for wealthy families from Portland and other nearby cities. The town was home to several grand hotels, including the Grand Beach Hotel, which was built in 1883 and was the largest hotel in Maine at the time.
In the early 1900s, the town began to attract a more diverse group of visitors, including working-class families from Massachusetts and other nearby states. The town was also home to several amusement parks, including Palace Playland, which opened in 1902 and is still in operation today.
Geography
Old Orchard Beach is located at 43°32'N 70°20'W (43.5333, -70.3333). According to the United States Census Bureau, the town has a total area of 11.2 square miles, of which 10.7 square miles is land and 0.5 square miles is water.
The town is situated along the Atlantic Ocean, and is bordered by Saco to the north, Scarborough to the east, and Biddeford to the south. The town is home to seven miles of sandy beaches, as well as several parks and nature preserves.
Economy
Old Orchard Beach is a popular summer destination, and the town's economy is largely dependent on tourism. The town is home to several hotels, restaurants, and other businesses that cater to visitors. The town is also home to several amusement parks, including Palace Playland, which is the oldest operating amusement park in the United States.
The town is also home to several manufacturing companies, including a paper mill and a boat building company. The town is also home to several retail stores, including a Walmart Supercenter.
Demographics
As of the 2010 census, there were 8,624 people, 3,845 households, and 2,092 families residing in the town. The population density was 803.2 people per square mile. There were 4,845 housing units at an average density of 451.2 per square mile.
The racial makeup of the town was 97.2% White, 0.7% African American, 0.3% Native American, 0.5% Asian, 0.1% Pacific Islander, 0.3% from other races, and 0.9% from two or more races. Hispanic or Latino of any race were 1.2% of the population.
There were 3,845 households, out of which 24.2% had children under the age of 18 living with them, 41.2% were married couples living together, 11.7% had a female householder with no husband present, and 42.7% were non-families. 34.2% of all households were made up of individuals, and 13.2% had someone living alone who was 65 years of age or older. The average household size was 2.23 and the average family size was 2.86.
In the town, the population was spread out, with 21.2% under the age of 18, 8.2% from 18 to 24, 28.2% from 25 to 44, 25.2% from 45 to 64, and 17.2% who were 65 years of age or older. The median age was 40 years. For every 100 females, there were 95.2 males. For every 100 females age 18 and over, there were 92.2 males.
The median income for a household in the town was $37,917, and the median income for a family was $45,938. Males had a median income of $32,813 versus $25,917 for females. The per capita income for the town was $20,945. About 8.2% of families and 11.2% of the population were below the poverty line, including 15.2% of those under age 18 and 8.2% of those age 65 or over.
Common Questions
What is Per Capita Income in Old Orchard Beach?
Per Capita income in Old Orchard Beach is $44,604.
What is the Median Family Income in Old Orchard Beach?
Median Family Income in Old Orchard Beach is $100,213.
What is the Median Household income in Old Orchard Beach?
Median Household Income in Old Orchard Beach is $62,335.
What is Income or Wage Gap in Old Orchard Beach?
Income or Wage Gap in Old Orchard Beach is 0.2%.
Women in Old Orchard Beach earn 99.8 cents for every dollar earned by a man.
What is Inequality or Gini Index in Old Orchard Beach?
Inequality or Gini Index in Old Orchard Beach is 0.45.
What is the Total Population of Old Orchard Beach?
Total Population of Old Orchard Beach is 9,040.
What is the Total Male Population of Old Orchard Beach?
Total Male Population of Old Orchard Beach is 4,385.
What is the Total Female Population of Old Orchard Beach?
Total Female Population of Old Orchard Beach is 4,655.
What is the Ratio of Males per 100 Females in Old Orchard Beach?
There are 94.20 Males per 100 Females in Old Orchard Beach.
What is the Ratio of Females per 100 Males in Old Orchard Beach?
There are 106.16 Females per 100 Males in Old Orchard Beach.
What is the Median Population Age in Old Orchard Beach?
Median Population Age in Old Orchard Beach is 57.5 Years.
What is the Average Family Size in Old Orchard Beach
Average Family Size in Old Orchard Beach is 2.4 People.
What is the Average Household Size in Old Orchard Beach
Average Household Size in Old Orchard Beach is 1.7 People.
How Large is the Labor Force in Old Orchard Beach?
There are 5,213 People in the Labor Forcein in Old Orchard Beach.
What is the Percentage of People in the Labor Force in Old Orchard Beach?
61.3% of People are in the Labor Force in Old Orchard Beach.
What is the Unemployment Rate in Old Orchard Beach?
Unemployment Rate in Old Orchard Beach is 5.6%.