Piscataquis County, ME Map & Demographics
Piscataquis County Map
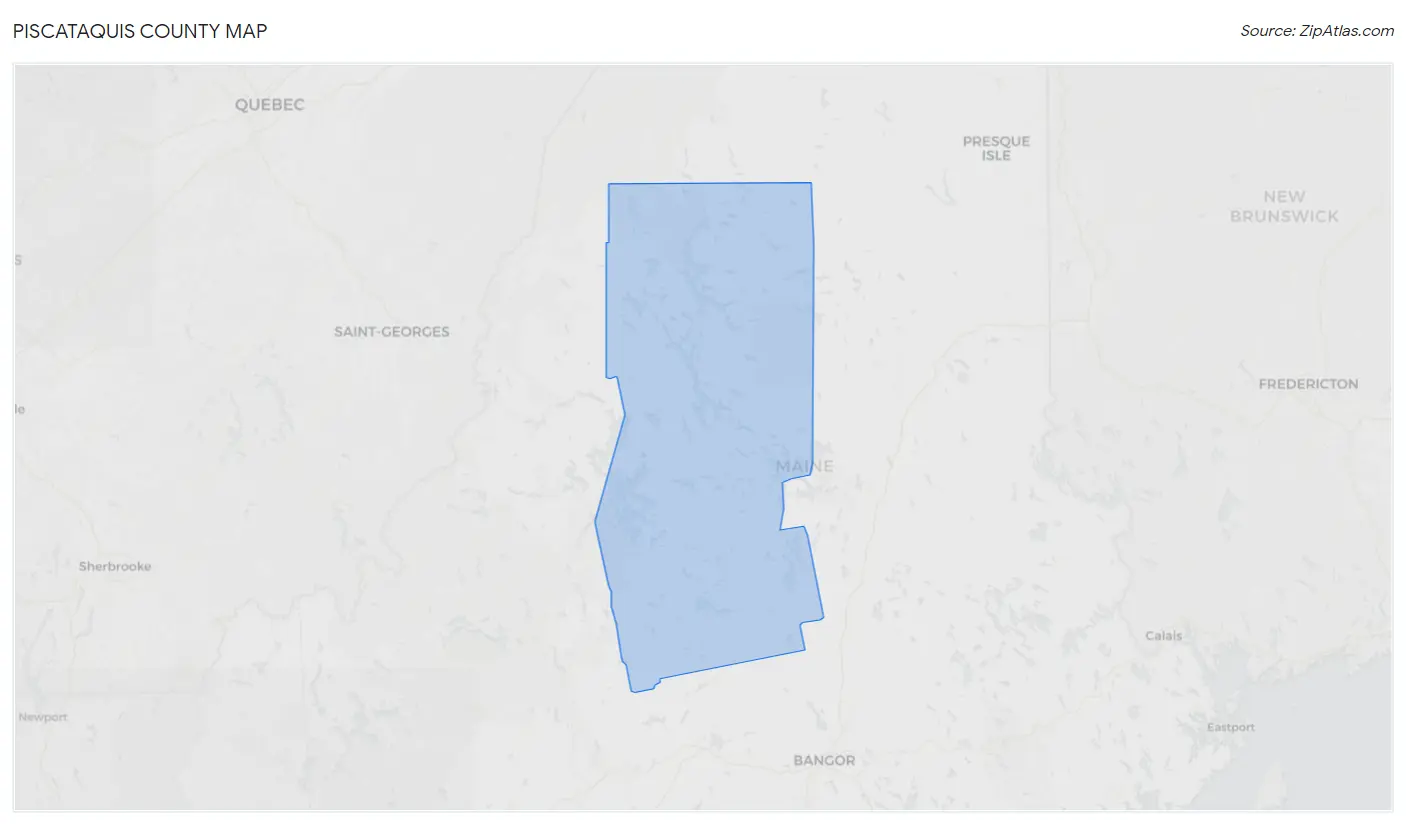
Piscataquis County Overview
$32,843
PER CAPITA INCOME
$62,700
AVG FAMILY INCOME
$51,805
AVG HOUSEHOLD INCOME
18.6%
WAGE / INCOME GAP [ % ]
81.4¢/ $1
WAGE / INCOME GAP [ $ ]
$9,101
FAMILY INCOME DEFICIT
0.46
INEQUALITY / GINI INDEX
16,936
TOTAL POPULATION
8,571
MALE POPULATION
8,365
FEMALE POPULATION
102.46
MALES / 100 FEMALES
97.60
FEMALES / 100 MALES
51.2
MEDIAN AGE
2.5
AVG FAMILY SIZE
2.2
AVG HOUSEHOLD SIZE
7,537
LABOR FORCE [ PEOPLE ]
52.1%
PERCENT IN LABOR FORCE
4.9%
UNEMPLOYMENT RATE
Piscataquis County Area Codes
Income in Piscataquis County
Income Overview in Piscataquis County
Per Capita Income in Piscataquis County is $32,843, while median incomes of families and households are $62,700 and $51,805 respectively.
| Characteristic | Number | Measure |
| Per Capita Income | 16,936 | $32,843 |
| Median Family Income | 4,897 | $62,700 |
| Mean Family Income | 4,897 | $87,032 |
| Median Household Income | 7,654 | $51,805 |
| Mean Household Income | 7,654 | $72,016 |
| Income Deficit | 4,897 | $9,101 |
| Wage / Income Gap (%) | 16,936 | 18.55% |
| Wage / Income Gap ($) | 16,936 | 81.45¢ per $1 |
| Gini / Inequality Index | 16,936 | 0.46 |
Earnings by Sex in Piscataquis County
Average Earnings in Piscataquis County are $36,440, $41,351 for men and $33,680 for women, a difference of 18.5%.
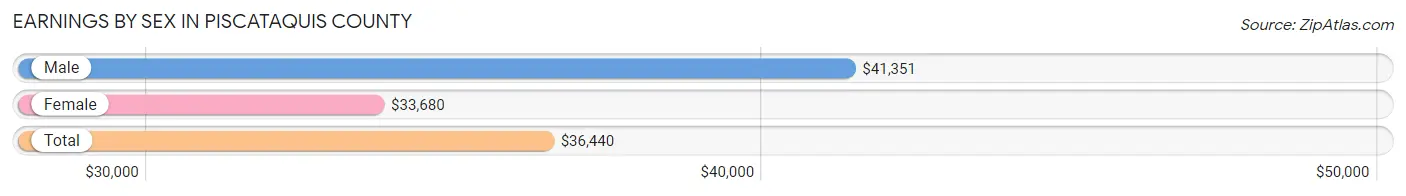
| Sex | Number | Average Earnings |
| Male | 4,201 (52.4%) | $41,351 |
| Female | 3,814 (47.6%) | $33,680 |
| Total | 8,015 (100.0%) | $36,440 |
Earnings by Sex by Income Bracket in Piscataquis County
The most common earnings brackets in Piscataquis County are $100,000+ for men (476 | 11.3%) and $30,000 to $34,999 for women (477 | 12.5%).
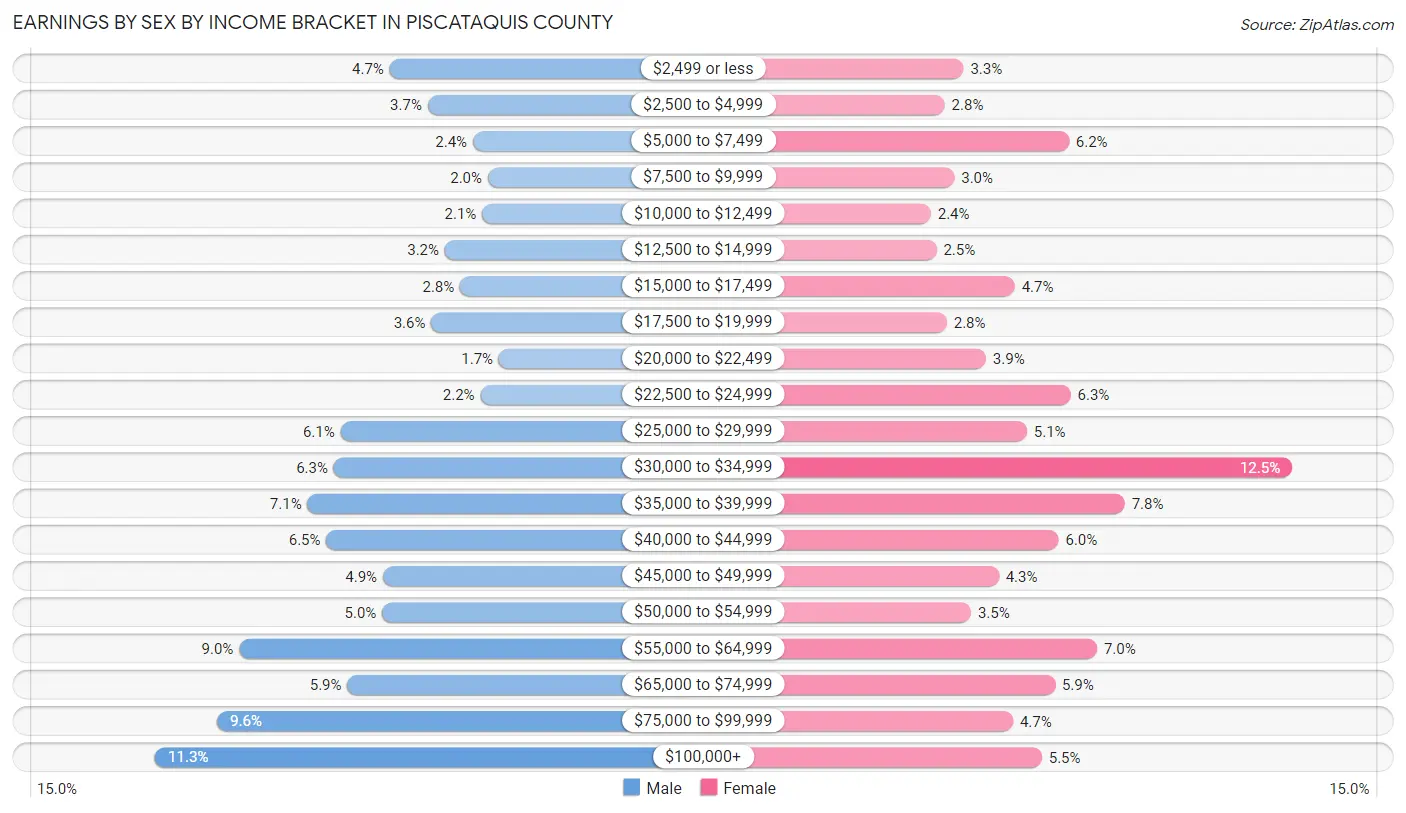
| Income | Male | Female |
| $2,499 or less | 199 (4.7%) | 125 (3.3%) |
| $2,500 to $4,999 | 154 (3.7%) | 105 (2.8%) |
| $5,000 to $7,499 | 101 (2.4%) | 238 (6.2%) |
| $7,500 to $9,999 | 83 (2.0%) | 115 (3.0%) |
| $10,000 to $12,499 | 90 (2.1%) | 90 (2.4%) |
| $12,500 to $14,999 | 134 (3.2%) | 96 (2.5%) |
| $15,000 to $17,499 | 116 (2.8%) | 180 (4.7%) |
| $17,500 to $19,999 | 150 (3.6%) | 107 (2.8%) |
| $20,000 to $22,499 | 70 (1.7%) | 149 (3.9%) |
| $22,500 to $24,999 | 92 (2.2%) | 240 (6.3%) |
| $25,000 to $29,999 | 257 (6.1%) | 193 (5.1%) |
| $30,000 to $34,999 | 265 (6.3%) | 477 (12.5%) |
| $35,000 to $39,999 | 296 (7.0%) | 298 (7.8%) |
| $40,000 to $44,999 | 274 (6.5%) | 227 (5.9%) |
| $45,000 to $49,999 | 207 (4.9%) | 163 (4.3%) |
| $50,000 to $54,999 | 208 (5.0%) | 133 (3.5%) |
| $55,000 to $64,999 | 377 (9.0%) | 268 (7.0%) |
| $65,000 to $74,999 | 249 (5.9%) | 223 (5.9%) |
| $75,000 to $99,999 | 403 (9.6%) | 178 (4.7%) |
| $100,000+ | 476 (11.3%) | 209 (5.5%) |
| Total | 4,201 (100.0%) | 3,814 (100.0%) |
Earnings by Sex by Educational Attainment in Piscataquis County
Average earnings in Piscataquis County are $43,329 for men and $34,966 for women, a difference of 19.3%. Men with an educational attainment of graduate degree enjoy the highest average annual earnings of $64,896, while those with less than high school education earn the least with $34,620. Women with an educational attainment of graduate degree earn the most with the average annual earnings of $64,792, while those with high school diploma education have the smallest earnings of $24,046.
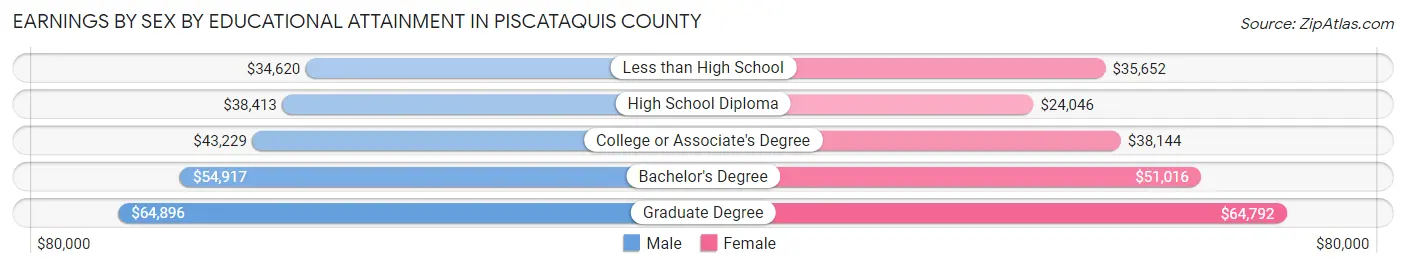
| Educational Attainment | Male Income | Female Income |
| Less than High School | $34,620 | $35,652 |
| High School Diploma | $38,413 | $24,046 |
| College or Associate's Degree | $43,229 | $38,144 |
| Bachelor's Degree | $54,917 | $51,016 |
| Graduate Degree | $64,896 | $64,792 |
| Total | $43,329 | $34,966 |
Family Income in Piscataquis County
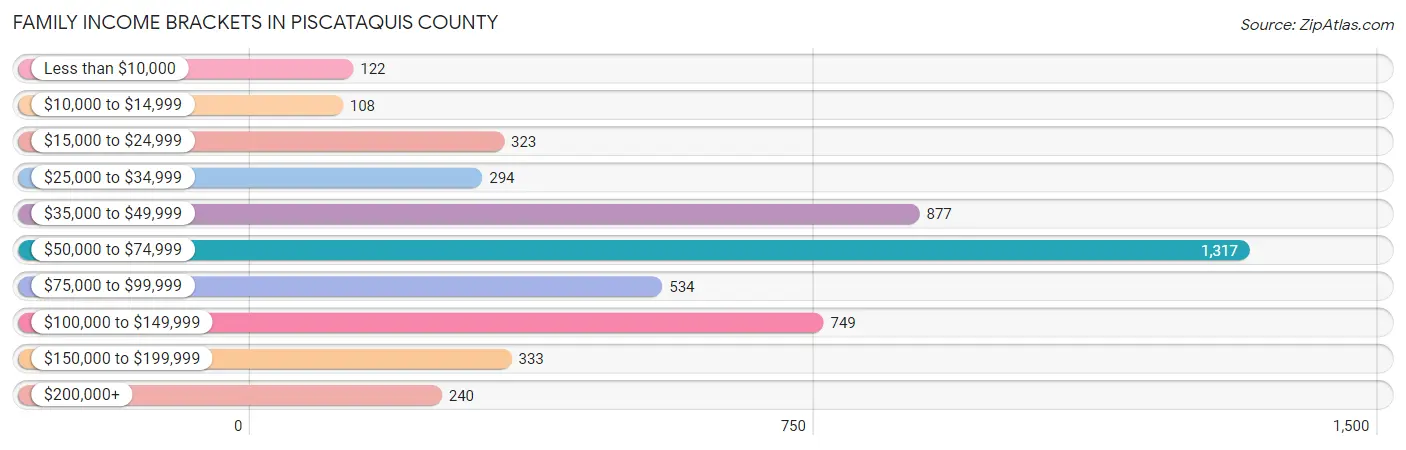
Family Income Brackets in Piscataquis County
According to the Piscataquis County family income data, there are 1,317 families falling into the $50,000 to $74,999 income range, which is the most common income bracket and makes up 26.9% of all families. Conversely, the $10,000 to $14,999 income bracket is the least frequent group with only 108 families (2.2%) belonging to this category.
| Income Bracket | # Families | % Families |
| Less than $10,000 | 122 | 2.5% |
| $10,000 to $14,999 | 108 | 2.2% |
| $15,000 to $24,999 | 323 | 6.6% |
| $25,000 to $34,999 | 294 | 6.0% |
| $35,000 to $49,999 | 877 | 17.9% |
| $50,000 to $74,999 | 1,317 | 26.9% |
| $75,000 to $99,999 | 534 | 10.9% |
| $100,000 to $149,999 | 749 | 15.3% |
| $150,000 to $199,999 | 333 | 6.8% |
| $200,000+ | 240 | 4.9% |
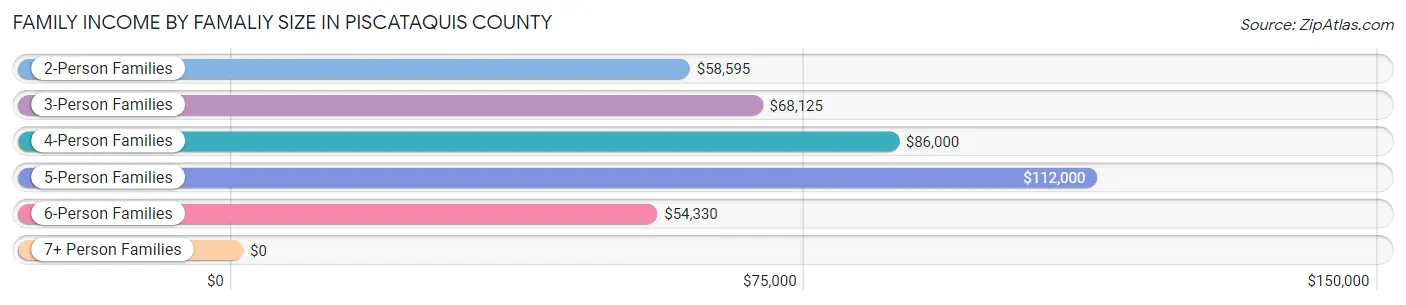
Family Income by Famaliy Size in Piscataquis County
5-person families (188 | 3.8%) account for the highest median family income in Piscataquis County with $112,000 per family, while 2-person families (3,110 | 63.5%) have the highest median income of $29,298 per family member.
| Income Bracket | # Families | Median Income |
| 2-Person Families | 3,110 (63.5%) | $58,595 |
| 3-Person Families | 1,010 (20.6%) | $68,125 |
| 4-Person Families | 436 (8.9%) | $86,000 |
| 5-Person Families | 188 (3.8%) | $112,000 |
| 6-Person Families | 81 (1.7%) | $54,330 |
| 7+ Person Families | 72 (1.5%) | $0 |
| Total | 4,897 (100.0%) | $62,700 |
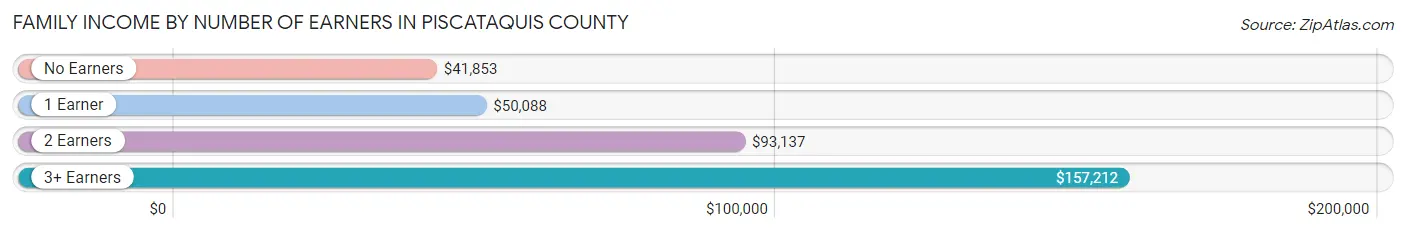
Family Income by Number of Earners in Piscataquis County
The median family income in Piscataquis County is $62,700, with families comprising 3+ earners (285) having the highest median family income of $157,212, while families with no earners (1,252) have the lowest median family income of $41,853, accounting for 5.8% and 25.6% of families, respectively.
| Number of Earners | # Families | Median Income |
| No Earners | 1,252 (25.6%) | $41,853 |
| 1 Earner | 1,623 (33.1%) | $50,088 |
| 2 Earners | 1,737 (35.5%) | $93,137 |
| 3+ Earners | 285 (5.8%) | $157,212 |
| Total | 4,897 (100.0%) | $62,700 |
Household Income in Piscataquis County
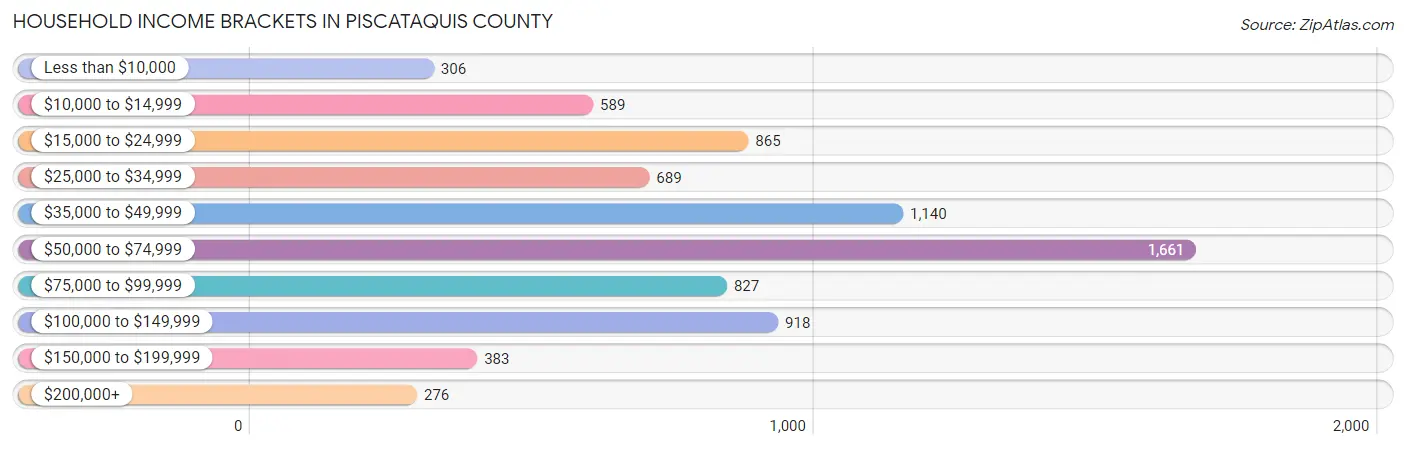
Household Income Brackets in Piscataquis County
With 1,661 households falling in the category, the $50,000 to $74,999 income range is the most frequent in Piscataquis County, accounting for 21.7% of all households. In contrast, only 276 households (3.6%) fall into the $200,000+ income bracket, making it the least populous group.
| Income Bracket | # Households | % Households |
| Less than $10,000 | 306 | 4.0% |
| $10,000 to $14,999 | 589 | 7.7% |
| $15,000 to $24,999 | 865 | 11.3% |
| $25,000 to $34,999 | 689 | 9.0% |
| $35,000 to $49,999 | 1,140 | 14.9% |
| $50,000 to $74,999 | 1,661 | 21.7% |
| $75,000 to $99,999 | 827 | 10.8% |
| $100,000 to $149,999 | 918 | 12.0% |
| $150,000 to $199,999 | 383 | 5.0% |
| $200,000+ | 276 | 3.6% |
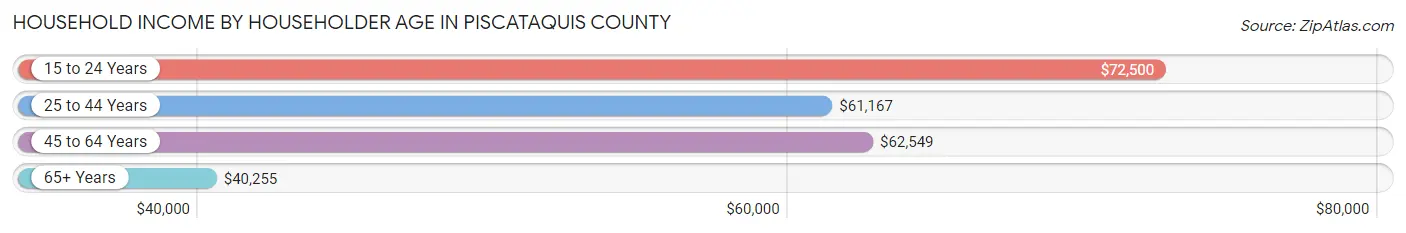
Household Income by Householder Age in Piscataquis County
The median household income in Piscataquis County is $51,805, with the highest median household income of $72,500 found in the 15 to 24 years age bracket for the primary householder. A total of 194 households (2.5%) fall into this category. Meanwhile, the 65+ years age bracket for the primary householder has the lowest median household income of $40,255, with 3,040 households (39.7%) in this group.
| Income Bracket | # Households | Median Income |
| 15 to 24 Years | 194 (2.5%) | $72,500 |
| 25 to 44 Years | 1,638 (21.4%) | $61,167 |
| 45 to 64 Years | 2,782 (36.3%) | $62,549 |
| 65+ Years | 3,040 (39.7%) | $40,255 |
| Total | 7,654 (100.0%) | $51,805 |
Poverty in Piscataquis County
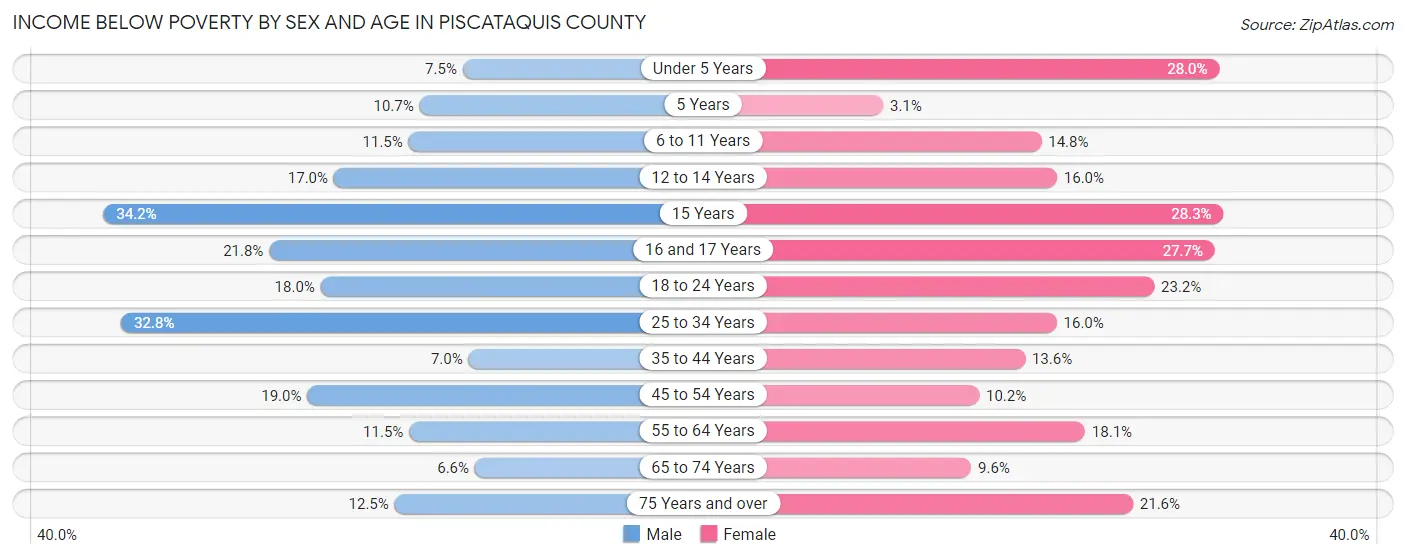
Income Below Poverty by Sex and Age in Piscataquis County
With 14.0% poverty level for males and 16.0% for females among the residents of Piscataquis County, 15 year old males and 15 year old females are the most vulnerable to poverty, with 14 males (34.2%) and 17 females (28.3%) in their respective age groups living below the poverty level.
| Age Bracket | Male | Female |
| Under 5 Years | 31 (7.5%) | 104 (28.0%) |
| 5 Years | 11 (10.7%) | 3 (3.1%) |
| 6 to 11 Years | 51 (11.5%) | 57 (14.8%) |
| 12 to 14 Years | 38 (17.0%) | 42 (16.0%) |
| 15 Years | 14 (34.2%) | 17 (28.3%) |
| 16 and 17 Years | 45 (21.8%) | 54 (27.7%) |
| 18 to 24 Years | 80 (18.0%) | 99 (23.2%) |
| 25 to 34 Years | 269 (32.8%) | 119 (16.0%) |
| 35 to 44 Years | 63 (7.0%) | 122 (13.6%) |
| 45 to 54 Years | 204 (19.0%) | 108 (10.2%) |
| 55 to 64 Years | 173 (11.5%) | 270 (18.0%) |
| 65 to 74 Years | 92 (6.6%) | 124 (9.6%) |
| 75 Years and over | 104 (12.5%) | 185 (21.6%) |
| Total | 1,175 (14.0%) | 1,304 (16.0%) |
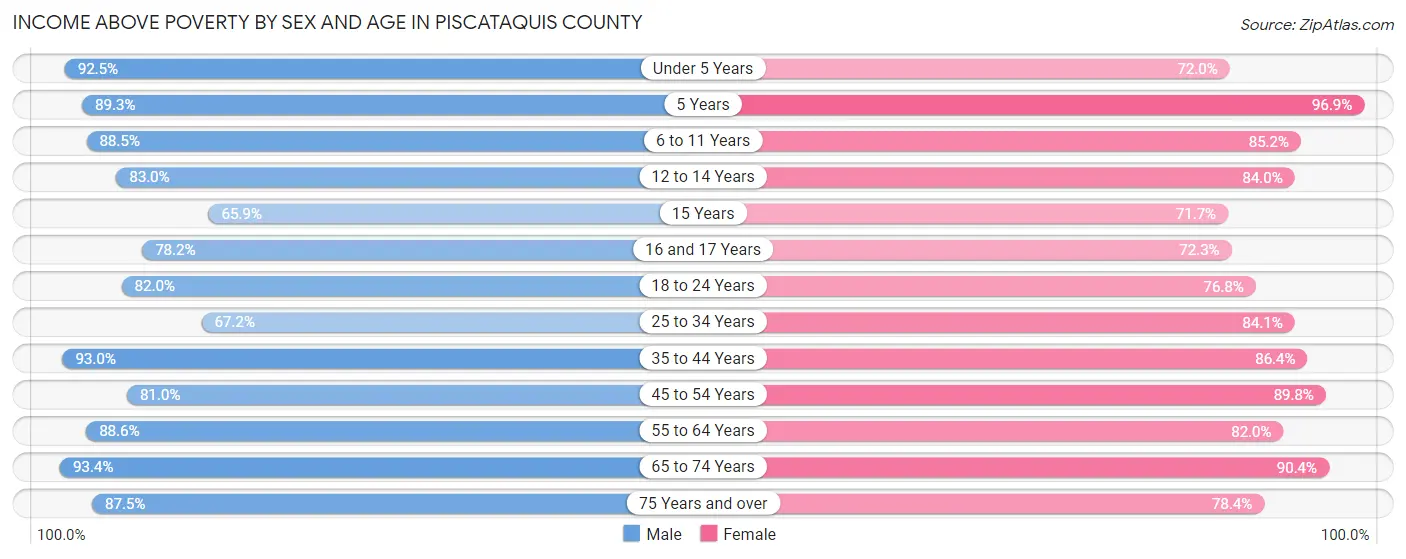
Income Above Poverty by Sex and Age in Piscataquis County
According to the poverty statistics in Piscataquis County, males aged 65 to 74 years and females aged 5 years are the age groups that are most secure financially, with 93.4% of males and 96.9% of females in these age groups living above the poverty line.
| Age Bracket | Male | Female |
| Under 5 Years | 384 (92.5%) | 267 (72.0%) |
| 5 Years | 92 (89.3%) | 95 (96.9%) |
| 6 to 11 Years | 393 (88.5%) | 328 (85.2%) |
| 12 to 14 Years | 185 (83.0%) | 221 (84.0%) |
| 15 Years | 27 (65.8%) | 43 (71.7%) |
| 16 and 17 Years | 161 (78.2%) | 141 (72.3%) |
| 18 to 24 Years | 364 (82.0%) | 328 (76.8%) |
| 25 to 34 Years | 550 (67.2%) | 627 (84.1%) |
| 35 to 44 Years | 832 (93.0%) | 775 (86.4%) |
| 45 to 54 Years | 869 (81.0%) | 952 (89.8%) |
| 55 to 64 Years | 1,338 (88.5%) | 1,226 (82.0%) |
| 65 to 74 Years | 1,309 (93.4%) | 1,168 (90.4%) |
| 75 Years and over | 726 (87.5%) | 671 (78.4%) |
| Total | 7,230 (86.0%) | 6,842 (84.0%) |
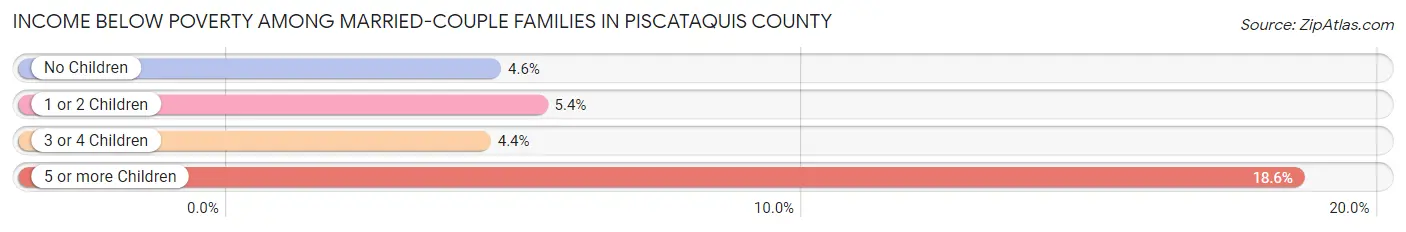
Income Below Poverty Among Married-Couple Families in Piscataquis County
The poverty statistics for married-couple families in Piscataquis County show that 5.0% or 183 of the total 3,674 families live below the poverty line. Families with 5 or more children have the highest poverty rate of 18.6%, comprising of 13 families. On the other hand, families with 3 or 4 children have the lowest poverty rate of 4.4%, which includes 8 families.
| Children | Above Poverty | Below Poverty |
| No Children | 2,646 (95.4%) | 127 (4.6%) |
| 1 or 2 Children | 614 (94.6%) | 35 (5.4%) |
| 3 or 4 Children | 174 (95.6%) | 8 (4.4%) |
| 5 or more Children | 57 (81.4%) | 13 (18.6%) |
| Total | 3,491 (95.0%) | 183 (5.0%) |
Income Below Poverty Among Single-Parent Households in Piscataquis County
According to the poverty data in Piscataquis County, 14.0% or 43 single-father households and 21.6% or 198 single-mother households are living below the poverty line. Among single-father households, those with 1 or 2 children have the highest poverty rate, with 30 households (14.8%) experiencing poverty. Likewise, among single-mother households, those with 3 or 4 children have the highest poverty rate, with 16 households (30.8%) falling below the poverty line.
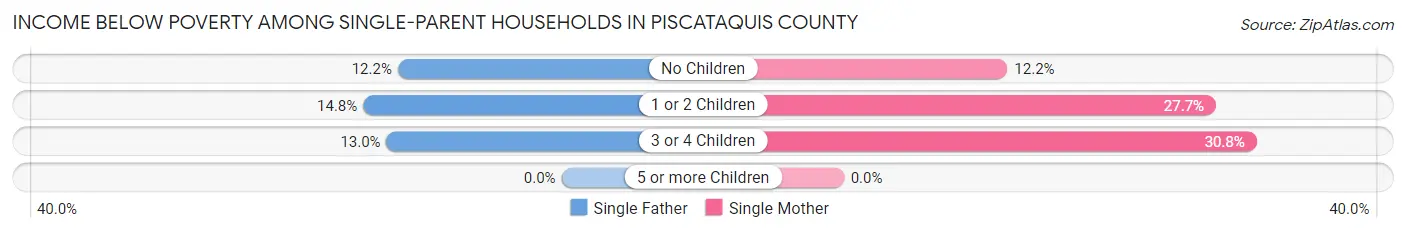
| Children | Single Father | Single Mother |
| No Children | 10 (12.2%) | 45 (12.2%) |
| 1 or 2 Children | 30 (14.8%) | 137 (27.7%) |
| 3 or 4 Children | 3 (13.0%) | 16 (30.8%) |
| 5 or more Children | 0 (0.0%) | 0 (0.0%) |
| Total | 43 (14.0%) | 198 (21.6%) |
Income Below Poverty Among Married-Couple vs Single-Parent Households in Piscataquis County
The poverty data for Piscataquis County shows that 183 of the married-couple family households (5.0%) and 241 of the single-parent households (19.7%) are living below the poverty level. Within the married-couple family households, those with 5 or more children have the highest poverty rate, with 13 households (18.6%) falling below the poverty line. Among the single-parent households, those with 3 or 4 children have the highest poverty rate, with 19 household (25.3%) living below poverty.
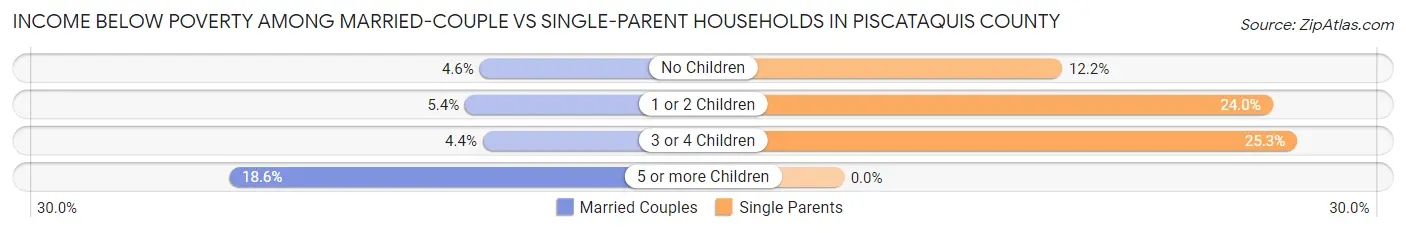
| Children | Married-Couple Families | Single-Parent Households |
| No Children | 127 (4.6%) | 55 (12.2%) |
| 1 or 2 Children | 35 (5.4%) | 167 (24.0%) |
| 3 or 4 Children | 8 (4.4%) | 19 (25.3%) |
| 5 or more Children | 13 (18.6%) | 0 (0.0%) |
| Total | 183 (5.0%) | 241 (19.7%) |
Race in Piscataquis County
The most populous races in Piscataquis County are White / Caucasian (15,825 | 93.4%), Two or more Races (618 | 3.6%), and Hispanic or Latino (414 | 2.4%).
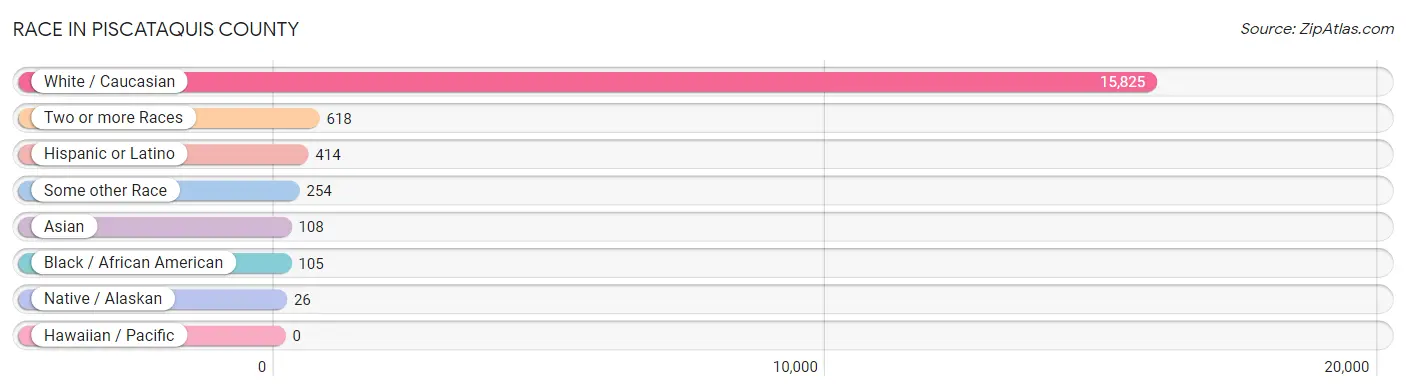
| Race | # Population | % Population |
| Asian | 108 | 0.6% |
| Black / African American | 105 | 0.6% |
| Hawaiian / Pacific | 0 | 0.0% |
| Hispanic or Latino | 414 | 2.4% |
| Native / Alaskan | 26 | 0.2% |
| White / Caucasian | 15,825 | 93.4% |
| Two or more Races | 618 | 3.6% |
| Some other Race | 254 | 1.5% |
| Total | 16,936 | 100.0% |
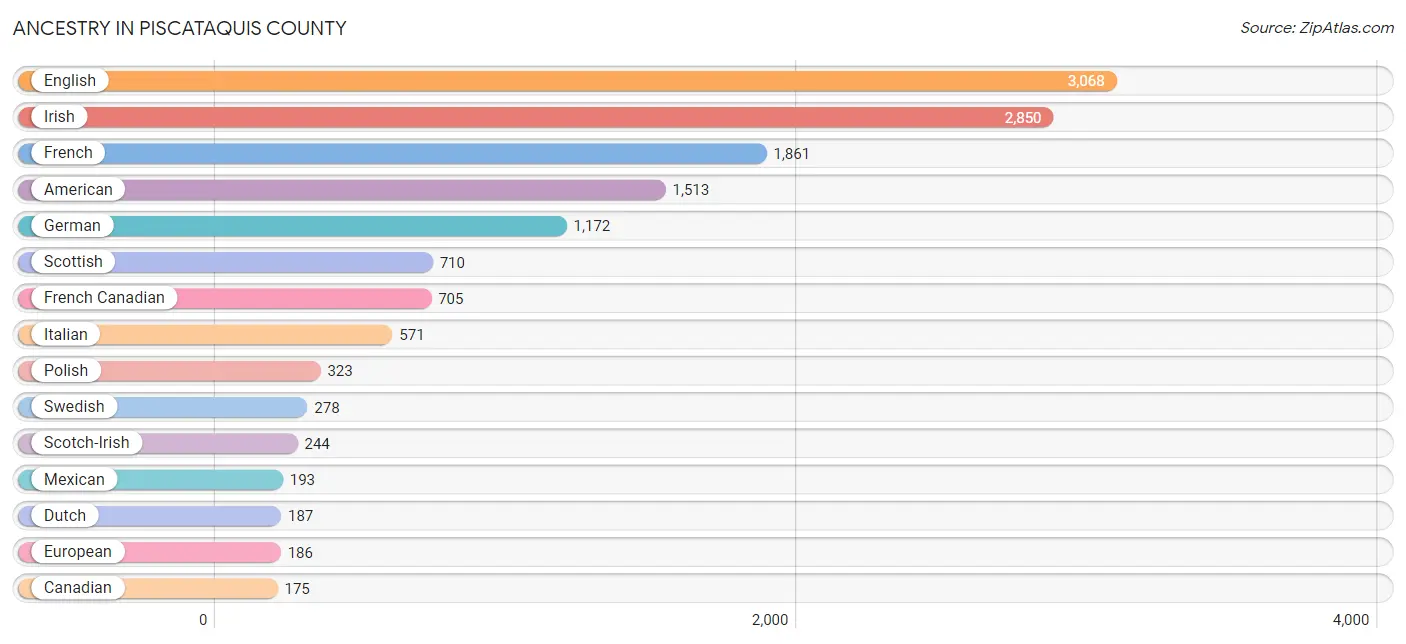
Ancestry in Piscataquis County
The most populous ancestries reported in Piscataquis County are English (3,068 | 18.1%), Irish (2,850 | 16.8%), French (1,861 | 11.0%), American (1,513 | 8.9%), and German (1,172 | 6.9%), together accounting for 61.8% of all Piscataquis County residents.
| Ancestry | # Population | % Population |
| American | 1,513 | 8.9% |
| Arab | 16 | 0.1% |
| Austrian | 20 | 0.1% |
| Basque | 3 | 0.0% |
| Bhutanese | 96 | 0.6% |
| Blackfeet | 23 | 0.1% |
| British | 155 | 0.9% |
| Bulgarian | 2 | 0.0% |
| Cajun | 22 | 0.1% |
| Canadian | 175 | 1.0% |
| Cape Verdean | 32 | 0.2% |
| Celtic | 14 | 0.1% |
| Cherokee | 17 | 0.1% |
| Chippewa | 6 | 0.0% |
| Choctaw | 6 | 0.0% |
| Crow | 2 | 0.0% |
| Cuban | 60 | 0.4% |
| Czech | 69 | 0.4% |
| Czechoslovakian | 1 | 0.0% |
| Danish | 19 | 0.1% |
| Dutch | 187 | 1.1% |
| Eastern European | 35 | 0.2% |
| Ecuadorian | 13 | 0.1% |
| English | 3,068 | 18.1% |
| European | 186 | 1.1% |
| Finnish | 40 | 0.2% |
| French | 1,861 | 11.0% |
| French American Indian | 1 | 0.0% |
| French Canadian | 705 | 4.2% |
| German | 1,172 | 6.9% |
| Greek | 28 | 0.2% |
| Guyanese | 5 | 0.0% |
| Hungarian | 50 | 0.3% |
| Indian (Asian) | 91 | 0.5% |
| Irish | 2,850 | 16.8% |
| Iroquois | 6 | 0.0% |
| Italian | 571 | 3.4% |
| Jordanian | 11 | 0.1% |
| Korean | 104 | 0.6% |
| Latvian | 34 | 0.2% |
| Lebanese | 5 | 0.0% |
| Lithuanian | 43 | 0.3% |
| Mexican | 193 | 1.1% |
| Native Hawaiian | 6 | 0.0% |
| Northern European | 6 | 0.0% |
| Norwegian | 107 | 0.6% |
| Pakistani | 2 | 0.0% |
| Pennsylvania German | 10 | 0.1% |
| Polish | 323 | 1.9% |
| Portuguese | 88 | 0.5% |
| Puerto Rican | 74 | 0.4% |
| Russian | 34 | 0.2% |
| Scandinavian | 14 | 0.1% |
| Scotch-Irish | 244 | 1.4% |
| Scottish | 710 | 4.2% |
| Sioux | 15 | 0.1% |
| Slovak | 46 | 0.3% |
| South American | 13 | 0.1% |
| Spaniard | 22 | 0.1% |
| Spanish | 22 | 0.1% |
| Spanish American | 5 | 0.0% |
| Sri Lankan | 41 | 0.2% |
| Subsaharan African | 32 | 0.2% |
| Swedish | 278 | 1.6% |
| Swiss | 35 | 0.2% |
| Thai | 39 | 0.2% |
| Ukrainian | 7 | 0.0% |
| Welsh | 83 | 0.5% | View All 68 Rows |
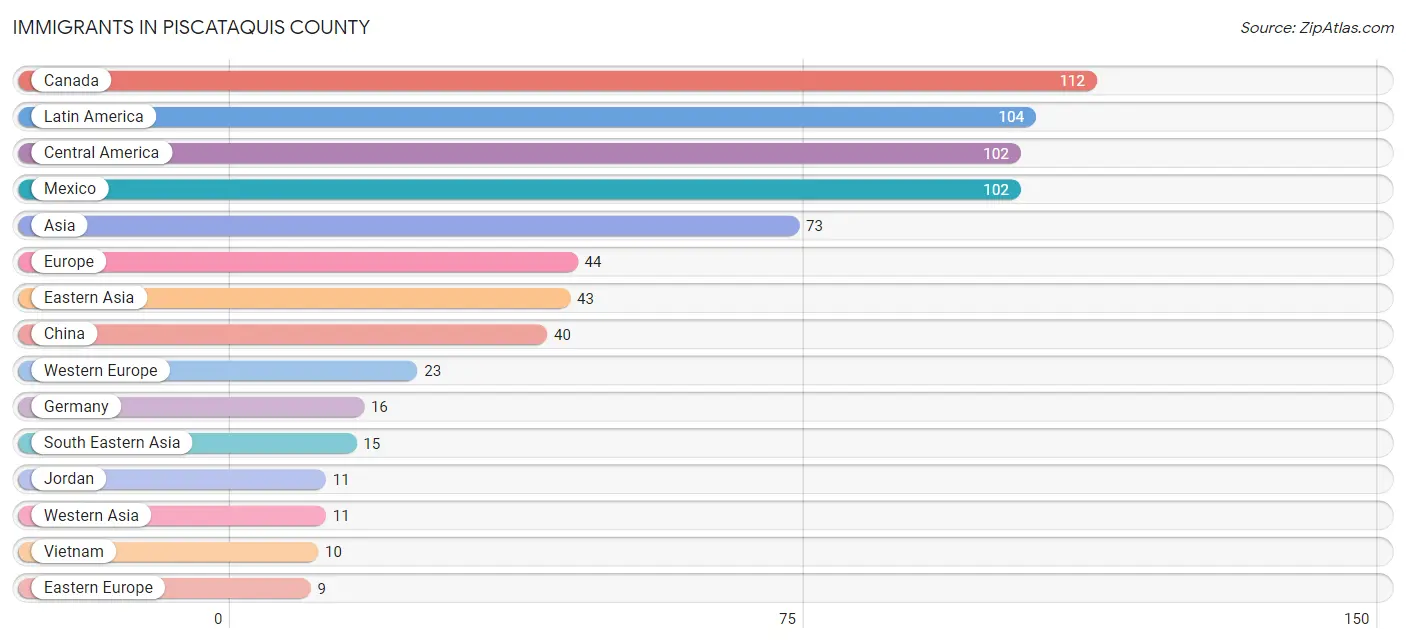
Immigrants in Piscataquis County
The most numerous immigrant groups reported in Piscataquis County came from Canada (112 | 0.7%), Latin America (104 | 0.6%), Central America (102 | 0.6%), Mexico (102 | 0.6%), and Asia (73 | 0.4%), together accounting for 2.9% of all Piscataquis County residents.
| Immigration Origin | # Population | % Population |
| Asia | 73 | 0.4% |
| Austria | 6 | 0.0% |
| Canada | 112 | 0.7% |
| Caribbean | 2 | 0.0% |
| Central America | 102 | 0.6% |
| China | 40 | 0.2% |
| Cuba | 2 | 0.0% |
| Eastern Asia | 43 | 0.3% |
| Eastern Europe | 9 | 0.1% |
| England | 6 | 0.0% |
| Europe | 44 | 0.3% |
| France | 1 | 0.0% |
| Germany | 16 | 0.1% |
| Greece | 2 | 0.0% |
| Italy | 1 | 0.0% |
| Japan | 3 | 0.0% |
| Jordan | 11 | 0.1% |
| Latin America | 104 | 0.6% |
| Mexico | 102 | 0.6% |
| Northern Europe | 6 | 0.0% |
| Pakistan | 4 | 0.0% |
| Philippines | 3 | 0.0% |
| Poland | 9 | 0.1% |
| Portugal | 3 | 0.0% |
| South Central Asia | 4 | 0.0% |
| South Eastern Asia | 15 | 0.1% |
| Southern Europe | 6 | 0.0% |
| Thailand | 2 | 0.0% |
| Vietnam | 10 | 0.1% |
| Western Asia | 11 | 0.1% |
| Western Europe | 23 | 0.1% | View All 31 Rows |
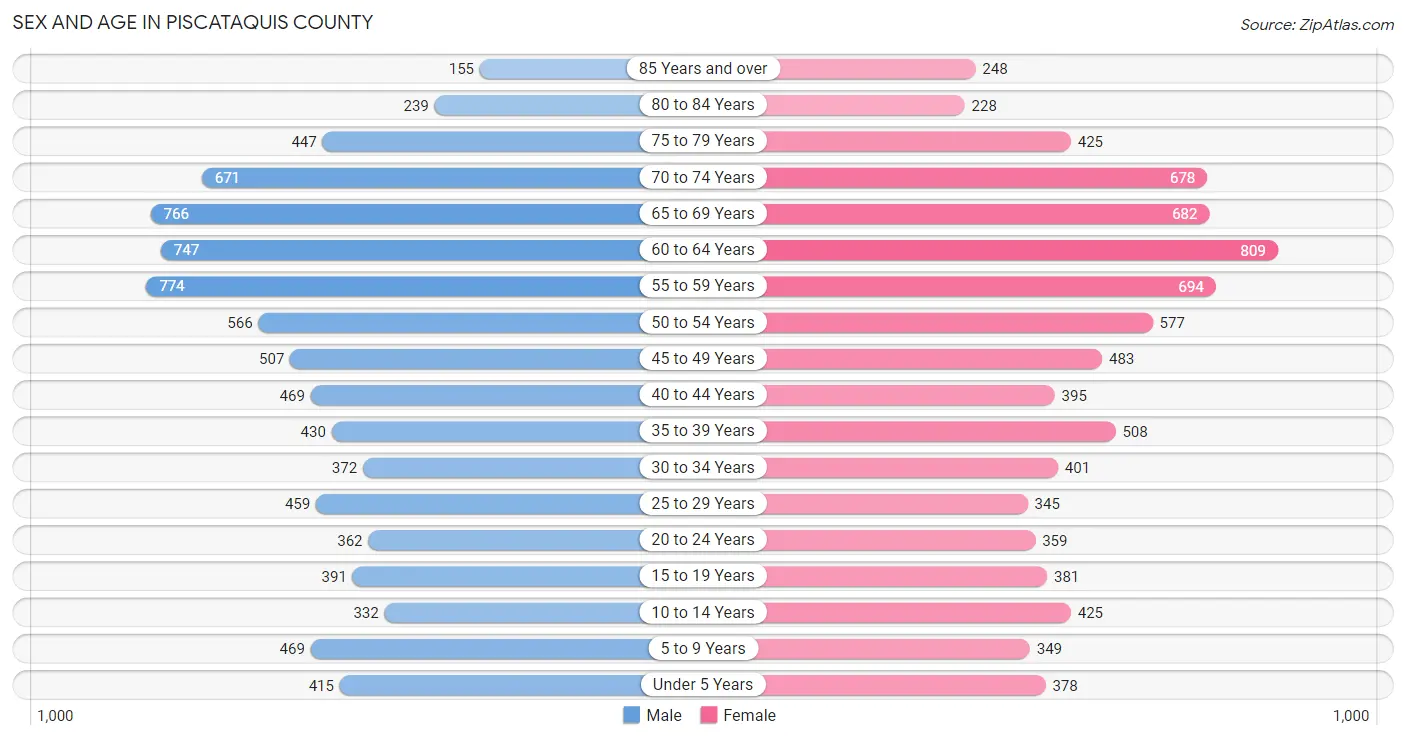
Sex and Age in Piscataquis County
Sex and Age in Piscataquis County
The most populous age groups in Piscataquis County are 55 to 59 Years (774 | 9.0%) for men and 60 to 64 Years (809 | 9.7%) for women.
| Age Bracket | Male | Female |
| Under 5 Years | 415 (4.8%) | 378 (4.5%) |
| 5 to 9 Years | 469 (5.5%) | 349 (4.2%) |
| 10 to 14 Years | 332 (3.9%) | 425 (5.1%) |
| 15 to 19 Years | 391 (4.6%) | 381 (4.5%) |
| 20 to 24 Years | 362 (4.2%) | 359 (4.3%) |
| 25 to 29 Years | 459 (5.4%) | 345 (4.1%) |
| 30 to 34 Years | 372 (4.3%) | 401 (4.8%) |
| 35 to 39 Years | 430 (5.0%) | 508 (6.1%) |
| 40 to 44 Years | 469 (5.5%) | 395 (4.7%) |
| 45 to 49 Years | 507 (5.9%) | 483 (5.8%) |
| 50 to 54 Years | 566 (6.6%) | 577 (6.9%) |
| 55 to 59 Years | 774 (9.0%) | 694 (8.3%) |
| 60 to 64 Years | 747 (8.7%) | 809 (9.7%) |
| 65 to 69 Years | 766 (8.9%) | 682 (8.2%) |
| 70 to 74 Years | 671 (7.8%) | 678 (8.1%) |
| 75 to 79 Years | 447 (5.2%) | 425 (5.1%) |
| 80 to 84 Years | 239 (2.8%) | 228 (2.7%) |
| 85 Years and over | 155 (1.8%) | 248 (3.0%) |
| Total | 8,571 (100.0%) | 8,365 (100.0%) |
Families and Households in Piscataquis County
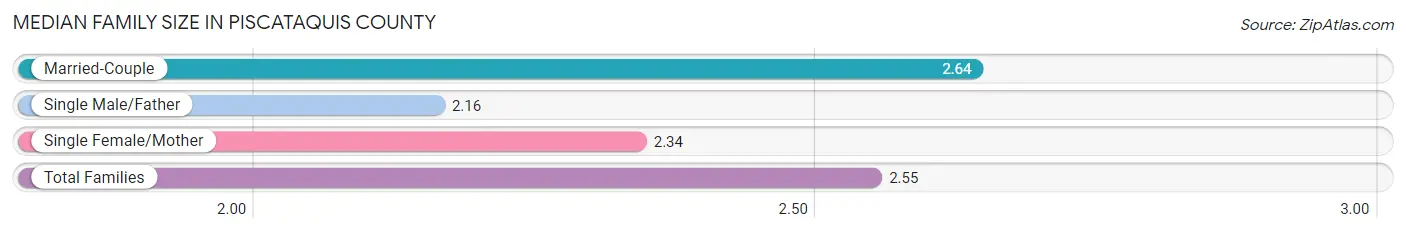
Median Family Size in Piscataquis County
The median family size in Piscataquis County is 2.55 persons per family, with married-couple families (3,674 | 75.0%) accounting for the largest median family size of 2.64 persons per family. On the other hand, single male/father families (308 | 6.3%) represent the smallest median family size with 2.16 persons per family.
| Family Type | # Families | Family Size |
| Married-Couple | 3,674 (75.0%) | 2.64 |
| Single Male/Father | 308 (6.3%) | 2.16 |
| Single Female/Mother | 915 (18.7%) | 2.34 |
| Total Families | 4,897 (100.0%) | 2.55 |
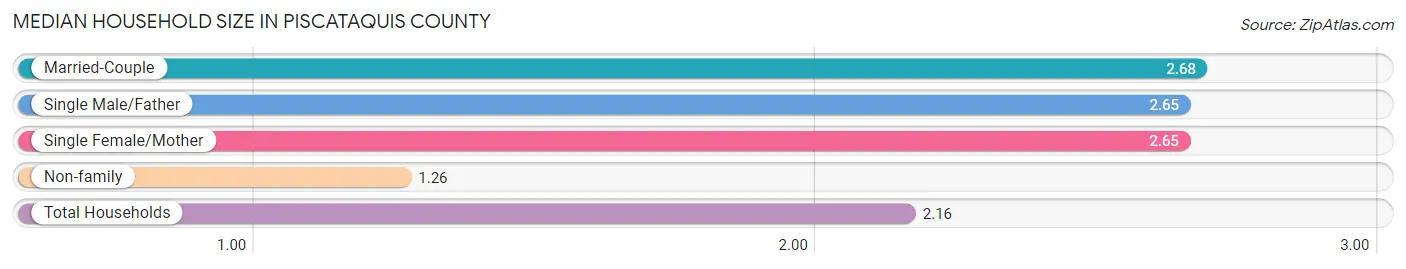
Median Household Size in Piscataquis County
The median household size in Piscataquis County is 2.16 persons per household, with married-couple households (3,674 | 48.0%) accounting for the largest median household size of 2.68 persons per household. non-family households (2,757 | 36.0%) represent the smallest median household size with 1.26 persons per household.
| Household Type | # Households | Household Size |
| Married-Couple | 3,674 (48.0%) | 2.68 |
| Single Male/Father | 308 (4.0%) | 2.65 |
| Single Female/Mother | 915 (11.9%) | 2.65 |
| Non-family | 2,757 (36.0%) | 1.26 |
| Total Households | 7,654 (100.0%) | 2.16 |
Household Size by Marriage Status in Piscataquis County
Out of a total of 7,654 households in Piscataquis County, 4,897 (64.0%) are family households, while 2,757 (36.0%) are nonfamily households. The most numerous type of family households are 2-person households, comprising 2,886, and the most common type of nonfamily households are 1-person households, comprising 2,160.
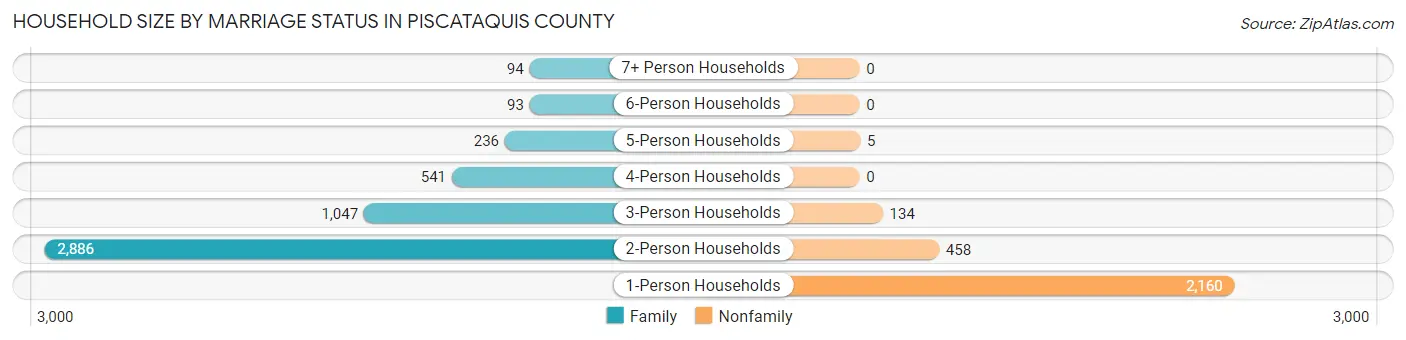
| Household Size | Family Households | Nonfamily Households |
| 1-Person Households | - | 2,160 (28.2%) |
| 2-Person Households | 2,886 (37.7%) | 458 (6.0%) |
| 3-Person Households | 1,047 (13.7%) | 134 (1.8%) |
| 4-Person Households | 541 (7.1%) | 0 (0.0%) |
| 5-Person Households | 236 (3.1%) | 5 (0.1%) |
| 6-Person Households | 93 (1.2%) | 0 (0.0%) |
| 7+ Person Households | 94 (1.2%) | 0 (0.0%) |
| Total | 4,897 (64.0%) | 2,757 (36.0%) |
Female Fertility in Piscataquis County
Fertility by Age in Piscataquis County
Average fertility rate in Piscataquis County is 66.0 births per 1,000 women. Women in the age bracket of 20 to 34 years have the highest fertility rate with 99.0 births per 1,000 women. Women in the age bracket of 20 to 34 years acount for 56.5% of all women with births.
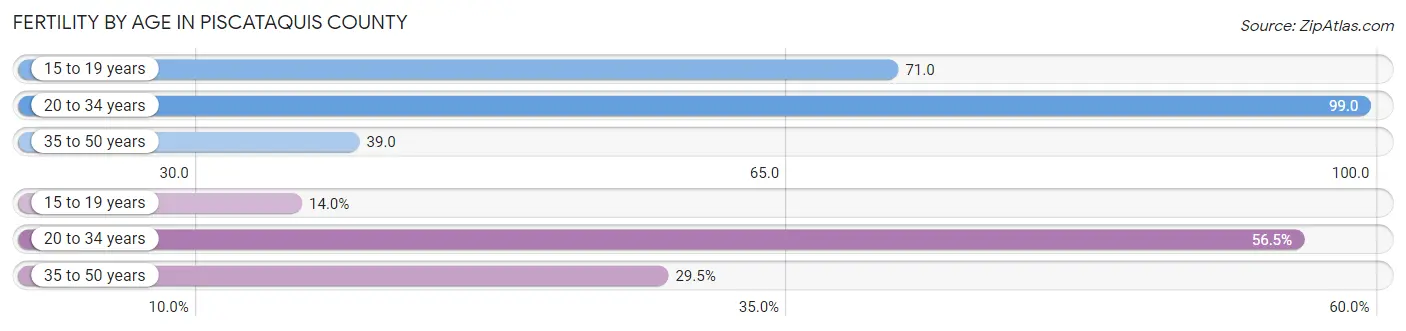
| Age Bracket | Women with Births | Births / 1,000 Women |
| 15 to 19 years | 27 (14.0%) | 71.0 |
| 20 to 34 years | 109 (56.5%) | 99.0 |
| 35 to 50 years | 57 (29.5%) | 39.0 |
| Total | 193 (100.0%) | 66.0 |
Fertility by Age by Marriage Status in Piscataquis County
60.1% of women with births (193) in Piscataquis County are married. The highest percentage of unmarried women with births falls into 15 to 19 years age bracket with 100.0% of them unmarried at the time of birth, while the lowest percentage of unmarried women with births belong to 20 to 34 years age bracket with 22.9% of them unmarried.
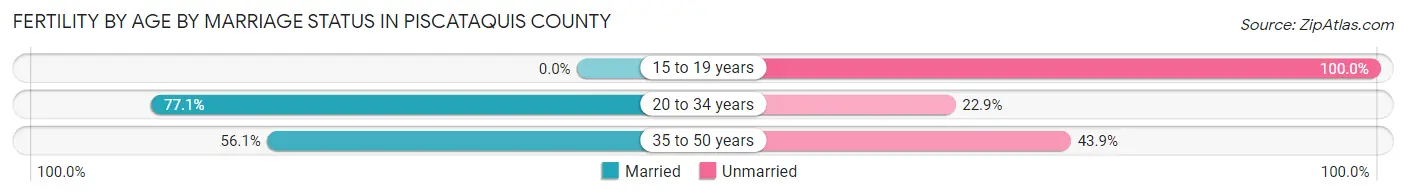
| Age Bracket | Married | Unmarried |
| 15 to 19 years | 0 (0.0%) | 27 (100.0%) |
| 20 to 34 years | 84 (77.1%) | 25 (22.9%) |
| 35 to 50 years | 32 (56.1%) | 25 (43.9%) |
| Total | 116 (60.1%) | 77 (39.9%) |
Fertility by Education in Piscataquis County
Average fertility rate in Piscataquis County is 66.0 births per 1,000 women. Women with the education attainment of less than high school have the highest fertility rate of 110.0 births per 1,000 women, while women with the education attainment of bachelor's degree have the lowest fertility at 11.0 births per 1,000 women. Women with the education attainment of college or associate's degree represent 50.8% of all women with births.
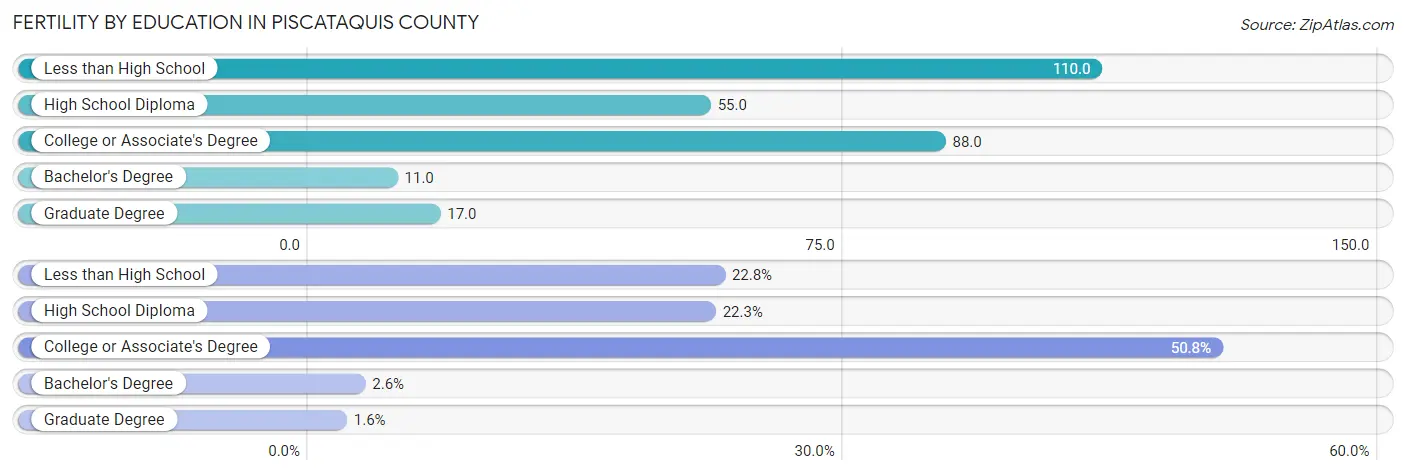
| Educational Attainment | Women with Births | Births / 1,000 Women |
| Less than High School | 44 (22.8%) | 110.0 |
| High School Diploma | 43 (22.3%) | 55.0 |
| College or Associate's Degree | 98 (50.8%) | 88.0 |
| Bachelor's Degree | 5 (2.6%) | 11.0 |
| Graduate Degree | 3 (1.5%) | 17.0 |
| Total | 193 (100.0%) | 66.0 |
Fertility by Education by Marriage Status in Piscataquis County
39.9% of women with births in Piscataquis County are unmarried. Women with the educational attainment of graduate degree are most likely to be married with 100.0% of them married at childbirth, while women with the educational attainment of less than high school are least likely to be married with 93.2% of them unmarried at childbirth.
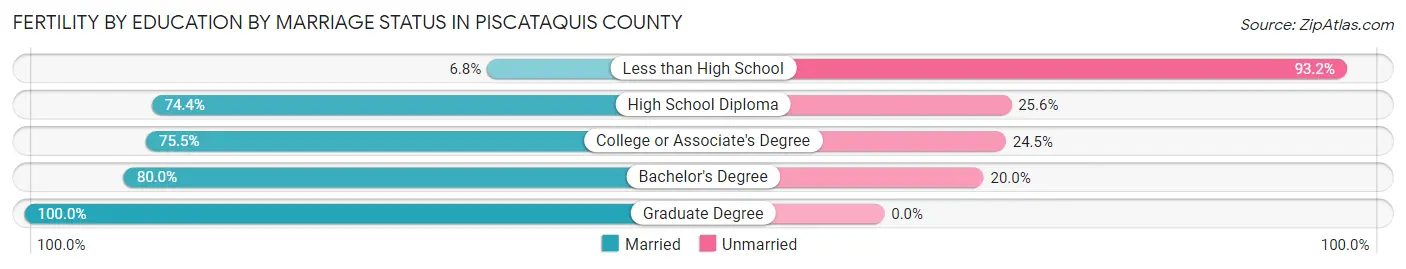
| Educational Attainment | Married | Unmarried |
| Less than High School | 3 (6.8%) | 41 (93.2%) |
| High School Diploma | 32 (74.4%) | 11 (25.6%) |
| College or Associate's Degree | 74 (75.5%) | 24 (24.5%) |
| Bachelor's Degree | 4 (80.0%) | 1 (20.0%) |
| Graduate Degree | 3 (100.0%) | 0 (0.0%) |
| Total | 116 (60.1%) | 77 (39.9%) |
Employment Characteristics in Piscataquis County
Employment by Class of Employer in Piscataquis County
Among the 6,957 employed individuals in Piscataquis County, private company employees (4,137 | 59.5%), not-for-profit organizations (730 | 10.5%), and self-employed (not incorporated) (573 | 8.2%) make up the most common classes of employment.
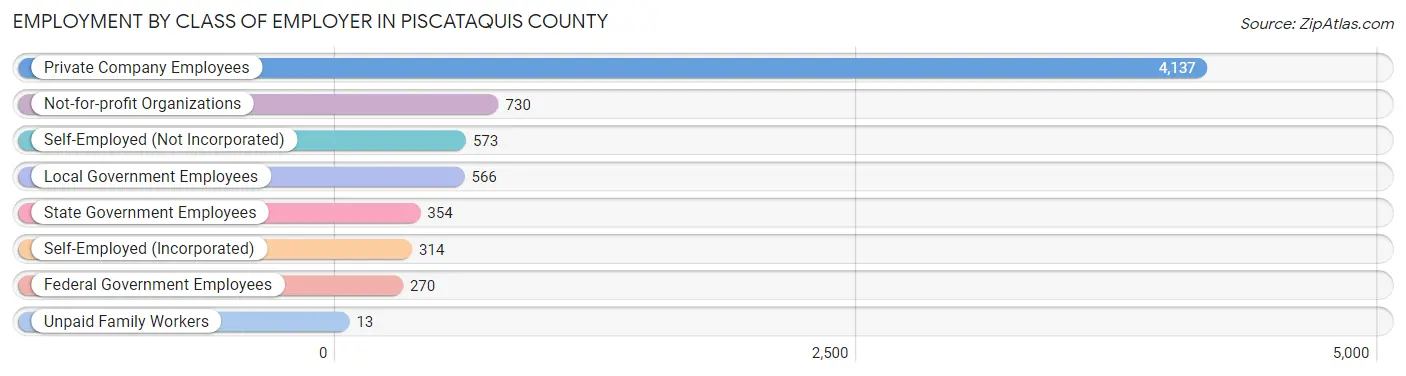
| Employer Class | # Employees | % Employees |
| Private Company Employees | 4,137 | 59.5% |
| Self-Employed (Incorporated) | 314 | 4.5% |
| Self-Employed (Not Incorporated) | 573 | 8.2% |
| Not-for-profit Organizations | 730 | 10.5% |
| Local Government Employees | 566 | 8.1% |
| State Government Employees | 354 | 5.1% |
| Federal Government Employees | 270 | 3.9% |
| Unpaid Family Workers | 13 | 0.2% |
| Total | 6,957 | 100.0% |
Employment Status by Age in Piscataquis County
According to the labor force statistics for Piscataquis County, out of the total population over 16 years of age (14,467), 52.1% or 7,537 individuals are in the labor force, with 4.9% or 369 of them unemployed. The age group with the highest labor force participation rate is 20 to 24 years, with 84.6% or 610 individuals in the labor force. Within the labor force, the 16 to 19 years age range has the highest percentage of unemployed individuals, with 18.6% or 46 of them being unemployed.
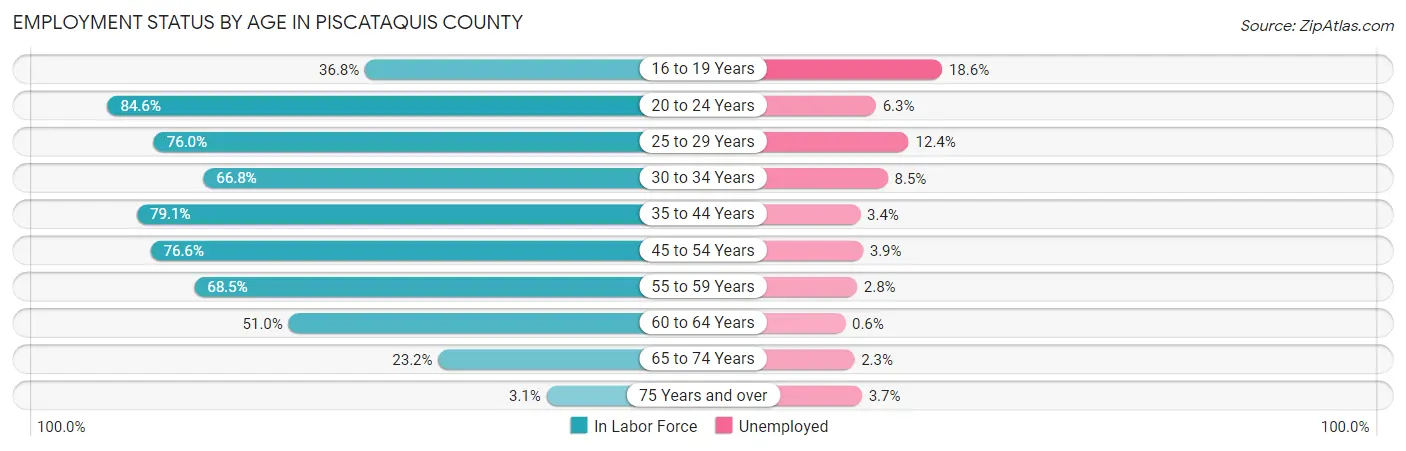
| Age Bracket | In Labor Force | Unemployed |
| 16 to 19 Years | 247 (36.8%) | 46 (18.6%) |
| 20 to 24 Years | 610 (84.6%) | 38 (6.3%) |
| 25 to 29 Years | 611 (76.0%) | 76 (12.4%) |
| 30 to 34 Years | 516 (66.8%) | 44 (8.5%) |
| 35 to 44 Years | 1,425 (79.1%) | 48 (3.4%) |
| 45 to 54 Years | 1,634 (76.6%) | 64 (3.9%) |
| 55 to 59 Years | 1,006 (68.5%) | 28 (2.8%) |
| 60 to 64 Years | 794 (51.0%) | 5 (0.6%) |
| 65 to 74 Years | 649 (23.2%) | 15 (2.3%) |
| 75 Years and over | 54 (3.1%) | 2 (3.7%) |
| Total | 7,537 (52.1%) | 369 (4.9%) |
Employment Status by Educational Attainment in Piscataquis County
According to labor force statistics for Piscataquis County, 70.1% of individuals (5,984) out of the total population between 25 and 64 years of age (8,536) are in the labor force, with 4.4% or 263 of them being unemployed. The group with the highest labor force participation rate are those with the educational attainment of bachelor's degree or higher, with 80.1% or 1,479 individuals in the labor force. Within the labor force, individuals with less than high school education have the highest percentage of unemployment, with 12.7% or 31 of them being unemployed.
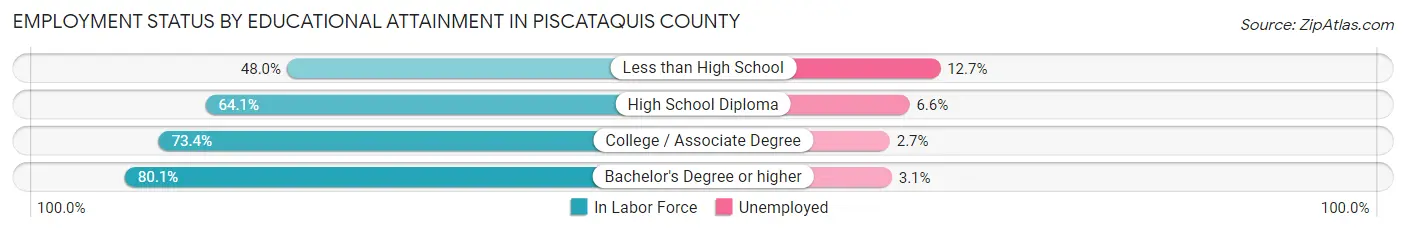
| Educational Attainment | In Labor Force | Unemployed |
| Less than High School | 244 (48.0%) | 65 (12.7%) |
| High School Diploma | 1,905 (64.1%) | 196 (6.6%) |
| College / Associate Degree | 2,356 (73.4%) | 87 (2.7%) |
| Bachelor's Degree or higher | 1,479 (80.1%) | 57 (3.1%) |
| Total | 5,984 (70.1%) | 376 (4.4%) |
Employment Occupations by Sex in Piscataquis County
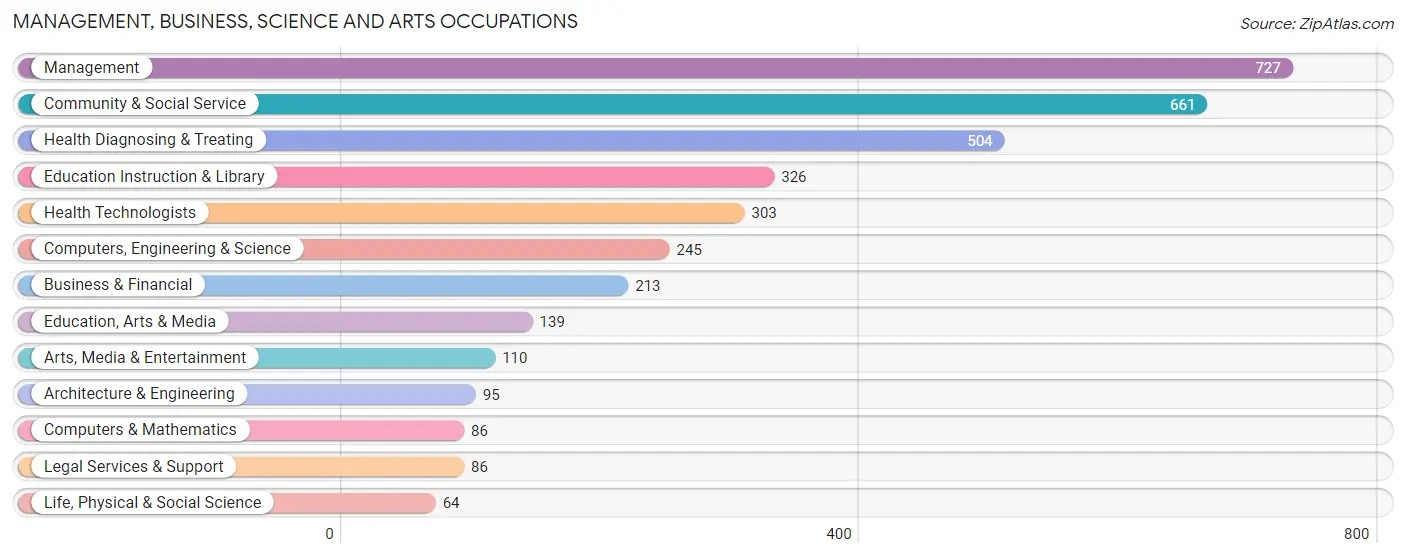
Management, Business, Science and Arts Occupations
The most common Management, Business, Science and Arts occupations in Piscataquis County are Management (727 | 10.2%), Community & Social Service (661 | 9.2%), Health Diagnosing & Treating (504 | 7.0%), Education Instruction & Library (326 | 4.6%), and Health Technologists (303 | 4.2%).
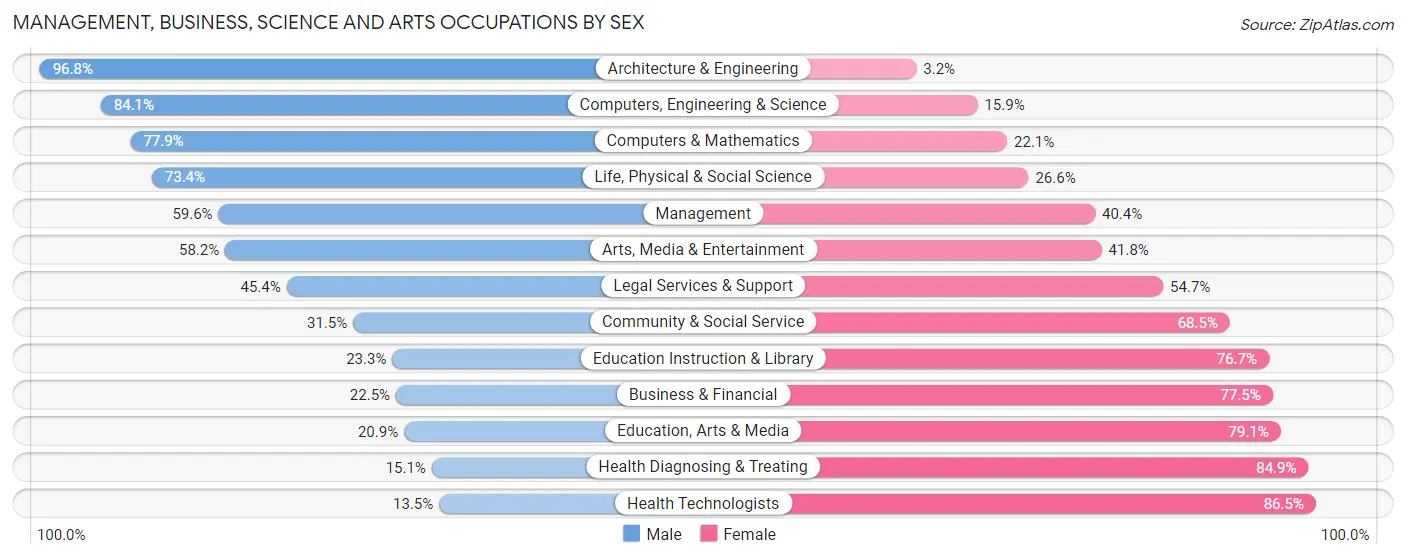
Management, Business, Science and Arts Occupations by Sex
Within the Management, Business, Science and Arts occupations in Piscataquis County, the most male-oriented occupations are Architecture & Engineering (96.8%), Computers, Engineering & Science (84.1%), and Computers & Mathematics (77.9%), while the most female-oriented occupations are Health Technologists (86.5%), Health Diagnosing & Treating (84.9%), and Education, Arts & Media (79.1%).
| Occupation | Male | Female |
| Management | 433 (59.6%) | 294 (40.4%) |
| Business & Financial | 48 (22.5%) | 165 (77.5%) |
| Computers, Engineering & Science | 206 (84.1%) | 39 (15.9%) |
| Computers & Mathematics | 67 (77.9%) | 19 (22.1%) |
| Architecture & Engineering | 92 (96.8%) | 3 (3.2%) |
| Life, Physical & Social Science | 47 (73.4%) | 17 (26.6%) |
| Community & Social Service | 208 (31.5%) | 453 (68.5%) |
| Education, Arts & Media | 29 (20.9%) | 110 (79.1%) |
| Legal Services & Support | 39 (45.4%) | 47 (54.6%) |
| Education Instruction & Library | 76 (23.3%) | 250 (76.7%) |
| Arts, Media & Entertainment | 64 (58.2%) | 46 (41.8%) |
| Health Diagnosing & Treating | 76 (15.1%) | 428 (84.9%) |
| Health Technologists | 41 (13.5%) | 262 (86.5%) |
| Total (Category) | 971 (41.3%) | 1,379 (58.7%) |
| Total (Overall) | 3,775 (52.8%) | 3,370 (47.2%) |
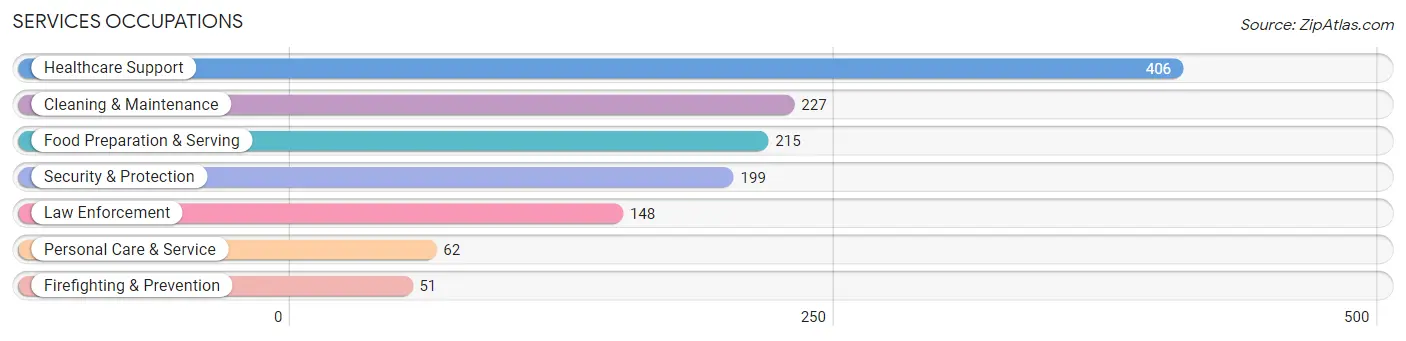
Services Occupations
The most common Services occupations in Piscataquis County are Healthcare Support (406 | 5.7%), Cleaning & Maintenance (227 | 3.2%), Food Preparation & Serving (215 | 3.0%), Security & Protection (199 | 2.8%), and Law Enforcement (148 | 2.1%).
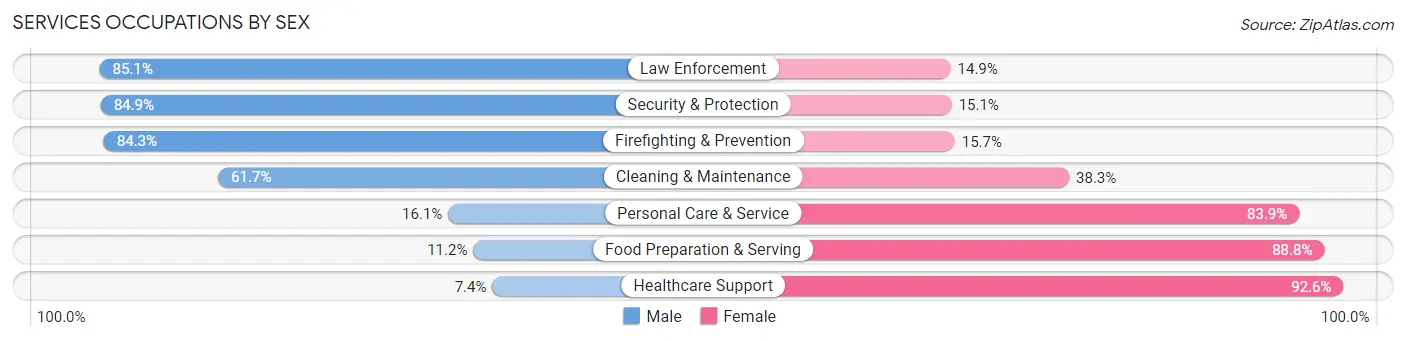
Services Occupations by Sex
Within the Services occupations in Piscataquis County, the most male-oriented occupations are Law Enforcement (85.1%), Security & Protection (84.9%), and Firefighting & Prevention (84.3%), while the most female-oriented occupations are Healthcare Support (92.6%), Food Preparation & Serving (88.8%), and Personal Care & Service (83.9%).
| Occupation | Male | Female |
| Healthcare Support | 30 (7.4%) | 376 (92.6%) |
| Security & Protection | 169 (84.9%) | 30 (15.1%) |
| Firefighting & Prevention | 43 (84.3%) | 8 (15.7%) |
| Law Enforcement | 126 (85.1%) | 22 (14.9%) |
| Food Preparation & Serving | 24 (11.2%) | 191 (88.8%) |
| Cleaning & Maintenance | 140 (61.7%) | 87 (38.3%) |
| Personal Care & Service | 10 (16.1%) | 52 (83.9%) |
| Total (Category) | 373 (33.6%) | 736 (66.4%) |
| Total (Overall) | 3,775 (52.8%) | 3,370 (47.2%) |
Sales and Office Occupations
The most common Sales and Office occupations in Piscataquis County are Office & Administration (689 | 9.6%), and Sales & Related (671 | 9.4%).
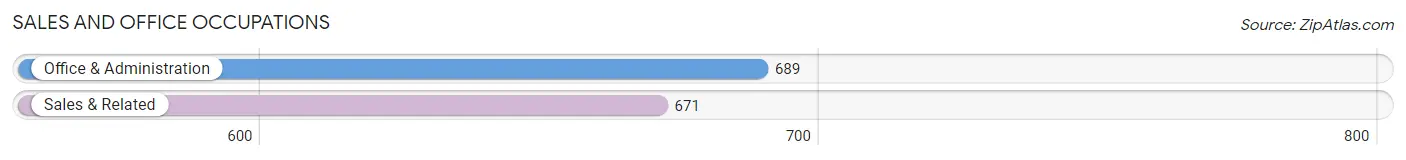
Sales and Office Occupations by Sex
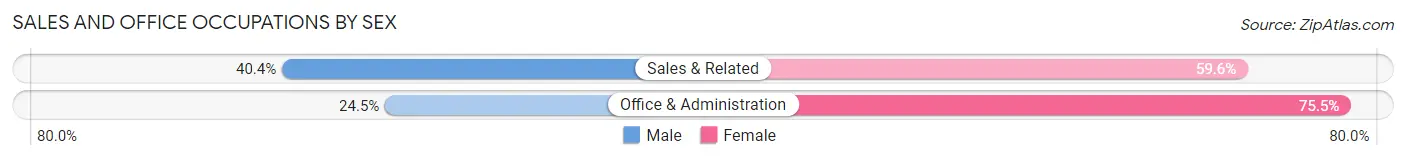
| Occupation | Male | Female |
| Sales & Related | 271 (40.4%) | 400 (59.6%) |
| Office & Administration | 169 (24.5%) | 520 (75.5%) |
| Total (Category) | 440 (32.4%) | 920 (67.6%) |
| Total (Overall) | 3,775 (52.8%) | 3,370 (47.2%) |
Natural Resources, Construction and Maintenance Occupations
The most common Natural Resources, Construction and Maintenance occupations in Piscataquis County are Construction & Extraction (439 | 6.1%), Installation, Maintenance & Repair (333 | 4.7%), and Farming, Fishing & Forestry (125 | 1.8%).
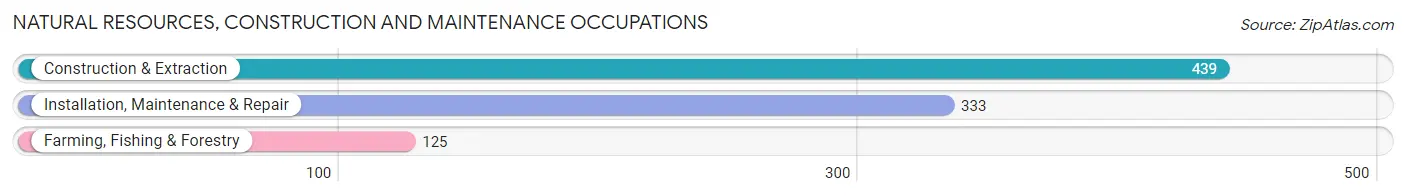
Natural Resources, Construction and Maintenance Occupations by Sex
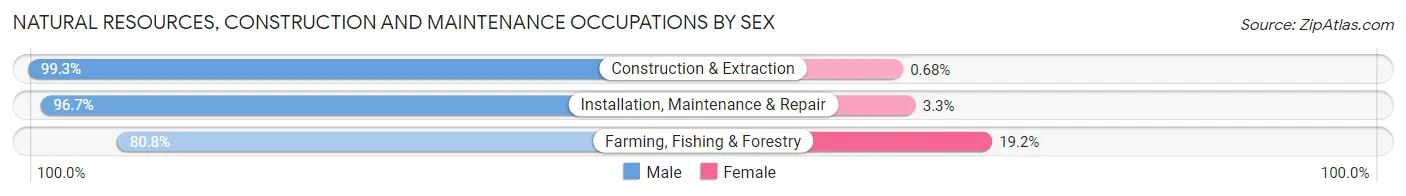
| Occupation | Male | Female |
| Farming, Fishing & Forestry | 101 (80.8%) | 24 (19.2%) |
| Construction & Extraction | 436 (99.3%) | 3 (0.7%) |
| Installation, Maintenance & Repair | 322 (96.7%) | 11 (3.3%) |
| Total (Category) | 859 (95.8%) | 38 (4.2%) |
| Total (Overall) | 3,775 (52.8%) | 3,370 (47.2%) |
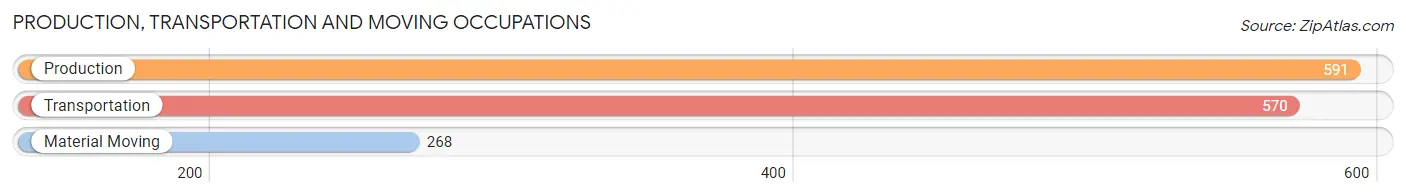
Production, Transportation and Moving Occupations
The most common Production, Transportation and Moving occupations in Piscataquis County are Production (591 | 8.3%), Transportation (570 | 8.0%), and Material Moving (268 | 3.7%).
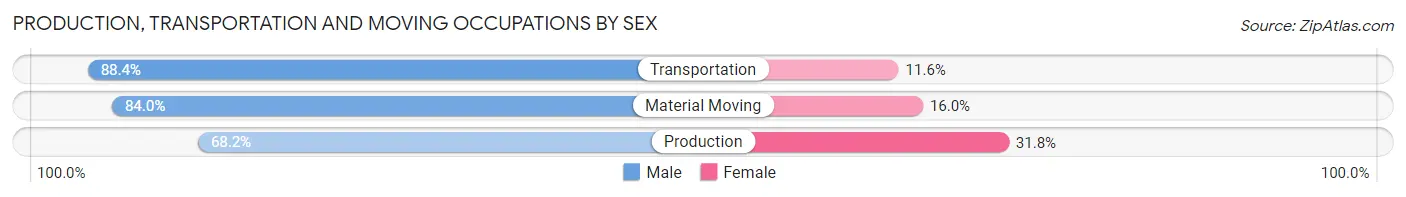
Production, Transportation and Moving Occupations by Sex
| Occupation | Male | Female |
| Production | 403 (68.2%) | 188 (31.8%) |
| Transportation | 504 (88.4%) | 66 (11.6%) |
| Material Moving | 225 (84.0%) | 43 (16.0%) |
| Total (Category) | 1,132 (79.2%) | 297 (20.8%) |
| Total (Overall) | 3,775 (52.8%) | 3,370 (47.2%) |
Employment Industries by Sex in Piscataquis County
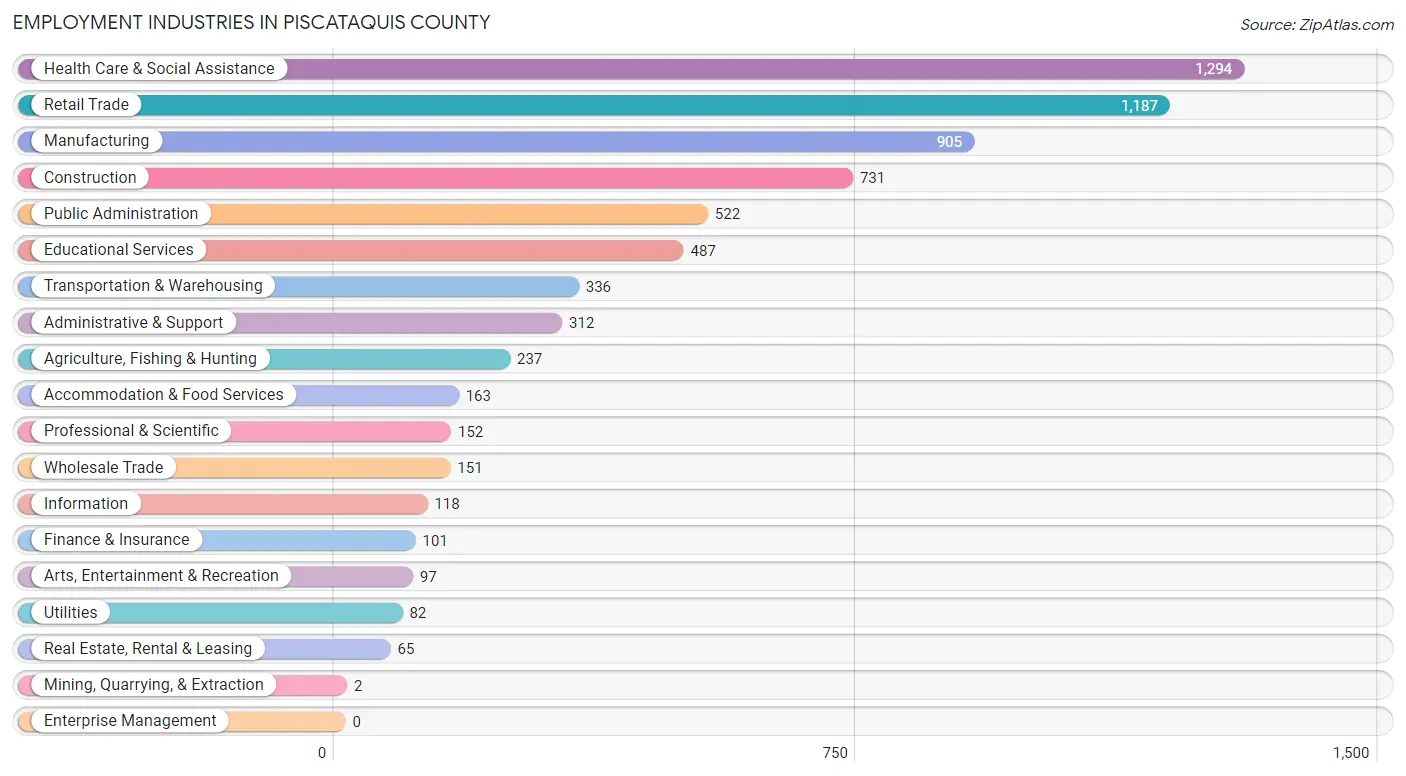
Employment Industries in Piscataquis County
The major employment industries in Piscataquis County include Health Care & Social Assistance (1,294 | 18.1%), Retail Trade (1,187 | 16.6%), Manufacturing (905 | 12.7%), Construction (731 | 10.2%), and Public Administration (522 | 7.3%).
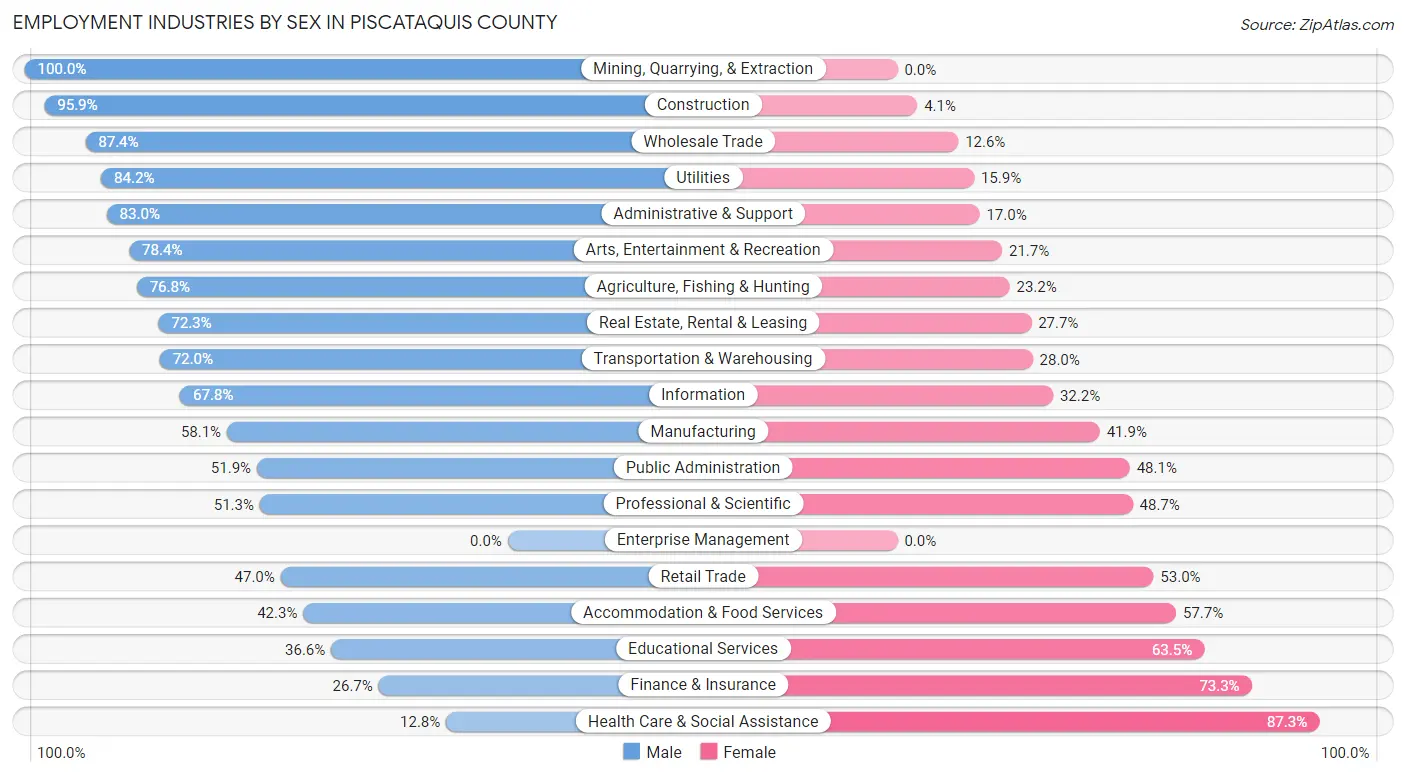
Employment Industries by Sex in Piscataquis County
The Piscataquis County industries that see more men than women are Mining, Quarrying, & Extraction (100.0%), Construction (95.9%), and Wholesale Trade (87.4%), whereas the industries that tend to have a higher number of women are Health Care & Social Assistance (87.3%), Finance & Insurance (73.3%), and Educational Services (63.4%).
| Industry | Male | Female |
| Agriculture, Fishing & Hunting | 182 (76.8%) | 55 (23.2%) |
| Mining, Quarrying, & Extraction | 2 (100.0%) | 0 (0.0%) |
| Construction | 701 (95.9%) | 30 (4.1%) |
| Manufacturing | 526 (58.1%) | 379 (41.9%) |
| Wholesale Trade | 132 (87.4%) | 19 (12.6%) |
| Retail Trade | 558 (47.0%) | 629 (53.0%) |
| Transportation & Warehousing | 242 (72.0%) | 94 (28.0%) |
| Utilities | 69 (84.2%) | 13 (15.9%) |
| Information | 80 (67.8%) | 38 (32.2%) |
| Finance & Insurance | 27 (26.7%) | 74 (73.3%) |
| Real Estate, Rental & Leasing | 47 (72.3%) | 18 (27.7%) |
| Professional & Scientific | 78 (51.3%) | 74 (48.7%) |
| Enterprise Management | 0 (0.0%) | 0 (0.0%) |
| Administrative & Support | 259 (83.0%) | 53 (17.0%) |
| Educational Services | 178 (36.5%) | 309 (63.4%) |
| Health Care & Social Assistance | 165 (12.8%) | 1,129 (87.3%) |
| Arts, Entertainment & Recreation | 76 (78.3%) | 21 (21.6%) |
| Accommodation & Food Services | 69 (42.3%) | 94 (57.7%) |
| Public Administration | 271 (51.9%) | 251 (48.1%) |
| Total | 3,775 (52.8%) | 3,370 (47.2%) |
Education in Piscataquis County
School Enrollment in Piscataquis County
The most common levels of schooling among the 2,719 students in Piscataquis County are high school (644 | 23.7%), elementary school (622 | 22.9%), and middle school (587 | 21.6%).
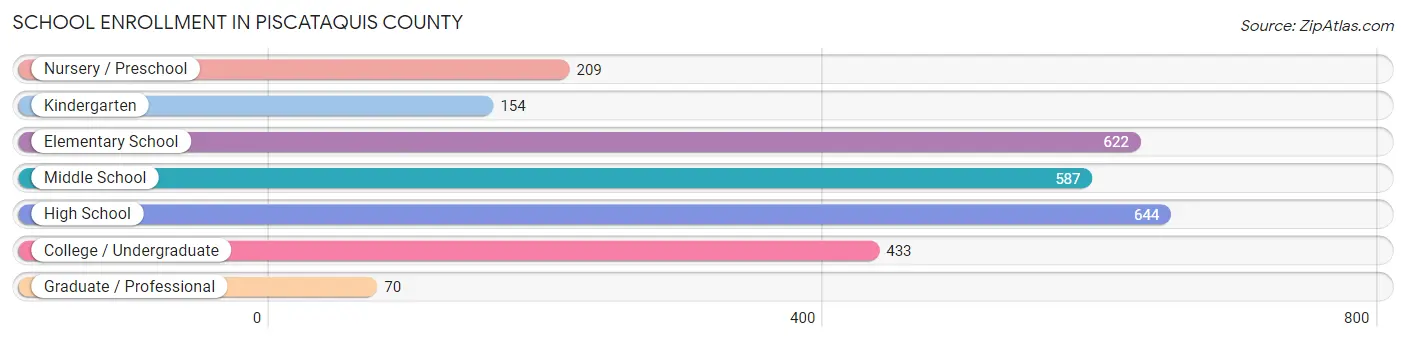
| School Level | # Students | % Students |
| Nursery / Preschool | 209 | 7.7% |
| Kindergarten | 154 | 5.7% |
| Elementary School | 622 | 22.9% |
| Middle School | 587 | 21.6% |
| High School | 644 | 23.7% |
| College / Undergraduate | 433 | 15.9% |
| Graduate / Professional | 70 | 2.6% |
| Total | 2,719 | 100.0% |
School Enrollment by Age by Funding Source in Piscataquis County
Out of a total of 2,719 students who are enrolled in schools in Piscataquis County, 631 (23.2%) attend a private institution, while the remaining 2,088 (76.8%) are enrolled in public schools. The age group of 25 to 34 year olds has the highest likelihood of being enrolled in private schools, with 37 (56.1% in the age bracket) enrolled. Conversely, the age group of 10 to 14 year olds has the lowest likelihood of being enrolled in a private school, with 646 (87.5% in the age bracket) attending a public institution.
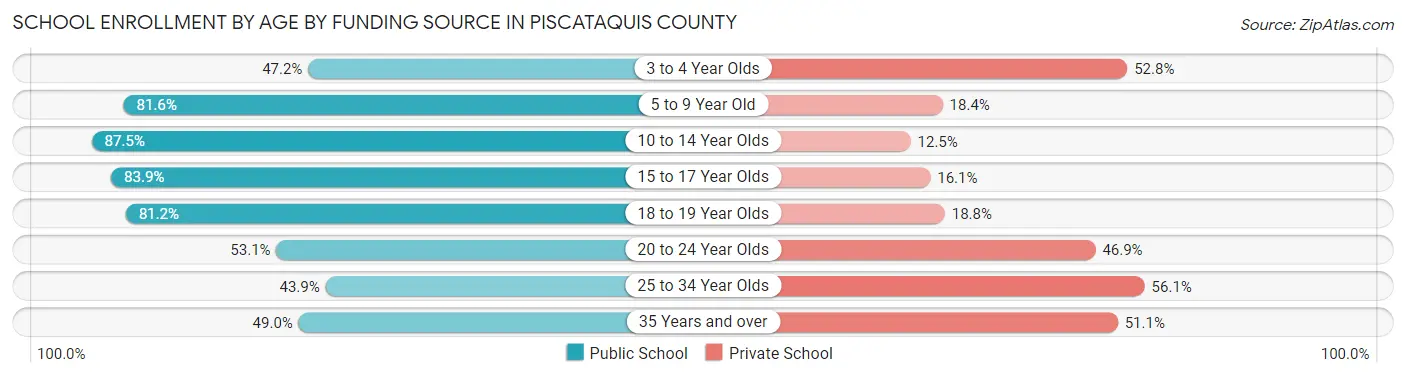
| Age Bracket | Public School | Private School |
| 3 to 4 Year Olds | 67 (47.2%) | 75 (52.8%) |
| 5 to 9 Year Old | 628 (81.6%) | 142 (18.4%) |
| 10 to 14 Year Olds | 646 (87.5%) | 92 (12.5%) |
| 15 to 17 Year Olds | 416 (83.9%) | 80 (16.1%) |
| 18 to 19 Year Olds | 112 (81.2%) | 26 (18.8%) |
| 20 to 24 Year Olds | 120 (53.1%) | 106 (46.9%) |
| 25 to 34 Year Olds | 29 (43.9%) | 37 (56.1%) |
| 35 Years and over | 70 (48.9%) | 73 (51.0%) |
| Total | 2,088 (76.8%) | 631 (23.2%) |
Educational Attainment by Field of Study in Piscataquis County
Business (516 | 17.4%), education (458 | 15.4%), science & technology (399 | 13.5%), bio, nature & agricultural (278 | 9.4%), and arts & humanities (265 | 8.9%) are the most common fields of study among 2,966 individuals in Piscataquis County who have obtained a bachelor's degree or higher.
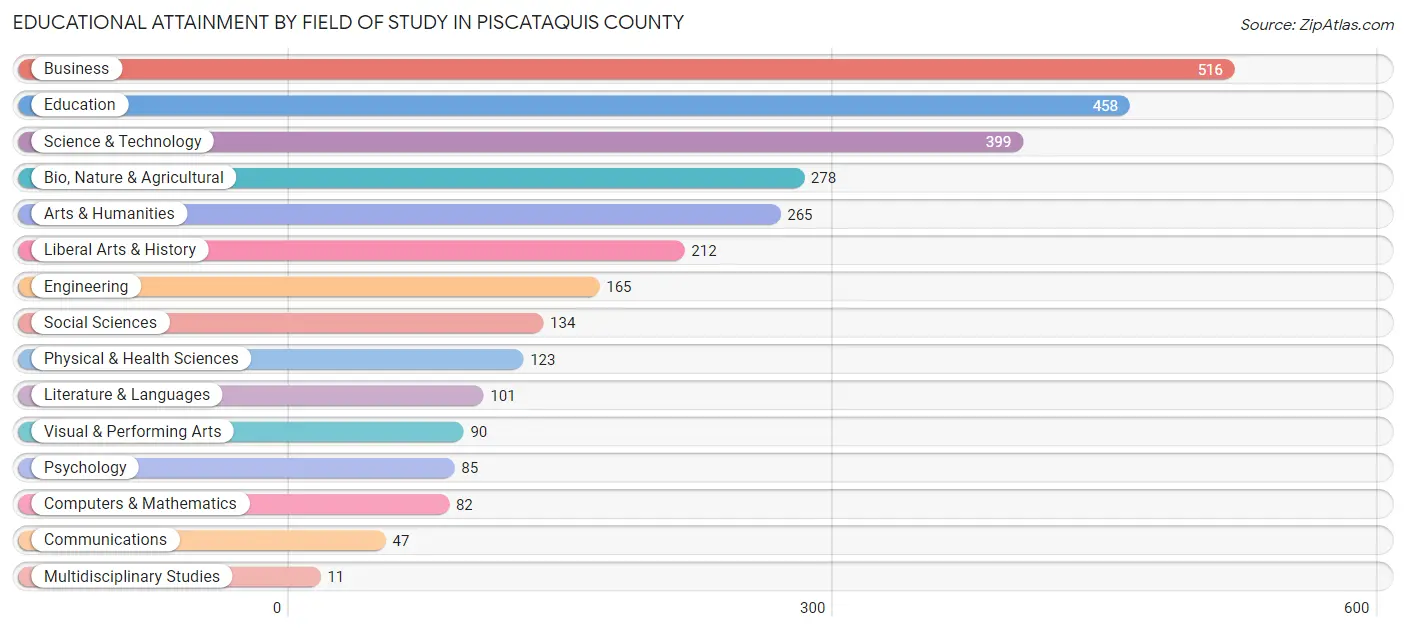
| Field of Study | # Graduates | % Graduates |
| Computers & Mathematics | 82 | 2.8% |
| Bio, Nature & Agricultural | 278 | 9.4% |
| Physical & Health Sciences | 123 | 4.2% |
| Psychology | 85 | 2.9% |
| Social Sciences | 134 | 4.5% |
| Engineering | 165 | 5.6% |
| Multidisciplinary Studies | 11 | 0.4% |
| Science & Technology | 399 | 13.5% |
| Business | 516 | 17.4% |
| Education | 458 | 15.4% |
| Literature & Languages | 101 | 3.4% |
| Liberal Arts & History | 212 | 7.1% |
| Visual & Performing Arts | 90 | 3.0% |
| Communications | 47 | 1.6% |
| Arts & Humanities | 265 | 8.9% |
| Total | 2,966 | 100.0% |
Transportation & Commute in Piscataquis County
Vehicle Availability by Sex in Piscataquis County
The most prevalent vehicle ownership categories in Piscataquis County are males with 2 vehicles (1,650, accounting for 45.4%) and females with 2 vehicles (1,187, making up 50.9%).
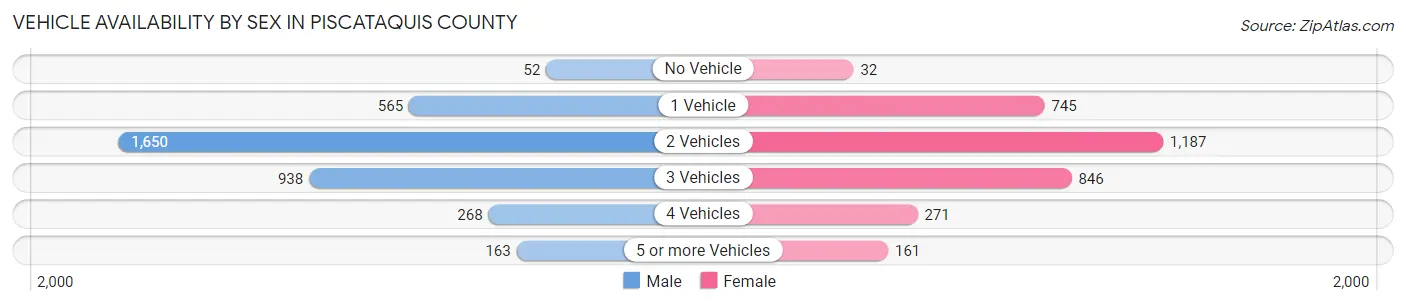
| Vehicles Available | Male | Female |
| No Vehicle | 52 (1.4%) | 32 (1.0%) |
| 1 Vehicle | 565 (15.5%) | 745 (23.0%) |
| 2 Vehicles | 1,650 (45.4%) | 1,187 (36.6%) |
| 3 Vehicles | 938 (25.8%) | 846 (26.1%) |
| 4 Vehicles | 268 (7.4%) | 271 (8.4%) |
| 5 or more Vehicles | 163 (4.5%) | 161 (5.0%) |
| Total | 3,636 (100.0%) | 3,242 (100.0%) |
Commute Time in Piscataquis County
The most frequently occuring commute durations in Piscataquis County are 5 to 9 minutes (1,339 commuters, 20.8%), 10 to 14 minutes (865 commuters, 13.5%), and 60 to 89 minutes (676 commuters, 10.5%).
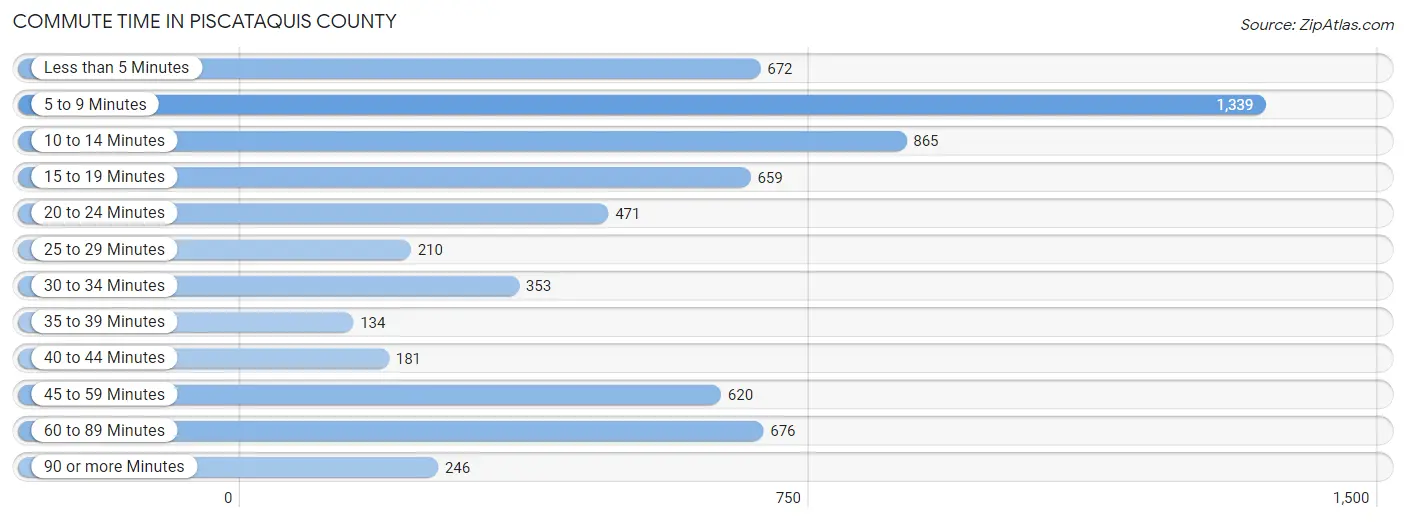
| Commute Time | # Commuters | % Commuters |
| Less than 5 Minutes | 672 | 10.5% |
| 5 to 9 Minutes | 1,339 | 20.8% |
| 10 to 14 Minutes | 865 | 13.5% |
| 15 to 19 Minutes | 659 | 10.3% |
| 20 to 24 Minutes | 471 | 7.3% |
| 25 to 29 Minutes | 210 | 3.3% |
| 30 to 34 Minutes | 353 | 5.5% |
| 35 to 39 Minutes | 134 | 2.1% |
| 40 to 44 Minutes | 181 | 2.8% |
| 45 to 59 Minutes | 620 | 9.7% |
| 60 to 89 Minutes | 676 | 10.5% |
| 90 or more Minutes | 246 | 3.8% |
Commute Time by Sex in Piscataquis County
The most common commute times in Piscataquis County are 5 to 9 minutes (699 commuters, 20.9%) for males and 5 to 9 minutes (640 commuters, 20.8%) for females.
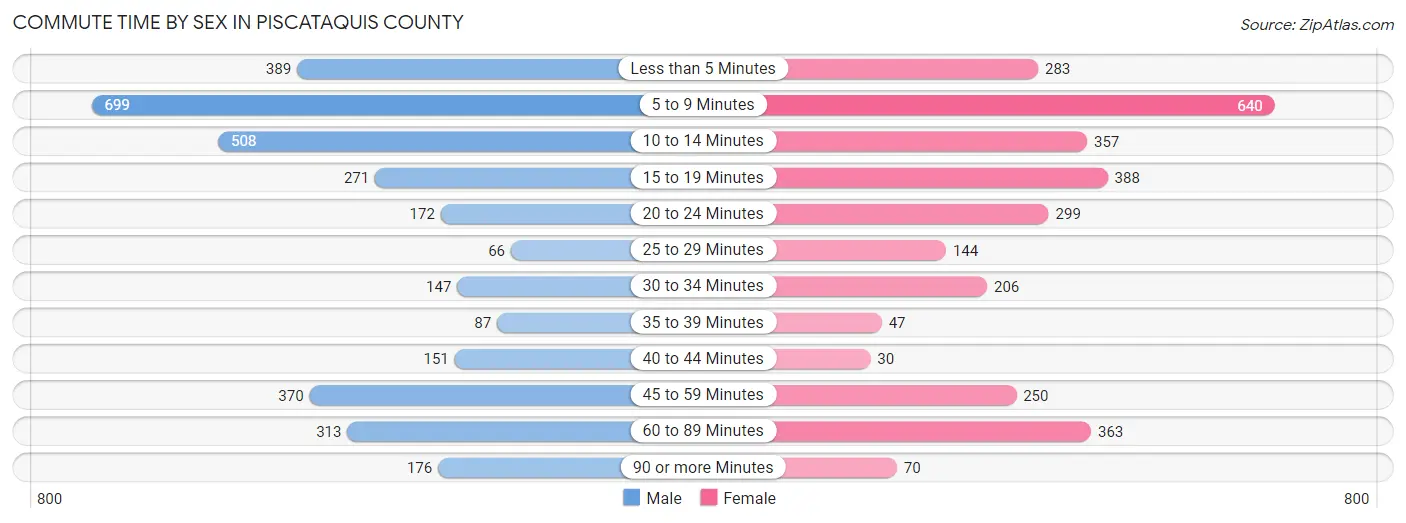
| Commute Time | Male | Female |
| Less than 5 Minutes | 389 (11.6%) | 283 (9.2%) |
| 5 to 9 Minutes | 699 (20.9%) | 640 (20.8%) |
| 10 to 14 Minutes | 508 (15.2%) | 357 (11.6%) |
| 15 to 19 Minutes | 271 (8.1%) | 388 (12.6%) |
| 20 to 24 Minutes | 172 (5.1%) | 299 (9.7%) |
| 25 to 29 Minutes | 66 (2.0%) | 144 (4.7%) |
| 30 to 34 Minutes | 147 (4.4%) | 206 (6.7%) |
| 35 to 39 Minutes | 87 (2.6%) | 47 (1.5%) |
| 40 to 44 Minutes | 151 (4.5%) | 30 (1.0%) |
| 45 to 59 Minutes | 370 (11.1%) | 250 (8.1%) |
| 60 to 89 Minutes | 313 (9.3%) | 363 (11.8%) |
| 90 or more Minutes | 176 (5.3%) | 70 (2.3%) |
Time of Departure to Work by Sex in Piscataquis County
The most frequent times of departure to work in Piscataquis County are 6:00 AM to 6:29 AM (601, 17.9%) for males and 7:00 AM to 7:29 AM (450, 14.6%) for females.
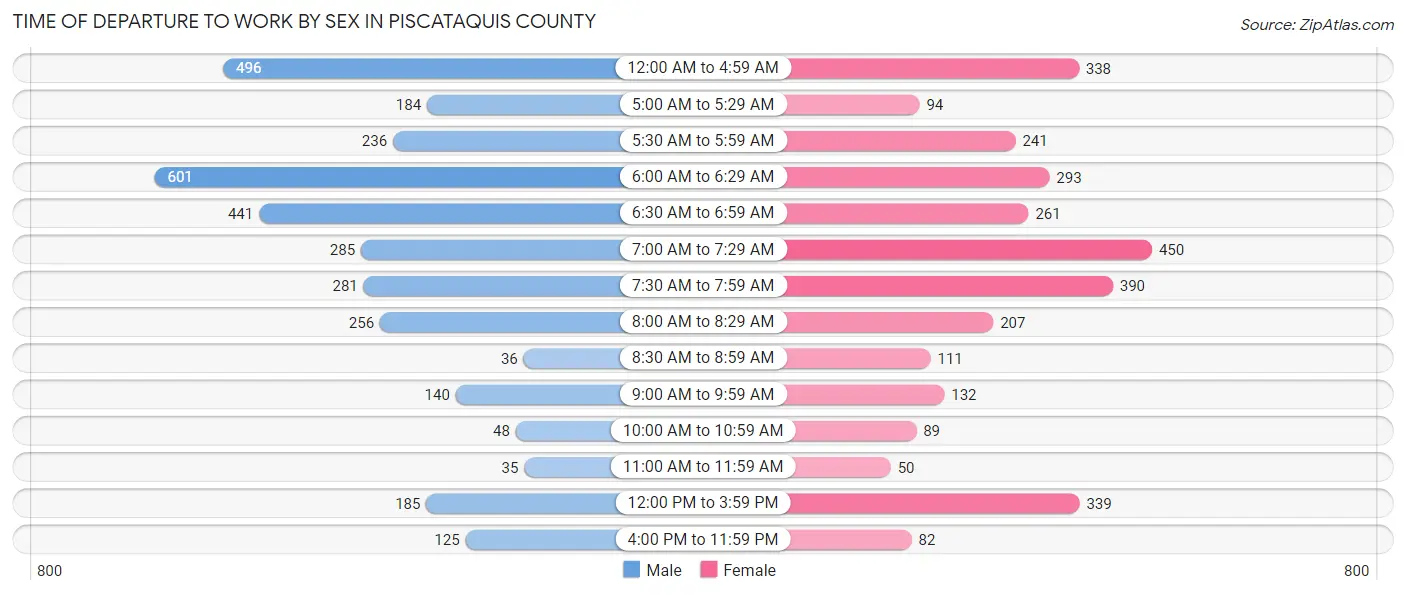
| Time of Departure | Male | Female |
| 12:00 AM to 4:59 AM | 496 (14.8%) | 338 (11.0%) |
| 5:00 AM to 5:29 AM | 184 (5.5%) | 94 (3.0%) |
| 5:30 AM to 5:59 AM | 236 (7.0%) | 241 (7.8%) |
| 6:00 AM to 6:29 AM | 601 (17.9%) | 293 (9.5%) |
| 6:30 AM to 6:59 AM | 441 (13.2%) | 261 (8.5%) |
| 7:00 AM to 7:29 AM | 285 (8.5%) | 450 (14.6%) |
| 7:30 AM to 7:59 AM | 281 (8.4%) | 390 (12.7%) |
| 8:00 AM to 8:29 AM | 256 (7.6%) | 207 (6.7%) |
| 8:30 AM to 8:59 AM | 36 (1.1%) | 111 (3.6%) |
| 9:00 AM to 9:59 AM | 140 (4.2%) | 132 (4.3%) |
| 10:00 AM to 10:59 AM | 48 (1.4%) | 89 (2.9%) |
| 11:00 AM to 11:59 AM | 35 (1.1%) | 50 (1.6%) |
| 12:00 PM to 3:59 PM | 185 (5.5%) | 339 (11.0%) |
| 4:00 PM to 11:59 PM | 125 (3.7%) | 82 (2.7%) |
| Total | 3,349 (100.0%) | 3,077 (100.0%) |
Housing Occupancy in Piscataquis County
Occupancy by Ownership in Piscataquis County
Of the total 7,654 dwellings in Piscataquis County, owner-occupied units account for 5,909 (77.2%), while renter-occupied units make up 1,745 (22.8%).
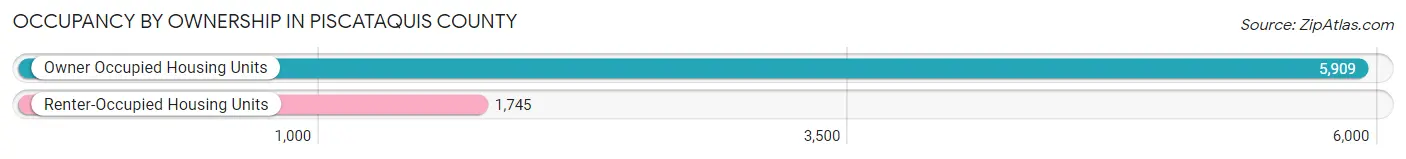
| Occupancy | # Housing Units | % Housing Units |
| Owner Occupied Housing Units | 5,909 | 77.2% |
| Renter-Occupied Housing Units | 1,745 | 22.8% |
| Total Occupied Housing Units | 7,654 | 100.0% |
Occupancy by Household Size in Piscataquis County
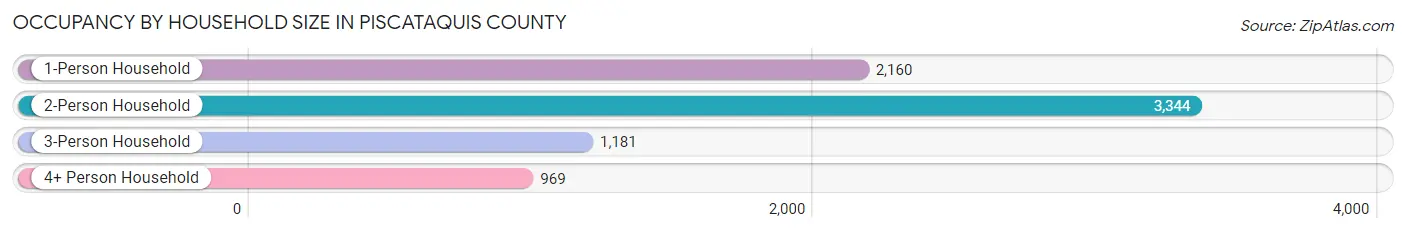
| Household Size | # Housing Units | % Housing Units |
| 1-Person Household | 2,160 | 28.2% |
| 2-Person Household | 3,344 | 43.7% |
| 3-Person Household | 1,181 | 15.4% |
| 4+ Person Household | 969 | 12.7% |
| Total Housing Units | 7,654 | 100.0% |
Occupancy by Ownership by Household Size in Piscataquis County
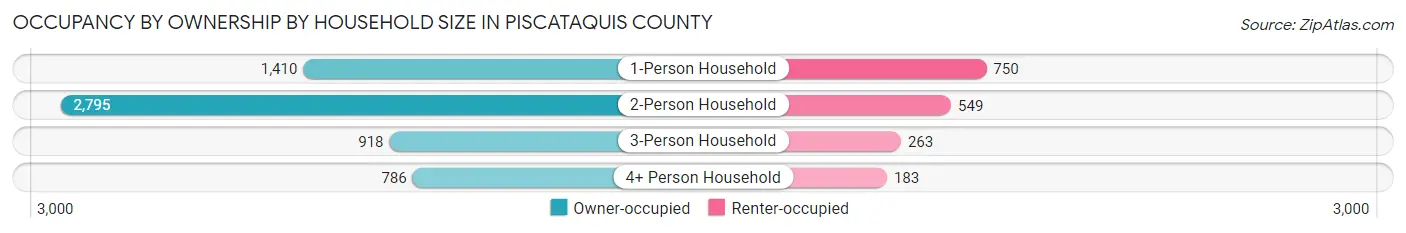
| Household Size | Owner-occupied | Renter-occupied |
| 1-Person Household | 1,410 (65.3%) | 750 (34.7%) |
| 2-Person Household | 2,795 (83.6%) | 549 (16.4%) |
| 3-Person Household | 918 (77.7%) | 263 (22.3%) |
| 4+ Person Household | 786 (81.1%) | 183 (18.9%) |
| Total Housing Units | 5,909 (77.2%) | 1,745 (22.8%) |
Occupancy by Educational Attainment in Piscataquis County
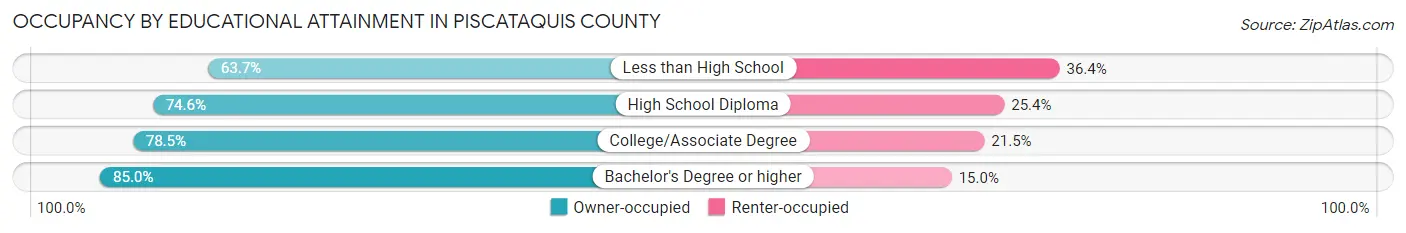
| Household Size | Owner-occupied | Renter-occupied |
| Less than High School | 408 (63.6%) | 233 (36.3%) |
| High School Diploma | 2,093 (74.6%) | 713 (25.4%) |
| College/Associate Degree | 2,046 (78.5%) | 559 (21.5%) |
| Bachelor's Degree or higher | 1,362 (85.0%) | 240 (15.0%) |
Occupancy by Age of Householder in Piscataquis County
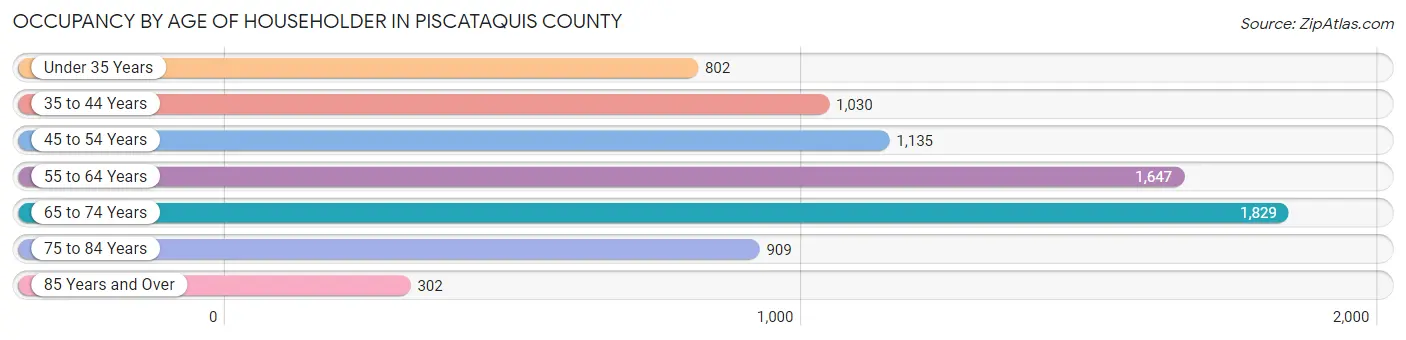
| Age Bracket | # Households | % Households |
| Under 35 Years | 802 | 10.5% |
| 35 to 44 Years | 1,030 | 13.5% |
| 45 to 54 Years | 1,135 | 14.8% |
| 55 to 64 Years | 1,647 | 21.5% |
| 65 to 74 Years | 1,829 | 23.9% |
| 75 to 84 Years | 909 | 11.9% |
| 85 Years and Over | 302 | 4.0% |
| Total | 7,654 | 100.0% |
Housing Finances in Piscataquis County
Median Income by Occupancy in Piscataquis County
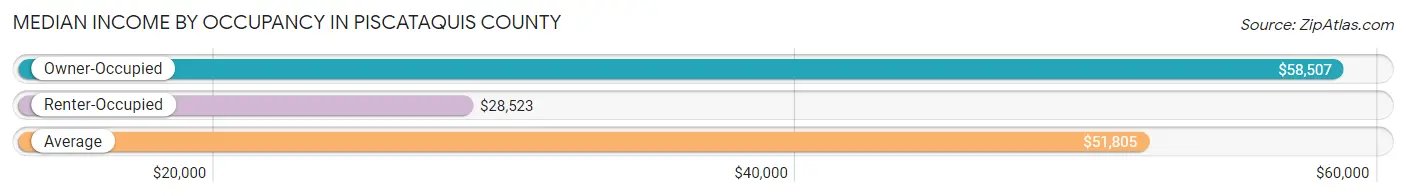
| Occupancy Type | # Households | Median Income |
| Owner-Occupied | 5,909 (77.2%) | $58,507 |
| Renter-Occupied | 1,745 (22.8%) | $28,523 |
| Average | 7,654 (100.0%) | $51,805 |
Occupancy by Householder Income Bracket in Piscataquis County
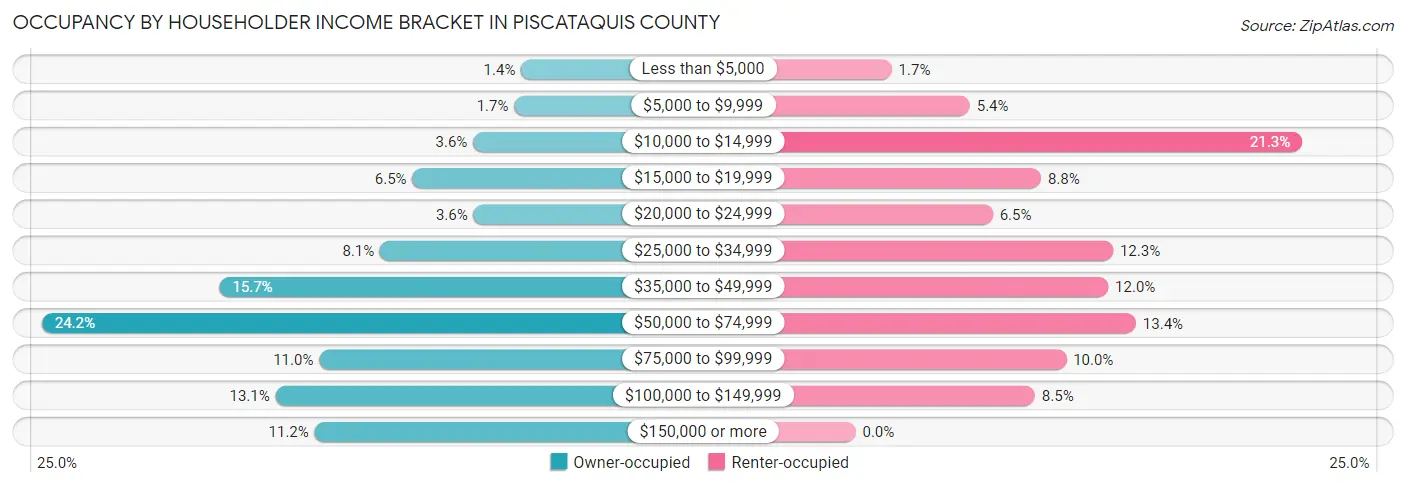
| Income Bracket | Owner-occupied | Renter-occupied |
| Less than $5,000 | 80 (1.3%) | 30 (1.7%) |
| $5,000 to $9,999 | 99 (1.7%) | 95 (5.4%) |
| $10,000 to $14,999 | 215 (3.6%) | 371 (21.3%) |
| $15,000 to $19,999 | 386 (6.5%) | 154 (8.8%) |
| $20,000 to $24,999 | 214 (3.6%) | 114 (6.5%) |
| $25,000 to $34,999 | 477 (8.1%) | 214 (12.3%) |
| $35,000 to $49,999 | 929 (15.7%) | 210 (12.0%) |
| $50,000 to $74,999 | 1,429 (24.2%) | 233 (13.4%) |
| $75,000 to $99,999 | 648 (11.0%) | 175 (10.0%) |
| $100,000 to $149,999 | 771 (13.1%) | 149 (8.5%) |
| $150,000 or more | 661 (11.2%) | 0 (0.0%) |
| Total | 5,909 (100.0%) | 1,745 (100.0%) |
Monthly Housing Cost Tiers in Piscataquis County
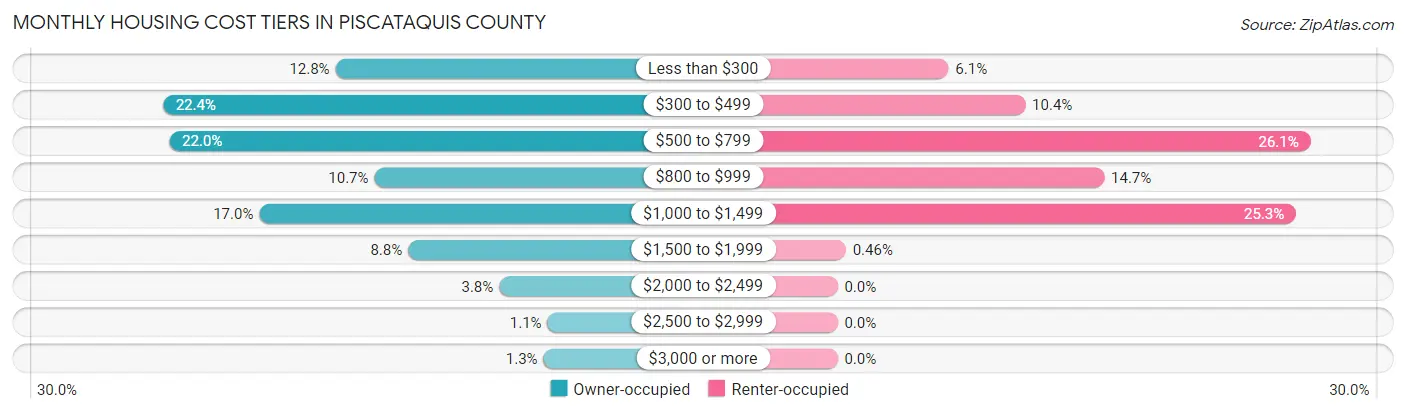
| Monthly Cost | Owner-occupied | Renter-occupied |
| Less than $300 | 758 (12.8%) | 107 (6.1%) |
| $300 to $499 | 1,322 (22.4%) | 181 (10.4%) |
| $500 to $799 | 1,301 (22.0%) | 456 (26.1%) |
| $800 to $999 | 631 (10.7%) | 257 (14.7%) |
| $1,000 to $1,499 | 1,007 (17.0%) | 442 (25.3%) |
| $1,500 to $1,999 | 521 (8.8%) | 8 (0.5%) |
| $2,000 to $2,499 | 224 (3.8%) | 0 (0.0%) |
| $2,500 to $2,999 | 66 (1.1%) | 0 (0.0%) |
| $3,000 or more | 79 (1.3%) | 0 (0.0%) |
| Total | 5,909 (100.0%) | 1,745 (100.0%) |
Physical Housing Characteristics in Piscataquis County
Housing Structures in Piscataquis County
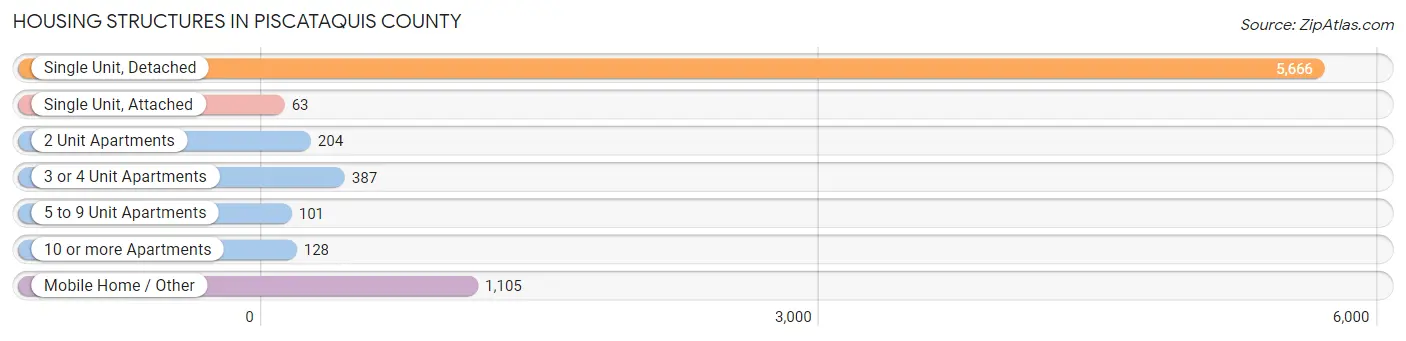
| Structure Type | # Housing Units | % Housing Units |
| Single Unit, Detached | 5,666 | 74.0% |
| Single Unit, Attached | 63 | 0.8% |
| 2 Unit Apartments | 204 | 2.7% |
| 3 or 4 Unit Apartments | 387 | 5.1% |
| 5 to 9 Unit Apartments | 101 | 1.3% |
| 10 or more Apartments | 128 | 1.7% |
| Mobile Home / Other | 1,105 | 14.4% |
| Total | 7,654 | 100.0% |
Housing Structures by Occupancy in Piscataquis County
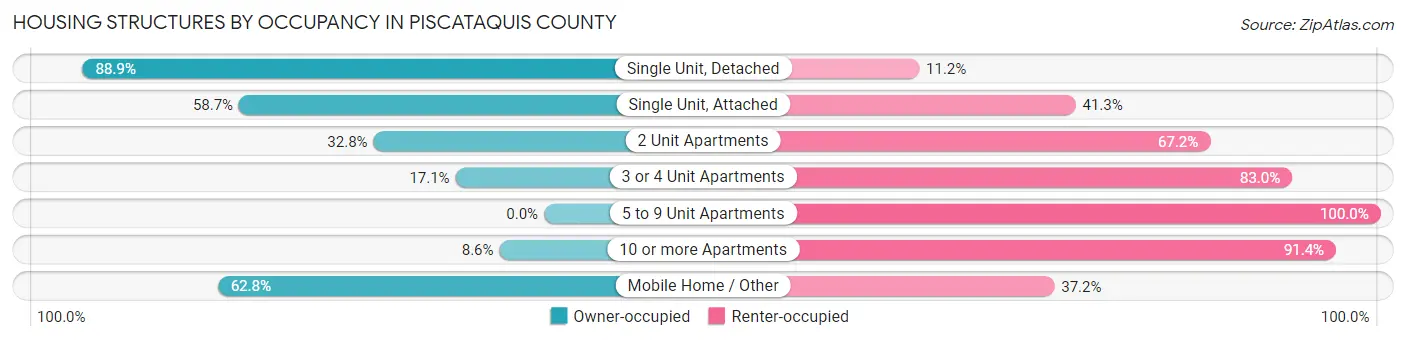
| Structure Type | Owner-occupied | Renter-occupied |
| Single Unit, Detached | 5,034 (88.8%) | 632 (11.2%) |
| Single Unit, Attached | 37 (58.7%) | 26 (41.3%) |
| 2 Unit Apartments | 67 (32.8%) | 137 (67.2%) |
| 3 or 4 Unit Apartments | 66 (17.1%) | 321 (83.0%) |
| 5 to 9 Unit Apartments | 0 (0.0%) | 101 (100.0%) |
| 10 or more Apartments | 11 (8.6%) | 117 (91.4%) |
| Mobile Home / Other | 694 (62.8%) | 411 (37.2%) |
| Total | 5,909 (77.2%) | 1,745 (22.8%) |
Housing Structures by Number of Rooms in Piscataquis County
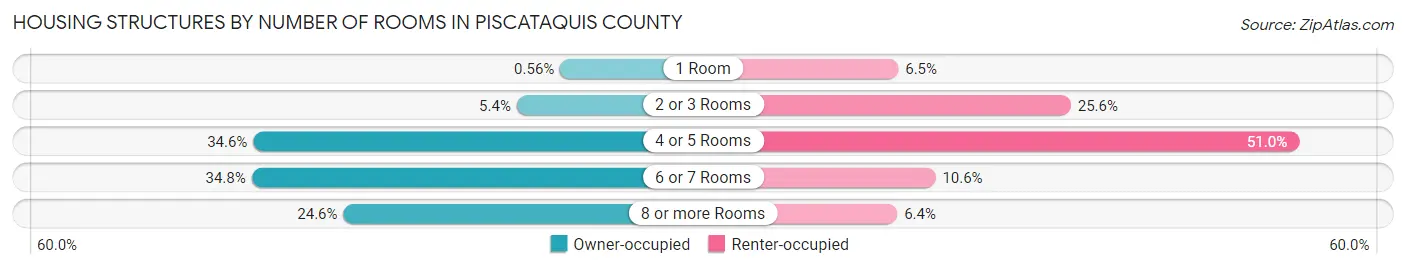
| Number of Rooms | Owner-occupied | Renter-occupied |
| 1 Room | 33 (0.6%) | 113 (6.5%) |
| 2 or 3 Rooms | 318 (5.4%) | 447 (25.6%) |
| 4 or 5 Rooms | 2,046 (34.6%) | 889 (50.9%) |
| 6 or 7 Rooms | 2,057 (34.8%) | 185 (10.6%) |
| 8 or more Rooms | 1,455 (24.6%) | 111 (6.4%) |
| Total | 5,909 (100.0%) | 1,745 (100.0%) |
Housing Structure by Heating Type in Piscataquis County
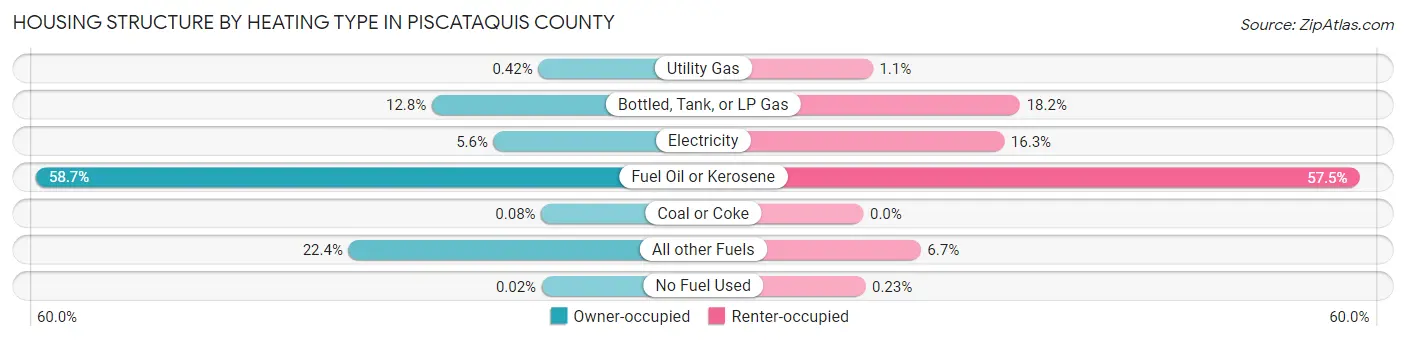
| Heating Type | Owner-occupied | Renter-occupied |
| Utility Gas | 25 (0.4%) | 19 (1.1%) |
| Bottled, Tank, or LP Gas | 754 (12.8%) | 317 (18.2%) |
| Electricity | 331 (5.6%) | 285 (16.3%) |
| Fuel Oil or Kerosene | 3,468 (58.7%) | 1,004 (57.5%) |
| Coal or Coke | 5 (0.1%) | 0 (0.0%) |
| All other Fuels | 1,325 (22.4%) | 116 (6.7%) |
| No Fuel Used | 1 (0.0%) | 4 (0.2%) |
| Total | 5,909 (100.0%) | 1,745 (100.0%) |
Household Vehicle Usage in Piscataquis County
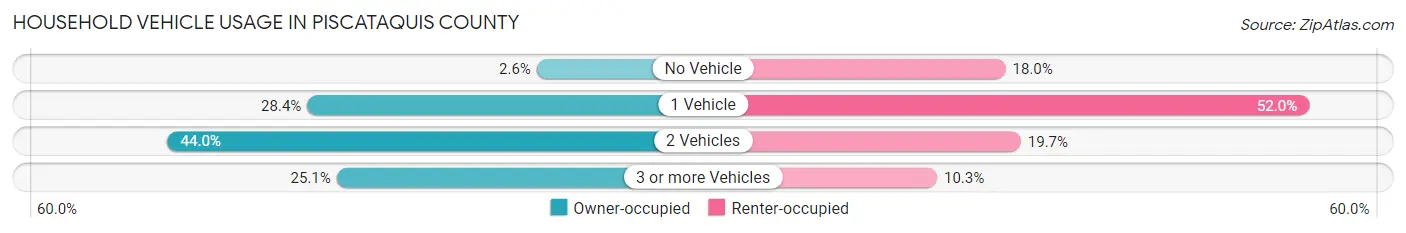
| Vehicles per Household | Owner-occupied | Renter-occupied |
| No Vehicle | 156 (2.6%) | 314 (18.0%) |
| 1 Vehicle | 1,675 (28.3%) | 907 (52.0%) |
| 2 Vehicles | 2,598 (44.0%) | 344 (19.7%) |
| 3 or more Vehicles | 1,480 (25.1%) | 180 (10.3%) |
| Total | 5,909 (100.0%) | 1,745 (100.0%) |
Real Estate & Mortgages in Piscataquis County
Real Estate and Mortgage Overview in Piscataquis County
| Characteristic | Without Mortgage | With Mortgage |
| Housing Units | 3,279 | 2,630 |
| Median Property Value | $118,900 | $155,300 |
| Median Household Income | $50,641 | $441 |
| Monthly Housing Costs | $439 | $65 |
| Real Estate Taxes | $1,278 | $58 |
Property Value by Mortgage Status in Piscataquis County
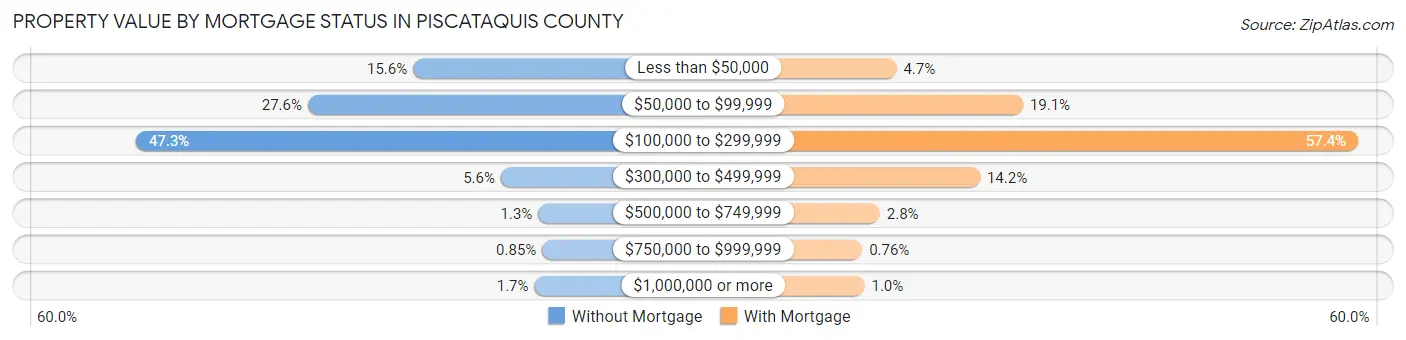
| Property Value | Without Mortgage | With Mortgage |
| Less than $50,000 | 512 (15.6%) | 123 (4.7%) |
| $50,000 to $99,999 | 906 (27.6%) | 503 (19.1%) |
| $100,000 to $299,999 | 1,550 (47.3%) | 1,510 (57.4%) |
| $300,000 to $499,999 | 183 (5.6%) | 374 (14.2%) |
| $500,000 to $749,999 | 43 (1.3%) | 73 (2.8%) |
| $750,000 to $999,999 | 28 (0.9%) | 20 (0.8%) |
| $1,000,000 or more | 57 (1.7%) | 27 (1.0%) |
| Total | 3,279 (100.0%) | 2,630 (100.0%) |
Household Income by Mortgage Status in Piscataquis County
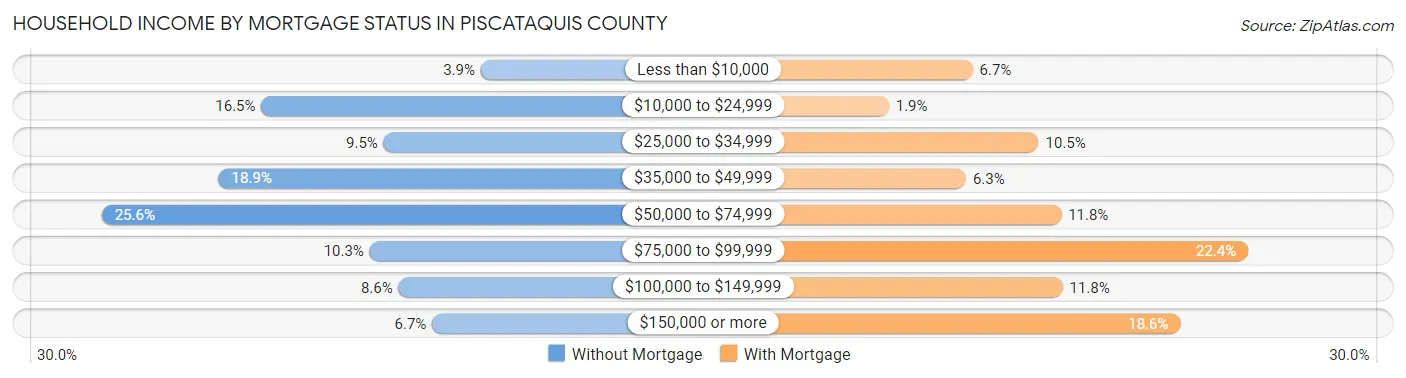
| Household Income | Without Mortgage | With Mortgage |
| Less than $10,000 | 129 (3.9%) | 176 (6.7%) |
| $10,000 to $24,999 | 540 (16.5%) | 50 (1.9%) |
| $25,000 to $34,999 | 311 (9.5%) | 275 (10.5%) |
| $35,000 to $49,999 | 620 (18.9%) | 166 (6.3%) |
| $50,000 to $74,999 | 839 (25.6%) | 309 (11.7%) |
| $75,000 to $99,999 | 337 (10.3%) | 590 (22.4%) |
| $100,000 to $149,999 | 283 (8.6%) | 311 (11.8%) |
| $150,000 or more | 220 (6.7%) | 488 (18.6%) |
| Total | 3,279 (100.0%) | 2,630 (100.0%) |
Property Value to Household Income Ratio in Piscataquis County
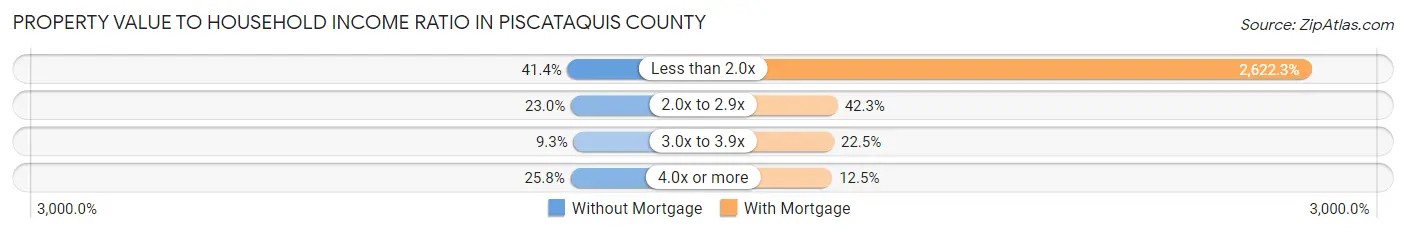
| Value-to-Income Ratio | Without Mortgage | With Mortgage |
| Less than 2.0x | 1,356 (41.3%) | 68,967 (2,622.3%) |
| 2.0x to 2.9x | 753 (23.0%) | 1,112 (42.3%) |
| 3.0x to 3.9x | 305 (9.3%) | 591 (22.5%) |
| 4.0x or more | 845 (25.8%) | 328 (12.5%) |
| Total | 3,279 (100.0%) | 2,630 (100.0%) |
Real Estate Taxes by Mortgage Status in Piscataquis County
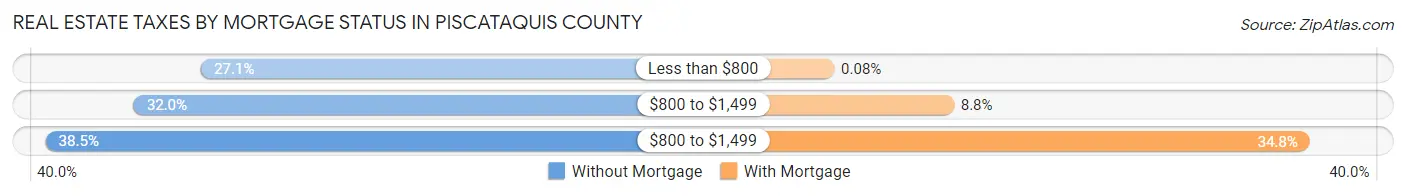
| Property Taxes | Without Mortgage | With Mortgage |
| Less than $800 | 889 (27.1%) | 2 (0.1%) |
| $800 to $1,499 | 1,050 (32.0%) | 232 (8.8%) |
| $800 to $1,499 | 1,261 (38.5%) | 916 (34.8%) |
| Total | 3,279 (100.0%) | 2,630 (100.0%) |
Health & Disability in Piscataquis County
Health Insurance Coverage by Age in Piscataquis County
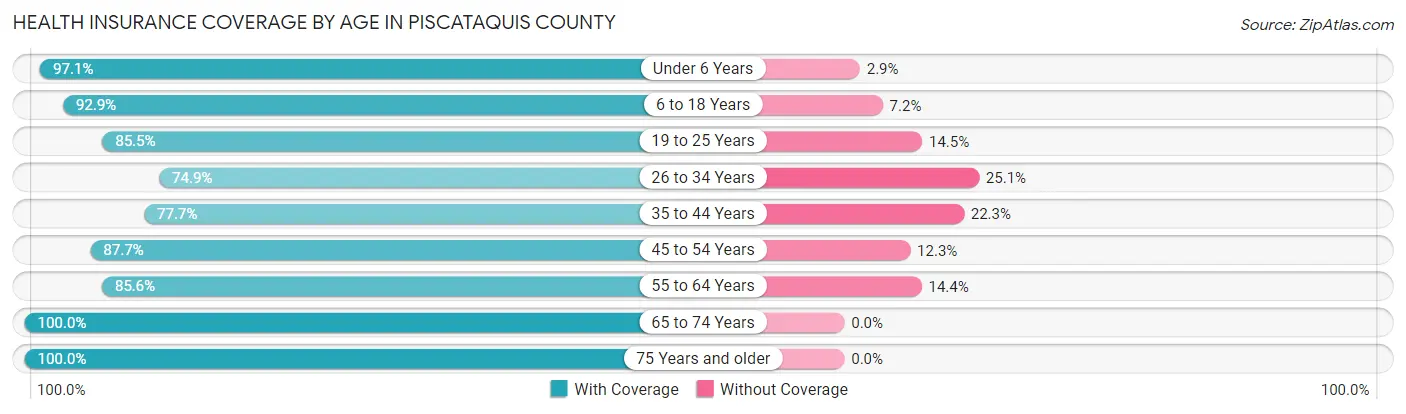
| Age Bracket | With Coverage | Without Coverage |
| Under 6 Years | 974 (97.1%) | 29 (2.9%) |
| 6 to 18 Years | 1,791 (92.8%) | 138 (7.1%) |
| 19 to 25 Years | 1,038 (85.5%) | 176 (14.5%) |
| 26 to 34 Years | 952 (74.9%) | 319 (25.1%) |
| 35 to 44 Years | 1,374 (77.7%) | 394 (22.3%) |
| 45 to 54 Years | 1,871 (87.7%) | 262 (12.3%) |
| 55 to 64 Years | 2,569 (85.6%) | 432 (14.4%) |
| 65 to 74 Years | 2,693 (100.0%) | 0 (0.0%) |
| 75 Years and older | 1,686 (100.0%) | 0 (0.0%) |
| Total | 14,948 (89.5%) | 1,750 (10.5%) |
Health Insurance Coverage by Citizenship Status in Piscataquis County
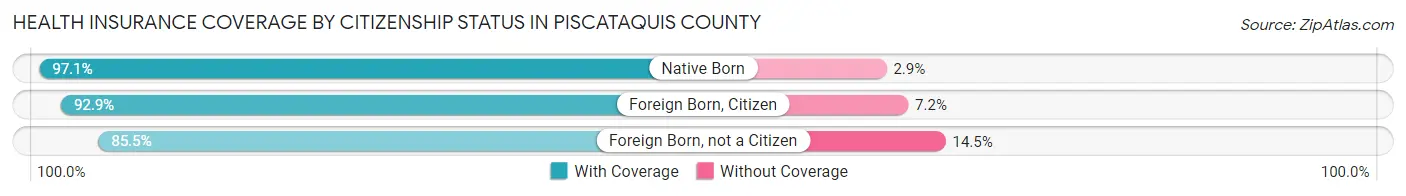
| Citizenship Status | With Coverage | Without Coverage |
| Native Born | 974 (97.1%) | 29 (2.9%) |
| Foreign Born, Citizen | 1,791 (92.8%) | 138 (7.1%) |
| Foreign Born, not a Citizen | 1,038 (85.5%) | 176 (14.5%) |
Health Insurance Coverage by Household Income in Piscataquis County
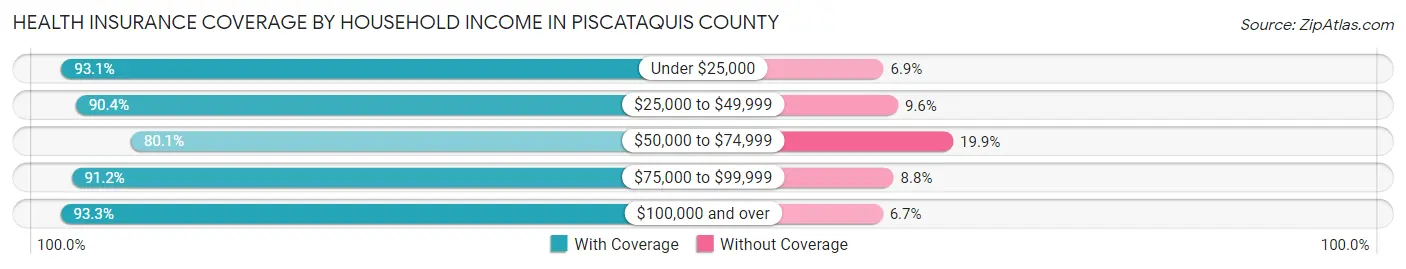
| Household Income | With Coverage | Without Coverage |
| Under $25,000 | 2,328 (93.1%) | 172 (6.9%) |
| $25,000 to $49,999 | 3,421 (90.4%) | 363 (9.6%) |
| $50,000 to $74,999 | 2,831 (80.1%) | 704 (19.9%) |
| $75,000 to $99,999 | 2,016 (91.2%) | 194 (8.8%) |
| $100,000 and over | 4,187 (93.3%) | 302 (6.7%) |
Public vs Private Health Insurance Coverage by Age in Piscataquis County
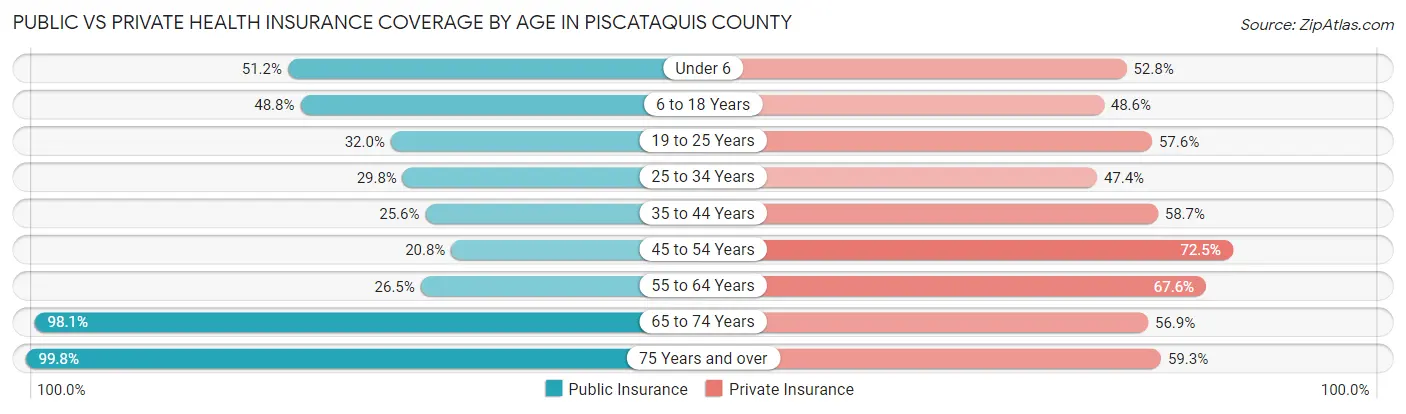
| Age Bracket | Public Insurance | Private Insurance |
| Under 6 | 513 (51.1%) | 530 (52.8%) |
| 6 to 18 Years | 942 (48.8%) | 938 (48.6%) |
| 19 to 25 Years | 389 (32.0%) | 699 (57.6%) |
| 25 to 34 Years | 379 (29.8%) | 602 (47.4%) |
| 35 to 44 Years | 453 (25.6%) | 1,037 (58.7%) |
| 45 to 54 Years | 444 (20.8%) | 1,547 (72.5%) |
| 55 to 64 Years | 795 (26.5%) | 2,028 (67.6%) |
| 65 to 74 Years | 2,643 (98.1%) | 1,531 (56.9%) |
| 75 Years and over | 1,683 (99.8%) | 999 (59.3%) |
| Total | 8,241 (49.3%) | 9,911 (59.4%) |
Disability Status by Sex by Age in Piscataquis County
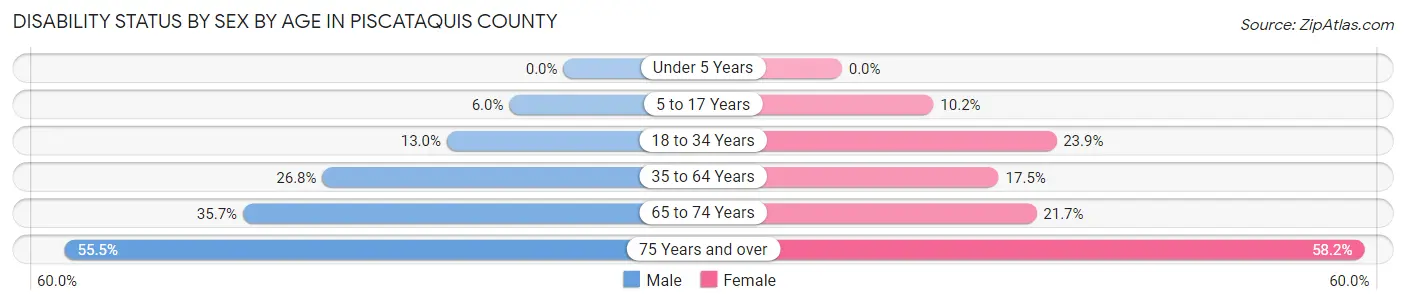
| Age Bracket | Male | Female |
| Under 5 Years | 0 (0.0%) | 0 (0.0%) |
| 5 to 17 Years | 63 (6.0%) | 105 (10.2%) |
| 18 to 34 Years | 171 (13.0%) | 294 (23.9%) |
| 35 to 64 Years | 932 (26.8%) | 599 (17.5%) |
| 65 to 74 Years | 500 (35.7%) | 280 (21.7%) |
| 75 Years and over | 461 (55.5%) | 498 (58.2%) |
Disability Class by Sex by Age in Piscataquis County
Disability Class: Hearing Difficulty
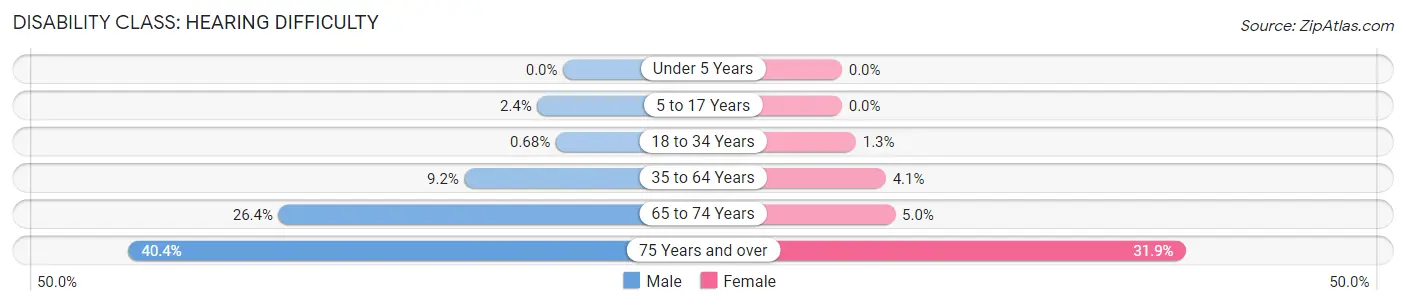
| Age Bracket | Male | Female |
| Under 5 Years | 0 (0.0%) | 0 (0.0%) |
| 5 to 17 Years | 25 (2.4%) | 0 (0.0%) |
| 18 to 34 Years | 9 (0.7%) | 16 (1.3%) |
| 35 to 64 Years | 318 (9.2%) | 140 (4.1%) |
| 65 to 74 Years | 370 (26.4%) | 64 (5.0%) |
| 75 Years and over | 335 (40.4%) | 273 (31.9%) |
Disability Class: Vision Difficulty
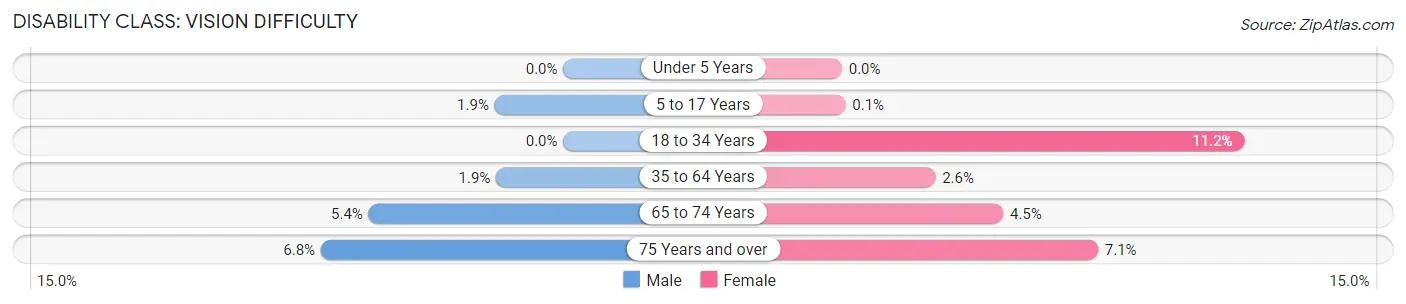
| Age Bracket | Male | Female |
| Under 5 Years | 0 (0.0%) | 0 (0.0%) |
| 5 to 17 Years | 20 (1.9%) | 1 (0.1%) |
| 18 to 34 Years | 0 (0.0%) | 138 (11.2%) |
| 35 to 64 Years | 65 (1.9%) | 89 (2.6%) |
| 65 to 74 Years | 76 (5.4%) | 58 (4.5%) |
| 75 Years and over | 56 (6.8%) | 61 (7.1%) |
Disability Class: Cognitive Difficulty
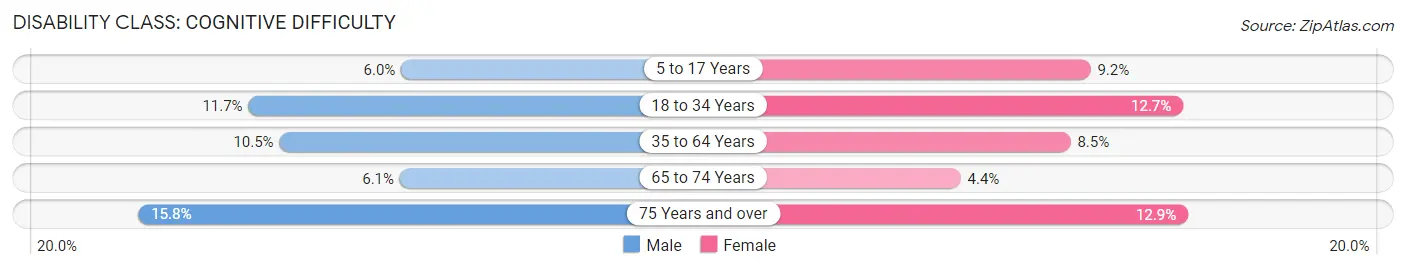
| Age Bracket | Male | Female |
| 5 to 17 Years | 63 (6.0%) | 95 (9.2%) |
| 18 to 34 Years | 154 (11.7%) | 156 (12.7%) |
| 35 to 64 Years | 366 (10.5%) | 291 (8.5%) |
| 65 to 74 Years | 85 (6.1%) | 57 (4.4%) |
| 75 Years and over | 131 (15.8%) | 110 (12.9%) |
Disability Class: Ambulatory Difficulty
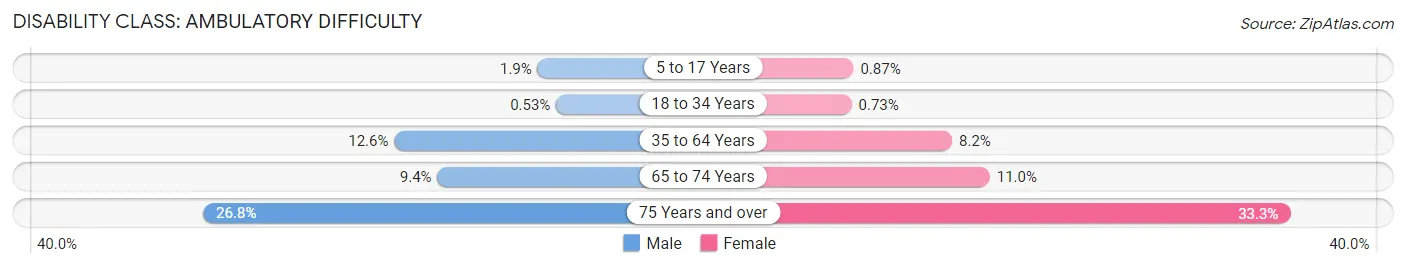
| Age Bracket | Male | Female |
| 5 to 17 Years | 20 (1.9%) | 9 (0.9%) |
| 18 to 34 Years | 7 (0.5%) | 9 (0.7%) |
| 35 to 64 Years | 436 (12.6%) | 281 (8.2%) |
| 65 to 74 Years | 131 (9.3%) | 142 (11.0%) |
| 75 Years and over | 222 (26.8%) | 285 (33.3%) |
Disability Class: Self-Care Difficulty
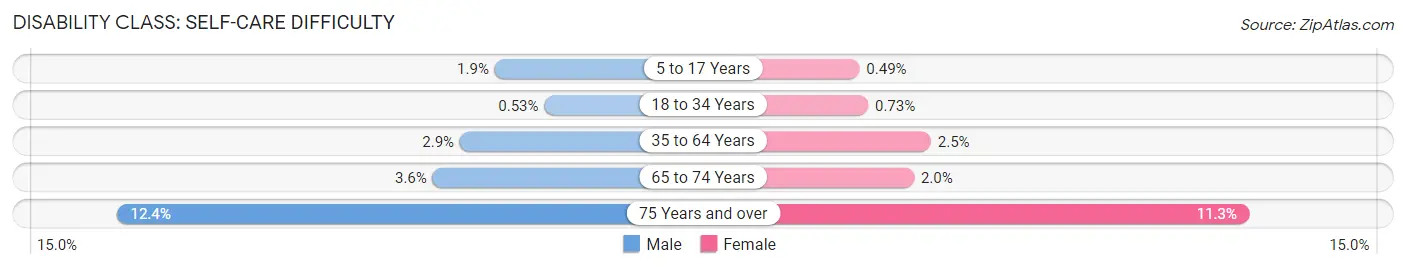
| Age Bracket | Male | Female |
| 5 to 17 Years | 20 (1.9%) | 5 (0.5%) |
| 18 to 34 Years | 7 (0.5%) | 9 (0.7%) |
| 35 to 64 Years | 100 (2.9%) | 85 (2.5%) |
| 65 to 74 Years | 51 (3.6%) | 26 (2.0%) |
| 75 Years and over | 103 (12.4%) | 97 (11.3%) |
Technology Access in Piscataquis County
Computing Device Access in Piscataquis County
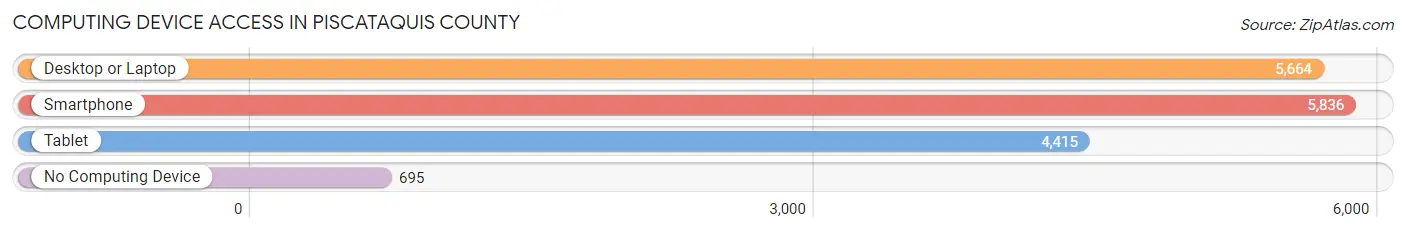
| Device Type | # Households | % Households |
| Desktop or Laptop | 5,664 | 74.0% |
| Smartphone | 5,836 | 76.2% |
| Tablet | 4,415 | 57.7% |
| No Computing Device | 695 | 9.1% |
| Total | 7,654 | 100.0% |
Internet Access in Piscataquis County
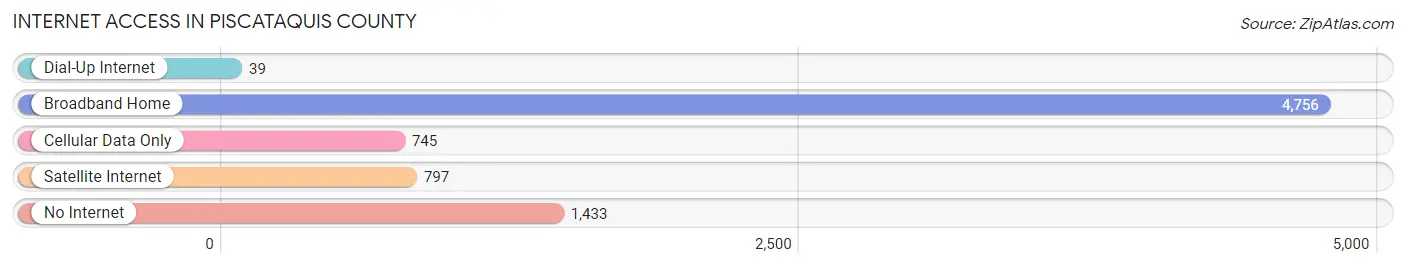
| Internet Type | # Households | % Households |
| Dial-Up Internet | 39 | 0.5% |
| Broadband Home | 4,756 | 62.1% |
| Cellular Data Only | 745 | 9.7% |
| Satellite Internet | 797 | 10.4% |
| No Internet | 1,433 | 18.7% |
| Total | 7,654 | 100.0% |
Piscataquis County Summary
Piscataquis County is located in the state of Maine, in the United States of America. It is the largest county in the state, covering an area of 3,717 square miles. The county is bordered by Penobscot County to the east, Somerset County to the south, Aroostook County to the west, and Washington County to the north. The county seat is Dover-Foxcroft.
History
Piscataquis County was established in 1838, and was named after the Piscataquis River, which runs through the county. The county was originally part of Hancock County, and was created from parts of Penobscot and Somerset counties. The county was originally inhabited by the Abenaki people, who were part of the Wabanaki Confederacy.
The first European settlers arrived in the area in the late 1700s, and the county was officially established in 1838. The county was primarily agricultural, and the main crops were potatoes, hay, and oats. The county also had a thriving lumber industry, and the first sawmill was built in 1820.
In the late 1800s, the county experienced a population boom, as many people moved to the area to work in the lumber industry. The county also experienced a boom in tourism, as people came to the area to enjoy the natural beauty of the area.
Geography
Piscataquis County is located in the northern part of Maine, and is the largest county in the state. The county is bordered by Penobscot County to the east, Somerset County to the south, Aroostook County to the west, and Washington County to the north. The county is mostly rural, and is home to several small towns and villages. The county is home to several lakes, rivers, and mountains, including Mount Katahdin, the highest peak in Maine.
The county has a humid continental climate, with cold winters and warm summers. The average annual temperature is around 40°F, and the average annual precipitation is around 40 inches.
Economy
The economy of Piscataquis County is largely based on agriculture and tourism. The county is home to several small farms, which produce potatoes, hay, oats, and other crops. The county also has a thriving lumber industry, and the first sawmill was built in 1820.
The county is also home to several tourist attractions, including Baxter State Park, which is home to Mount Katahdin, the highest peak in Maine. The county is also home to several lakes and rivers, which attract visitors for fishing, boating, and other outdoor activities.
Demographics
As of the 2010 census, the population of Piscataquis County was 17,535. The population is mostly white (96.3%), with small percentages of African American (1.2%), Native American (0.7%), Asian (0.3%), and other races (1.5%). The median household income is $37,945, and the median age is 44.7 years. The county has a poverty rate of 16.2%.
Common Questions
What is Per Capita Income in Piscataquis County?
Per Capita income in Piscataquis County is $32,843.
What is the Median Family Income in Piscataquis County?
Median Family Income in Piscataquis County is $62,700.
What is the Median Household income in Piscataquis County?
Median Household Income in Piscataquis County is $51,805.
What is Income or Wage Gap in Piscataquis County?
Income or Wage Gap in Piscataquis County is 18.6%.
Women in Piscataquis County earn 81.4 cents for every dollar earned by a man.
What is Family Income Deficit in Piscataquis County?
Family Income Deficit in Piscataquis County is $9,101.
Families that are below poverty line in Piscataquis County earn $9,101 less on average than the poverty threshold level.
What is Inequality or Gini Index in Piscataquis County?
Inequality or Gini Index in Piscataquis County is 0.46.
What is the Total Population of Piscataquis County?
Total Population of Piscataquis County is 16,936.
What is the Total Male Population of Piscataquis County?
Total Male Population of Piscataquis County is 8,571.
What is the Total Female Population of Piscataquis County?
Total Female Population of Piscataquis County is 8,365.
What is the Ratio of Males per 100 Females in Piscataquis County?
There are 102.46 Males per 100 Females in Piscataquis County.
What is the Ratio of Females per 100 Males in Piscataquis County?
There are 97.60 Females per 100 Males in Piscataquis County.
What is the Median Population Age in Piscataquis County?
Median Population Age in Piscataquis County is 51.2 Years.
What is the Average Family Size in Piscataquis County
Average Family Size in Piscataquis County is 2.5 People.
What is the Average Household Size in Piscataquis County
Average Household Size in Piscataquis County is 2.2 People.
How Large is the Labor Force in Piscataquis County?
There are 7,537 People in the Labor Forcein in Piscataquis County.
What is the Percentage of People in the Labor Force in Piscataquis County?
52.1% of People are in the Labor Force in Piscataquis County.
What is the Unemployment Rate in Piscataquis County?
Unemployment Rate in Piscataquis County is 4.9%.