Yarmouth, ME Map & Demographics
Yarmouth Map
Yarmouth Overview
$50,865
PER CAPITA INCOME
$114,327
AVG FAMILY INCOME
$89,770
AVG HOUSEHOLD INCOME
55.6%
WAGE / INCOME GAP [ % ]
44.4¢/ $1
WAGE / INCOME GAP [ $ ]
0.49
INEQUALITY / GINI INDEX
5,937
TOTAL POPULATION
2,678
MALE POPULATION
3,259
FEMALE POPULATION
82.17
MALES / 100 FEMALES
121.70
FEMALES / 100 MALES
39.3
MEDIAN AGE
3.0
AVG FAMILY SIZE
2.6
AVG HOUSEHOLD SIZE
3,466
LABOR FORCE [ PEOPLE ]
73.8%
PERCENT IN LABOR FORCE
6.5%
UNEMPLOYMENT RATE
Yarmouth Zip Codes
Yarmouth Area Codes
Income in Yarmouth
Income Overview in Yarmouth
Per Capita Income in Yarmouth is $50,865, while median incomes of families and households are $114,327 and $89,770 respectively.
| Characteristic | Number | Measure |
| Per Capita Income | 5,937 | $50,865 |
| Median Family Income | 1,464 | $114,327 |
| Mean Family Income | 1,464 | $169,263 |
| Median Household Income | 2,217 | $89,770 |
| Mean Household Income | 2,217 | $136,605 |
| Income Deficit | 1,464 | $0 |
| Wage / Income Gap (%) | 5,937 | 55.60% |
| Wage / Income Gap ($) | 5,937 | 44.40¢ per $1 |
| Gini / Inequality Index | 5,937 | 0.49 |
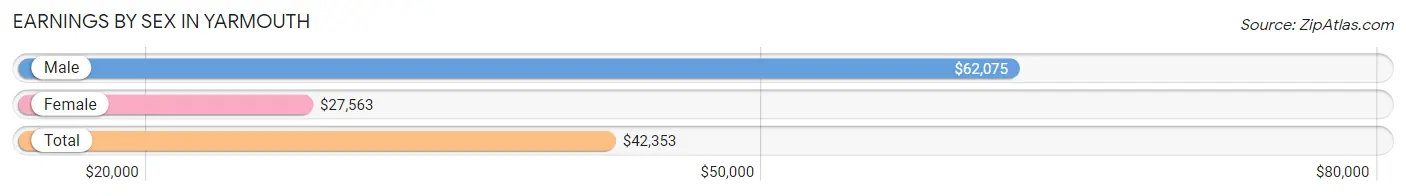
Earnings by Sex in Yarmouth
Average Earnings in Yarmouth are $42,353, $62,075 for men and $27,563 for women, a difference of 55.6%.
| Sex | Number | Average Earnings |
| Male | 1,447 (41.4%) | $62,075 |
| Female | 2,049 (58.6%) | $27,563 |
| Total | 3,496 (100.0%) | $42,353 |
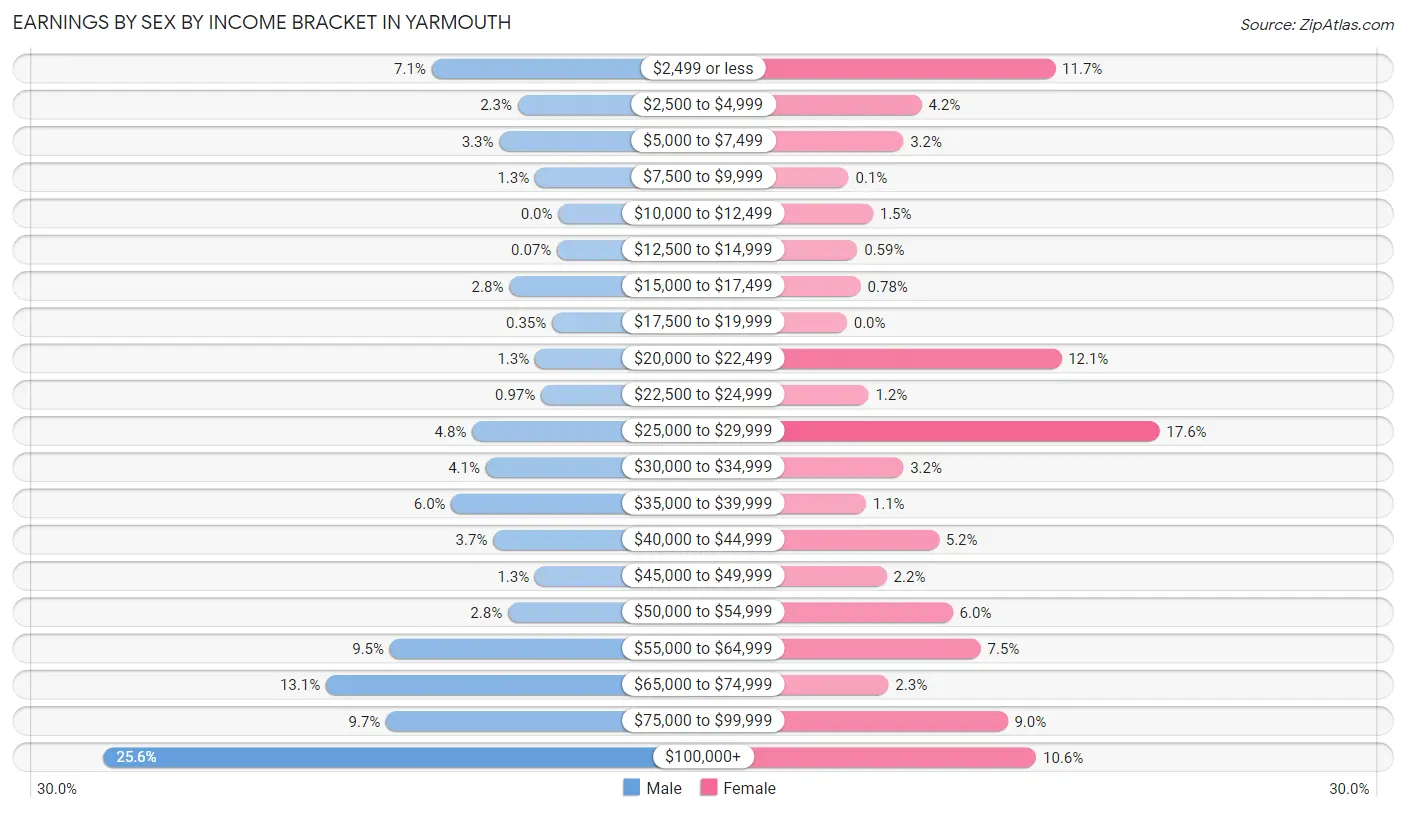
Earnings by Sex by Income Bracket in Yarmouth
The most common earnings brackets in Yarmouth are $100,000+ for men (370 | 25.6%) and $25,000 to $29,999 for women (360 | 17.6%).
| Income | Male | Female |
| $2,499 or less | 103 (7.1%) | 240 (11.7%) |
| $2,500 to $4,999 | 33 (2.3%) | 86 (4.2%) |
| $5,000 to $7,499 | 48 (3.3%) | 65 (3.2%) |
| $7,500 to $9,999 | 19 (1.3%) | 2 (0.1%) |
| $10,000 to $12,499 | 0 (0.0%) | 30 (1.5%) |
| $12,500 to $14,999 | 1 (0.1%) | 12 (0.6%) |
| $15,000 to $17,499 | 40 (2.8%) | 16 (0.8%) |
| $17,500 to $19,999 | 5 (0.4%) | 0 (0.0%) |
| $20,000 to $22,499 | 19 (1.3%) | 247 (12.0%) |
| $22,500 to $24,999 | 14 (1.0%) | 25 (1.2%) |
| $25,000 to $29,999 | 70 (4.8%) | 360 (17.6%) |
| $30,000 to $34,999 | 59 (4.1%) | 65 (3.2%) |
| $35,000 to $39,999 | 87 (6.0%) | 22 (1.1%) |
| $40,000 to $44,999 | 53 (3.7%) | 106 (5.2%) |
| $45,000 to $49,999 | 19 (1.3%) | 46 (2.2%) |
| $50,000 to $54,999 | 41 (2.8%) | 122 (5.9%) |
| $55,000 to $64,999 | 137 (9.5%) | 154 (7.5%) |
| $65,000 to $74,999 | 189 (13.1%) | 48 (2.3%) |
| $75,000 to $99,999 | 140 (9.7%) | 185 (9.0%) |
| $100,000+ | 370 (25.6%) | 218 (10.6%) |
| Total | 1,447 (100.0%) | 2,049 (100.0%) |
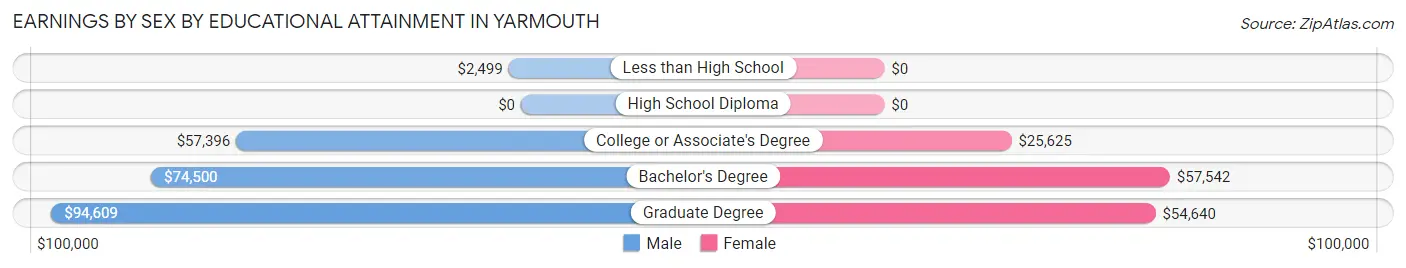
Earnings by Sex by Educational Attainment in Yarmouth
Average earnings in Yarmouth are $70,123 for men and $32,829 for women, a difference of 53.2%. Men with an educational attainment of graduate degree enjoy the highest average annual earnings of $94,609, while those with less than high school education earn the least with $2,499. Women with an educational attainment of bachelor's degree earn the most with the average annual earnings of $57,542, while those with college or associate's degree education have the smallest earnings of $25,625.
| Educational Attainment | Male Income | Female Income |
| Less than High School | $2,499 | $0 |
| High School Diploma | - | - |
| College or Associate's Degree | $57,396 | $25,625 |
| Bachelor's Degree | $74,500 | $57,542 |
| Graduate Degree | $94,609 | $54,640 |
| Total | $70,123 | $32,829 |
Family Income in Yarmouth
Family Income Brackets in Yarmouth
According to the Yarmouth family income data, there are 354 families falling into the $100,000 to $149,999 income range, which is the most common income bracket and makes up 24.2% of all families.
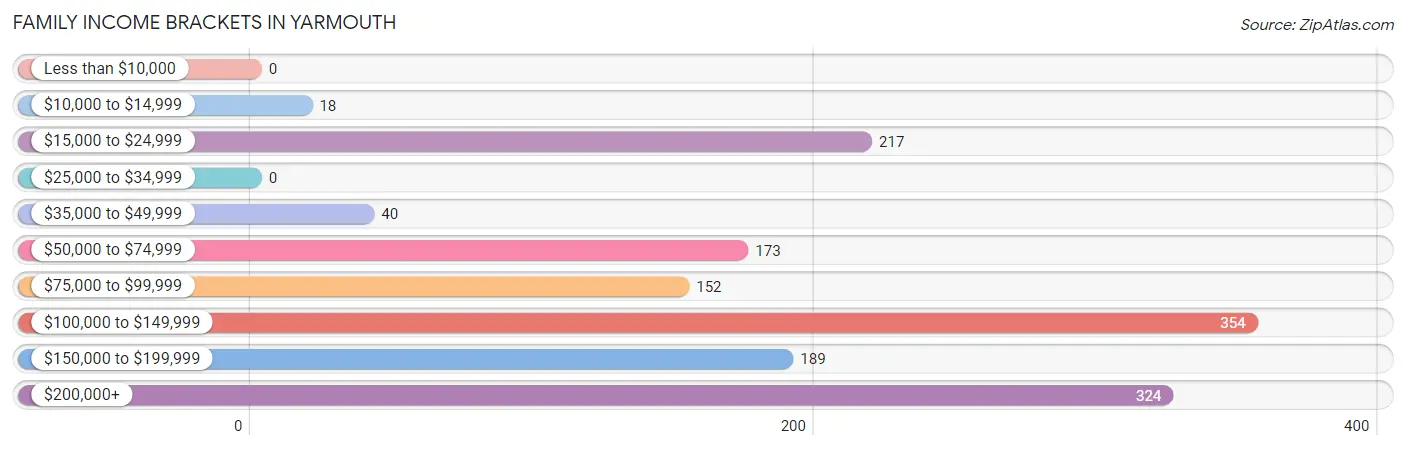
| Income Bracket | # Families | % Families |
| Less than $10,000 | 0 | 0.0% |
| $10,000 to $14,999 | 18 | 1.2% |
| $15,000 to $24,999 | 217 | 14.8% |
| $25,000 to $34,999 | 0 | 0.0% |
| $35,000 to $49,999 | 40 | 2.7% |
| $50,000 to $74,999 | 173 | 11.8% |
| $75,000 to $99,999 | 152 | 10.4% |
| $100,000 to $149,999 | 354 | 24.2% |
| $150,000 to $199,999 | 189 | 12.9% |
| $200,000+ | 324 | 22.1% |
Family Income by Famaliy Size in Yarmouth
5-person families (83 | 5.7%) account for the highest median family income in Yarmouth with $250,001 per family, while 2-person families (643 | 43.9%) have the highest median income of $51,420 per family member.
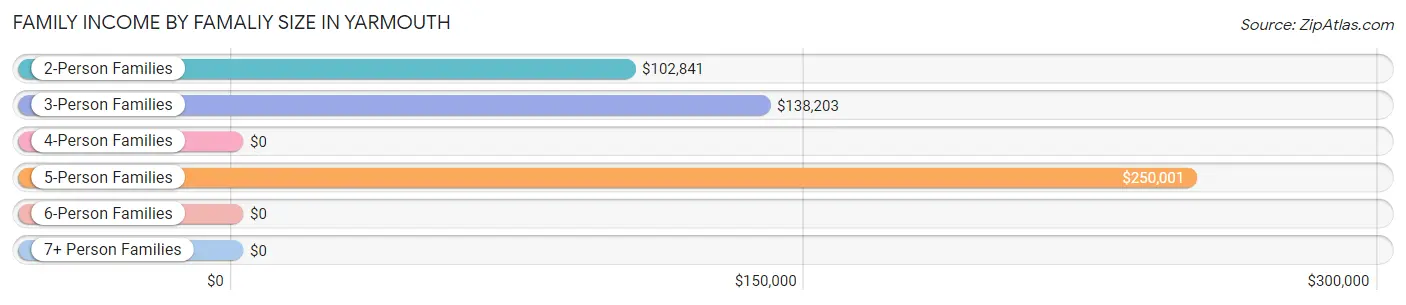
| Income Bracket | # Families | Median Income |
| 2-Person Families | 643 (43.9%) | $102,841 |
| 3-Person Families | 275 (18.8%) | $138,203 |
| 4-Person Families | 413 (28.2%) | $0 |
| 5-Person Families | 83 (5.7%) | $250,001 |
| 6-Person Families | 50 (3.4%) | $0 |
| 7+ Person Families | 0 (0.0%) | $0 |
| Total | 1,464 (100.0%) | $114,327 |
Family Income by Number of Earners in Yarmouth
The median family income in Yarmouth is $114,327, with families comprising 3+ earners (76) having the highest median family income of $250,001, while families with no earners (139) have the lowest median family income of $88,750, accounting for 5.2% and 9.5% of families, respectively.
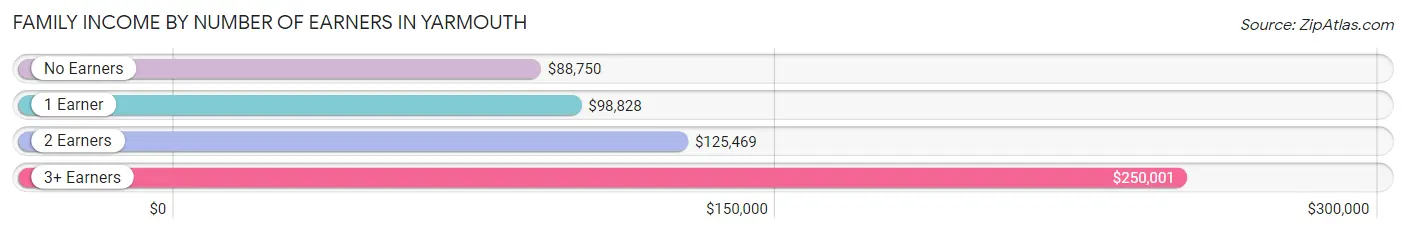
| Number of Earners | # Families | Median Income |
| No Earners | 139 (9.5%) | $88,750 |
| 1 Earner | 325 (22.2%) | $98,828 |
| 2 Earners | 924 (63.1%) | $125,469 |
| 3+ Earners | 76 (5.2%) | $250,001 |
| Total | 1,464 (100.0%) | $114,327 |
Household Income in Yarmouth
Household Income Brackets in Yarmouth
With 505 households falling in the category, the $100,000 to $149,999 income range is the most frequent in Yarmouth, accounting for 22.8% of all households. In contrast, only 27 households (1.2%) fall into the less than $10,000 income bracket, making it the least populous group.
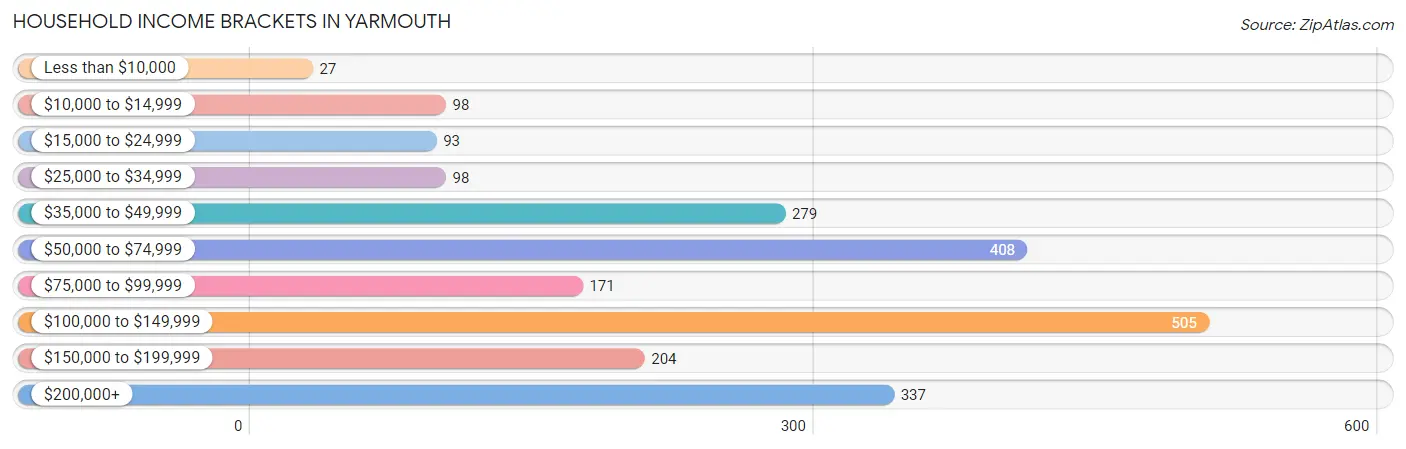
| Income Bracket | # Households | % Households |
| Less than $10,000 | 27 | 1.2% |
| $10,000 to $14,999 | 98 | 4.4% |
| $15,000 to $24,999 | 93 | 4.2% |
| $25,000 to $34,999 | 98 | 4.4% |
| $35,000 to $49,999 | 279 | 12.6% |
| $50,000 to $74,999 | 408 | 18.4% |
| $75,000 to $99,999 | 171 | 7.7% |
| $100,000 to $149,999 | 505 | 22.8% |
| $150,000 to $199,999 | 204 | 9.2% |
| $200,000+ | 337 | 15.2% |
Household Income by Householder Age in Yarmouth
The median household income in Yarmouth is $89,770, with the highest median household income of $131,250 found in the 25 to 44 years age bracket for the primary householder. A total of 596 households (26.9%) fall into this category. Meanwhile, the 15 to 24 years age bracket for the primary householder has the lowest median household income of $0, with 54 households (2.4%) in this group.
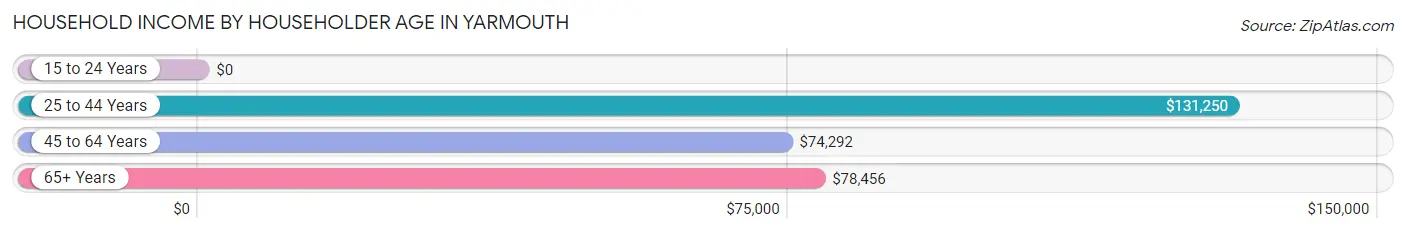
| Income Bracket | # Households | Median Income |
| 15 to 24 Years | 54 (2.4%) | $0 |
| 25 to 44 Years | 596 (26.9%) | $131,250 |
| 45 to 64 Years | 1,116 (50.3%) | $74,292 |
| 65+ Years | 451 (20.3%) | $78,456 |
| Total | 2,217 (100.0%) | $89,770 |
Poverty in Yarmouth
Income Below Poverty by Sex and Age in Yarmouth
With 15.5% poverty level for males and 16.9% for females among the residents of Yarmouth, 15 year old males and 18 to 24 year old females are the most vulnerable to poverty, with 145 males (89.5%) and 181 females (53.9%) in their respective age groups living below the poverty level.
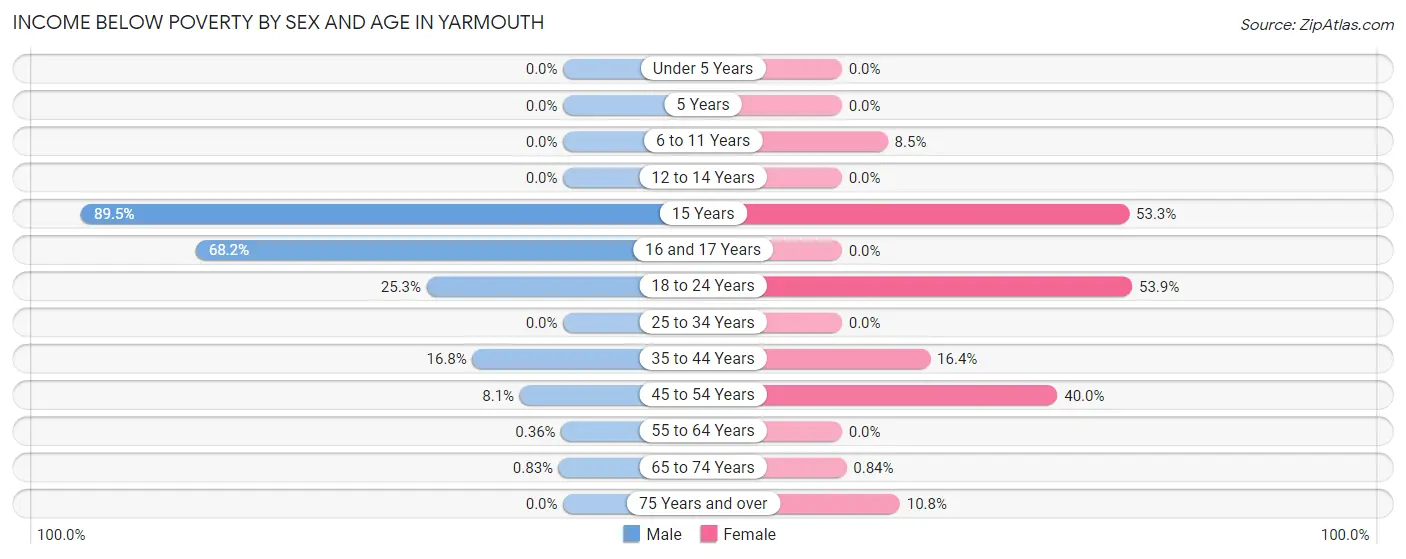
| Age Bracket | Male | Female |
| Under 5 Years | 0 (0.0%) | 0 (0.0%) |
| 5 Years | 0 (0.0%) | 0 (0.0%) |
| 6 to 11 Years | 0 (0.0%) | 16 (8.5%) |
| 12 to 14 Years | 0 (0.0%) | 0 (0.0%) |
| 15 Years | 145 (89.5%) | 16 (53.3%) |
| 16 and 17 Years | 146 (68.2%) | 0 (0.0%) |
| 18 to 24 Years | 19 (25.3%) | 181 (53.9%) |
| 25 to 34 Years | 0 (0.0%) | 0 (0.0%) |
| 35 to 44 Years | 50 (16.8%) | 72 (16.4%) |
| 45 to 54 Years | 34 (8.1%) | 234 (40.0%) |
| 55 to 64 Years | 1 (0.4%) | 0 (0.0%) |
| 65 to 74 Years | 2 (0.8%) | 2 (0.8%) |
| 75 Years and over | 0 (0.0%) | 17 (10.8%) |
| Total | 397 (15.5%) | 538 (16.9%) |
Income Above Poverty by Sex and Age in Yarmouth
According to the poverty statistics in Yarmouth, males aged under 5 years and females aged under 5 years are the age groups that are most secure financially, with 100.0% of males and 100.0% of females in these age groups living above the poverty line.
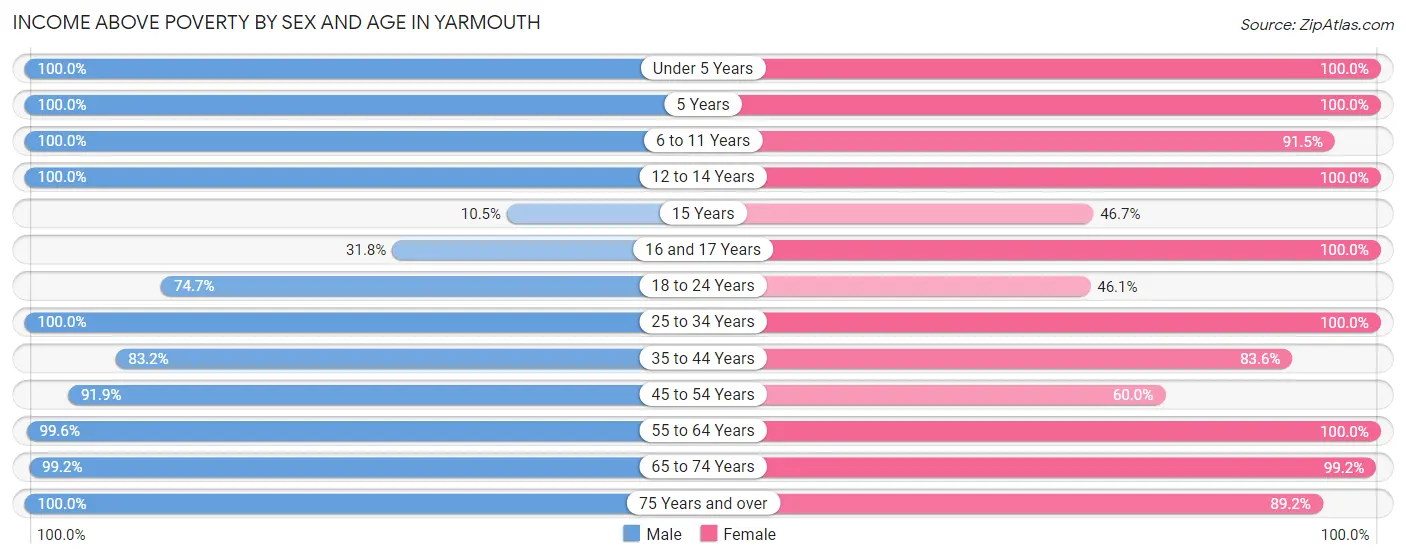
| Age Bracket | Male | Female |
| Under 5 Years | 108 (100.0%) | 112 (100.0%) |
| 5 Years | 43 (100.0%) | 33 (100.0%) |
| 6 to 11 Years | 278 (100.0%) | 172 (91.5%) |
| 12 to 14 Years | 89 (100.0%) | 150 (100.0%) |
| 15 Years | 17 (10.5%) | 14 (46.7%) |
| 16 and 17 Years | 68 (31.8%) | 115 (100.0%) |
| 18 to 24 Years | 56 (74.7%) | 155 (46.1%) |
| 25 to 34 Years | 263 (100.0%) | 440 (100.0%) |
| 35 to 44 Years | 247 (83.2%) | 367 (83.6%) |
| 45 to 54 Years | 388 (91.9%) | 351 (60.0%) |
| 55 to 64 Years | 275 (99.6%) | 354 (100.0%) |
| 65 to 74 Years | 240 (99.2%) | 237 (99.2%) |
| 75 Years and over | 91 (100.0%) | 141 (89.2%) |
| Total | 2,163 (84.5%) | 2,641 (83.1%) |
Income Below Poverty Among Married-Couple Families in Yarmouth
The poverty statistics for married-couple families in Yarmouth show that 1.7% or 17 of the total 988 families live below the poverty line. Families with 1 or 2 children have the highest poverty rate of 4.5%, comprising of 17 families. On the other hand, families with no children have the lowest poverty rate of 0.0%, which includes 0 families.
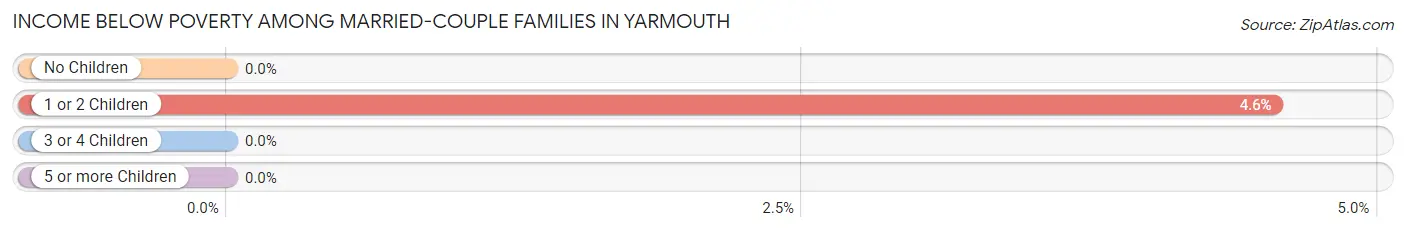
| Children | Above Poverty | Below Poverty |
| No Children | 481 (100.0%) | 0 (0.0%) |
| 1 or 2 Children | 357 (95.5%) | 17 (4.5%) |
| 3 or 4 Children | 133 (100.0%) | 0 (0.0%) |
| 5 or more Children | 0 (0.0%) | 0 (0.0%) |
| Total | 971 (98.3%) | 17 (1.7%) |
Income Below Poverty Among Single-Parent Households in Yarmouth
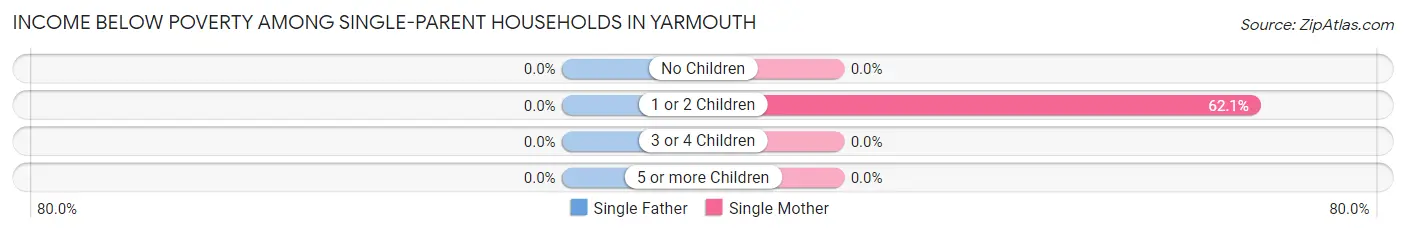
| Children | Single Father | Single Mother |
| No Children | 0 (0.0%) | 0 (0.0%) |
| 1 or 2 Children | 0 (0.0%) | 187 (62.1%) |
| 3 or 4 Children | 0 (0.0%) | 0 (0.0%) |
| 5 or more Children | 0 (0.0%) | 0 (0.0%) |
| Total | 0 (0.0%) | 187 (47.5%) |
Income Below Poverty Among Married-Couple vs Single-Parent Households in Yarmouth
The poverty data for Yarmouth shows that 17 of the married-couple family households (1.7%) and 187 of the single-parent households (39.3%) are living below the poverty level. Within the married-couple family households, those with 1 or 2 children have the highest poverty rate, with 17 households (4.5%) falling below the poverty line. Among the single-parent households, those with 1 or 2 children have the highest poverty rate, with 187 household (50.7%) living below poverty.
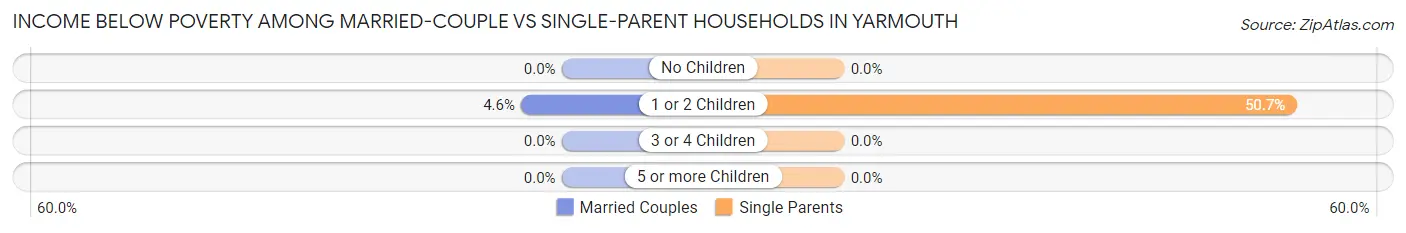
| Children | Married-Couple Families | Single-Parent Households |
| No Children | 0 (0.0%) | 0 (0.0%) |
| 1 or 2 Children | 17 (4.5%) | 187 (50.7%) |
| 3 or 4 Children | 0 (0.0%) | 0 (0.0%) |
| 5 or more Children | 0 (0.0%) | 0 (0.0%) |
| Total | 17 (1.7%) | 187 (39.3%) |
Race in Yarmouth
The most populous races in Yarmouth are White / Caucasian (5,498 | 92.6%), Two or more Races (163 | 2.8%), and Hispanic or Latino (138 | 2.3%).
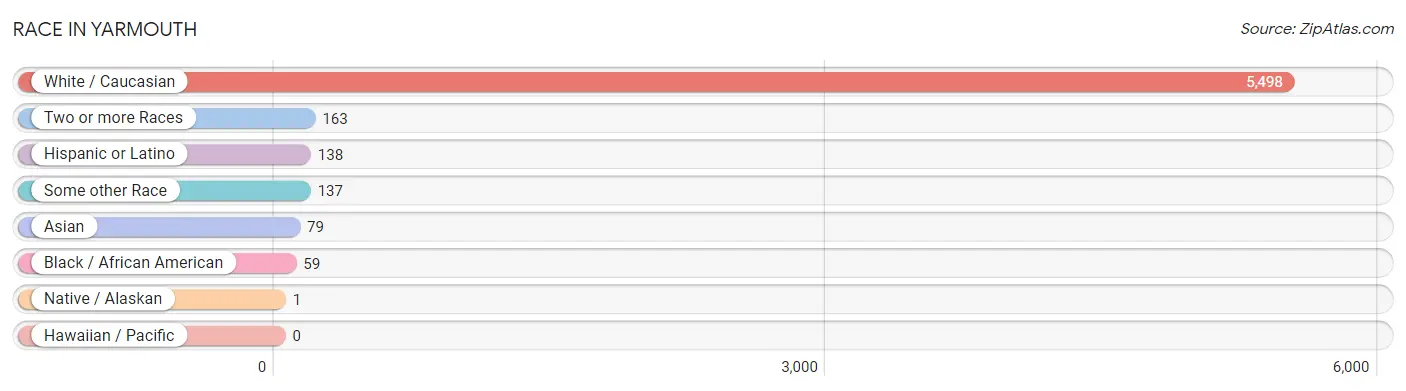
| Race | # Population | % Population |
| Asian | 79 | 1.3% |
| Black / African American | 59 | 1.0% |
| Hawaiian / Pacific | 0 | 0.0% |
| Hispanic or Latino | 138 | 2.3% |
| Native / Alaskan | 1 | 0.0% |
| White / Caucasian | 5,498 | 92.6% |
| Two or more Races | 163 | 2.8% |
| Some other Race | 137 | 2.3% |
| Total | 5,937 | 100.0% |
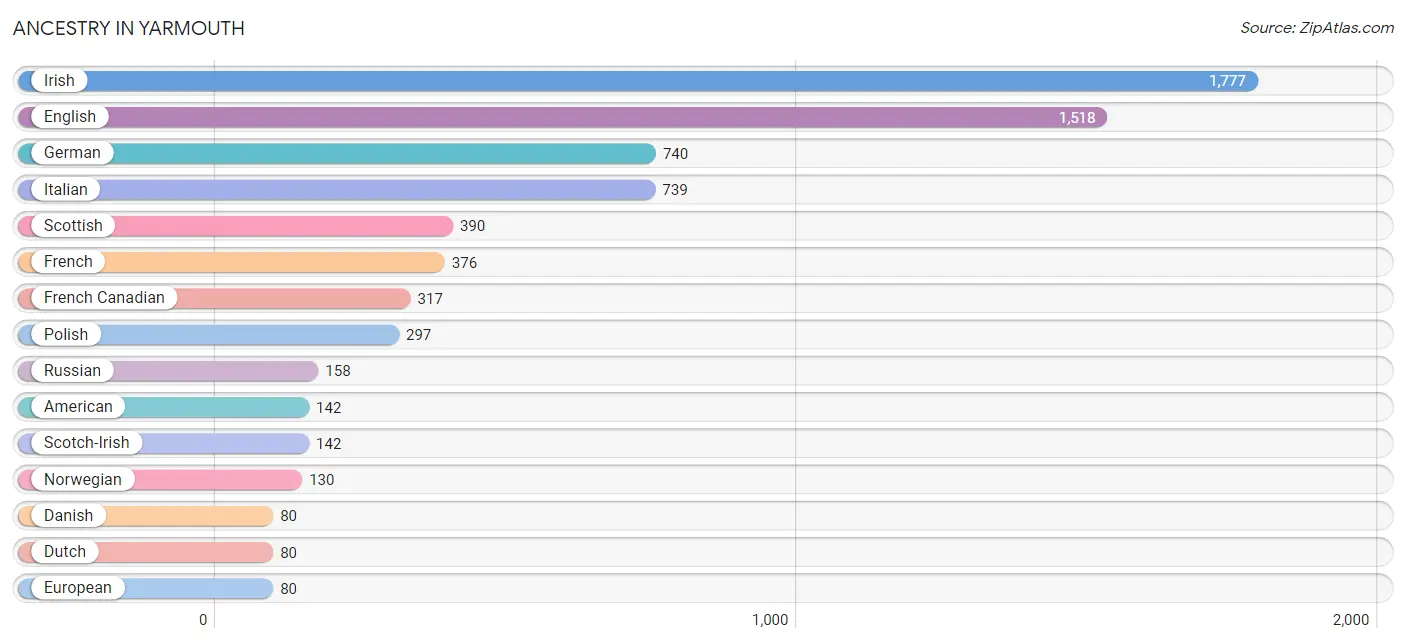
Ancestry in Yarmouth
The most populous ancestries reported in Yarmouth are Irish (1,777 | 29.9%), English (1,518 | 25.6%), German (740 | 12.5%), Italian (739 | 12.4%), and Scottish (390 | 6.6%), together accounting for 87.0% of all Yarmouth residents.
| Ancestry | # Population | % Population |
| African | 18 | 0.3% |
| American | 142 | 2.4% |
| Armenian | 30 | 0.5% |
| Bhutanese | 22 | 0.4% |
| Brazilian | 5 | 0.1% |
| British | 75 | 1.3% |
| Cajun | 9 | 0.2% |
| Canadian | 14 | 0.2% |
| Carpatho Rusyn | 12 | 0.2% |
| Central American | 59 | 1.0% |
| Cherokee | 20 | 0.3% |
| Costa Rican | 58 | 1.0% |
| Croatian | 24 | 0.4% |
| Czechoslovakian | 26 | 0.4% |
| Danish | 80 | 1.3% |
| Dutch | 80 | 1.3% |
| Eastern European | 16 | 0.3% |
| English | 1,518 | 25.6% |
| European | 80 | 1.3% |
| Finnish | 31 | 0.5% |
| French | 376 | 6.3% |
| French Canadian | 317 | 5.3% |
| German | 740 | 12.5% |
| Greek | 59 | 1.0% |
| Hungarian | 8 | 0.1% |
| Indian (Asian) | 36 | 0.6% |
| Irish | 1,777 | 29.9% |
| Italian | 739 | 12.4% |
| Jamaican | 26 | 0.4% |
| Korean | 13 | 0.2% |
| Laotian | 1 | 0.0% |
| Lithuanian | 12 | 0.2% |
| Mexican | 49 | 0.8% |
| New Zealander | 80 | 1.3% |
| Northern European | 45 | 0.8% |
| Norwegian | 130 | 2.2% |
| Panamanian | 1 | 0.0% |
| Polish | 297 | 5.0% |
| Portuguese | 5 | 0.1% |
| Puerto Rican | 30 | 0.5% |
| Russian | 158 | 2.7% |
| Scandinavian | 1 | 0.0% |
| Scotch-Irish | 142 | 2.4% |
| Scottish | 390 | 6.6% |
| Serbian | 17 | 0.3% |
| Slovak | 49 | 0.8% |
| Subsaharan African | 18 | 0.3% |
| Swedish | 39 | 0.7% |
| Thai | 42 | 0.7% |
| Ukrainian | 40 | 0.7% |
| Welsh | 35 | 0.6% | View All 51 Rows |
Immigrants in Yarmouth
The most numerous immigrant groups reported in Yarmouth came from Europe (97 | 1.6%), Asia (79 | 1.3%), Latin America (54 | 0.9%), Northern Europe (43 | 0.7%), and India (42 | 0.7%), together accounting for 5.3% of all Yarmouth residents.
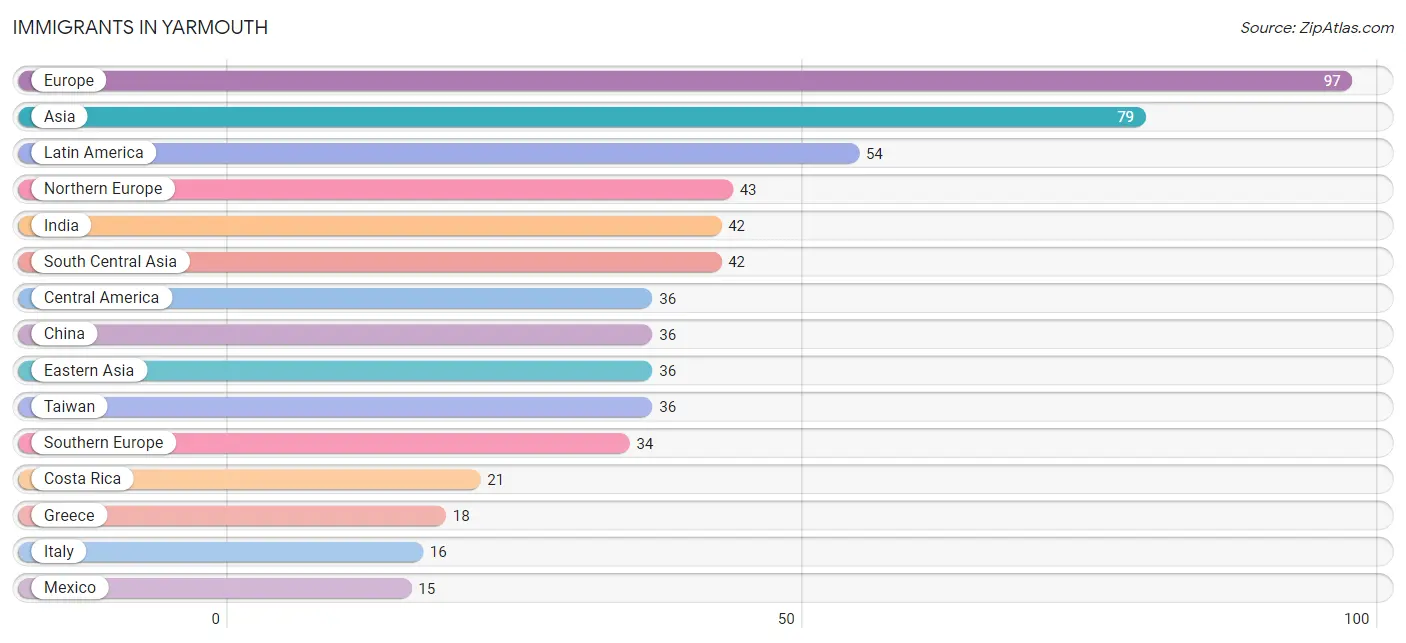
| Immigration Origin | # Population | % Population |
| Asia | 79 | 1.3% |
| Brazil | 5 | 0.1% |
| Caribbean | 13 | 0.2% |
| Central America | 36 | 0.6% |
| China | 36 | 0.6% |
| Costa Rica | 21 | 0.4% |
| Eastern Asia | 36 | 0.6% |
| Eastern Europe | 5 | 0.1% |
| England | 9 | 0.2% |
| Europe | 97 | 1.6% |
| Greece | 18 | 0.3% |
| India | 42 | 0.7% |
| Italy | 16 | 0.3% |
| Jamaica | 13 | 0.2% |
| Latin America | 54 | 0.9% |
| Mexico | 15 | 0.3% |
| Netherlands | 15 | 0.3% |
| Northern Europe | 43 | 0.7% |
| Philippines | 1 | 0.0% |
| Poland | 5 | 0.1% |
| South America | 5 | 0.1% |
| South Central Asia | 42 | 0.7% |
| South Eastern Asia | 1 | 0.0% |
| Southern Europe | 34 | 0.6% |
| Taiwan | 36 | 0.6% |
| Western Europe | 15 | 0.3% | View All 26 Rows |
Sex and Age in Yarmouth
Sex and Age in Yarmouth
The most populous age groups in Yarmouth are 15 to 19 Years (395 | 14.7%) for men and 50 to 54 Years (426 | 13.1%) for women.
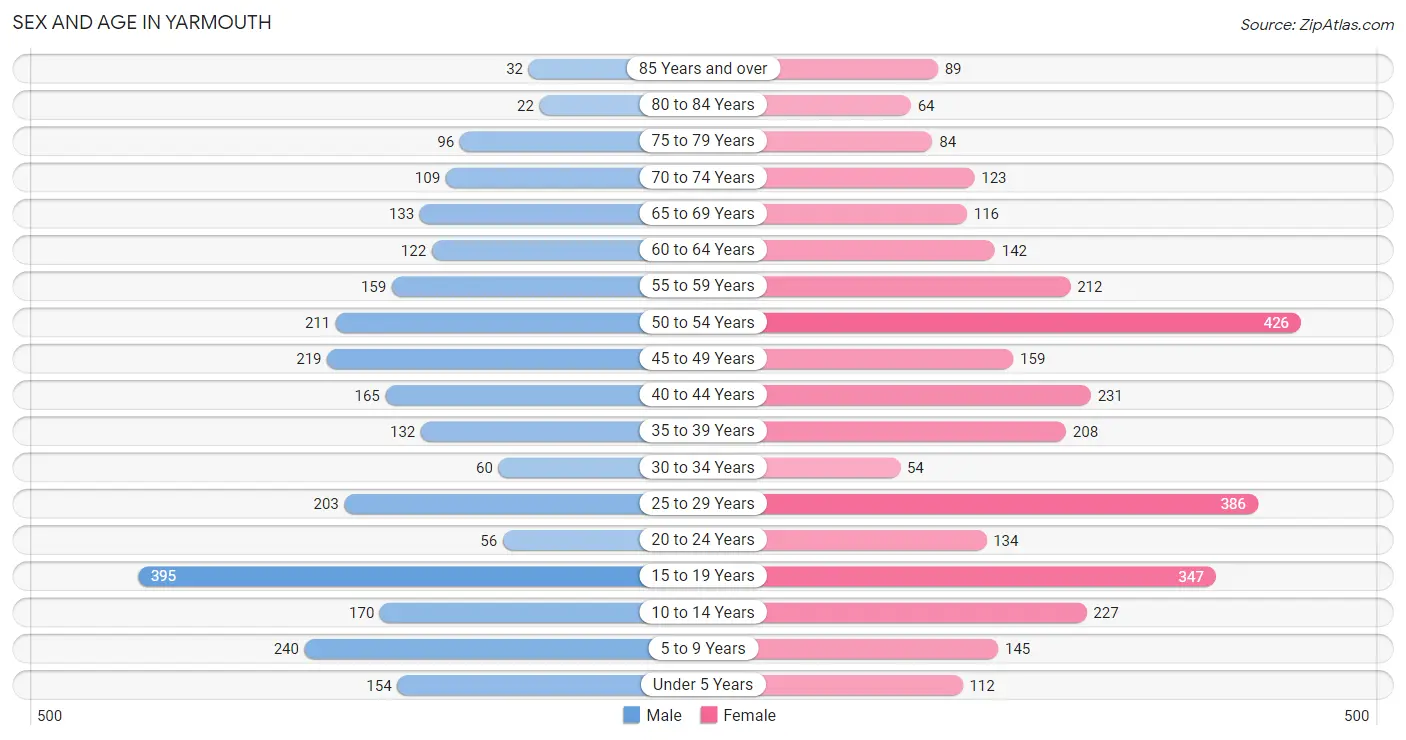
| Age Bracket | Male | Female |
| Under 5 Years | 154 (5.8%) | 112 (3.4%) |
| 5 to 9 Years | 240 (9.0%) | 145 (4.4%) |
| 10 to 14 Years | 170 (6.4%) | 227 (7.0%) |
| 15 to 19 Years | 395 (14.7%) | 347 (10.6%) |
| 20 to 24 Years | 56 (2.1%) | 134 (4.1%) |
| 25 to 29 Years | 203 (7.6%) | 386 (11.8%) |
| 30 to 34 Years | 60 (2.2%) | 54 (1.7%) |
| 35 to 39 Years | 132 (4.9%) | 208 (6.4%) |
| 40 to 44 Years | 165 (6.2%) | 231 (7.1%) |
| 45 to 49 Years | 219 (8.2%) | 159 (4.9%) |
| 50 to 54 Years | 211 (7.9%) | 426 (13.1%) |
| 55 to 59 Years | 159 (5.9%) | 212 (6.5%) |
| 60 to 64 Years | 122 (4.6%) | 142 (4.4%) |
| 65 to 69 Years | 133 (5.0%) | 116 (3.6%) |
| 70 to 74 Years | 109 (4.1%) | 123 (3.8%) |
| 75 to 79 Years | 96 (3.6%) | 84 (2.6%) |
| 80 to 84 Years | 22 (0.8%) | 64 (2.0%) |
| 85 Years and over | 32 (1.2%) | 89 (2.7%) |
| Total | 2,678 (100.0%) | 3,259 (100.0%) |
Families and Households in Yarmouth
Median Family Size in Yarmouth
The median family size in Yarmouth is 2.98 persons per family, with married-couple families (988 | 67.5%) accounting for the largest median family size of 3.04 persons per family. On the other hand, single male/father families (82 | 5.6%) represent the smallest median family size with 2.34 persons per family.
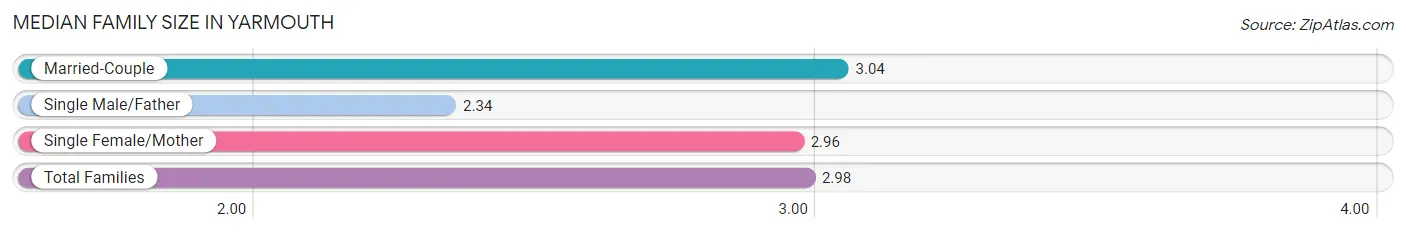
| Family Type | # Families | Family Size |
| Married-Couple | 988 (67.5%) | 3.04 |
| Single Male/Father | 82 (5.6%) | 2.34 |
| Single Female/Mother | 394 (26.9%) | 2.96 |
| Total Families | 1,464 (100.0%) | 2.98 |
Median Household Size in Yarmouth
The median household size in Yarmouth is 2.61 persons per household, with single female/mother households (394 | 17.8%) accounting for the largest median household size of 3.95 persons per household. non-family households (753 | 34.0%) represent the smallest median household size with 1.25 persons per household.
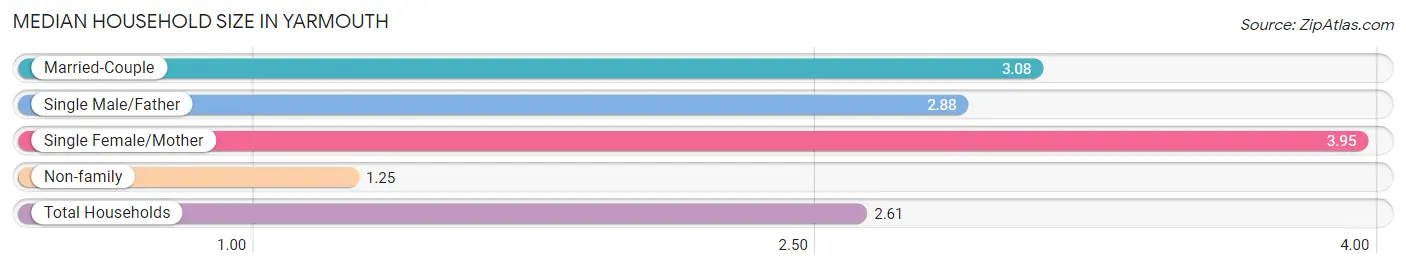
| Household Type | # Households | Household Size |
| Married-Couple | 988 (44.6%) | 3.08 |
| Single Male/Father | 82 (3.7%) | 2.88 |
| Single Female/Mother | 394 (17.8%) | 3.95 |
| Non-family | 753 (34.0%) | 1.25 |
| Total Households | 2,217 (100.0%) | 2.61 |
Household Size by Marriage Status in Yarmouth
Out of a total of 2,217 households in Yarmouth, 1,464 (66.0%) are family households, while 753 (34.0%) are nonfamily households. The most numerous type of family households are 2-person households, comprising 556, and the most common type of nonfamily households are 1-person households, comprising 569.
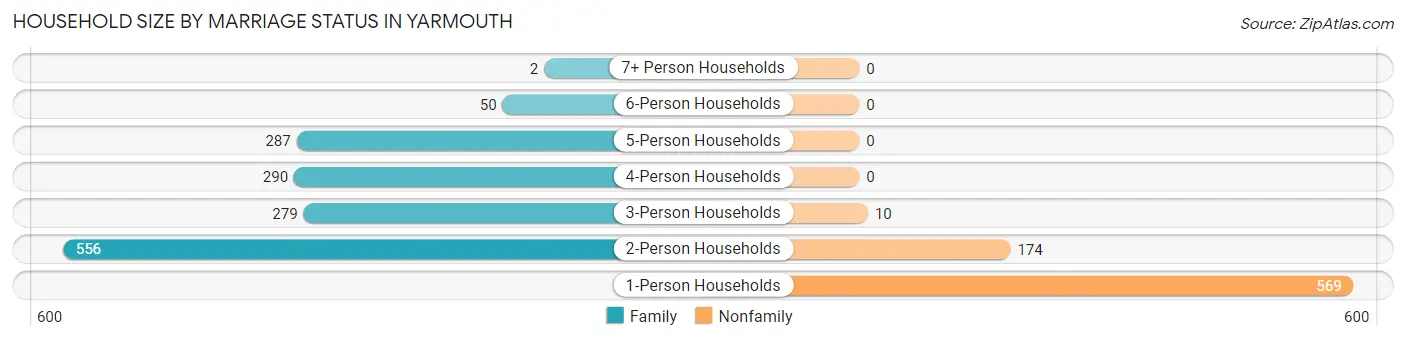
| Household Size | Family Households | Nonfamily Households |
| 1-Person Households | - | 569 (25.7%) |
| 2-Person Households | 556 (25.1%) | 174 (7.9%) |
| 3-Person Households | 279 (12.6%) | 10 (0.4%) |
| 4-Person Households | 290 (13.1%) | 0 (0.0%) |
| 5-Person Households | 287 (13.0%) | 0 (0.0%) |
| 6-Person Households | 50 (2.3%) | 0 (0.0%) |
| 7+ Person Households | 2 (0.1%) | 0 (0.0%) |
| Total | 1,464 (66.0%) | 753 (34.0%) |
Female Fertility in Yarmouth
Fertility by Age in Yarmouth
Average fertility rate in Yarmouth is 40.0 births per 1,000 women. Women in the age bracket of 20 to 34 years have the highest fertility rate with 78.0 births per 1,000 women. Women in the age bracket of 20 to 34 years acount for 72.6% of all women with births.
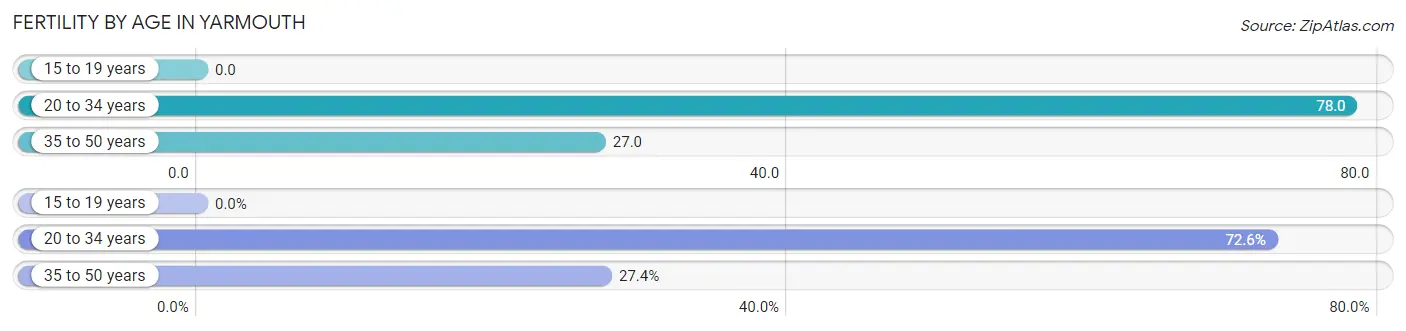
| Age Bracket | Women with Births | Births / 1,000 Women |
| 15 to 19 years | 0 (0.0%) | 0.0 |
| 20 to 34 years | 45 (72.6%) | 78.0 |
| 35 to 50 years | 17 (27.4%) | 27.0 |
| Total | 62 (100.0%) | 40.0 |
Fertility by Age by Marriage Status in Yarmouth
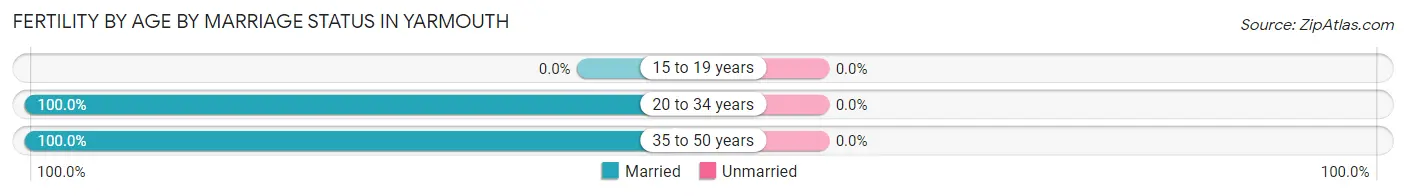
| Age Bracket | Married | Unmarried |
| 15 to 19 years | 0 (0.0%) | 0 (0.0%) |
| 20 to 34 years | 45 (100.0%) | 0 (0.0%) |
| 35 to 50 years | 17 (100.0%) | 0 (0.0%) |
| Total | 62 (100.0%) | 0 (0.0%) |
Fertility by Education in Yarmouth
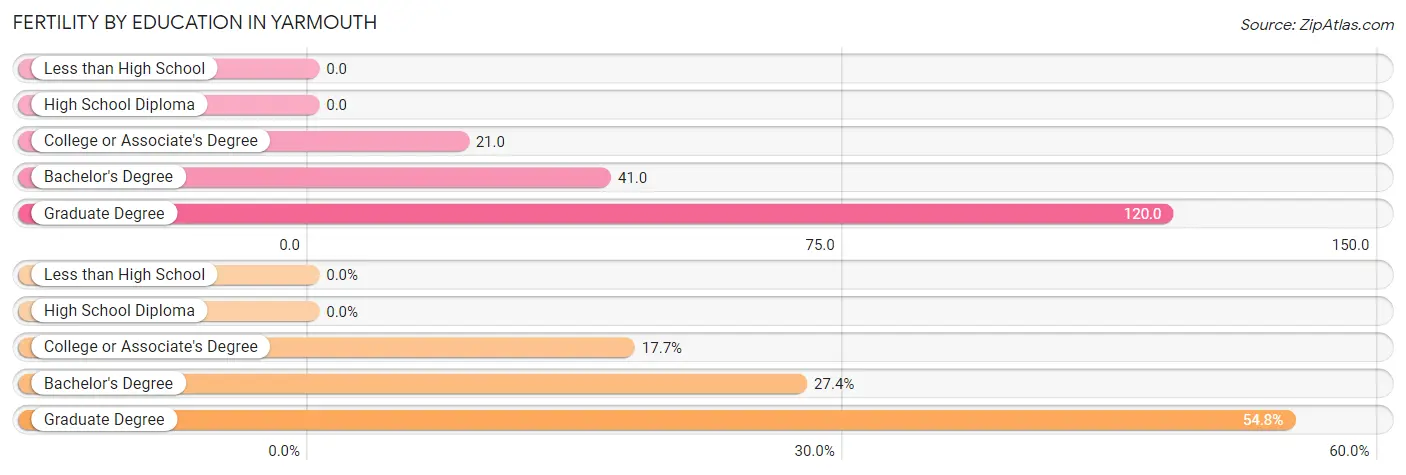
| Educational Attainment | Women with Births | Births / 1,000 Women |
| Less than High School | 0 (0.0%) | 0.0 |
| High School Diploma | 0 (0.0%) | 0.0 |
| College or Associate's Degree | 11 (17.7%) | 21.0 |
| Bachelor's Degree | 17 (27.4%) | 41.0 |
| Graduate Degree | 34 (54.8%) | 120.0 |
| Total | 62 (100.0%) | 40.0 |
Fertility by Education by Marriage Status in Yarmouth
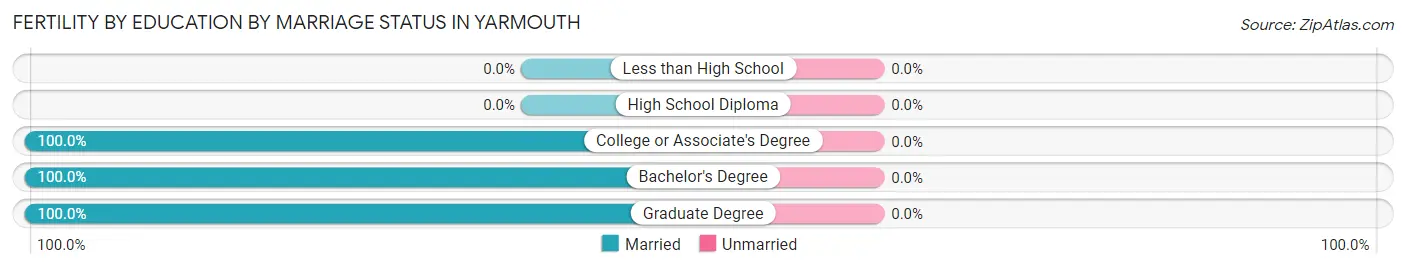
| Educational Attainment | Married | Unmarried |
| Less than High School | 0 (0.0%) | 0 (0.0%) |
| High School Diploma | 0 (0.0%) | 0 (0.0%) |
| College or Associate's Degree | 11 (100.0%) | 0 (0.0%) |
| Bachelor's Degree | 17 (100.0%) | 0 (0.0%) |
| Graduate Degree | 34 (100.0%) | 0 (0.0%) |
| Total | 62 (100.0%) | 0 (0.0%) |
Employment Characteristics in Yarmouth
Employment by Class of Employer in Yarmouth
Among the 3,203 employed individuals in Yarmouth, private company employees (1,632 | 50.9%), not-for-profit organizations (622 | 19.4%), and self-employed (not incorporated) (492 | 15.4%) make up the most common classes of employment.
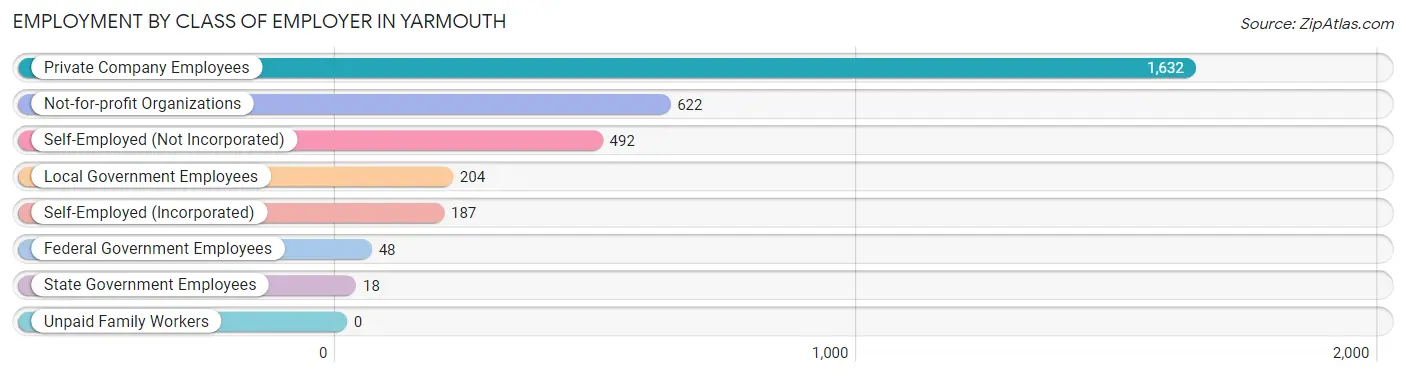
| Employer Class | # Employees | % Employees |
| Private Company Employees | 1,632 | 50.9% |
| Self-Employed (Incorporated) | 187 | 5.8% |
| Self-Employed (Not Incorporated) | 492 | 15.4% |
| Not-for-profit Organizations | 622 | 19.4% |
| Local Government Employees | 204 | 6.4% |
| State Government Employees | 18 | 0.6% |
| Federal Government Employees | 48 | 1.5% |
| Unpaid Family Workers | 0 | 0.0% |
| Total | 3,203 | 100.0% |
Employment Status by Age in Yarmouth
According to the labor force statistics for Yarmouth, out of the total population over 16 years of age (4,697), 73.8% or 3,466 individuals are in the labor force, with 6.5% or 225 of them unemployed. The age group with the highest labor force participation rate is 25 to 29 years, with 99.7% or 587 individuals in the labor force. Within the labor force, the 16 to 19 years age range has the highest percentage of unemployed individuals, with 37.5% or 146 of them being unemployed.
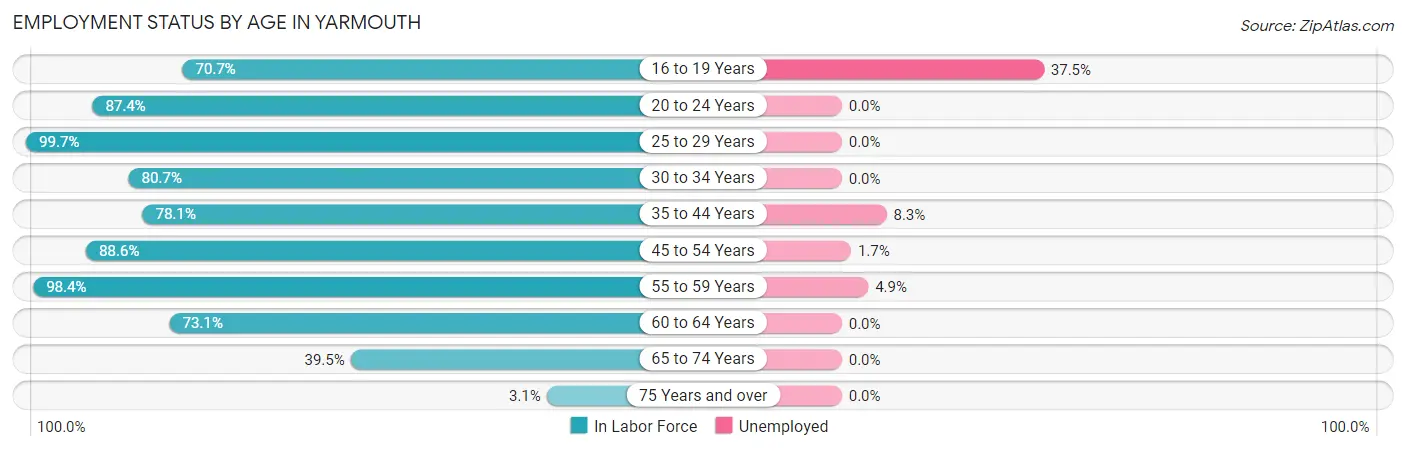
| Age Bracket | In Labor Force | Unemployed |
| 16 to 19 Years | 389 (70.7%) | 146 (37.5%) |
| 20 to 24 Years | 166 (87.4%) | 0 (0.0%) |
| 25 to 29 Years | 587 (99.7%) | 0 (0.0%) |
| 30 to 34 Years | 92 (80.7%) | 0 (0.0%) |
| 35 to 44 Years | 575 (78.1%) | 48 (8.3%) |
| 45 to 54 Years | 899 (88.6%) | 15 (1.7%) |
| 55 to 59 Years | 365 (98.4%) | 18 (4.9%) |
| 60 to 64 Years | 193 (73.1%) | 0 (0.0%) |
| 65 to 74 Years | 190 (39.5%) | 0 (0.0%) |
| 75 Years and over | 12 (3.1%) | 0 (0.0%) |
| Total | 3,466 (73.8%) | 225 (6.5%) |
Employment Status by Educational Attainment in Yarmouth
According to labor force statistics for Yarmouth, 87.8% of individuals (2,712) out of the total population between 25 and 64 years of age (3,089) are in the labor force, with 3.0% or 81 of them being unemployed. The group with the highest labor force participation rate are those with the educational attainment of college / associate degree, with 96.2% or 911 individuals in the labor force. Within the labor force, individuals with less than high school education have the highest percentage of unemployment, with 55.9% or 19 of them being unemployed.
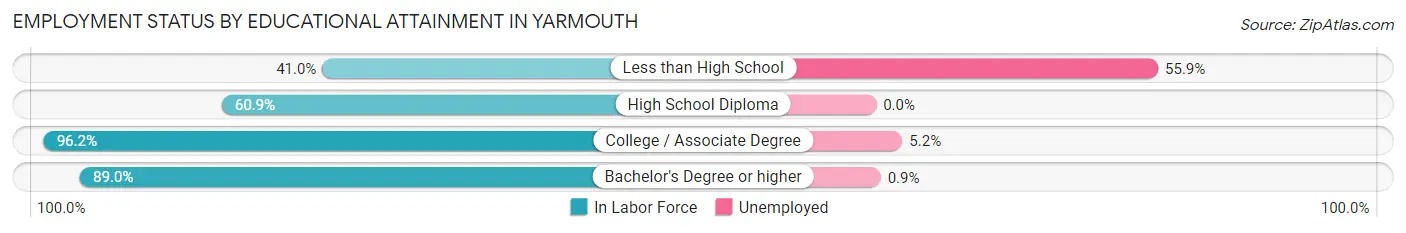
| Educational Attainment | In Labor Force | Unemployed |
| Less than High School | 34 (41.0%) | 46 (55.9%) |
| High School Diploma | 143 (60.9%) | 0 (0.0%) |
| College / Associate Degree | 911 (96.2%) | 49 (5.2%) |
| Bachelor's Degree or higher | 1,623 (89.0%) | 16 (0.9%) |
| Total | 2,712 (87.8%) | 93 (3.0%) |
Employment Occupations by Sex in Yarmouth
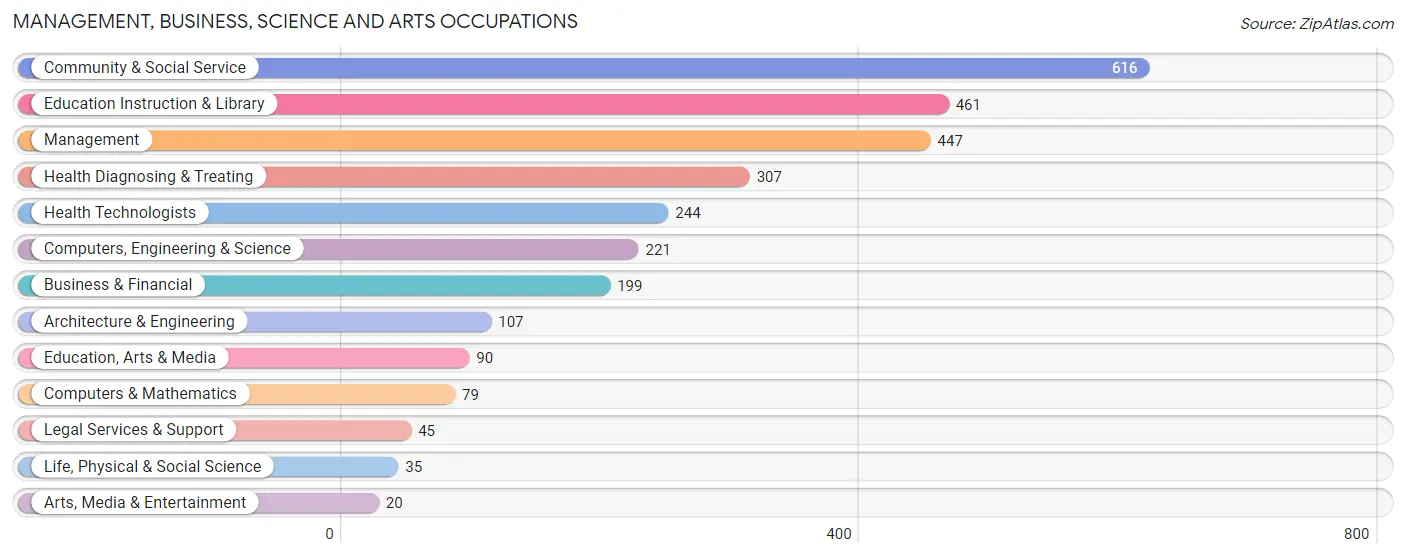
Management, Business, Science and Arts Occupations
The most common Management, Business, Science and Arts occupations in Yarmouth are Community & Social Service (616 | 19.0%), Education Instruction & Library (461 | 14.2%), Management (447 | 13.8%), Health Diagnosing & Treating (307 | 9.5%), and Health Technologists (244 | 7.5%).
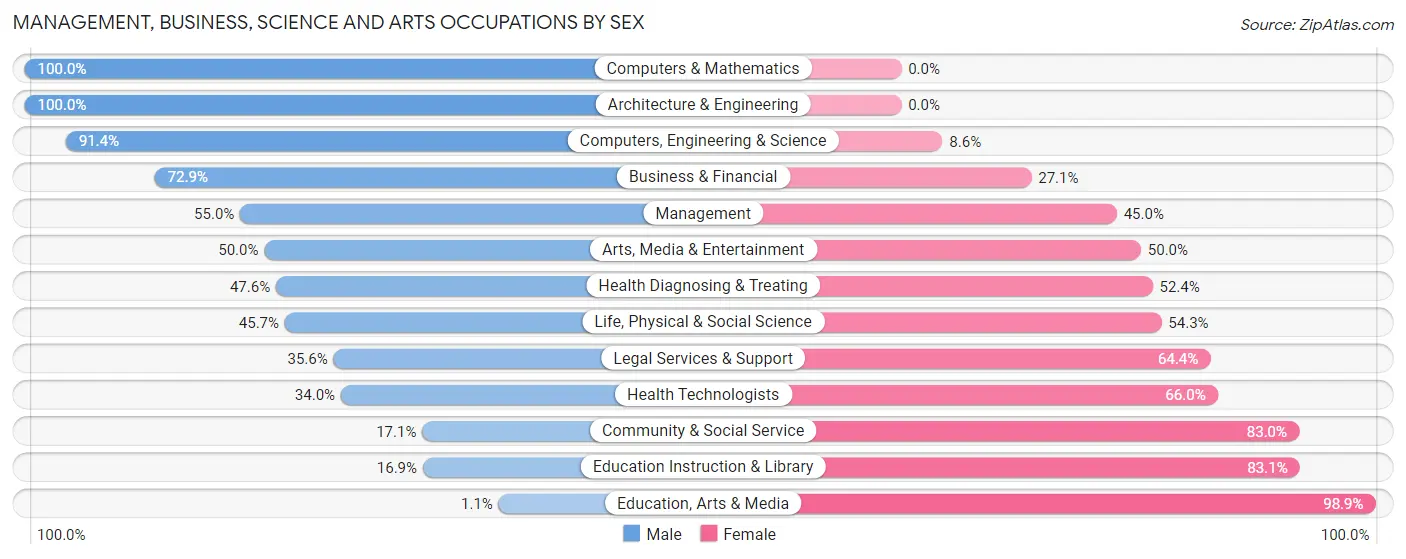
Management, Business, Science and Arts Occupations by Sex
Within the Management, Business, Science and Arts occupations in Yarmouth, the most male-oriented occupations are Computers & Mathematics (100.0%), Architecture & Engineering (100.0%), and Computers, Engineering & Science (91.4%), while the most female-oriented occupations are Education, Arts & Media (98.9%), Education Instruction & Library (83.1%), and Community & Social Service (83.0%).
| Occupation | Male | Female |
| Management | 246 (55.0%) | 201 (45.0%) |
| Business & Financial | 145 (72.9%) | 54 (27.1%) |
| Computers, Engineering & Science | 202 (91.4%) | 19 (8.6%) |
| Computers & Mathematics | 79 (100.0%) | 0 (0.0%) |
| Architecture & Engineering | 107 (100.0%) | 0 (0.0%) |
| Life, Physical & Social Science | 16 (45.7%) | 19 (54.3%) |
| Community & Social Service | 105 (17.1%) | 511 (83.0%) |
| Education, Arts & Media | 1 (1.1%) | 89 (98.9%) |
| Legal Services & Support | 16 (35.6%) | 29 (64.4%) |
| Education Instruction & Library | 78 (16.9%) | 383 (83.1%) |
| Arts, Media & Entertainment | 10 (50.0%) | 10 (50.0%) |
| Health Diagnosing & Treating | 146 (47.6%) | 161 (52.4%) |
| Health Technologists | 83 (34.0%) | 161 (66.0%) |
| Total (Category) | 844 (47.1%) | 946 (52.8%) |
| Total (Overall) | 1,326 (40.9%) | 1,915 (59.1%) |
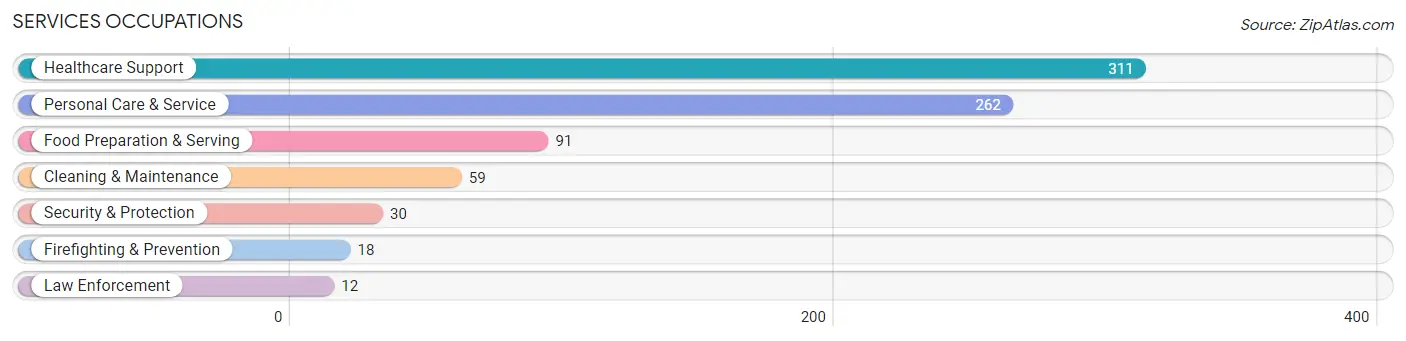
Services Occupations
The most common Services occupations in Yarmouth are Healthcare Support (311 | 9.6%), Personal Care & Service (262 | 8.1%), Food Preparation & Serving (91 | 2.8%), Cleaning & Maintenance (59 | 1.8%), and Security & Protection (30 | 0.9%).
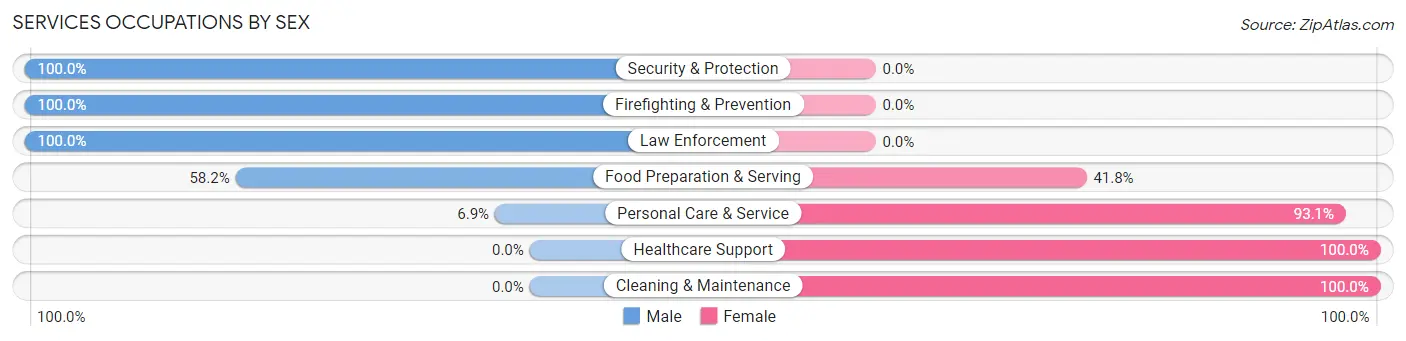
Services Occupations by Sex
Within the Services occupations in Yarmouth, the most male-oriented occupations are Security & Protection (100.0%), Firefighting & Prevention (100.0%), and Law Enforcement (100.0%), while the most female-oriented occupations are Healthcare Support (100.0%), Cleaning & Maintenance (100.0%), and Personal Care & Service (93.1%).
| Occupation | Male | Female |
| Healthcare Support | 0 (0.0%) | 311 (100.0%) |
| Security & Protection | 30 (100.0%) | 0 (0.0%) |
| Firefighting & Prevention | 18 (100.0%) | 0 (0.0%) |
| Law Enforcement | 12 (100.0%) | 0 (0.0%) |
| Food Preparation & Serving | 53 (58.2%) | 38 (41.8%) |
| Cleaning & Maintenance | 0 (0.0%) | 59 (100.0%) |
| Personal Care & Service | 18 (6.9%) | 244 (93.1%) |
| Total (Category) | 101 (13.4%) | 652 (86.6%) |
| Total (Overall) | 1,326 (40.9%) | 1,915 (59.1%) |
Sales and Office Occupations
The most common Sales and Office occupations in Yarmouth are Office & Administration (253 | 7.8%), and Sales & Related (162 | 5.0%).

Sales and Office Occupations by Sex
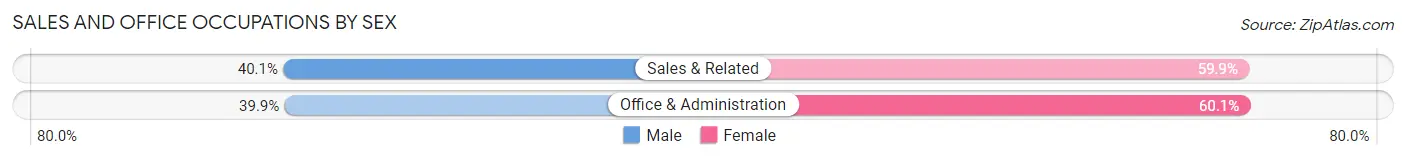
| Occupation | Male | Female |
| Sales & Related | 65 (40.1%) | 97 (59.9%) |
| Office & Administration | 101 (39.9%) | 152 (60.1%) |
| Total (Category) | 166 (40.0%) | 249 (60.0%) |
| Total (Overall) | 1,326 (40.9%) | 1,915 (59.1%) |
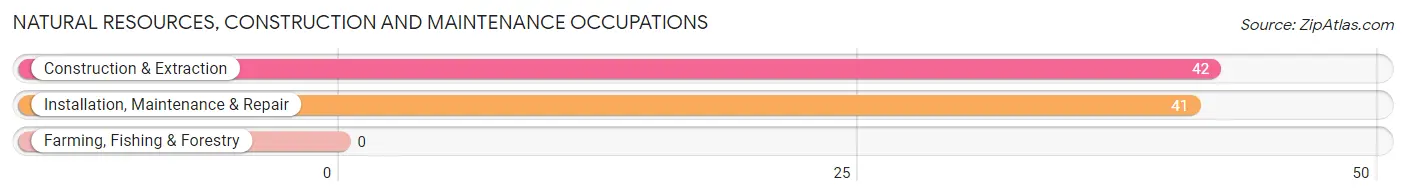
Natural Resources, Construction and Maintenance Occupations
The most common Natural Resources, Construction and Maintenance occupations in Yarmouth are Construction & Extraction (42 | 1.3%), and Installation, Maintenance & Repair (41 | 1.3%).
Natural Resources, Construction and Maintenance Occupations by Sex
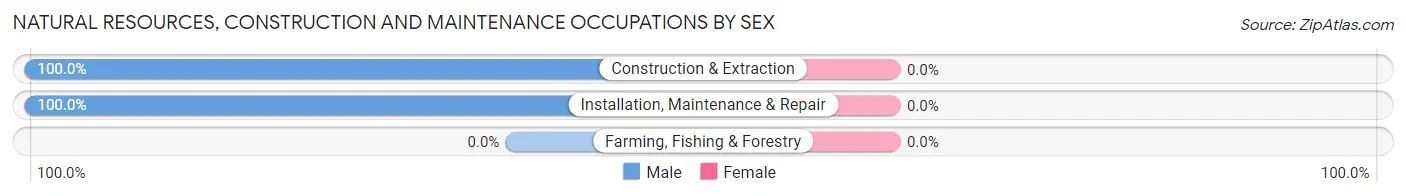
| Occupation | Male | Female |
| Farming, Fishing & Forestry | 0 (0.0%) | 0 (0.0%) |
| Construction & Extraction | 42 (100.0%) | 0 (0.0%) |
| Installation, Maintenance & Repair | 41 (100.0%) | 0 (0.0%) |
| Total (Category) | 83 (100.0%) | 0 (0.0%) |
| Total (Overall) | 1,326 (40.9%) | 1,915 (59.1%) |
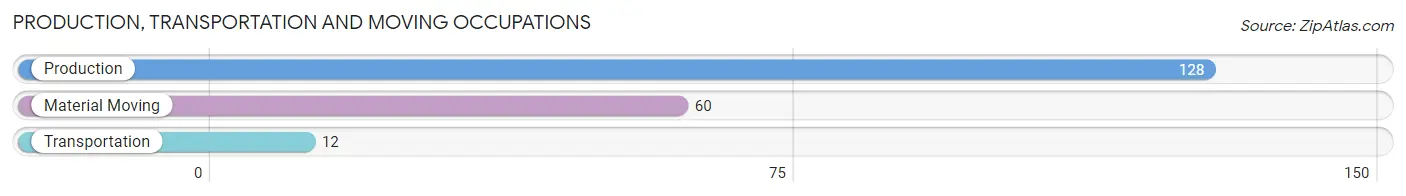
Production, Transportation and Moving Occupations
The most common Production, Transportation and Moving occupations in Yarmouth are Production (128 | 4.0%), Material Moving (60 | 1.8%), and Transportation (12 | 0.4%).
Production, Transportation and Moving Occupations by Sex
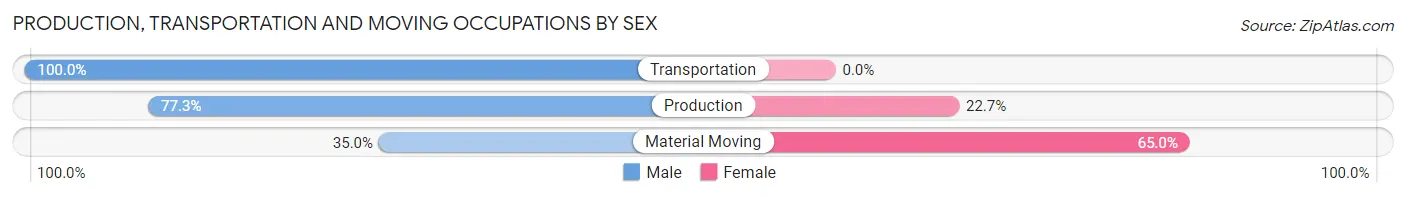
| Occupation | Male | Female |
| Production | 99 (77.3%) | 29 (22.7%) |
| Transportation | 12 (100.0%) | 0 (0.0%) |
| Material Moving | 21 (35.0%) | 39 (65.0%) |
| Total (Category) | 132 (66.0%) | 68 (34.0%) |
| Total (Overall) | 1,326 (40.9%) | 1,915 (59.1%) |
Employment Industries by Sex in Yarmouth
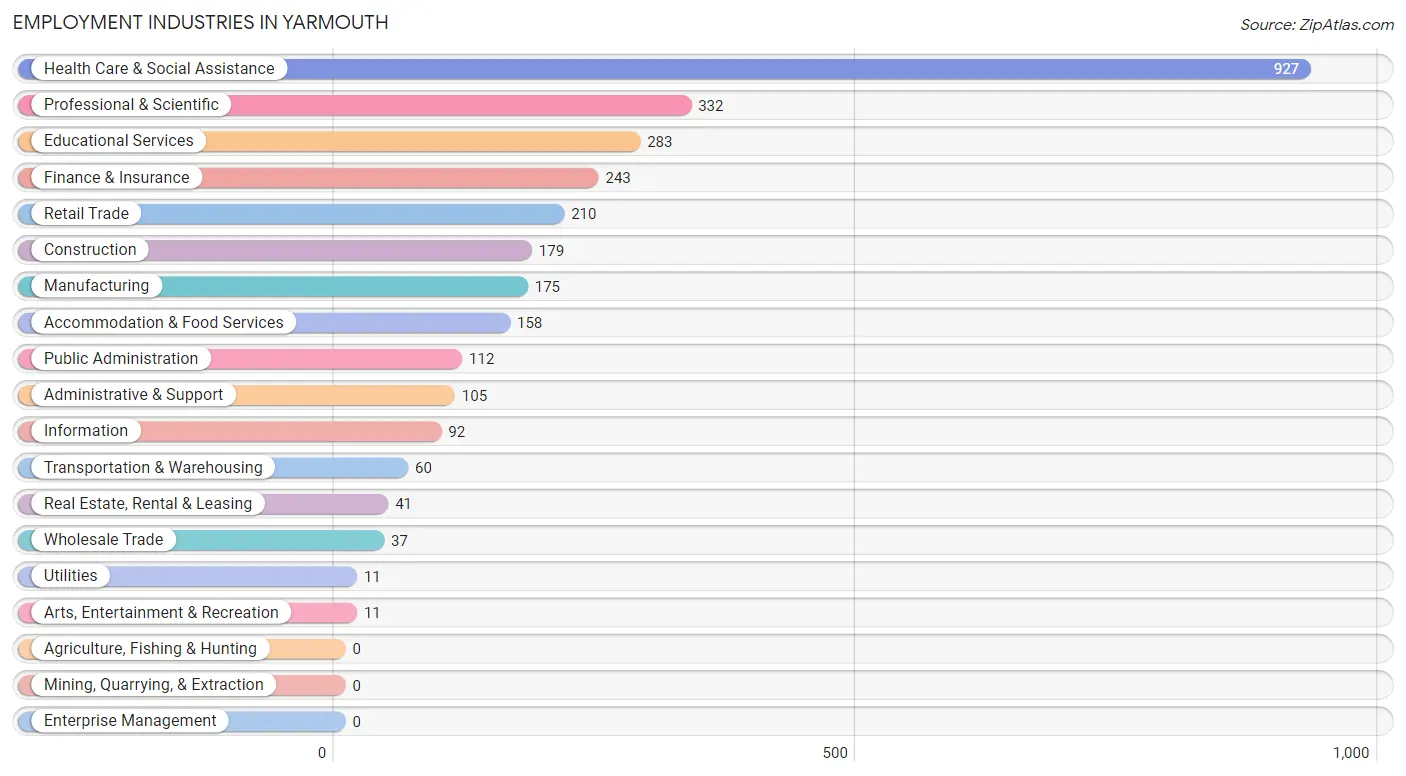
Employment Industries in Yarmouth
The major employment industries in Yarmouth include Health Care & Social Assistance (927 | 28.6%), Professional & Scientific (332 | 10.2%), Educational Services (283 | 8.7%), Finance & Insurance (243 | 7.5%), and Retail Trade (210 | 6.5%).
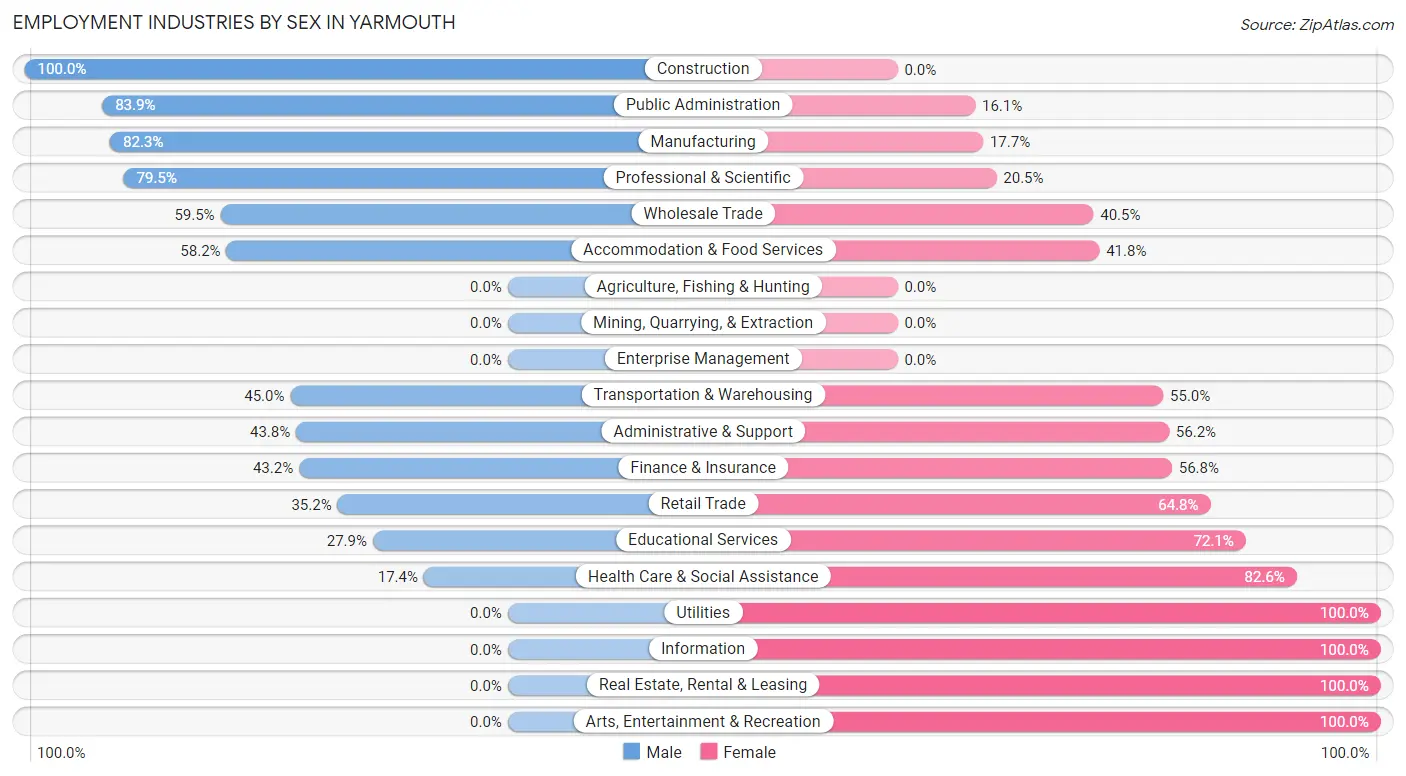
Employment Industries by Sex in Yarmouth
The Yarmouth industries that see more men than women are Construction (100.0%), Public Administration (83.9%), and Manufacturing (82.3%), whereas the industries that tend to have a higher number of women are Utilities (100.0%), Information (100.0%), and Real Estate, Rental & Leasing (100.0%).
| Industry | Male | Female |
| Agriculture, Fishing & Hunting | 0 (0.0%) | 0 (0.0%) |
| Mining, Quarrying, & Extraction | 0 (0.0%) | 0 (0.0%) |
| Construction | 179 (100.0%) | 0 (0.0%) |
| Manufacturing | 144 (82.3%) | 31 (17.7%) |
| Wholesale Trade | 22 (59.5%) | 15 (40.5%) |
| Retail Trade | 74 (35.2%) | 136 (64.8%) |
| Transportation & Warehousing | 27 (45.0%) | 33 (55.0%) |
| Utilities | 0 (0.0%) | 11 (100.0%) |
| Information | 0 (0.0%) | 92 (100.0%) |
| Finance & Insurance | 105 (43.2%) | 138 (56.8%) |
| Real Estate, Rental & Leasing | 0 (0.0%) | 41 (100.0%) |
| Professional & Scientific | 264 (79.5%) | 68 (20.5%) |
| Enterprise Management | 0 (0.0%) | 0 (0.0%) |
| Administrative & Support | 46 (43.8%) | 59 (56.2%) |
| Educational Services | 79 (27.9%) | 204 (72.1%) |
| Health Care & Social Assistance | 161 (17.4%) | 766 (82.6%) |
| Arts, Entertainment & Recreation | 0 (0.0%) | 11 (100.0%) |
| Accommodation & Food Services | 92 (58.2%) | 66 (41.8%) |
| Public Administration | 94 (83.9%) | 18 (16.1%) |
| Total | 1,326 (40.9%) | 1,915 (59.1%) |
Education in Yarmouth
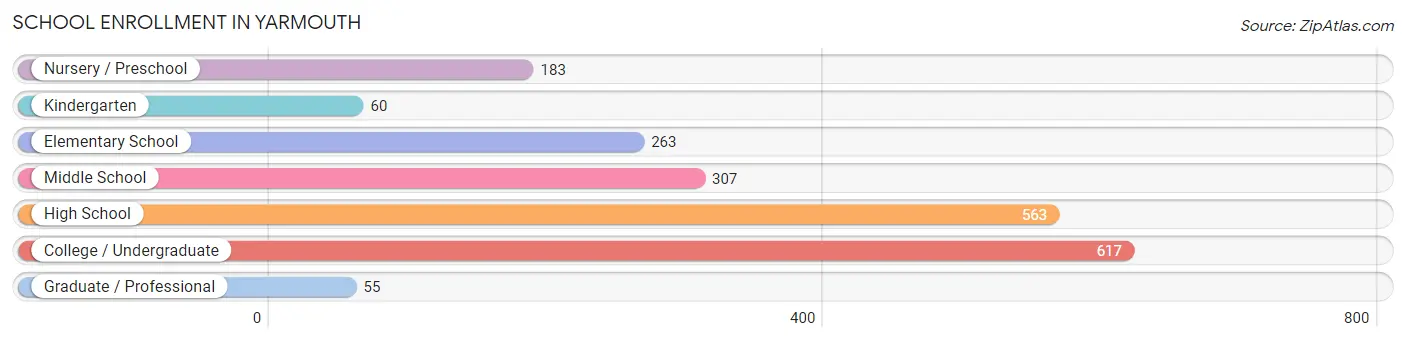
School Enrollment in Yarmouth
The most common levels of schooling among the 2,048 students in Yarmouth are college / undergraduate (617 | 30.1%), high school (563 | 27.5%), and middle school (307 | 15.0%).
| School Level | # Students | % Students |
| Nursery / Preschool | 183 | 8.9% |
| Kindergarten | 60 | 2.9% |
| Elementary School | 263 | 12.8% |
| Middle School | 307 | 15.0% |
| High School | 563 | 27.5% |
| College / Undergraduate | 617 | 30.1% |
| Graduate / Professional | 55 | 2.7% |
| Total | 2,048 | 100.0% |
School Enrollment by Age by Funding Source in Yarmouth
Out of a total of 2,048 students who are enrolled in schools in Yarmouth, 657 (32.1%) attend a private institution, while the remaining 1,391 (67.9%) are enrolled in public schools. The age group of 18 to 19 year olds has the highest likelihood of being enrolled in private schools, with 181 (89.6% in the age bracket) enrolled. Conversely, the age group of 10 to 14 year olds has the lowest likelihood of being enrolled in a private school, with 367 (100.0% in the age bracket) attending a public institution.
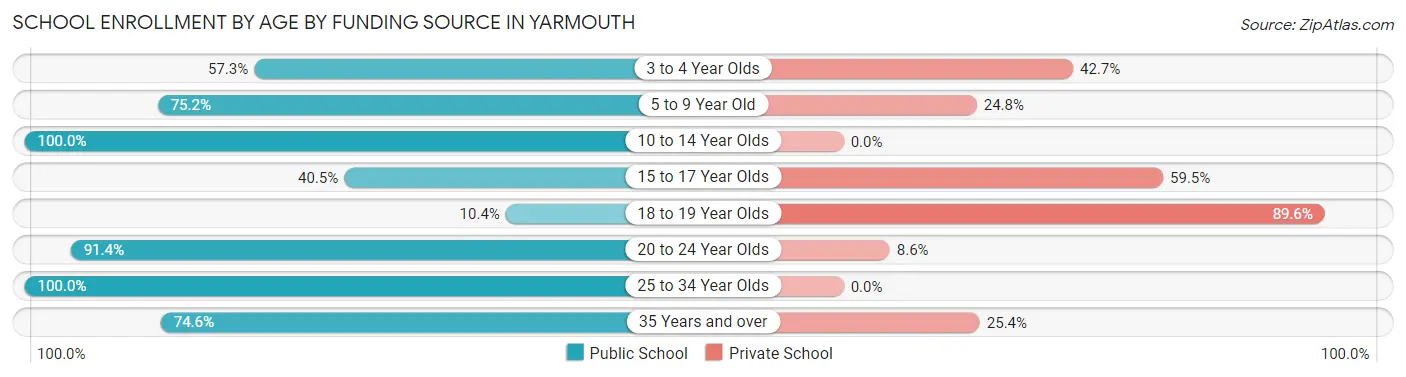
| Age Bracket | Public School | Private School |
| 3 to 4 Year Olds | 67 (57.3%) | 50 (42.7%) |
| 5 to 9 Year Old | 279 (75.2%) | 92 (24.8%) |
| 10 to 14 Year Olds | 367 (100.0%) | 0 (0.0%) |
| 15 to 17 Year Olds | 211 (40.5%) | 310 (59.5%) |
| 18 to 19 Year Olds | 21 (10.4%) | 181 (89.6%) |
| 20 to 24 Year Olds | 85 (91.4%) | 8 (8.6%) |
| 25 to 34 Year Olds | 310 (100.0%) | 0 (0.0%) |
| 35 Years and over | 50 (74.6%) | 17 (25.4%) |
| Total | 1,391 (67.9%) | 657 (32.1%) |
Educational Attainment by Field of Study in Yarmouth
Social sciences (364 | 13.9%), business (324 | 12.4%), education (295 | 11.3%), science & technology (269 | 10.3%), and liberal arts & history (264 | 10.1%) are the most common fields of study among 2,614 individuals in Yarmouth who have obtained a bachelor's degree or higher.
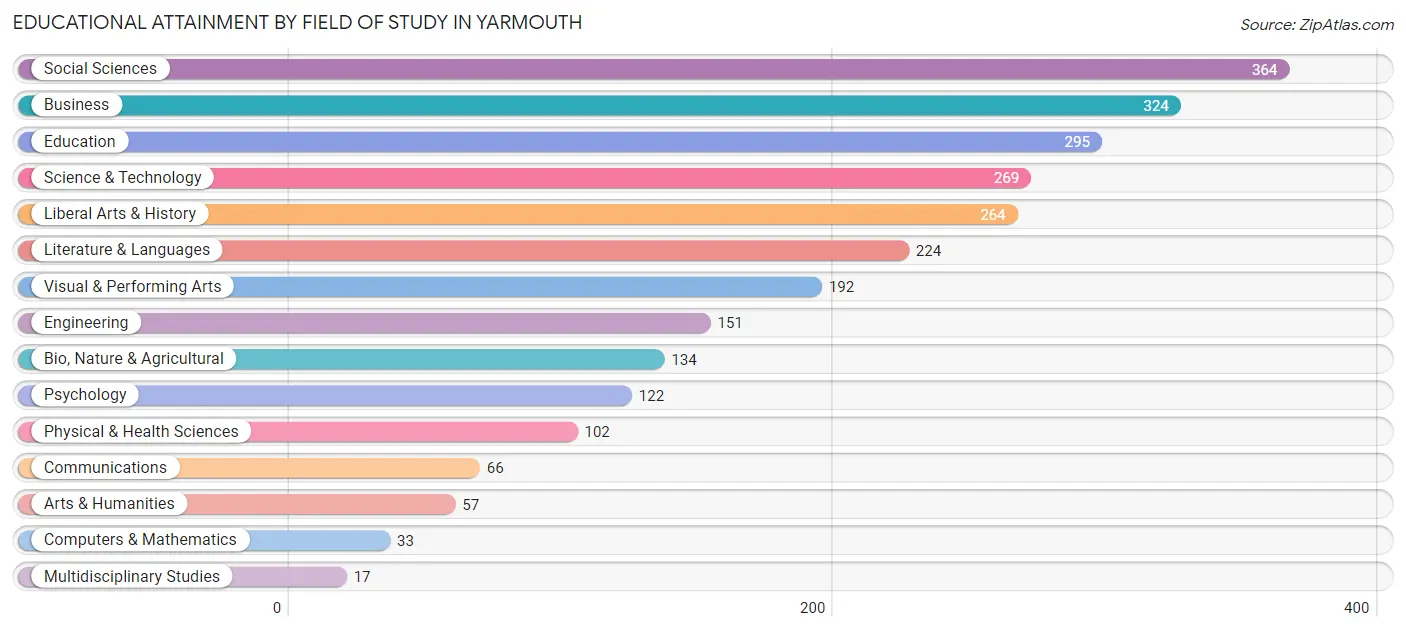
| Field of Study | # Graduates | % Graduates |
| Computers & Mathematics | 33 | 1.3% |
| Bio, Nature & Agricultural | 134 | 5.1% |
| Physical & Health Sciences | 102 | 3.9% |
| Psychology | 122 | 4.7% |
| Social Sciences | 364 | 13.9% |
| Engineering | 151 | 5.8% |
| Multidisciplinary Studies | 17 | 0.6% |
| Science & Technology | 269 | 10.3% |
| Business | 324 | 12.4% |
| Education | 295 | 11.3% |
| Literature & Languages | 224 | 8.6% |
| Liberal Arts & History | 264 | 10.1% |
| Visual & Performing Arts | 192 | 7.3% |
| Communications | 66 | 2.5% |
| Arts & Humanities | 57 | 2.2% |
| Total | 2,614 | 100.0% |
Transportation & Commute in Yarmouth
Vehicle Availability by Sex in Yarmouth
The most prevalent vehicle ownership categories in Yarmouth are males with 2 vehicles (740, accounting for 56.3%) and females with 2 vehicles (829, making up 39.2%).
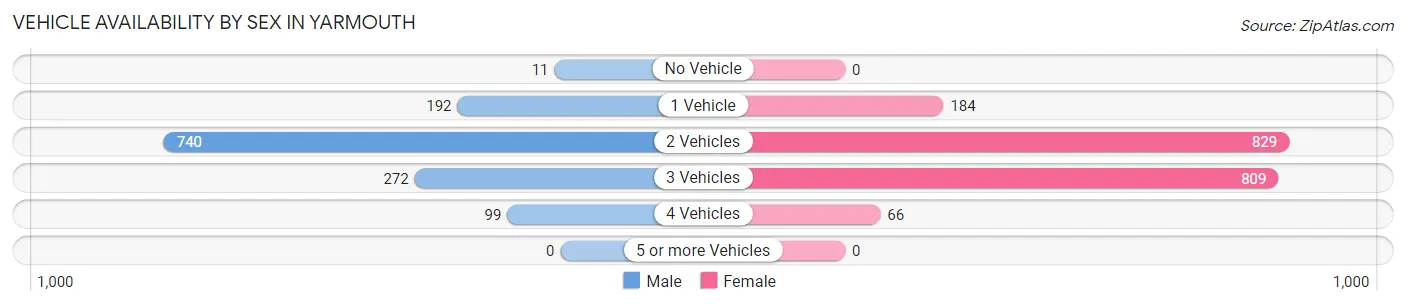
| Vehicles Available | Male | Female |
| No Vehicle | 11 (0.8%) | 0 (0.0%) |
| 1 Vehicle | 192 (14.6%) | 184 (9.8%) |
| 2 Vehicles | 740 (56.3%) | 829 (43.9%) |
| 3 Vehicles | 272 (20.7%) | 809 (42.8%) |
| 4 Vehicles | 99 (7.5%) | 66 (3.5%) |
| 5 or more Vehicles | 0 (0.0%) | 0 (0.0%) |
| Total | 1,314 (100.0%) | 1,888 (100.0%) |
Commute Time in Yarmouth
The most frequently occuring commute durations in Yarmouth are 20 to 24 minutes (507 commuters, 18.7%), 25 to 29 minutes (462 commuters, 17.0%), and 10 to 14 minutes (413 commuters, 15.2%).
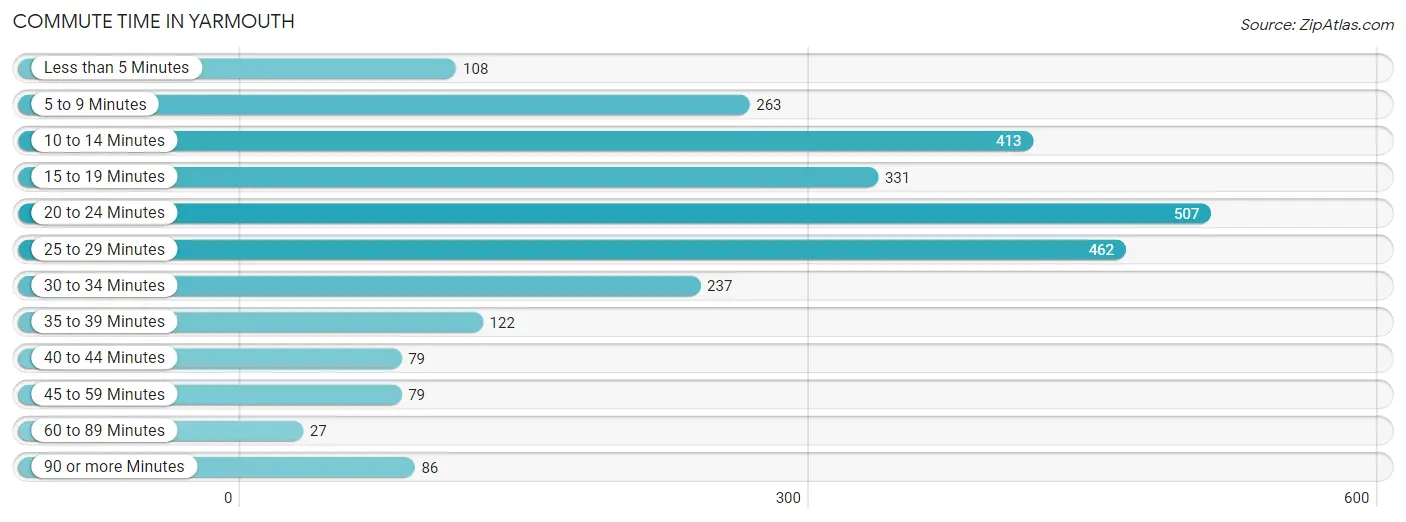
| Commute Time | # Commuters | % Commuters |
| Less than 5 Minutes | 108 | 4.0% |
| 5 to 9 Minutes | 263 | 9.7% |
| 10 to 14 Minutes | 413 | 15.2% |
| 15 to 19 Minutes | 331 | 12.2% |
| 20 to 24 Minutes | 507 | 18.7% |
| 25 to 29 Minutes | 462 | 17.0% |
| 30 to 34 Minutes | 237 | 8.7% |
| 35 to 39 Minutes | 122 | 4.5% |
| 40 to 44 Minutes | 79 | 2.9% |
| 45 to 59 Minutes | 79 | 2.9% |
| 60 to 89 Minutes | 27 | 1.0% |
| 90 or more Minutes | 86 | 3.2% |
Commute Time by Sex in Yarmouth
The most common commute times in Yarmouth are 15 to 19 minutes (219 commuters, 20.3%) for males and 25 to 29 minutes (373 commuters, 22.8%) for females.
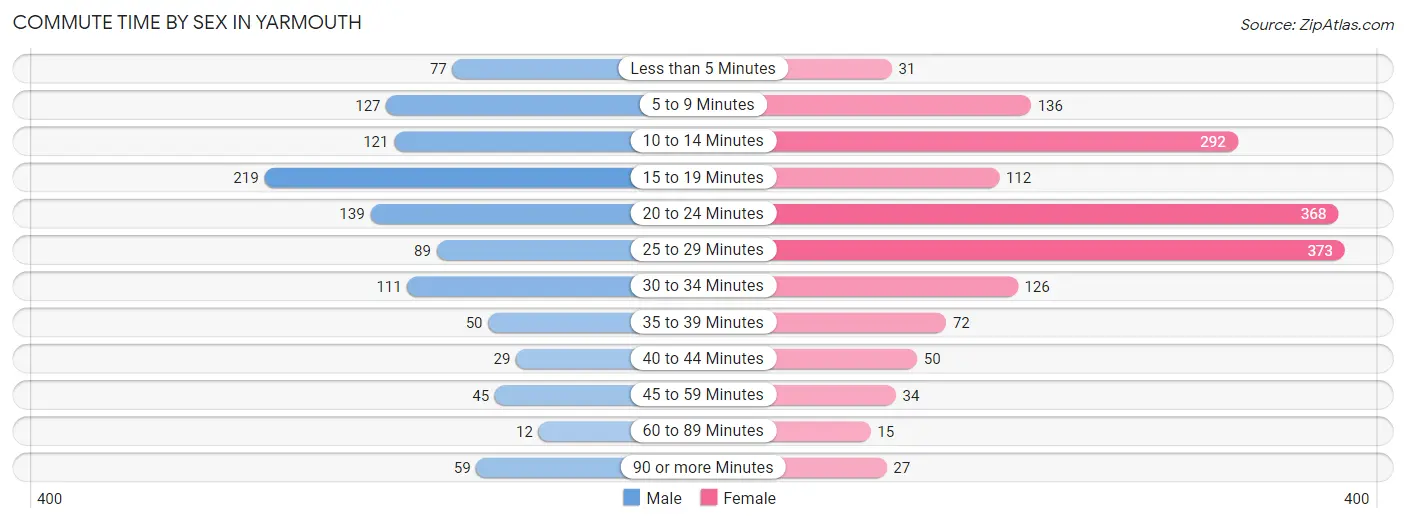
| Commute Time | Male | Female |
| Less than 5 Minutes | 77 (7.1%) | 31 (1.9%) |
| 5 to 9 Minutes | 127 (11.8%) | 136 (8.3%) |
| 10 to 14 Minutes | 121 (11.2%) | 292 (17.8%) |
| 15 to 19 Minutes | 219 (20.3%) | 112 (6.9%) |
| 20 to 24 Minutes | 139 (12.9%) | 368 (22.5%) |
| 25 to 29 Minutes | 89 (8.3%) | 373 (22.8%) |
| 30 to 34 Minutes | 111 (10.3%) | 126 (7.7%) |
| 35 to 39 Minutes | 50 (4.6%) | 72 (4.4%) |
| 40 to 44 Minutes | 29 (2.7%) | 50 (3.1%) |
| 45 to 59 Minutes | 45 (4.2%) | 34 (2.1%) |
| 60 to 89 Minutes | 12 (1.1%) | 15 (0.9%) |
| 90 or more Minutes | 59 (5.5%) | 27 (1.7%) |
Time of Departure to Work by Sex in Yarmouth
The most frequent times of departure to work in Yarmouth are 7:30 AM to 7:59 AM (228, 21.1%) for males and 7:30 AM to 7:59 AM (439, 26.8%) for females.
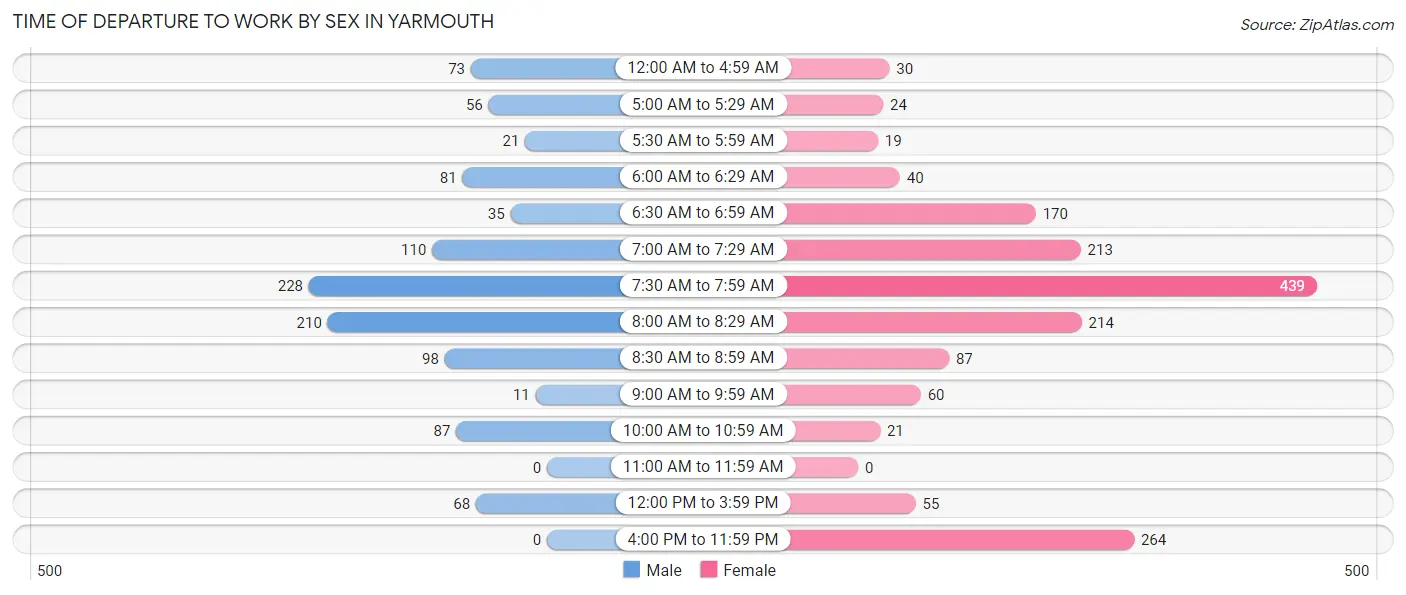
| Time of Departure | Male | Female |
| 12:00 AM to 4:59 AM | 73 (6.8%) | 30 (1.8%) |
| 5:00 AM to 5:29 AM | 56 (5.2%) | 24 (1.5%) |
| 5:30 AM to 5:59 AM | 21 (1.9%) | 19 (1.2%) |
| 6:00 AM to 6:29 AM | 81 (7.5%) | 40 (2.4%) |
| 6:30 AM to 6:59 AM | 35 (3.3%) | 170 (10.4%) |
| 7:00 AM to 7:29 AM | 110 (10.2%) | 213 (13.0%) |
| 7:30 AM to 7:59 AM | 228 (21.1%) | 439 (26.8%) |
| 8:00 AM to 8:29 AM | 210 (19.5%) | 214 (13.1%) |
| 8:30 AM to 8:59 AM | 98 (9.1%) | 87 (5.3%) |
| 9:00 AM to 9:59 AM | 11 (1.0%) | 60 (3.7%) |
| 10:00 AM to 10:59 AM | 87 (8.1%) | 21 (1.3%) |
| 11:00 AM to 11:59 AM | 0 (0.0%) | 0 (0.0%) |
| 12:00 PM to 3:59 PM | 68 (6.3%) | 55 (3.4%) |
| 4:00 PM to 11:59 PM | 0 (0.0%) | 264 (16.1%) |
| Total | 1,078 (100.0%) | 1,636 (100.0%) |
Housing Occupancy in Yarmouth
Occupancy by Ownership in Yarmouth
Of the total 2,217 dwellings in Yarmouth, owner-occupied units account for 1,526 (68.8%), while renter-occupied units make up 691 (31.2%).
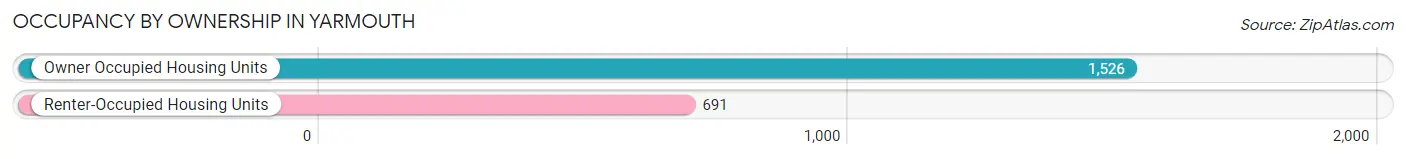
| Occupancy | # Housing Units | % Housing Units |
| Owner Occupied Housing Units | 1,526 | 68.8% |
| Renter-Occupied Housing Units | 691 | 31.2% |
| Total Occupied Housing Units | 2,217 | 100.0% |
Occupancy by Household Size in Yarmouth
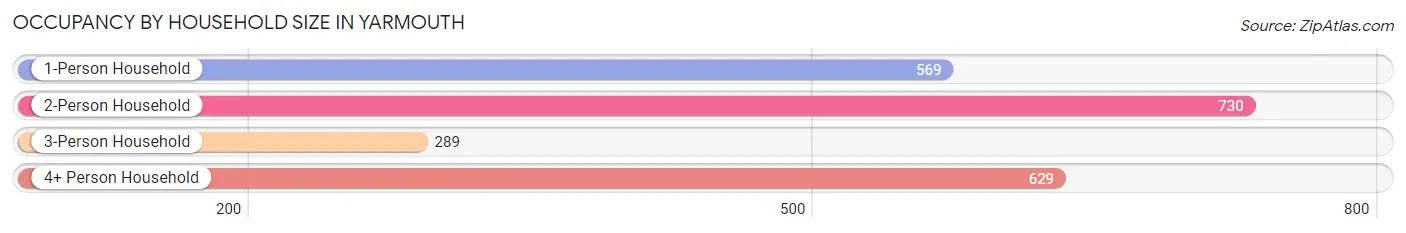
| Household Size | # Housing Units | % Housing Units |
| 1-Person Household | 569 | 25.7% |
| 2-Person Household | 730 | 32.9% |
| 3-Person Household | 289 | 13.0% |
| 4+ Person Household | 629 | 28.4% |
| Total Housing Units | 2,217 | 100.0% |
Occupancy by Ownership by Household Size in Yarmouth
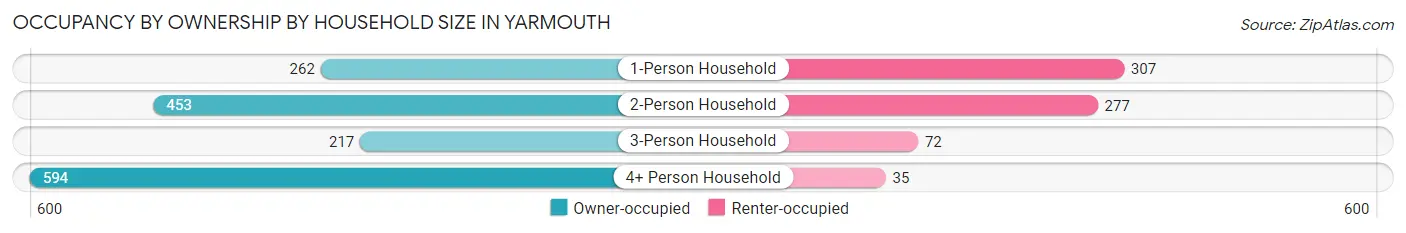
| Household Size | Owner-occupied | Renter-occupied |
| 1-Person Household | 262 (46.1%) | 307 (53.9%) |
| 2-Person Household | 453 (62.1%) | 277 (38.0%) |
| 3-Person Household | 217 (75.1%) | 72 (24.9%) |
| 4+ Person Household | 594 (94.4%) | 35 (5.6%) |
| Total Housing Units | 1,526 (68.8%) | 691 (31.2%) |
Occupancy by Educational Attainment in Yarmouth
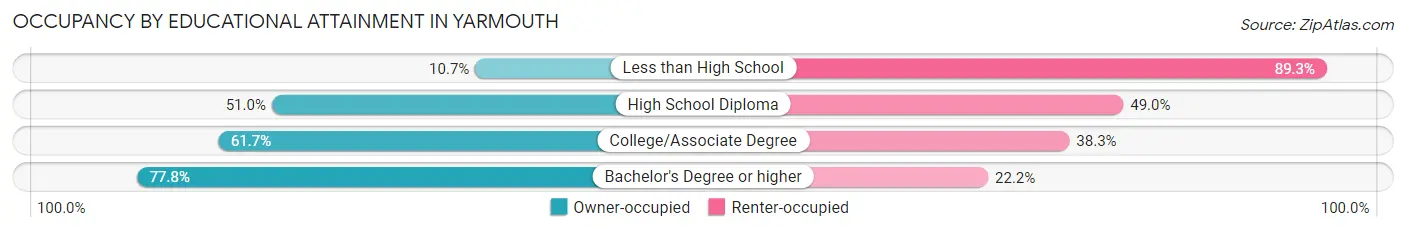
| Household Size | Owner-occupied | Renter-occupied |
| Less than High School | 8 (10.7%) | 67 (89.3%) |
| High School Diploma | 102 (51.0%) | 98 (49.0%) |
| College/Associate Degree | 364 (61.7%) | 226 (38.3%) |
| Bachelor's Degree or higher | 1,052 (77.8%) | 300 (22.2%) |
Occupancy by Age of Householder in Yarmouth
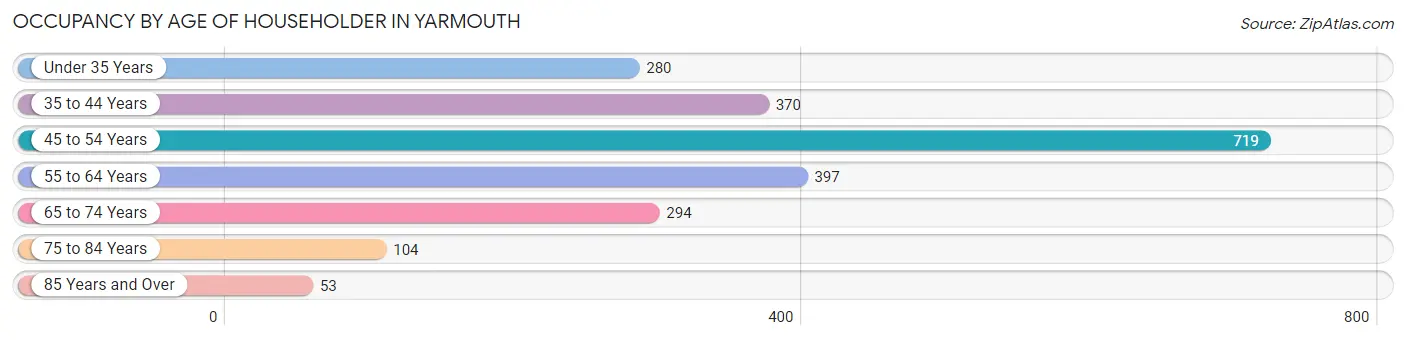
| Age Bracket | # Households | % Households |
| Under 35 Years | 280 | 12.6% |
| 35 to 44 Years | 370 | 16.7% |
| 45 to 54 Years | 719 | 32.4% |
| 55 to 64 Years | 397 | 17.9% |
| 65 to 74 Years | 294 | 13.3% |
| 75 to 84 Years | 104 | 4.7% |
| 85 Years and Over | 53 | 2.4% |
| Total | 2,217 | 100.0% |
Housing Finances in Yarmouth
Median Income by Occupancy in Yarmouth
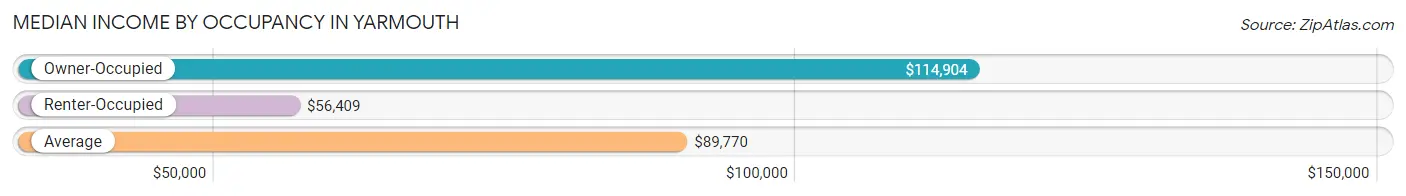
| Occupancy Type | # Households | Median Income |
| Owner-Occupied | 1,526 (68.8%) | $114,904 |
| Renter-Occupied | 691 (31.2%) | $56,409 |
| Average | 2,217 (100.0%) | $89,770 |
Occupancy by Householder Income Bracket in Yarmouth
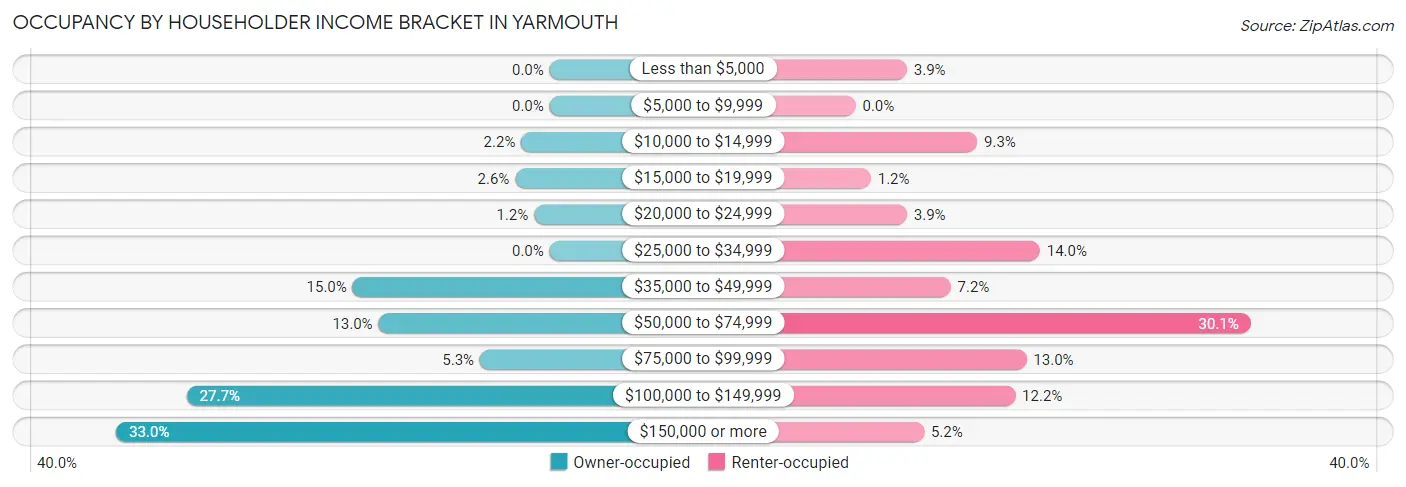
| Income Bracket | Owner-occupied | Renter-occupied |
| Less than $5,000 | 0 (0.0%) | 27 (3.9%) |
| $5,000 to $9,999 | 0 (0.0%) | 0 (0.0%) |
| $10,000 to $14,999 | 33 (2.2%) | 64 (9.3%) |
| $15,000 to $19,999 | 40 (2.6%) | 8 (1.2%) |
| $20,000 to $24,999 | 18 (1.2%) | 27 (3.9%) |
| $25,000 to $34,999 | 0 (0.0%) | 97 (14.0%) |
| $35,000 to $49,999 | 229 (15.0%) | 50 (7.2%) |
| $50,000 to $74,999 | 199 (13.0%) | 208 (30.1%) |
| $75,000 to $99,999 | 81 (5.3%) | 90 (13.0%) |
| $100,000 to $149,999 | 422 (27.7%) | 84 (12.2%) |
| $150,000 or more | 504 (33.0%) | 36 (5.2%) |
| Total | 1,526 (100.0%) | 691 (100.0%) |
Monthly Housing Cost Tiers in Yarmouth
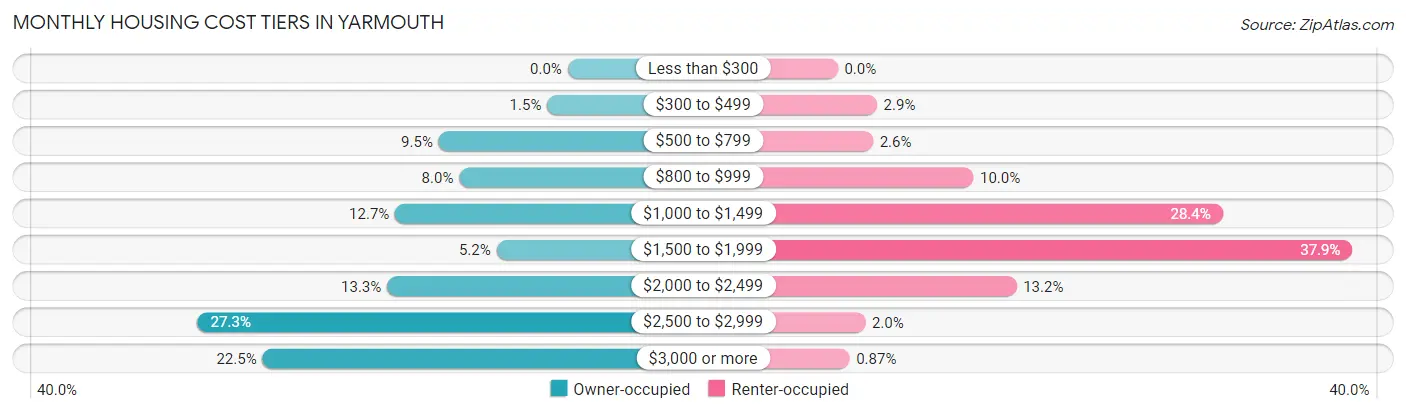
| Monthly Cost | Owner-occupied | Renter-occupied |
| Less than $300 | 0 (0.0%) | 0 (0.0%) |
| $300 to $499 | 23 (1.5%) | 20 (2.9%) |
| $500 to $799 | 145 (9.5%) | 18 (2.6%) |
| $800 to $999 | 122 (8.0%) | 69 (10.0%) |
| $1,000 to $1,499 | 194 (12.7%) | 196 (28.4%) |
| $1,500 to $1,999 | 80 (5.2%) | 262 (37.9%) |
| $2,000 to $2,499 | 203 (13.3%) | 91 (13.2%) |
| $2,500 to $2,999 | 416 (27.3%) | 14 (2.0%) |
| $3,000 or more | 343 (22.5%) | 6 (0.9%) |
| Total | 1,526 (100.0%) | 691 (100.0%) |
Physical Housing Characteristics in Yarmouth
Housing Structures in Yarmouth
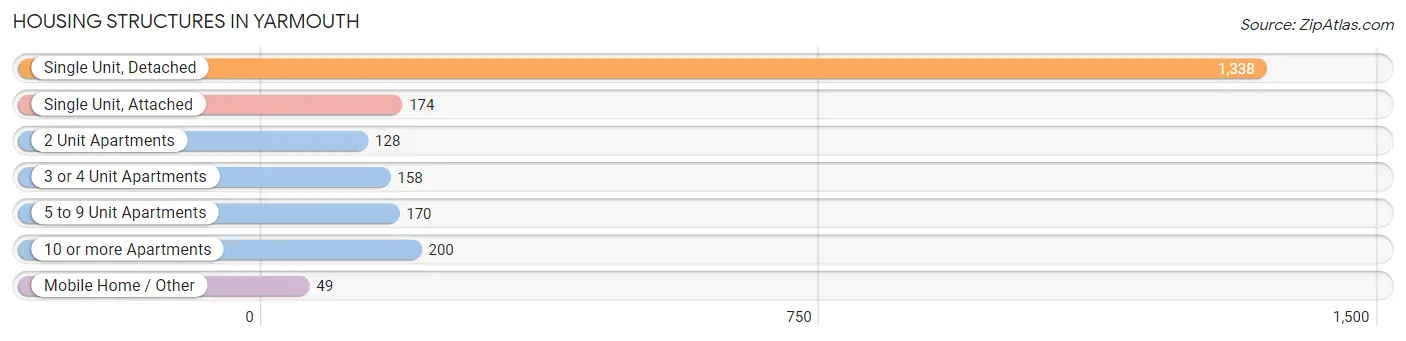
| Structure Type | # Housing Units | % Housing Units |
| Single Unit, Detached | 1,338 | 60.4% |
| Single Unit, Attached | 174 | 7.9% |
| 2 Unit Apartments | 128 | 5.8% |
| 3 or 4 Unit Apartments | 158 | 7.1% |
| 5 to 9 Unit Apartments | 170 | 7.7% |
| 10 or more Apartments | 200 | 9.0% |
| Mobile Home / Other | 49 | 2.2% |
| Total | 2,217 | 100.0% |
Housing Structures by Occupancy in Yarmouth
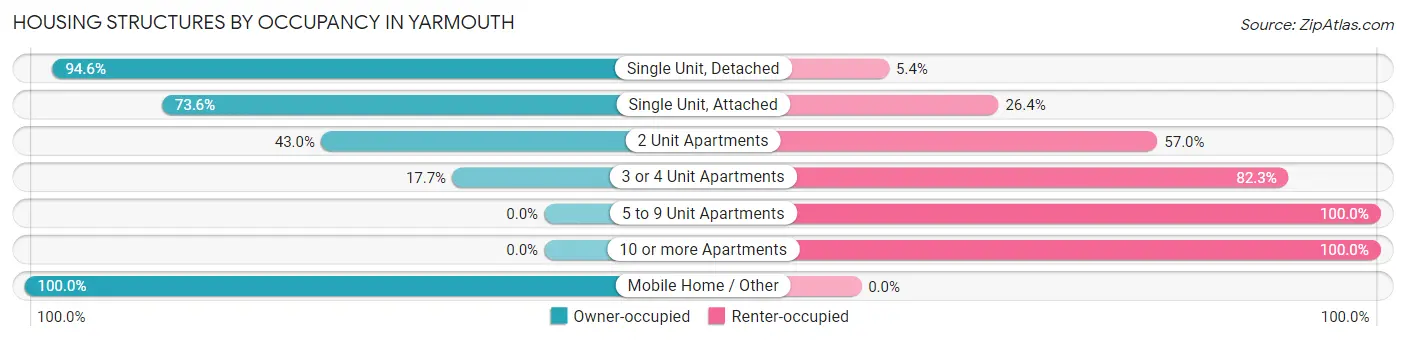
| Structure Type | Owner-occupied | Renter-occupied |
| Single Unit, Detached | 1,266 (94.6%) | 72 (5.4%) |
| Single Unit, Attached | 128 (73.6%) | 46 (26.4%) |
| 2 Unit Apartments | 55 (43.0%) | 73 (57.0%) |
| 3 or 4 Unit Apartments | 28 (17.7%) | 130 (82.3%) |
| 5 to 9 Unit Apartments | 0 (0.0%) | 170 (100.0%) |
| 10 or more Apartments | 0 (0.0%) | 200 (100.0%) |
| Mobile Home / Other | 49 (100.0%) | 0 (0.0%) |
| Total | 1,526 (68.8%) | 691 (31.2%) |
Housing Structures by Number of Rooms in Yarmouth
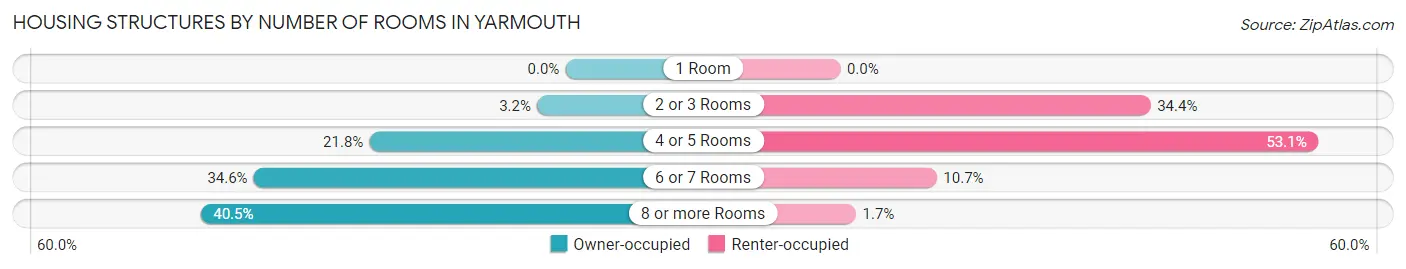
| Number of Rooms | Owner-occupied | Renter-occupied |
| 1 Room | 0 (0.0%) | 0 (0.0%) |
| 2 or 3 Rooms | 48 (3.2%) | 238 (34.4%) |
| 4 or 5 Rooms | 332 (21.8%) | 367 (53.1%) |
| 6 or 7 Rooms | 528 (34.6%) | 74 (10.7%) |
| 8 or more Rooms | 618 (40.5%) | 12 (1.7%) |
| Total | 1,526 (100.0%) | 691 (100.0%) |
Housing Structure by Heating Type in Yarmouth
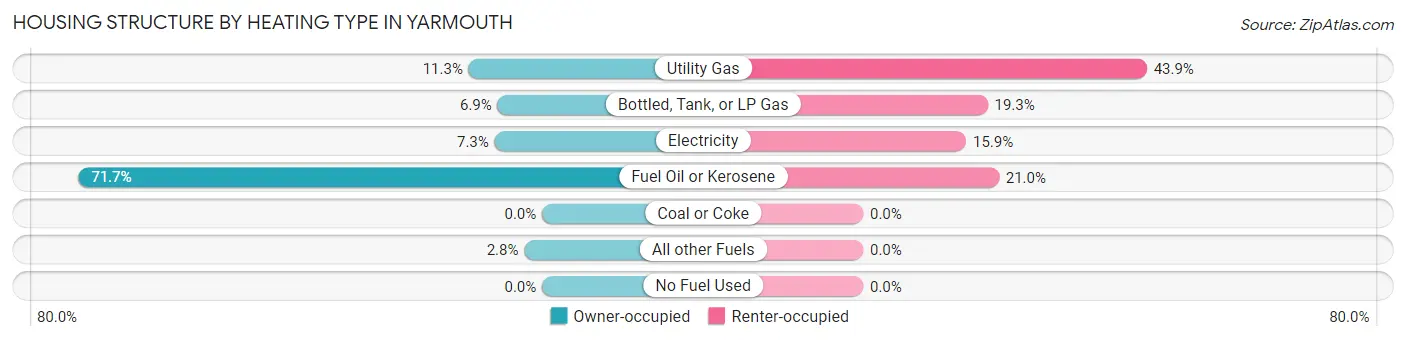
| Heating Type | Owner-occupied | Renter-occupied |
| Utility Gas | 173 (11.3%) | 303 (43.9%) |
| Bottled, Tank, or LP Gas | 105 (6.9%) | 133 (19.3%) |
| Electricity | 112 (7.3%) | 110 (15.9%) |
| Fuel Oil or Kerosene | 1,094 (71.7%) | 145 (21.0%) |
| Coal or Coke | 0 (0.0%) | 0 (0.0%) |
| All other Fuels | 42 (2.8%) | 0 (0.0%) |
| No Fuel Used | 0 (0.0%) | 0 (0.0%) |
| Total | 1,526 (100.0%) | 691 (100.0%) |
Household Vehicle Usage in Yarmouth
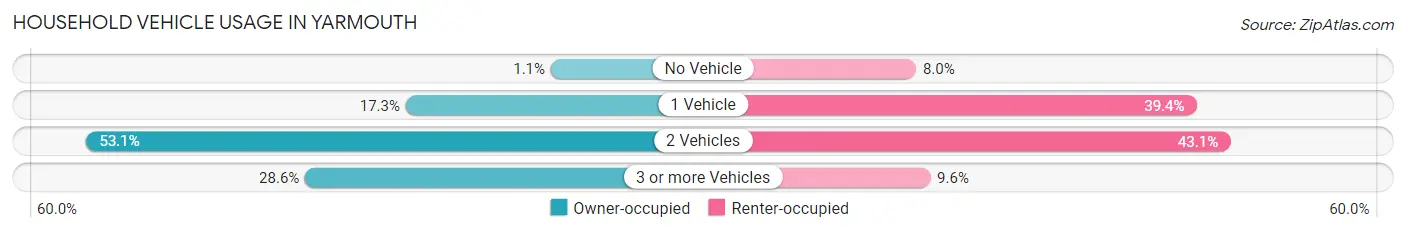
| Vehicles per Household | Owner-occupied | Renter-occupied |
| No Vehicle | 16 (1.1%) | 55 (8.0%) |
| 1 Vehicle | 264 (17.3%) | 272 (39.4%) |
| 2 Vehicles | 810 (53.1%) | 298 (43.1%) |
| 3 or more Vehicles | 436 (28.6%) | 66 (9.6%) |
| Total | 1,526 (100.0%) | 691 (100.0%) |
Real Estate & Mortgages in Yarmouth
Real Estate and Mortgage Overview in Yarmouth
| Characteristic | Without Mortgage | With Mortgage |
| Housing Units | 369 | 1,157 |
| Median Property Value | $416,800 | $504,600 |
| Median Household Income | $107,530 | $452 |
| Monthly Housing Costs | $881 | $343 |
| Real Estate Taxes | $5,226 | $0 |
Property Value by Mortgage Status in Yarmouth
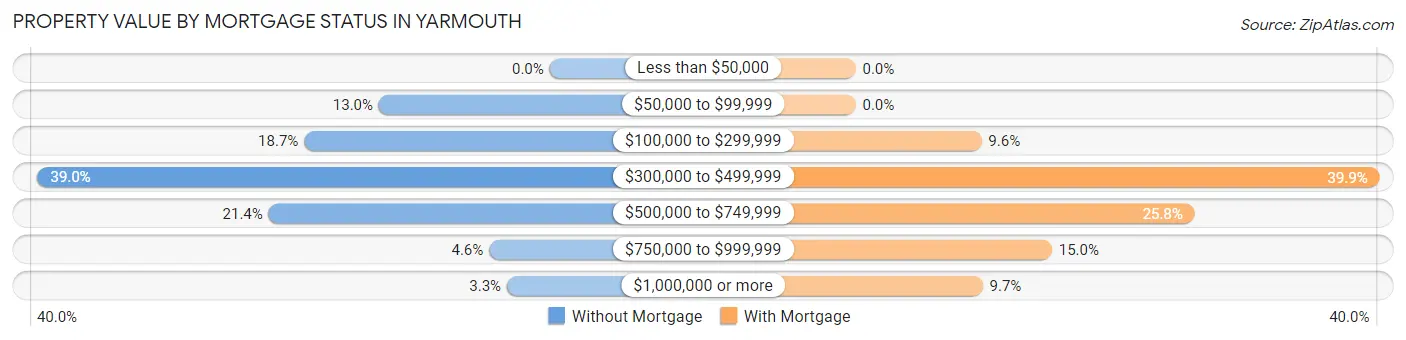
| Property Value | Without Mortgage | With Mortgage |
| Less than $50,000 | 0 (0.0%) | 0 (0.0%) |
| $50,000 to $99,999 | 48 (13.0%) | 0 (0.0%) |
| $100,000 to $299,999 | 69 (18.7%) | 111 (9.6%) |
| $300,000 to $499,999 | 144 (39.0%) | 462 (39.9%) |
| $500,000 to $749,999 | 79 (21.4%) | 299 (25.8%) |
| $750,000 to $999,999 | 17 (4.6%) | 173 (14.9%) |
| $1,000,000 or more | 12 (3.3%) | 112 (9.7%) |
| Total | 369 (100.0%) | 1,157 (100.0%) |
Household Income by Mortgage Status in Yarmouth
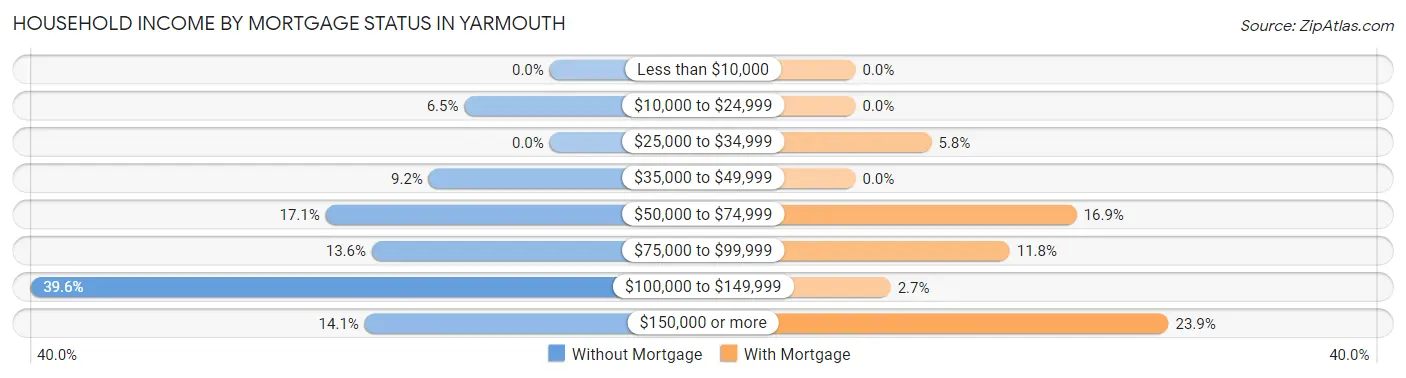
| Household Income | Without Mortgage | With Mortgage |
| Less than $10,000 | 0 (0.0%) | 0 (0.0%) |
| $10,000 to $24,999 | 24 (6.5%) | 0 (0.0%) |
| $25,000 to $34,999 | 0 (0.0%) | 67 (5.8%) |
| $35,000 to $49,999 | 34 (9.2%) | 0 (0.0%) |
| $50,000 to $74,999 | 63 (17.1%) | 195 (16.9%) |
| $75,000 to $99,999 | 50 (13.6%) | 136 (11.7%) |
| $100,000 to $149,999 | 146 (39.6%) | 31 (2.7%) |
| $150,000 or more | 52 (14.1%) | 276 (23.8%) |
| Total | 369 (100.0%) | 1,157 (100.0%) |
Property Value to Household Income Ratio in Yarmouth
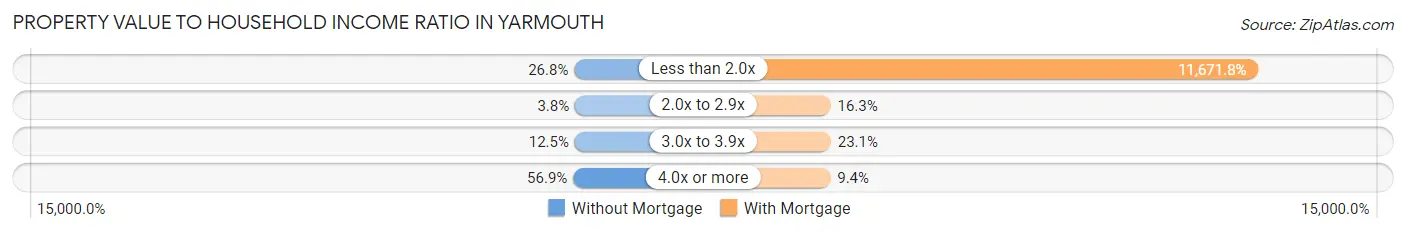
| Value-to-Income Ratio | Without Mortgage | With Mortgage |
| Less than 2.0x | 99 (26.8%) | 135,043 (11,671.8%) |
| 2.0x to 2.9x | 14 (3.8%) | 189 (16.3%) |
| 3.0x to 3.9x | 46 (12.5%) | 267 (23.1%) |
| 4.0x or more | 210 (56.9%) | 109 (9.4%) |
| Total | 369 (100.0%) | 1,157 (100.0%) |
Real Estate Taxes by Mortgage Status in Yarmouth
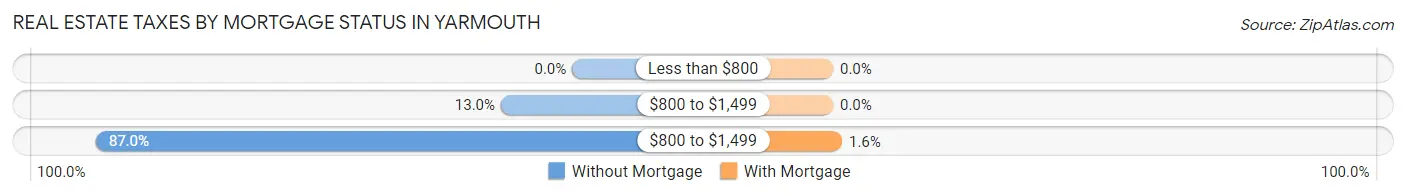
| Property Taxes | Without Mortgage | With Mortgage |
| Less than $800 | 0 (0.0%) | 0 (0.0%) |
| $800 to $1,499 | 48 (13.0%) | 0 (0.0%) |
| $800 to $1,499 | 321 (87.0%) | 19 (1.6%) |
| Total | 369 (100.0%) | 1,157 (100.0%) |
Health & Disability in Yarmouth
Health Insurance Coverage by Age in Yarmouth
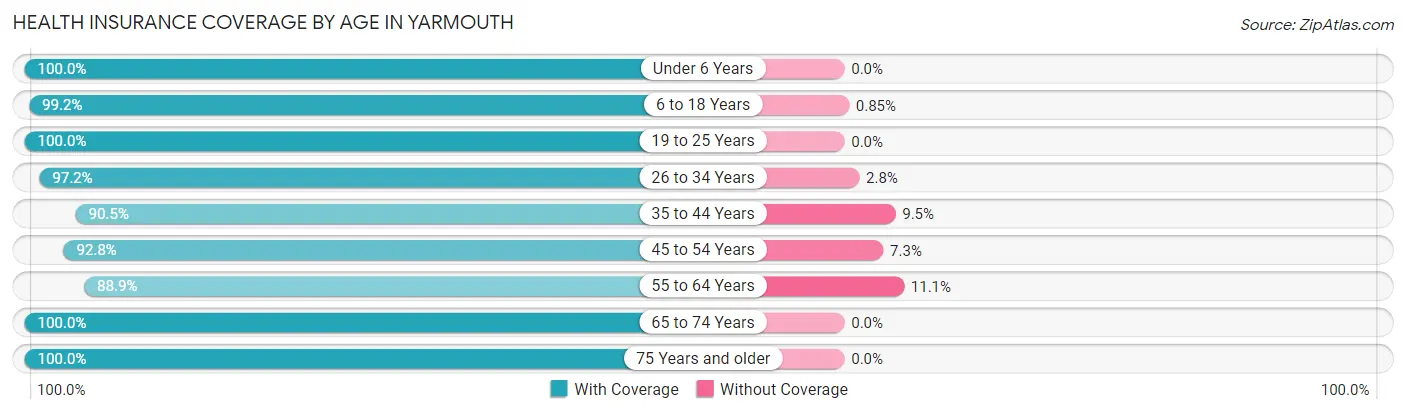
| Age Bracket | With Coverage | Without Coverage |
| Under 6 Years | 342 (100.0%) | 0 (0.0%) |
| 6 to 18 Years | 1,396 (99.2%) | 12 (0.9%) |
| 19 to 25 Years | 282 (100.0%) | 0 (0.0%) |
| 26 to 34 Years | 633 (97.2%) | 18 (2.8%) |
| 35 to 44 Years | 666 (90.5%) | 70 (9.5%) |
| 45 to 54 Years | 934 (92.7%) | 73 (7.2%) |
| 55 to 64 Years | 560 (88.9%) | 70 (11.1%) |
| 65 to 74 Years | 481 (100.0%) | 0 (0.0%) |
| 75 Years and older | 249 (100.0%) | 0 (0.0%) |
| Total | 5,543 (95.8%) | 243 (4.2%) |
Health Insurance Coverage by Citizenship Status in Yarmouth
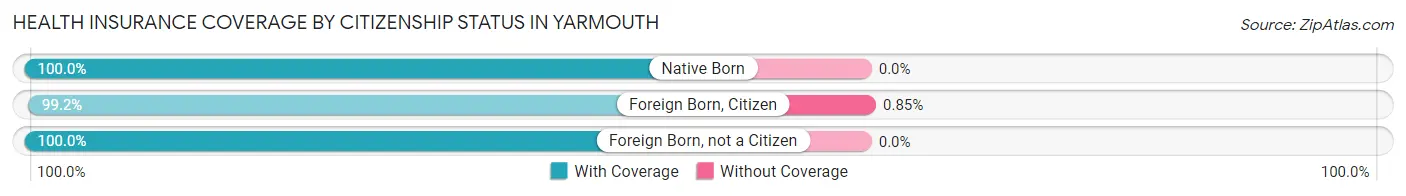
| Citizenship Status | With Coverage | Without Coverage |
| Native Born | 342 (100.0%) | 0 (0.0%) |
| Foreign Born, Citizen | 1,396 (99.2%) | 12 (0.9%) |
| Foreign Born, not a Citizen | 282 (100.0%) | 0 (0.0%) |
Health Insurance Coverage by Household Income in Yarmouth
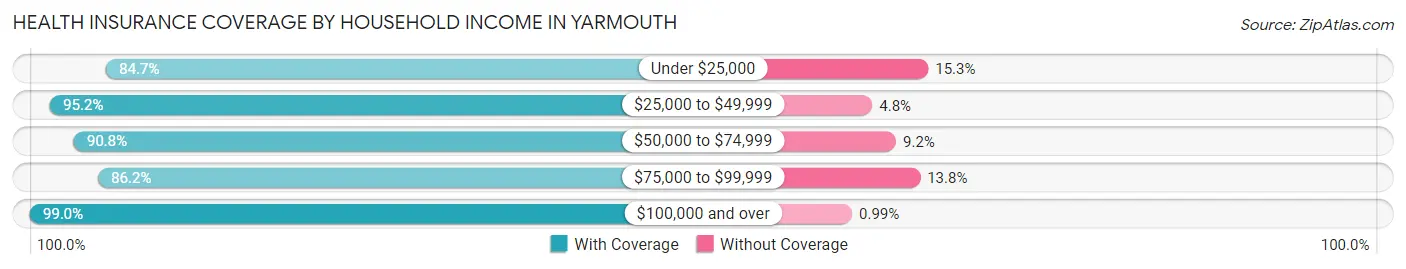
| Household Income | With Coverage | Without Coverage |
| Under $25,000 | 222 (84.7%) | 40 (15.3%) |
| $25,000 to $49,999 | 1,095 (95.2%) | 55 (4.8%) |
| $50,000 to $74,999 | 600 (90.8%) | 61 (9.2%) |
| $75,000 to $99,999 | 326 (86.2%) | 52 (13.8%) |
| $100,000 and over | 3,294 (99.0%) | 33 (1.0%) |
Public vs Private Health Insurance Coverage by Age in Yarmouth
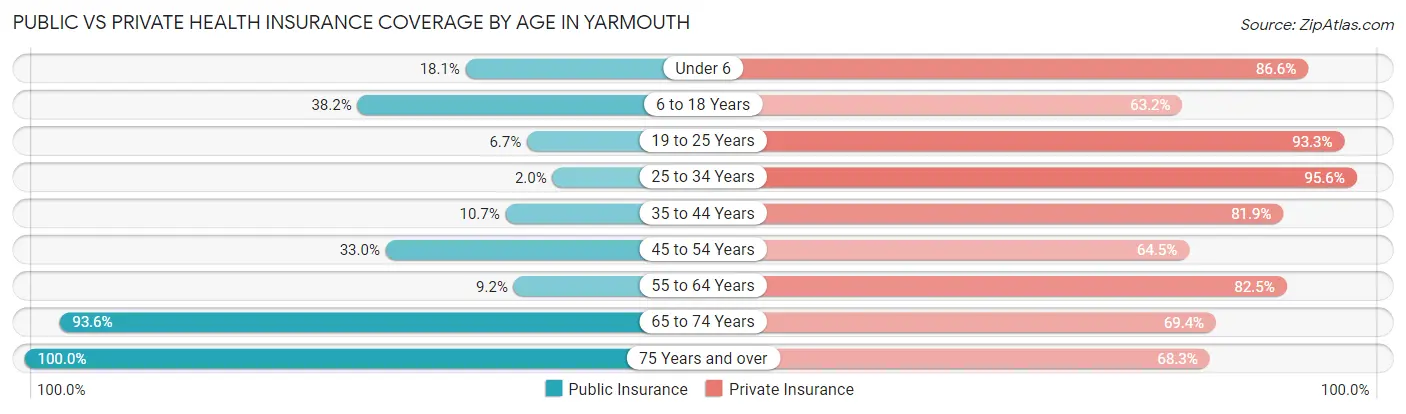
| Age Bracket | Public Insurance | Private Insurance |
| Under 6 | 62 (18.1%) | 296 (86.6%) |
| 6 to 18 Years | 538 (38.2%) | 890 (63.2%) |
| 19 to 25 Years | 19 (6.7%) | 263 (93.3%) |
| 25 to 34 Years | 13 (2.0%) | 622 (95.6%) |
| 35 to 44 Years | 79 (10.7%) | 603 (81.9%) |
| 45 to 54 Years | 332 (33.0%) | 649 (64.4%) |
| 55 to 64 Years | 58 (9.2%) | 520 (82.5%) |
| 65 to 74 Years | 450 (93.6%) | 334 (69.4%) |
| 75 Years and over | 249 (100.0%) | 170 (68.3%) |
| Total | 1,800 (31.1%) | 4,347 (75.1%) |
Disability Status by Sex by Age in Yarmouth
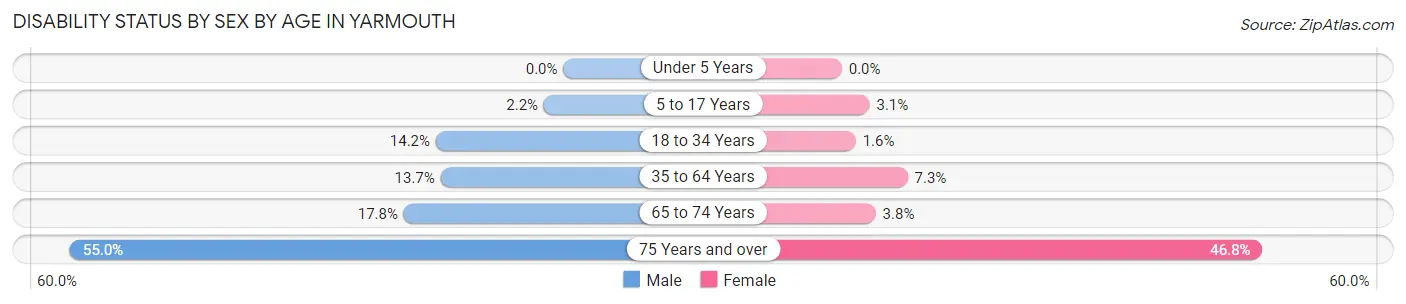
| Age Bracket | Male | Female |
| Under 5 Years | 0 (0.0%) | 0 (0.0%) |
| 5 to 17 Years | 17 (2.2%) | 16 (3.1%) |
| 18 to 34 Years | 48 (14.2%) | 12 (1.5%) |
| 35 to 64 Years | 136 (13.7%) | 101 (7.3%) |
| 65 to 74 Years | 43 (17.8%) | 9 (3.8%) |
| 75 Years and over | 50 (54.9%) | 74 (46.8%) |
Disability Class by Sex by Age in Yarmouth
Disability Class: Hearing Difficulty
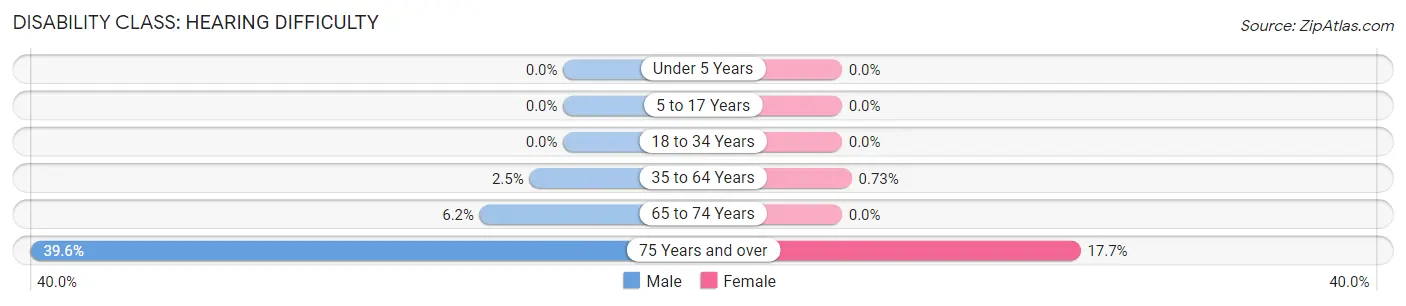
| Age Bracket | Male | Female |
| Under 5 Years | 0 (0.0%) | 0 (0.0%) |
| 5 to 17 Years | 0 (0.0%) | 0 (0.0%) |
| 18 to 34 Years | 0 (0.0%) | 0 (0.0%) |
| 35 to 64 Years | 25 (2.5%) | 10 (0.7%) |
| 65 to 74 Years | 15 (6.2%) | 0 (0.0%) |
| 75 Years and over | 36 (39.6%) | 28 (17.7%) |
Disability Class: Vision Difficulty
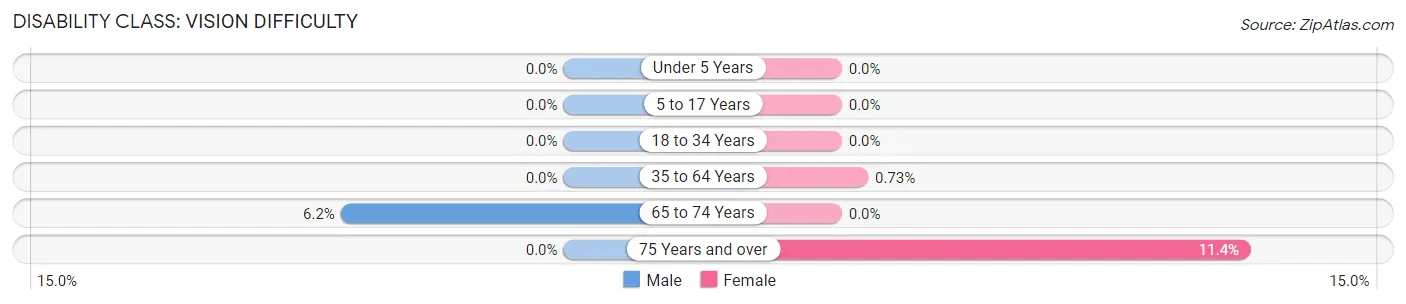
| Age Bracket | Male | Female |
| Under 5 Years | 0 (0.0%) | 0 (0.0%) |
| 5 to 17 Years | 0 (0.0%) | 0 (0.0%) |
| 18 to 34 Years | 0 (0.0%) | 0 (0.0%) |
| 35 to 64 Years | 0 (0.0%) | 10 (0.7%) |
| 65 to 74 Years | 15 (6.2%) | 0 (0.0%) |
| 75 Years and over | 0 (0.0%) | 18 (11.4%) |
Disability Class: Cognitive Difficulty
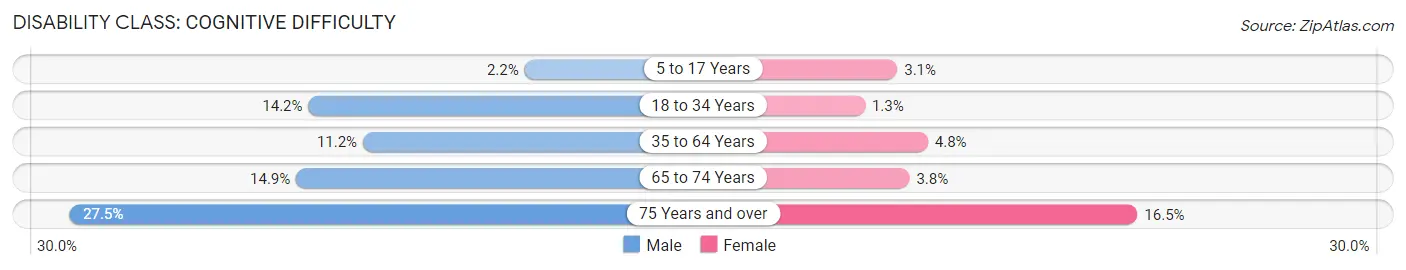
| Age Bracket | Male | Female |
| 5 to 17 Years | 17 (2.2%) | 16 (3.1%) |
| 18 to 34 Years | 48 (14.2%) | 10 (1.3%) |
| 35 to 64 Years | 111 (11.2%) | 66 (4.8%) |
| 65 to 74 Years | 36 (14.9%) | 9 (3.8%) |
| 75 Years and over | 25 (27.5%) | 26 (16.5%) |
Disability Class: Ambulatory Difficulty
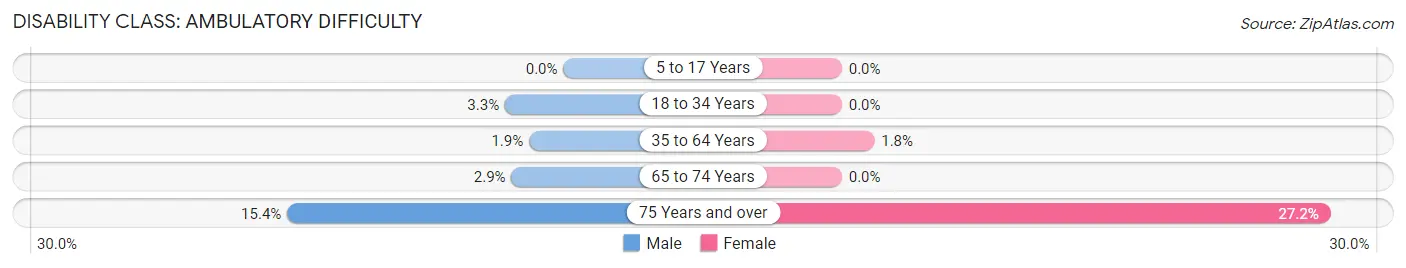
| Age Bracket | Male | Female |
| 5 to 17 Years | 0 (0.0%) | 0 (0.0%) |
| 18 to 34 Years | 11 (3.3%) | 0 (0.0%) |
| 35 to 64 Years | 19 (1.9%) | 25 (1.8%) |
| 65 to 74 Years | 7 (2.9%) | 0 (0.0%) |
| 75 Years and over | 14 (15.4%) | 43 (27.2%) |
Disability Class: Self-Care Difficulty
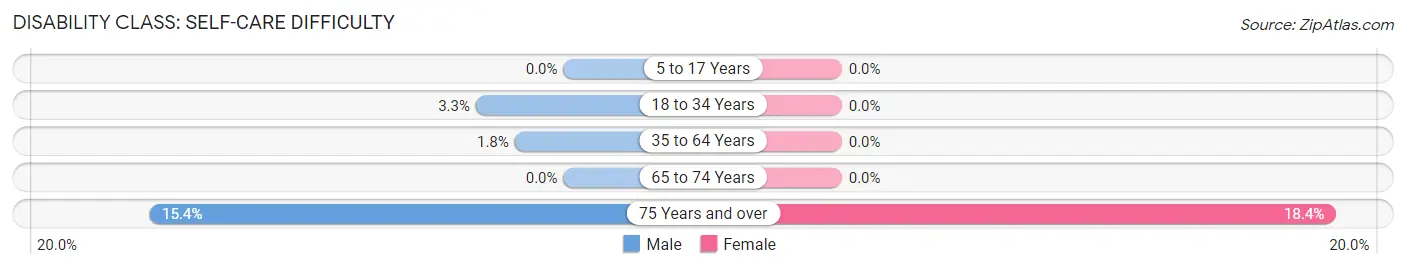
| Age Bracket | Male | Female |
| 5 to 17 Years | 0 (0.0%) | 0 (0.0%) |
| 18 to 34 Years | 11 (3.3%) | 0 (0.0%) |
| 35 to 64 Years | 18 (1.8%) | 0 (0.0%) |
| 65 to 74 Years | 0 (0.0%) | 0 (0.0%) |
| 75 Years and over | 14 (15.4%) | 29 (18.3%) |
Technology Access in Yarmouth
Computing Device Access in Yarmouth
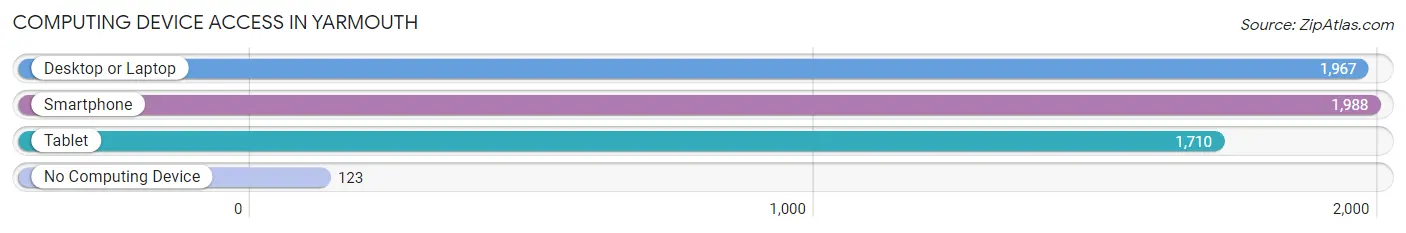
| Device Type | # Households | % Households |
| Desktop or Laptop | 1,967 | 88.7% |
| Smartphone | 1,988 | 89.7% |
| Tablet | 1,710 | 77.1% |
| No Computing Device | 123 | 5.6% |
| Total | 2,217 | 100.0% |
Internet Access in Yarmouth
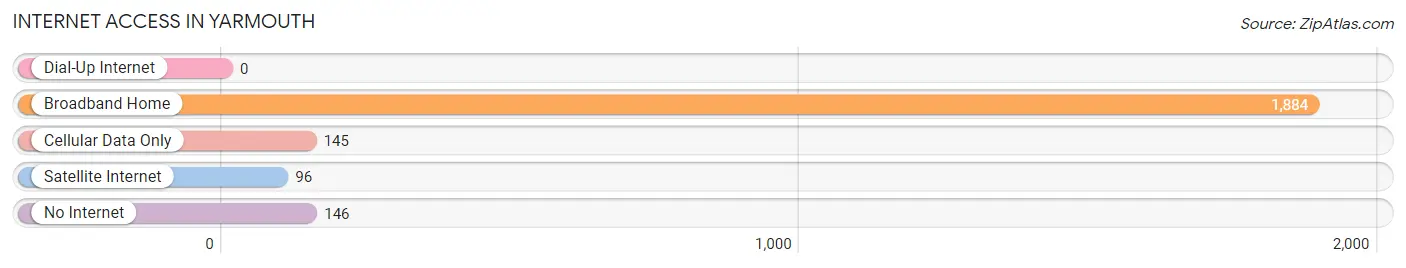
| Internet Type | # Households | % Households |
| Dial-Up Internet | 0 | 0.0% |
| Broadband Home | 1,884 | 85.0% |
| Cellular Data Only | 145 | 6.5% |
| Satellite Internet | 96 | 4.3% |
| No Internet | 146 | 6.6% |
| Total | 2,217 | 100.0% |
Yarmouth Summary
Yarmouth is a town located in Cumberland County, Maine, United States. It is part of the Portland–South Portland–Biddeford, Maine metropolitan statistical area. The population was 8,349 at the 2010 census.
History
Yarmouth was first settled in 1636 by Abraham Preble and his family. The town was incorporated in 1849 and named after Great Yarmouth, England.
In the 19th century, Yarmouth was a major shipbuilding center. The town was home to the Yarmouth Shipyard, which built many of the wooden ships that sailed the world. The shipyard was in operation from 1820 to 1891.
Geography
Yarmouth is located at 43°48'N 70°11'W (43.80, -70.18). According to the United States Census Bureau, the town has a total area of 24.2 square miles (62.7 km2), of which, 22.7 square miles (58.8 km2) of it is land and 1.5 square miles (3.9 km2) of it (6.17%) is water.
Yarmouth is bordered by the towns of Freeport to the north, Cumberland to the east, Falmouth to the south, and North Yarmouth to the west.
Economy
Yarmouth is home to several businesses, including the Yarmouth Boat Yard, which builds and repairs wooden boats, and the Yarmouth Lobster Company, which processes and ships lobster.
The town is also home to several retail stores, including the Yarmouth Marketplace, a grocery store, and the Yarmouth Mall, which features a variety of stores and restaurants.
Demographics
As of the census of 2010, there were 8,349 people, 3,521 households, and 2,323 families residing in the town. The population density was 367.2 people per square mile (141.9/km2). There were 3,845 housing units at an average density of 169.7 per square mile (65.5/km2). The racial makeup of the town was 97.2% White, 0.7% African American, 0.2% Native American, 0.7% Asian, 0.1% Pacific Islander, 0.3% from other races, and 0.9% from two or more races. Hispanic or Latino of any race were 1.2% of the population.
There were 3,521 households, out of which 28.2% had children under the age of 18 living with them, 54.2% were married couples living together, 8.7% had a female householder with no husband present, and 33.3% were non-families. 27.2% of all households were made up of individuals, and 11.7% had someone living alone who was 65 years of age or older. The average household size was 2.35 and the average family size was 2.86.
In the town, the population was spread out, with 22.7% under the age of 18, 5.7% from 18 to 24, 25.3% from 25 to 44, 30.2% from 45 to 64, and 16.1% who were 65 years of age or older. The median age was 43 years. For every 100 females, there were 92.2 males. For every 100 females age 18 and over, there were 88.7 males.
The median income for a household in the town was $54,844, and the median income for a family was $64,844. Males had a median income of $45,938 versus $33,917 for females. The per capita income for the town was $27,945. About 3.7% of families and 5.2% of the population were below the poverty line, including 6.2% of those under age 18 and 5.3% of those age 65 or over.
Common Questions
What is Per Capita Income in Yarmouth?
Per Capita income in Yarmouth is $50,865.
What is the Median Family Income in Yarmouth?
Median Family Income in Yarmouth is $114,327.
What is the Median Household income in Yarmouth?
Median Household Income in Yarmouth is $89,770.
What is Income or Wage Gap in Yarmouth?
Income or Wage Gap in Yarmouth is 55.6%.
Women in Yarmouth earn 44.4 cents for every dollar earned by a man.
What is Inequality or Gini Index in Yarmouth?
Inequality or Gini Index in Yarmouth is 0.49.
What is the Total Population of Yarmouth?
Total Population of Yarmouth is 5,937.
What is the Total Male Population of Yarmouth?
Total Male Population of Yarmouth is 2,678.
What is the Total Female Population of Yarmouth?
Total Female Population of Yarmouth is 3,259.
What is the Ratio of Males per 100 Females in Yarmouth?
There are 82.17 Males per 100 Females in Yarmouth.
What is the Ratio of Females per 100 Males in Yarmouth?
There are 121.70 Females per 100 Males in Yarmouth.
What is the Median Population Age in Yarmouth?
Median Population Age in Yarmouth is 39.3 Years.
What is the Average Family Size in Yarmouth
Average Family Size in Yarmouth is 3.0 People.
What is the Average Household Size in Yarmouth
Average Household Size in Yarmouth is 2.6 People.
How Large is the Labor Force in Yarmouth?
There are 3,466 People in the Labor Forcein in Yarmouth.
What is the Percentage of People in the Labor Force in Yarmouth?
73.8% of People are in the Labor Force in Yarmouth.
What is the Unemployment Rate in Yarmouth?
Unemployment Rate in Yarmouth is 6.5%.