Sanford, ME Map & Demographics
Sanford Map
Sanford Overview
$35,090
PER CAPITA INCOME
$79,836
AVG FAMILY INCOME
$71,848
AVG HOUSEHOLD INCOME
31.9%
WAGE / INCOME GAP [ % ]
68.1¢/ $1
WAGE / INCOME GAP [ $ ]
$7,596
FAMILY INCOME DEFICIT
0.40
INEQUALITY / GINI INDEX
21,986
TOTAL POPULATION
10,529
MALE POPULATION
11,457
FEMALE POPULATION
91.90
MALES / 100 FEMALES
108.81
FEMALES / 100 MALES
39.3
MEDIAN AGE
3.0
AVG FAMILY SIZE
2.4
AVG HOUSEHOLD SIZE
11,646
LABOR FORCE [ PEOPLE ]
67.3%
PERCENT IN LABOR FORCE
4.0%
UNEMPLOYMENT RATE
Sanford Zip Codes
Sanford Area Codes
Income in Sanford
Income Overview in Sanford
Per Capita Income in Sanford is $35,090, while median incomes of families and households are $79,836 and $71,848 respectively.
| Characteristic | Number | Measure |
| Per Capita Income | 21,986 | $35,090 |
| Median Family Income | 5,338 | $79,836 |
| Mean Family Income | 5,338 | $90,463 |
| Median Household Income | 9,019 | $71,848 |
| Mean Household Income | 9,019 | $82,900 |
| Income Deficit | 5,338 | $7,596 |
| Wage / Income Gap (%) | 21,986 | 31.85% |
| Wage / Income Gap ($) | 21,986 | 68.15¢ per $1 |
| Gini / Inequality Index | 21,986 | 0.40 |
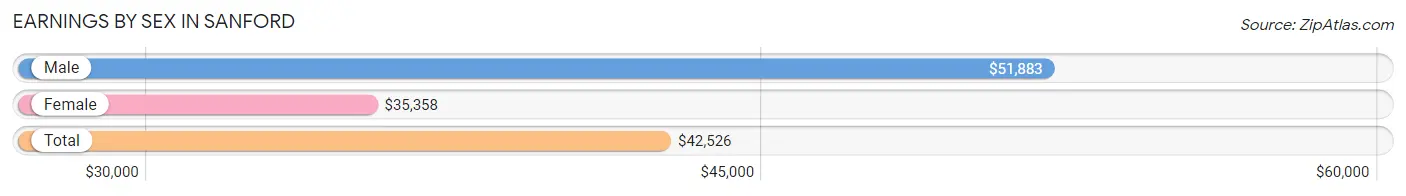
Earnings by Sex in Sanford
Average Earnings in Sanford are $42,526, $51,883 for men and $35,358 for women, a difference of 31.9%.
| Sex | Number | Average Earnings |
| Male | 5,920 (49.1%) | $51,883 |
| Female | 6,127 (50.9%) | $35,358 |
| Total | 12,047 (100.0%) | $42,526 |
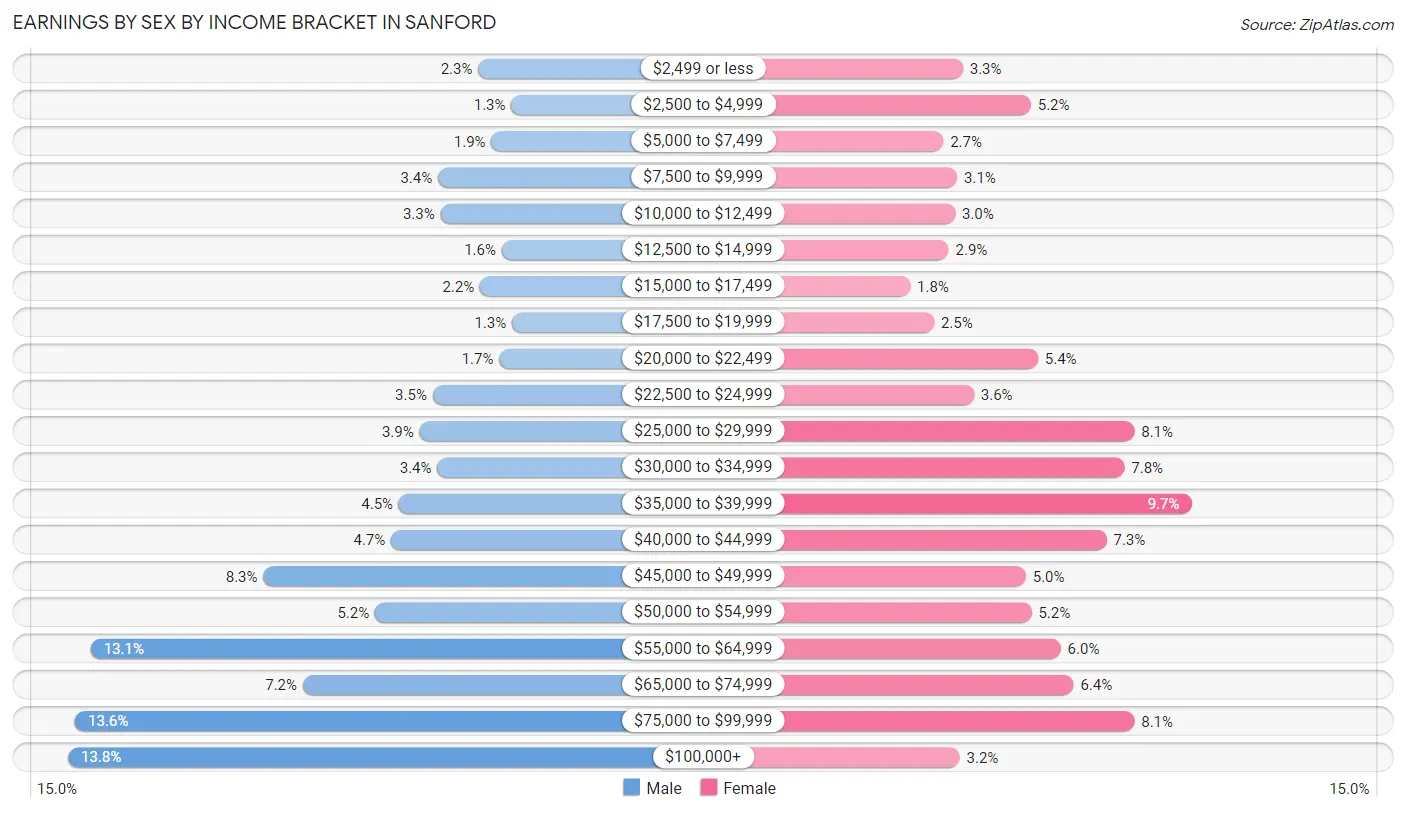
Earnings by Sex by Income Bracket in Sanford
The most common earnings brackets in Sanford are $100,000+ for men (816 | 13.8%) and $35,000 to $39,999 for women (593 | 9.7%).
| Income | Male | Female |
| $2,499 or less | 133 (2.2%) | 200 (3.3%) |
| $2,500 to $4,999 | 78 (1.3%) | 317 (5.2%) |
| $5,000 to $7,499 | 111 (1.9%) | 166 (2.7%) |
| $7,500 to $9,999 | 200 (3.4%) | 190 (3.1%) |
| $10,000 to $12,499 | 196 (3.3%) | 186 (3.0%) |
| $12,500 to $14,999 | 94 (1.6%) | 175 (2.9%) |
| $15,000 to $17,499 | 130 (2.2%) | 109 (1.8%) |
| $17,500 to $19,999 | 77 (1.3%) | 150 (2.5%) |
| $20,000 to $22,499 | 98 (1.7%) | 329 (5.4%) |
| $22,500 to $24,999 | 209 (3.5%) | 219 (3.6%) |
| $25,000 to $29,999 | 231 (3.9%) | 495 (8.1%) |
| $30,000 to $34,999 | 201 (3.4%) | 478 (7.8%) |
| $35,000 to $39,999 | 265 (4.5%) | 593 (9.7%) |
| $40,000 to $44,999 | 278 (4.7%) | 447 (7.3%) |
| $45,000 to $49,999 | 491 (8.3%) | 308 (5.0%) |
| $50,000 to $54,999 | 305 (5.1%) | 318 (5.2%) |
| $55,000 to $64,999 | 778 (13.1%) | 368 (6.0%) |
| $65,000 to $74,999 | 425 (7.2%) | 390 (6.4%) |
| $75,000 to $99,999 | 804 (13.6%) | 495 (8.1%) |
| $100,000+ | 816 (13.8%) | 194 (3.2%) |
| Total | 5,920 (100.0%) | 6,127 (100.0%) |
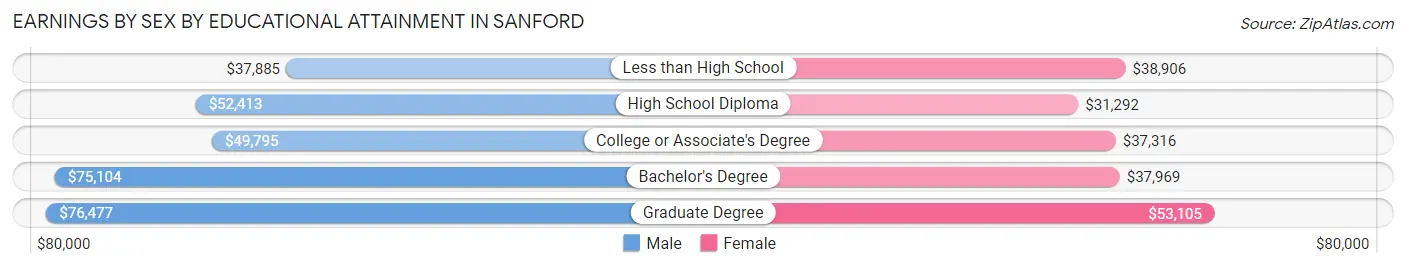
Earnings by Sex by Educational Attainment in Sanford
Average earnings in Sanford are $55,791 for men and $37,078 for women, a difference of 33.5%. Men with an educational attainment of graduate degree enjoy the highest average annual earnings of $76,477, while those with less than high school education earn the least with $37,885. Women with an educational attainment of graduate degree earn the most with the average annual earnings of $53,105, while those with high school diploma education have the smallest earnings of $31,292.
| Educational Attainment | Male Income | Female Income |
| Less than High School | $37,885 | $38,906 |
| High School Diploma | $52,413 | $31,292 |
| College or Associate's Degree | $49,795 | $37,316 |
| Bachelor's Degree | $75,104 | $37,969 |
| Graduate Degree | $76,477 | $53,105 |
| Total | $55,791 | $37,078 |
Family Income in Sanford
Family Income Brackets in Sanford
According to the Sanford family income data, there are 1,233 families falling into the $100,000 to $149,999 income range, which is the most common income bracket and makes up 23.1% of all families. Conversely, the $10,000 to $14,999 income bracket is the least frequent group with only 80 families (1.5%) belonging to this category.
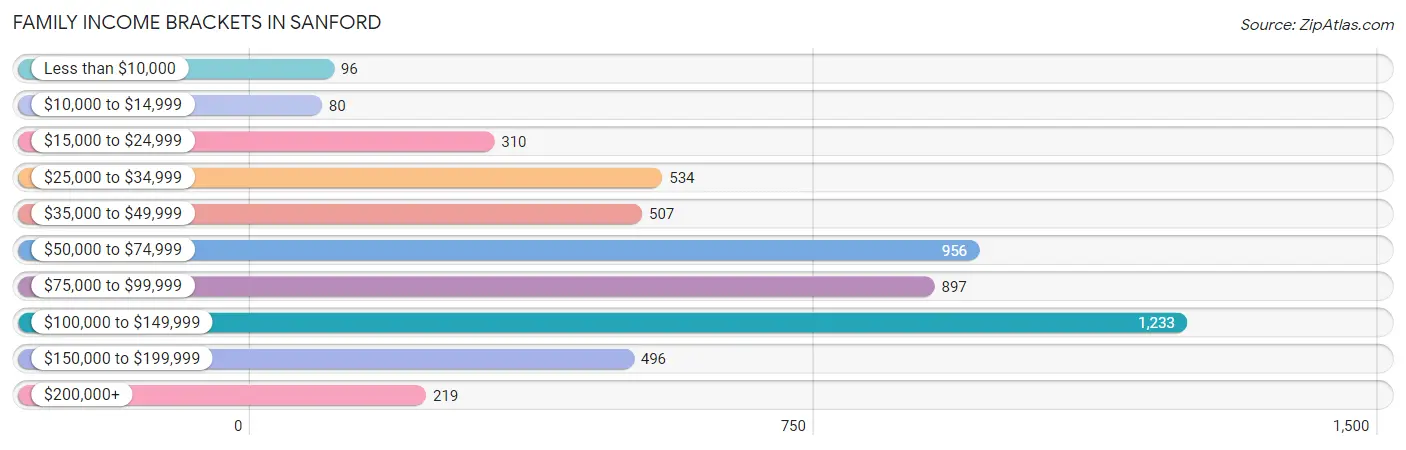
| Income Bracket | # Families | % Families |
| Less than $10,000 | 96 | 1.8% |
| $10,000 to $14,999 | 80 | 1.5% |
| $15,000 to $24,999 | 310 | 5.8% |
| $25,000 to $34,999 | 534 | 10.0% |
| $35,000 to $49,999 | 507 | 9.5% |
| $50,000 to $74,999 | 956 | 17.9% |
| $75,000 to $99,999 | 897 | 16.8% |
| $100,000 to $149,999 | 1,233 | 23.1% |
| $150,000 to $199,999 | 496 | 9.3% |
| $200,000+ | 219 | 4.1% |
Family Income by Famaliy Size in Sanford
5-person families (349 | 6.5%) account for the highest median family income in Sanford with $116,438 per family, while 2-person families (2,589 | 48.5%) have the highest median income of $33,442 per family member.
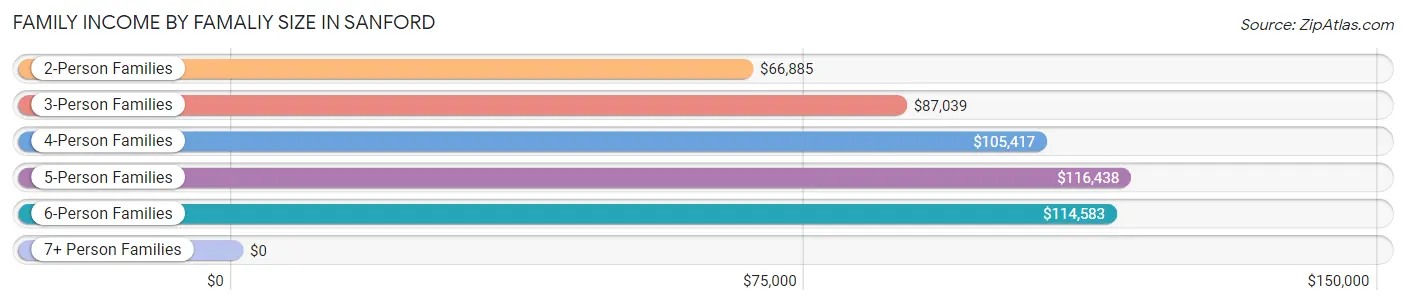
| Income Bracket | # Families | Median Income |
| 2-Person Families | 2,589 (48.5%) | $66,885 |
| 3-Person Families | 1,326 (24.8%) | $87,039 |
| 4-Person Families | 853 (16.0%) | $105,417 |
| 5-Person Families | 349 (6.5%) | $116,438 |
| 6-Person Families | 182 (3.4%) | $114,583 |
| 7+ Person Families | 39 (0.7%) | $0 |
| Total | 5,338 (100.0%) | $79,836 |
Family Income by Number of Earners in Sanford
The median family income in Sanford is $79,836, with families comprising 3+ earners (479) having the highest median family income of $155,160, while families with no earners (762) have the lowest median family income of $38,538, accounting for 9.0% and 14.3% of families, respectively.
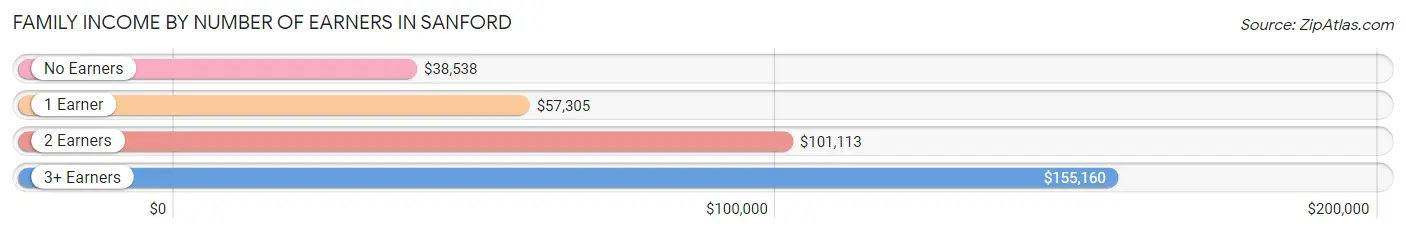
| Number of Earners | # Families | Median Income |
| No Earners | 762 (14.3%) | $38,538 |
| 1 Earner | 1,922 (36.0%) | $57,305 |
| 2 Earners | 2,175 (40.7%) | $101,113 |
| 3+ Earners | 479 (9.0%) | $155,160 |
| Total | 5,338 (100.0%) | $79,836 |
Household Income in Sanford
Household Income Brackets in Sanford
With 1,813 households falling in the category, the $100,000 to $149,999 income range is the most frequent in Sanford, accounting for 20.1% of all households. In contrast, only 207 households (2.3%) fall into the $10,000 to $14,999 income bracket, making it the least populous group.
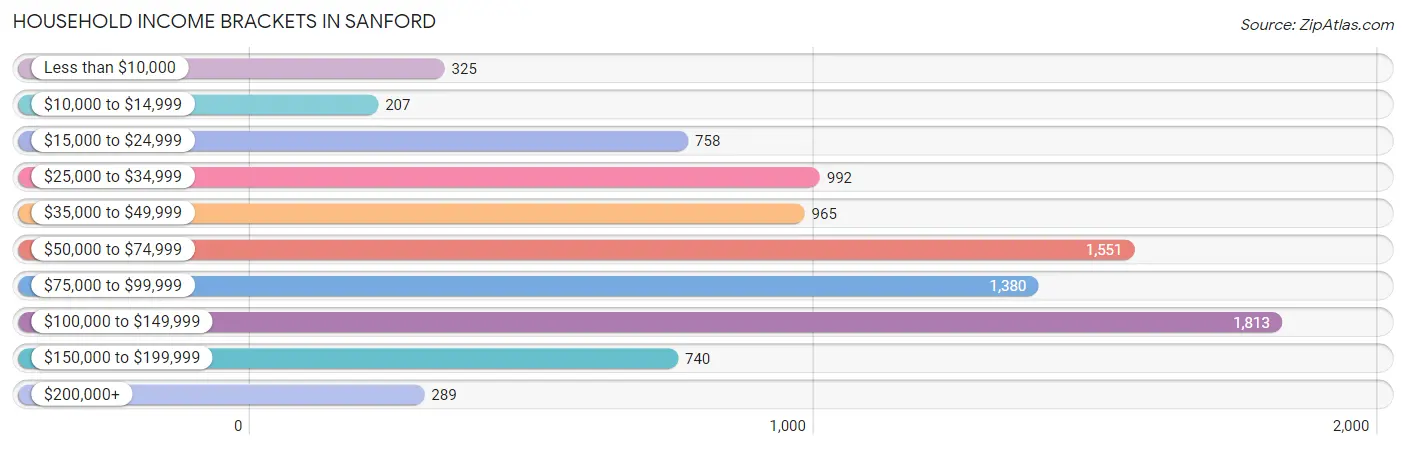
| Income Bracket | # Households | % Households |
| Less than $10,000 | 325 | 3.6% |
| $10,000 to $14,999 | 207 | 2.3% |
| $15,000 to $24,999 | 758 | 8.4% |
| $25,000 to $34,999 | 992 | 11.0% |
| $35,000 to $49,999 | 965 | 10.7% |
| $50,000 to $74,999 | 1,551 | 17.2% |
| $75,000 to $99,999 | 1,380 | 15.3% |
| $100,000 to $149,999 | 1,813 | 20.1% |
| $150,000 to $199,999 | 740 | 8.2% |
| $200,000+ | 289 | 3.2% |
Household Income by Householder Age in Sanford
The median household income in Sanford is $71,848, with the highest median household income of $84,352 found in the 45 to 64 years age bracket for the primary householder. A total of 3,422 households (37.9%) fall into this category. Meanwhile, the 65+ years age bracket for the primary householder has the lowest median household income of $39,979, with 2,478 households (27.5%) in this group.
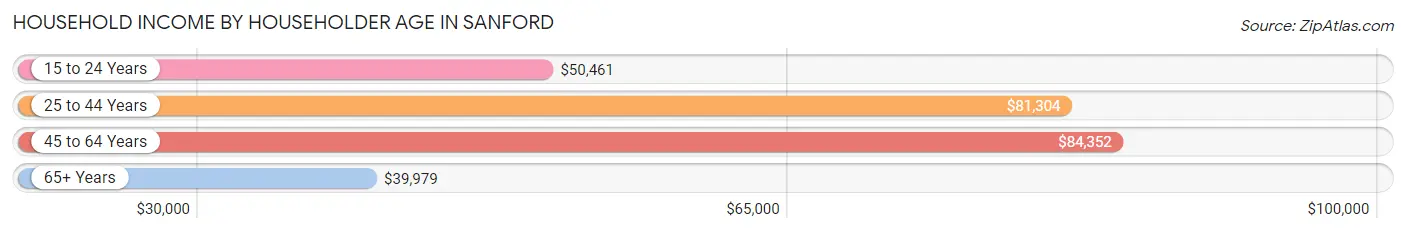
| Income Bracket | # Households | Median Income |
| 15 to 24 Years | 207 (2.3%) | $50,461 |
| 25 to 44 Years | 2,912 (32.3%) | $81,304 |
| 45 to 64 Years | 3,422 (37.9%) | $84,352 |
| 65+ Years | 2,478 (27.5%) | $39,979 |
| Total | 9,019 (100.0%) | $71,848 |
Poverty in Sanford
Income Below Poverty by Sex and Age in Sanford
With 10.7% poverty level for males and 11.6% for females among the residents of Sanford, 5 year old males and 6 to 11 year old females are the most vulnerable to poverty, with 62 males (49.6%) and 180 females (23.4%) in their respective age groups living below the poverty level.
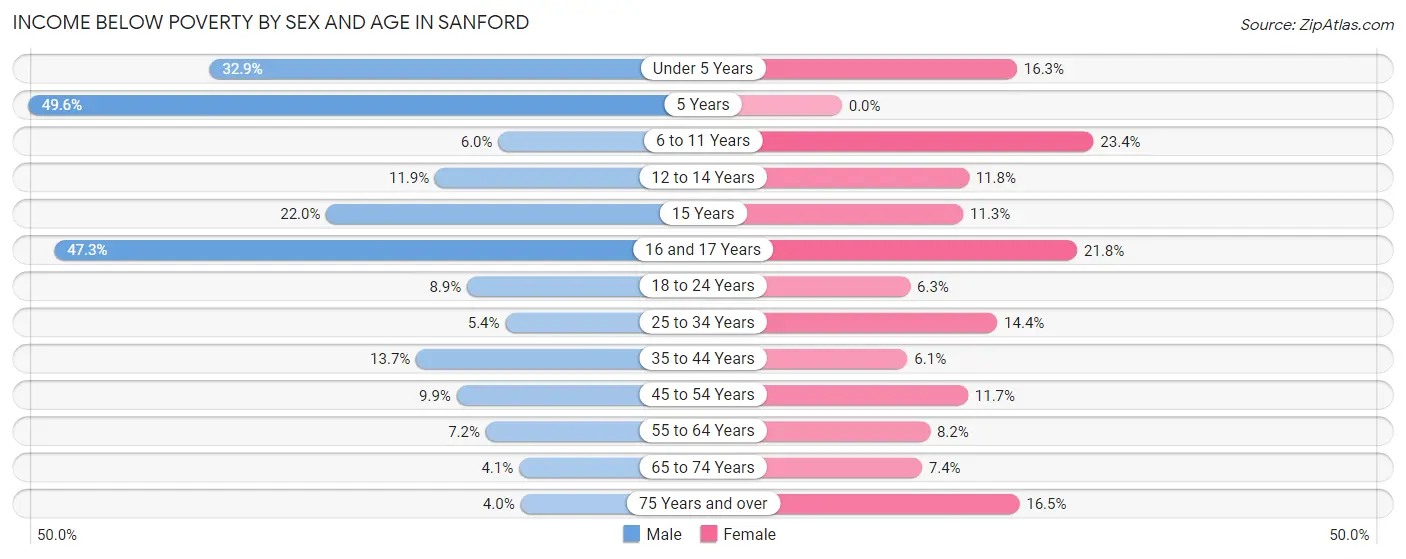
| Age Bracket | Male | Female |
| Under 5 Years | 203 (32.9%) | 105 (16.3%) |
| 5 Years | 62 (49.6%) | 0 (0.0%) |
| 6 to 11 Years | 54 (6.0%) | 180 (23.4%) |
| 12 to 14 Years | 43 (11.9%) | 39 (11.8%) |
| 15 Years | 55 (22.0%) | 33 (11.3%) |
| 16 and 17 Years | 86 (47.2%) | 64 (21.8%) |
| 18 to 24 Years | 50 (8.9%) | 34 (6.3%) |
| 25 to 34 Years | 88 (5.4%) | 267 (14.4%) |
| 35 to 44 Years | 157 (13.7%) | 89 (6.1%) |
| 45 to 54 Years | 133 (9.9%) | 148 (11.7%) |
| 55 to 64 Years | 99 (7.2%) | 134 (8.2%) |
| 65 to 74 Years | 49 (4.1%) | 86 (7.4%) |
| 75 Years and over | 27 (4.0%) | 111 (16.5%) |
| Total | 1,106 (10.7%) | 1,290 (11.6%) |
Income Above Poverty by Sex and Age in Sanford
According to the poverty statistics in Sanford, males aged 75 years and over and females aged 5 years are the age groups that are most secure financially, with 96.0% of males and 100.0% of females in these age groups living above the poverty line.
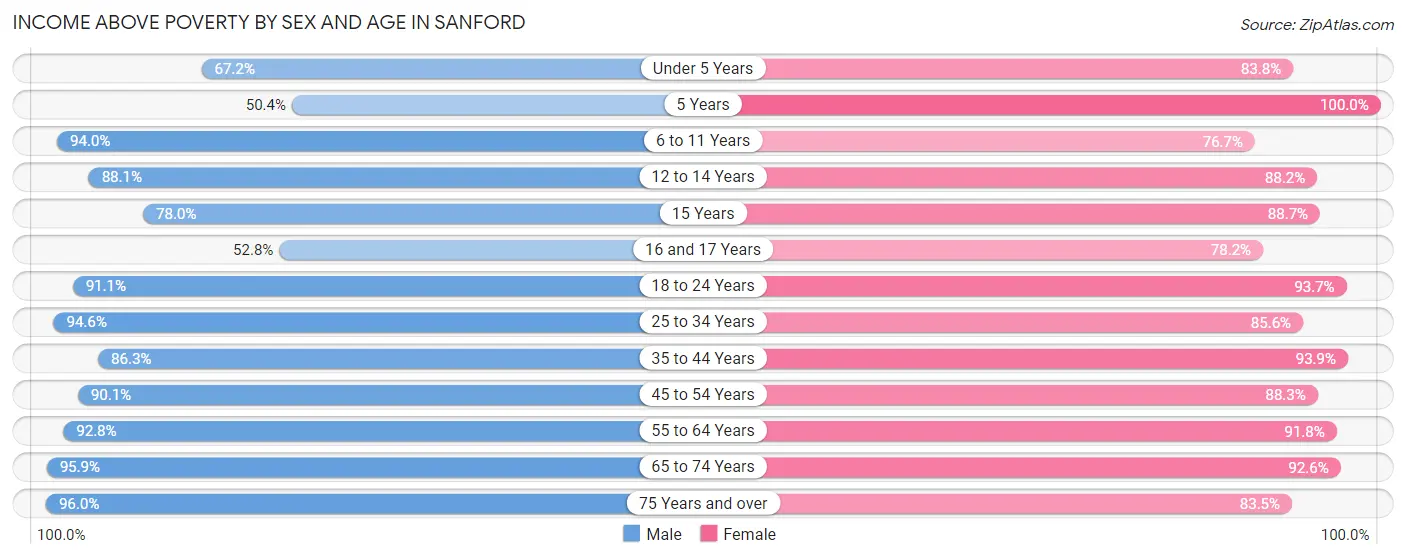
| Age Bracket | Male | Female |
| Under 5 Years | 415 (67.1%) | 541 (83.8%) |
| 5 Years | 63 (50.4%) | 218 (100.0%) |
| 6 to 11 Years | 841 (94.0%) | 591 (76.6%) |
| 12 to 14 Years | 318 (88.1%) | 292 (88.2%) |
| 15 Years | 195 (78.0%) | 260 (88.7%) |
| 16 and 17 Years | 96 (52.7%) | 229 (78.2%) |
| 18 to 24 Years | 509 (91.1%) | 502 (93.7%) |
| 25 to 34 Years | 1,547 (94.6%) | 1,585 (85.6%) |
| 35 to 44 Years | 992 (86.3%) | 1,373 (93.9%) |
| 45 to 54 Years | 1,210 (90.1%) | 1,117 (88.3%) |
| 55 to 64 Years | 1,276 (92.8%) | 1,504 (91.8%) |
| 65 to 74 Years | 1,143 (95.9%) | 1,072 (92.6%) |
| 75 Years and over | 651 (96.0%) | 563 (83.5%) |
| Total | 9,256 (89.3%) | 9,847 (88.4%) |
Income Below Poverty Among Married-Couple Families in Sanford
The poverty statistics for married-couple families in Sanford show that 2.9% or 110 of the total 3,823 families live below the poverty line. Families with no children have the highest poverty rate of 4.1%, comprising of 92 families. On the other hand, families with 5 or more children have the lowest poverty rate of 0.0%, which includes 0 families.
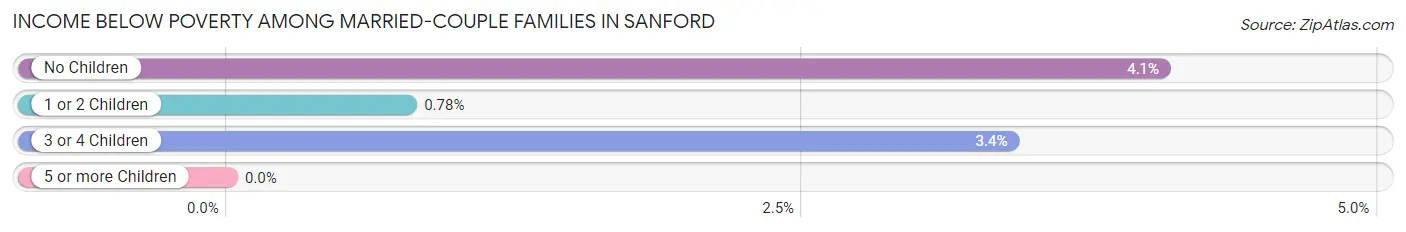
| Children | Above Poverty | Below Poverty |
| No Children | 2,173 (95.9%) | 92 (4.1%) |
| 1 or 2 Children | 1,274 (99.2%) | 10 (0.8%) |
| 3 or 4 Children | 227 (96.6%) | 8 (3.4%) |
| 5 or more Children | 39 (100.0%) | 0 (0.0%) |
| Total | 3,713 (97.1%) | 110 (2.9%) |
Income Below Poverty Among Single-Parent Households in Sanford
According to the poverty data in Sanford, 38.1% or 139 single-father households and 22.9% or 263 single-mother households are living below the poverty line. Among single-father households, those with 3 or 4 children have the highest poverty rate, with 53 households (84.1%) experiencing poverty. Likewise, among single-mother households, those with 5 or more children have the highest poverty rate, with 19 households (100.0%) falling below the poverty line.
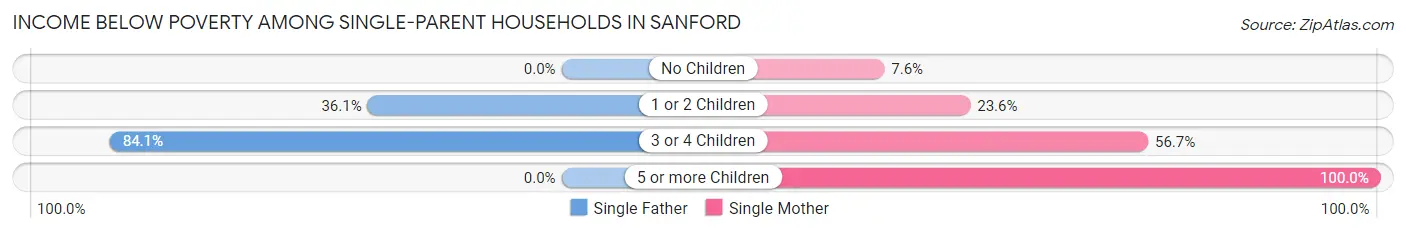
| Children | Single Father | Single Mother |
| No Children | 0 (0.0%) | 26 (7.6%) |
| 1 or 2 Children | 86 (36.1%) | 163 (23.6%) |
| 3 or 4 Children | 53 (84.1%) | 55 (56.7%) |
| 5 or more Children | 0 (0.0%) | 19 (100.0%) |
| Total | 139 (38.1%) | 263 (22.9%) |
Income Below Poverty Among Married-Couple vs Single-Parent Households in Sanford
The poverty data for Sanford shows that 110 of the married-couple family households (2.9%) and 402 of the single-parent households (26.5%) are living below the poverty level. Within the married-couple family households, those with no children have the highest poverty rate, with 92 households (4.1%) falling below the poverty line. Among the single-parent households, those with 5 or more children have the highest poverty rate, with 19 household (100.0%) living below poverty.
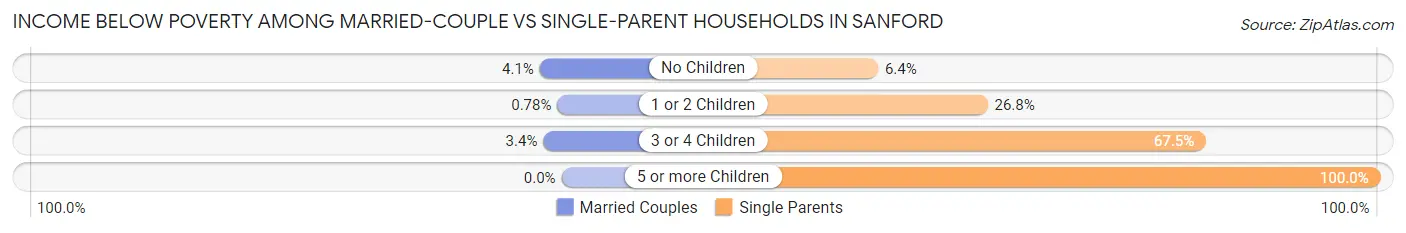
| Children | Married-Couple Families | Single-Parent Households |
| No Children | 92 (4.1%) | 26 (6.4%) |
| 1 or 2 Children | 10 (0.8%) | 249 (26.8%) |
| 3 or 4 Children | 8 (3.4%) | 108 (67.5%) |
| 5 or more Children | 0 (0.0%) | 19 (100.0%) |
| Total | 110 (2.9%) | 402 (26.5%) |
Race in Sanford
The most populous races in Sanford are White / Caucasian (20,142 | 91.6%), Two or more Races (1,148 | 5.2%), and Hispanic or Latino (572 | 2.6%).
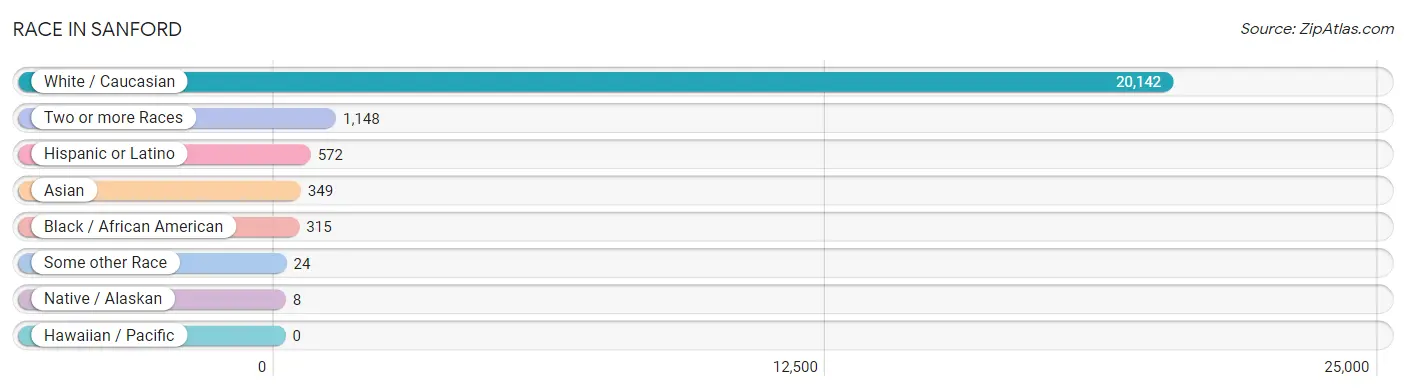
| Race | # Population | % Population |
| Asian | 349 | 1.6% |
| Black / African American | 315 | 1.4% |
| Hawaiian / Pacific | 0 | 0.0% |
| Hispanic or Latino | 572 | 2.6% |
| Native / Alaskan | 8 | 0.0% |
| White / Caucasian | 20,142 | 91.6% |
| Two or more Races | 1,148 | 5.2% |
| Some other Race | 24 | 0.1% |
| Total | 21,986 | 100.0% |
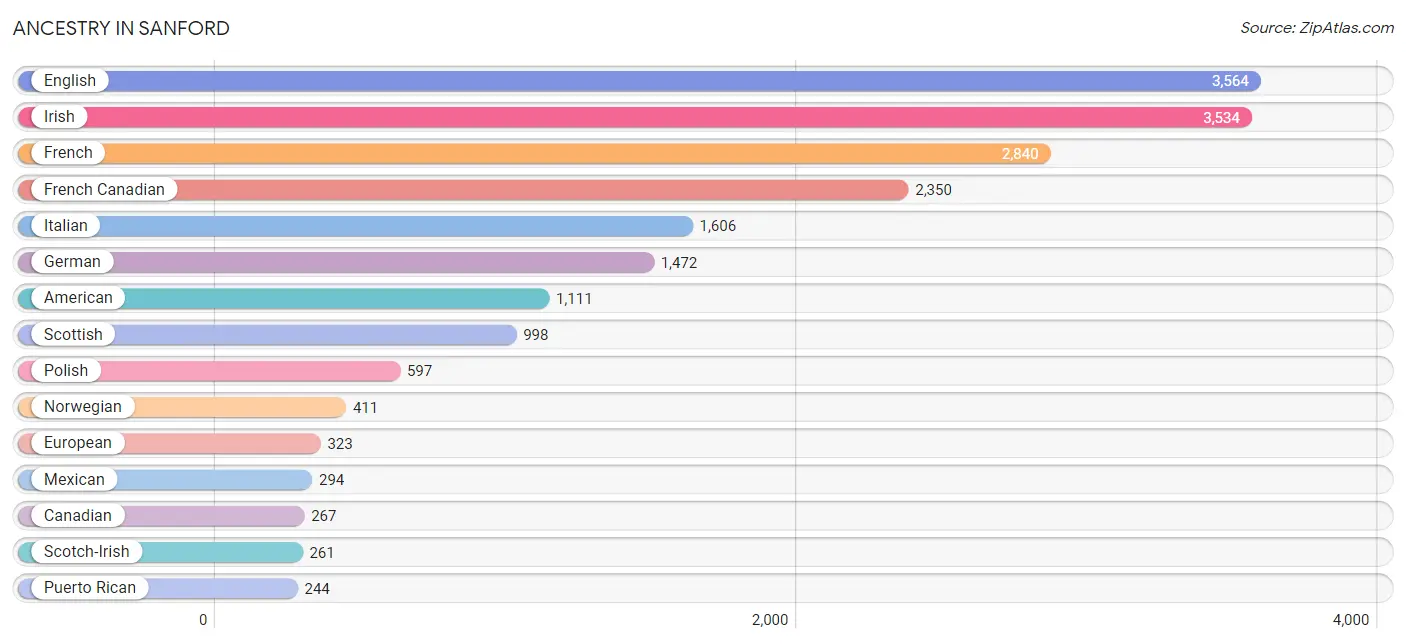
Ancestry in Sanford
The most populous ancestries reported in Sanford are English (3,564 | 16.2%), Irish (3,534 | 16.1%), French (2,840 | 12.9%), French Canadian (2,350 | 10.7%), and Italian (1,606 | 7.3%), together accounting for 63.2% of all Sanford residents.
| Ancestry | # Population | % Population |
| African | 10 | 0.1% |
| Albanian | 50 | 0.2% |
| American | 1,111 | 5.1% |
| Arab | 35 | 0.2% |
| Argentinean | 14 | 0.1% |
| Armenian | 17 | 0.1% |
| Austrian | 13 | 0.1% |
| Belgian | 14 | 0.1% |
| Bhutanese | 12 | 0.1% |
| Blackfeet | 109 | 0.5% |
| British | 91 | 0.4% |
| Burmese | 63 | 0.3% |
| Cajun | 11 | 0.1% |
| Canadian | 267 | 1.2% |
| Central American Indian | 6 | 0.0% |
| Cherokee | 84 | 0.4% |
| Croatian | 4 | 0.0% |
| Czech | 58 | 0.3% |
| Czechoslovakian | 27 | 0.1% |
| Danish | 22 | 0.1% |
| Dutch | 31 | 0.1% |
| Eastern European | 141 | 0.6% |
| Egyptian | 27 | 0.1% |
| English | 3,564 | 16.2% |
| European | 323 | 1.5% |
| Finnish | 25 | 0.1% |
| French | 2,840 | 12.9% |
| French American Indian | 19 | 0.1% |
| French Canadian | 2,350 | 10.7% |
| German | 1,472 | 6.7% |
| Greek | 143 | 0.6% |
| Hungarian | 24 | 0.1% |
| Indian (Asian) | 19 | 0.1% |
| Irish | 3,534 | 16.1% |
| Iroquois | 98 | 0.4% |
| Italian | 1,606 | 7.3% |
| Jamaican | 29 | 0.1% |
| Japanese | 205 | 0.9% |
| Korean | 62 | 0.3% |
| Lebanese | 8 | 0.0% |
| Lithuanian | 18 | 0.1% |
| Mexican | 294 | 1.3% |
| Mexican American Indian | 20 | 0.1% |
| Norwegian | 411 | 1.9% |
| Pakistani | 7 | 0.0% |
| Polish | 597 | 2.7% |
| Portuguese | 183 | 0.8% |
| Puerto Rican | 244 | 1.1% |
| Romanian | 14 | 0.1% |
| Russian | 43 | 0.2% |
| Scandinavian | 56 | 0.3% |
| Scotch-Irish | 261 | 1.2% |
| Scottish | 998 | 4.5% |
| Sioux | 3 | 0.0% |
| Slovene | 6 | 0.0% |
| South American | 14 | 0.1% |
| Spaniard | 20 | 0.1% |
| Sri Lankan | 89 | 0.4% |
| Subsaharan African | 10 | 0.1% |
| Swedish | 162 | 0.7% |
| Swiss | 24 | 0.1% |
| Thai | 37 | 0.2% |
| Welsh | 108 | 0.5% | View All 63 Rows |
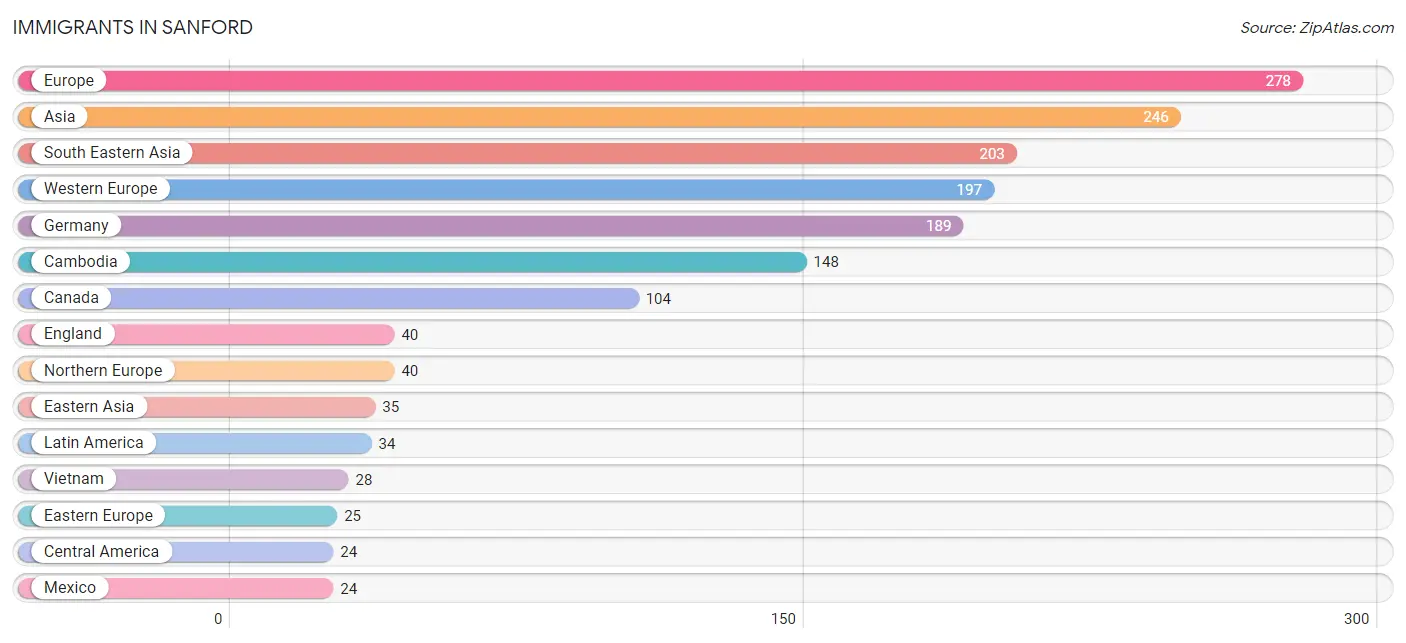
Immigrants in Sanford
The most numerous immigrant groups reported in Sanford came from Europe (278 | 1.3%), Asia (246 | 1.1%), South Eastern Asia (203 | 0.9%), Western Europe (197 | 0.9%), and Germany (189 | 0.9%), together accounting for 5.1% of all Sanford residents.
| Immigration Origin | # Population | % Population |
| Africa | 10 | 0.1% |
| Asia | 246 | 1.1% |
| Belgium | 8 | 0.0% |
| Brazil | 10 | 0.1% |
| Cambodia | 148 | 0.7% |
| Canada | 104 | 0.5% |
| Central America | 24 | 0.1% |
| China | 23 | 0.1% |
| Czechoslovakia | 20 | 0.1% |
| Eastern Asia | 35 | 0.2% |
| Eastern Europe | 25 | 0.1% |
| England | 40 | 0.2% |
| Europe | 278 | 1.3% |
| Germany | 189 | 0.9% |
| India | 8 | 0.0% |
| Italy | 16 | 0.1% |
| Japan | 12 | 0.1% |
| Latin America | 34 | 0.2% |
| Mexico | 24 | 0.1% |
| Northern Europe | 40 | 0.2% |
| Philippines | 20 | 0.1% |
| Russia | 5 | 0.0% |
| South America | 10 | 0.1% |
| South Central Asia | 8 | 0.0% |
| South Eastern Asia | 203 | 0.9% |
| Southern Europe | 16 | 0.1% |
| Thailand | 7 | 0.0% |
| Vietnam | 28 | 0.1% |
| Western Europe | 197 | 0.9% | View All 29 Rows |
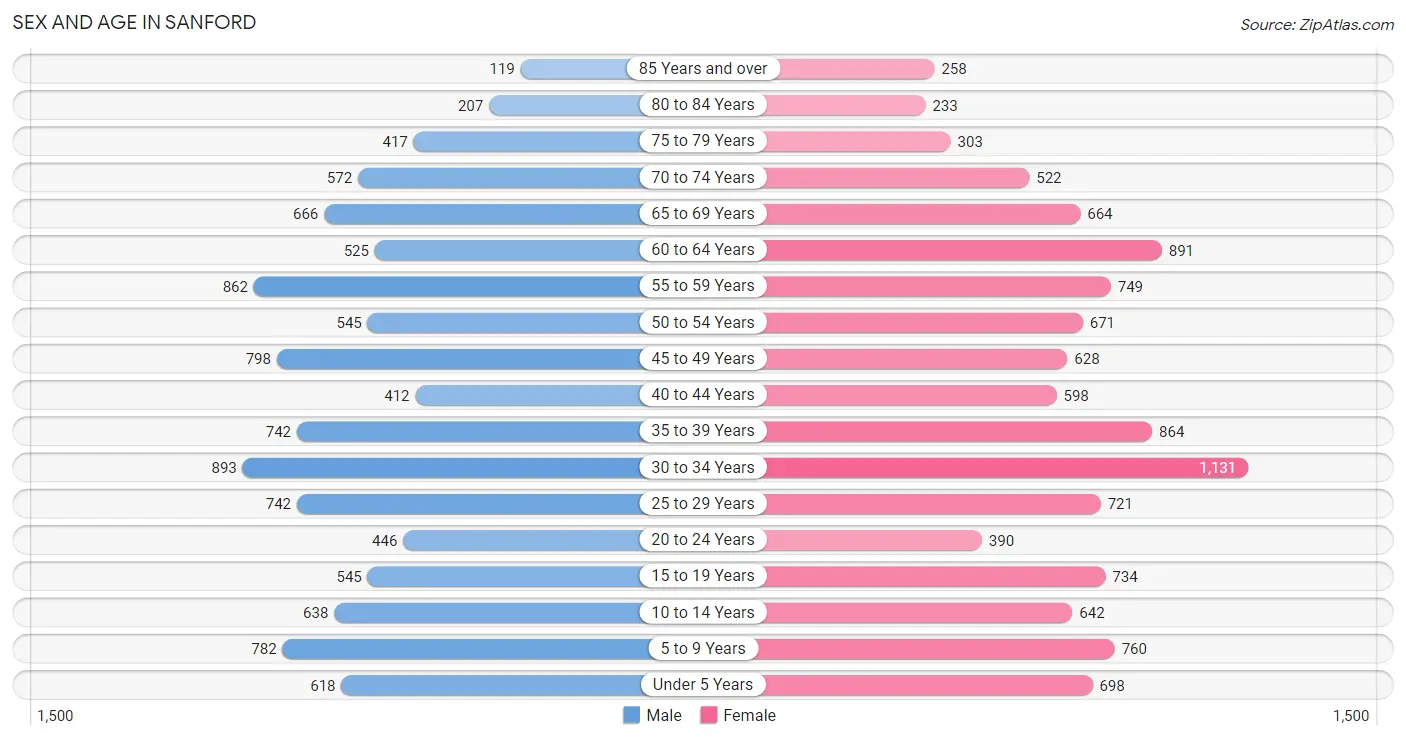
Sex and Age in Sanford
Sex and Age in Sanford
The most populous age groups in Sanford are 30 to 34 Years (893 | 8.5%) for men and 30 to 34 Years (1,131 | 9.9%) for women.
| Age Bracket | Male | Female |
| Under 5 Years | 618 (5.9%) | 698 (6.1%) |
| 5 to 9 Years | 782 (7.4%) | 760 (6.6%) |
| 10 to 14 Years | 638 (6.1%) | 642 (5.6%) |
| 15 to 19 Years | 545 (5.2%) | 734 (6.4%) |
| 20 to 24 Years | 446 (4.2%) | 390 (3.4%) |
| 25 to 29 Years | 742 (7.0%) | 721 (6.3%) |
| 30 to 34 Years | 893 (8.5%) | 1,131 (9.9%) |
| 35 to 39 Years | 742 (7.0%) | 864 (7.5%) |
| 40 to 44 Years | 412 (3.9%) | 598 (5.2%) |
| 45 to 49 Years | 798 (7.6%) | 628 (5.5%) |
| 50 to 54 Years | 545 (5.2%) | 671 (5.9%) |
| 55 to 59 Years | 862 (8.2%) | 749 (6.5%) |
| 60 to 64 Years | 525 (5.0%) | 891 (7.8%) |
| 65 to 69 Years | 666 (6.3%) | 664 (5.8%) |
| 70 to 74 Years | 572 (5.4%) | 522 (4.6%) |
| 75 to 79 Years | 417 (4.0%) | 303 (2.6%) |
| 80 to 84 Years | 207 (2.0%) | 233 (2.0%) |
| 85 Years and over | 119 (1.1%) | 258 (2.2%) |
| Total | 10,529 (100.0%) | 11,457 (100.0%) |
Families and Households in Sanford
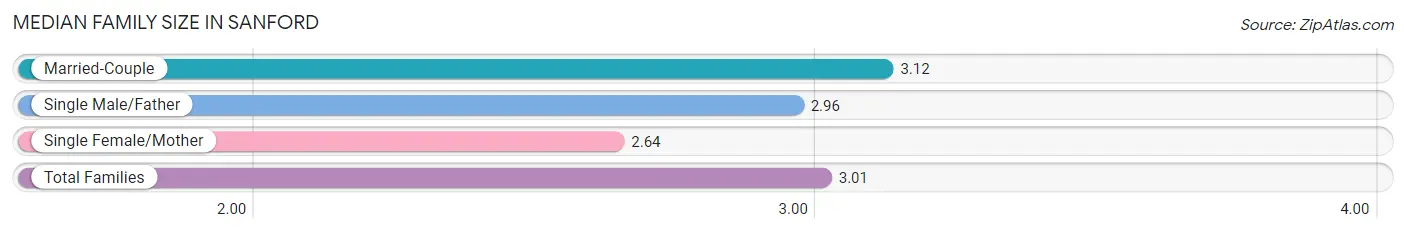
Median Family Size in Sanford
The median family size in Sanford is 3.01 persons per family, with married-couple families (3,823 | 71.6%) accounting for the largest median family size of 3.12 persons per family. On the other hand, single female/mother families (1,150 | 21.5%) represent the smallest median family size with 2.64 persons per family.
| Family Type | # Families | Family Size |
| Married-Couple | 3,823 (71.6%) | 3.12 |
| Single Male/Father | 365 (6.8%) | 2.96 |
| Single Female/Mother | 1,150 (21.5%) | 2.64 |
| Total Families | 5,338 (100.0%) | 3.01 |
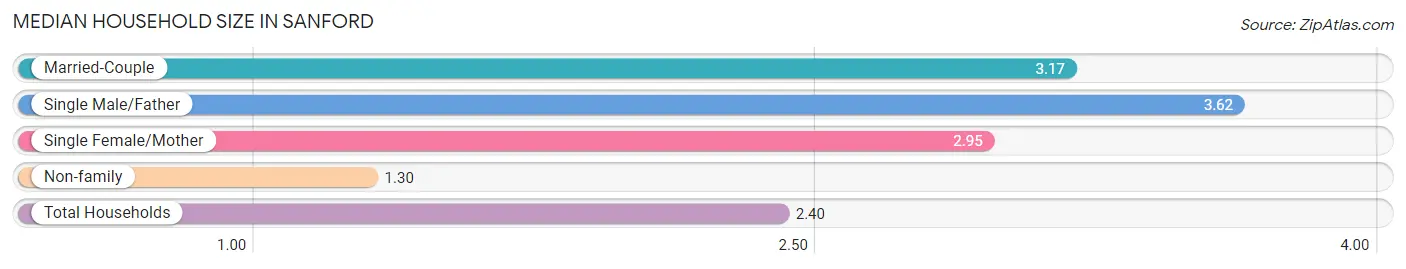
Median Household Size in Sanford
The median household size in Sanford is 2.40 persons per household, with single male/father households (365 | 4.1%) accounting for the largest median household size of 3.62 persons per household. non-family households (3,681 | 40.8%) represent the smallest median household size with 1.30 persons per household.
| Household Type | # Households | Household Size |
| Married-Couple | 3,823 (42.4%) | 3.17 |
| Single Male/Father | 365 (4.1%) | 3.62 |
| Single Female/Mother | 1,150 (12.8%) | 2.95 |
| Non-family | 3,681 (40.8%) | 1.30 |
| Total Households | 9,019 (100.0%) | 2.40 |
Household Size by Marriage Status in Sanford
Out of a total of 9,019 households in Sanford, 5,338 (59.2%) are family households, while 3,681 (40.8%) are nonfamily households. The most numerous type of family households are 2-person households, comprising 2,221, and the most common type of nonfamily households are 1-person households, comprising 2,762.
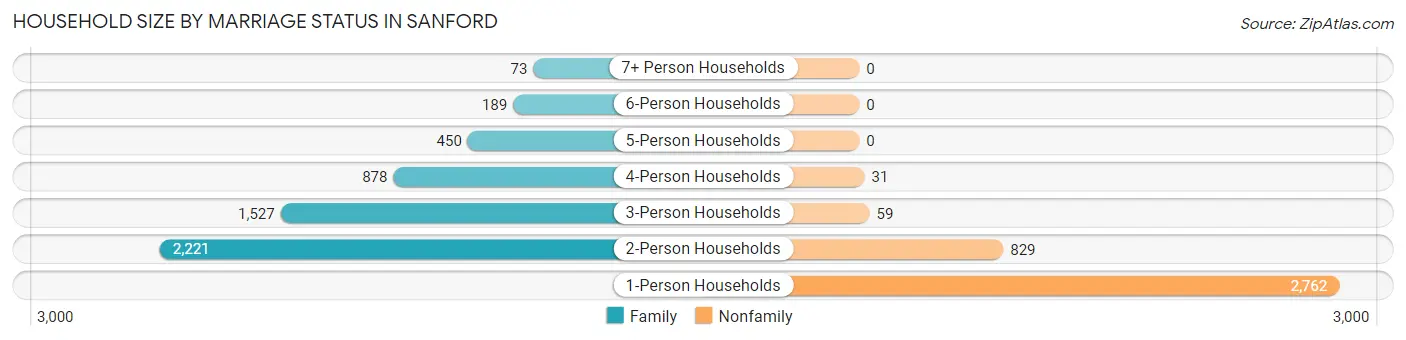
| Household Size | Family Households | Nonfamily Households |
| 1-Person Households | - | 2,762 (30.6%) |
| 2-Person Households | 2,221 (24.6%) | 829 (9.2%) |
| 3-Person Households | 1,527 (16.9%) | 59 (0.6%) |
| 4-Person Households | 878 (9.7%) | 31 (0.3%) |
| 5-Person Households | 450 (5.0%) | 0 (0.0%) |
| 6-Person Households | 189 (2.1%) | 0 (0.0%) |
| 7+ Person Households | 73 (0.8%) | 0 (0.0%) |
| Total | 5,338 (59.2%) | 3,681 (40.8%) |
Female Fertility in Sanford
Fertility by Age in Sanford
Average fertility rate in Sanford is 62.0 births per 1,000 women. Women in the age bracket of 20 to 34 years have the highest fertility rate with 117.0 births per 1,000 women. Women in the age bracket of 20 to 34 years acount for 80.9% of all women with births.
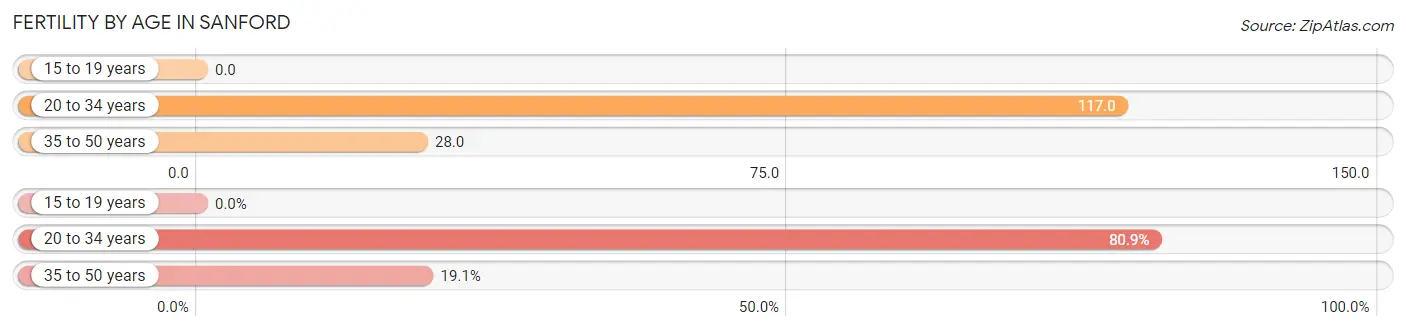
| Age Bracket | Women with Births | Births / 1,000 Women |
| 15 to 19 years | 0 (0.0%) | 0.0 |
| 20 to 34 years | 262 (80.9%) | 117.0 |
| 35 to 50 years | 62 (19.1%) | 28.0 |
| Total | 324 (100.0%) | 62.0 |
Fertility by Age by Marriage Status in Sanford
53.7% of women with births (324) in Sanford are married. The highest percentage of unmarried women with births falls into 35 to 50 years age bracket with 51.6% of them unmarried at the time of birth, while the lowest percentage of unmarried women with births belong to 20 to 34 years age bracket with 45.0% of them unmarried.
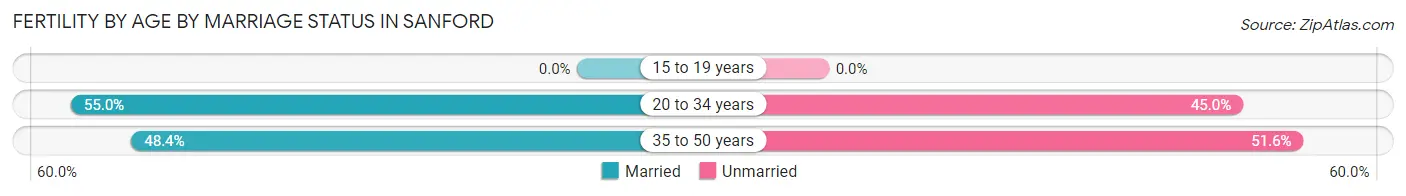
| Age Bracket | Married | Unmarried |
| 15 to 19 years | 0 (0.0%) | 0 (0.0%) |
| 20 to 34 years | 144 (55.0%) | 118 (45.0%) |
| 35 to 50 years | 30 (48.4%) | 32 (51.6%) |
| Total | 174 (53.7%) | 150 (46.3%) |
Fertility by Education in Sanford
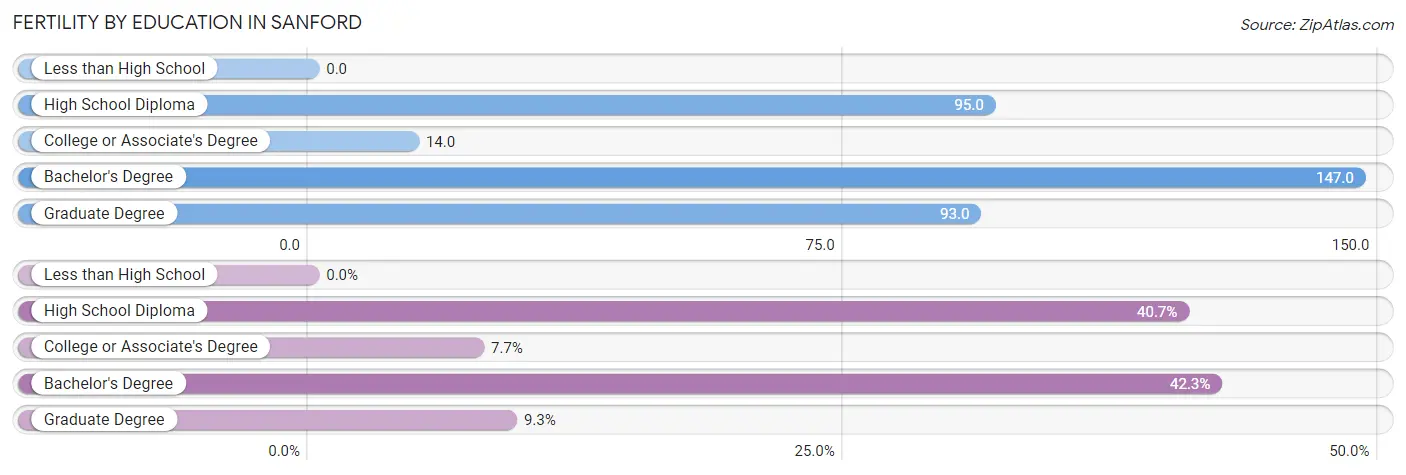
| Educational Attainment | Women with Births | Births / 1,000 Women |
| Less than High School | 0 (0.0%) | 0.0 |
| High School Diploma | 132 (40.7%) | 95.0 |
| College or Associate's Degree | 25 (7.7%) | 14.0 |
| Bachelor's Degree | 137 (42.3%) | 147.0 |
| Graduate Degree | 30 (9.3%) | 93.0 |
| Total | 324 (100.0%) | 62.0 |
Fertility by Education by Marriage Status in Sanford
46.3% of women with births in Sanford are unmarried. Women with the educational attainment of graduate degree are most likely to be married with 100.0% of them married at childbirth, while women with the educational attainment of college or associate's degree are least likely to be married with 72.0% of them unmarried at childbirth.
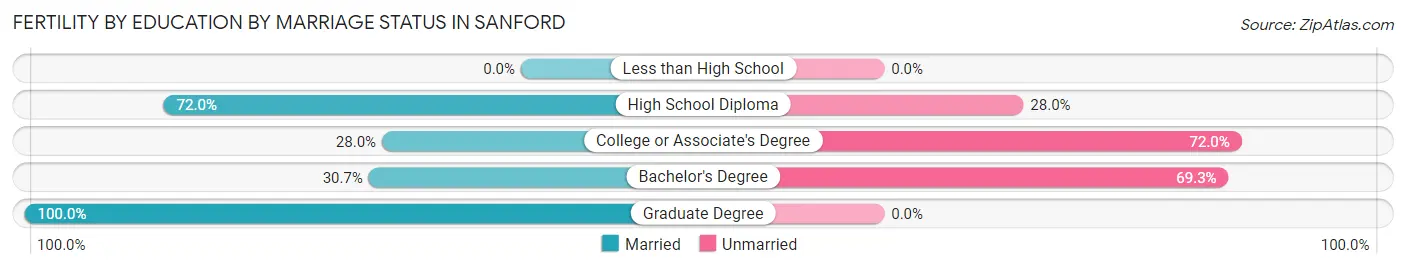
| Educational Attainment | Married | Unmarried |
| Less than High School | 0 (0.0%) | 0 (0.0%) |
| High School Diploma | 95 (72.0%) | 37 (28.0%) |
| College or Associate's Degree | 7 (28.0%) | 18 (72.0%) |
| Bachelor's Degree | 42 (30.7%) | 95 (69.3%) |
| Graduate Degree | 30 (100.0%) | 0 (0.0%) |
| Total | 174 (53.7%) | 150 (46.3%) |
Employment Characteristics in Sanford
Employment by Class of Employer in Sanford
Among the 10,814 employed individuals in Sanford, private company employees (6,919 | 64.0%), not-for-profit organizations (1,331 | 12.3%), and local government employees (776 | 7.2%) make up the most common classes of employment.
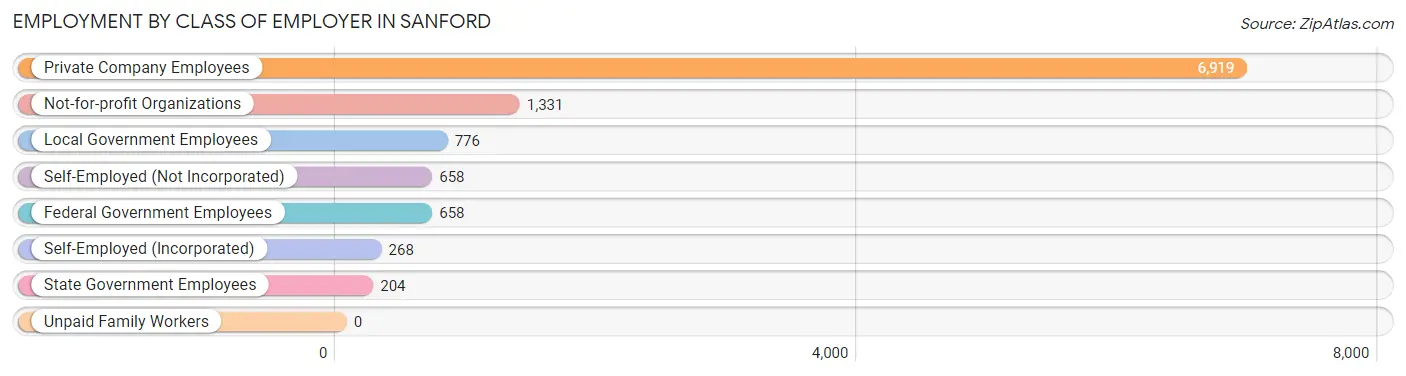
| Employer Class | # Employees | % Employees |
| Private Company Employees | 6,919 | 64.0% |
| Self-Employed (Incorporated) | 268 | 2.5% |
| Self-Employed (Not Incorporated) | 658 | 6.1% |
| Not-for-profit Organizations | 1,331 | 12.3% |
| Local Government Employees | 776 | 7.2% |
| State Government Employees | 204 | 1.9% |
| Federal Government Employees | 658 | 6.1% |
| Unpaid Family Workers | 0 | 0.0% |
| Total | 10,814 | 100.0% |
Employment Status by Age in Sanford
According to the labor force statistics for Sanford, out of the total population over 16 years of age (17,305), 67.3% or 11,646 individuals are in the labor force, with 4.0% or 466 of them unemployed. The age group with the highest labor force participation rate is 25 to 29 years, with 90.1% or 1,318 individuals in the labor force. Within the labor force, the 65 to 74 years age range has the highest percentage of unemployed individuals, with 12.0% or 90 of them being unemployed.
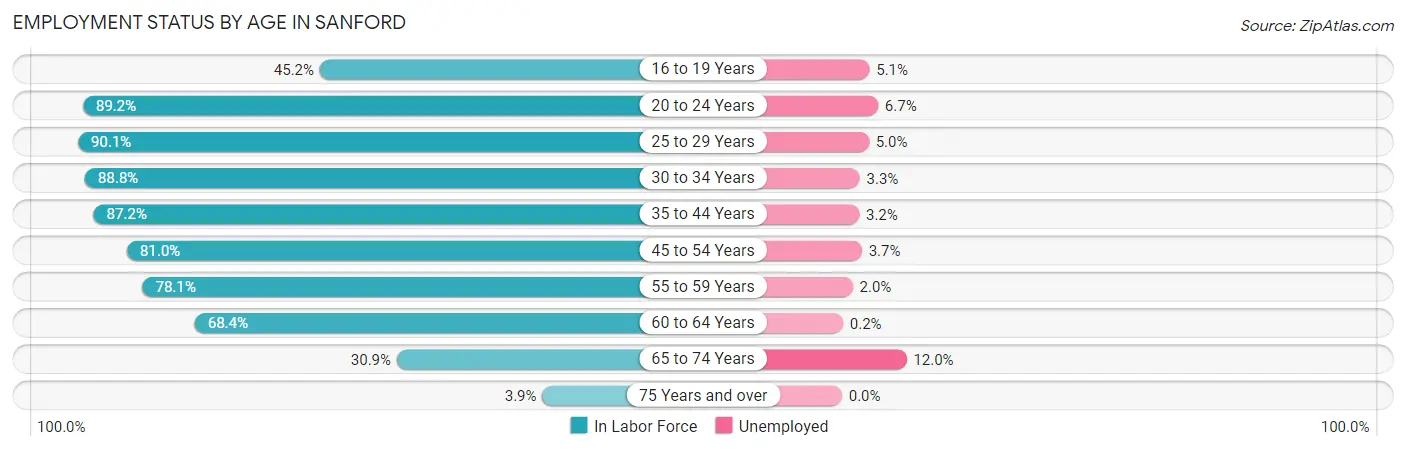
| Age Bracket | In Labor Force | Unemployed |
| 16 to 19 Years | 333 (45.2%) | 17 (5.1%) |
| 20 to 24 Years | 746 (89.2%) | 50 (6.7%) |
| 25 to 29 Years | 1,318 (90.1%) | 66 (5.0%) |
| 30 to 34 Years | 1,797 (88.8%) | 59 (3.3%) |
| 35 to 44 Years | 2,281 (87.2%) | 73 (3.2%) |
| 45 to 54 Years | 2,140 (81.0%) | 79 (3.7%) |
| 55 to 59 Years | 1,258 (78.1%) | 25 (2.0%) |
| 60 to 64 Years | 969 (68.4%) | 2 (0.2%) |
| 65 to 74 Years | 749 (30.9%) | 90 (12.0%) |
| 75 Years and over | 60 (3.9%) | 0 (0.0%) |
| Total | 11,646 (67.3%) | 466 (4.0%) |
Employment Status by Educational Attainment in Sanford
According to labor force statistics for Sanford, 83.0% of individuals (9,771) out of the total population between 25 and 64 years of age (11,772) are in the labor force, with 3.1% or 303 of them being unemployed. The group with the highest labor force participation rate are those with the educational attainment of bachelor's degree or higher, with 92.2% or 2,376 individuals in the labor force. Within the labor force, individuals with high school diploma education have the highest percentage of unemployment, with 4.9% or 177 of them being unemployed.
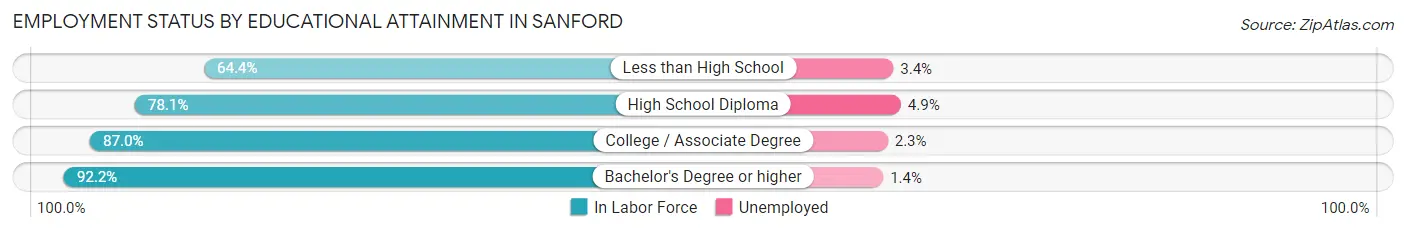
| Educational Attainment | In Labor Force | Unemployed |
| Less than High School | 556 (64.4%) | 29 (3.4%) |
| High School Diploma | 3,609 (78.1%) | 226 (4.9%) |
| College / Associate Degree | 3,229 (87.0%) | 85 (2.3%) |
| Bachelor's Degree or higher | 2,376 (92.2%) | 36 (1.4%) |
| Total | 9,771 (83.0%) | 365 (3.1%) |
Employment Occupations by Sex in Sanford
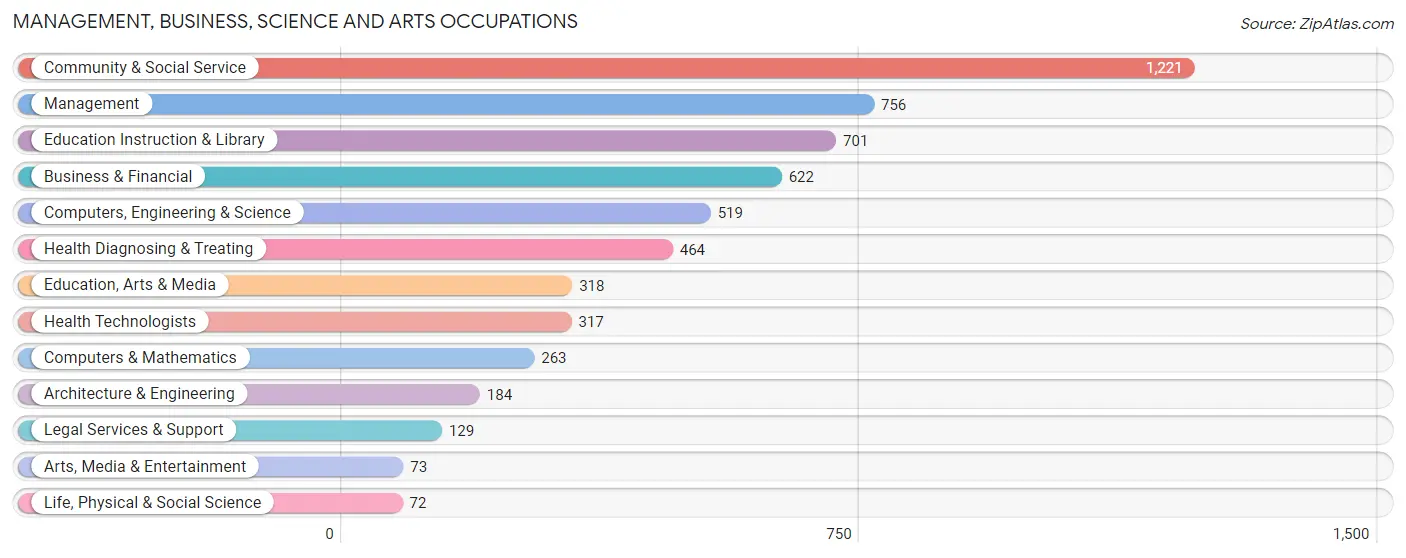
Management, Business, Science and Arts Occupations
The most common Management, Business, Science and Arts occupations in Sanford are Community & Social Service (1,221 | 10.9%), Management (756 | 6.8%), Education Instruction & Library (701 | 6.3%), Business & Financial (622 | 5.6%), and Computers, Engineering & Science (519 | 4.6%).
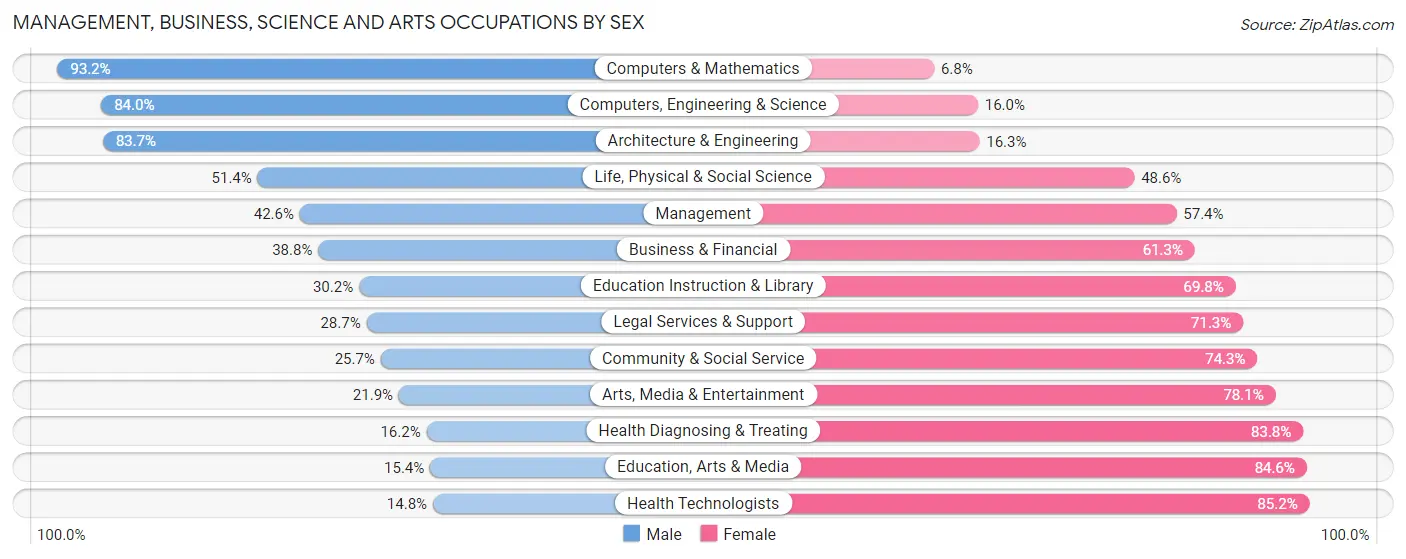
Management, Business, Science and Arts Occupations by Sex
Within the Management, Business, Science and Arts occupations in Sanford, the most male-oriented occupations are Computers & Mathematics (93.2%), Computers, Engineering & Science (84.0%), and Architecture & Engineering (83.7%), while the most female-oriented occupations are Health Technologists (85.2%), Education, Arts & Media (84.6%), and Health Diagnosing & Treating (83.8%).
| Occupation | Male | Female |
| Management | 322 (42.6%) | 434 (57.4%) |
| Business & Financial | 241 (38.8%) | 381 (61.3%) |
| Computers, Engineering & Science | 436 (84.0%) | 83 (16.0%) |
| Computers & Mathematics | 245 (93.2%) | 18 (6.8%) |
| Architecture & Engineering | 154 (83.7%) | 30 (16.3%) |
| Life, Physical & Social Science | 37 (51.4%) | 35 (48.6%) |
| Community & Social Service | 314 (25.7%) | 907 (74.3%) |
| Education, Arts & Media | 49 (15.4%) | 269 (84.6%) |
| Legal Services & Support | 37 (28.7%) | 92 (71.3%) |
| Education Instruction & Library | 212 (30.2%) | 489 (69.8%) |
| Arts, Media & Entertainment | 16 (21.9%) | 57 (78.1%) |
| Health Diagnosing & Treating | 75 (16.2%) | 389 (83.8%) |
| Health Technologists | 47 (14.8%) | 270 (85.2%) |
| Total (Category) | 1,388 (38.8%) | 2,194 (61.3%) |
| Total (Overall) | 5,525 (49.5%) | 5,640 (50.5%) |
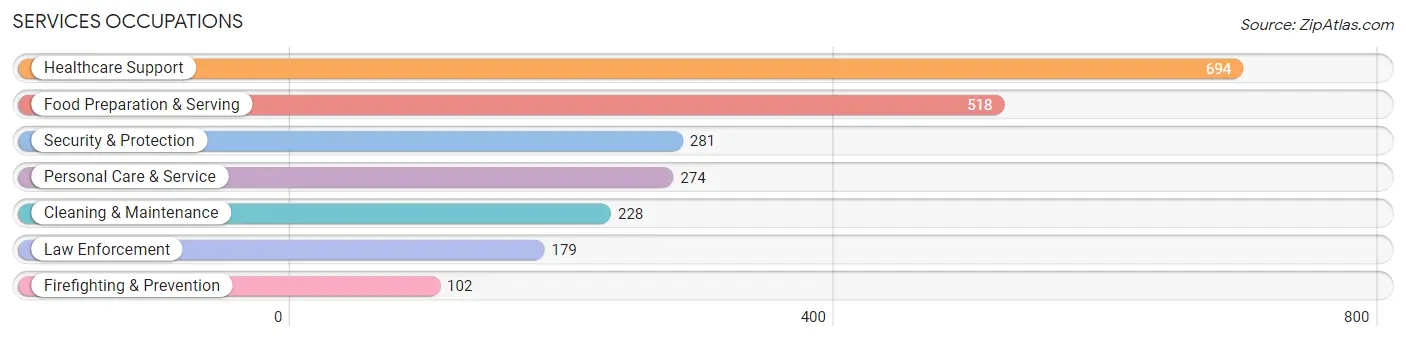
Services Occupations
The most common Services occupations in Sanford are Healthcare Support (694 | 6.2%), Food Preparation & Serving (518 | 4.6%), Security & Protection (281 | 2.5%), Personal Care & Service (274 | 2.5%), and Cleaning & Maintenance (228 | 2.0%).
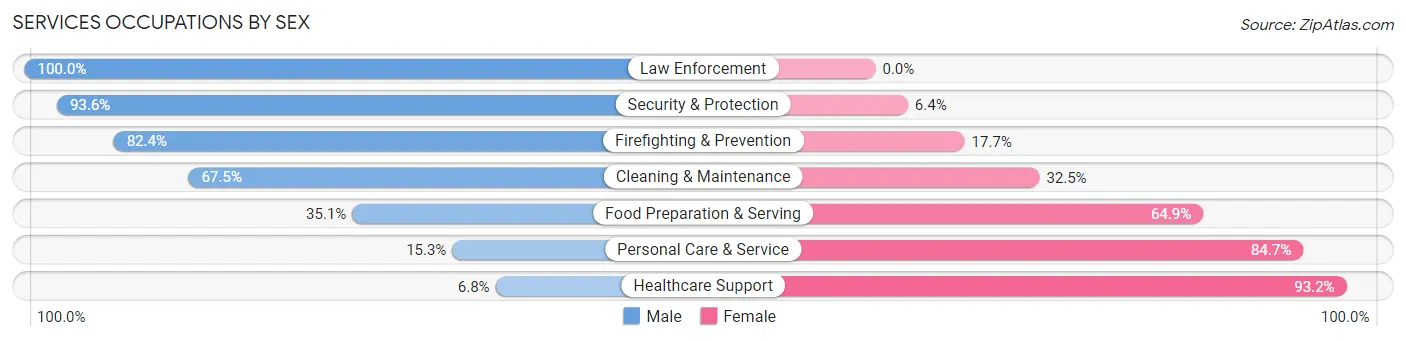
Services Occupations by Sex
Within the Services occupations in Sanford, the most male-oriented occupations are Law Enforcement (100.0%), Security & Protection (93.6%), and Firefighting & Prevention (82.4%), while the most female-oriented occupations are Healthcare Support (93.2%), Personal Care & Service (84.7%), and Food Preparation & Serving (64.9%).
| Occupation | Male | Female |
| Healthcare Support | 47 (6.8%) | 647 (93.2%) |
| Security & Protection | 263 (93.6%) | 18 (6.4%) |
| Firefighting & Prevention | 84 (82.4%) | 18 (17.6%) |
| Law Enforcement | 179 (100.0%) | 0 (0.0%) |
| Food Preparation & Serving | 182 (35.1%) | 336 (64.9%) |
| Cleaning & Maintenance | 154 (67.5%) | 74 (32.5%) |
| Personal Care & Service | 42 (15.3%) | 232 (84.7%) |
| Total (Category) | 688 (34.5%) | 1,307 (65.5%) |
| Total (Overall) | 5,525 (49.5%) | 5,640 (50.5%) |
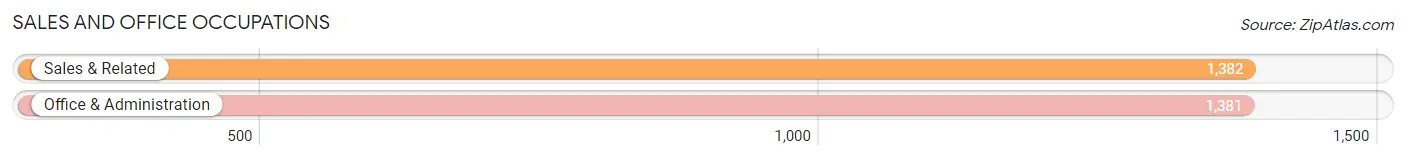
Sales and Office Occupations
The most common Sales and Office occupations in Sanford are Sales & Related (1,382 | 12.4%), and Office & Administration (1,381 | 12.4%).
Sales and Office Occupations by Sex
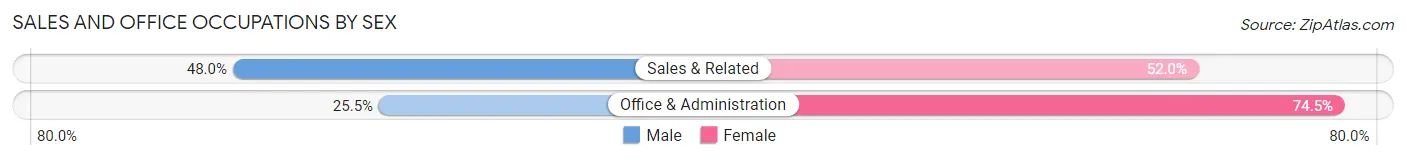
| Occupation | Male | Female |
| Sales & Related | 663 (48.0%) | 719 (52.0%) |
| Office & Administration | 352 (25.5%) | 1,029 (74.5%) |
| Total (Category) | 1,015 (36.7%) | 1,748 (63.3%) |
| Total (Overall) | 5,525 (49.5%) | 5,640 (50.5%) |
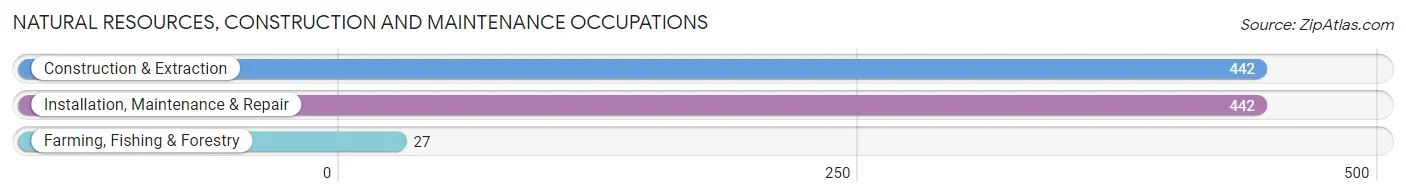
Natural Resources, Construction and Maintenance Occupations
The most common Natural Resources, Construction and Maintenance occupations in Sanford are Construction & Extraction (442 | 4.0%), Installation, Maintenance & Repair (442 | 4.0%), and Farming, Fishing & Forestry (27 | 0.2%).
Natural Resources, Construction and Maintenance Occupations by Sex
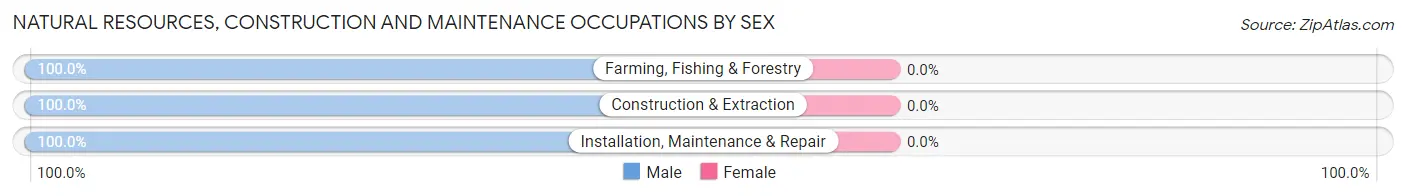
| Occupation | Male | Female |
| Farming, Fishing & Forestry | 27 (100.0%) | 0 (0.0%) |
| Construction & Extraction | 442 (100.0%) | 0 (0.0%) |
| Installation, Maintenance & Repair | 442 (100.0%) | 0 (0.0%) |
| Total (Category) | 911 (100.0%) | 0 (0.0%) |
| Total (Overall) | 5,525 (49.5%) | 5,640 (50.5%) |
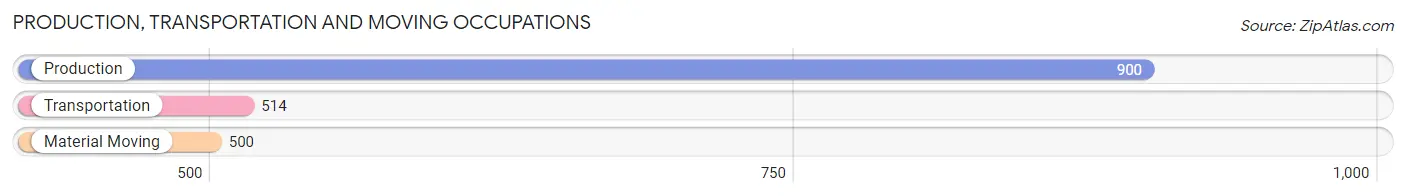
Production, Transportation and Moving Occupations
The most common Production, Transportation and Moving occupations in Sanford are Production (900 | 8.1%), Transportation (514 | 4.6%), and Material Moving (500 | 4.5%).
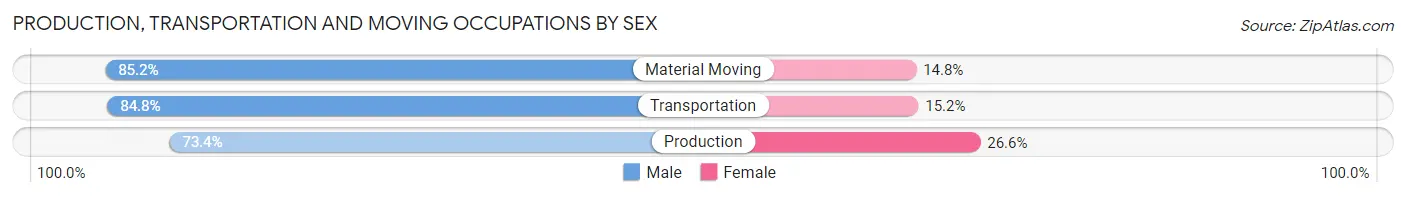
Production, Transportation and Moving Occupations by Sex
| Occupation | Male | Female |
| Production | 661 (73.4%) | 239 (26.6%) |
| Transportation | 436 (84.8%) | 78 (15.2%) |
| Material Moving | 426 (85.2%) | 74 (14.8%) |
| Total (Category) | 1,523 (79.6%) | 391 (20.4%) |
| Total (Overall) | 5,525 (49.5%) | 5,640 (50.5%) |
Employment Industries by Sex in Sanford
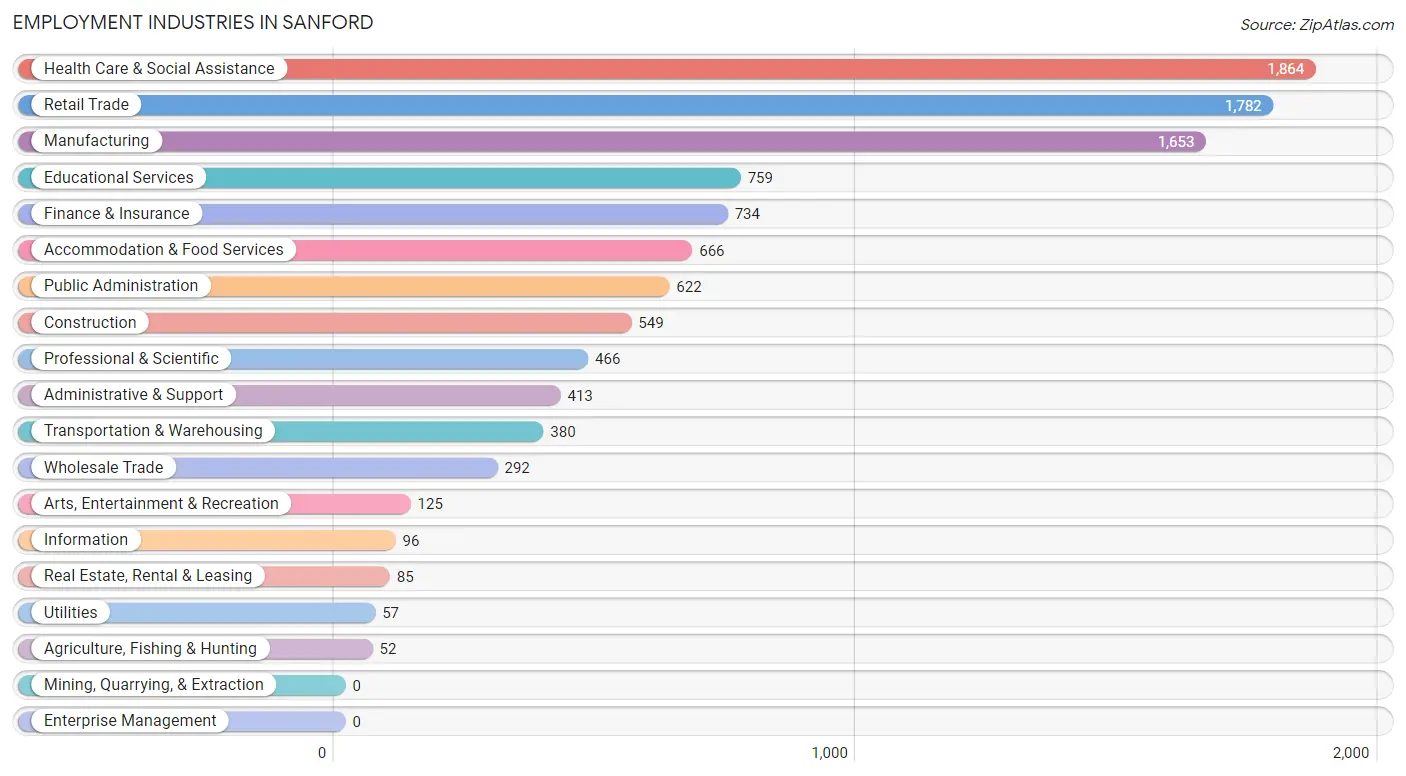
Employment Industries in Sanford
The major employment industries in Sanford include Health Care & Social Assistance (1,864 | 16.7%), Retail Trade (1,782 | 16.0%), Manufacturing (1,653 | 14.8%), Educational Services (759 | 6.8%), and Finance & Insurance (734 | 6.6%).
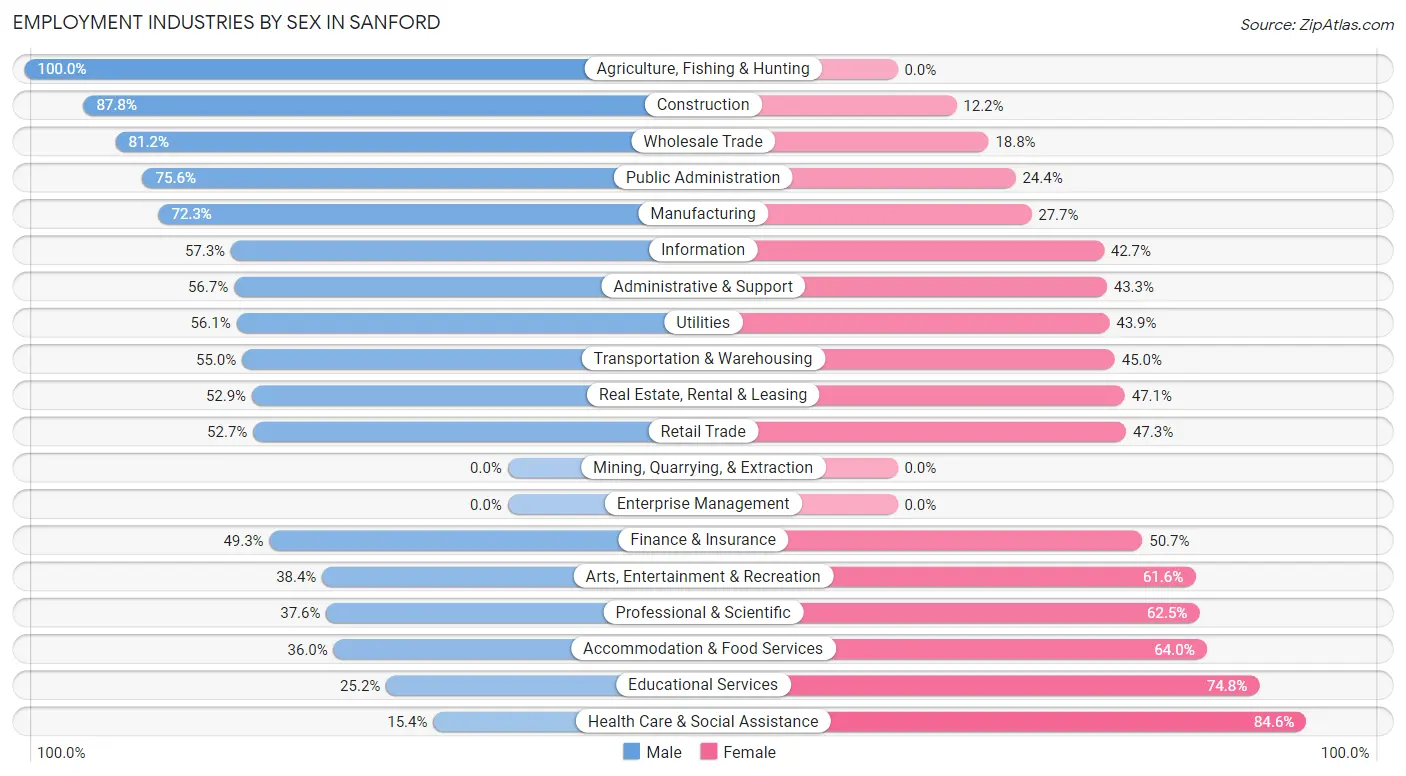
Employment Industries by Sex in Sanford
The Sanford industries that see more men than women are Agriculture, Fishing & Hunting (100.0%), Construction (87.8%), and Wholesale Trade (81.2%), whereas the industries that tend to have a higher number of women are Health Care & Social Assistance (84.6%), Educational Services (74.8%), and Accommodation & Food Services (64.0%).
| Industry | Male | Female |
| Agriculture, Fishing & Hunting | 52 (100.0%) | 0 (0.0%) |
| Mining, Quarrying, & Extraction | 0 (0.0%) | 0 (0.0%) |
| Construction | 482 (87.8%) | 67 (12.2%) |
| Manufacturing | 1,195 (72.3%) | 458 (27.7%) |
| Wholesale Trade | 237 (81.2%) | 55 (18.8%) |
| Retail Trade | 939 (52.7%) | 843 (47.3%) |
| Transportation & Warehousing | 209 (55.0%) | 171 (45.0%) |
| Utilities | 32 (56.1%) | 25 (43.9%) |
| Information | 55 (57.3%) | 41 (42.7%) |
| Finance & Insurance | 362 (49.3%) | 372 (50.7%) |
| Real Estate, Rental & Leasing | 45 (52.9%) | 40 (47.1%) |
| Professional & Scientific | 175 (37.6%) | 291 (62.5%) |
| Enterprise Management | 0 (0.0%) | 0 (0.0%) |
| Administrative & Support | 234 (56.7%) | 179 (43.3%) |
| Educational Services | 191 (25.2%) | 568 (74.8%) |
| Health Care & Social Assistance | 287 (15.4%) | 1,577 (84.6%) |
| Arts, Entertainment & Recreation | 48 (38.4%) | 77 (61.6%) |
| Accommodation & Food Services | 240 (36.0%) | 426 (64.0%) |
| Public Administration | 470 (75.6%) | 152 (24.4%) |
| Total | 5,525 (49.5%) | 5,640 (50.5%) |
Education in Sanford
School Enrollment in Sanford
The most common levels of schooling among the 4,755 students in Sanford are elementary school (1,236 | 26.0%), high school (1,128 | 23.7%), and middle school (925 | 19.5%).
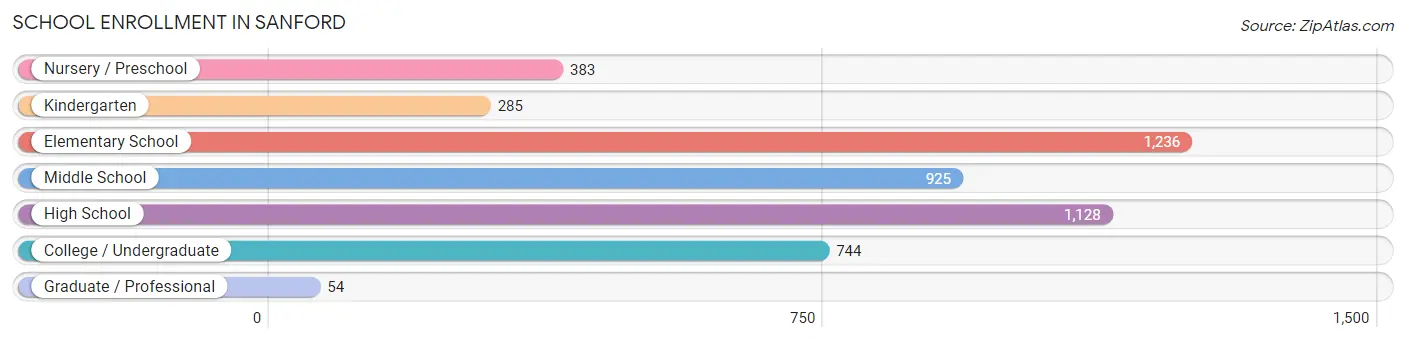
| School Level | # Students | % Students |
| Nursery / Preschool | 383 | 8.1% |
| Kindergarten | 285 | 6.0% |
| Elementary School | 1,236 | 26.0% |
| Middle School | 925 | 19.5% |
| High School | 1,128 | 23.7% |
| College / Undergraduate | 744 | 15.7% |
| Graduate / Professional | 54 | 1.1% |
| Total | 4,755 | 100.0% |
School Enrollment by Age by Funding Source in Sanford
Out of a total of 4,755 students who are enrolled in schools in Sanford, 694 (14.6%) attend a private institution, while the remaining 4,061 (85.4%) are enrolled in public schools. The age group of 3 to 4 year olds has the highest likelihood of being enrolled in private schools, with 98 (36.0% in the age bracket) enrolled. Conversely, the age group of 15 to 17 year olds has the lowest likelihood of being enrolled in a private school, with 950 (95.4% in the age bracket) attending a public institution.
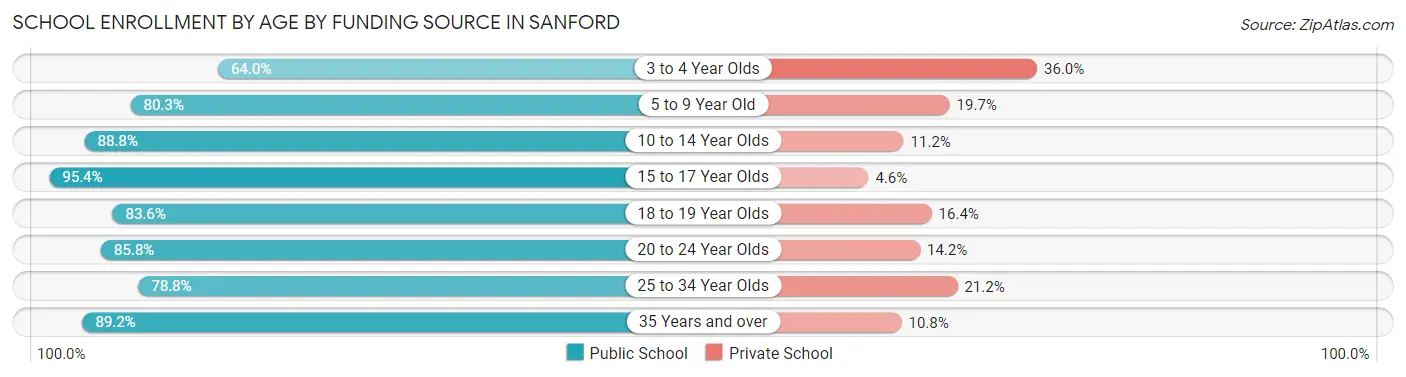
| Age Bracket | Public School | Private School |
| 3 to 4 Year Olds | 174 (64.0%) | 98 (36.0%) |
| 5 to 9 Year Old | 1,118 (80.3%) | 275 (19.7%) |
| 10 to 14 Year Olds | 1,113 (88.8%) | 140 (11.2%) |
| 15 to 17 Year Olds | 950 (95.4%) | 46 (4.6%) |
| 18 to 19 Year Olds | 153 (83.6%) | 30 (16.4%) |
| 20 to 24 Year Olds | 175 (85.8%) | 29 (14.2%) |
| 25 to 34 Year Olds | 197 (78.8%) | 53 (21.2%) |
| 35 Years and over | 182 (89.2%) | 22 (10.8%) |
| Total | 4,061 (85.4%) | 694 (14.6%) |
Educational Attainment by Field of Study in Sanford
Business (749 | 19.8%), education (523 | 13.8%), science & technology (389 | 10.3%), arts & humanities (316 | 8.4%), and bio, nature & agricultural (315 | 8.3%) are the most common fields of study among 3,781 individuals in Sanford who have obtained a bachelor's degree or higher.
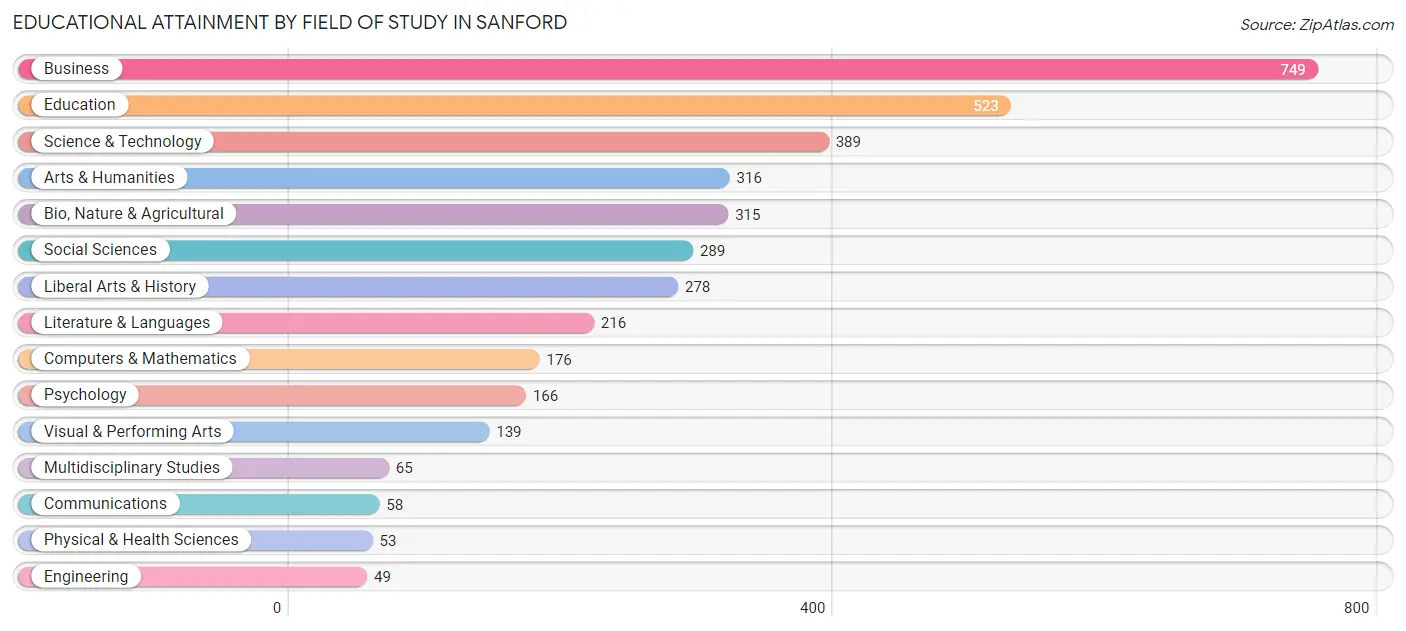
| Field of Study | # Graduates | % Graduates |
| Computers & Mathematics | 176 | 4.6% |
| Bio, Nature & Agricultural | 315 | 8.3% |
| Physical & Health Sciences | 53 | 1.4% |
| Psychology | 166 | 4.4% |
| Social Sciences | 289 | 7.6% |
| Engineering | 49 | 1.3% |
| Multidisciplinary Studies | 65 | 1.7% |
| Science & Technology | 389 | 10.3% |
| Business | 749 | 19.8% |
| Education | 523 | 13.8% |
| Literature & Languages | 216 | 5.7% |
| Liberal Arts & History | 278 | 7.3% |
| Visual & Performing Arts | 139 | 3.7% |
| Communications | 58 | 1.5% |
| Arts & Humanities | 316 | 8.4% |
| Total | 3,781 | 100.0% |
Transportation & Commute in Sanford
Vehicle Availability by Sex in Sanford
The most prevalent vehicle ownership categories in Sanford are males with 2 vehicles (2,490, accounting for 46.8%) and females with 2 vehicles (2,472, making up 45.4%).
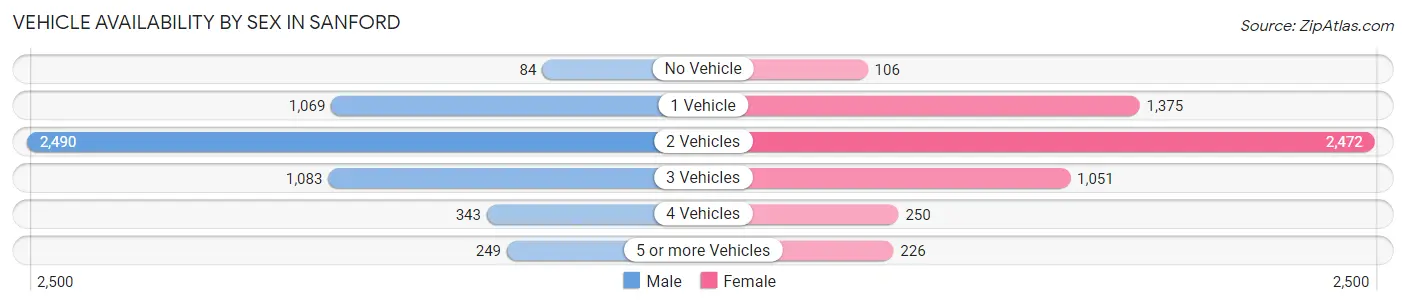
| Vehicles Available | Male | Female |
| No Vehicle | 84 (1.6%) | 106 (1.9%) |
| 1 Vehicle | 1,069 (20.1%) | 1,375 (25.1%) |
| 2 Vehicles | 2,490 (46.8%) | 2,472 (45.1%) |
| 3 Vehicles | 1,083 (20.4%) | 1,051 (19.2%) |
| 4 Vehicles | 343 (6.5%) | 250 (4.6%) |
| 5 or more Vehicles | 249 (4.7%) | 226 (4.1%) |
| Total | 5,318 (100.0%) | 5,480 (100.0%) |
Commute Time in Sanford
The most frequently occuring commute durations in Sanford are 45 to 59 minutes (1,421 commuters, 14.2%), 30 to 34 minutes (1,302 commuters, 13.1%), and 15 to 19 minutes (1,177 commuters, 11.8%).
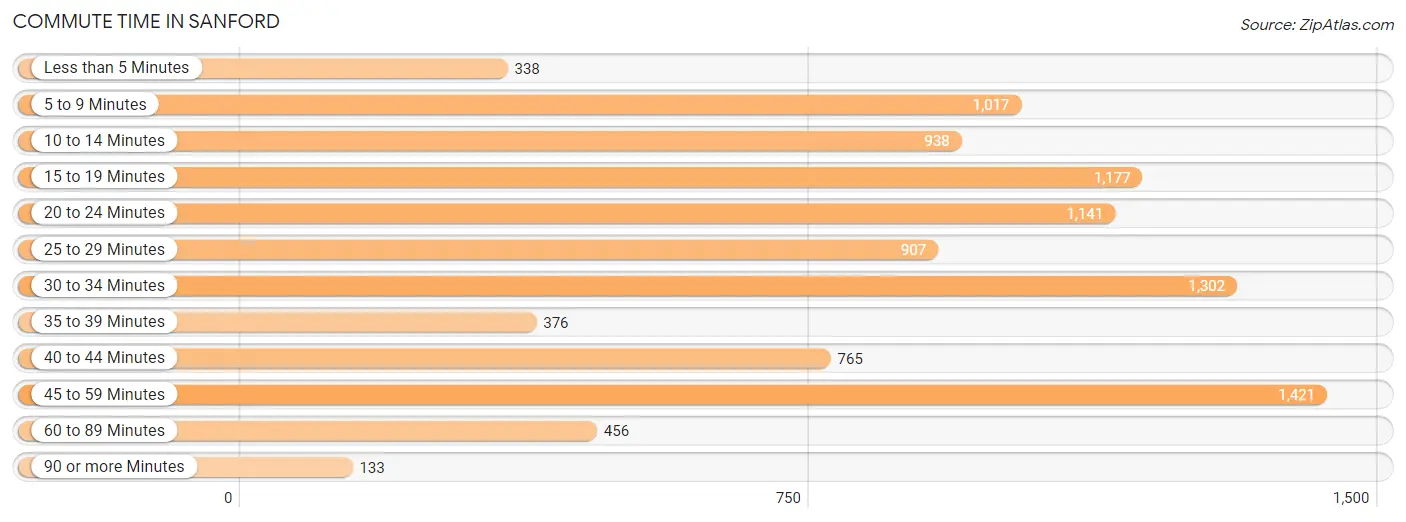
| Commute Time | # Commuters | % Commuters |
| Less than 5 Minutes | 338 | 3.4% |
| 5 to 9 Minutes | 1,017 | 10.2% |
| 10 to 14 Minutes | 938 | 9.4% |
| 15 to 19 Minutes | 1,177 | 11.8% |
| 20 to 24 Minutes | 1,141 | 11.4% |
| 25 to 29 Minutes | 907 | 9.1% |
| 30 to 34 Minutes | 1,302 | 13.1% |
| 35 to 39 Minutes | 376 | 3.8% |
| 40 to 44 Minutes | 765 | 7.7% |
| 45 to 59 Minutes | 1,421 | 14.2% |
| 60 to 89 Minutes | 456 | 4.6% |
| 90 or more Minutes | 133 | 1.3% |
Commute Time by Sex in Sanford
The most common commute times in Sanford are 45 to 59 minutes (898 commuters, 17.9%) for males and 5 to 9 minutes (734 commuters, 14.8%) for females.
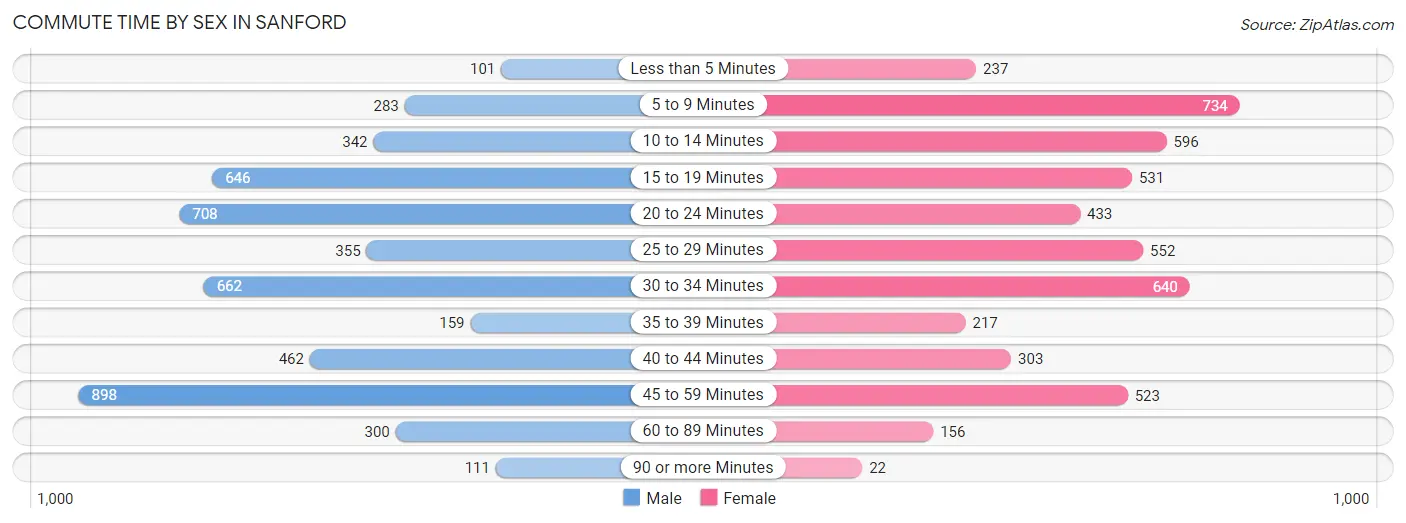
| Commute Time | Male | Female |
| Less than 5 Minutes | 101 (2.0%) | 237 (4.8%) |
| 5 to 9 Minutes | 283 (5.6%) | 734 (14.8%) |
| 10 to 14 Minutes | 342 (6.8%) | 596 (12.1%) |
| 15 to 19 Minutes | 646 (12.9%) | 531 (10.7%) |
| 20 to 24 Minutes | 708 (14.1%) | 433 (8.8%) |
| 25 to 29 Minutes | 355 (7.1%) | 552 (11.2%) |
| 30 to 34 Minutes | 662 (13.2%) | 640 (12.9%) |
| 35 to 39 Minutes | 159 (3.2%) | 217 (4.4%) |
| 40 to 44 Minutes | 462 (9.2%) | 303 (6.1%) |
| 45 to 59 Minutes | 898 (17.9%) | 523 (10.6%) |
| 60 to 89 Minutes | 300 (6.0%) | 156 (3.2%) |
| 90 or more Minutes | 111 (2.2%) | 22 (0.4%) |
Time of Departure to Work by Sex in Sanford
The most frequent times of departure to work in Sanford are 7:30 AM to 7:59 AM (698, 13.9%) for males and 7:00 AM to 7:29 AM (1,058, 21.4%) for females.
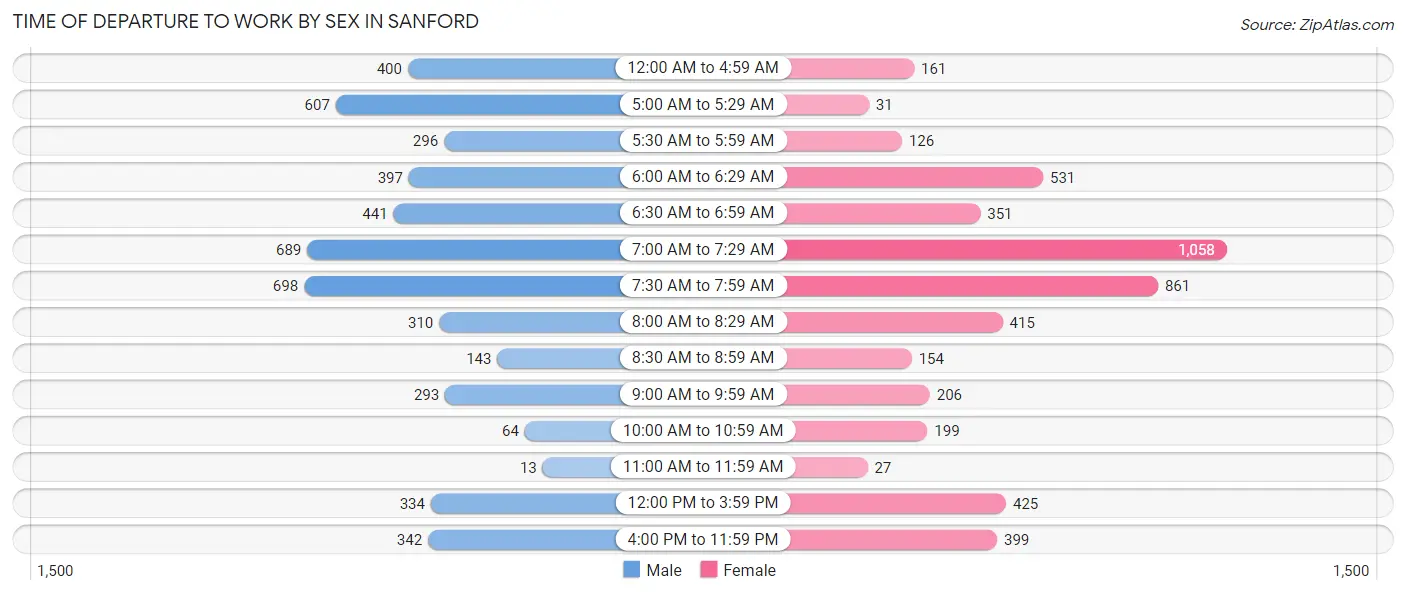
| Time of Departure | Male | Female |
| 12:00 AM to 4:59 AM | 400 (8.0%) | 161 (3.3%) |
| 5:00 AM to 5:29 AM | 607 (12.1%) | 31 (0.6%) |
| 5:30 AM to 5:59 AM | 296 (5.9%) | 126 (2.5%) |
| 6:00 AM to 6:29 AM | 397 (7.9%) | 531 (10.7%) |
| 6:30 AM to 6:59 AM | 441 (8.8%) | 351 (7.1%) |
| 7:00 AM to 7:29 AM | 689 (13.7%) | 1,058 (21.4%) |
| 7:30 AM to 7:59 AM | 698 (13.9%) | 861 (17.4%) |
| 8:00 AM to 8:29 AM | 310 (6.2%) | 415 (8.4%) |
| 8:30 AM to 8:59 AM | 143 (2.8%) | 154 (3.1%) |
| 9:00 AM to 9:59 AM | 293 (5.8%) | 206 (4.2%) |
| 10:00 AM to 10:59 AM | 64 (1.3%) | 199 (4.0%) |
| 11:00 AM to 11:59 AM | 13 (0.3%) | 27 (0.5%) |
| 12:00 PM to 3:59 PM | 334 (6.6%) | 425 (8.6%) |
| 4:00 PM to 11:59 PM | 342 (6.8%) | 399 (8.1%) |
| Total | 5,027 (100.0%) | 4,944 (100.0%) |
Housing Occupancy in Sanford
Occupancy by Ownership in Sanford
Of the total 9,019 dwellings in Sanford, owner-occupied units account for 6,122 (67.9%), while renter-occupied units make up 2,897 (32.1%).
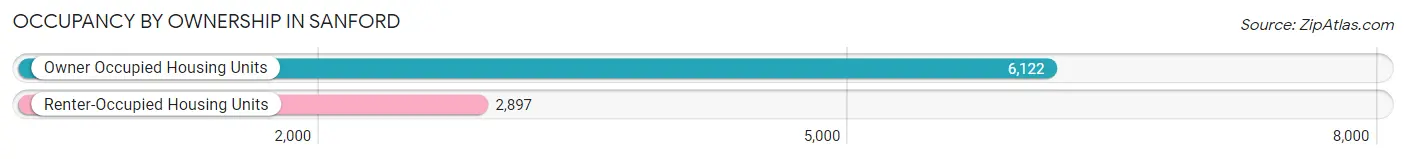
| Occupancy | # Housing Units | % Housing Units |
| Owner Occupied Housing Units | 6,122 | 67.9% |
| Renter-Occupied Housing Units | 2,897 | 32.1% |
| Total Occupied Housing Units | 9,019 | 100.0% |
Occupancy by Household Size in Sanford
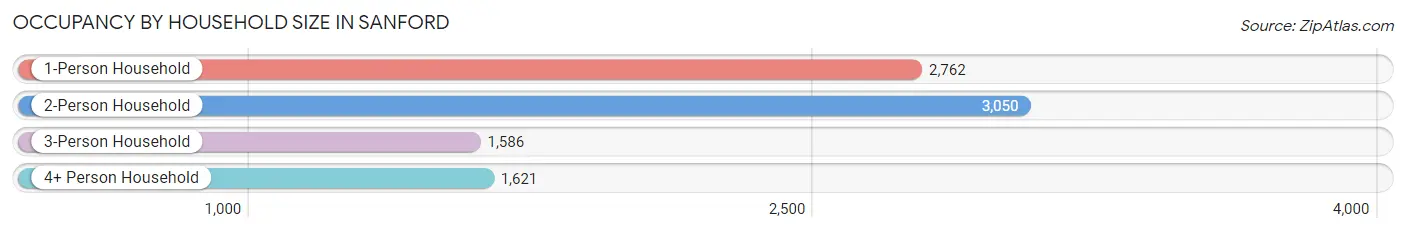
| Household Size | # Housing Units | % Housing Units |
| 1-Person Household | 2,762 | 30.6% |
| 2-Person Household | 3,050 | 33.8% |
| 3-Person Household | 1,586 | 17.6% |
| 4+ Person Household | 1,621 | 18.0% |
| Total Housing Units | 9,019 | 100.0% |
Occupancy by Ownership by Household Size in Sanford
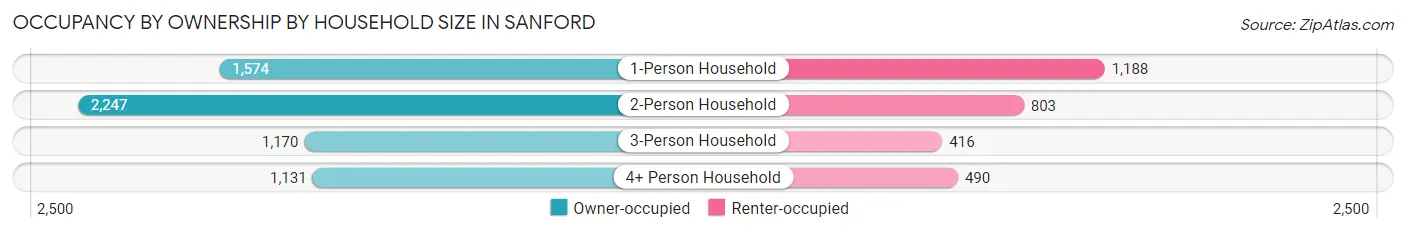
| Household Size | Owner-occupied | Renter-occupied |
| 1-Person Household | 1,574 (57.0%) | 1,188 (43.0%) |
| 2-Person Household | 2,247 (73.7%) | 803 (26.3%) |
| 3-Person Household | 1,170 (73.8%) | 416 (26.2%) |
| 4+ Person Household | 1,131 (69.8%) | 490 (30.2%) |
| Total Housing Units | 6,122 (67.9%) | 2,897 (32.1%) |
Occupancy by Educational Attainment in Sanford
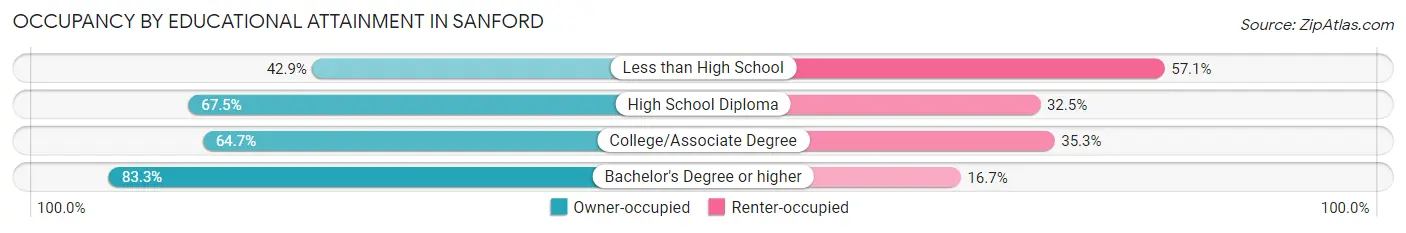
| Household Size | Owner-occupied | Renter-occupied |
| Less than High School | 298 (42.9%) | 397 (57.1%) |
| High School Diploma | 2,127 (67.5%) | 1,023 (32.5%) |
| College/Associate Degree | 2,128 (64.7%) | 1,162 (35.3%) |
| Bachelor's Degree or higher | 1,569 (83.3%) | 315 (16.7%) |
Occupancy by Age of Householder in Sanford
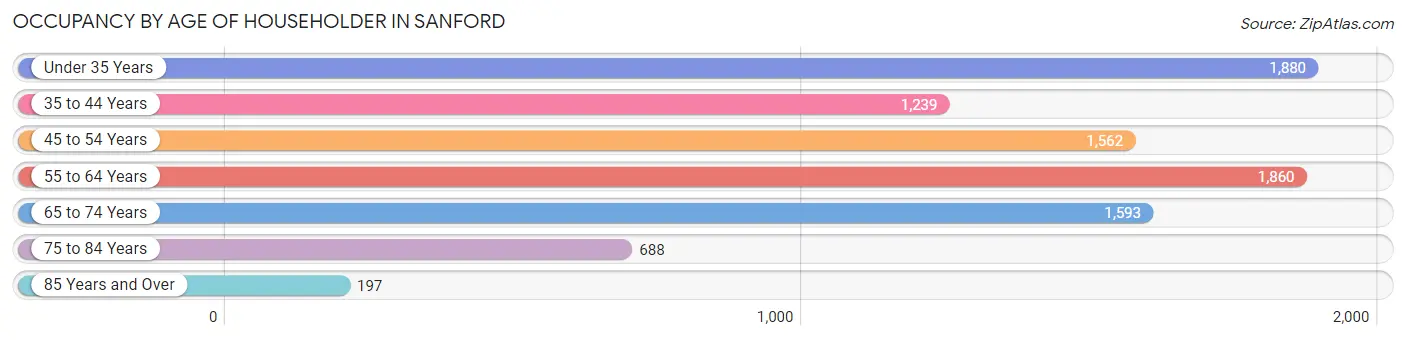
| Age Bracket | # Households | % Households |
| Under 35 Years | 1,880 | 20.8% |
| 35 to 44 Years | 1,239 | 13.7% |
| 45 to 54 Years | 1,562 | 17.3% |
| 55 to 64 Years | 1,860 | 20.6% |
| 65 to 74 Years | 1,593 | 17.7% |
| 75 to 84 Years | 688 | 7.6% |
| 85 Years and Over | 197 | 2.2% |
| Total | 9,019 | 100.0% |
Housing Finances in Sanford
Median Income by Occupancy in Sanford
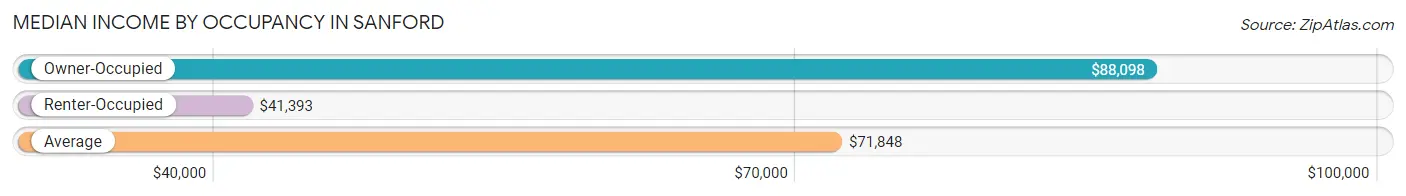
| Occupancy Type | # Households | Median Income |
| Owner-Occupied | 6,122 (67.9%) | $88,098 |
| Renter-Occupied | 2,897 (32.1%) | $41,393 |
| Average | 9,019 (100.0%) | $71,848 |
Occupancy by Householder Income Bracket in Sanford
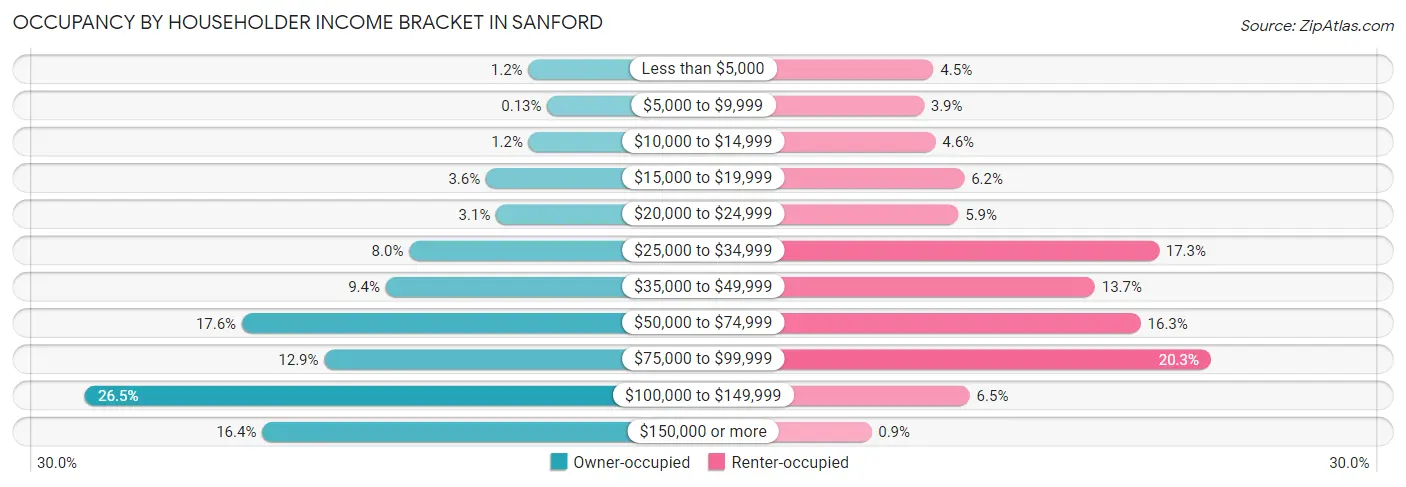
| Income Bracket | Owner-occupied | Renter-occupied |
| Less than $5,000 | 74 (1.2%) | 129 (4.4%) |
| $5,000 to $9,999 | 8 (0.1%) | 113 (3.9%) |
| $10,000 to $14,999 | 73 (1.2%) | 132 (4.6%) |
| $15,000 to $19,999 | 222 (3.6%) | 180 (6.2%) |
| $20,000 to $24,999 | 187 (3.0%) | 170 (5.9%) |
| $25,000 to $34,999 | 491 (8.0%) | 502 (17.3%) |
| $35,000 to $49,999 | 573 (9.4%) | 396 (13.7%) |
| $50,000 to $74,999 | 1,076 (17.6%) | 472 (16.3%) |
| $75,000 to $99,999 | 788 (12.9%) | 588 (20.3%) |
| $100,000 to $149,999 | 1,625 (26.5%) | 189 (6.5%) |
| $150,000 or more | 1,005 (16.4%) | 26 (0.9%) |
| Total | 6,122 (100.0%) | 2,897 (100.0%) |
Monthly Housing Cost Tiers in Sanford
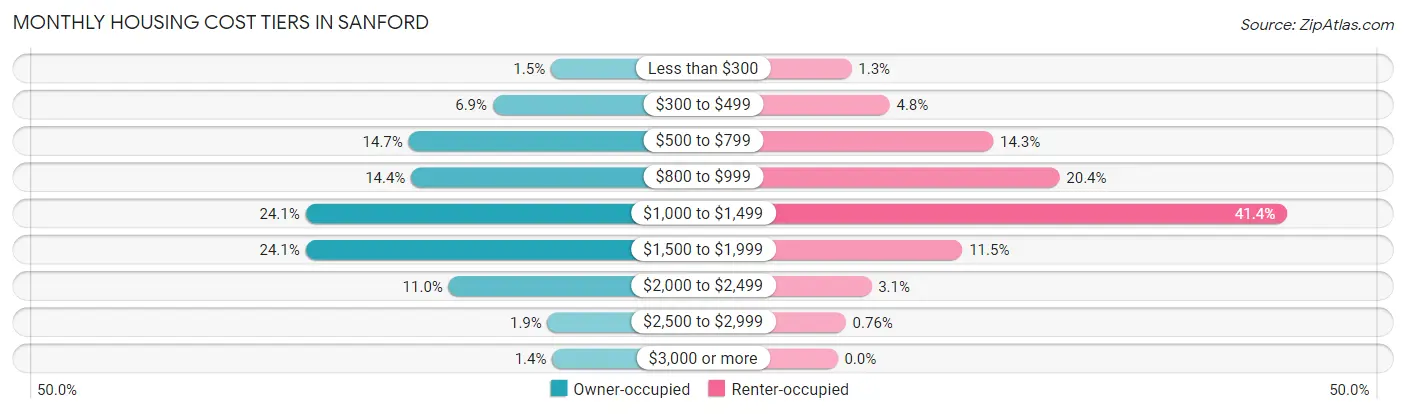
| Monthly Cost | Owner-occupied | Renter-occupied |
| Less than $300 | 94 (1.5%) | 37 (1.3%) |
| $300 to $499 | 422 (6.9%) | 139 (4.8%) |
| $500 to $799 | 897 (14.6%) | 415 (14.3%) |
| $800 to $999 | 882 (14.4%) | 592 (20.4%) |
| $1,000 to $1,499 | 1,478 (24.1%) | 1,199 (41.4%) |
| $1,500 to $1,999 | 1,478 (24.1%) | 333 (11.5%) |
| $2,000 to $2,499 | 671 (11.0%) | 90 (3.1%) |
| $2,500 to $2,999 | 113 (1.8%) | 22 (0.8%) |
| $3,000 or more | 87 (1.4%) | 0 (0.0%) |
| Total | 6,122 (100.0%) | 2,897 (100.0%) |
Physical Housing Characteristics in Sanford
Housing Structures in Sanford
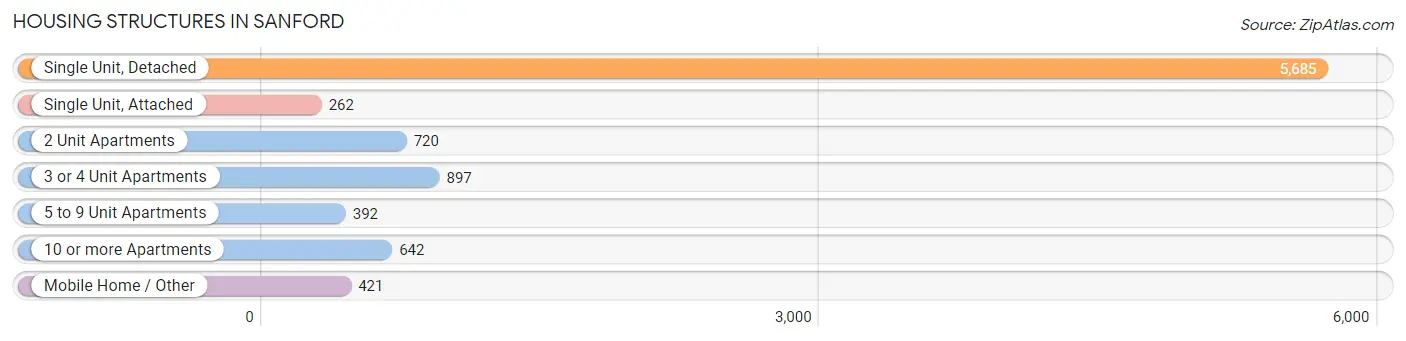
| Structure Type | # Housing Units | % Housing Units |
| Single Unit, Detached | 5,685 | 63.0% |
| Single Unit, Attached | 262 | 2.9% |
| 2 Unit Apartments | 720 | 8.0% |
| 3 or 4 Unit Apartments | 897 | 10.0% |
| 5 to 9 Unit Apartments | 392 | 4.3% |
| 10 or more Apartments | 642 | 7.1% |
| Mobile Home / Other | 421 | 4.7% |
| Total | 9,019 | 100.0% |
Housing Structures by Occupancy in Sanford
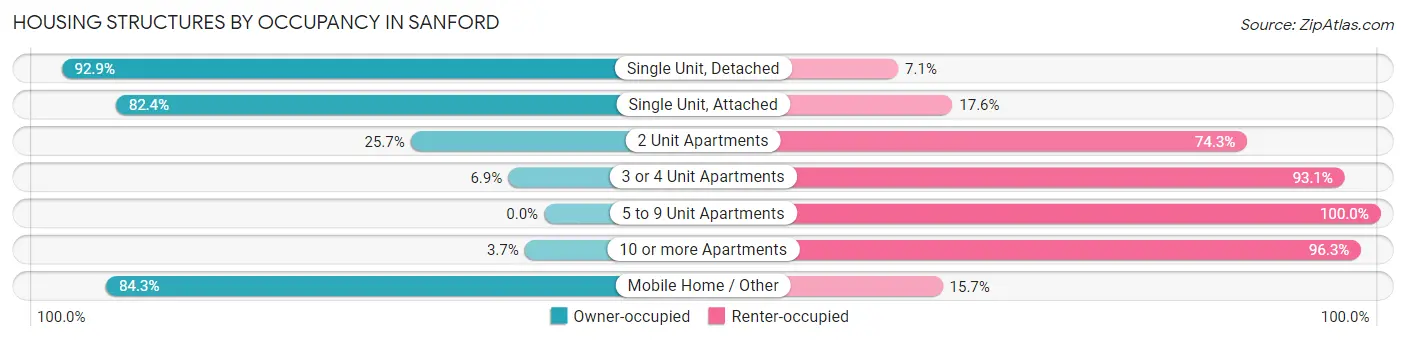
| Structure Type | Owner-occupied | Renter-occupied |
| Single Unit, Detached | 5,280 (92.9%) | 405 (7.1%) |
| Single Unit, Attached | 216 (82.4%) | 46 (17.6%) |
| 2 Unit Apartments | 185 (25.7%) | 535 (74.3%) |
| 3 or 4 Unit Apartments | 62 (6.9%) | 835 (93.1%) |
| 5 to 9 Unit Apartments | 0 (0.0%) | 392 (100.0%) |
| 10 or more Apartments | 24 (3.7%) | 618 (96.3%) |
| Mobile Home / Other | 355 (84.3%) | 66 (15.7%) |
| Total | 6,122 (67.9%) | 2,897 (32.1%) |
Housing Structures by Number of Rooms in Sanford
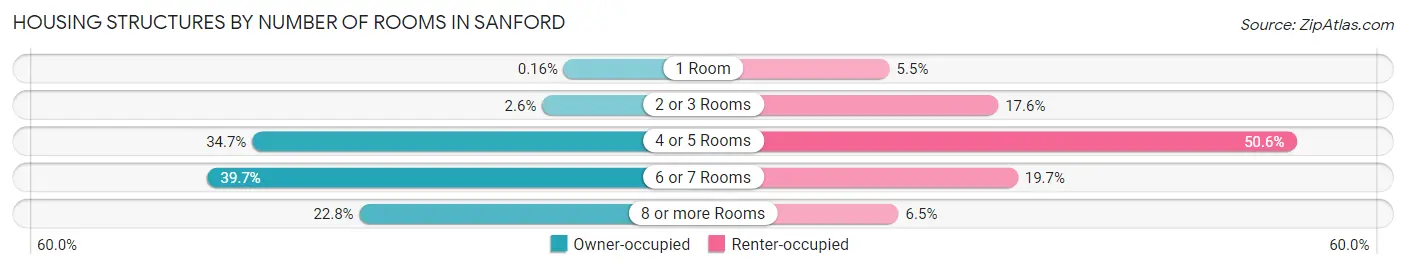
| Number of Rooms | Owner-occupied | Renter-occupied |
| 1 Room | 10 (0.2%) | 160 (5.5%) |
| 2 or 3 Rooms | 156 (2.5%) | 509 (17.6%) |
| 4 or 5 Rooms | 2,127 (34.7%) | 1,467 (50.6%) |
| 6 or 7 Rooms | 2,431 (39.7%) | 572 (19.7%) |
| 8 or more Rooms | 1,398 (22.8%) | 189 (6.5%) |
| Total | 6,122 (100.0%) | 2,897 (100.0%) |
Housing Structure by Heating Type in Sanford
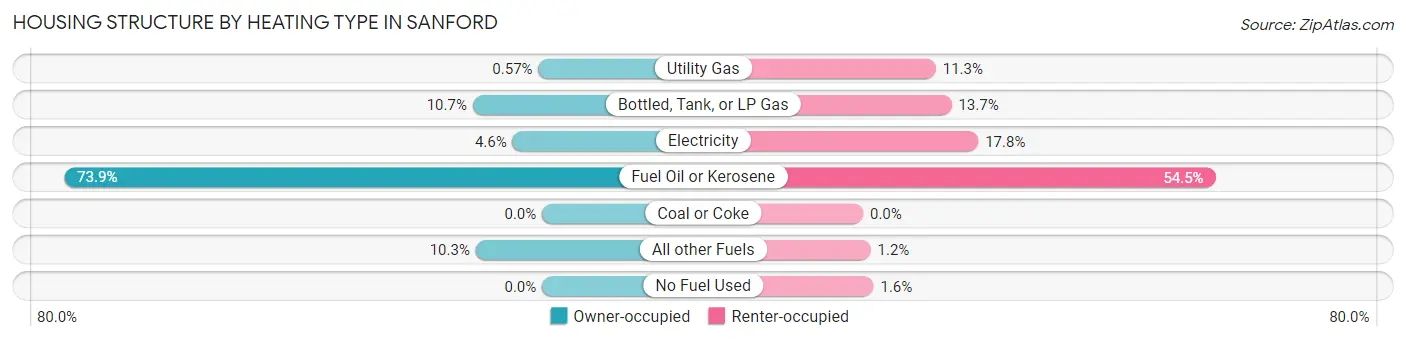
| Heating Type | Owner-occupied | Renter-occupied |
| Utility Gas | 35 (0.6%) | 326 (11.3%) |
| Bottled, Tank, or LP Gas | 656 (10.7%) | 396 (13.7%) |
| Electricity | 280 (4.6%) | 516 (17.8%) |
| Fuel Oil or Kerosene | 4,523 (73.9%) | 1,578 (54.5%) |
| Coal or Coke | 0 (0.0%) | 0 (0.0%) |
| All other Fuels | 628 (10.3%) | 34 (1.2%) |
| No Fuel Used | 0 (0.0%) | 47 (1.6%) |
| Total | 6,122 (100.0%) | 2,897 (100.0%) |
Household Vehicle Usage in Sanford
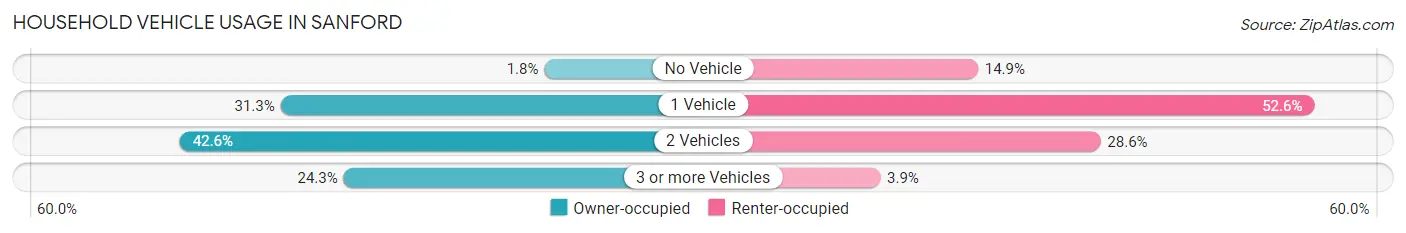
| Vehicles per Household | Owner-occupied | Renter-occupied |
| No Vehicle | 109 (1.8%) | 431 (14.9%) |
| 1 Vehicle | 1,918 (31.3%) | 1,523 (52.6%) |
| 2 Vehicles | 2,609 (42.6%) | 829 (28.6%) |
| 3 or more Vehicles | 1,486 (24.3%) | 114 (3.9%) |
| Total | 6,122 (100.0%) | 2,897 (100.0%) |
Real Estate & Mortgages in Sanford
Real Estate and Mortgage Overview in Sanford
| Characteristic | Without Mortgage | With Mortgage |
| Housing Units | 1,856 | 4,266 |
| Median Property Value | $232,600 | $239,600 |
| Median Household Income | $58,936 | $755 |
| Monthly Housing Costs | $616 | $87 |
| Real Estate Taxes | $3,321 | $15 |
Property Value by Mortgage Status in Sanford
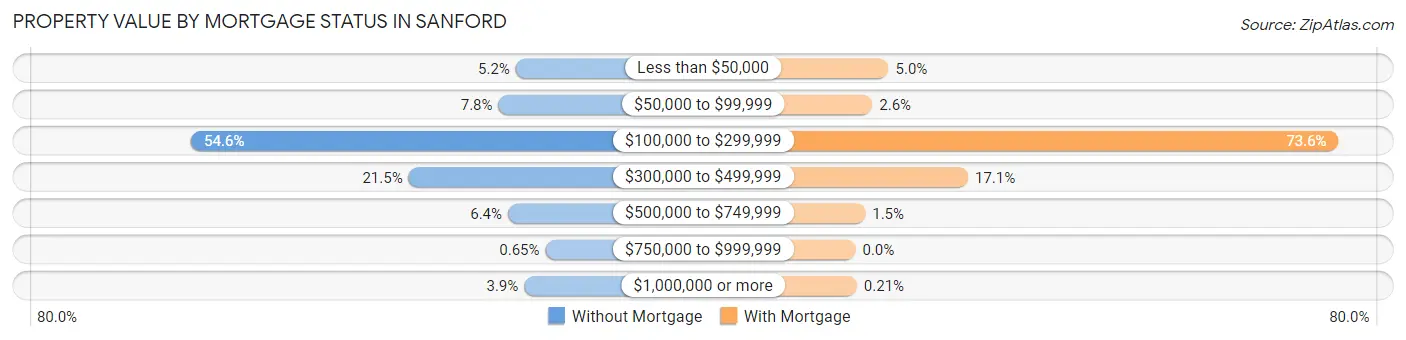
| Property Value | Without Mortgage | With Mortgage |
| Less than $50,000 | 96 (5.2%) | 215 (5.0%) |
| $50,000 to $99,999 | 145 (7.8%) | 109 (2.6%) |
| $100,000 to $299,999 | 1,014 (54.6%) | 3,139 (73.6%) |
| $300,000 to $499,999 | 399 (21.5%) | 731 (17.1%) |
| $500,000 to $749,999 | 118 (6.4%) | 63 (1.5%) |
| $750,000 to $999,999 | 12 (0.6%) | 0 (0.0%) |
| $1,000,000 or more | 72 (3.9%) | 9 (0.2%) |
| Total | 1,856 (100.0%) | 4,266 (100.0%) |
Household Income by Mortgage Status in Sanford
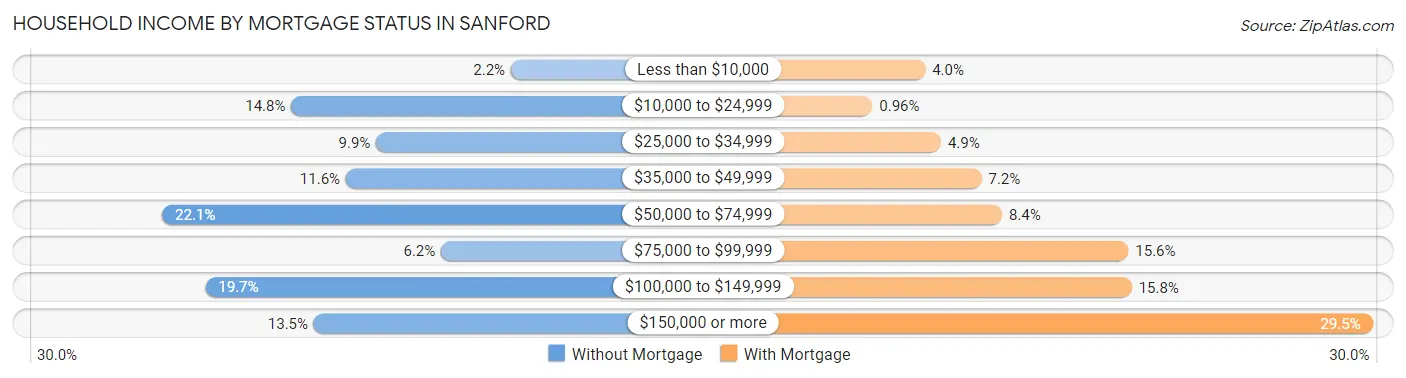
| Household Income | Without Mortgage | With Mortgage |
| Less than $10,000 | 41 (2.2%) | 170 (4.0%) |
| $10,000 to $24,999 | 274 (14.8%) | 41 (1.0%) |
| $25,000 to $34,999 | 184 (9.9%) | 208 (4.9%) |
| $35,000 to $49,999 | 216 (11.6%) | 307 (7.2%) |
| $50,000 to $74,999 | 411 (22.1%) | 357 (8.4%) |
| $75,000 to $99,999 | 115 (6.2%) | 665 (15.6%) |
| $100,000 to $149,999 | 365 (19.7%) | 673 (15.8%) |
| $150,000 or more | 250 (13.5%) | 1,260 (29.5%) |
| Total | 1,856 (100.0%) | 4,266 (100.0%) |
Property Value to Household Income Ratio in Sanford
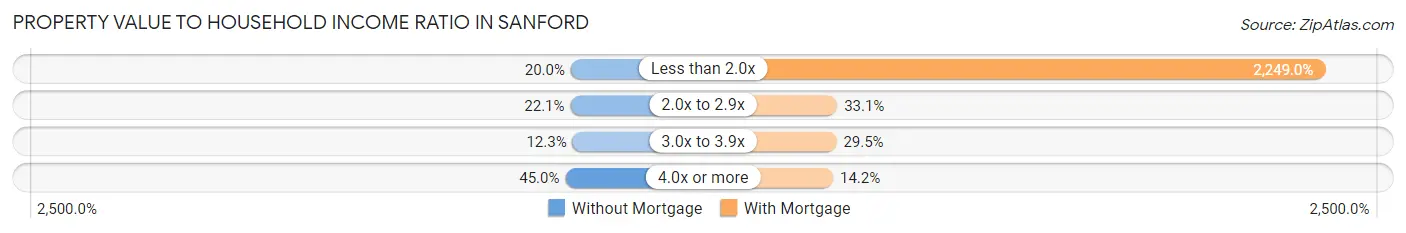
| Value-to-Income Ratio | Without Mortgage | With Mortgage |
| Less than 2.0x | 372 (20.0%) | 95,942 (2,249.0%) |
| 2.0x to 2.9x | 411 (22.1%) | 1,410 (33.1%) |
| 3.0x to 3.9x | 229 (12.3%) | 1,260 (29.5%) |
| 4.0x or more | 835 (45.0%) | 606 (14.2%) |
| Total | 1,856 (100.0%) | 4,266 (100.0%) |
Real Estate Taxes by Mortgage Status in Sanford
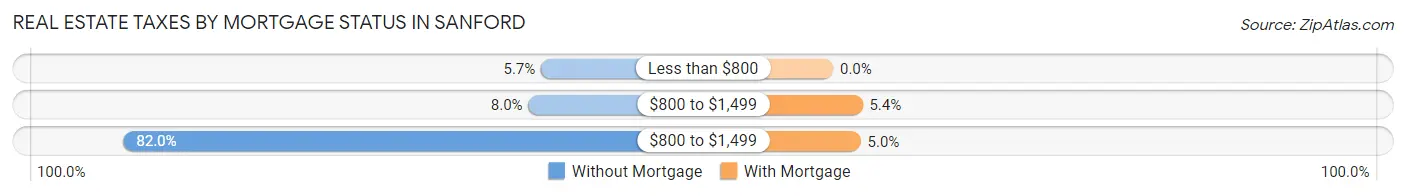
| Property Taxes | Without Mortgage | With Mortgage |
| Less than $800 | 105 (5.7%) | 0 (0.0%) |
| $800 to $1,499 | 148 (8.0%) | 229 (5.4%) |
| $800 to $1,499 | 1,521 (82.0%) | 215 (5.0%) |
| Total | 1,856 (100.0%) | 4,266 (100.0%) |
Health & Disability in Sanford
Health Insurance Coverage by Age in Sanford
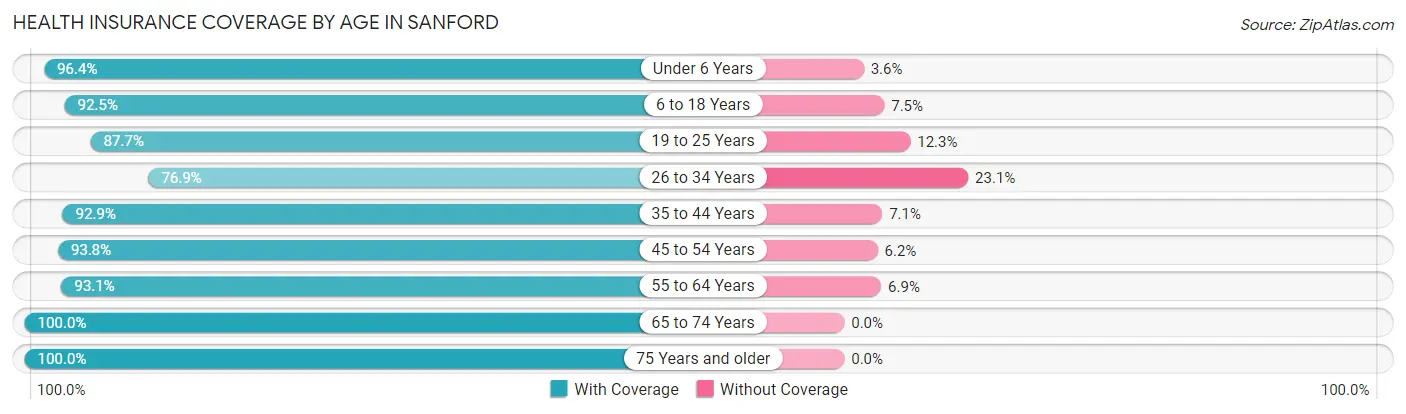
| Age Bracket | With Coverage | Without Coverage |
| Under 6 Years | 1,599 (96.4%) | 60 (3.6%) |
| 6 to 18 Years | 3,372 (92.5%) | 272 (7.5%) |
| 19 to 25 Years | 997 (87.7%) | 140 (12.3%) |
| 26 to 34 Years | 2,524 (76.9%) | 758 (23.1%) |
| 35 to 44 Years | 2,414 (92.9%) | 184 (7.1%) |
| 45 to 54 Years | 2,446 (93.8%) | 162 (6.2%) |
| 55 to 64 Years | 2,806 (93.1%) | 207 (6.9%) |
| 65 to 74 Years | 2,350 (100.0%) | 0 (0.0%) |
| 75 Years and older | 1,352 (100.0%) | 0 (0.0%) |
| Total | 19,860 (91.8%) | 1,783 (8.2%) |
Health Insurance Coverage by Citizenship Status in Sanford
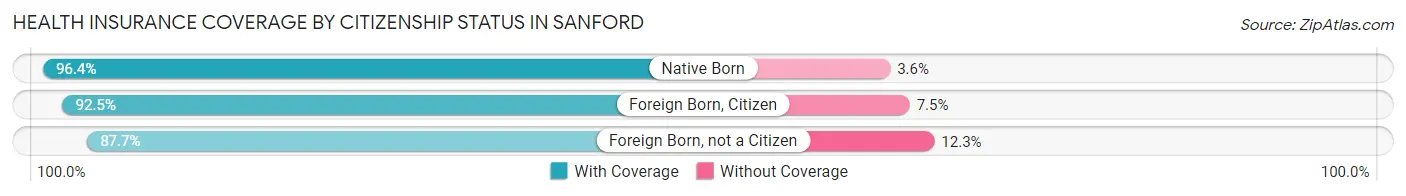
| Citizenship Status | With Coverage | Without Coverage |
| Native Born | 1,599 (96.4%) | 60 (3.6%) |
| Foreign Born, Citizen | 3,372 (92.5%) | 272 (7.5%) |
| Foreign Born, not a Citizen | 997 (87.7%) | 140 (12.3%) |
Health Insurance Coverage by Household Income in Sanford
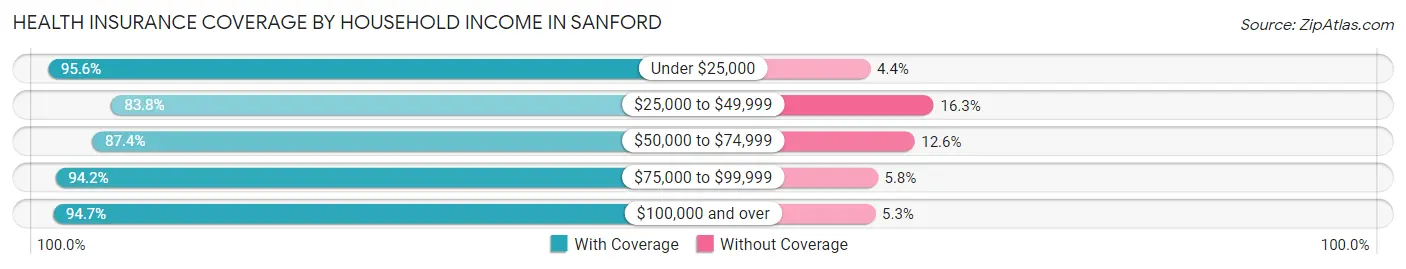
| Household Income | With Coverage | Without Coverage |
| Under $25,000 | 1,994 (95.6%) | 91 (4.4%) |
| $25,000 to $49,999 | 2,902 (83.8%) | 563 (16.3%) |
| $50,000 to $74,999 | 3,111 (87.4%) | 450 (12.6%) |
| $75,000 to $99,999 | 3,386 (94.2%) | 207 (5.8%) |
| $100,000 and over | 8,410 (94.7%) | 471 (5.3%) |
Public vs Private Health Insurance Coverage by Age in Sanford
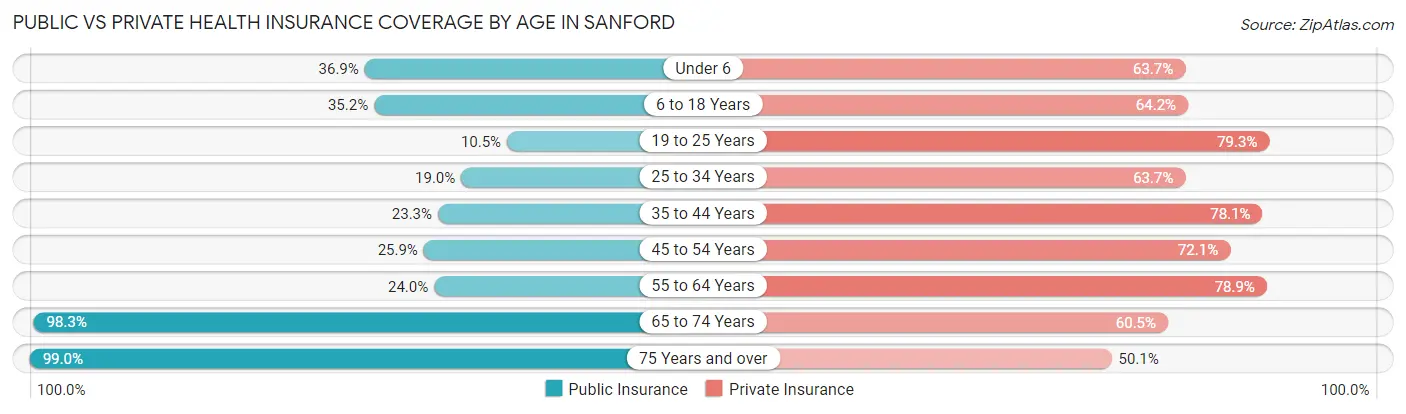
| Age Bracket | Public Insurance | Private Insurance |
| Under 6 | 612 (36.9%) | 1,057 (63.7%) |
| 6 to 18 Years | 1,281 (35.1%) | 2,341 (64.2%) |
| 19 to 25 Years | 119 (10.5%) | 902 (79.3%) |
| 25 to 34 Years | 623 (19.0%) | 2,092 (63.7%) |
| 35 to 44 Years | 605 (23.3%) | 2,028 (78.1%) |
| 45 to 54 Years | 676 (25.9%) | 1,879 (72.1%) |
| 55 to 64 Years | 723 (24.0%) | 2,376 (78.9%) |
| 65 to 74 Years | 2,311 (98.3%) | 1,422 (60.5%) |
| 75 Years and over | 1,339 (99.0%) | 677 (50.1%) |
| Total | 8,289 (38.3%) | 14,774 (68.3%) |
Disability Status by Sex by Age in Sanford
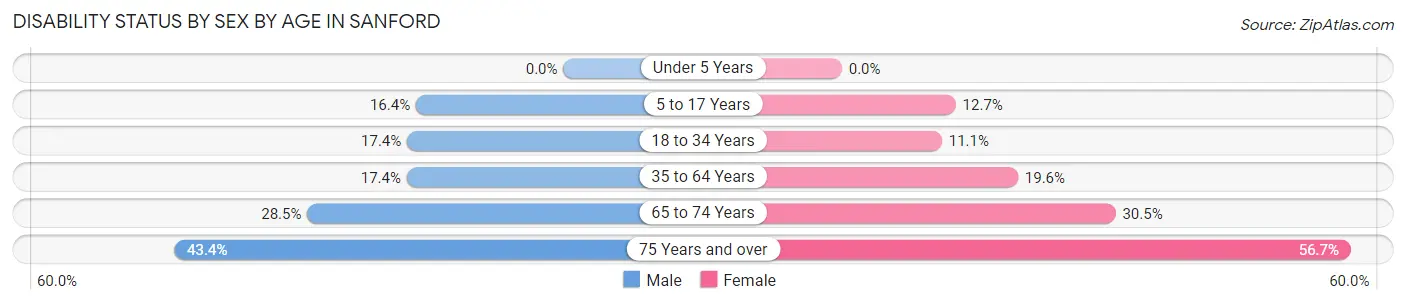
| Age Bracket | Male | Female |
| Under 5 Years | 0 (0.0%) | 0 (0.0%) |
| 5 to 17 Years | 304 (16.4%) | 252 (12.7%) |
| 18 to 34 Years | 379 (17.4%) | 266 (11.1%) |
| 35 to 64 Years | 672 (17.4%) | 856 (19.6%) |
| 65 to 74 Years | 340 (28.5%) | 353 (30.5%) |
| 75 Years and over | 294 (43.4%) | 382 (56.7%) |
Disability Class by Sex by Age in Sanford
Disability Class: Hearing Difficulty
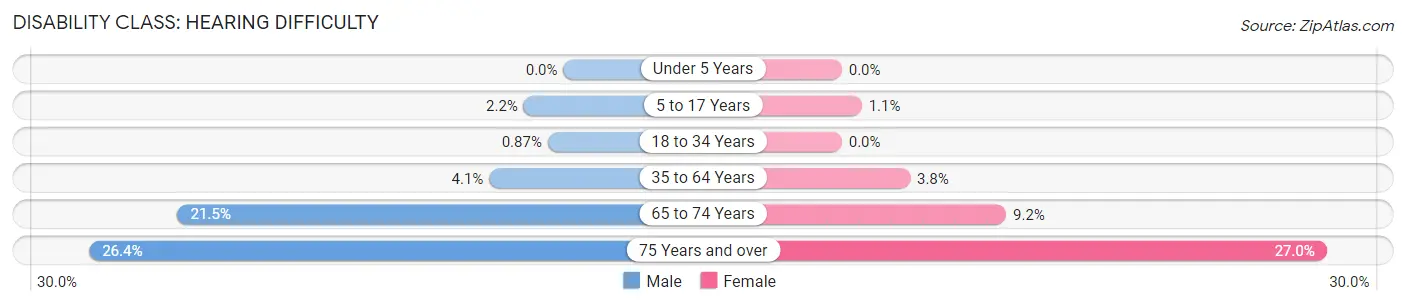
| Age Bracket | Male | Female |
| Under 5 Years | 0 (0.0%) | 0 (0.0%) |
| 5 to 17 Years | 41 (2.2%) | 22 (1.1%) |
| 18 to 34 Years | 19 (0.9%) | 0 (0.0%) |
| 35 to 64 Years | 159 (4.1%) | 166 (3.8%) |
| 65 to 74 Years | 256 (21.5%) | 106 (9.1%) |
| 75 Years and over | 179 (26.4%) | 182 (27.0%) |
Disability Class: Vision Difficulty
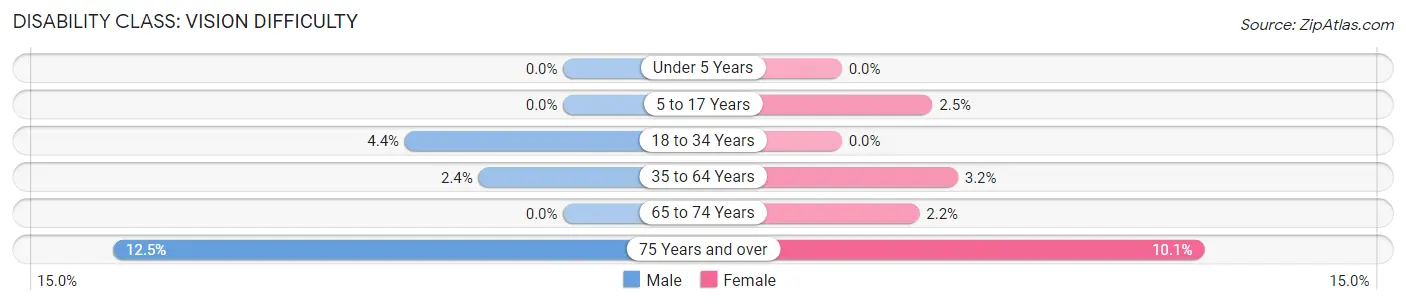
| Age Bracket | Male | Female |
| Under 5 Years | 0 (0.0%) | 0 (0.0%) |
| 5 to 17 Years | 0 (0.0%) | 50 (2.5%) |
| 18 to 34 Years | 96 (4.4%) | 0 (0.0%) |
| 35 to 64 Years | 91 (2.4%) | 141 (3.2%) |
| 65 to 74 Years | 0 (0.0%) | 25 (2.2%) |
| 75 Years and over | 85 (12.5%) | 68 (10.1%) |
Disability Class: Cognitive Difficulty
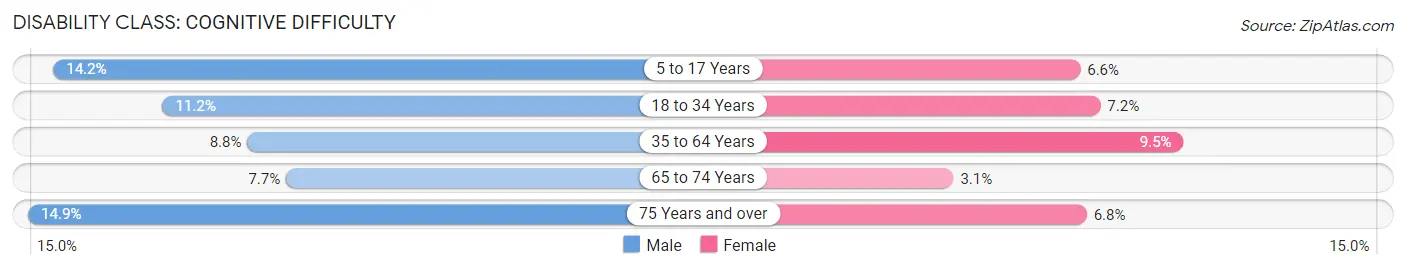
| Age Bracket | Male | Female |
| 5 to 17 Years | 263 (14.2%) | 132 (6.6%) |
| 18 to 34 Years | 243 (11.2%) | 172 (7.2%) |
| 35 to 64 Years | 339 (8.8%) | 415 (9.5%) |
| 65 to 74 Years | 92 (7.7%) | 36 (3.1%) |
| 75 Years and over | 101 (14.9%) | 46 (6.8%) |
Disability Class: Ambulatory Difficulty
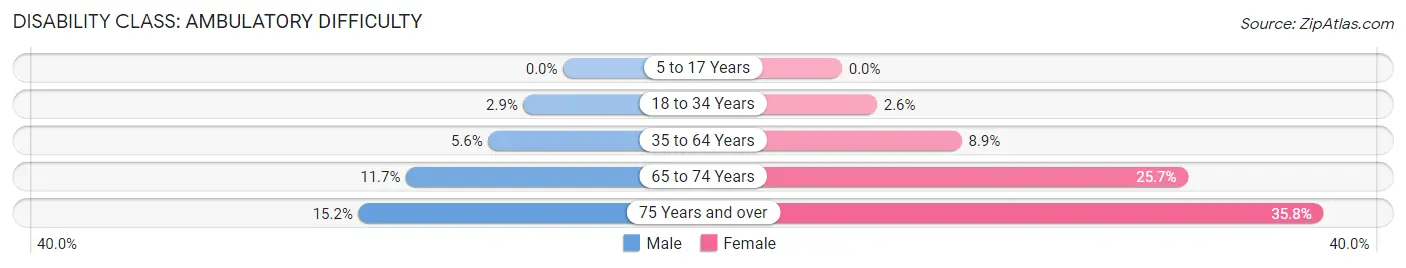
| Age Bracket | Male | Female |
| 5 to 17 Years | 0 (0.0%) | 0 (0.0%) |
| 18 to 34 Years | 64 (2.9%) | 62 (2.6%) |
| 35 to 64 Years | 214 (5.6%) | 388 (8.9%) |
| 65 to 74 Years | 139 (11.7%) | 298 (25.7%) |
| 75 Years and over | 103 (15.2%) | 241 (35.8%) |
Disability Class: Self-Care Difficulty
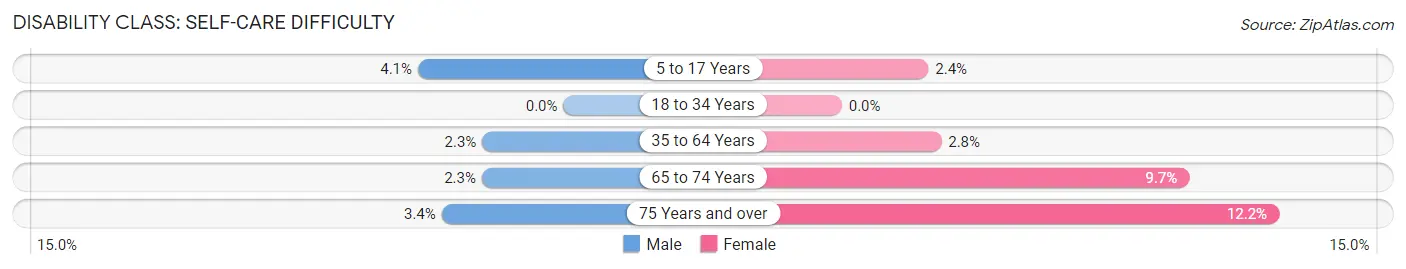
| Age Bracket | Male | Female |
| 5 to 17 Years | 75 (4.1%) | 48 (2.4%) |
| 18 to 34 Years | 0 (0.0%) | 0 (0.0%) |
| 35 to 64 Years | 87 (2.3%) | 121 (2.8%) |
| 65 to 74 Years | 27 (2.3%) | 112 (9.7%) |
| 75 Years and over | 23 (3.4%) | 82 (12.2%) |
Technology Access in Sanford
Computing Device Access in Sanford
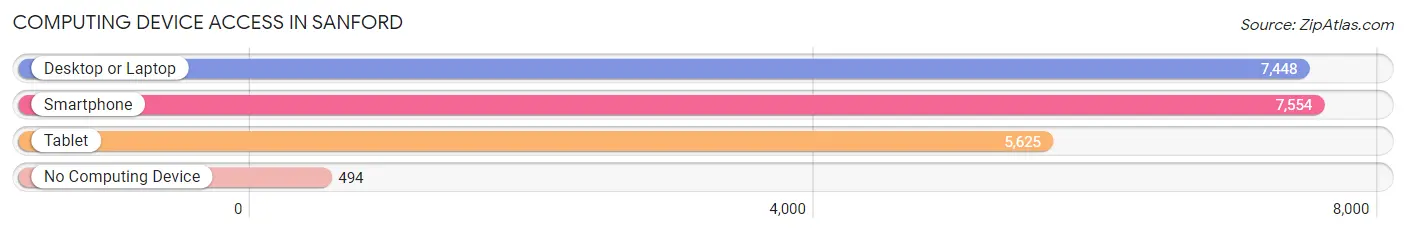
| Device Type | # Households | % Households |
| Desktop or Laptop | 7,448 | 82.6% |
| Smartphone | 7,554 | 83.8% |
| Tablet | 5,625 | 62.4% |
| No Computing Device | 494 | 5.5% |
| Total | 9,019 | 100.0% |
Internet Access in Sanford
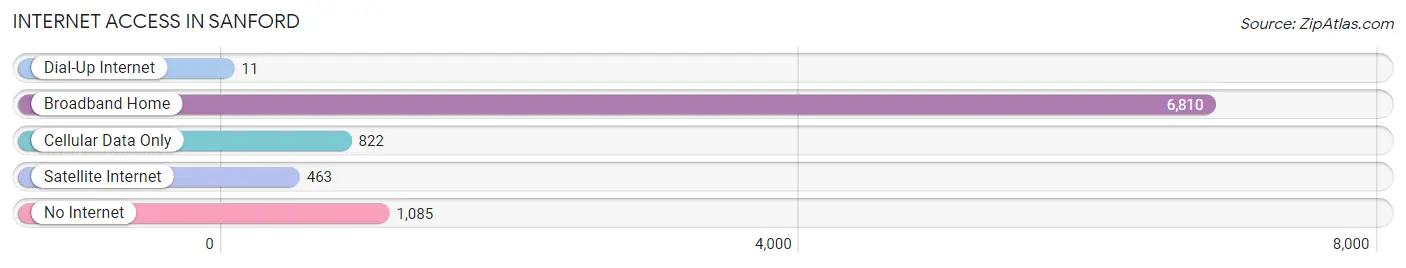
| Internet Type | # Households | % Households |
| Dial-Up Internet | 11 | 0.1% |
| Broadband Home | 6,810 | 75.5% |
| Cellular Data Only | 822 | 9.1% |
| Satellite Internet | 463 | 5.1% |
| No Internet | 1,085 | 12.0% |
| Total | 9,019 | 100.0% |
Sanford Summary
Sanford, Maine is a city located in York County, Maine, United States. It is part of the Portland–South Portland–Biddeford, Maine metropolitan statistical area. The population was 20,798 at the 2010 census, making it the seventh largest municipality in the state.
History
Sanford was first settled in 1661 by Thomas Littlefield, who was granted a large tract of land by the Massachusetts General Court. The area was known as Phillipstown, named after Sir William Phipps, the governor of the Province of Maine. In 1739, the area was incorporated as the town of Sanford, named after Peleg Sanford, a prominent local landowner.
In 1866, Sanford was incorporated as a city. During the 19th century, Sanford was a major center for the lumber and shipbuilding industries. The city was also home to several textile mills, which provided employment for many of the city's residents.
Geography
Sanford is located at 43°27′N 70°48′W (43.45, -70.80). According to the United States Census Bureau, the city has a total area of 28.2 square miles (73.1 km2), of which 27.7 square miles (71.6 km2) is land and 0.5 square miles (1.3 km2) is water.
Sanford is located on the Mousam River, which flows into the Atlantic Ocean at nearby Kennebunkport. The city is bordered by Alfred to the north, Waterboro to the east, Springvale to the south, and Acton to the west.
Economy
Sanford is a major economic center for York County. The city is home to several large employers, including Goodall Hospital, Sanford Regional Technical Center, and the Sanford-Springvale YMCA. The city is also home to several retail stores, including the Sanford Mall and the Sanford Marketplace.
The city is also home to several manufacturing companies, including Sanford Manufacturing, which produces a variety of products, including furniture, cabinets, and doors. The city is also home to several technology companies, including Sanford Technologies, which produces a variety of computer hardware and software.
Demographics
As of the 2010 census, there were 20,798 people, 8,541 households, and 5,541 families residing in the city. The population density was 751.2 people per square mile (290.2/km2). There were 9,093 housing units at an average density of 328.3 per square mile (127.0/km2). The racial makeup of the city was 94.2% White, 1.3% African American, 0.4% Native American, 1.2% Asian, 0.1% Pacific Islander, 1.2% from other races, and 1.6% from two or more races. Hispanic or Latino of any race were 3.2% of the population.
There were 8,541 households, out of which 30.2% had children under the age of 18 living with them, 47.2% were married couples living together, 13.2% had a female householder with no husband present, and 34.7% were non-families. 28.2% of all households were made up of individuals, and 11.7% had someone living alone who was 65 years of age or older. The average household size was 2.41 and the average family size was 2.94.
In the city, the population was spread out, with 24.2% under the age of 18, 8.2% from 18 to 24, 29.2% from 25 to 44, 22.7% from 45 to 64, and 15.7% who were 65 years of age or older. The median age was 38 years. For every 100 females, there were 93.2 males. For every 100 females age 18 and over, there were 90.2 males.
The median income for a household in the city was $41,845, and the median income for a family was $50,945. Males had a median income of $37,845 versus $27,945 for females. The per capita income for the city was $20,945. About 8.2% of families and 10.7% of the population were below the poverty line, including 14.2% of those under age 18 and 8.2% of those age 65 or over.
Common Questions
What is Per Capita Income in Sanford?
Per Capita income in Sanford is $35,090.
What is the Median Family Income in Sanford?
Median Family Income in Sanford is $79,836.
What is the Median Household income in Sanford?
Median Household Income in Sanford is $71,848.
What is Income or Wage Gap in Sanford?
Income or Wage Gap in Sanford is 31.9%.
Women in Sanford earn 68.1 cents for every dollar earned by a man.
What is Family Income Deficit in Sanford?
Family Income Deficit in Sanford is $7,596.
Families that are below poverty line in Sanford earn $7,596 less on average than the poverty threshold level.
What is Inequality or Gini Index in Sanford?
Inequality or Gini Index in Sanford is 0.40.
What is the Total Population of Sanford?
Total Population of Sanford is 21,986.
What is the Total Male Population of Sanford?
Total Male Population of Sanford is 10,529.
What is the Total Female Population of Sanford?
Total Female Population of Sanford is 11,457.
What is the Ratio of Males per 100 Females in Sanford?
There are 91.90 Males per 100 Females in Sanford.
What is the Ratio of Females per 100 Males in Sanford?
There are 108.81 Females per 100 Males in Sanford.
What is the Median Population Age in Sanford?
Median Population Age in Sanford is 39.3 Years.
What is the Average Family Size in Sanford
Average Family Size in Sanford is 3.0 People.
What is the Average Household Size in Sanford
Average Household Size in Sanford is 2.4 People.
How Large is the Labor Force in Sanford?
There are 11,646 People in the Labor Forcein in Sanford.
What is the Percentage of People in the Labor Force in Sanford?
67.3% of People are in the Labor Force in Sanford.
What is the Unemployment Rate in Sanford?
Unemployment Rate in Sanford is 4.0%.