Oxford County, ME Map & Demographics
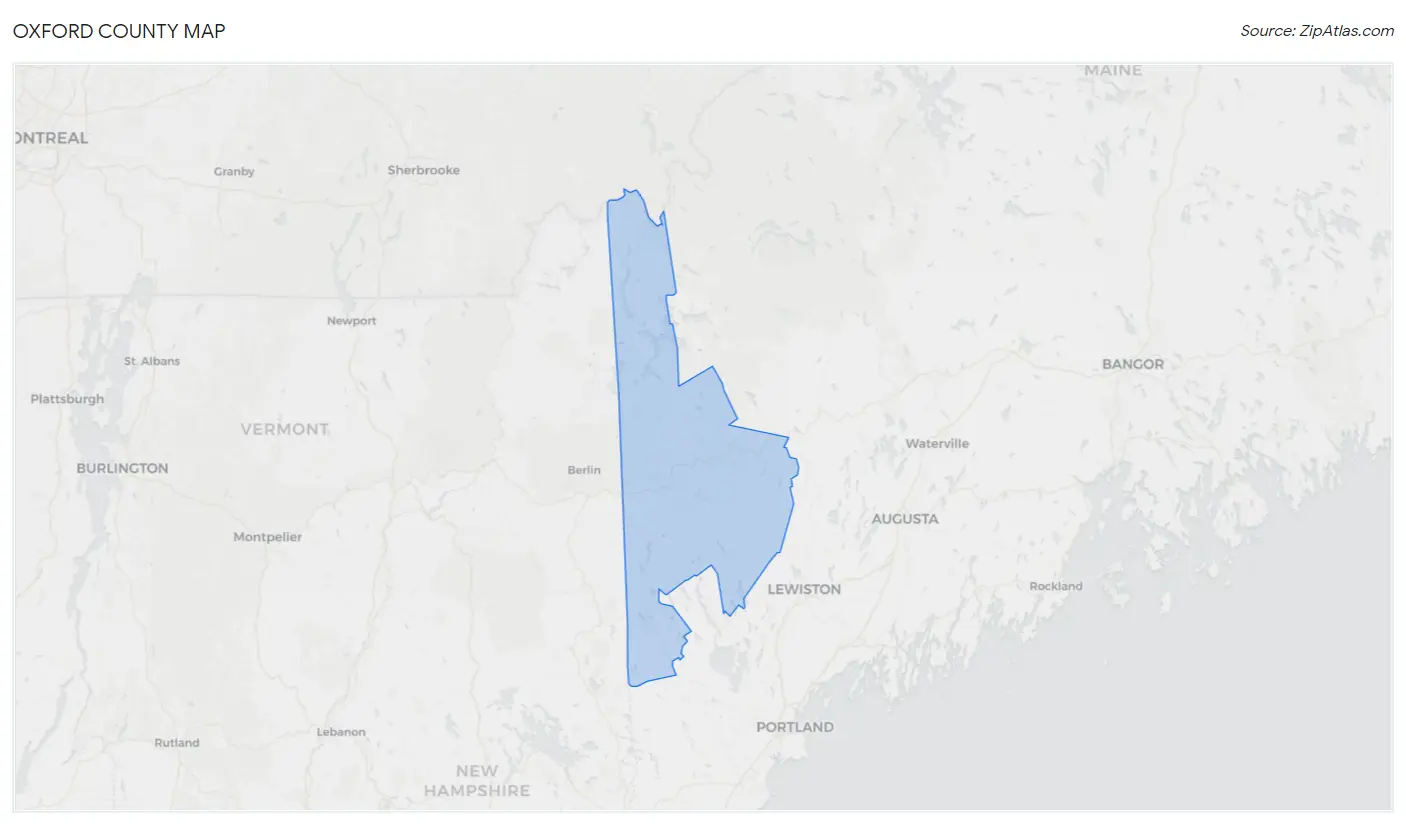
Oxford County Map
Oxford County Overview
$30,884
PER CAPITA INCOME
$69,412
AVG FAMILY INCOME
$54,780
AVG HOUSEHOLD INCOME
22.0%
WAGE / INCOME GAP [ % ]
78.0¢/ $1
WAGE / INCOME GAP [ $ ]
$9,510
FAMILY INCOME DEFICIT
0.44
INEQUALITY / GINI INDEX
58,276
TOTAL POPULATION
29,200
MALE POPULATION
29,076
FEMALE POPULATION
100.43
MALES / 100 FEMALES
99.58
FEMALES / 100 MALES
48.2
MEDIAN AGE
3.0
AVG FAMILY SIZE
2.5
AVG HOUSEHOLD SIZE
27,648
LABOR FORCE [ PEOPLE ]
56.1%
PERCENT IN LABOR FORCE
5.5%
UNEMPLOYMENT RATE
Oxford County Area Codes
Income in Oxford County
Income Overview in Oxford County
Per Capita Income in Oxford County is $30,884, while median incomes of families and households are $69,412 and $54,780 respectively.
| Characteristic | Number | Measure |
| Per Capita Income | 58,276 | $30,884 |
| Median Family Income | 14,379 | $69,412 |
| Mean Family Income | 14,379 | $86,285 |
| Median Household Income | 23,183 | $54,780 |
| Mean Household Income | 23,183 | $72,619 |
| Income Deficit | 14,379 | $9,510 |
| Wage / Income Gap (%) | 58,276 | 22.02% |
| Wage / Income Gap ($) | 58,276 | 77.98¢ per $1 |
| Gini / Inequality Index | 58,276 | 0.44 |
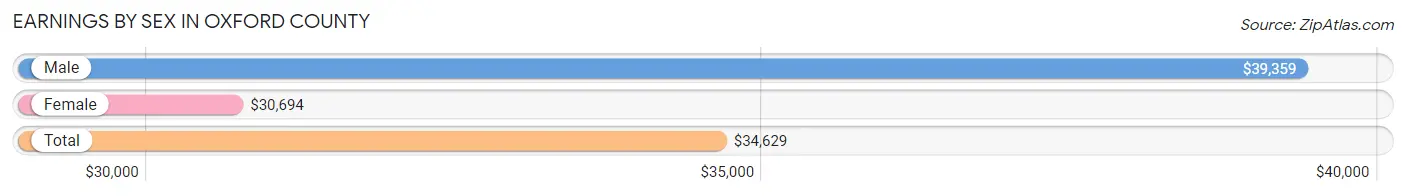
Earnings by Sex in Oxford County
Average Earnings in Oxford County are $34,629, $39,359 for men and $30,694 for women, a difference of 22.0%.
| Sex | Number | Average Earnings |
| Male | 14,764 (50.4%) | $39,359 |
| Female | 14,520 (49.6%) | $30,694 |
| Total | 29,284 (100.0%) | $34,629 |
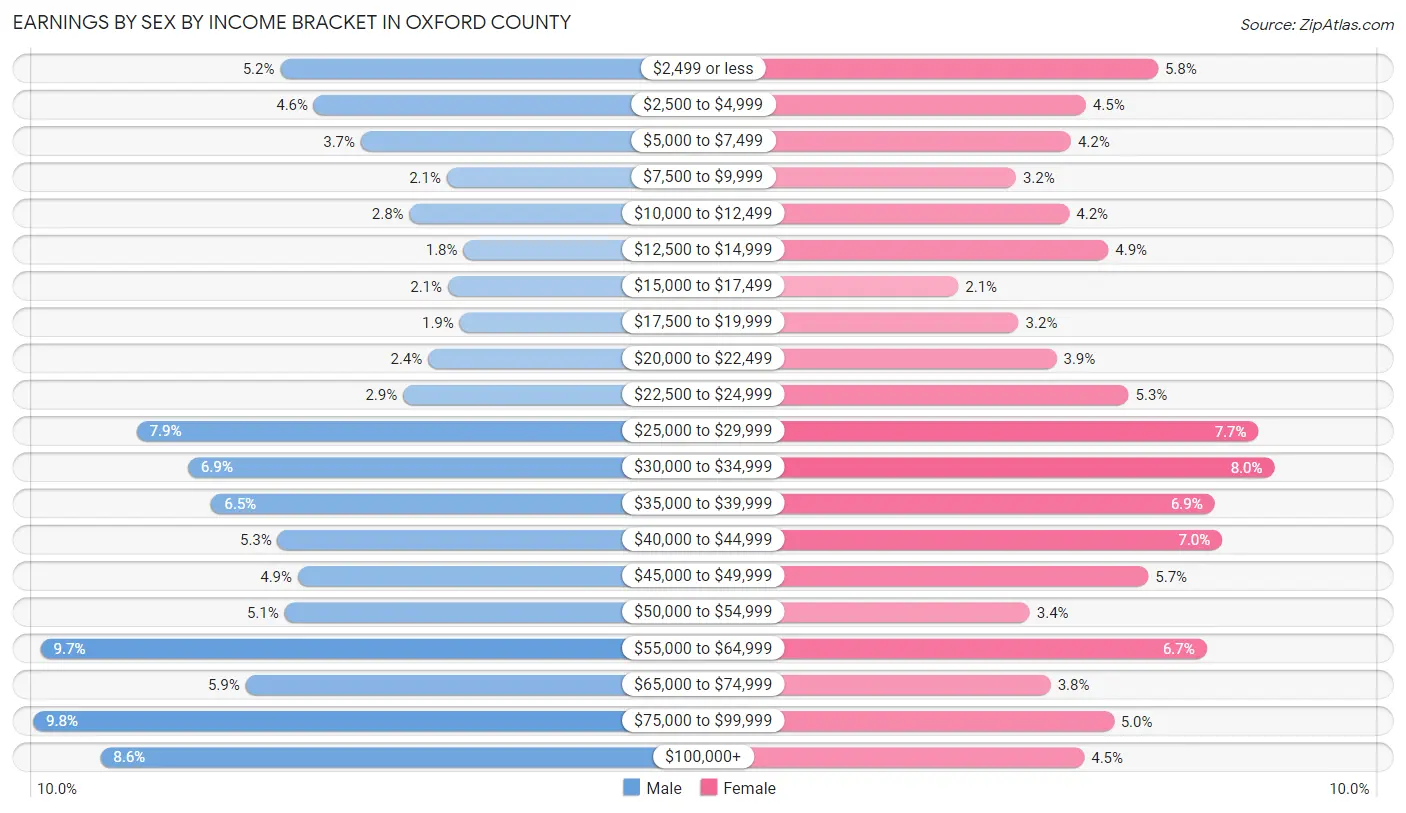
Earnings by Sex by Income Bracket in Oxford County
The most common earnings brackets in Oxford County are $75,000 to $99,999 for men (1,453 | 9.8%) and $30,000 to $34,999 for women (1,163 | 8.0%).
| Income | Male | Female |
| $2,499 or less | 769 (5.2%) | 847 (5.8%) |
| $2,500 to $4,999 | 676 (4.6%) | 651 (4.5%) |
| $5,000 to $7,499 | 546 (3.7%) | 610 (4.2%) |
| $7,500 to $9,999 | 309 (2.1%) | 460 (3.2%) |
| $10,000 to $12,499 | 412 (2.8%) | 605 (4.2%) |
| $12,500 to $14,999 | 263 (1.8%) | 711 (4.9%) |
| $15,000 to $17,499 | 305 (2.1%) | 304 (2.1%) |
| $17,500 to $19,999 | 273 (1.8%) | 467 (3.2%) |
| $20,000 to $22,499 | 360 (2.4%) | 571 (3.9%) |
| $22,500 to $24,999 | 430 (2.9%) | 767 (5.3%) |
| $25,000 to $29,999 | 1,167 (7.9%) | 1,119 (7.7%) |
| $30,000 to $34,999 | 1,024 (6.9%) | 1,163 (8.0%) |
| $35,000 to $39,999 | 959 (6.5%) | 1,000 (6.9%) |
| $40,000 to $44,999 | 776 (5.3%) | 1,021 (7.0%) |
| $45,000 to $49,999 | 721 (4.9%) | 820 (5.7%) |
| $50,000 to $54,999 | 757 (5.1%) | 498 (3.4%) |
| $55,000 to $64,999 | 1,432 (9.7%) | 979 (6.7%) |
| $65,000 to $74,999 | 865 (5.9%) | 555 (3.8%) |
| $75,000 to $99,999 | 1,453 (9.8%) | 726 (5.0%) |
| $100,000+ | 1,267 (8.6%) | 646 (4.4%) |
| Total | 14,764 (100.0%) | 14,520 (100.0%) |
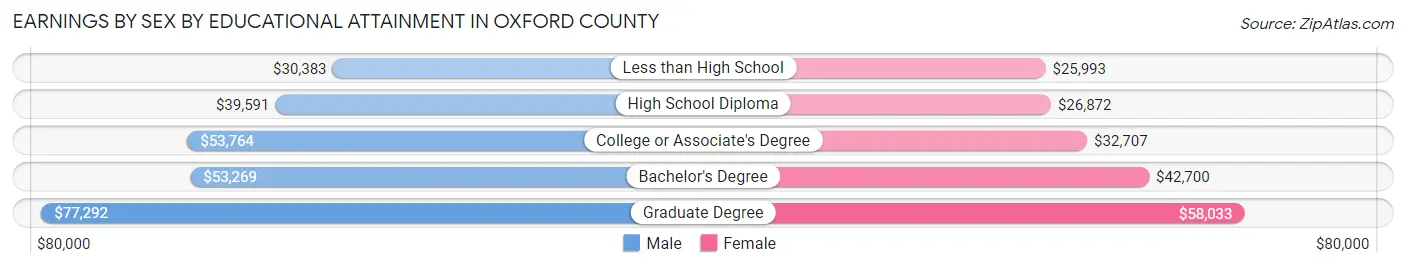
Earnings by Sex by Educational Attainment in Oxford County
Average earnings in Oxford County are $44,488 for men and $33,903 for women, a difference of 23.8%. Men with an educational attainment of graduate degree enjoy the highest average annual earnings of $77,292, while those with less than high school education earn the least with $30,383. Women with an educational attainment of graduate degree earn the most with the average annual earnings of $58,033, while those with less than high school education have the smallest earnings of $25,993.
| Educational Attainment | Male Income | Female Income |
| Less than High School | $30,383 | $25,993 |
| High School Diploma | $39,591 | $26,872 |
| College or Associate's Degree | $53,764 | $32,707 |
| Bachelor's Degree | $53,269 | $42,700 |
| Graduate Degree | $77,292 | $58,033 |
| Total | $44,488 | $33,903 |
Family Income in Oxford County
Family Income Brackets in Oxford County
According to the Oxford County family income data, there are 3,005 families falling into the $50,000 to $74,999 income range, which is the most common income bracket and makes up 20.9% of all families. Conversely, the $10,000 to $14,999 income bracket is the least frequent group with only 316 families (2.2%) belonging to this category.
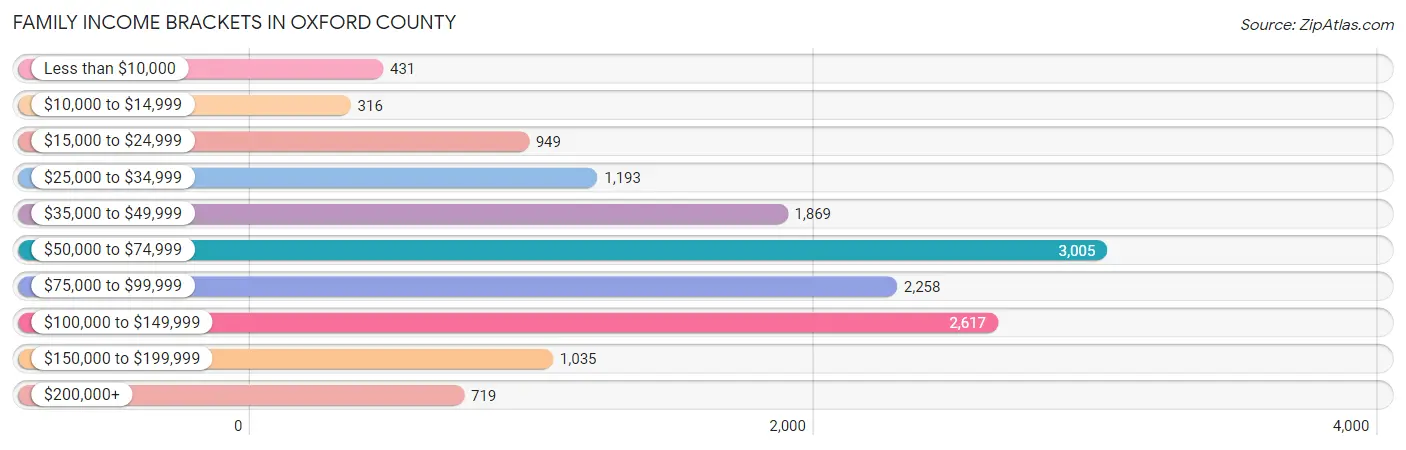
| Income Bracket | # Families | % Families |
| Less than $10,000 | 431 | 3.0% |
| $10,000 to $14,999 | 316 | 2.2% |
| $15,000 to $24,999 | 949 | 6.6% |
| $25,000 to $34,999 | 1,193 | 8.3% |
| $35,000 to $49,999 | 1,869 | 13.0% |
| $50,000 to $74,999 | 3,005 | 20.9% |
| $75,000 to $99,999 | 2,258 | 15.7% |
| $100,000 to $149,999 | 2,617 | 18.2% |
| $150,000 to $199,999 | 1,035 | 7.2% |
| $200,000+ | 719 | 5.0% |
Family Income by Famaliy Size in Oxford County
5-person families (667 | 4.6%) account for the highest median family income in Oxford County with $106,042 per family, while 2-person families (8,546 | 59.4%) have the highest median income of $31,473 per family member.
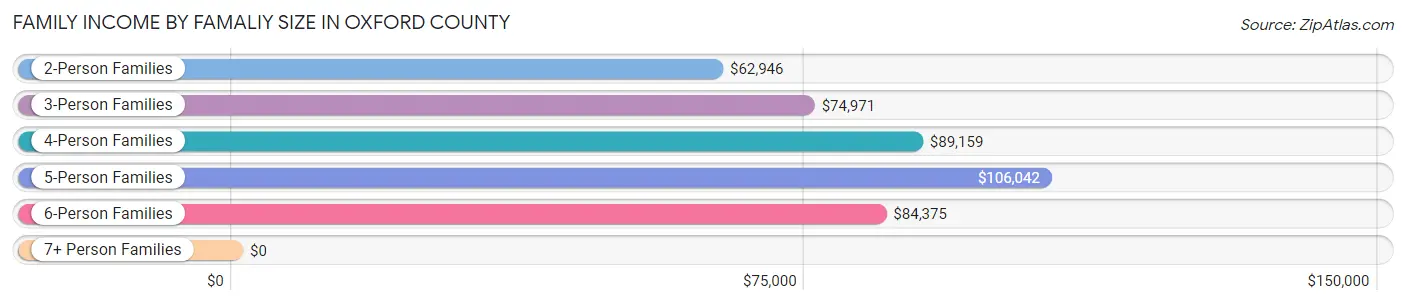
| Income Bracket | # Families | Median Income |
| 2-Person Families | 8,546 (59.4%) | $62,946 |
| 3-Person Families | 2,752 (19.1%) | $74,971 |
| 4-Person Families | 1,944 (13.5%) | $89,159 |
| 5-Person Families | 667 (4.6%) | $106,042 |
| 6-Person Families | 296 (2.1%) | $84,375 |
| 7+ Person Families | 174 (1.2%) | $0 |
| Total | 14,379 (100.0%) | $69,412 |
Family Income by Number of Earners in Oxford County
The median family income in Oxford County is $69,412, with families comprising 3+ earners (1,464) having the highest median family income of $107,368, while families with no earners (3,115) have the lowest median family income of $38,652, accounting for 10.2% and 21.7% of families, respectively.
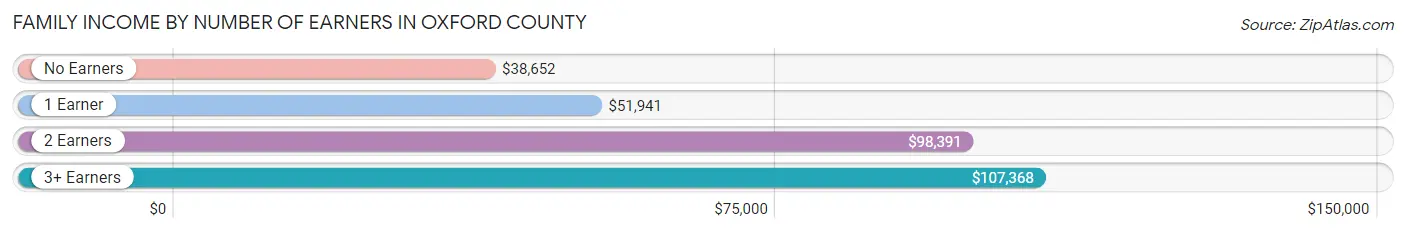
| Number of Earners | # Families | Median Income |
| No Earners | 3,115 (21.7%) | $38,652 |
| 1 Earner | 4,475 (31.1%) | $51,941 |
| 2 Earners | 5,325 (37.0%) | $98,391 |
| 3+ Earners | 1,464 (10.2%) | $107,368 |
| Total | 14,379 (100.0%) | $69,412 |
Household Income in Oxford County
Household Income Brackets in Oxford County
With 3,987 households falling in the category, the $50,000 to $74,999 income range is the most frequent in Oxford County, accounting for 17.2% of all households. In contrast, only 835 households (3.6%) fall into the $200,000+ income bracket, making it the least populous group.
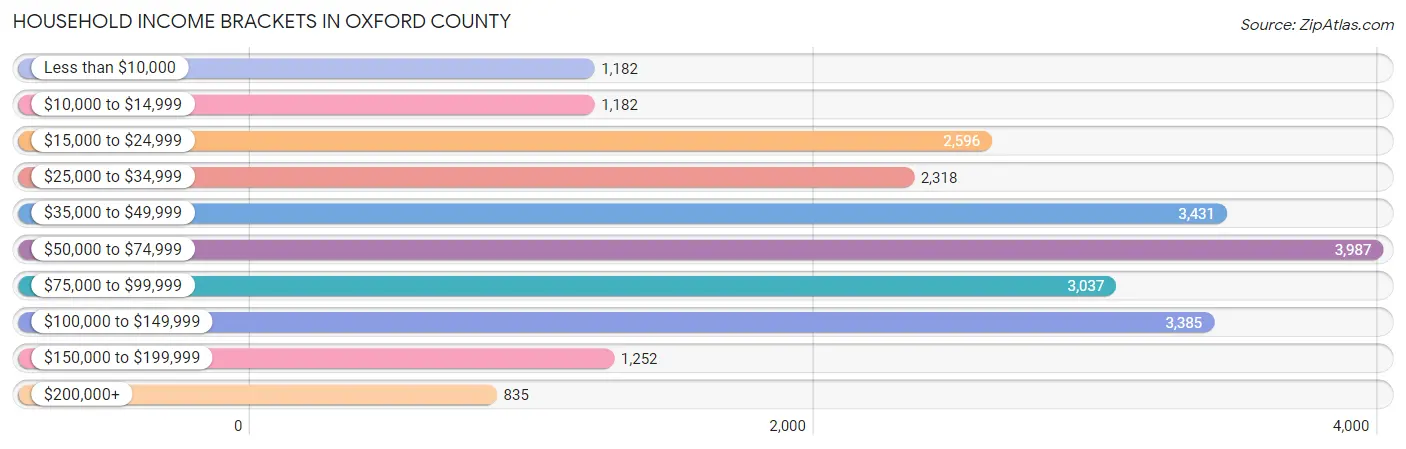
| Income Bracket | # Households | % Households |
| Less than $10,000 | 1,182 | 5.1% |
| $10,000 to $14,999 | 1,182 | 5.1% |
| $15,000 to $24,999 | 2,596 | 11.2% |
| $25,000 to $34,999 | 2,318 | 10.0% |
| $35,000 to $49,999 | 3,431 | 14.8% |
| $50,000 to $74,999 | 3,987 | 17.2% |
| $75,000 to $99,999 | 3,037 | 13.1% |
| $100,000 to $149,999 | 3,385 | 14.6% |
| $150,000 to $199,999 | 1,252 | 5.4% |
| $200,000+ | 835 | 3.6% |
Household Income by Householder Age in Oxford County
The median household income in Oxford County is $54,780, with the highest median household income of $71,959 found in the 25 to 44 years age bracket for the primary householder. A total of 4,991 households (21.5%) fall into this category. Meanwhile, the 15 to 24 years age bracket for the primary householder has the lowest median household income of $28,125, with 394 households (1.7%) in this group.
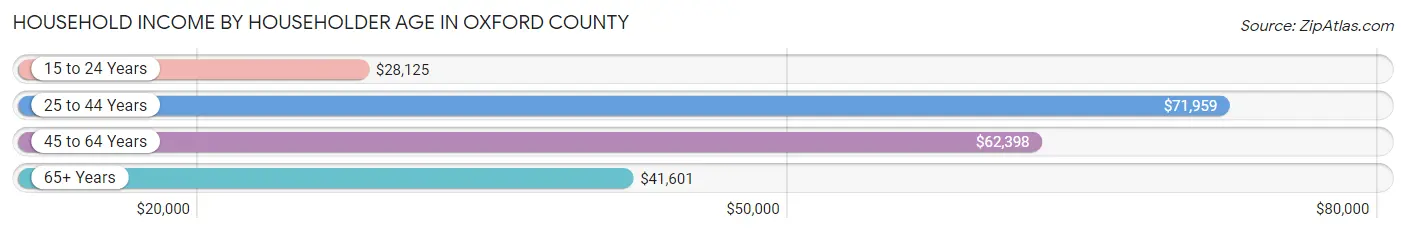
| Income Bracket | # Households | Median Income |
| 15 to 24 Years | 394 (1.7%) | $28,125 |
| 25 to 44 Years | 4,991 (21.5%) | $71,959 |
| 45 to 64 Years | 9,704 (41.9%) | $62,398 |
| 65+ Years | 8,094 (34.9%) | $41,601 |
| Total | 23,183 (100.0%) | $54,780 |
Poverty in Oxford County
Income Below Poverty by Sex and Age in Oxford County
With 13.2% poverty level for males and 15.6% for females among the residents of Oxford County, 5 year old males and 15 year old females are the most vulnerable to poverty, with 57 males (26.2%) and 77 females (27.9%) in their respective age groups living below the poverty level.
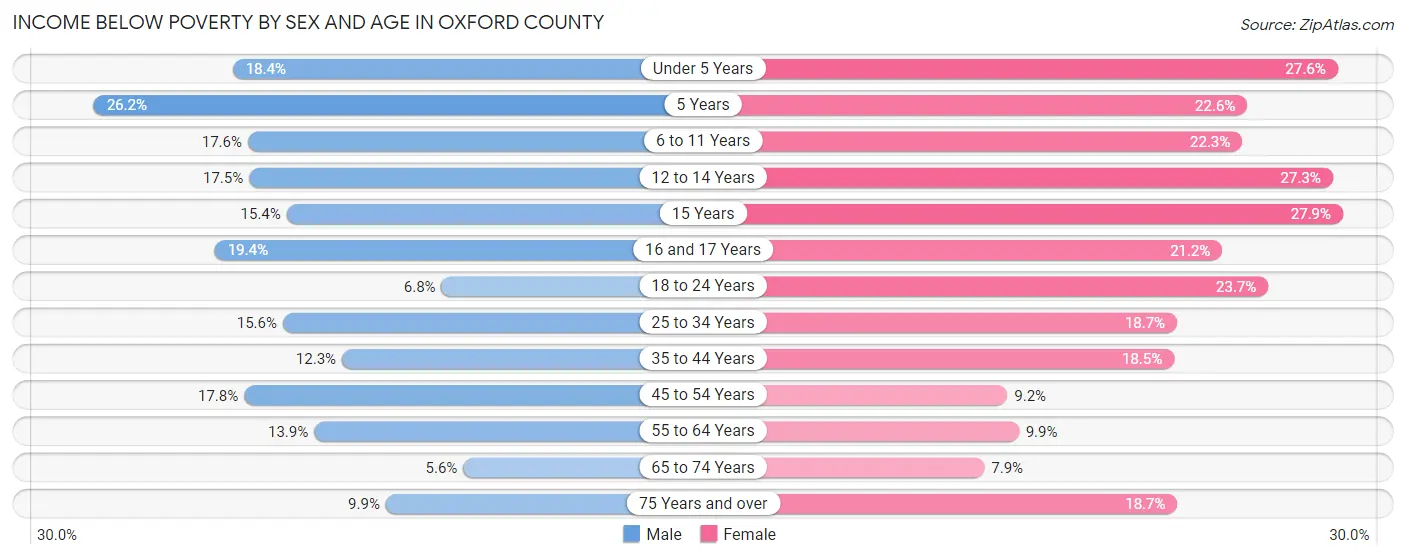
| Age Bracket | Male | Female |
| Under 5 Years | 238 (18.4%) | 312 (27.6%) |
| 5 Years | 57 (26.2%) | 51 (22.6%) |
| 6 to 11 Years | 328 (17.6%) | 410 (22.3%) |
| 12 to 14 Years | 130 (17.5%) | 161 (27.3%) |
| 15 Years | 55 (15.4%) | 77 (27.9%) |
| 16 and 17 Years | 125 (19.4%) | 162 (21.2%) |
| 18 to 24 Years | 131 (6.8%) | 427 (23.7%) |
| 25 to 34 Years | 477 (15.6%) | 580 (18.7%) |
| 35 to 44 Years | 418 (12.3%) | 615 (18.5%) |
| 45 to 54 Years | 668 (17.8%) | 346 (9.2%) |
| 55 to 64 Years | 720 (13.9%) | 505 (9.9%) |
| 65 to 74 Years | 224 (5.6%) | 314 (7.9%) |
| 75 Years and over | 211 (9.9%) | 517 (18.7%) |
| Total | 3,782 (13.2%) | 4,477 (15.6%) |
Income Above Poverty by Sex and Age in Oxford County
According to the poverty statistics in Oxford County, males aged 65 to 74 years and females aged 65 to 74 years are the age groups that are most secure financially, with 94.4% of males and 92.1% of females in these age groups living above the poverty line.
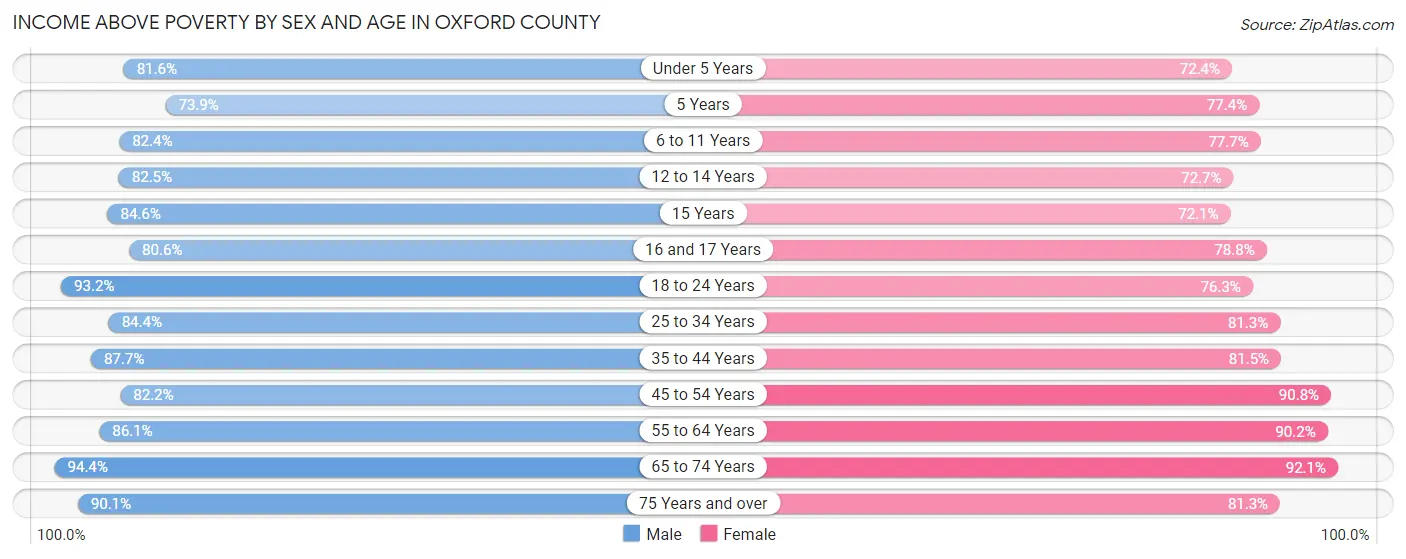
| Age Bracket | Male | Female |
| Under 5 Years | 1,055 (81.6%) | 818 (72.4%) |
| 5 Years | 161 (73.9%) | 175 (77.4%) |
| 6 to 11 Years | 1,539 (82.4%) | 1,429 (77.7%) |
| 12 to 14 Years | 613 (82.5%) | 428 (72.7%) |
| 15 Years | 302 (84.6%) | 199 (72.1%) |
| 16 and 17 Years | 519 (80.6%) | 603 (78.8%) |
| 18 to 24 Years | 1,797 (93.2%) | 1,372 (76.3%) |
| 25 to 34 Years | 2,576 (84.4%) | 2,529 (81.3%) |
| 35 to 44 Years | 2,971 (87.7%) | 2,710 (81.5%) |
| 45 to 54 Years | 3,090 (82.2%) | 3,407 (90.8%) |
| 55 to 64 Years | 4,466 (86.1%) | 4,623 (90.1%) |
| 65 to 74 Years | 3,792 (94.4%) | 3,640 (92.1%) |
| 75 Years and over | 1,922 (90.1%) | 2,250 (81.3%) |
| Total | 24,803 (86.8%) | 24,183 (84.4%) |
Income Below Poverty Among Married-Couple Families in Oxford County
The poverty statistics for married-couple families in Oxford County show that 5.2% or 602 of the total 11,584 families live below the poverty line. Families with 5 or more children have the highest poverty rate of 91.4%, comprising of 74 families. On the other hand, families with no children have the lowest poverty rate of 4.0%, which includes 328 families.
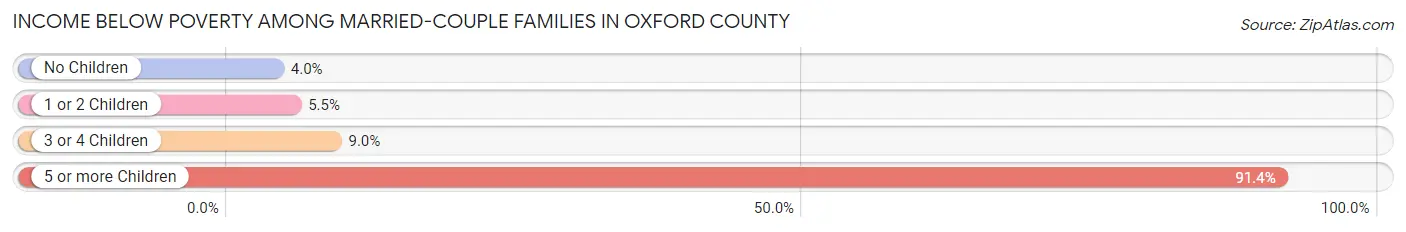
| Children | Above Poverty | Below Poverty |
| No Children | 7,901 (96.0%) | 328 (4.0%) |
| 1 or 2 Children | 2,559 (94.5%) | 149 (5.5%) |
| 3 or 4 Children | 515 (91.0%) | 51 (9.0%) |
| 5 or more Children | 7 (8.6%) | 74 (91.4%) |
| Total | 10,982 (94.8%) | 602 (5.2%) |
Income Below Poverty Among Single-Parent Households in Oxford County
According to the poverty data in Oxford County, 28.0% or 251 single-father households and 29.0% or 551 single-mother households are living below the poverty line. Among single-father households, those with 3 or 4 children have the highest poverty rate, with 27 households (50.0%) experiencing poverty. Likewise, among single-mother households, those with 5 or more children have the highest poverty rate, with 40 households (100.0%) falling below the poverty line.
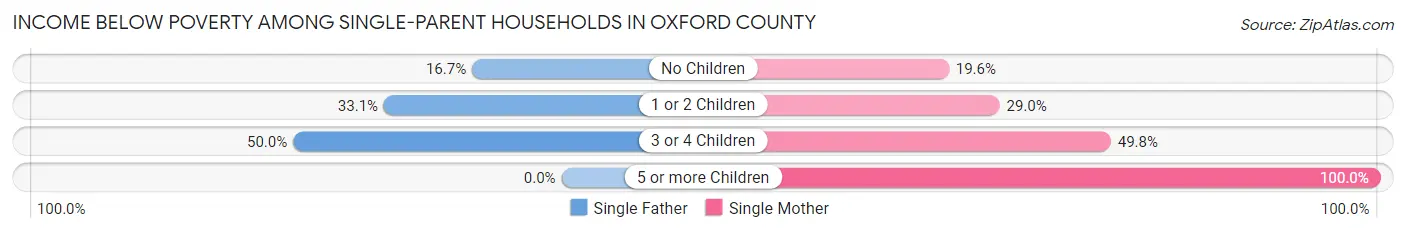
| Children | Single Father | Single Mother |
| No Children | 54 (16.7%) | 149 (19.6%) |
| 1 or 2 Children | 170 (33.1%) | 259 (29.0%) |
| 3 or 4 Children | 27 (50.0%) | 103 (49.8%) |
| 5 or more Children | 0 (0.0%) | 40 (100.0%) |
| Total | 251 (28.0%) | 551 (29.0%) |
Income Below Poverty Among Married-Couple vs Single-Parent Households in Oxford County
The poverty data for Oxford County shows that 602 of the married-couple family households (5.2%) and 802 of the single-parent households (28.7%) are living below the poverty level. Within the married-couple family households, those with 5 or more children have the highest poverty rate, with 74 households (91.4%) falling below the poverty line. Among the single-parent households, those with 5 or more children have the highest poverty rate, with 40 household (93.0%) living below poverty.
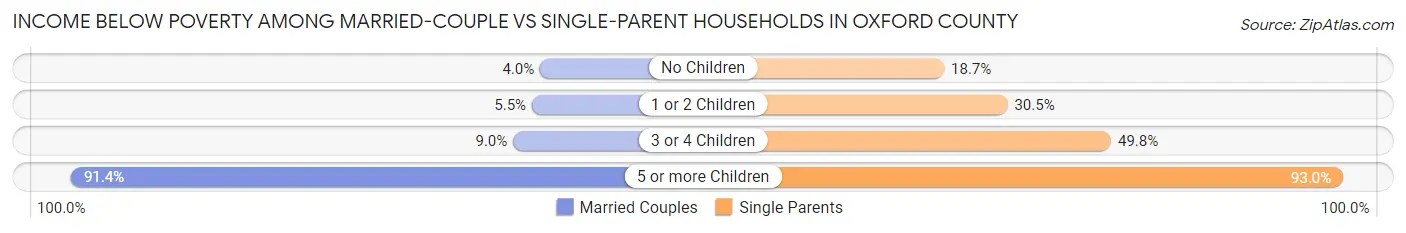
| Children | Married-Couple Families | Single-Parent Households |
| No Children | 328 (4.0%) | 203 (18.7%) |
| 1 or 2 Children | 149 (5.5%) | 429 (30.5%) |
| 3 or 4 Children | 51 (9.0%) | 130 (49.8%) |
| 5 or more Children | 74 (91.4%) | 40 (93.0%) |
| Total | 602 (5.2%) | 802 (28.7%) |
Race in Oxford County
The most populous races in Oxford County are White / Caucasian (55,043 | 94.5%), Two or more Races (2,380 | 4.1%), and Hispanic or Latino (924 | 1.6%).
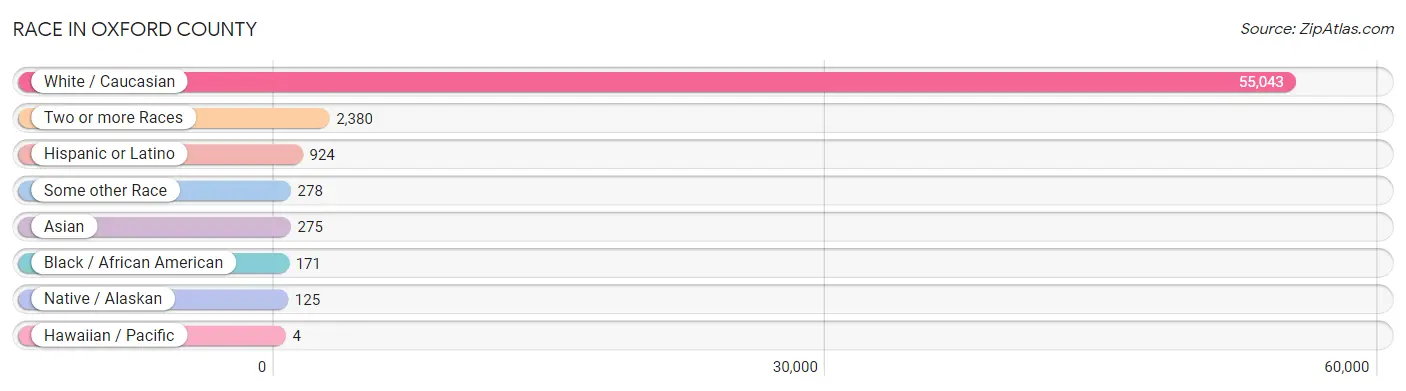
| Race | # Population | % Population |
| Asian | 275 | 0.5% |
| Black / African American | 171 | 0.3% |
| Hawaiian / Pacific | 4 | 0.0% |
| Hispanic or Latino | 924 | 1.6% |
| Native / Alaskan | 125 | 0.2% |
| White / Caucasian | 55,043 | 94.5% |
| Two or more Races | 2,380 | 4.1% |
| Some other Race | 278 | 0.5% |
| Total | 58,276 | 100.0% |
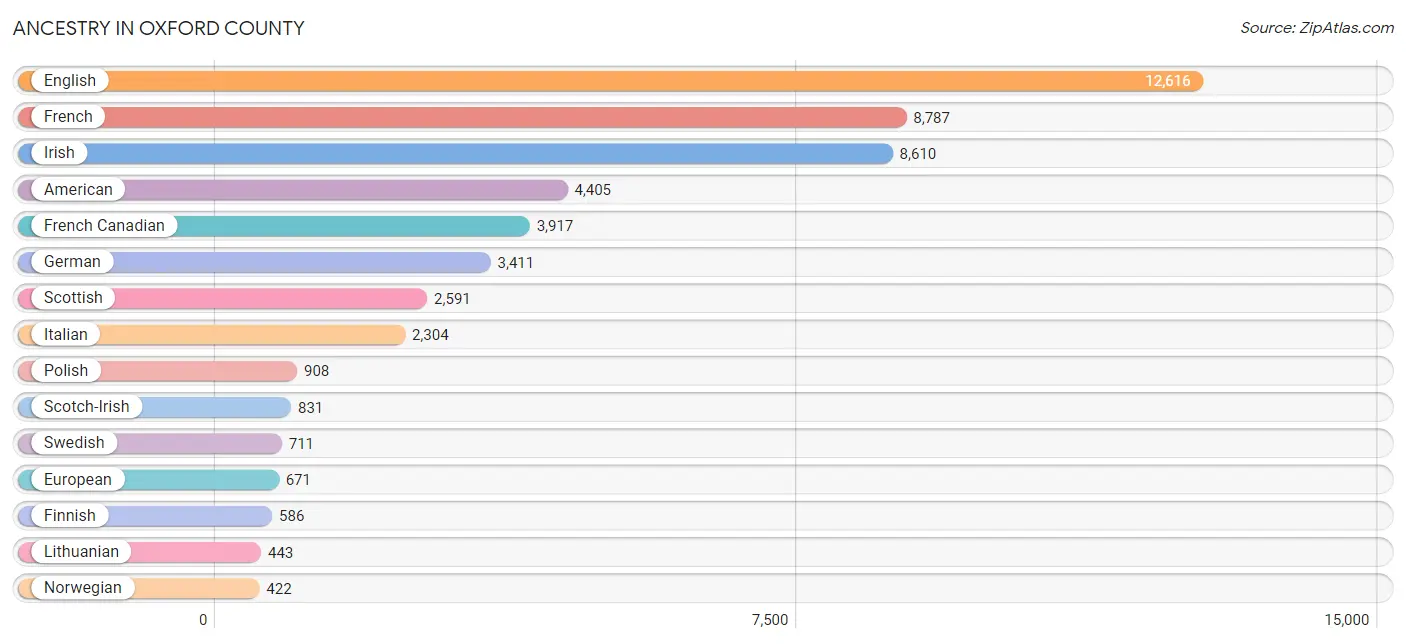
Ancestry in Oxford County
The most populous ancestries reported in Oxford County are English (12,616 | 21.6%), French (8,787 | 15.1%), Irish (8,610 | 14.8%), American (4,405 | 7.6%), and French Canadian (3,917 | 6.7%), together accounting for 65.8% of all Oxford County residents.
| Ancestry | # Population | % Population |
| African | 12 | 0.0% |
| Albanian | 2 | 0.0% |
| American | 4,405 | 7.6% |
| Arab | 149 | 0.3% |
| Armenian | 7 | 0.0% |
| Austrian | 32 | 0.1% |
| Belgian | 19 | 0.0% |
| Bhutanese | 153 | 0.3% |
| Blackfeet | 8 | 0.0% |
| Brazilian | 56 | 0.1% |
| British | 324 | 0.6% |
| Burmese | 11 | 0.0% |
| Cajun | 2 | 0.0% |
| Canadian | 412 | 0.7% |
| Cape Verdean | 2 | 0.0% |
| Celtic | 3 | 0.0% |
| Central American | 5 | 0.0% |
| Central American Indian | 42 | 0.1% |
| Cherokee | 54 | 0.1% |
| Chippewa | 26 | 0.0% |
| Choctaw | 12 | 0.0% |
| Colombian | 39 | 0.1% |
| Creek | 8 | 0.0% |
| Croatian | 12 | 0.0% |
| Cuban | 56 | 0.1% |
| Czech | 59 | 0.1% |
| Czechoslovakian | 5 | 0.0% |
| Danish | 179 | 0.3% |
| Delaware | 8 | 0.0% |
| Dominican | 9 | 0.0% |
| Dutch | 290 | 0.5% |
| Eastern European | 42 | 0.1% |
| English | 12,616 | 21.6% |
| European | 671 | 1.1% |
| Filipino | 10 | 0.0% |
| Finnish | 586 | 1.0% |
| French | 8,787 | 15.1% |
| French American Indian | 4 | 0.0% |
| French Canadian | 3,917 | 6.7% |
| German | 3,411 | 5.9% |
| Greek | 278 | 0.5% |
| Guamanian / Chamorro | 4 | 0.0% |
| Guatemalan | 5 | 0.0% |
| Haitian | 5 | 0.0% |
| Hungarian | 225 | 0.4% |
| Indian (Asian) | 150 | 0.3% |
| Inupiat | 6 | 0.0% |
| Iraqi | 3 | 0.0% |
| Irish | 8,610 | 14.8% |
| Iroquois | 5 | 0.0% |
| Italian | 2,304 | 4.0% |
| Jamaican | 4 | 0.0% |
| Japanese | 8 | 0.0% |
| Korean | 109 | 0.2% |
| Lebanese | 55 | 0.1% |
| Lithuanian | 443 | 0.8% |
| Malaysian | 8 | 0.0% |
| Mexican | 282 | 0.5% |
| Moroccan | 18 | 0.0% |
| Native Hawaiian | 4 | 0.0% |
| Northern European | 81 | 0.1% |
| Norwegian | 422 | 0.7% |
| Pakistani | 80 | 0.1% |
| Peruvian | 59 | 0.1% |
| Polish | 908 | 1.6% |
| Portuguese | 309 | 0.5% |
| Potawatomi | 11 | 0.0% |
| Puerto Rican | 301 | 0.5% |
| Romanian | 24 | 0.0% |
| Russian | 185 | 0.3% |
| Samoan | 46 | 0.1% |
| Scandinavian | 347 | 0.6% |
| Scotch-Irish | 831 | 1.4% |
| Scottish | 2,591 | 4.4% |
| Serbian | 4 | 0.0% |
| Sioux | 2 | 0.0% |
| Slavic | 4 | 0.0% |
| Slovak | 31 | 0.1% |
| Slovene | 7 | 0.0% |
| Somali | 10 | 0.0% |
| South African | 3 | 0.0% |
| South American | 98 | 0.2% |
| Spaniard | 132 | 0.2% |
| Sri Lankan | 41 | 0.1% |
| Subsaharan African | 31 | 0.1% |
| Swedish | 711 | 1.2% |
| Swiss | 76 | 0.1% |
| Syrian | 53 | 0.1% |
| Thai | 24 | 0.0% |
| Trinidadian and Tobagonian | 31 | 0.1% |
| Ukrainian | 45 | 0.1% |
| Welsh | 253 | 0.4% |
| West Indian | 18 | 0.0% |
| Yup'ik | 29 | 0.1% | View All 94 Rows |
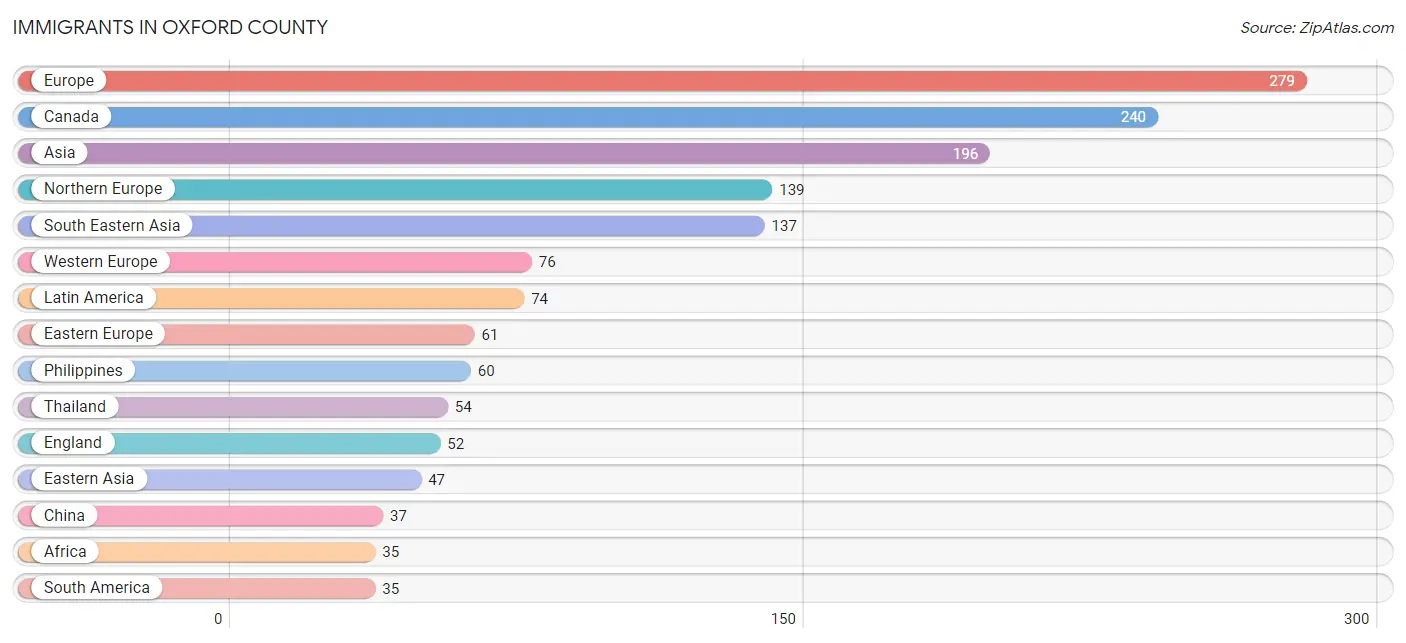
Immigrants in Oxford County
The most numerous immigrant groups reported in Oxford County came from Europe (279 | 0.5%), Canada (240 | 0.4%), Asia (196 | 0.3%), Northern Europe (139 | 0.2%), and South Eastern Asia (137 | 0.2%), together accounting for 1.7% of all Oxford County residents.
| Immigration Origin | # Population | % Population |
| Africa | 35 | 0.1% |
| Asia | 196 | 0.3% |
| Austria | 25 | 0.0% |
| Brazil | 17 | 0.0% |
| Cambodia | 8 | 0.0% |
| Canada | 240 | 0.4% |
| Caribbean | 31 | 0.1% |
| Central America | 8 | 0.0% |
| China | 37 | 0.1% |
| Colombia | 18 | 0.0% |
| Cuba | 20 | 0.0% |
| Denmark | 3 | 0.0% |
| Eastern Africa | 7 | 0.0% |
| Eastern Asia | 47 | 0.1% |
| Eastern Europe | 61 | 0.1% |
| England | 52 | 0.1% |
| Europe | 279 | 0.5% |
| France | 29 | 0.1% |
| Germany | 17 | 0.0% |
| Ghana | 5 | 0.0% |
| Haiti | 5 | 0.0% |
| Hungary | 1 | 0.0% |
| India | 6 | 0.0% |
| Ireland | 1 | 0.0% |
| Italy | 3 | 0.0% |
| Jamaica | 1 | 0.0% |
| Japan | 10 | 0.0% |
| Laos | 2 | 0.0% |
| Latin America | 74 | 0.1% |
| Mexico | 4 | 0.0% |
| Morocco | 15 | 0.0% |
| Netherlands | 5 | 0.0% |
| Northern Africa | 15 | 0.0% |
| Northern Europe | 139 | 0.2% |
| Panama | 4 | 0.0% |
| Philippines | 60 | 0.1% |
| Poland | 25 | 0.0% |
| Romania | 24 | 0.0% |
| Russia | 5 | 0.0% |
| Serbia | 4 | 0.0% |
| Singapore | 13 | 0.0% |
| South Africa | 8 | 0.0% |
| South America | 35 | 0.1% |
| South Central Asia | 6 | 0.0% |
| South Eastern Asia | 137 | 0.2% |
| Southern Europe | 3 | 0.0% |
| Sweden | 5 | 0.0% |
| Syria | 6 | 0.0% |
| Taiwan | 10 | 0.0% |
| Thailand | 54 | 0.1% |
| Trinidad and Tobago | 5 | 0.0% |
| Ukraine | 2 | 0.0% |
| Western Africa | 5 | 0.0% |
| Western Asia | 6 | 0.0% |
| Western Europe | 76 | 0.1% |
| Zimbabwe | 3 | 0.0% | View All 56 Rows |
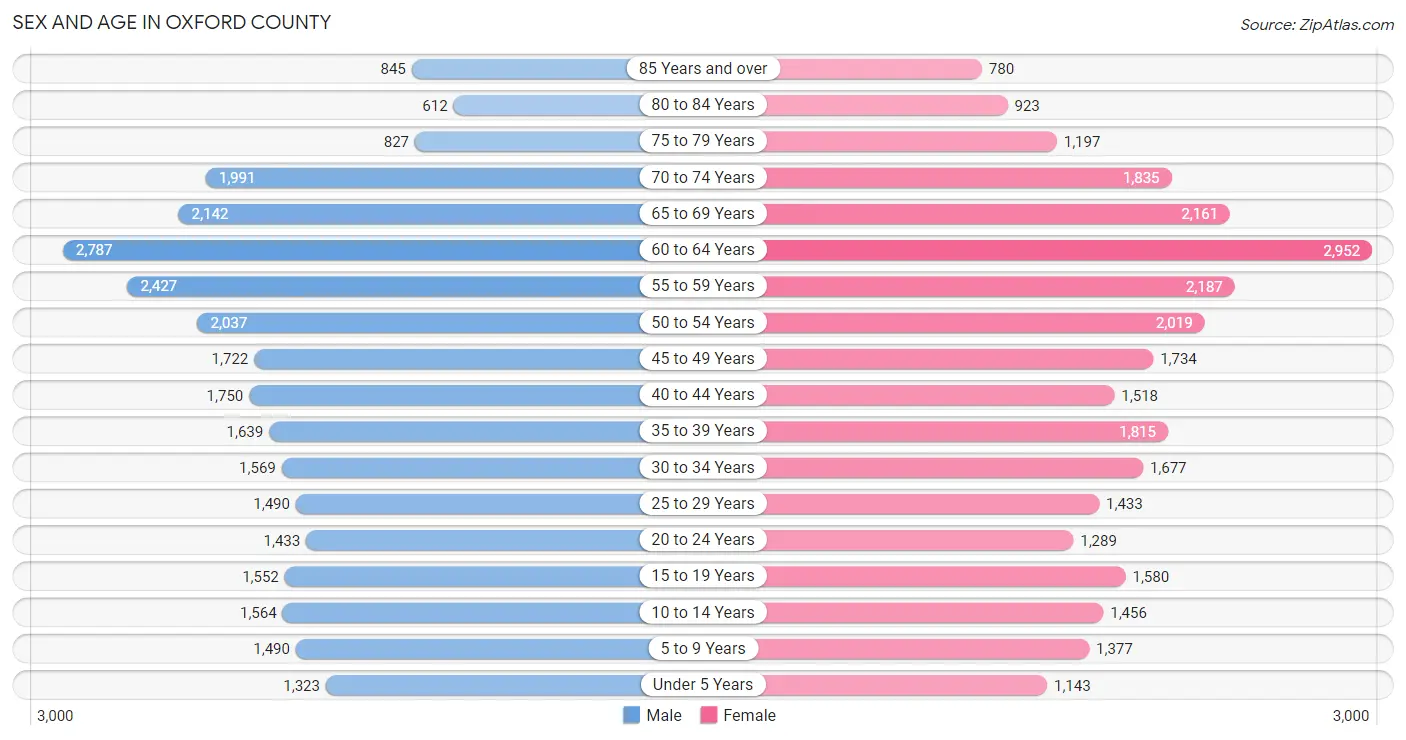
Sex and Age in Oxford County
Sex and Age in Oxford County
The most populous age groups in Oxford County are 60 to 64 Years (2,787 | 9.5%) for men and 60 to 64 Years (2,952 | 10.2%) for women.
| Age Bracket | Male | Female |
| Under 5 Years | 1,323 (4.5%) | 1,143 (3.9%) |
| 5 to 9 Years | 1,490 (5.1%) | 1,377 (4.7%) |
| 10 to 14 Years | 1,564 (5.4%) | 1,456 (5.0%) |
| 15 to 19 Years | 1,552 (5.3%) | 1,580 (5.4%) |
| 20 to 24 Years | 1,433 (4.9%) | 1,289 (4.4%) |
| 25 to 29 Years | 1,490 (5.1%) | 1,433 (4.9%) |
| 30 to 34 Years | 1,569 (5.4%) | 1,677 (5.8%) |
| 35 to 39 Years | 1,639 (5.6%) | 1,815 (6.2%) |
| 40 to 44 Years | 1,750 (6.0%) | 1,518 (5.2%) |
| 45 to 49 Years | 1,722 (5.9%) | 1,734 (6.0%) |
| 50 to 54 Years | 2,037 (7.0%) | 2,019 (6.9%) |
| 55 to 59 Years | 2,427 (8.3%) | 2,187 (7.5%) |
| 60 to 64 Years | 2,787 (9.5%) | 2,952 (10.2%) |
| 65 to 69 Years | 2,142 (7.3%) | 2,161 (7.4%) |
| 70 to 74 Years | 1,991 (6.8%) | 1,835 (6.3%) |
| 75 to 79 Years | 827 (2.8%) | 1,197 (4.1%) |
| 80 to 84 Years | 612 (2.1%) | 923 (3.2%) |
| 85 Years and over | 845 (2.9%) | 780 (2.7%) |
| Total | 29,200 (100.0%) | 29,076 (100.0%) |
Families and Households in Oxford County
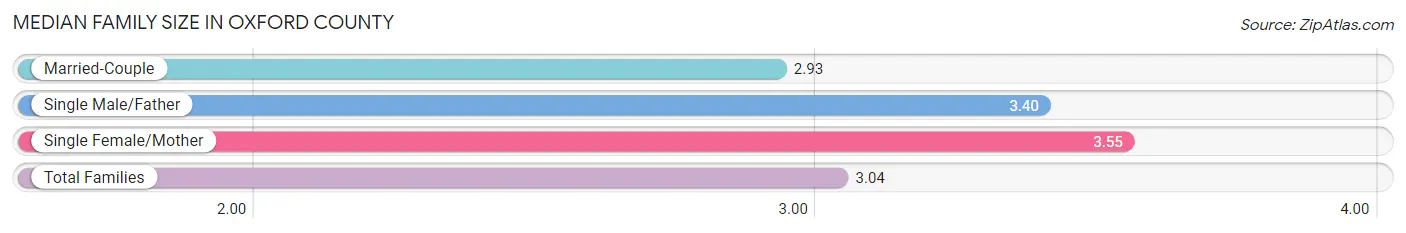
Median Family Size in Oxford County
The median family size in Oxford County is 3.04 persons per family, with single female/mother families (1,900 | 13.2%) accounting for the largest median family size of 3.55 persons per family. On the other hand, married-couple families (11,584 | 80.6%) represent the smallest median family size with 2.93 persons per family.
| Family Type | # Families | Family Size |
| Married-Couple | 11,584 (80.6%) | 2.93 |
| Single Male/Father | 895 (6.2%) | 3.40 |
| Single Female/Mother | 1,900 (13.2%) | 3.55 |
| Total Families | 14,379 (100.0%) | 3.04 |
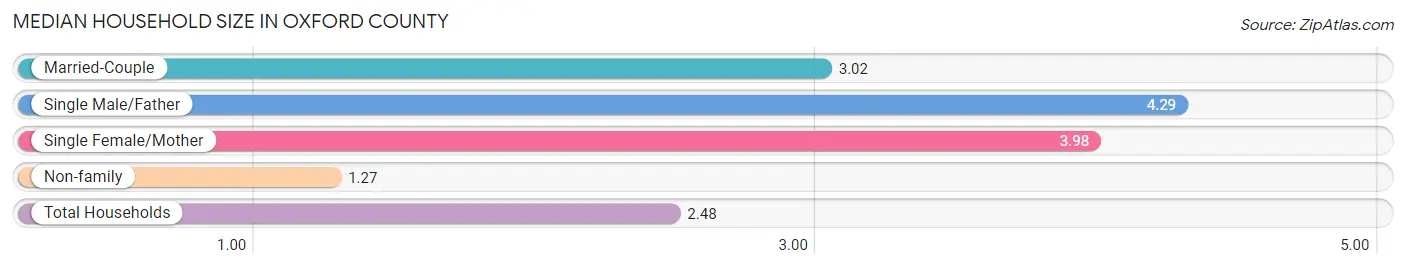
Median Household Size in Oxford County
The median household size in Oxford County is 2.48 persons per household, with single male/father households (895 | 3.9%) accounting for the largest median household size of 4.29 persons per household. non-family households (8,804 | 38.0%) represent the smallest median household size with 1.27 persons per household.
| Household Type | # Households | Household Size |
| Married-Couple | 11,584 (50.0%) | 3.02 |
| Single Male/Father | 895 (3.9%) | 4.29 |
| Single Female/Mother | 1,900 (8.2%) | 3.98 |
| Non-family | 8,804 (38.0%) | 1.27 |
| Total Households | 23,183 (100.0%) | 2.48 |
Household Size by Marriage Status in Oxford County
Out of a total of 23,183 households in Oxford County, 14,379 (62.0%) are family households, while 8,804 (38.0%) are nonfamily households. The most numerous type of family households are 2-person households, comprising 7,760, and the most common type of nonfamily households are 1-person households, comprising 6,937.
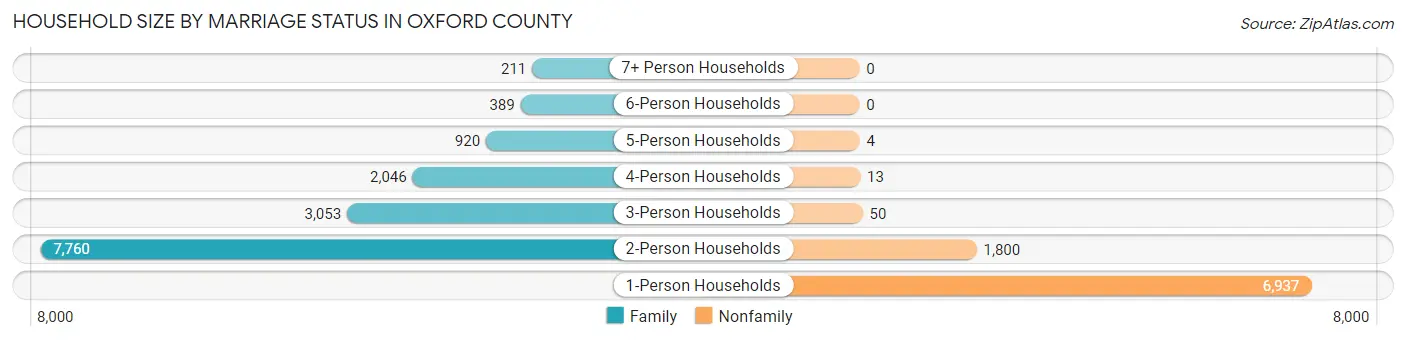
| Household Size | Family Households | Nonfamily Households |
| 1-Person Households | - | 6,937 (29.9%) |
| 2-Person Households | 7,760 (33.5%) | 1,800 (7.8%) |
| 3-Person Households | 3,053 (13.2%) | 50 (0.2%) |
| 4-Person Households | 2,046 (8.8%) | 13 (0.1%) |
| 5-Person Households | 920 (4.0%) | 4 (0.0%) |
| 6-Person Households | 389 (1.7%) | 0 (0.0%) |
| 7+ Person Households | 211 (0.9%) | 0 (0.0%) |
| Total | 14,379 (62.0%) | 8,804 (38.0%) |
Female Fertility in Oxford County
Fertility by Age in Oxford County
Average fertility rate in Oxford County is 58.0 births per 1,000 women. Women in the age bracket of 20 to 34 years have the highest fertility rate with 101.0 births per 1,000 women. Women in the age bracket of 20 to 34 years acount for 67.4% of all women with births.
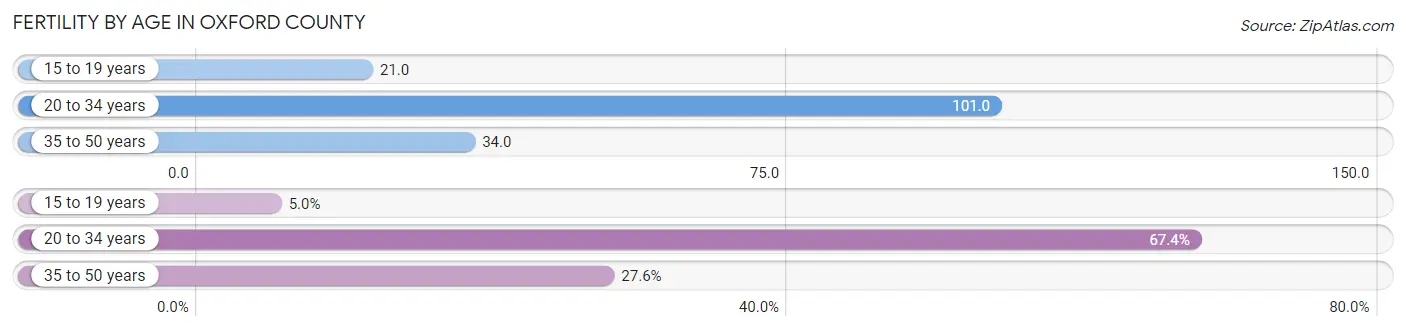
| Age Bracket | Women with Births | Births / 1,000 Women |
| 15 to 19 years | 33 (5.0%) | 21.0 |
| 20 to 34 years | 445 (67.4%) | 101.0 |
| 35 to 50 years | 182 (27.6%) | 34.0 |
| Total | 660 (100.0%) | 58.0 |
Fertility by Age by Marriage Status in Oxford County
50.9% of women with births (660) in Oxford County are married. The highest percentage of unmarried women with births falls into 15 to 19 years age bracket with 100.0% of them unmarried at the time of birth, while the lowest percentage of unmarried women with births belong to 20 to 34 years age bracket with 43.1% of them unmarried.
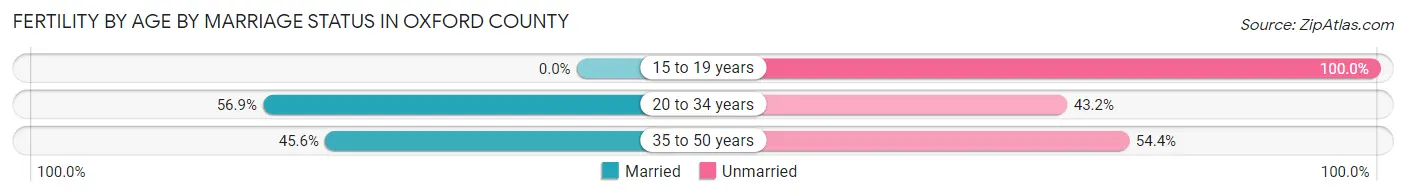
| Age Bracket | Married | Unmarried |
| 15 to 19 years | 0 (0.0%) | 33 (100.0%) |
| 20 to 34 years | 253 (56.9%) | 192 (43.1%) |
| 35 to 50 years | 83 (45.6%) | 99 (54.4%) |
| Total | 336 (50.9%) | 324 (49.1%) |
Fertility by Education in Oxford County
Average fertility rate in Oxford County is 58.0 births per 1,000 women. Women with the education attainment of graduate degree have the highest fertility rate of 83.0 births per 1,000 women, while women with the education attainment of less than high school have the lowest fertility at 30.0 births per 1,000 women. Women with the education attainment of high school diploma represent 36.7% of all women with births.
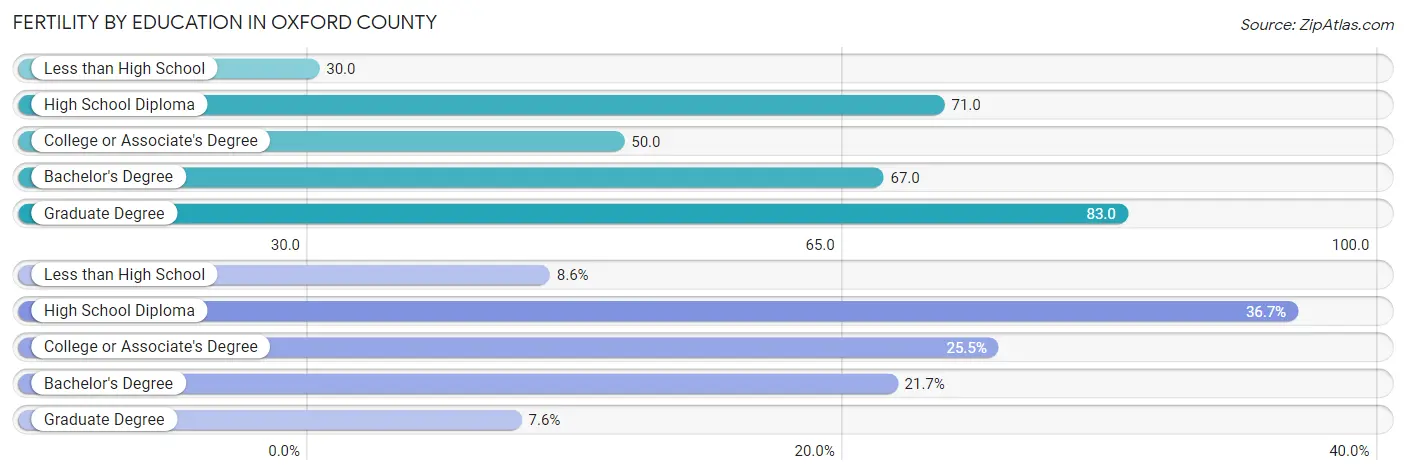
| Educational Attainment | Women with Births | Births / 1,000 Women |
| Less than High School | 57 (8.6%) | 30.0 |
| High School Diploma | 242 (36.7%) | 71.0 |
| College or Associate's Degree | 168 (25.5%) | 50.0 |
| Bachelor's Degree | 143 (21.7%) | 67.0 |
| Graduate Degree | 50 (7.6%) | 83.0 |
| Total | 660 (100.0%) | 58.0 |
Fertility by Education by Marriage Status in Oxford County
49.1% of women with births in Oxford County are unmarried. Women with the educational attainment of graduate degree are most likely to be married with 100.0% of them married at childbirth, while women with the educational attainment of less than high school are least likely to be married with 77.2% of them unmarried at childbirth.
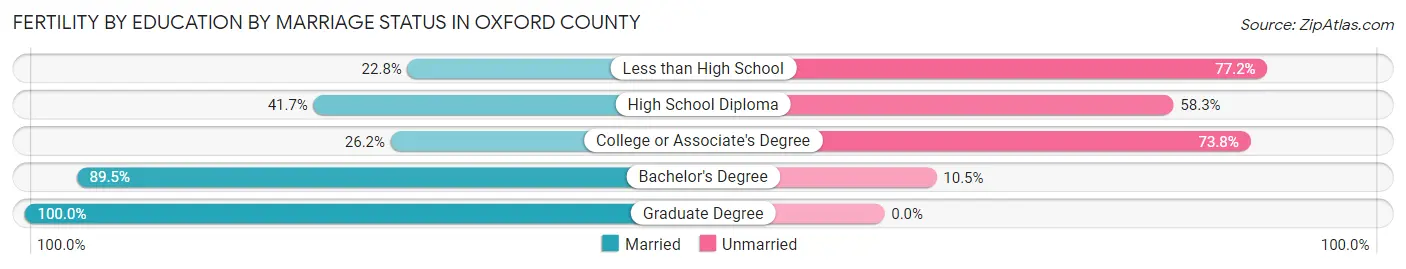
| Educational Attainment | Married | Unmarried |
| Less than High School | 13 (22.8%) | 44 (77.2%) |
| High School Diploma | 101 (41.7%) | 141 (58.3%) |
| College or Associate's Degree | 44 (26.2%) | 124 (73.8%) |
| Bachelor's Degree | 128 (89.5%) | 15 (10.5%) |
| Graduate Degree | 50 (100.0%) | 0 (0.0%) |
| Total | 336 (50.9%) | 324 (49.1%) |
Employment Characteristics in Oxford County
Employment by Class of Employer in Oxford County
Among the 25,576 employed individuals in Oxford County, private company employees (15,939 | 62.3%), not-for-profit organizations (2,925 | 11.4%), and self-employed (not incorporated) (2,445 | 9.6%) make up the most common classes of employment.
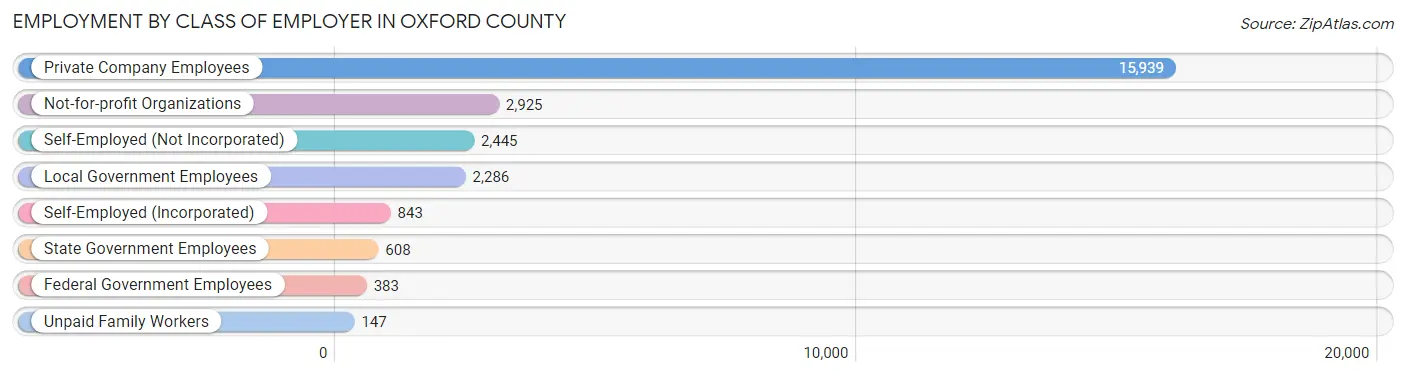
| Employer Class | # Employees | % Employees |
| Private Company Employees | 15,939 | 62.3% |
| Self-Employed (Incorporated) | 843 | 3.3% |
| Self-Employed (Not Incorporated) | 2,445 | 9.6% |
| Not-for-profit Organizations | 2,925 | 11.4% |
| Local Government Employees | 2,286 | 8.9% |
| State Government Employees | 608 | 2.4% |
| Federal Government Employees | 383 | 1.5% |
| Unpaid Family Workers | 147 | 0.6% |
| Total | 25,576 | 100.0% |
Employment Status by Age in Oxford County
According to the labor force statistics for Oxford County, out of the total population over 16 years of age (49,284), 56.1% or 27,648 individuals are in the labor force, with 5.5% or 1,521 of them unemployed. The age group with the highest labor force participation rate is 25 to 29 years, with 84.0% or 2,455 individuals in the labor force. Within the labor force, the 16 to 19 years age range has the highest percentage of unemployed individuals, with 16.2% or 170 of them being unemployed.
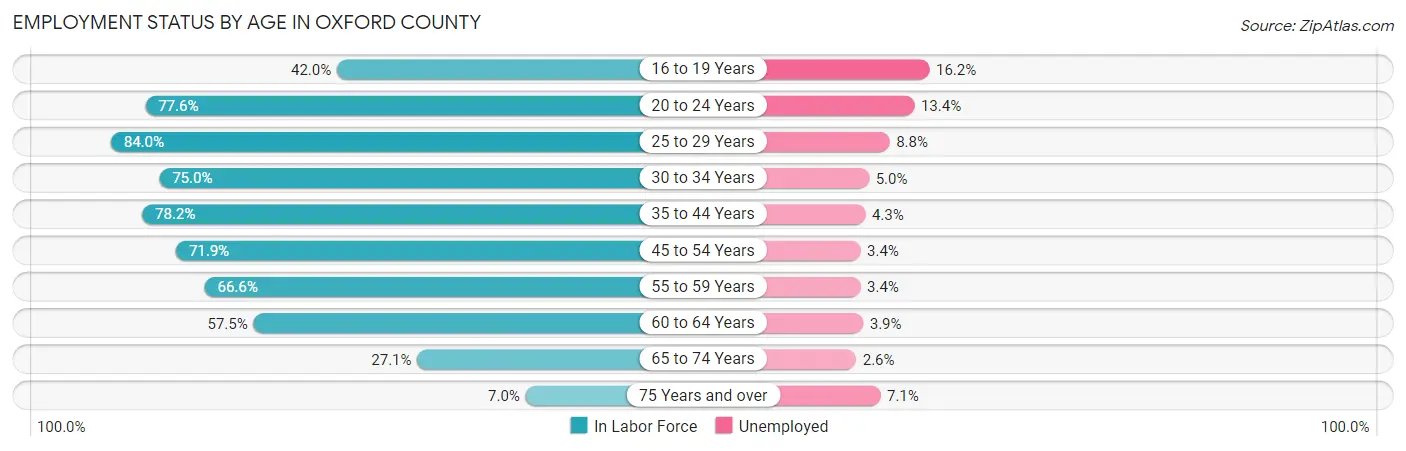
| Age Bracket | In Labor Force | Unemployed |
| 16 to 19 Years | 1,047 (42.0%) | 170 (16.2%) |
| 20 to 24 Years | 2,112 (77.6%) | 283 (13.4%) |
| 25 to 29 Years | 2,455 (84.0%) | 216 (8.8%) |
| 30 to 34 Years | 2,434 (75.0%) | 122 (5.0%) |
| 35 to 44 Years | 5,257 (78.2%) | 226 (4.3%) |
| 45 to 54 Years | 5,401 (71.9%) | 184 (3.4%) |
| 55 to 59 Years | 3,073 (66.6%) | 104 (3.4%) |
| 60 to 64 Years | 3,300 (57.5%) | 129 (3.9%) |
| 65 to 74 Years | 2,203 (27.1%) | 57 (2.6%) |
| 75 Years and over | 363 (7.0%) | 26 (7.1%) |
| Total | 27,648 (56.1%) | 1,521 (5.5%) |
Employment Status by Educational Attainment in Oxford County
According to labor force statistics for Oxford County, 71.3% of individuals (21,929) out of the total population between 25 and 64 years of age (30,756) are in the labor force, with 4.5% or 987 of them being unemployed. The group with the highest labor force participation rate are those with the educational attainment of bachelor's degree or higher, with 83.8% or 5,349 individuals in the labor force. Within the labor force, individuals with less than high school education have the highest percentage of unemployment, with 15.9% or 214 of them being unemployed.
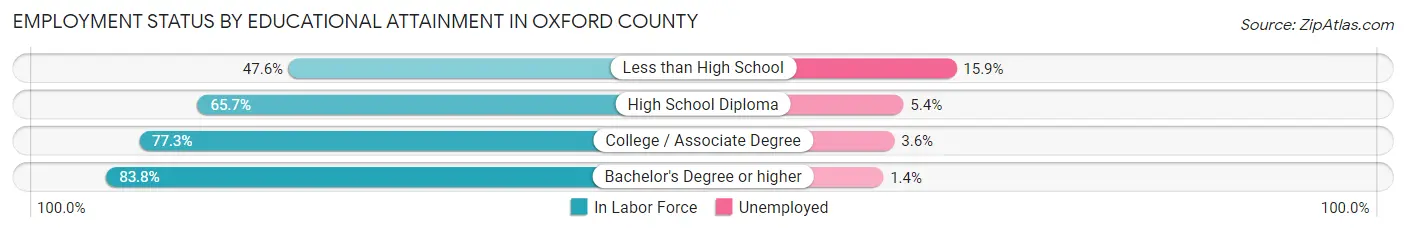
| Educational Attainment | In Labor Force | Unemployed |
| Less than High School | 1,347 (47.6%) | 450 (15.9%) |
| High School Diploma | 8,155 (65.7%) | 670 (5.4%) |
| College / Associate Degree | 7,058 (77.3%) | 329 (3.6%) |
| Bachelor's Degree or higher | 5,349 (83.8%) | 89 (1.4%) |
| Total | 21,929 (71.3%) | 1,384 (4.5%) |
Employment Occupations by Sex in Oxford County
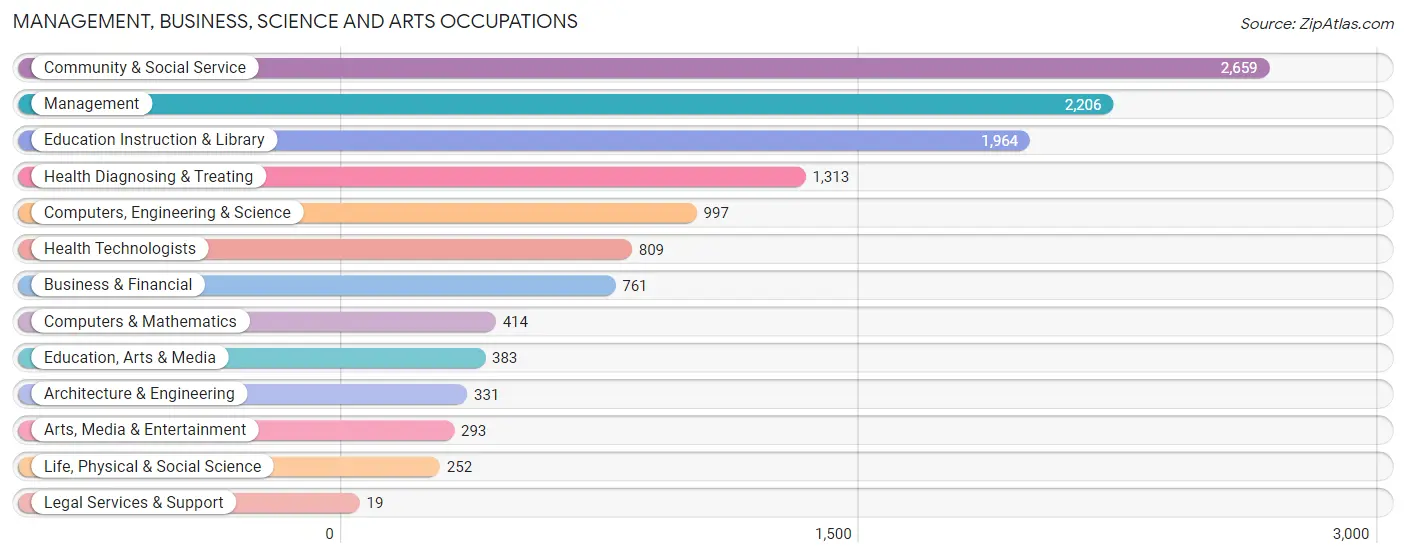
Management, Business, Science and Arts Occupations
The most common Management, Business, Science and Arts occupations in Oxford County are Community & Social Service (2,659 | 10.2%), Management (2,206 | 8.5%), Education Instruction & Library (1,964 | 7.5%), Health Diagnosing & Treating (1,313 | 5.0%), and Computers, Engineering & Science (997 | 3.8%).
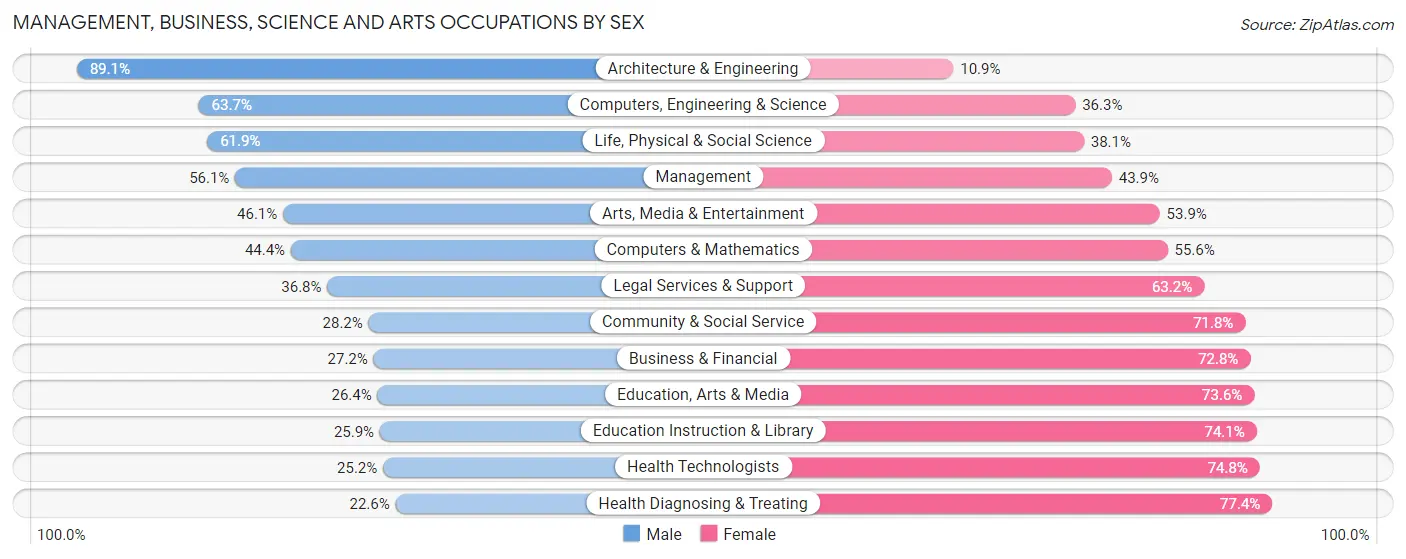
Management, Business, Science and Arts Occupations by Sex
Within the Management, Business, Science and Arts occupations in Oxford County, the most male-oriented occupations are Architecture & Engineering (89.1%), Computers, Engineering & Science (63.7%), and Life, Physical & Social Science (61.9%), while the most female-oriented occupations are Health Diagnosing & Treating (77.4%), Health Technologists (74.8%), and Education Instruction & Library (74.1%).
| Occupation | Male | Female |
| Management | 1,237 (56.1%) | 969 (43.9%) |
| Business & Financial | 207 (27.2%) | 554 (72.8%) |
| Computers, Engineering & Science | 635 (63.7%) | 362 (36.3%) |
| Computers & Mathematics | 184 (44.4%) | 230 (55.6%) |
| Architecture & Engineering | 295 (89.1%) | 36 (10.9%) |
| Life, Physical & Social Science | 156 (61.9%) | 96 (38.1%) |
| Community & Social Service | 751 (28.2%) | 1,908 (71.8%) |
| Education, Arts & Media | 101 (26.4%) | 282 (73.6%) |
| Legal Services & Support | 7 (36.8%) | 12 (63.2%) |
| Education Instruction & Library | 508 (25.9%) | 1,456 (74.1%) |
| Arts, Media & Entertainment | 135 (46.1%) | 158 (53.9%) |
| Health Diagnosing & Treating | 297 (22.6%) | 1,016 (77.4%) |
| Health Technologists | 204 (25.2%) | 605 (74.8%) |
| Total (Category) | 3,127 (39.4%) | 4,809 (60.6%) |
| Total (Overall) | 13,165 (50.4%) | 12,941 (49.6%) |
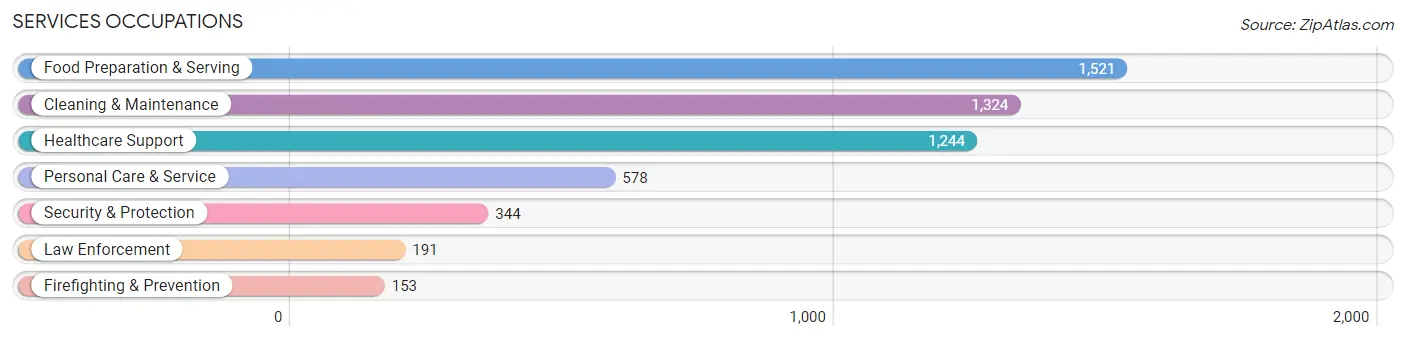
Services Occupations
The most common Services occupations in Oxford County are Food Preparation & Serving (1,521 | 5.8%), Cleaning & Maintenance (1,324 | 5.1%), Healthcare Support (1,244 | 4.8%), Personal Care & Service (578 | 2.2%), and Security & Protection (344 | 1.3%).
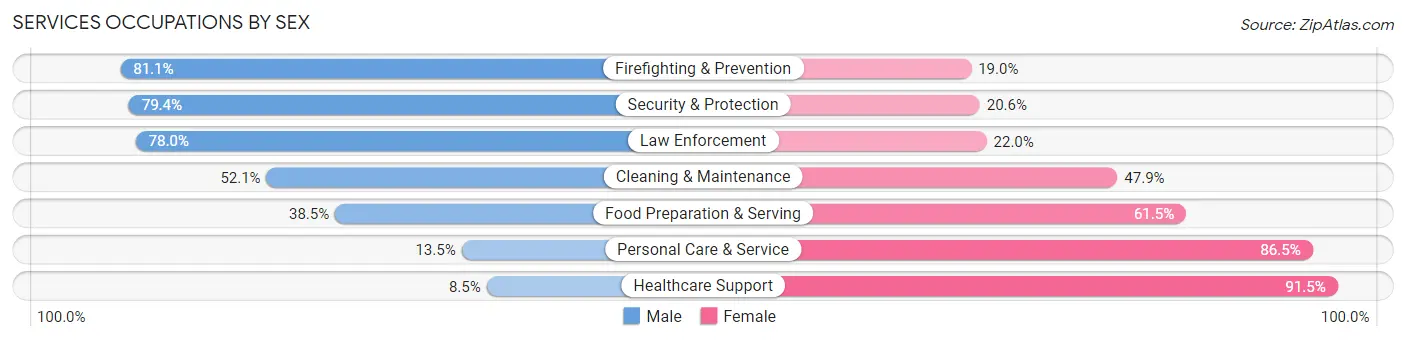
Services Occupations by Sex
Within the Services occupations in Oxford County, the most male-oriented occupations are Firefighting & Prevention (81.0%), Security & Protection (79.4%), and Law Enforcement (78.0%), while the most female-oriented occupations are Healthcare Support (91.5%), Personal Care & Service (86.5%), and Food Preparation & Serving (61.5%).
| Occupation | Male | Female |
| Healthcare Support | 106 (8.5%) | 1,138 (91.5%) |
| Security & Protection | 273 (79.4%) | 71 (20.6%) |
| Firefighting & Prevention | 124 (81.0%) | 29 (19.0%) |
| Law Enforcement | 149 (78.0%) | 42 (22.0%) |
| Food Preparation & Serving | 586 (38.5%) | 935 (61.5%) |
| Cleaning & Maintenance | 690 (52.1%) | 634 (47.9%) |
| Personal Care & Service | 78 (13.5%) | 500 (86.5%) |
| Total (Category) | 1,733 (34.6%) | 3,278 (65.4%) |
| Total (Overall) | 13,165 (50.4%) | 12,941 (49.6%) |
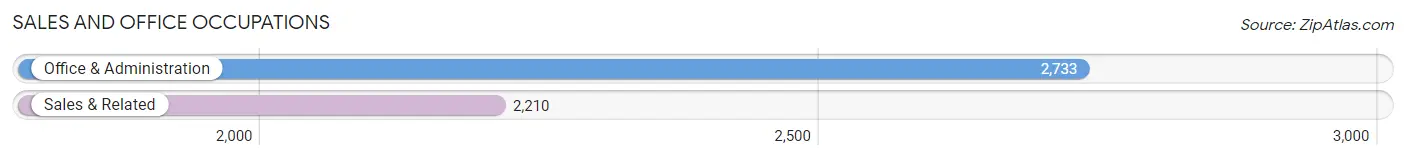
Sales and Office Occupations
The most common Sales and Office occupations in Oxford County are Office & Administration (2,733 | 10.5%), and Sales & Related (2,210 | 8.5%).
Sales and Office Occupations by Sex
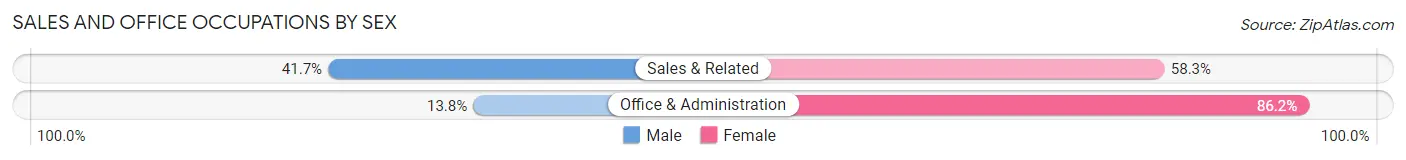
| Occupation | Male | Female |
| Sales & Related | 921 (41.7%) | 1,289 (58.3%) |
| Office & Administration | 376 (13.8%) | 2,357 (86.2%) |
| Total (Category) | 1,297 (26.2%) | 3,646 (73.8%) |
| Total (Overall) | 13,165 (50.4%) | 12,941 (49.6%) |
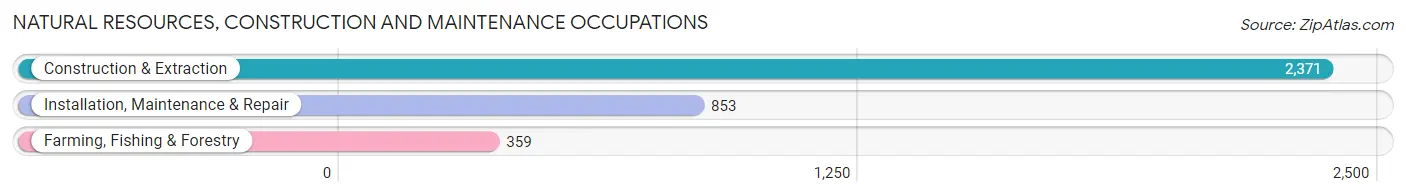
Natural Resources, Construction and Maintenance Occupations
The most common Natural Resources, Construction and Maintenance occupations in Oxford County are Construction & Extraction (2,371 | 9.1%), Installation, Maintenance & Repair (853 | 3.3%), and Farming, Fishing & Forestry (359 | 1.4%).
Natural Resources, Construction and Maintenance Occupations by Sex
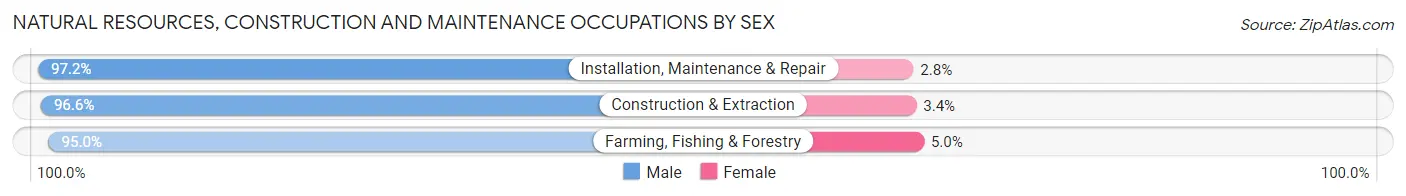
| Occupation | Male | Female |
| Farming, Fishing & Forestry | 341 (95.0%) | 18 (5.0%) |
| Construction & Extraction | 2,290 (96.6%) | 81 (3.4%) |
| Installation, Maintenance & Repair | 829 (97.2%) | 24 (2.8%) |
| Total (Category) | 3,460 (96.6%) | 123 (3.4%) |
| Total (Overall) | 13,165 (50.4%) | 12,941 (49.6%) |
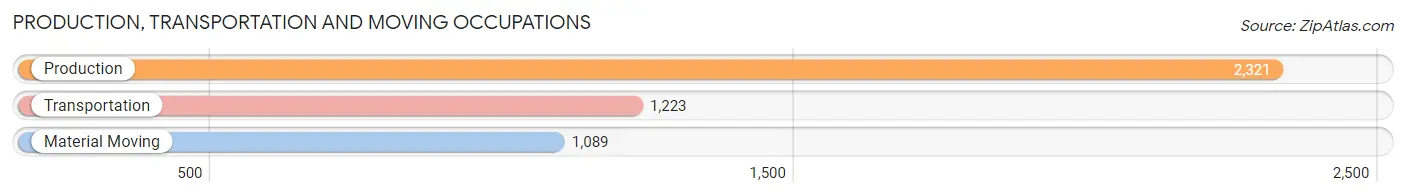
Production, Transportation and Moving Occupations
The most common Production, Transportation and Moving occupations in Oxford County are Production (2,321 | 8.9%), Transportation (1,223 | 4.7%), and Material Moving (1,089 | 4.2%).
Production, Transportation and Moving Occupations by Sex
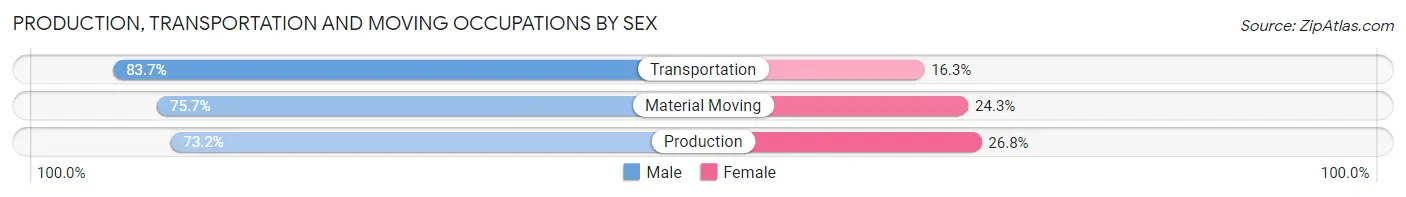
| Occupation | Male | Female |
| Production | 1,700 (73.2%) | 621 (26.8%) |
| Transportation | 1,024 (83.7%) | 199 (16.3%) |
| Material Moving | 824 (75.7%) | 265 (24.3%) |
| Total (Category) | 3,548 (76.6%) | 1,085 (23.4%) |
| Total (Overall) | 13,165 (50.4%) | 12,941 (49.6%) |
Employment Industries by Sex in Oxford County
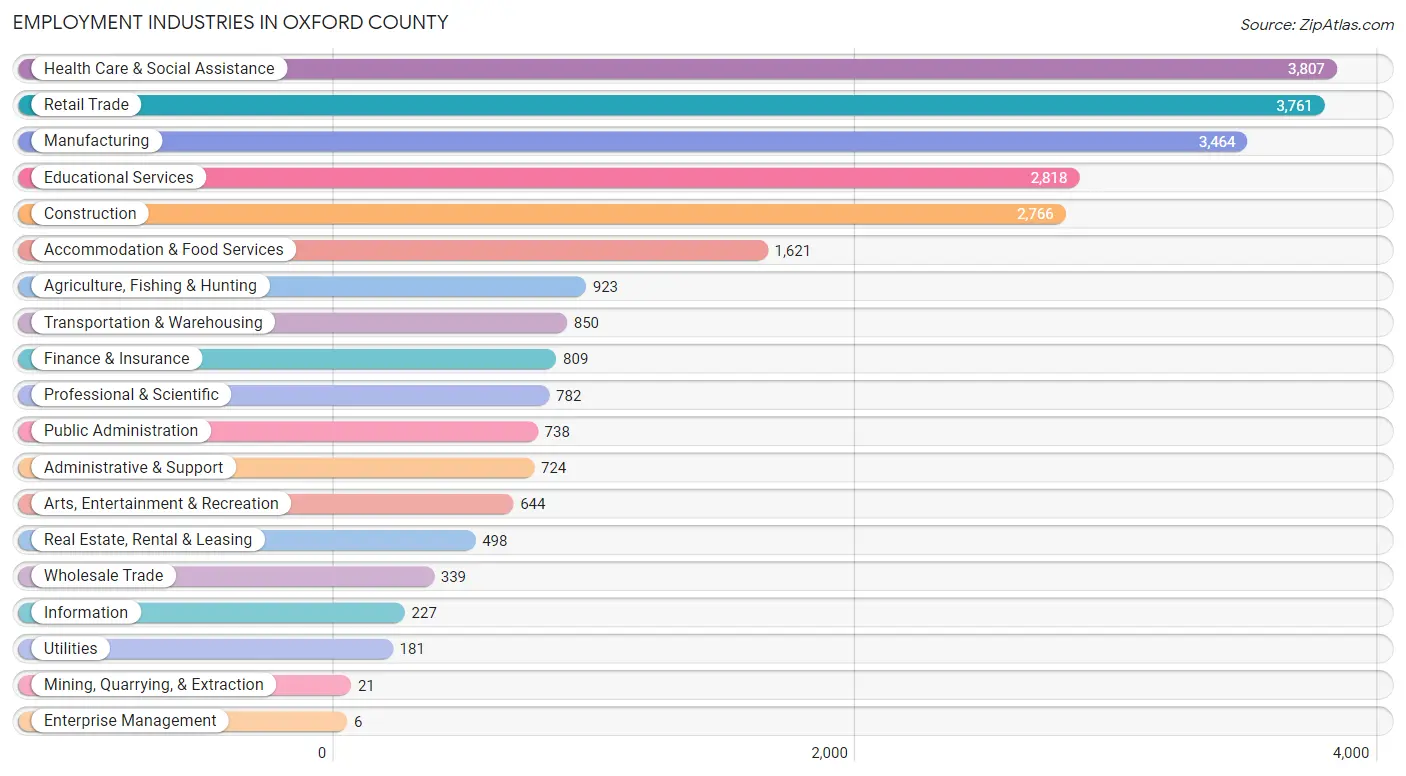
Employment Industries in Oxford County
The major employment industries in Oxford County include Health Care & Social Assistance (3,807 | 14.6%), Retail Trade (3,761 | 14.4%), Manufacturing (3,464 | 13.3%), Educational Services (2,818 | 10.8%), and Construction (2,766 | 10.6%).
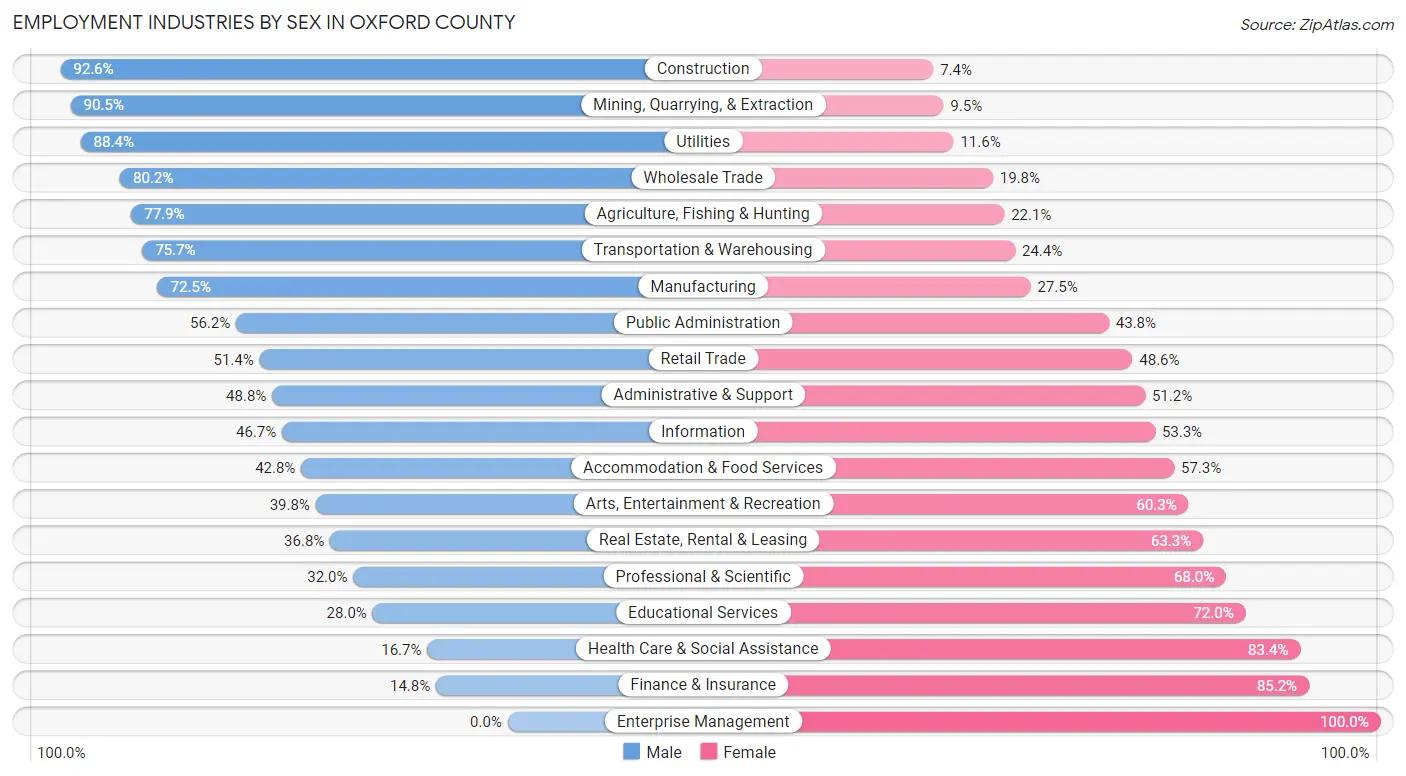
Employment Industries by Sex in Oxford County
The Oxford County industries that see more men than women are Construction (92.6%), Mining, Quarrying, & Extraction (90.5%), and Utilities (88.4%), whereas the industries that tend to have a higher number of women are Enterprise Management (100.0%), Finance & Insurance (85.2%), and Health Care & Social Assistance (83.4%).
| Industry | Male | Female |
| Agriculture, Fishing & Hunting | 719 (77.9%) | 204 (22.1%) |
| Mining, Quarrying, & Extraction | 19 (90.5%) | 2 (9.5%) |
| Construction | 2,561 (92.6%) | 205 (7.4%) |
| Manufacturing | 2,510 (72.5%) | 954 (27.5%) |
| Wholesale Trade | 272 (80.2%) | 67 (19.8%) |
| Retail Trade | 1,932 (51.4%) | 1,829 (48.6%) |
| Transportation & Warehousing | 643 (75.6%) | 207 (24.3%) |
| Utilities | 160 (88.4%) | 21 (11.6%) |
| Information | 106 (46.7%) | 121 (53.3%) |
| Finance & Insurance | 120 (14.8%) | 689 (85.2%) |
| Real Estate, Rental & Leasing | 183 (36.7%) | 315 (63.2%) |
| Professional & Scientific | 250 (32.0%) | 532 (68.0%) |
| Enterprise Management | 0 (0.0%) | 6 (100.0%) |
| Administrative & Support | 353 (48.8%) | 371 (51.2%) |
| Educational Services | 788 (28.0%) | 2,030 (72.0%) |
| Health Care & Social Assistance | 634 (16.7%) | 3,173 (83.4%) |
| Arts, Entertainment & Recreation | 256 (39.8%) | 388 (60.3%) |
| Accommodation & Food Services | 693 (42.7%) | 928 (57.3%) |
| Public Administration | 415 (56.2%) | 323 (43.8%) |
| Total | 13,165 (50.4%) | 12,941 (49.6%) |
Education in Oxford County
School Enrollment in Oxford County
The most common levels of schooling among the 10,655 students in Oxford County are elementary school (2,771 | 26.0%), high school (2,630 | 24.7%), and middle school (2,303 | 21.6%).
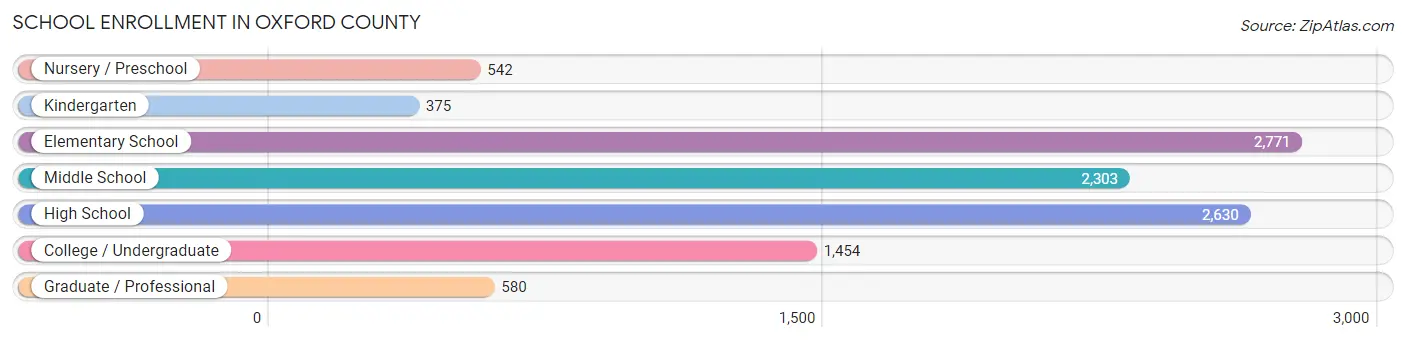
| School Level | # Students | % Students |
| Nursery / Preschool | 542 | 5.1% |
| Kindergarten | 375 | 3.5% |
| Elementary School | 2,771 | 26.0% |
| Middle School | 2,303 | 21.6% |
| High School | 2,630 | 24.7% |
| College / Undergraduate | 1,454 | 13.7% |
| Graduate / Professional | 580 | 5.4% |
| Total | 10,655 | 100.0% |
School Enrollment by Age by Funding Source in Oxford County
Out of a total of 10,655 students who are enrolled in schools in Oxford County, 1,524 (14.3%) attend a private institution, while the remaining 9,131 (85.7%) are enrolled in public schools. The age group of 35 years and over has the highest likelihood of being enrolled in private schools, with 273 (36.4% in the age bracket) enrolled. Conversely, the age group of 5 to 9 year old has the lowest likelihood of being enrolled in a private school, with 2,574 (92.6% in the age bracket) attending a public institution.
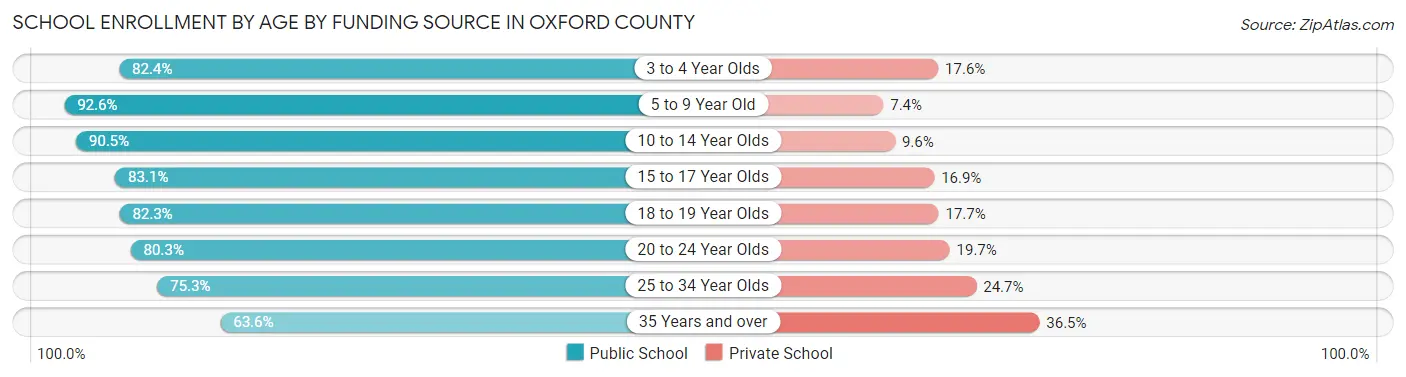
| Age Bracket | Public School | Private School |
| 3 to 4 Year Olds | 337 (82.4%) | 72 (17.6%) |
| 5 to 9 Year Old | 2,574 (92.6%) | 205 (7.4%) |
| 10 to 14 Year Olds | 2,710 (90.4%) | 286 (9.6%) |
| 15 to 17 Year Olds | 1,613 (83.1%) | 327 (16.9%) |
| 18 to 19 Year Olds | 573 (82.3%) | 123 (17.7%) |
| 20 to 24 Year Olds | 537 (80.3%) | 132 (19.7%) |
| 25 to 34 Year Olds | 314 (75.3%) | 103 (24.7%) |
| 35 Years and over | 476 (63.5%) | 273 (36.4%) |
| Total | 9,131 (85.7%) | 1,524 (14.3%) |
Educational Attainment by Field of Study in Oxford County
Education (2,060 | 19.8%), business (1,339 | 12.9%), science & technology (1,075 | 10.3%), bio, nature & agricultural (742 | 7.1%), and social sciences (742 | 7.1%) are the most common fields of study among 10,400 individuals in Oxford County who have obtained a bachelor's degree or higher.
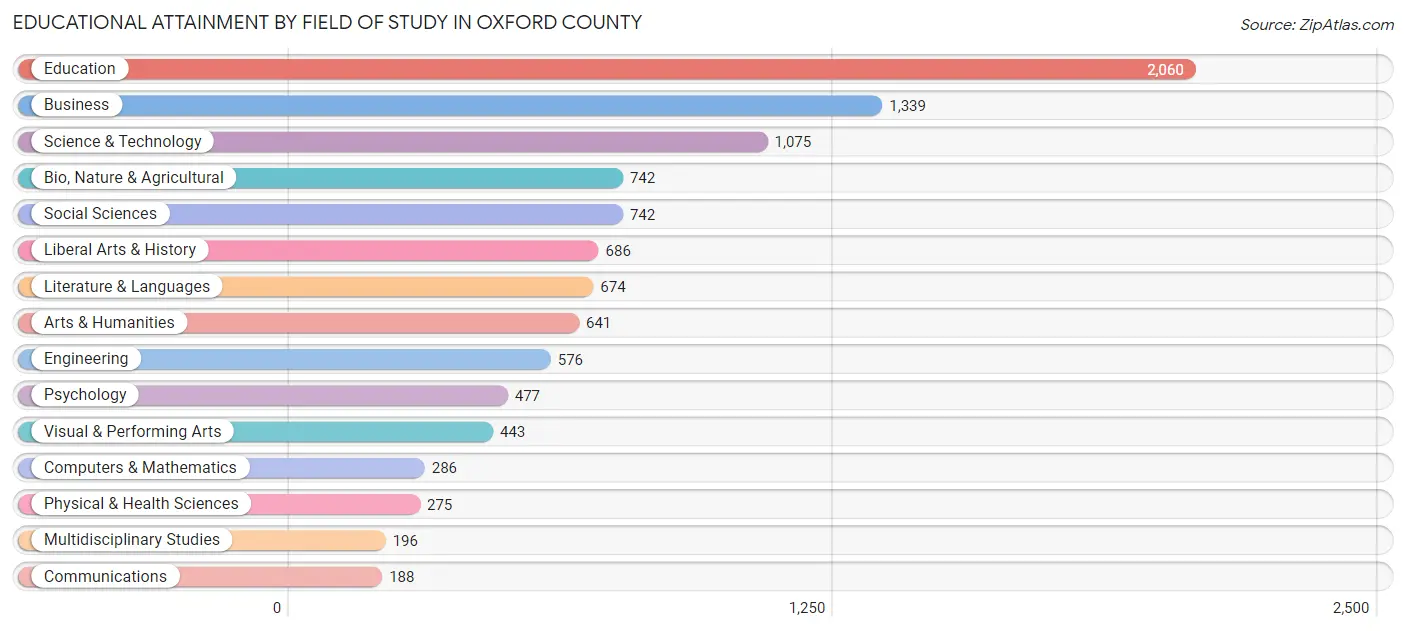
| Field of Study | # Graduates | % Graduates |
| Computers & Mathematics | 286 | 2.8% |
| Bio, Nature & Agricultural | 742 | 7.1% |
| Physical & Health Sciences | 275 | 2.6% |
| Psychology | 477 | 4.6% |
| Social Sciences | 742 | 7.1% |
| Engineering | 576 | 5.5% |
| Multidisciplinary Studies | 196 | 1.9% |
| Science & Technology | 1,075 | 10.3% |
| Business | 1,339 | 12.9% |
| Education | 2,060 | 19.8% |
| Literature & Languages | 674 | 6.5% |
| Liberal Arts & History | 686 | 6.6% |
| Visual & Performing Arts | 443 | 4.3% |
| Communications | 188 | 1.8% |
| Arts & Humanities | 641 | 6.2% |
| Total | 10,400 | 100.0% |
Transportation & Commute in Oxford County
Vehicle Availability by Sex in Oxford County
The most prevalent vehicle ownership categories in Oxford County are males with 2 vehicles (5,527, accounting for 43.1%) and females with 2 vehicles (5,105, making up 43.7%).
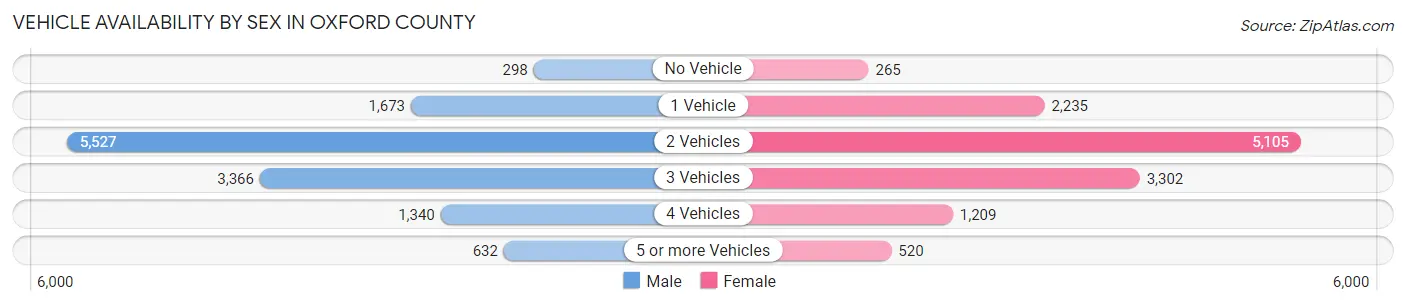
| Vehicles Available | Male | Female |
| No Vehicle | 298 (2.3%) | 265 (2.1%) |
| 1 Vehicle | 1,673 (13.0%) | 2,235 (17.7%) |
| 2 Vehicles | 5,527 (43.1%) | 5,105 (40.4%) |
| 3 Vehicles | 3,366 (26.2%) | 3,302 (26.1%) |
| 4 Vehicles | 1,340 (10.4%) | 1,209 (9.6%) |
| 5 or more Vehicles | 632 (4.9%) | 520 (4.1%) |
| Total | 12,836 (100.0%) | 12,636 (100.0%) |
Commute Time in Oxford County
The most frequently occuring commute durations in Oxford County are 30 to 34 minutes (3,080 commuters, 13.5%), 15 to 19 minutes (2,845 commuters, 12.4%), and 10 to 14 minutes (2,769 commuters, 12.1%).
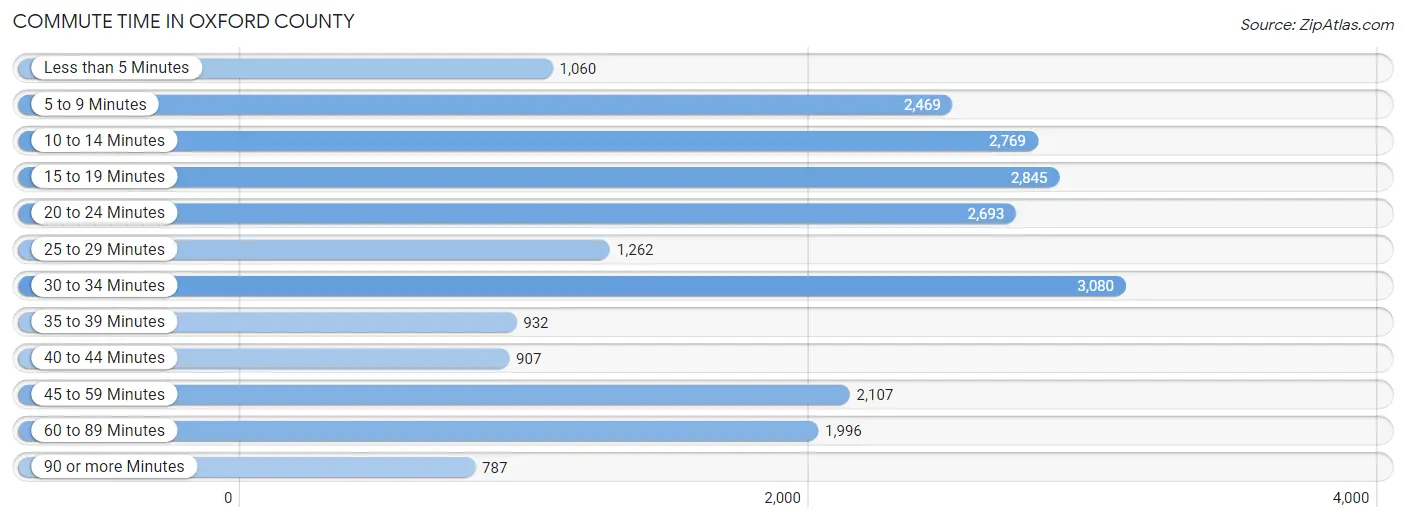
| Commute Time | # Commuters | % Commuters |
| Less than 5 Minutes | 1,060 | 4.6% |
| 5 to 9 Minutes | 2,469 | 10.8% |
| 10 to 14 Minutes | 2,769 | 12.1% |
| 15 to 19 Minutes | 2,845 | 12.4% |
| 20 to 24 Minutes | 2,693 | 11.8% |
| 25 to 29 Minutes | 1,262 | 5.5% |
| 30 to 34 Minutes | 3,080 | 13.5% |
| 35 to 39 Minutes | 932 | 4.1% |
| 40 to 44 Minutes | 907 | 4.0% |
| 45 to 59 Minutes | 2,107 | 9.2% |
| 60 to 89 Minutes | 1,996 | 8.7% |
| 90 or more Minutes | 787 | 3.4% |
Commute Time by Sex in Oxford County
The most common commute times in Oxford County are 10 to 14 minutes (1,513 commuters, 12.9%) for males and 15 to 19 minutes (1,643 commuters, 14.7%) for females.
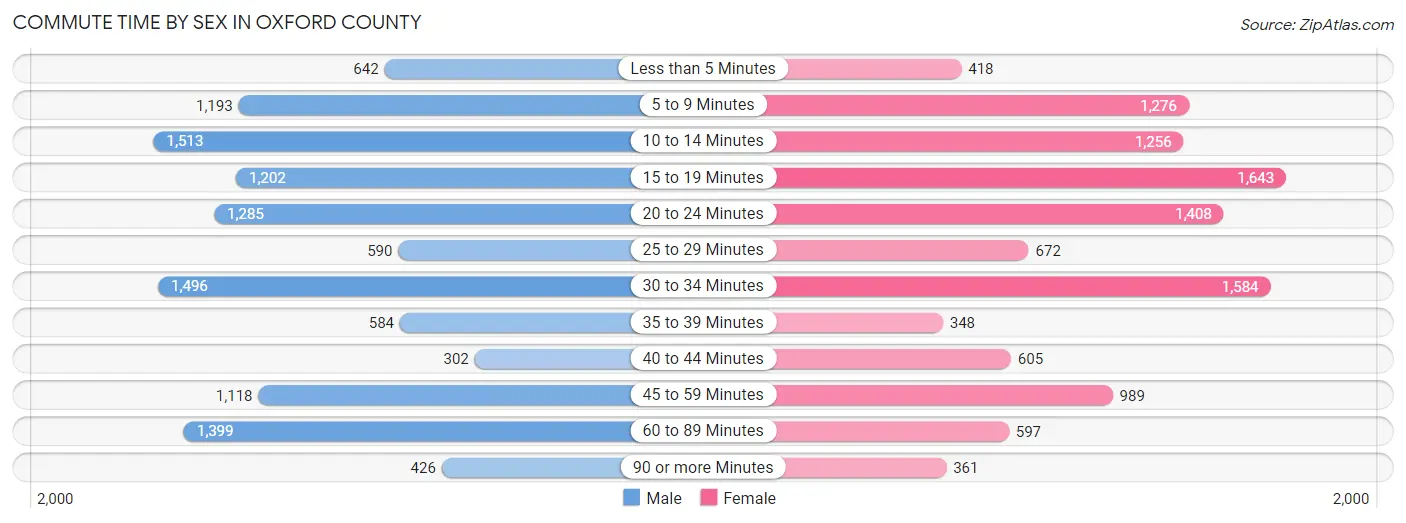
| Commute Time | Male | Female |
| Less than 5 Minutes | 642 (5.5%) | 418 (3.7%) |
| 5 to 9 Minutes | 1,193 (10.2%) | 1,276 (11.4%) |
| 10 to 14 Minutes | 1,513 (12.9%) | 1,256 (11.3%) |
| 15 to 19 Minutes | 1,202 (10.2%) | 1,643 (14.7%) |
| 20 to 24 Minutes | 1,285 (10.9%) | 1,408 (12.6%) |
| 25 to 29 Minutes | 590 (5.0%) | 672 (6.0%) |
| 30 to 34 Minutes | 1,496 (12.7%) | 1,584 (14.2%) |
| 35 to 39 Minutes | 584 (5.0%) | 348 (3.1%) |
| 40 to 44 Minutes | 302 (2.6%) | 605 (5.4%) |
| 45 to 59 Minutes | 1,118 (9.5%) | 989 (8.9%) |
| 60 to 89 Minutes | 1,399 (11.9%) | 597 (5.3%) |
| 90 or more Minutes | 426 (3.6%) | 361 (3.2%) |
Time of Departure to Work by Sex in Oxford County
The most frequent times of departure to work in Oxford County are 12:00 AM to 4:59 AM (1,557, 13.3%) for males and 7:00 AM to 7:29 AM (1,671, 15.0%) for females.
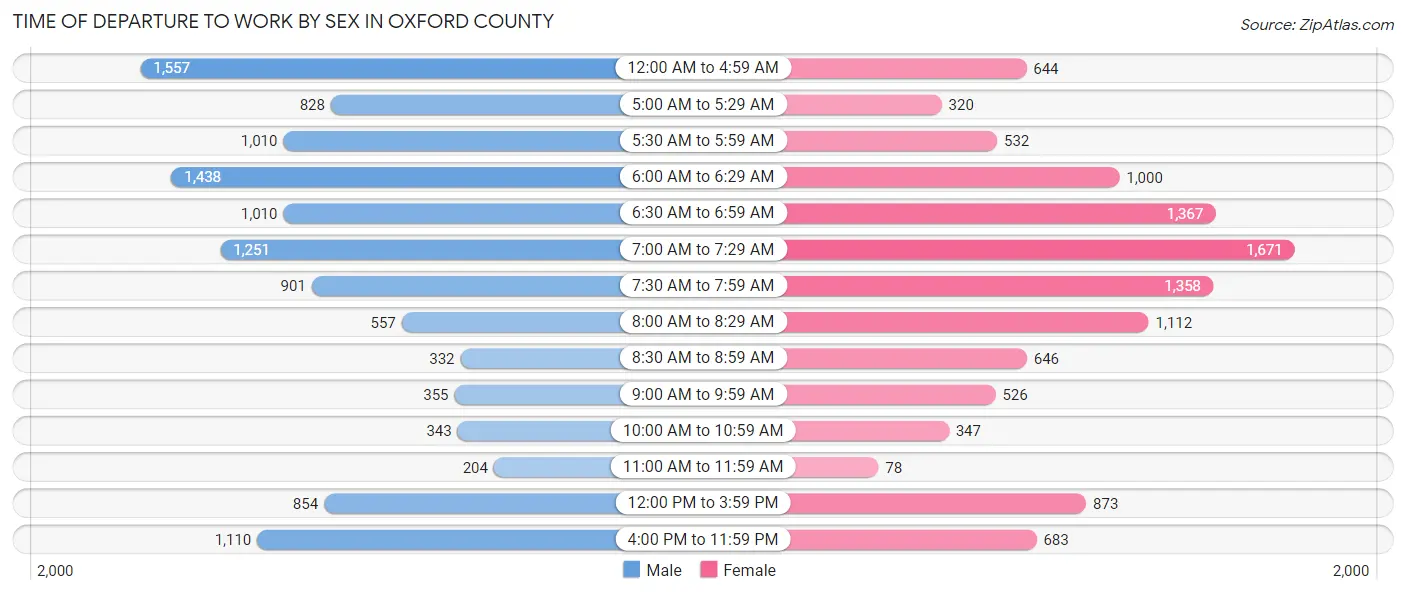
| Time of Departure | Male | Female |
| 12:00 AM to 4:59 AM | 1,557 (13.3%) | 644 (5.8%) |
| 5:00 AM to 5:29 AM | 828 (7.0%) | 320 (2.9%) |
| 5:30 AM to 5:59 AM | 1,010 (8.6%) | 532 (4.8%) |
| 6:00 AM to 6:29 AM | 1,438 (12.2%) | 1,000 (9.0%) |
| 6:30 AM to 6:59 AM | 1,010 (8.6%) | 1,367 (12.2%) |
| 7:00 AM to 7:29 AM | 1,251 (10.6%) | 1,671 (15.0%) |
| 7:30 AM to 7:59 AM | 901 (7.7%) | 1,358 (12.2%) |
| 8:00 AM to 8:29 AM | 557 (4.7%) | 1,112 (10.0%) |
| 8:30 AM to 8:59 AM | 332 (2.8%) | 646 (5.8%) |
| 9:00 AM to 9:59 AM | 355 (3.0%) | 526 (4.7%) |
| 10:00 AM to 10:59 AM | 343 (2.9%) | 347 (3.1%) |
| 11:00 AM to 11:59 AM | 204 (1.7%) | 78 (0.7%) |
| 12:00 PM to 3:59 PM | 854 (7.3%) | 873 (7.8%) |
| 4:00 PM to 11:59 PM | 1,110 (9.5%) | 683 (6.1%) |
| Total | 11,750 (100.0%) | 11,157 (100.0%) |
Housing Occupancy in Oxford County
Occupancy by Ownership in Oxford County
Of the total 23,183 dwellings in Oxford County, owner-occupied units account for 18,627 (80.3%), while renter-occupied units make up 4,556 (19.7%).
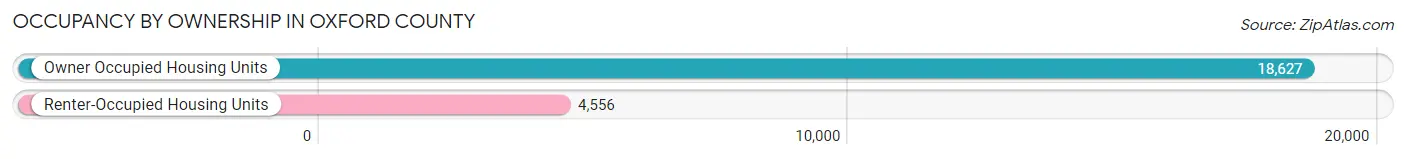
| Occupancy | # Housing Units | % Housing Units |
| Owner Occupied Housing Units | 18,627 | 80.3% |
| Renter-Occupied Housing Units | 4,556 | 19.7% |
| Total Occupied Housing Units | 23,183 | 100.0% |
Occupancy by Household Size in Oxford County
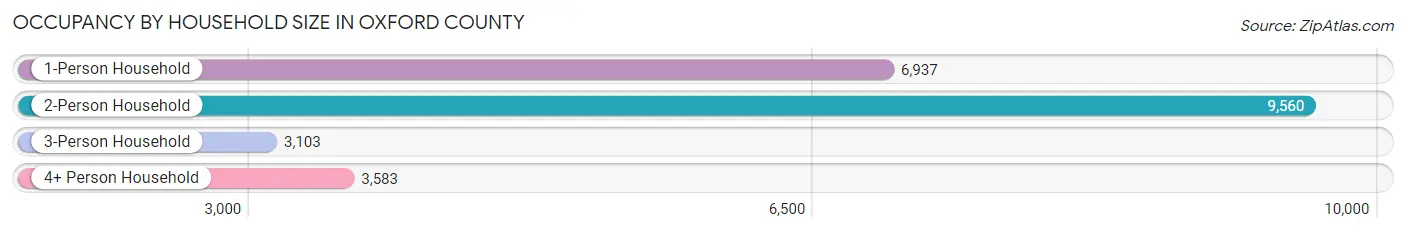
| Household Size | # Housing Units | % Housing Units |
| 1-Person Household | 6,937 | 29.9% |
| 2-Person Household | 9,560 | 41.2% |
| 3-Person Household | 3,103 | 13.4% |
| 4+ Person Household | 3,583 | 15.5% |
| Total Housing Units | 23,183 | 100.0% |
Occupancy by Ownership by Household Size in Oxford County
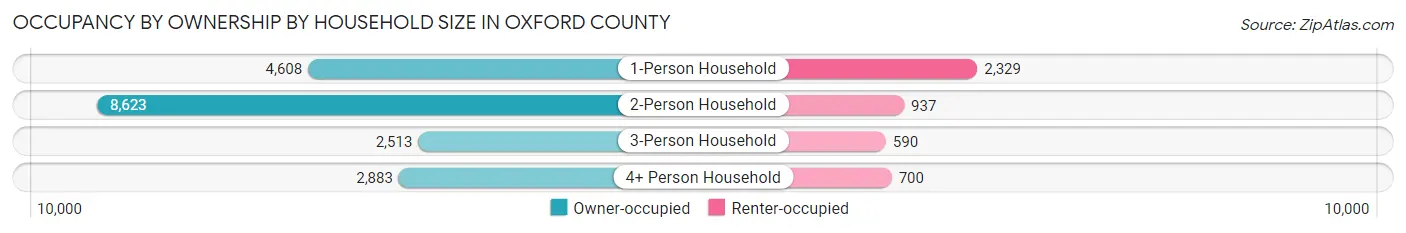
| Household Size | Owner-occupied | Renter-occupied |
| 1-Person Household | 4,608 (66.4%) | 2,329 (33.6%) |
| 2-Person Household | 8,623 (90.2%) | 937 (9.8%) |
| 3-Person Household | 2,513 (81.0%) | 590 (19.0%) |
| 4+ Person Household | 2,883 (80.5%) | 700 (19.5%) |
| Total Housing Units | 18,627 (80.3%) | 4,556 (19.7%) |
Occupancy by Educational Attainment in Oxford County
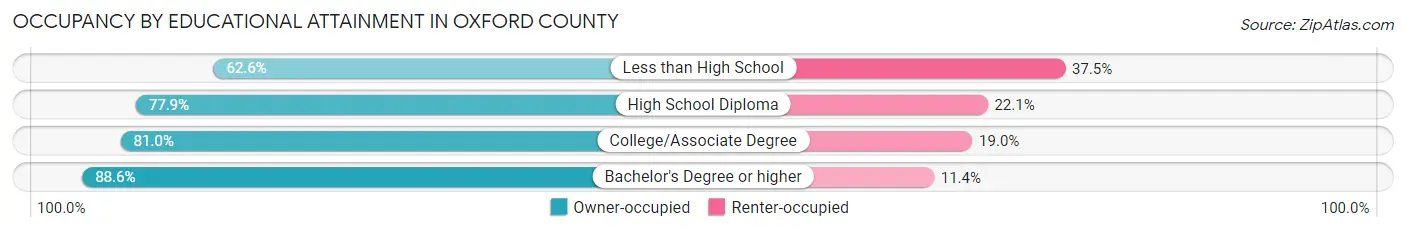
| Household Size | Owner-occupied | Renter-occupied |
| Less than High School | 1,054 (62.5%) | 631 (37.4%) |
| High School Diploma | 6,707 (77.9%) | 1,899 (22.1%) |
| College/Associate Degree | 5,889 (81.0%) | 1,384 (19.0%) |
| Bachelor's Degree or higher | 4,977 (88.6%) | 642 (11.4%) |
Occupancy by Age of Householder in Oxford County
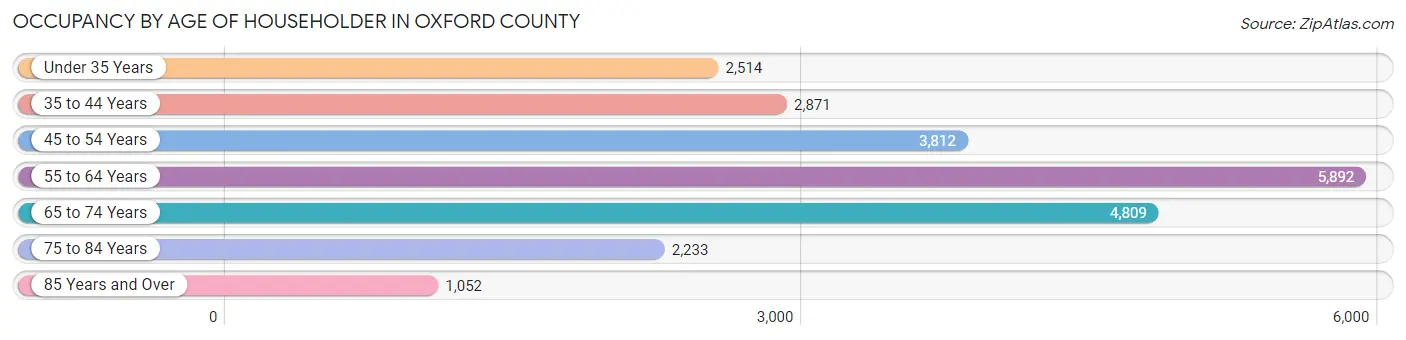
| Age Bracket | # Households | % Households |
| Under 35 Years | 2,514 | 10.8% |
| 35 to 44 Years | 2,871 | 12.4% |
| 45 to 54 Years | 3,812 | 16.4% |
| 55 to 64 Years | 5,892 | 25.4% |
| 65 to 74 Years | 4,809 | 20.7% |
| 75 to 84 Years | 2,233 | 9.6% |
| 85 Years and Over | 1,052 | 4.5% |
| Total | 23,183 | 100.0% |
Housing Finances in Oxford County
Median Income by Occupancy in Oxford County
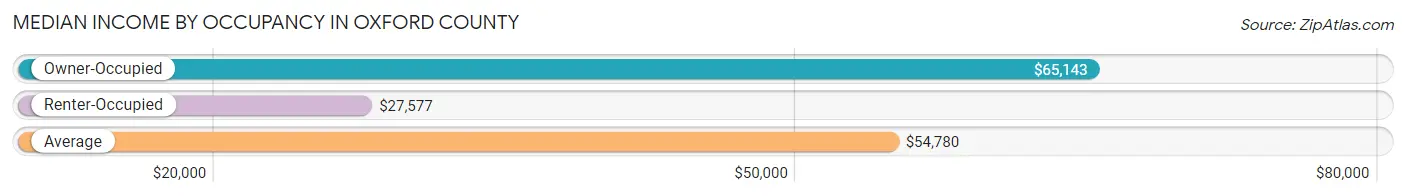
| Occupancy Type | # Households | Median Income |
| Owner-Occupied | 18,627 (80.3%) | $65,143 |
| Renter-Occupied | 4,556 (19.7%) | $27,577 |
| Average | 23,183 (100.0%) | $54,780 |
Occupancy by Householder Income Bracket in Oxford County
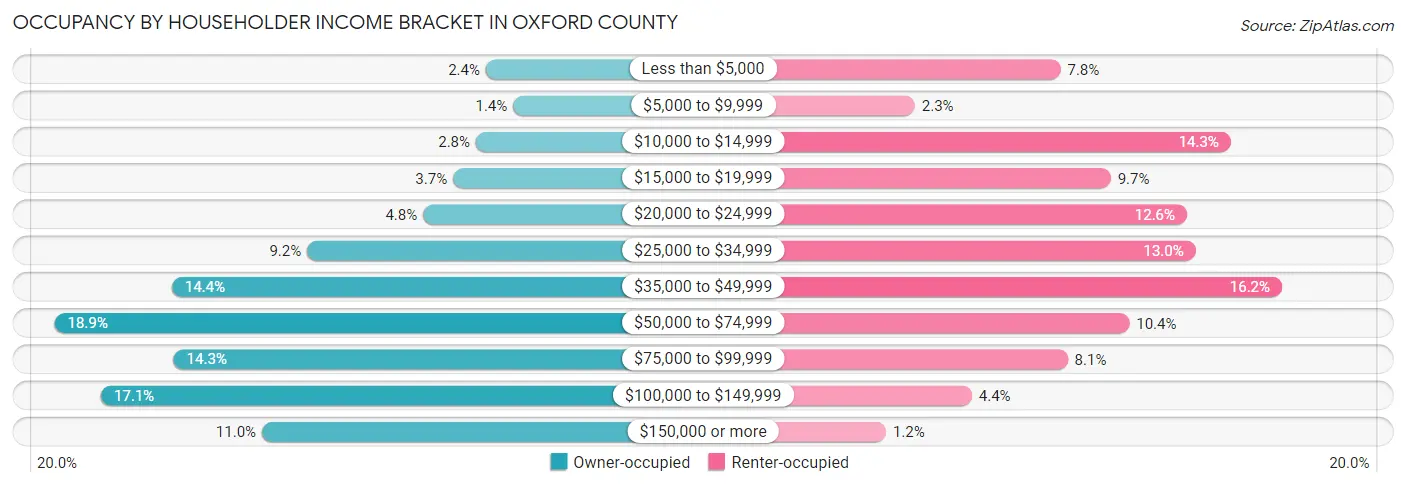
| Income Bracket | Owner-occupied | Renter-occupied |
| Less than $5,000 | 453 (2.4%) | 356 (7.8%) |
| $5,000 to $9,999 | 259 (1.4%) | 103 (2.3%) |
| $10,000 to $14,999 | 523 (2.8%) | 651 (14.3%) |
| $15,000 to $19,999 | 686 (3.7%) | 443 (9.7%) |
| $20,000 to $24,999 | 898 (4.8%) | 575 (12.6%) |
| $25,000 to $34,999 | 1,721 (9.2%) | 590 (13.0%) |
| $35,000 to $49,999 | 2,681 (14.4%) | 740 (16.2%) |
| $50,000 to $74,999 | 3,513 (18.9%) | 475 (10.4%) |
| $75,000 to $99,999 | 2,668 (14.3%) | 368 (8.1%) |
| $100,000 to $149,999 | 3,184 (17.1%) | 202 (4.4%) |
| $150,000 or more | 2,041 (11.0%) | 53 (1.2%) |
| Total | 18,627 (100.0%) | 4,556 (100.0%) |
Monthly Housing Cost Tiers in Oxford County
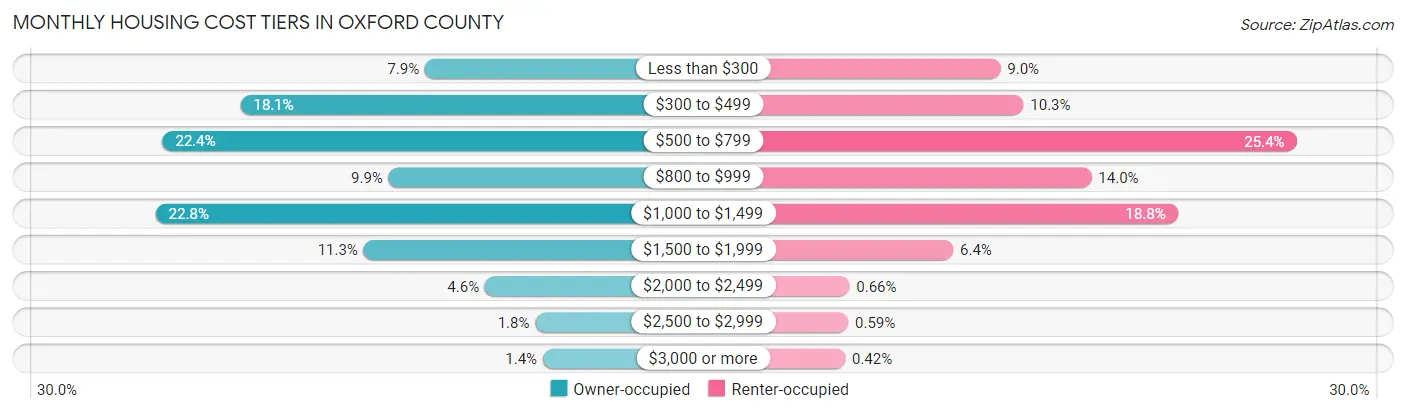
| Monthly Cost | Owner-occupied | Renter-occupied |
| Less than $300 | 1,468 (7.9%) | 410 (9.0%) |
| $300 to $499 | 3,367 (18.1%) | 468 (10.3%) |
| $500 to $799 | 4,171 (22.4%) | 1,155 (25.4%) |
| $800 to $999 | 1,842 (9.9%) | 639 (14.0%) |
| $1,000 to $1,499 | 4,240 (22.8%) | 856 (18.8%) |
| $1,500 to $1,999 | 2,099 (11.3%) | 291 (6.4%) |
| $2,000 to $2,499 | 852 (4.6%) | 30 (0.7%) |
| $2,500 to $2,999 | 333 (1.8%) | 27 (0.6%) |
| $3,000 or more | 255 (1.4%) | 19 (0.4%) |
| Total | 18,627 (100.0%) | 4,556 (100.0%) |
Physical Housing Characteristics in Oxford County
Housing Structures in Oxford County
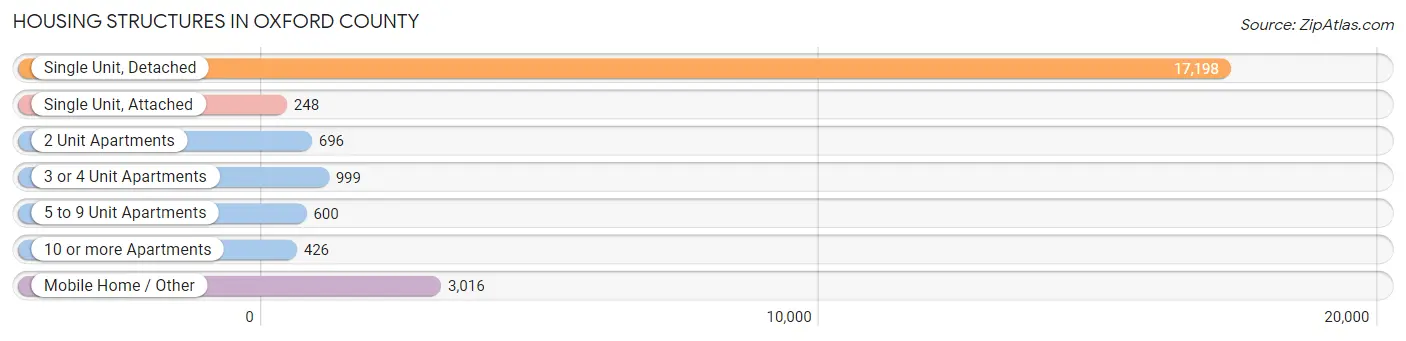
| Structure Type | # Housing Units | % Housing Units |
| Single Unit, Detached | 17,198 | 74.2% |
| Single Unit, Attached | 248 | 1.1% |
| 2 Unit Apartments | 696 | 3.0% |
| 3 or 4 Unit Apartments | 999 | 4.3% |
| 5 to 9 Unit Apartments | 600 | 2.6% |
| 10 or more Apartments | 426 | 1.8% |
| Mobile Home / Other | 3,016 | 13.0% |
| Total | 23,183 | 100.0% |
Housing Structures by Occupancy in Oxford County
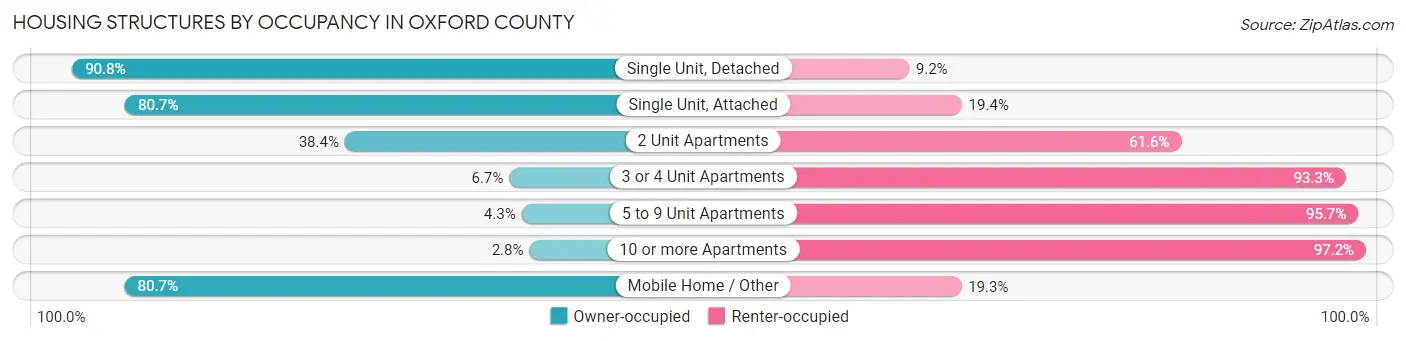
| Structure Type | Owner-occupied | Renter-occupied |
| Single Unit, Detached | 15,620 (90.8%) | 1,578 (9.2%) |
| Single Unit, Attached | 200 (80.6%) | 48 (19.4%) |
| 2 Unit Apartments | 267 (38.4%) | 429 (61.6%) |
| 3 or 4 Unit Apartments | 67 (6.7%) | 932 (93.3%) |
| 5 to 9 Unit Apartments | 26 (4.3%) | 574 (95.7%) |
| 10 or more Apartments | 12 (2.8%) | 414 (97.2%) |
| Mobile Home / Other | 2,435 (80.7%) | 581 (19.3%) |
| Total | 18,627 (80.3%) | 4,556 (19.7%) |
Housing Structures by Number of Rooms in Oxford County
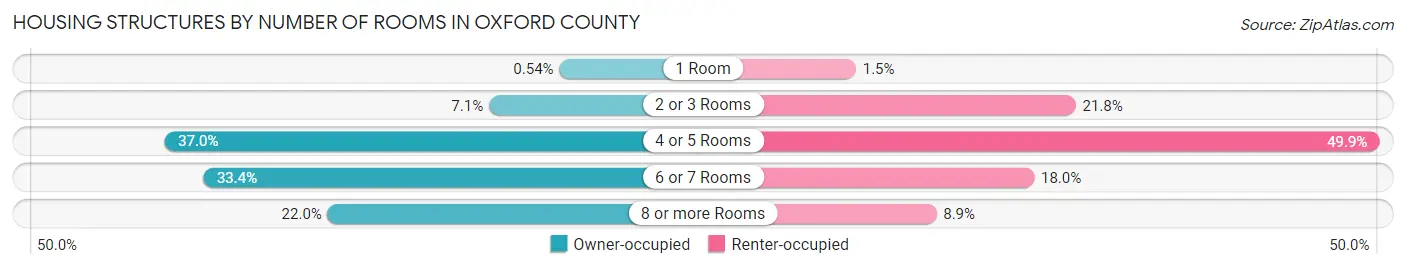
| Number of Rooms | Owner-occupied | Renter-occupied |
| 1 Room | 101 (0.5%) | 67 (1.5%) |
| 2 or 3 Rooms | 1,314 (7.0%) | 993 (21.8%) |
| 4 or 5 Rooms | 6,893 (37.0%) | 2,272 (49.9%) |
| 6 or 7 Rooms | 6,227 (33.4%) | 818 (17.9%) |
| 8 or more Rooms | 4,092 (22.0%) | 406 (8.9%) |
| Total | 18,627 (100.0%) | 4,556 (100.0%) |
Housing Structure by Heating Type in Oxford County
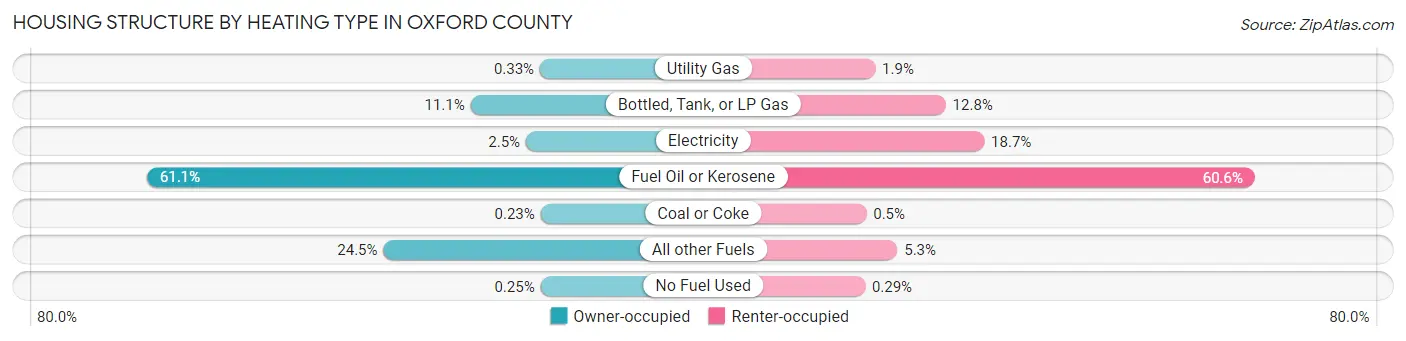
| Heating Type | Owner-occupied | Renter-occupied |
| Utility Gas | 61 (0.3%) | 85 (1.9%) |
| Bottled, Tank, or LP Gas | 2,060 (11.1%) | 582 (12.8%) |
| Electricity | 465 (2.5%) | 853 (18.7%) |
| Fuel Oil or Kerosene | 11,380 (61.1%) | 2,759 (60.6%) |
| Coal or Coke | 43 (0.2%) | 23 (0.5%) |
| All other Fuels | 4,571 (24.5%) | 241 (5.3%) |
| No Fuel Used | 47 (0.3%) | 13 (0.3%) |
| Total | 18,627 (100.0%) | 4,556 (100.0%) |
Household Vehicle Usage in Oxford County
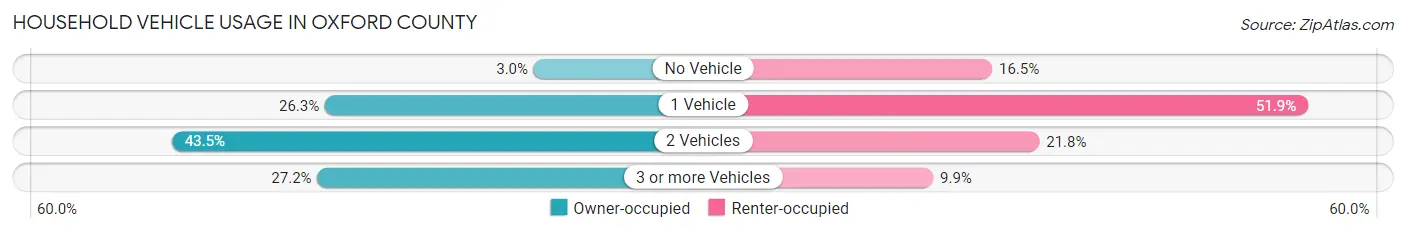
| Vehicles per Household | Owner-occupied | Renter-occupied |
| No Vehicle | 549 (2.9%) | 751 (16.5%) |
| 1 Vehicle | 4,906 (26.3%) | 2,363 (51.9%) |
| 2 Vehicles | 8,106 (43.5%) | 992 (21.8%) |
| 3 or more Vehicles | 5,066 (27.2%) | 450 (9.9%) |
| Total | 18,627 (100.0%) | 4,556 (100.0%) |
Real Estate & Mortgages in Oxford County
Real Estate and Mortgage Overview in Oxford County
| Characteristic | Without Mortgage | With Mortgage |
| Housing Units | 8,968 | 9,659 |
| Median Property Value | $158,600 | $190,900 |
| Median Household Income | $48,805 | $1,215 |
| Monthly Housing Costs | $490 | $199 |
| Real Estate Taxes | $1,861 | $83 |
Property Value by Mortgage Status in Oxford County
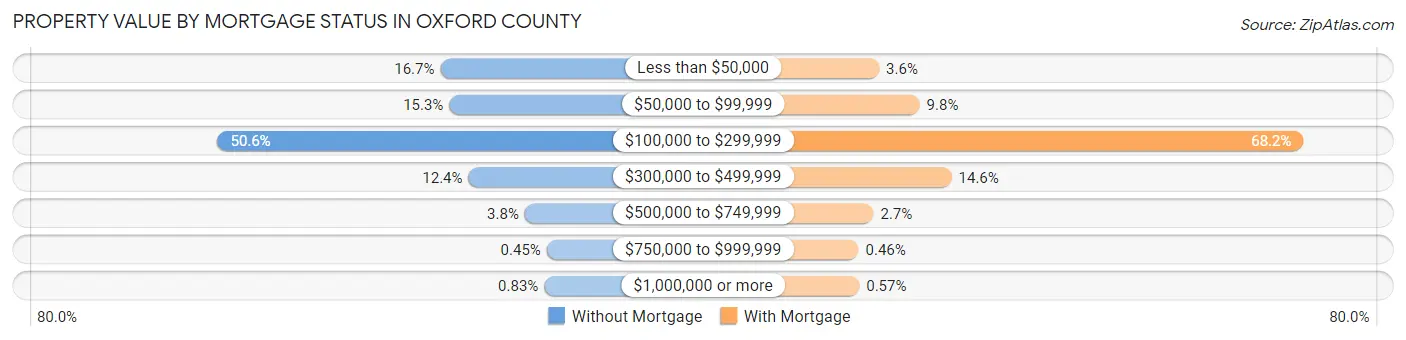
| Property Value | Without Mortgage | With Mortgage |
| Less than $50,000 | 1,493 (16.7%) | 348 (3.6%) |
| $50,000 to $99,999 | 1,372 (15.3%) | 944 (9.8%) |
| $100,000 to $299,999 | 4,539 (50.6%) | 6,589 (68.2%) |
| $300,000 to $499,999 | 1,110 (12.4%) | 1,414 (14.6%) |
| $500,000 to $749,999 | 340 (3.8%) | 265 (2.7%) |
| $750,000 to $999,999 | 40 (0.4%) | 44 (0.5%) |
| $1,000,000 or more | 74 (0.8%) | 55 (0.6%) |
| Total | 8,968 (100.0%) | 9,659 (100.0%) |
Household Income by Mortgage Status in Oxford County
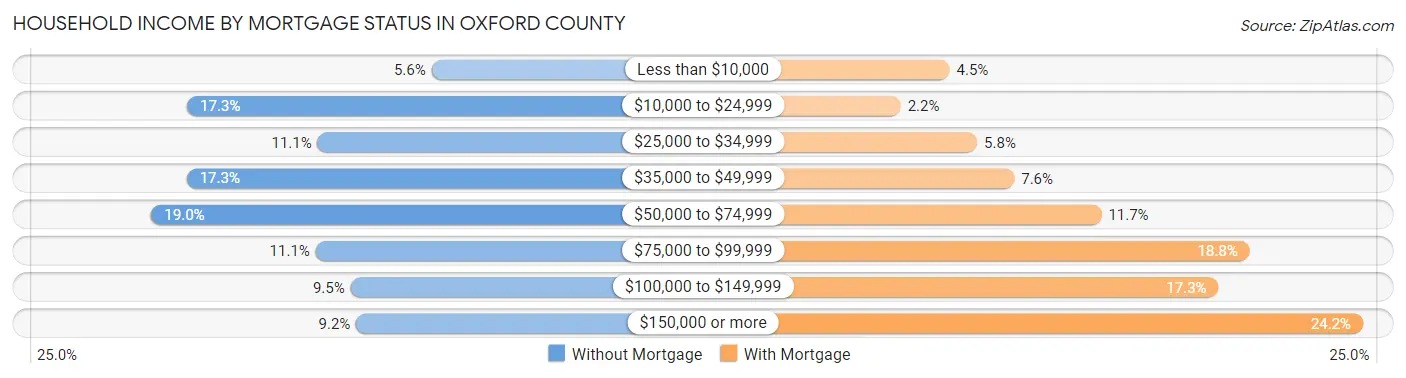
| Household Income | Without Mortgage | With Mortgage |
| Less than $10,000 | 504 (5.6%) | 433 (4.5%) |
| $10,000 to $24,999 | 1,548 (17.3%) | 208 (2.1%) |
| $25,000 to $34,999 | 991 (11.1%) | 559 (5.8%) |
| $35,000 to $49,999 | 1,550 (17.3%) | 730 (7.6%) |
| $50,000 to $74,999 | 1,700 (19.0%) | 1,131 (11.7%) |
| $75,000 to $99,999 | 999 (11.1%) | 1,813 (18.8%) |
| $100,000 to $149,999 | 850 (9.5%) | 1,669 (17.3%) |
| $150,000 or more | 826 (9.2%) | 2,334 (24.2%) |
| Total | 8,968 (100.0%) | 9,659 (100.0%) |
Property Value to Household Income Ratio in Oxford County
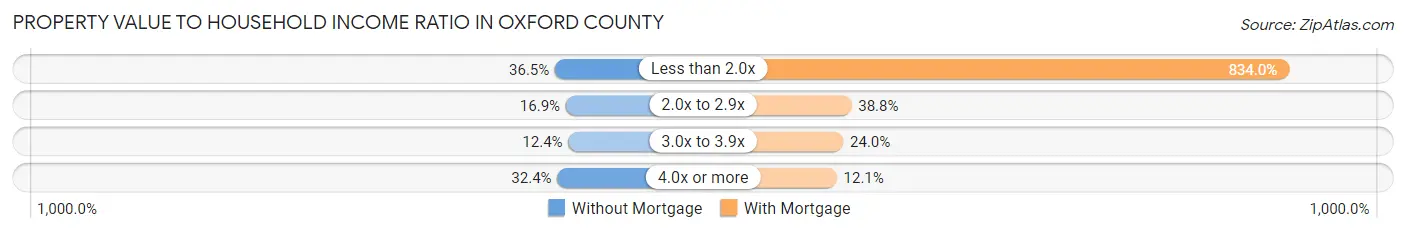
| Value-to-Income Ratio | Without Mortgage | With Mortgage |
| Less than 2.0x | 3,275 (36.5%) | 80,552 (834.0%) |
| 2.0x to 2.9x | 1,519 (16.9%) | 3,747 (38.8%) |
| 3.0x to 3.9x | 1,111 (12.4%) | 2,319 (24.0%) |
| 4.0x or more | 2,901 (32.4%) | 1,172 (12.1%) |
| Total | 8,968 (100.0%) | 9,659 (100.0%) |
Real Estate Taxes by Mortgage Status in Oxford County
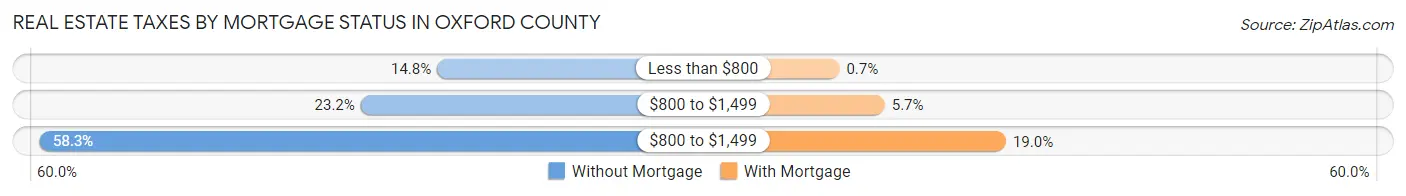
| Property Taxes | Without Mortgage | With Mortgage |
| Less than $800 | 1,327 (14.8%) | 68 (0.7%) |
| $800 to $1,499 | 2,079 (23.2%) | 548 (5.7%) |
| $800 to $1,499 | 5,230 (58.3%) | 1,830 (19.0%) |
| Total | 8,968 (100.0%) | 9,659 (100.0%) |
Health & Disability in Oxford County
Health Insurance Coverage by Age in Oxford County
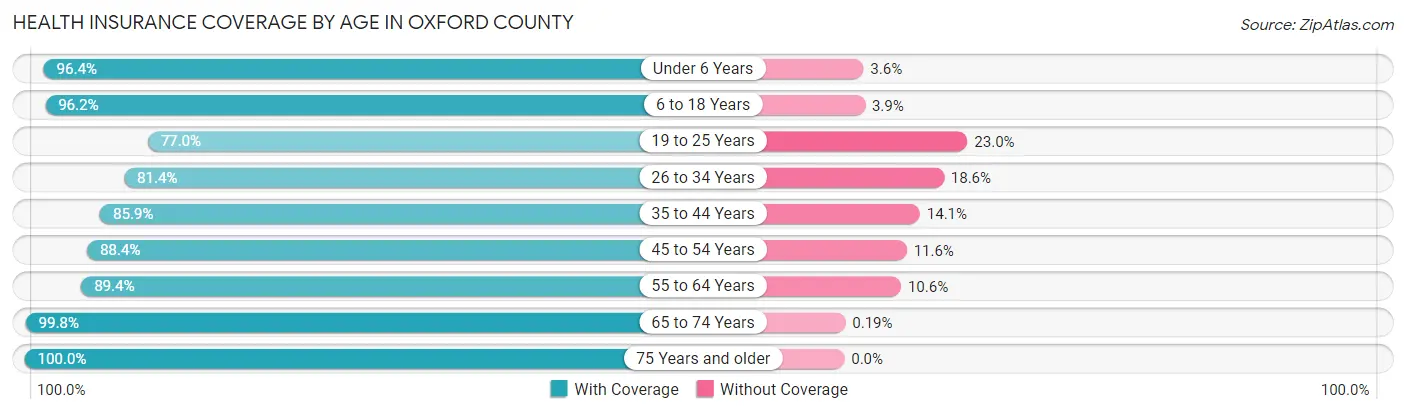
| Age Bracket | With Coverage | Without Coverage |
| Under 6 Years | 2,815 (96.4%) | 104 (3.6%) |
| 6 to 18 Years | 7,798 (96.2%) | 312 (3.8%) |
| 19 to 25 Years | 2,687 (77.0%) | 801 (23.0%) |
| 26 to 34 Years | 4,733 (81.4%) | 1,079 (18.6%) |
| 35 to 44 Years | 5,764 (85.9%) | 945 (14.1%) |
| 45 to 54 Years | 6,637 (88.4%) | 874 (11.6%) |
| 55 to 64 Years | 9,224 (89.4%) | 1,090 (10.6%) |
| 65 to 74 Years | 7,955 (99.8%) | 15 (0.2%) |
| 75 Years and older | 4,900 (100.0%) | 0 (0.0%) |
| Total | 52,513 (91.0%) | 5,220 (9.0%) |
Health Insurance Coverage by Citizenship Status in Oxford County
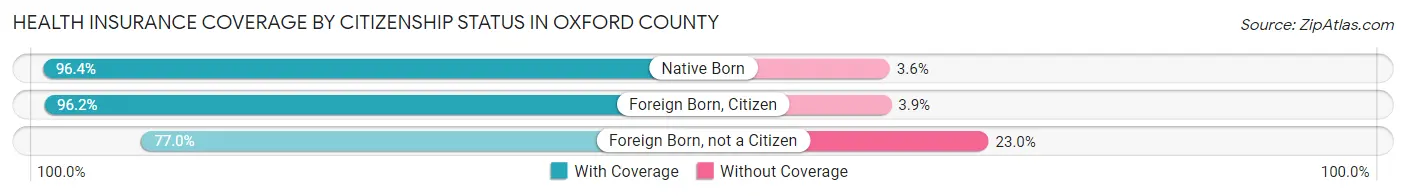
| Citizenship Status | With Coverage | Without Coverage |
| Native Born | 2,815 (96.4%) | 104 (3.6%) |
| Foreign Born, Citizen | 7,798 (96.2%) | 312 (3.8%) |
| Foreign Born, not a Citizen | 2,687 (77.0%) | 801 (23.0%) |
Health Insurance Coverage by Household Income in Oxford County
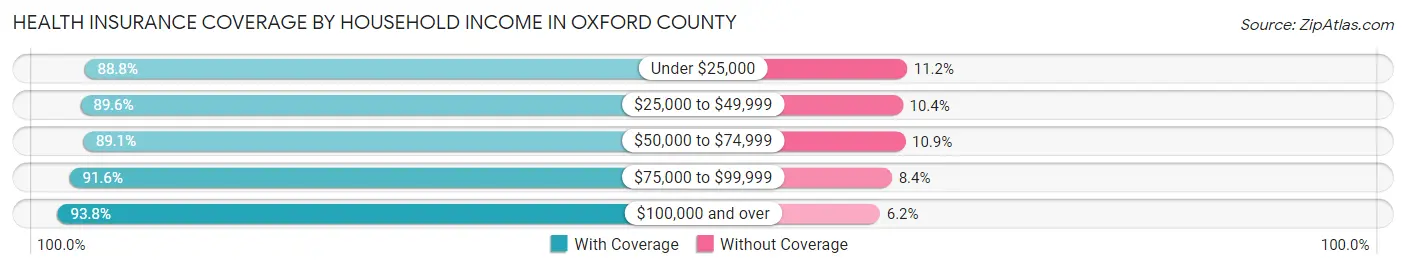
| Household Income | With Coverage | Without Coverage |
| Under $25,000 | 7,264 (88.8%) | 920 (11.2%) |
| $25,000 to $49,999 | 11,281 (89.6%) | 1,315 (10.4%) |
| $50,000 to $74,999 | 9,037 (89.1%) | 1,107 (10.9%) |
| $75,000 to $99,999 | 7,946 (91.6%) | 731 (8.4%) |
| $100,000 and over | 16,787 (93.8%) | 1,106 (6.2%) |
Public vs Private Health Insurance Coverage by Age in Oxford County
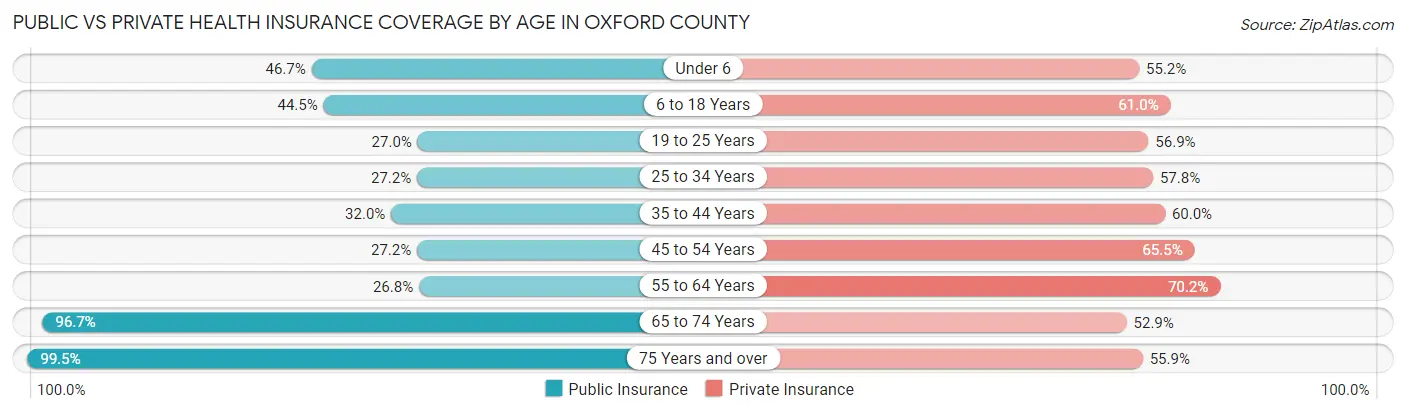
| Age Bracket | Public Insurance | Private Insurance |
| Under 6 | 1,364 (46.7%) | 1,611 (55.2%) |
| 6 to 18 Years | 3,610 (44.5%) | 4,947 (61.0%) |
| 19 to 25 Years | 943 (27.0%) | 1,985 (56.9%) |
| 25 to 34 Years | 1,578 (27.2%) | 3,357 (57.8%) |
| 35 to 44 Years | 2,144 (32.0%) | 4,024 (60.0%) |
| 45 to 54 Years | 2,039 (27.2%) | 4,917 (65.5%) |
| 55 to 64 Years | 2,764 (26.8%) | 7,244 (70.2%) |
| 65 to 74 Years | 7,706 (96.7%) | 4,214 (52.9%) |
| 75 Years and over | 4,875 (99.5%) | 2,737 (55.9%) |
| Total | 27,023 (46.8%) | 35,036 (60.7%) |
Disability Status by Sex by Age in Oxford County
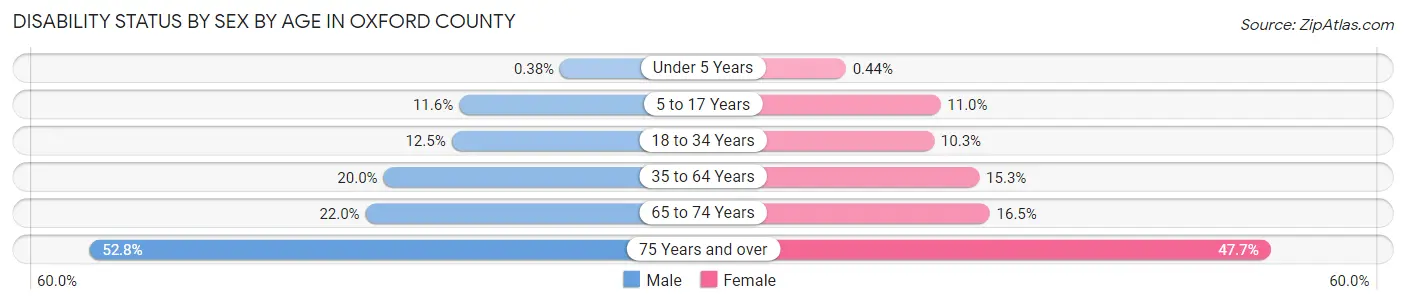
| Age Bracket | Male | Female |
| Under 5 Years | 5 (0.4%) | 5 (0.4%) |
| 5 to 17 Years | 471 (11.6%) | 425 (11.0%) |
| 18 to 34 Years | 624 (12.5%) | 506 (10.3%) |
| 35 to 64 Years | 2,471 (20.0%) | 1,868 (15.3%) |
| 65 to 74 Years | 885 (22.0%) | 651 (16.5%) |
| 75 Years and over | 1,126 (52.8%) | 1,321 (47.7%) |
Disability Class by Sex by Age in Oxford County
Disability Class: Hearing Difficulty
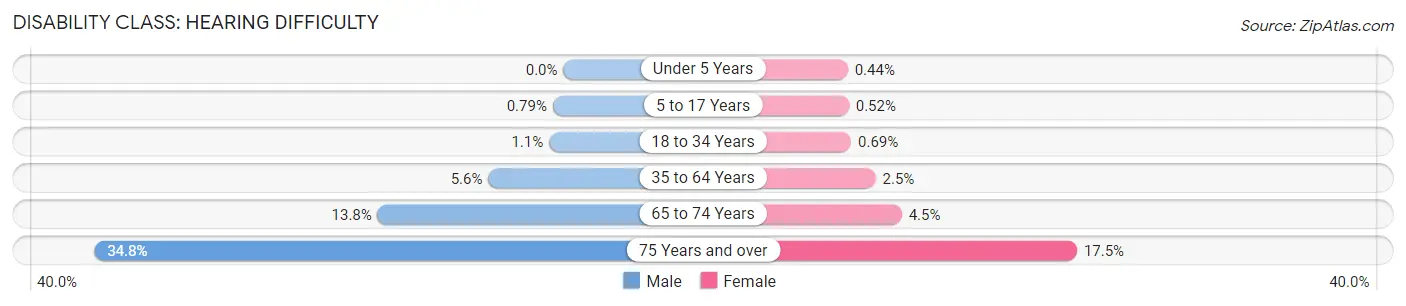
| Age Bracket | Male | Female |
| Under 5 Years | 0 (0.0%) | 5 (0.4%) |
| 5 to 17 Years | 32 (0.8%) | 20 (0.5%) |
| 18 to 34 Years | 53 (1.1%) | 34 (0.7%) |
| 35 to 64 Years | 687 (5.6%) | 306 (2.5%) |
| 65 to 74 Years | 554 (13.8%) | 176 (4.4%) |
| 75 Years and over | 743 (34.8%) | 483 (17.5%) |
Disability Class: Vision Difficulty
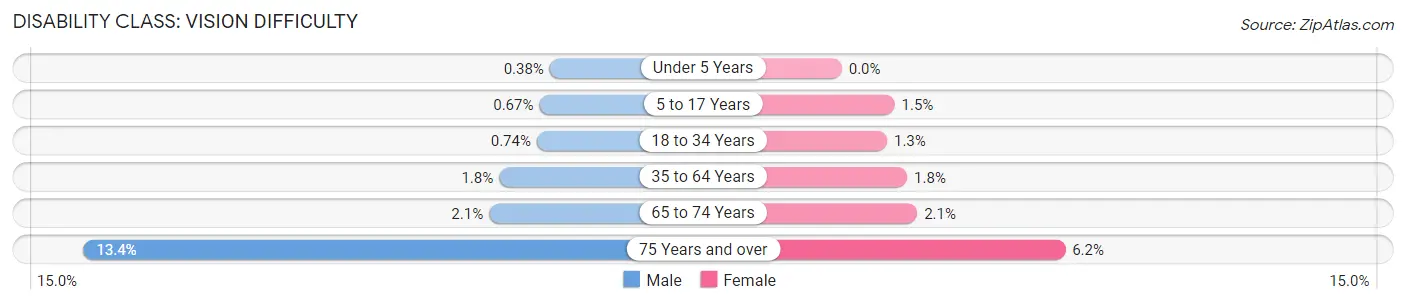
| Age Bracket | Male | Female |
| Under 5 Years | 5 (0.4%) | 0 (0.0%) |
| 5 to 17 Years | 27 (0.7%) | 57 (1.5%) |
| 18 to 34 Years | 37 (0.7%) | 62 (1.3%) |
| 35 to 64 Years | 221 (1.8%) | 222 (1.8%) |
| 65 to 74 Years | 83 (2.1%) | 83 (2.1%) |
| 75 Years and over | 285 (13.4%) | 172 (6.2%) |
Disability Class: Cognitive Difficulty
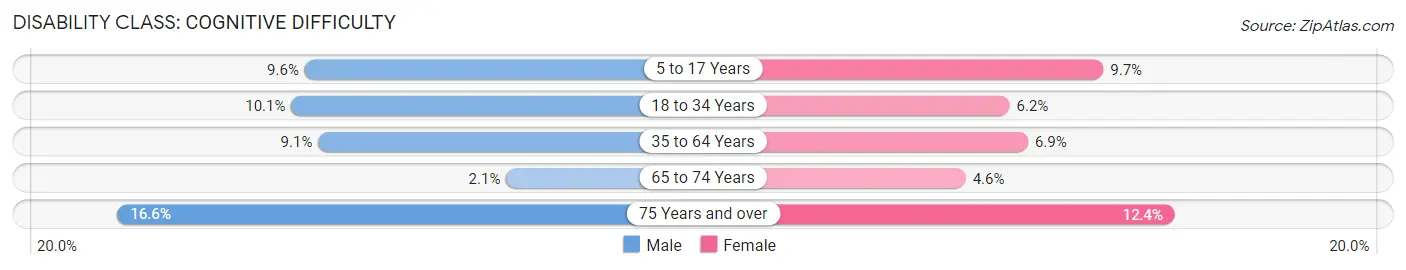
| Age Bracket | Male | Female |
| 5 to 17 Years | 389 (9.6%) | 376 (9.7%) |
| 18 to 34 Years | 506 (10.1%) | 307 (6.2%) |
| 35 to 64 Years | 1,122 (9.1%) | 843 (6.9%) |
| 65 to 74 Years | 85 (2.1%) | 182 (4.6%) |
| 75 Years and over | 353 (16.6%) | 342 (12.4%) |
Disability Class: Ambulatory Difficulty
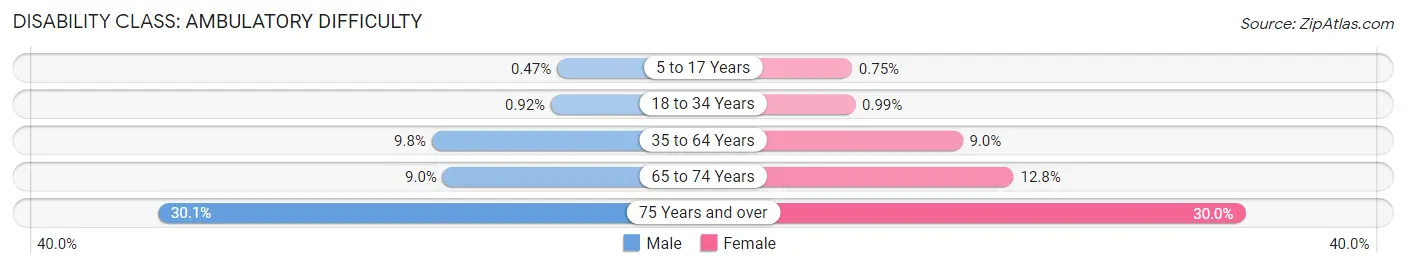
| Age Bracket | Male | Female |
| 5 to 17 Years | 19 (0.5%) | 29 (0.7%) |
| 18 to 34 Years | 46 (0.9%) | 49 (1.0%) |
| 35 to 64 Years | 1,205 (9.8%) | 1,094 (9.0%) |
| 65 to 74 Years | 360 (9.0%) | 504 (12.8%) |
| 75 Years and over | 642 (30.1%) | 829 (30.0%) |
Disability Class: Self-Care Difficulty
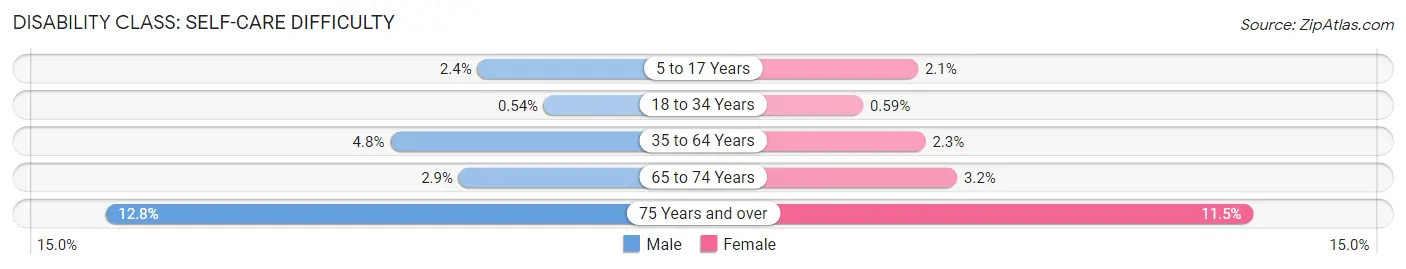
| Age Bracket | Male | Female |
| 5 to 17 Years | 97 (2.4%) | 82 (2.1%) |
| 18 to 34 Years | 27 (0.5%) | 29 (0.6%) |
| 35 to 64 Years | 594 (4.8%) | 285 (2.3%) |
| 65 to 74 Years | 117 (2.9%) | 127 (3.2%) |
| 75 Years and over | 272 (12.8%) | 317 (11.5%) |
Technology Access in Oxford County
Computing Device Access in Oxford County
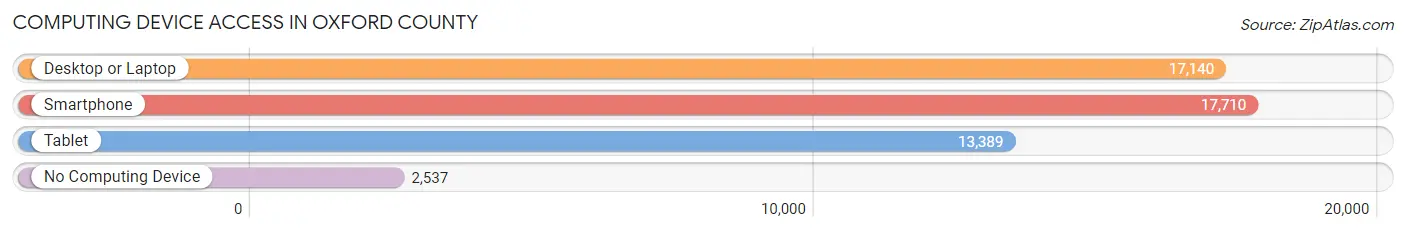
| Device Type | # Households | % Households |
| Desktop or Laptop | 17,140 | 73.9% |
| Smartphone | 17,710 | 76.4% |
| Tablet | 13,389 | 57.8% |
| No Computing Device | 2,537 | 10.9% |
| Total | 23,183 | 100.0% |
Internet Access in Oxford County
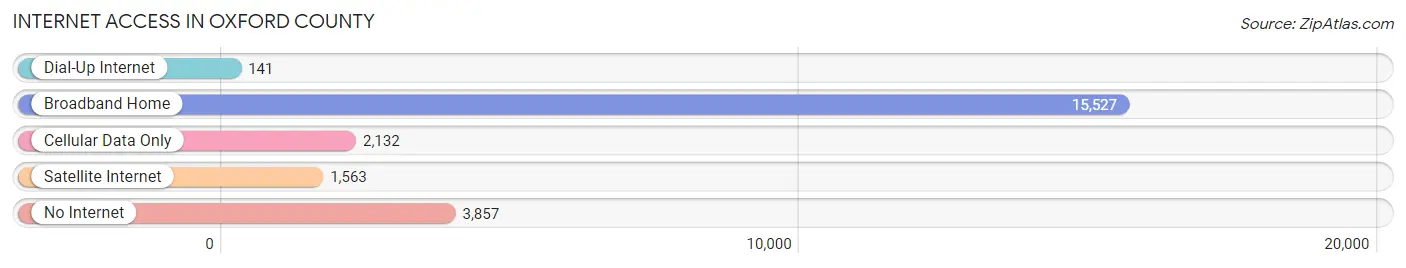
| Internet Type | # Households | % Households |
| Dial-Up Internet | 141 | 0.6% |
| Broadband Home | 15,527 | 67.0% |
| Cellular Data Only | 2,132 | 9.2% |
| Satellite Internet | 1,563 | 6.7% |
| No Internet | 3,857 | 16.6% |
| Total | 23,183 | 100.0% |
Oxford County Summary
Oxford County is located in the state of Maine, in the United States of America. It is the second-largest county in the state, with an area of 2,717 square miles. The county seat is the town of Paris. As of the 2010 census, the population of Oxford County was 57,833.
Geography
Oxford County is located in the western part of Maine, bordered by the states of New Hampshire to the west and Massachusetts to the south. The county is mostly rural, with a few small towns and villages scattered throughout. The terrain is mostly hilly and forested, with the highest point being the summit of Mount Blue, at an elevation of 2,664 feet. The Androscoggin River runs through the county, and there are several lakes and ponds, including Kezar Lake, Thompson Lake, and Flagstaff Lake.
Economy
Oxford County is largely rural and agricultural, with a few small towns and villages scattered throughout. The main industries in the county are tourism, forestry, and agriculture. Tourism is a major source of income for the county, with visitors coming to enjoy the area's natural beauty and outdoor activities. The county is also home to several ski resorts, including Sunday River and Black Mountain.
Agriculture is also an important part of the economy, with dairy farming being the main activity. Other agricultural products include potatoes, apples, and hay. Forestry is also an important industry, with the county being home to several large paper mills.
Demographics
As of the 2010 census, the population of Oxford County was 57,833. The population is mostly white (96.2%), with small percentages of African Americans (1.2%), Native Americans (0.5%), Asians (0.4%), and other races (1.7%). The median household income in the county is $45,845, and the median age is 43.7 years.
The largest cities in the county are Norway (population 5,945), Rumford (population 4,845), and Mexico (population 3,845). The county is also home to several small towns and villages, including Bethel, Fryeburg, and Oxford.
Conclusion
Oxford County is a rural county located in the western part of Maine. It is mostly hilly and forested, with a few small towns and villages scattered throughout. The main industries in the county are tourism, forestry, and agriculture. The population of the county is mostly white, with a median household income of $45,845 and a median age of 43.7 years. The largest cities in the county are Norway, Rumford, and Mexico.
Common Questions
What is Per Capita Income in Oxford County?
Per Capita income in Oxford County is $30,884.
What is the Median Family Income in Oxford County?
Median Family Income in Oxford County is $69,412.
What is the Median Household income in Oxford County?
Median Household Income in Oxford County is $54,780.
What is Income or Wage Gap in Oxford County?
Income or Wage Gap in Oxford County is 22.0%.
Women in Oxford County earn 78.0 cents for every dollar earned by a man.
What is Family Income Deficit in Oxford County?
Family Income Deficit in Oxford County is $9,510.
Families that are below poverty line in Oxford County earn $9,510 less on average than the poverty threshold level.
What is Inequality or Gini Index in Oxford County?
Inequality or Gini Index in Oxford County is 0.44.
What is the Total Population of Oxford County?
Total Population of Oxford County is 58,276.
What is the Total Male Population of Oxford County?
Total Male Population of Oxford County is 29,200.
What is the Total Female Population of Oxford County?
Total Female Population of Oxford County is 29,076.
What is the Ratio of Males per 100 Females in Oxford County?
There are 100.43 Males per 100 Females in Oxford County.
What is the Ratio of Females per 100 Males in Oxford County?
There are 99.58 Females per 100 Males in Oxford County.
What is the Median Population Age in Oxford County?
Median Population Age in Oxford County is 48.2 Years.
What is the Average Family Size in Oxford County
Average Family Size in Oxford County is 3.0 People.
What is the Average Household Size in Oxford County
Average Household Size in Oxford County is 2.5 People.
How Large is the Labor Force in Oxford County?
There are 27,648 People in the Labor Forcein in Oxford County.
What is the Percentage of People in the Labor Force in Oxford County?
56.1% of People are in the Labor Force in Oxford County.
What is the Unemployment Rate in Oxford County?
Unemployment Rate in Oxford County is 5.5%.