York County, ME Map & Demographics
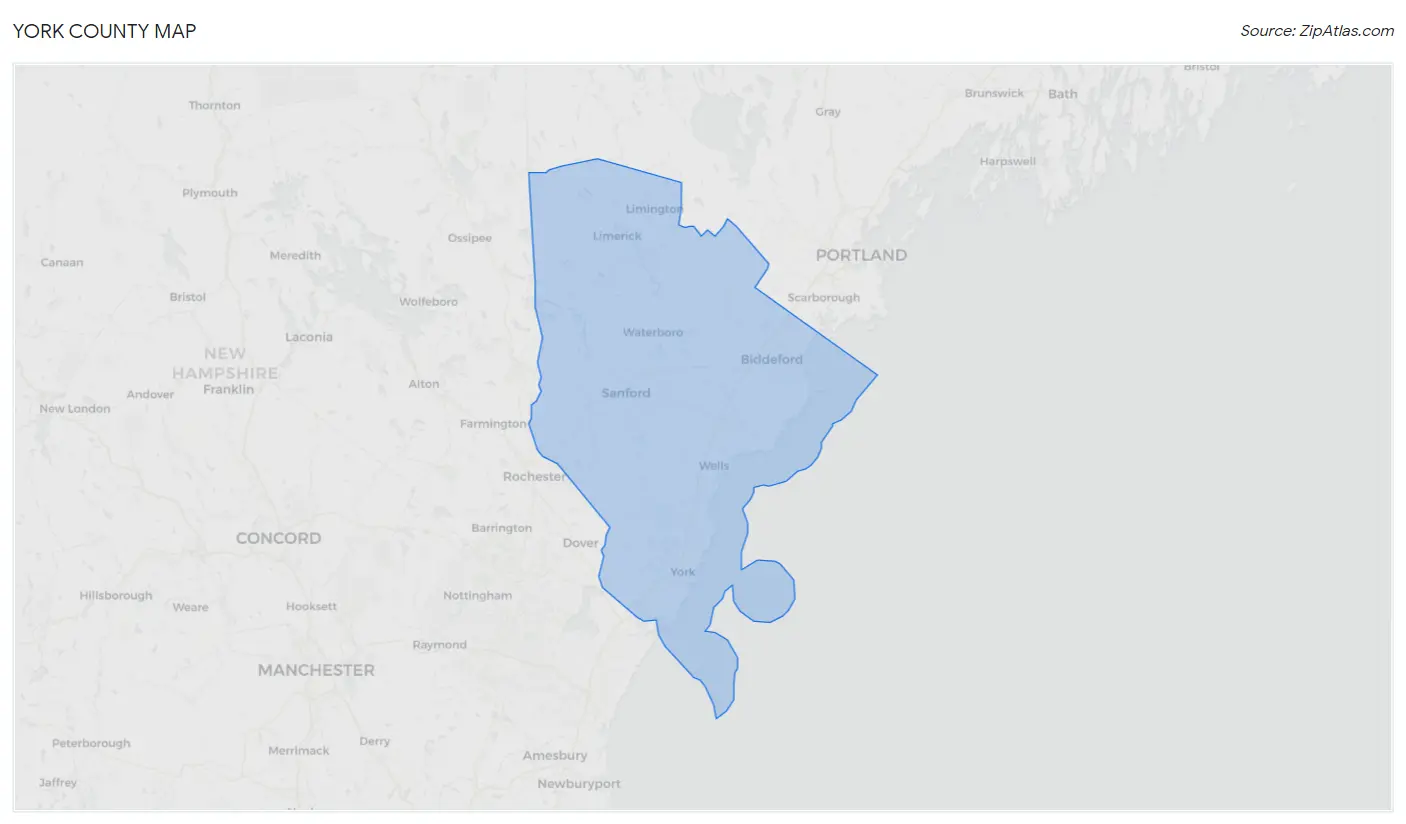
York County Map
York County Overview
$42,053
PER CAPITA INCOME
$99,041
AVG FAMILY INCOME
$79,743
AVG HOUSEHOLD INCOME
31.4%
WAGE / INCOME GAP [ % ]
68.6¢/ $1
WAGE / INCOME GAP [ $ ]
$9,090
FAMILY INCOME DEFICIT
0.42
INEQUALITY / GINI INDEX
212,691
TOTAL POPULATION
104,642
MALE POPULATION
108,049
FEMALE POPULATION
96.85
MALES / 100 FEMALES
103.26
FEMALES / 100 MALES
45.2
MEDIAN AGE
2.9
AVG FAMILY SIZE
2.3
AVG HOUSEHOLD SIZE
117,318
LABOR FORCE [ PEOPLE ]
65.7%
PERCENT IN LABOR FORCE
3.4%
UNEMPLOYMENT RATE
York County Area Codes
Income in York County
Income Overview in York County
Per Capita Income in York County is $42,053, while median incomes of families and households are $99,041 and $79,743 respectively.
| Characteristic | Number | Measure |
| Per Capita Income | 212,691 | $42,053 |
| Median Family Income | 56,665 | $99,041 |
| Mean Family Income | 56,665 | $116,705 |
| Median Household Income | 89,404 | $79,743 |
| Mean Household Income | 89,404 | $98,768 |
| Income Deficit | 56,665 | $9,090 |
| Wage / Income Gap (%) | 212,691 | 31.38% |
| Wage / Income Gap ($) | 212,691 | 68.62¢ per $1 |
| Gini / Inequality Index | 212,691 | 0.42 |
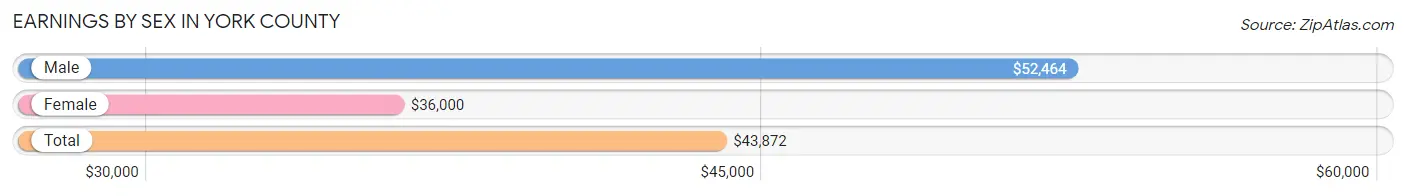
Earnings by Sex in York County
Average Earnings in York County are $43,872, $52,464 for men and $36,000 for women, a difference of 31.4%.
| Sex | Number | Average Earnings |
| Male | 64,207 (51.7%) | $52,464 |
| Female | 59,858 (48.2%) | $36,000 |
| Total | 124,065 (100.0%) | $43,872 |
Earnings by Sex by Income Bracket in York County
The most common earnings brackets in York County are $100,000+ for men (11,221 | 17.5%) and $75,000 to $99,999 for women (5,446 | 9.1%).
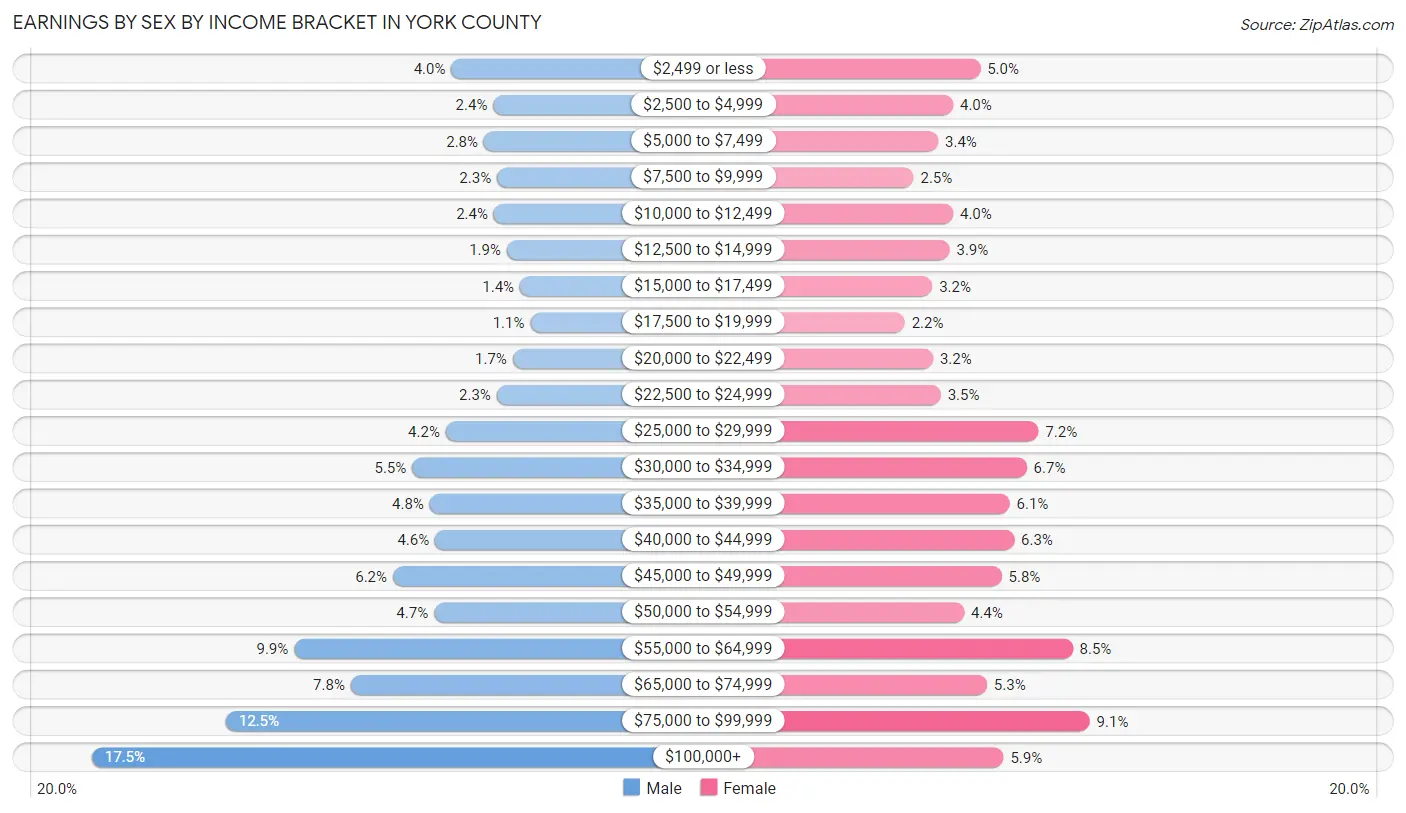
| Income | Male | Female |
| $2,499 or less | 2,577 (4.0%) | 2,991 (5.0%) |
| $2,500 to $4,999 | 1,568 (2.4%) | 2,385 (4.0%) |
| $5,000 to $7,499 | 1,790 (2.8%) | 2,049 (3.4%) |
| $7,500 to $9,999 | 1,474 (2.3%) | 1,497 (2.5%) |
| $10,000 to $12,499 | 1,553 (2.4%) | 2,381 (4.0%) |
| $12,500 to $14,999 | 1,240 (1.9%) | 2,303 (3.8%) |
| $15,000 to $17,499 | 925 (1.4%) | 1,913 (3.2%) |
| $17,500 to $19,999 | 671 (1.1%) | 1,299 (2.2%) |
| $20,000 to $22,499 | 1,097 (1.7%) | 1,935 (3.2%) |
| $22,500 to $24,999 | 1,486 (2.3%) | 2,109 (3.5%) |
| $25,000 to $29,999 | 2,707 (4.2%) | 4,295 (7.2%) |
| $30,000 to $34,999 | 3,517 (5.5%) | 4,033 (6.7%) |
| $35,000 to $39,999 | 3,097 (4.8%) | 3,652 (6.1%) |
| $40,000 to $44,999 | 2,966 (4.6%) | 3,754 (6.3%) |
| $45,000 to $49,999 | 3,978 (6.2%) | 3,471 (5.8%) |
| $50,000 to $54,999 | 2,989 (4.7%) | 2,626 (4.4%) |
| $55,000 to $64,999 | 6,359 (9.9%) | 5,064 (8.5%) |
| $65,000 to $74,999 | 4,994 (7.8%) | 3,143 (5.2%) |
| $75,000 to $99,999 | 7,998 (12.5%) | 5,446 (9.1%) |
| $100,000+ | 11,221 (17.5%) | 3,512 (5.9%) |
| Total | 64,207 (100.0%) | 59,858 (100.0%) |
Earnings by Sex by Educational Attainment in York County
Average earnings in York County are $58,392 for men and $40,558 for women, a difference of 30.5%. Men with an educational attainment of graduate degree enjoy the highest average annual earnings of $91,692, while those with less than high school education earn the least with $45,492. Women with an educational attainment of graduate degree earn the most with the average annual earnings of $56,469, while those with less than high school education have the smallest earnings of $29,393.
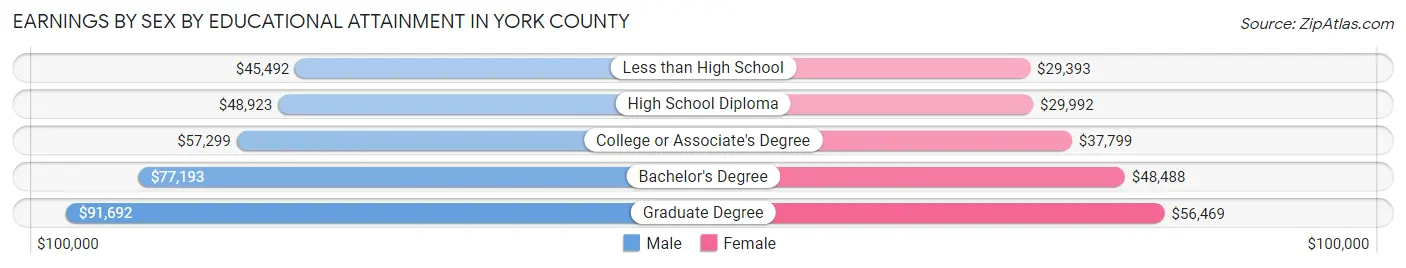
| Educational Attainment | Male Income | Female Income |
| Less than High School | $45,492 | $29,393 |
| High School Diploma | $48,923 | $29,992 |
| College or Associate's Degree | $57,299 | $37,799 |
| Bachelor's Degree | $77,193 | $48,488 |
| Graduate Degree | $91,692 | $56,469 |
| Total | $58,392 | $40,558 |
Family Income in York County
Family Income Brackets in York County
According to the York County family income data, there are 14,280 families falling into the $100,000 to $149,999 income range, which is the most common income bracket and makes up 25.2% of all families. Conversely, the $10,000 to $14,999 income bracket is the least frequent group with only 453 families (0.8%) belonging to this category.
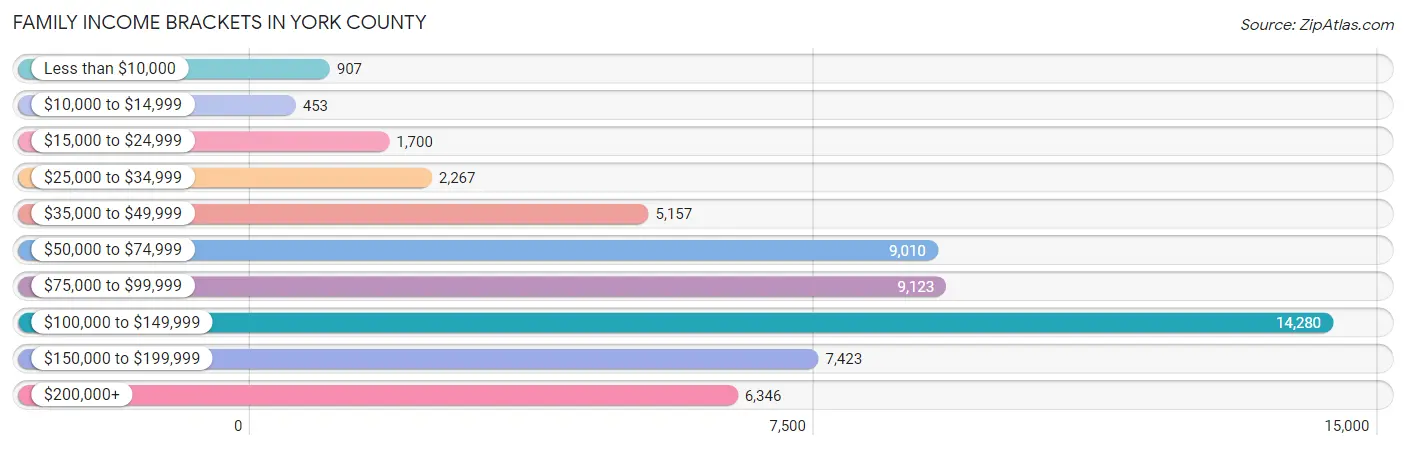
| Income Bracket | # Families | % Families |
| Less than $10,000 | 907 | 1.6% |
| $10,000 to $14,999 | 453 | 0.8% |
| $15,000 to $24,999 | 1,700 | 3.0% |
| $25,000 to $34,999 | 2,267 | 4.0% |
| $35,000 to $49,999 | 5,157 | 9.1% |
| $50,000 to $74,999 | 9,010 | 15.9% |
| $75,000 to $99,999 | 9,123 | 16.1% |
| $100,000 to $149,999 | 14,280 | 25.2% |
| $150,000 to $199,999 | 7,423 | 13.1% |
| $200,000+ | 6,346 | 11.2% |
Family Income by Famaliy Size in York County
7+ person families (346 | 0.6%) account for the highest median family income in York County with $142,083 per family, while 2-person families (29,956 | 52.9%) have the highest median income of $41,132 per family member.
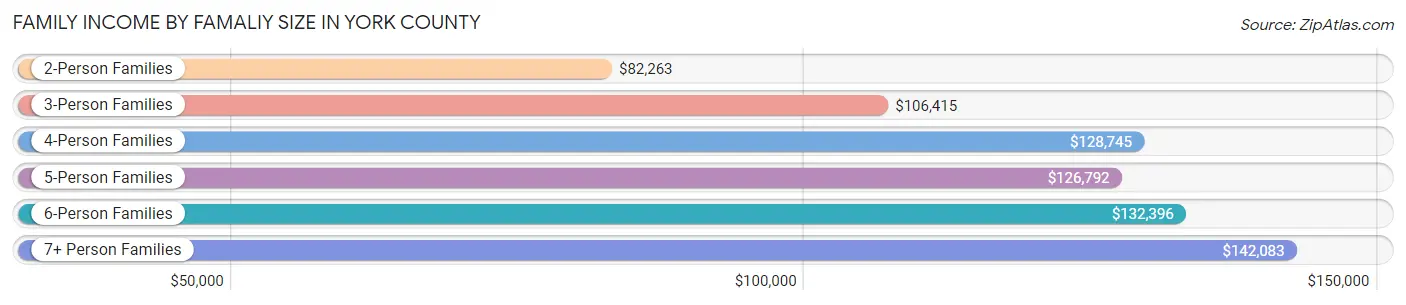
| Income Bracket | # Families | Median Income |
| 2-Person Families | 29,956 (52.9%) | $82,263 |
| 3-Person Families | 12,043 (21.2%) | $106,415 |
| 4-Person Families | 9,814 (17.3%) | $128,745 |
| 5-Person Families | 3,250 (5.7%) | $126,792 |
| 6-Person Families | 1,256 (2.2%) | $132,396 |
| 7+ Person Families | 346 (0.6%) | $142,083 |
| Total | 56,665 (100.0%) | $99,041 |
Family Income by Number of Earners in York County
The median family income in York County is $99,041, with families comprising 3+ earners (7,679) having the highest median family income of $156,378, while families with no earners (8,886) have the lowest median family income of $55,110, accounting for 13.6% and 15.7% of families, respectively.
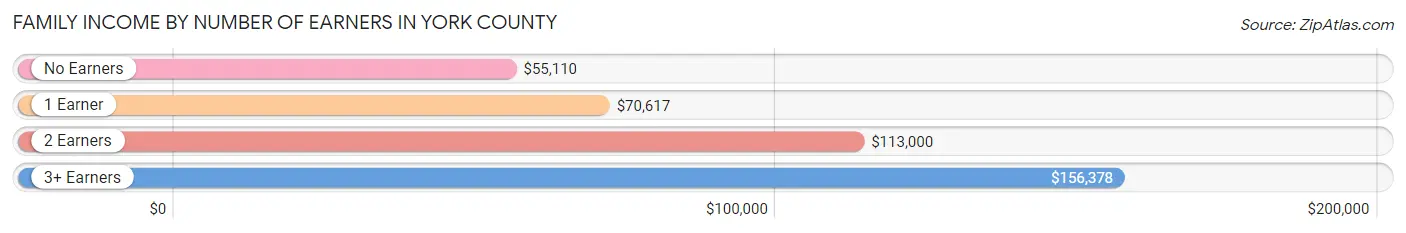
| Number of Earners | # Families | Median Income |
| No Earners | 8,886 (15.7%) | $55,110 |
| 1 Earner | 15,077 (26.6%) | $70,617 |
| 2 Earners | 25,023 (44.2%) | $113,000 |
| 3+ Earners | 7,679 (13.6%) | $156,378 |
| Total | 56,665 (100.0%) | $99,041 |
Household Income in York County
Household Income Brackets in York County
With 18,417 households falling in the category, the $100,000 to $149,999 income range is the most frequent in York County, accounting for 20.6% of all households. In contrast, only 2,503 households (2.8%) fall into the $10,000 to $14,999 income bracket, making it the least populous group.
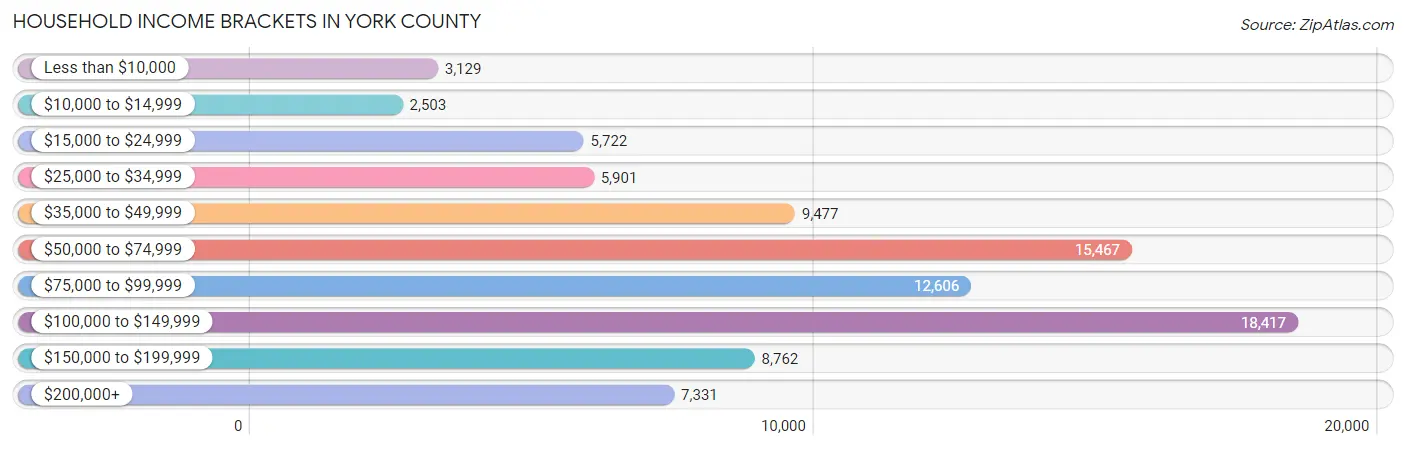
| Income Bracket | # Households | % Households |
| Less than $10,000 | 3,129 | 3.5% |
| $10,000 to $14,999 | 2,503 | 2.8% |
| $15,000 to $24,999 | 5,722 | 6.4% |
| $25,000 to $34,999 | 5,901 | 6.6% |
| $35,000 to $49,999 | 9,477 | 10.6% |
| $50,000 to $74,999 | 15,467 | 17.3% |
| $75,000 to $99,999 | 12,606 | 14.1% |
| $100,000 to $149,999 | 18,417 | 20.6% |
| $150,000 to $199,999 | 8,762 | 9.8% |
| $200,000+ | 7,331 | 8.2% |
Household Income by Householder Age in York County
The median household income in York County is $79,743, with the highest median household income of $96,646 found in the 25 to 44 years age bracket for the primary householder. A total of 23,238 households (26.0%) fall into this category. Meanwhile, the 65+ years age bracket for the primary householder has the lowest median household income of $53,782, with 28,206 households (31.6%) in this group.
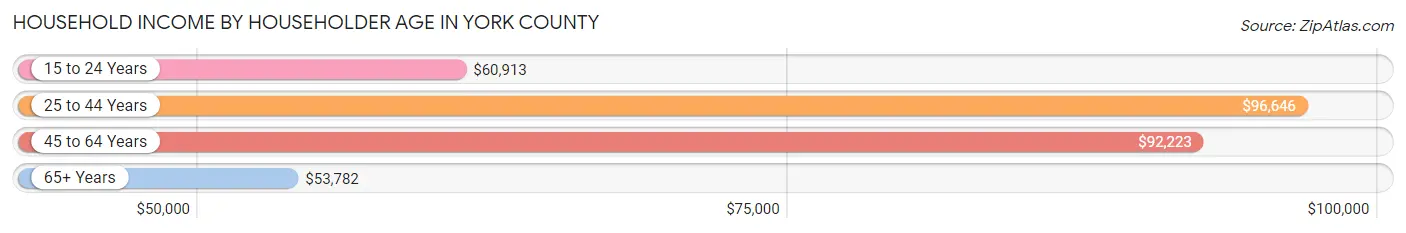
| Income Bracket | # Households | Median Income |
| 15 to 24 Years | 2,246 (2.5%) | $60,913 |
| 25 to 44 Years | 23,238 (26.0%) | $96,646 |
| 45 to 64 Years | 35,714 (40.0%) | $92,223 |
| 65+ Years | 28,206 (31.6%) | $53,782 |
| Total | 89,404 (100.0%) | $79,743 |
Poverty in York County
Income Below Poverty by Sex and Age in York County
With 7.5% poverty level for males and 8.5% for females among the residents of York County, 16 and 17 year old males and 18 to 24 year old females are the most vulnerable to poverty, with 367 males (15.7%) and 862 females (12.2%) in their respective age groups living below the poverty level.
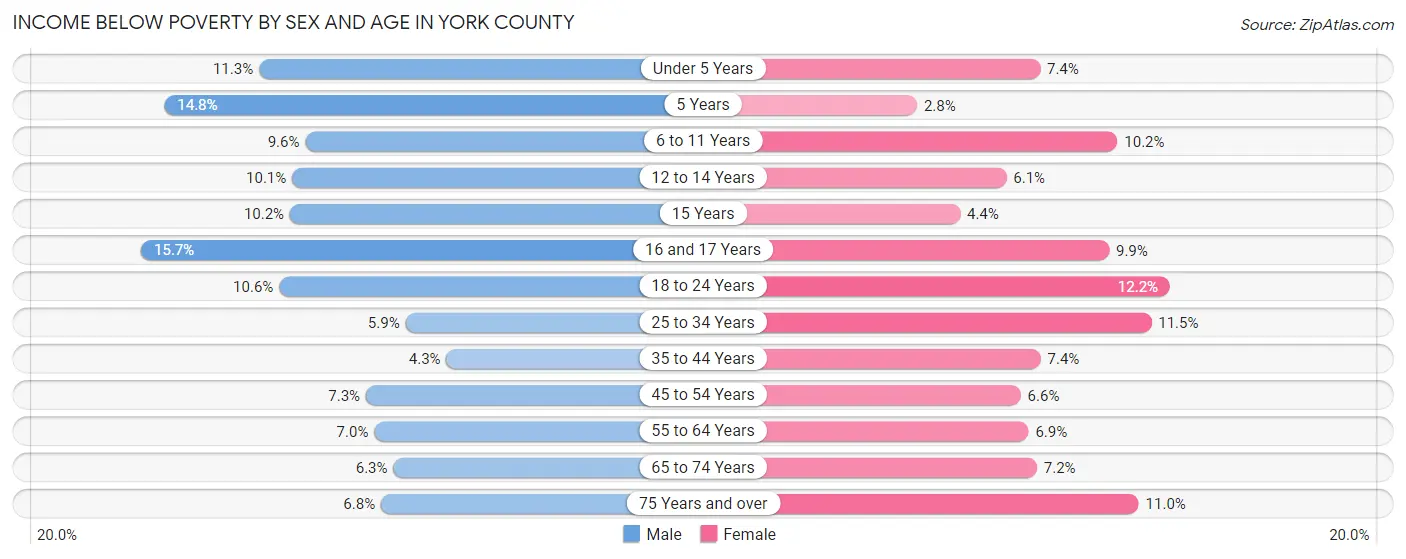
| Age Bracket | Male | Female |
| Under 5 Years | 539 (11.3%) | 339 (7.4%) |
| 5 Years | 144 (14.8%) | 25 (2.8%) |
| 6 to 11 Years | 597 (9.6%) | 644 (10.2%) |
| 12 to 14 Years | 375 (10.1%) | 186 (6.1%) |
| 15 Years | 145 (10.2%) | 54 (4.4%) |
| 16 and 17 Years | 367 (15.7%) | 220 (9.9%) |
| 18 to 24 Years | 791 (10.5%) | 862 (12.2%) |
| 25 to 34 Years | 774 (5.9%) | 1,488 (11.5%) |
| 35 to 44 Years | 538 (4.3%) | 930 (7.4%) |
| 45 to 54 Years | 1,029 (7.3%) | 902 (6.6%) |
| 55 to 64 Years | 1,154 (7.0%) | 1,209 (6.9%) |
| 65 to 74 Years | 805 (6.3%) | 1,040 (7.2%) |
| 75 Years and over | 494 (6.8%) | 1,081 (11.0%) |
| Total | 7,752 (7.5%) | 8,980 (8.5%) |
Income Above Poverty by Sex and Age in York County
According to the poverty statistics in York County, males aged 35 to 44 years and females aged 5 years are the age groups that are most secure financially, with 95.7% of males and 97.2% of females in these age groups living above the poverty line.
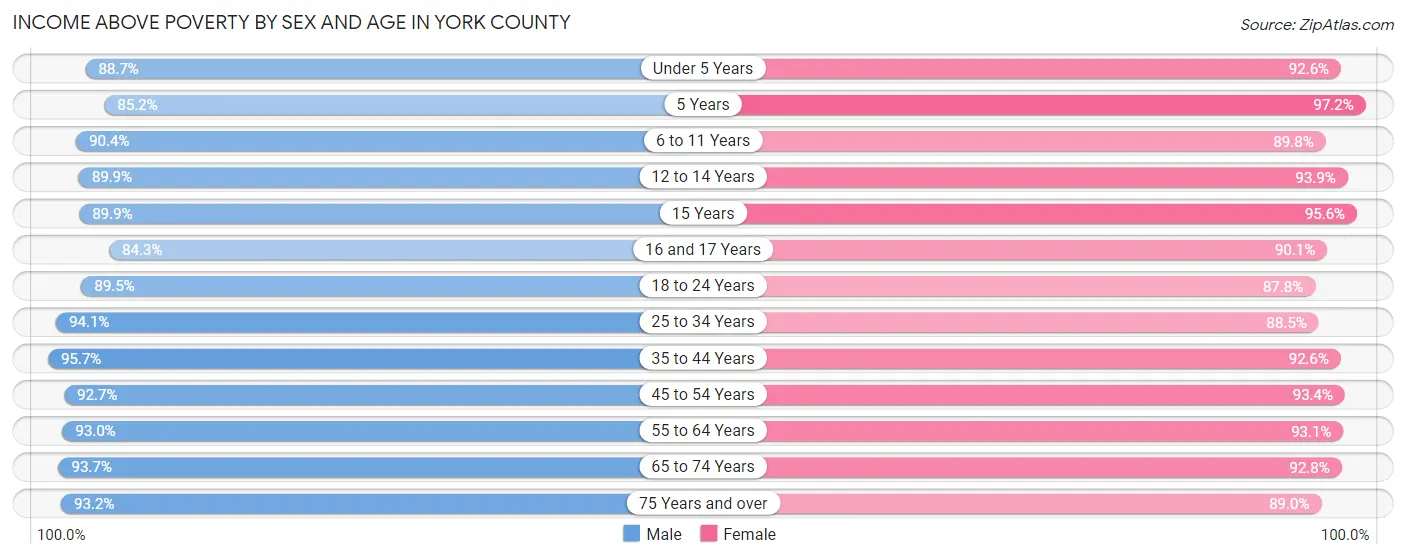
| Age Bracket | Male | Female |
| Under 5 Years | 4,229 (88.7%) | 4,264 (92.6%) |
| 5 Years | 828 (85.2%) | 870 (97.2%) |
| 6 to 11 Years | 5,634 (90.4%) | 5,653 (89.8%) |
| 12 to 14 Years | 3,349 (89.9%) | 2,859 (93.9%) |
| 15 Years | 1,283 (89.8%) | 1,175 (95.6%) |
| 16 and 17 Years | 1,974 (84.3%) | 1,997 (90.1%) |
| 18 to 24 Years | 6,708 (89.4%) | 6,218 (87.8%) |
| 25 to 34 Years | 12,436 (94.1%) | 11,457 (88.5%) |
| 35 to 44 Years | 11,859 (95.7%) | 11,677 (92.6%) |
| 45 to 54 Years | 13,010 (92.7%) | 12,681 (93.4%) |
| 55 to 64 Years | 15,286 (93.0%) | 16,239 (93.1%) |
| 65 to 74 Years | 11,960 (93.7%) | 13,333 (92.8%) |
| 75 Years and over | 6,799 (93.2%) | 8,727 (89.0%) |
| Total | 95,355 (92.5%) | 97,150 (91.5%) |
Income Below Poverty Among Married-Couple Families in York County
The poverty statistics for married-couple families in York County show that 2.6% or 1,173 of the total 45,546 families live below the poverty line. Families with 5 or more children have the highest poverty rate of 20.4%, comprising of 46 families. On the other hand, families with 1 or 2 children have the lowest poverty rate of 1.5%, which includes 202 families.
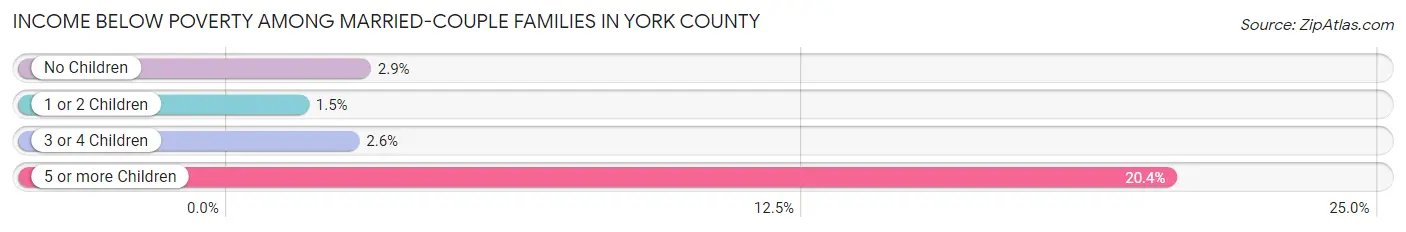
| Children | Above Poverty | Below Poverty |
| No Children | 29,301 (97.1%) | 871 (2.9%) |
| 1 or 2 Children | 12,904 (98.5%) | 202 (1.5%) |
| 3 or 4 Children | 1,989 (97.4%) | 54 (2.6%) |
| 5 or more Children | 179 (79.6%) | 46 (20.4%) |
| Total | 44,373 (97.4%) | 1,173 (2.6%) |
Income Below Poverty Among Single-Parent Households in York County
According to the poverty data in York County, 9.3% or 343 single-father households and 16.5% or 1,224 single-mother households are living below the poverty line. Among single-father households, those with 3 or 4 children have the highest poverty rate, with 68 households (33.0%) experiencing poverty. Likewise, among single-mother households, those with 5 or more children have the highest poverty rate, with 114 households (100.0%) falling below the poverty line.
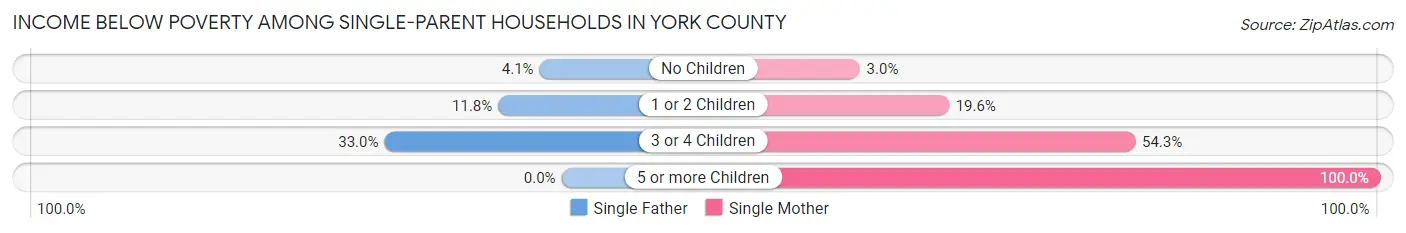
| Children | Single Father | Single Mother |
| No Children | 72 (4.1%) | 85 (3.0%) |
| 1 or 2 Children | 203 (11.8%) | 790 (19.6%) |
| 3 or 4 Children | 68 (33.0%) | 235 (54.3%) |
| 5 or more Children | 0 (0.0%) | 114 (100.0%) |
| Total | 343 (9.3%) | 1,224 (16.5%) |
Income Below Poverty Among Married-Couple vs Single-Parent Households in York County
The poverty data for York County shows that 1,173 of the married-couple family households (2.6%) and 1,567 of the single-parent households (14.1%) are living below the poverty level. Within the married-couple family households, those with 5 or more children have the highest poverty rate, with 46 households (20.4%) falling below the poverty line. Among the single-parent households, those with 5 or more children have the highest poverty rate, with 114 household (100.0%) living below poverty.
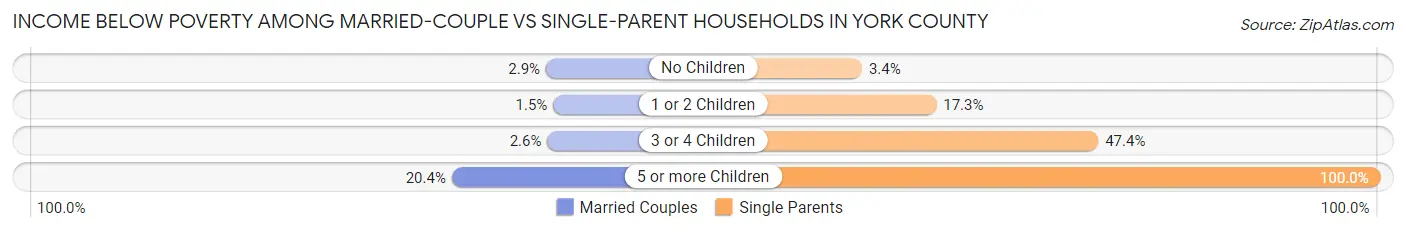
| Children | Married-Couple Families | Single-Parent Households |
| No Children | 871 (2.9%) | 157 (3.4%) |
| 1 or 2 Children | 202 (1.5%) | 993 (17.2%) |
| 3 or 4 Children | 54 (2.6%) | 303 (47.4%) |
| 5 or more Children | 46 (20.4%) | 114 (100.0%) |
| Total | 1,173 (2.6%) | 1,567 (14.1%) |
Race in York County
The most populous races in York County are White / Caucasian (197,097 | 92.7%), Two or more Races (9,371 | 4.4%), and Hispanic or Latino (4,162 | 2.0%).
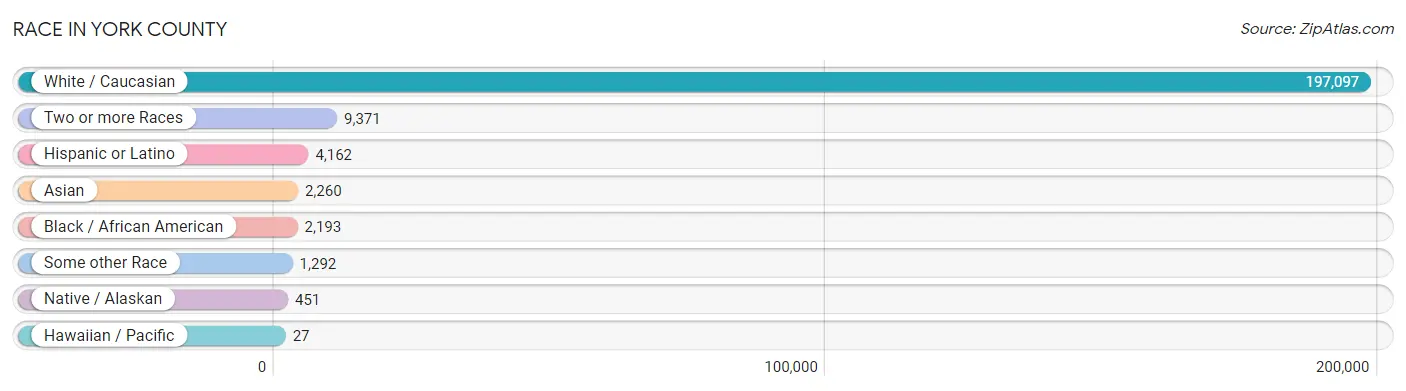
| Race | # Population | % Population |
| Asian | 2,260 | 1.1% |
| Black / African American | 2,193 | 1.0% |
| Hawaiian / Pacific | 27 | 0.0% |
| Hispanic or Latino | 4,162 | 2.0% |
| Native / Alaskan | 451 | 0.2% |
| White / Caucasian | 197,097 | 92.7% |
| Two or more Races | 9,371 | 4.4% |
| Some other Race | 1,292 | 0.6% |
| Total | 212,691 | 100.0% |
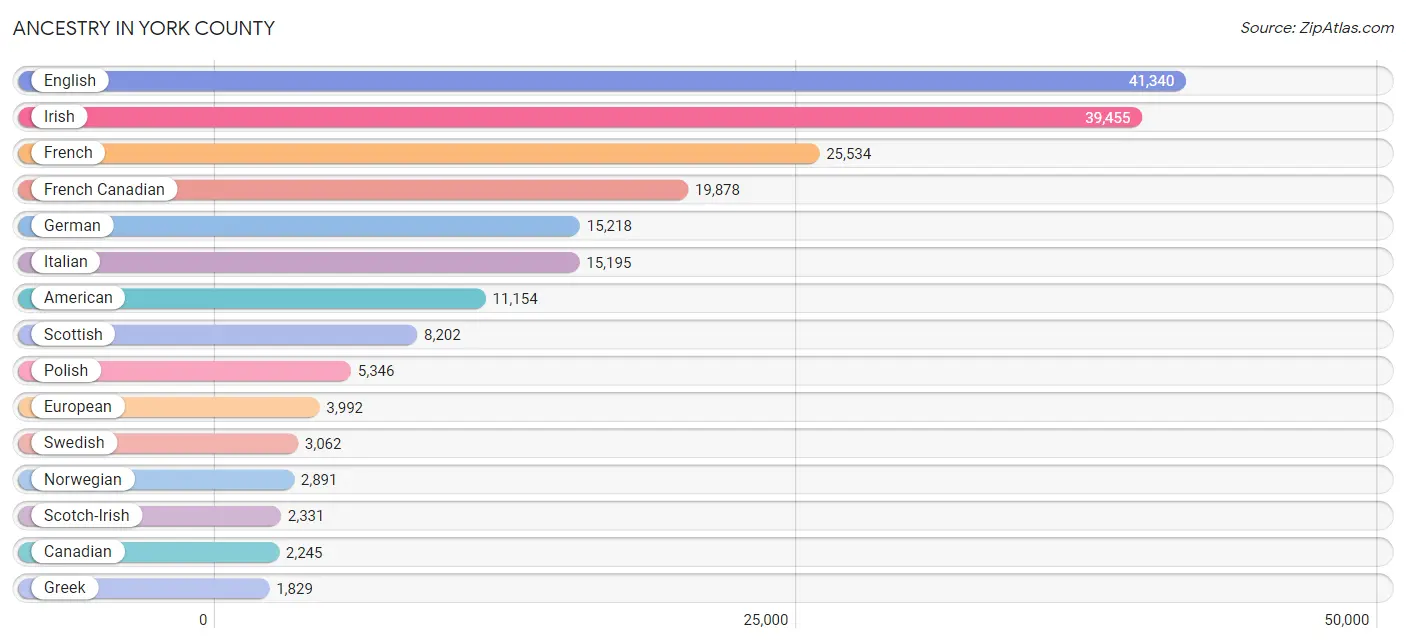
Ancestry in York County
The most populous ancestries reported in York County are English (41,340 | 19.4%), Irish (39,455 | 18.5%), French (25,534 | 12.0%), French Canadian (19,878 | 9.3%), and German (15,218 | 7.1%), together accounting for 66.5% of all York County residents.
| Ancestry | # Population | % Population |
| Afghan | 430 | 0.2% |
| African | 67 | 0.0% |
| Alaska Native | 6 | 0.0% |
| Alaskan Athabascan | 12 | 0.0% |
| Albanian | 252 | 0.1% |
| American | 11,154 | 5.2% |
| Apache | 10 | 0.0% |
| Arab | 832 | 0.4% |
| Argentinean | 14 | 0.0% |
| Armenian | 127 | 0.1% |
| Assyrian / Chaldean / Syriac | 26 | 0.0% |
| Australian | 120 | 0.1% |
| Austrian | 337 | 0.2% |
| Basque | 35 | 0.0% |
| Belgian | 121 | 0.1% |
| Bhutanese | 269 | 0.1% |
| Blackfeet | 163 | 0.1% |
| Brazilian | 70 | 0.0% |
| British | 1,805 | 0.9% |
| Bulgarian | 33 | 0.0% |
| Burmese | 208 | 0.1% |
| Cajun | 147 | 0.1% |
| Cambodian | 18 | 0.0% |
| Canadian | 2,245 | 1.1% |
| Cape Verdean | 26 | 0.0% |
| Celtic | 56 | 0.0% |
| Central American | 359 | 0.2% |
| Central American Indian | 7 | 0.0% |
| Cherokee | 213 | 0.1% |
| Cheyenne | 72 | 0.0% |
| Chickasaw | 115 | 0.1% |
| Chippewa | 28 | 0.0% |
| Choctaw | 7 | 0.0% |
| Colombian | 64 | 0.0% |
| Croatian | 54 | 0.0% |
| Cuban | 122 | 0.1% |
| Czech | 896 | 0.4% |
| Czechoslovakian | 215 | 0.1% |
| Danish | 859 | 0.4% |
| Dominican | 152 | 0.1% |
| Dutch | 1,521 | 0.7% |
| Eastern European | 783 | 0.4% |
| Ecuadorian | 25 | 0.0% |
| Egyptian | 65 | 0.0% |
| English | 41,340 | 19.4% |
| Estonian | 13 | 0.0% |
| Ethiopian | 16 | 0.0% |
| European | 3,992 | 1.9% |
| Filipino | 81 | 0.0% |
| Finnish | 448 | 0.2% |
| French | 25,534 | 12.0% |
| French American Indian | 63 | 0.0% |
| French Canadian | 19,878 | 9.3% |
| German | 15,218 | 7.1% |
| Greek | 1,829 | 0.9% |
| Guamanian / Chamorro | 71 | 0.0% |
| Guatemalan | 63 | 0.0% |
| Guyanese | 6 | 0.0% |
| Haitian | 5 | 0.0% |
| Honduran | 1 | 0.0% |
| Hungarian | 609 | 0.3% |
| Icelander | 3 | 0.0% |
| Indian (Asian) | 855 | 0.4% |
| Iranian | 26 | 0.0% |
| Irish | 39,455 | 18.5% |
| Iroquois | 149 | 0.1% |
| Israeli | 5 | 0.0% |
| Italian | 15,195 | 7.1% |
| Jamaican | 403 | 0.2% |
| Japanese | 432 | 0.2% |
| Kenyan | 88 | 0.0% |
| Korean | 743 | 0.4% |
| Laotian | 132 | 0.1% |
| Latvian | 99 | 0.1% |
| Lebanese | 352 | 0.2% |
| Lithuanian | 597 | 0.3% |
| Malaysian | 82 | 0.0% |
| Mexican | 1,498 | 0.7% |
| Mexican American Indian | 20 | 0.0% |
| Moroccan | 10 | 0.0% |
| Native Hawaiian | 65 | 0.0% |
| Navajo | 9 | 0.0% |
| New Zealander | 27 | 0.0% |
| Nicaraguan | 11 | 0.0% |
| Northern European | 348 | 0.2% |
| Norwegian | 2,891 | 1.4% |
| Pakistani | 266 | 0.1% |
| Panamanian | 32 | 0.0% |
| Pennsylvania German | 78 | 0.0% |
| Peruvian | 90 | 0.0% |
| Polish | 5,346 | 2.5% |
| Portuguese | 1,516 | 0.7% |
| Puerto Rican | 1,180 | 0.5% |
| Romanian | 64 | 0.0% |
| Russian | 1,121 | 0.5% |
| Salvadoran | 252 | 0.1% |
| Samoan | 20 | 0.0% |
| Scandinavian | 576 | 0.3% |
| Scotch-Irish | 2,331 | 1.1% |
| Scottish | 8,202 | 3.9% |
| Serbian | 47 | 0.0% |
| Sioux | 129 | 0.1% |
| Slavic | 10 | 0.0% |
| Slovak | 209 | 0.1% |
| Slovene | 65 | 0.0% |
| Somali | 62 | 0.0% |
| South American | 276 | 0.1% |
| South American Indian | 35 | 0.0% |
| Spaniard | 151 | 0.1% |
| Spanish | 198 | 0.1% |
| Sri Lankan | 365 | 0.2% |
| Subsaharan African | 600 | 0.3% |
| Sudanese | 1 | 0.0% |
| Swedish | 3,062 | 1.4% |
| Swiss | 409 | 0.2% |
| Syrian | 237 | 0.1% |
| Thai | 137 | 0.1% |
| Turkish | 35 | 0.0% |
| Ukrainian | 374 | 0.2% |
| Venezuelan | 83 | 0.0% |
| Welsh | 1,548 | 0.7% |
| West Indian | 75 | 0.0% |
| Yugoslavian | 73 | 0.0% | View All 123 Rows |
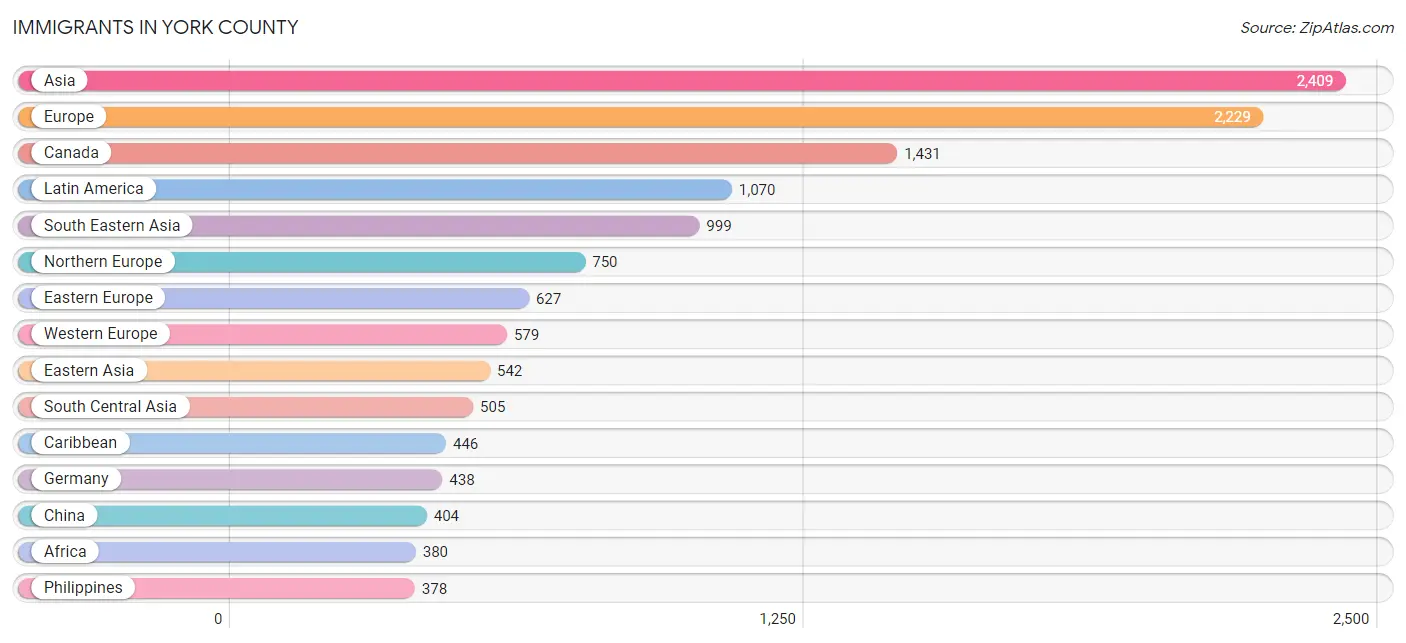
Immigrants in York County
The most numerous immigrant groups reported in York County came from Asia (2,409 | 1.1%), Europe (2,229 | 1.1%), Canada (1,431 | 0.7%), Latin America (1,070 | 0.5%), and South Eastern Asia (999 | 0.5%), together accounting for 3.8% of all York County residents.
| Immigration Origin | # Population | % Population |
| Afghanistan | 353 | 0.2% |
| Africa | 380 | 0.2% |
| Argentina | 82 | 0.0% |
| Asia | 2,409 | 1.1% |
| Australia | 25 | 0.0% |
| Belarus | 17 | 0.0% |
| Belgium | 64 | 0.0% |
| Bosnia and Herzegovina | 33 | 0.0% |
| Brazil | 71 | 0.0% |
| Bulgaria | 54 | 0.0% |
| Cabo Verde | 26 | 0.0% |
| Cambodia | 275 | 0.1% |
| Canada | 1,431 | 0.7% |
| Caribbean | 446 | 0.2% |
| Central America | 317 | 0.2% |
| China | 404 | 0.2% |
| Colombia | 18 | 0.0% |
| Cuba | 17 | 0.0% |
| Czechoslovakia | 167 | 0.1% |
| Denmark | 36 | 0.0% |
| Dominican Republic | 94 | 0.0% |
| Eastern Africa | 198 | 0.1% |
| Eastern Asia | 542 | 0.3% |
| Eastern Europe | 627 | 0.3% |
| Ecuador | 20 | 0.0% |
| El Salvador | 133 | 0.1% |
| England | 350 | 0.2% |
| Eritrea | 8 | 0.0% |
| Ethiopia | 15 | 0.0% |
| Europe | 2,229 | 1.1% |
| France | 15 | 0.0% |
| Germany | 438 | 0.2% |
| Greece | 154 | 0.1% |
| Guatemala | 50 | 0.0% |
| Haiti | 43 | 0.0% |
| Honduras | 1 | 0.0% |
| India | 112 | 0.1% |
| Indonesia | 57 | 0.0% |
| Iran | 27 | 0.0% |
| Iraq | 264 | 0.1% |
| Ireland | 45 | 0.0% |
| Italy | 53 | 0.0% |
| Jamaica | 292 | 0.1% |
| Japan | 57 | 0.0% |
| Kenya | 50 | 0.0% |
| Korea | 63 | 0.0% |
| Kuwait | 28 | 0.0% |
| Laos | 20 | 0.0% |
| Latin America | 1,070 | 0.5% |
| Latvia | 3 | 0.0% |
| Lithuania | 17 | 0.0% |
| Malaysia | 34 | 0.0% |
| Mexico | 110 | 0.1% |
| Middle Africa | 60 | 0.0% |
| Moldova | 23 | 0.0% |
| Morocco | 20 | 0.0% |
| Netherlands | 29 | 0.0% |
| Nicaragua | 23 | 0.0% |
| Northern Africa | 45 | 0.0% |
| Northern Europe | 750 | 0.4% |
| Norway | 17 | 0.0% |
| Oceania | 25 | 0.0% |
| Pakistan | 13 | 0.0% |
| Peru | 46 | 0.0% |
| Philippines | 378 | 0.2% |
| Poland | 78 | 0.0% |
| Portugal | 37 | 0.0% |
| Romania | 9 | 0.0% |
| Russia | 127 | 0.1% |
| Scotland | 28 | 0.0% |
| South Africa | 41 | 0.0% |
| South America | 307 | 0.1% |
| South Central Asia | 505 | 0.2% |
| South Eastern Asia | 999 | 0.5% |
| Southern Europe | 273 | 0.1% |
| Spain | 29 | 0.0% |
| Sweden | 22 | 0.0% |
| Switzerland | 33 | 0.0% |
| Taiwan | 14 | 0.0% |
| Thailand | 139 | 0.1% |
| Turkey | 19 | 0.0% |
| Ukraine | 95 | 0.0% |
| Venezuela | 70 | 0.0% |
| Vietnam | 96 | 0.1% |
| Western Africa | 26 | 0.0% |
| Western Asia | 363 | 0.2% |
| Western Europe | 579 | 0.3% |
| Zaire | 51 | 0.0% |
| Zimbabwe | 16 | 0.0% | View All 89 Rows |
Sex and Age in York County
Sex and Age in York County
The most populous age groups in York County are 60 to 64 Years (8,584 | 8.2%) for men and 60 to 64 Years (8,840 | 8.2%) for women.
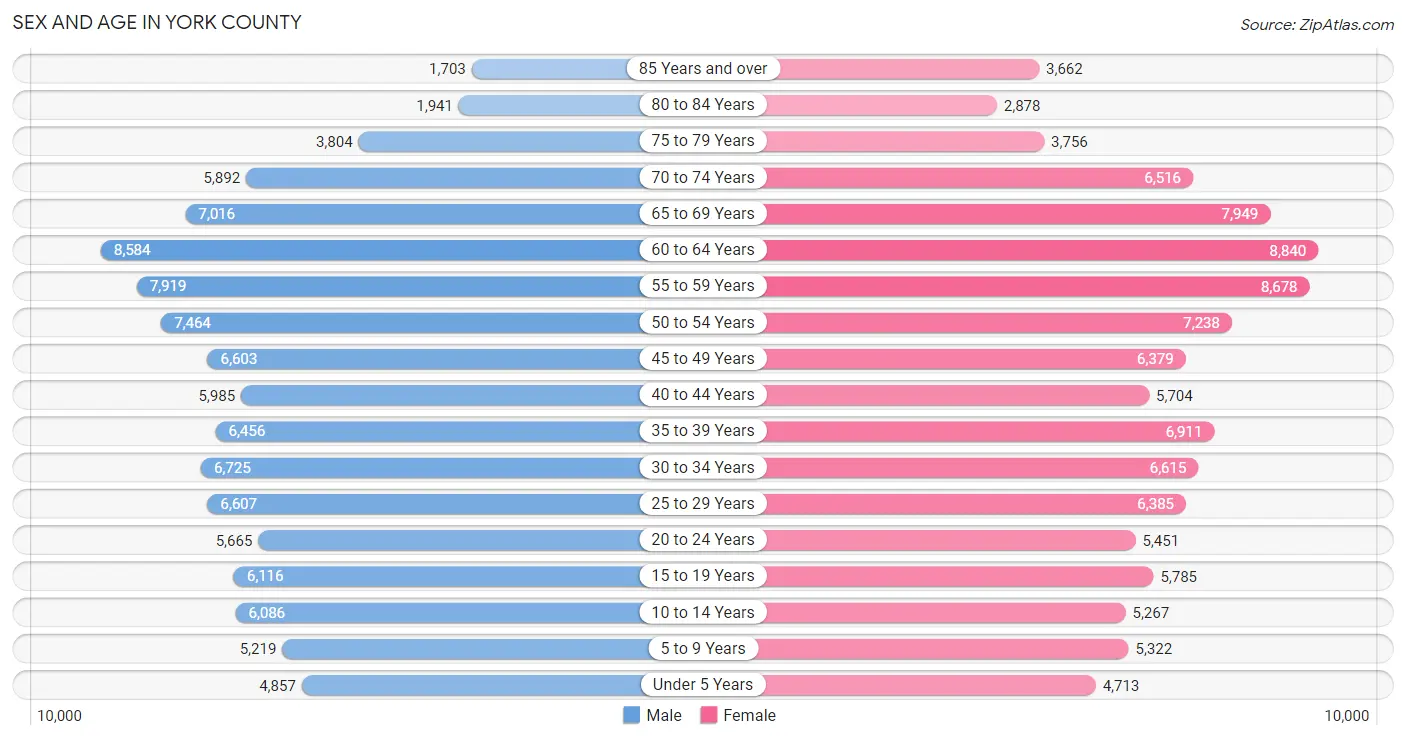
| Age Bracket | Male | Female |
| Under 5 Years | 4,857 (4.6%) | 4,713 (4.4%) |
| 5 to 9 Years | 5,219 (5.0%) | 5,322 (4.9%) |
| 10 to 14 Years | 6,086 (5.8%) | 5,267 (4.9%) |
| 15 to 19 Years | 6,116 (5.8%) | 5,785 (5.3%) |
| 20 to 24 Years | 5,665 (5.4%) | 5,451 (5.0%) |
| 25 to 29 Years | 6,607 (6.3%) | 6,385 (5.9%) |
| 30 to 34 Years | 6,725 (6.4%) | 6,615 (6.1%) |
| 35 to 39 Years | 6,456 (6.2%) | 6,911 (6.4%) |
| 40 to 44 Years | 5,985 (5.7%) | 5,704 (5.3%) |
| 45 to 49 Years | 6,603 (6.3%) | 6,379 (5.9%) |
| 50 to 54 Years | 7,464 (7.1%) | 7,238 (6.7%) |
| 55 to 59 Years | 7,919 (7.6%) | 8,678 (8.0%) |
| 60 to 64 Years | 8,584 (8.2%) | 8,840 (8.2%) |
| 65 to 69 Years | 7,016 (6.7%) | 7,949 (7.4%) |
| 70 to 74 Years | 5,892 (5.6%) | 6,516 (6.0%) |
| 75 to 79 Years | 3,804 (3.6%) | 3,756 (3.5%) |
| 80 to 84 Years | 1,941 (1.8%) | 2,878 (2.7%) |
| 85 Years and over | 1,703 (1.6%) | 3,662 (3.4%) |
| Total | 104,642 (100.0%) | 108,049 (100.0%) |
Families and Households in York County
Median Family Size in York County
The median family size in York County is 2.87 persons per family, with married-couple families (45,546 | 80.4%) accounting for the largest median family size of 2.9 persons per family. On the other hand, single male/father families (3,679 | 6.5%) represent the smallest median family size with 2.62 persons per family.
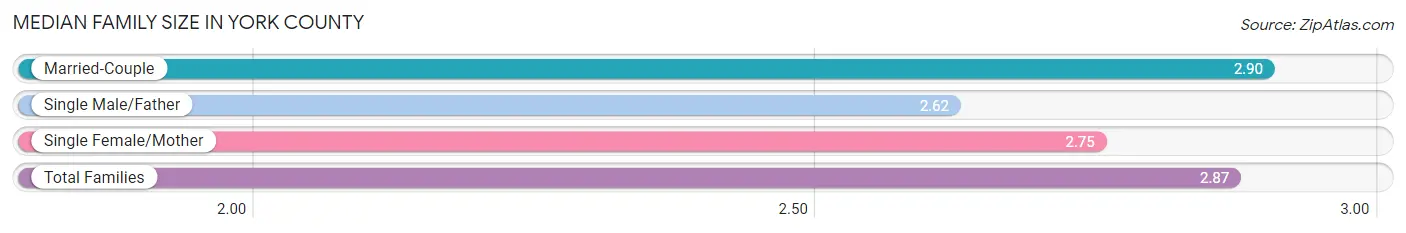
| Family Type | # Families | Family Size |
| Married-Couple | 45,546 (80.4%) | 2.90 |
| Single Male/Father | 3,679 (6.5%) | 2.62 |
| Single Female/Mother | 7,440 (13.1%) | 2.75 |
| Total Families | 56,665 (100.0%) | 2.87 |
Median Household Size in York County
The median household size in York County is 2.34 persons per household, with single male/father households (3,679 | 4.1%) accounting for the largest median household size of 3.1 persons per household. non-family households (32,739 | 36.6%) represent the smallest median household size with 1.27 persons per household.
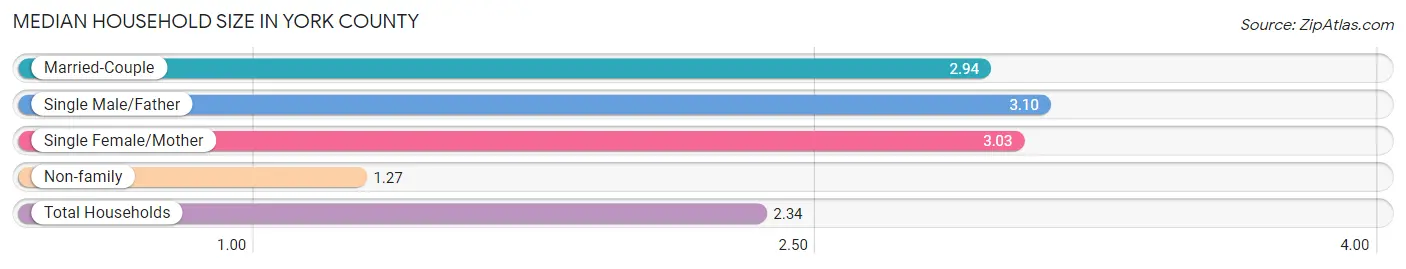
| Household Type | # Households | Household Size |
| Married-Couple | 45,546 (50.9%) | 2.94 |
| Single Male/Father | 3,679 (4.1%) | 3.10 |
| Single Female/Mother | 7,440 (8.3%) | 3.03 |
| Non-family | 32,739 (36.6%) | 1.27 |
| Total Households | 89,404 (100.0%) | 2.34 |
Household Size by Marriage Status in York County
Out of a total of 89,404 households in York County, 56,665 (63.4%) are family households, while 32,739 (36.6%) are nonfamily households. The most numerous type of family households are 2-person households, comprising 27,905, and the most common type of nonfamily households are 1-person households, comprising 25,471.
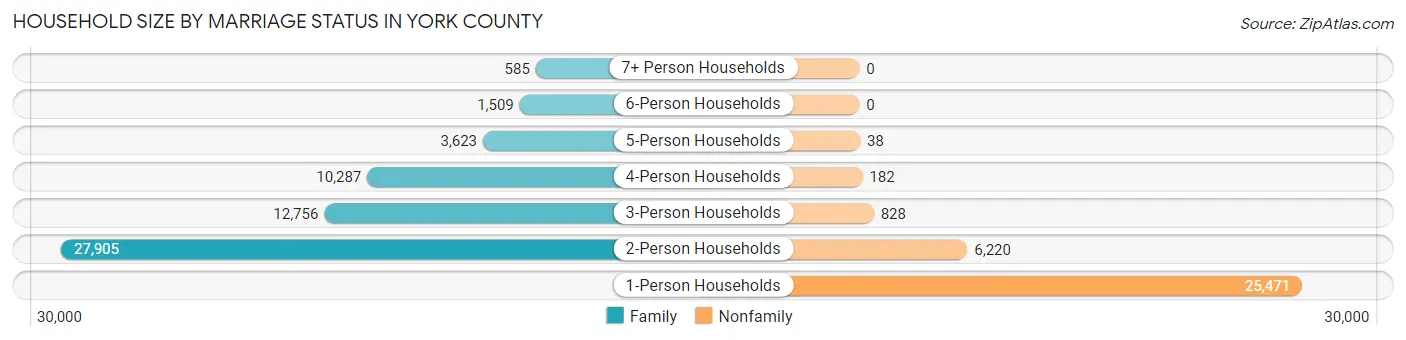
| Household Size | Family Households | Nonfamily Households |
| 1-Person Households | - | 25,471 (28.5%) |
| 2-Person Households | 27,905 (31.2%) | 6,220 (7.0%) |
| 3-Person Households | 12,756 (14.3%) | 828 (0.9%) |
| 4-Person Households | 10,287 (11.5%) | 182 (0.2%) |
| 5-Person Households | 3,623 (4.1%) | 38 (0.0%) |
| 6-Person Households | 1,509 (1.7%) | 0 (0.0%) |
| 7+ Person Households | 585 (0.6%) | 0 (0.0%) |
| Total | 56,665 (63.4%) | 32,739 (36.6%) |
Female Fertility in York County
Fertility by Age in York County
Average fertility rate in York County is 45.0 births per 1,000 women. Women in the age bracket of 20 to 34 years have the highest fertility rate with 87.0 births per 1,000 women. Women in the age bracket of 20 to 34 years acount for 80.3% of all women with births.
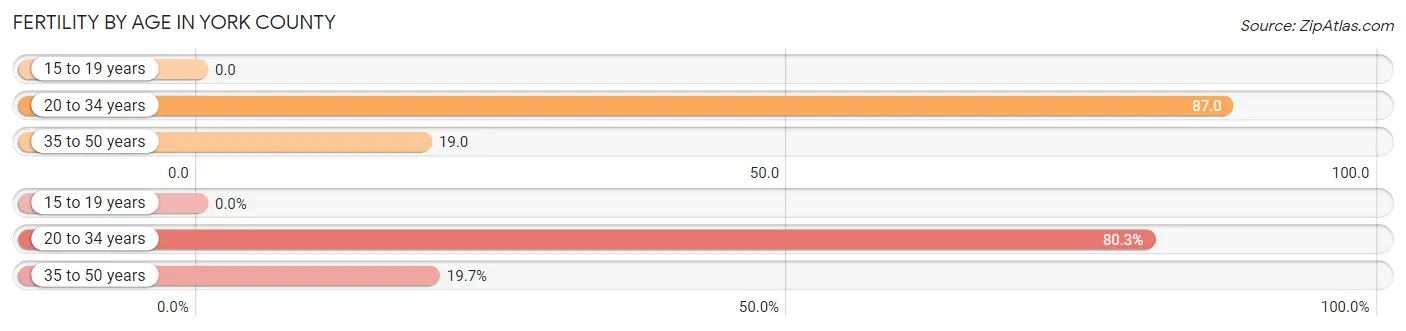
| Age Bracket | Women with Births | Births / 1,000 Women |
| 15 to 19 years | 0 (0.0%) | 0.0 |
| 20 to 34 years | 1,609 (80.3%) | 87.0 |
| 35 to 50 years | 394 (19.7%) | 19.0 |
| Total | 2,003 (100.0%) | 45.0 |
Fertility by Age by Marriage Status in York County
75.0% of women with births (2,003) in York County are married. The highest percentage of unmarried women with births falls into 20 to 34 years age bracket with 26.2% of them unmarried at the time of birth, while the lowest percentage of unmarried women with births belong to 35 to 50 years age bracket with 20.1% of them unmarried.
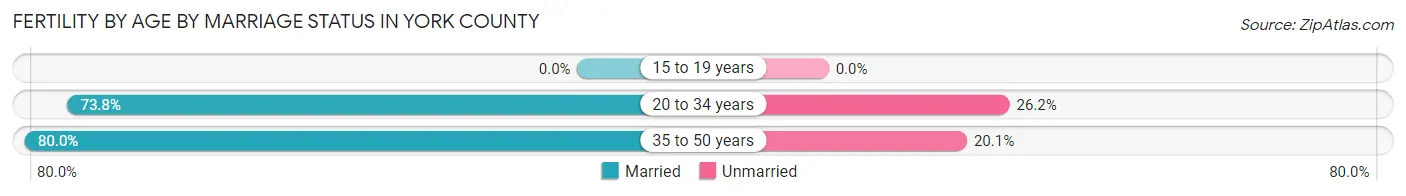
| Age Bracket | Married | Unmarried |
| 15 to 19 years | 0 (0.0%) | 0 (0.0%) |
| 20 to 34 years | 1,187 (73.8%) | 422 (26.2%) |
| 35 to 50 years | 315 (79.9%) | 79 (20.1%) |
| Total | 1,502 (75.0%) | 501 (25.0%) |
Fertility by Education in York County
Average fertility rate in York County is 45.0 births per 1,000 women. Women with the education attainment of graduate degree have the highest fertility rate of 69.0 births per 1,000 women, while women with the education attainment of less than high school have the lowest fertility at 28.0 births per 1,000 women. Women with the education attainment of college or associate's degree represent 30.3% of all women with births.
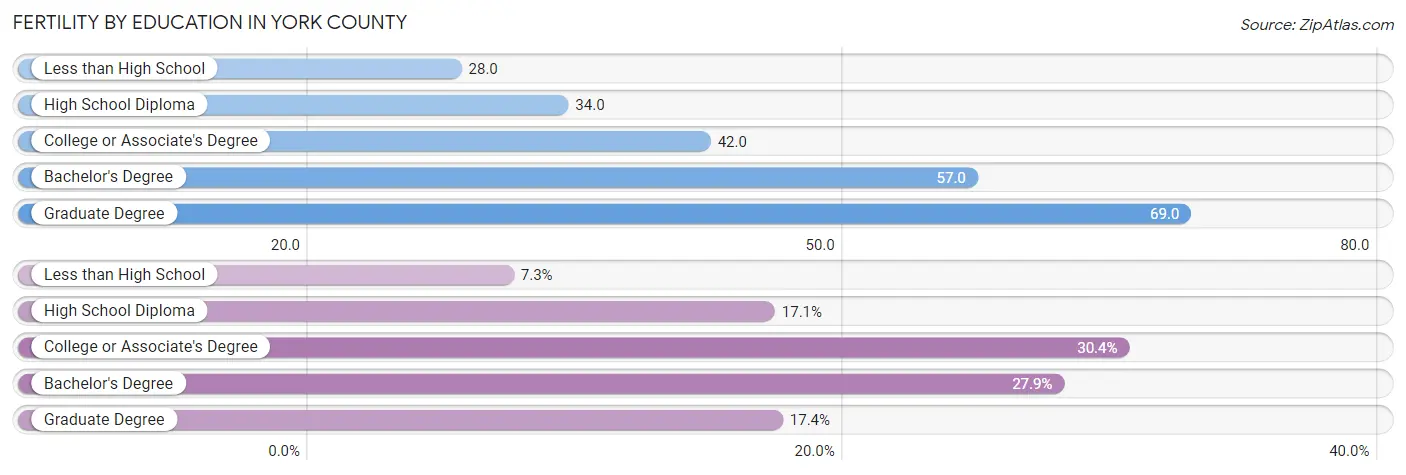
| Educational Attainment | Women with Births | Births / 1,000 Women |
| Less than High School | 146 (7.3%) | 28.0 |
| High School Diploma | 342 (17.1%) | 34.0 |
| College or Associate's Degree | 608 (30.3%) | 42.0 |
| Bachelor's Degree | 559 (27.9%) | 57.0 |
| Graduate Degree | 348 (17.4%) | 69.0 |
| Total | 2,003 (100.0%) | 45.0 |
Fertility by Education by Marriage Status in York County
25.0% of women with births in York County are unmarried. Women with the educational attainment of graduate degree are most likely to be married with 93.7% of them married at childbirth, while women with the educational attainment of high school diploma are least likely to be married with 45.6% of them unmarried at childbirth.
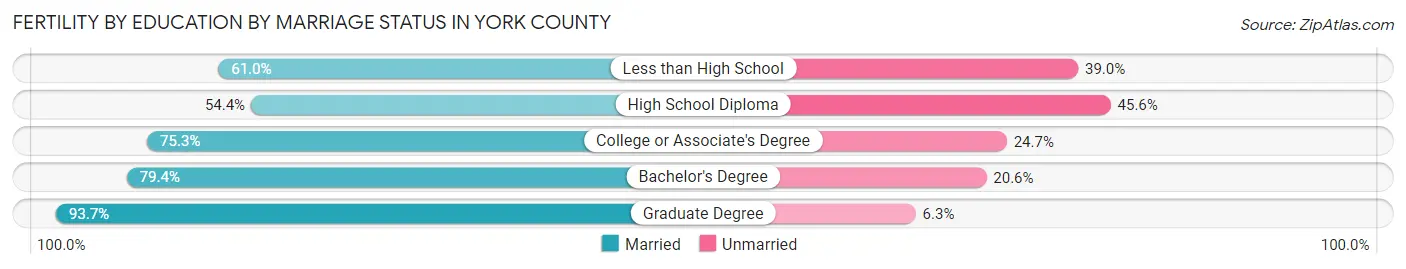
| Educational Attainment | Married | Unmarried |
| Less than High School | 89 (61.0%) | 57 (39.0%) |
| High School Diploma | 186 (54.4%) | 156 (45.6%) |
| College or Associate's Degree | 458 (75.3%) | 150 (24.7%) |
| Bachelor's Degree | 444 (79.4%) | 115 (20.6%) |
| Graduate Degree | 326 (93.7%) | 22 (6.3%) |
| Total | 1,502 (75.0%) | 501 (25.0%) |
Employment Characteristics in York County
Employment by Class of Employer in York County
Among the 111,025 employed individuals in York County, private company employees (68,060 | 61.3%), not-for-profit organizations (12,963 | 11.7%), and self-employed (not incorporated) (8,255 | 7.4%) make up the most common classes of employment.
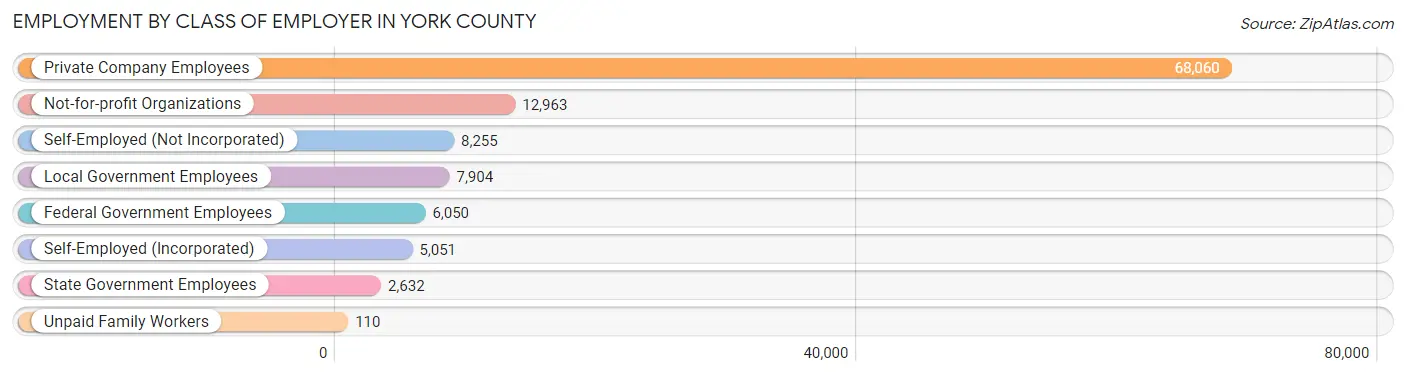
| Employer Class | # Employees | % Employees |
| Private Company Employees | 68,060 | 61.3% |
| Self-Employed (Incorporated) | 5,051 | 4.5% |
| Self-Employed (Not Incorporated) | 8,255 | 7.4% |
| Not-for-profit Organizations | 12,963 | 11.7% |
| Local Government Employees | 7,904 | 7.1% |
| State Government Employees | 2,632 | 2.4% |
| Federal Government Employees | 6,050 | 5.4% |
| Unpaid Family Workers | 110 | 0.1% |
| Total | 111,025 | 100.0% |
Employment Status by Age in York County
According to the labor force statistics for York County, out of the total population over 16 years of age (178,566), 65.7% or 117,318 individuals are in the labor force, with 3.4% or 3,989 of them unemployed. The age group with the highest labor force participation rate is 30 to 34 years, with 90.1% or 12,019 individuals in the labor force. Within the labor force, the 16 to 19 years age range has the highest percentage of unemployed individuals, with 11.7% or 618 of them being unemployed.
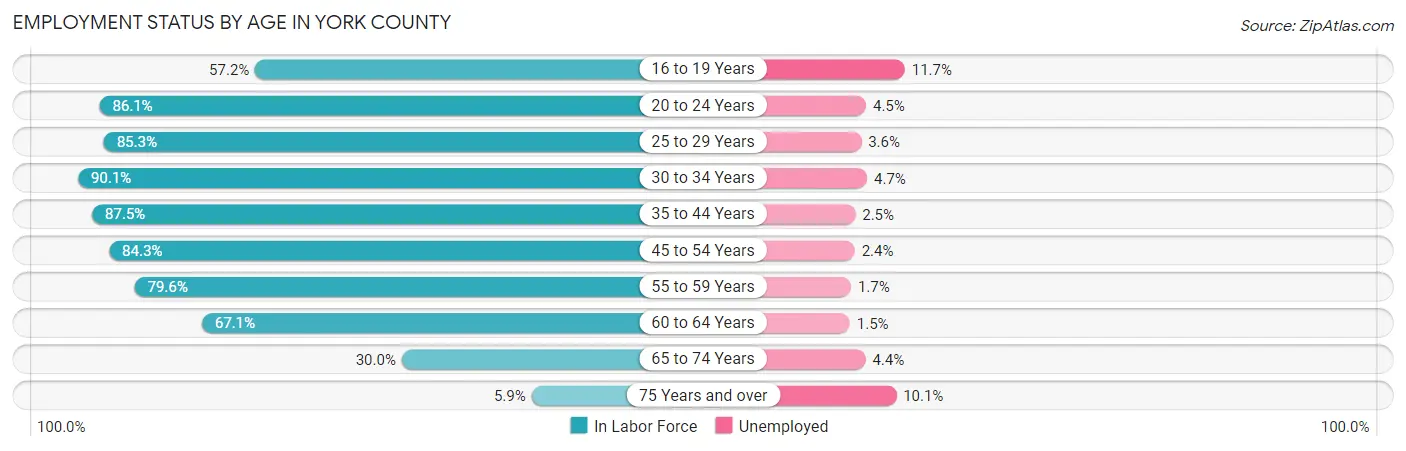
| Age Bracket | In Labor Force | Unemployed |
| 16 to 19 Years | 5,285 (57.2%) | 618 (11.7%) |
| 20 to 24 Years | 9,571 (86.1%) | 431 (4.5%) |
| 25 to 29 Years | 11,082 (85.3%) | 399 (3.6%) |
| 30 to 34 Years | 12,019 (90.1%) | 565 (4.7%) |
| 35 to 44 Years | 21,924 (87.5%) | 548 (2.5%) |
| 45 to 54 Years | 23,338 (84.3%) | 560 (2.4%) |
| 55 to 59 Years | 13,211 (79.6%) | 225 (1.7%) |
| 60 to 64 Years | 11,692 (67.1%) | 175 (1.5%) |
| 65 to 74 Years | 8,212 (30.0%) | 361 (4.4%) |
| 75 Years and over | 1,047 (5.9%) | 106 (10.1%) |
| Total | 117,318 (65.7%) | 3,989 (3.4%) |
Employment Status by Educational Attainment in York County
According to labor force statistics for York County, 82.5% of individuals (93,302) out of the total population between 25 and 64 years of age (113,093) are in the labor force, with 2.6% or 2,426 of them being unemployed. The group with the highest labor force participation rate are those with the educational attainment of bachelor's degree or higher, with 88.6% or 32,662 individuals in the labor force. Within the labor force, individuals with less than high school education have the highest percentage of unemployment, with 4.4% or 153 of them being unemployed.
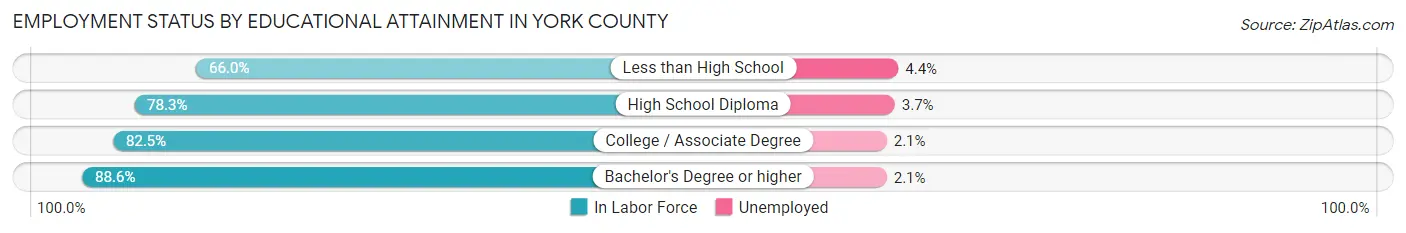
| Educational Attainment | In Labor Force | Unemployed |
| Less than High School | 3,470 (66.0%) | 231 (4.4%) |
| High School Diploma | 26,606 (78.3%) | 1,257 (3.7%) |
| College / Associate Degree | 30,519 (82.5%) | 777 (2.1%) |
| Bachelor's Degree or higher | 32,662 (88.6%) | 774 (2.1%) |
| Total | 93,302 (82.5%) | 2,940 (2.6%) |
Employment Occupations by Sex in York County
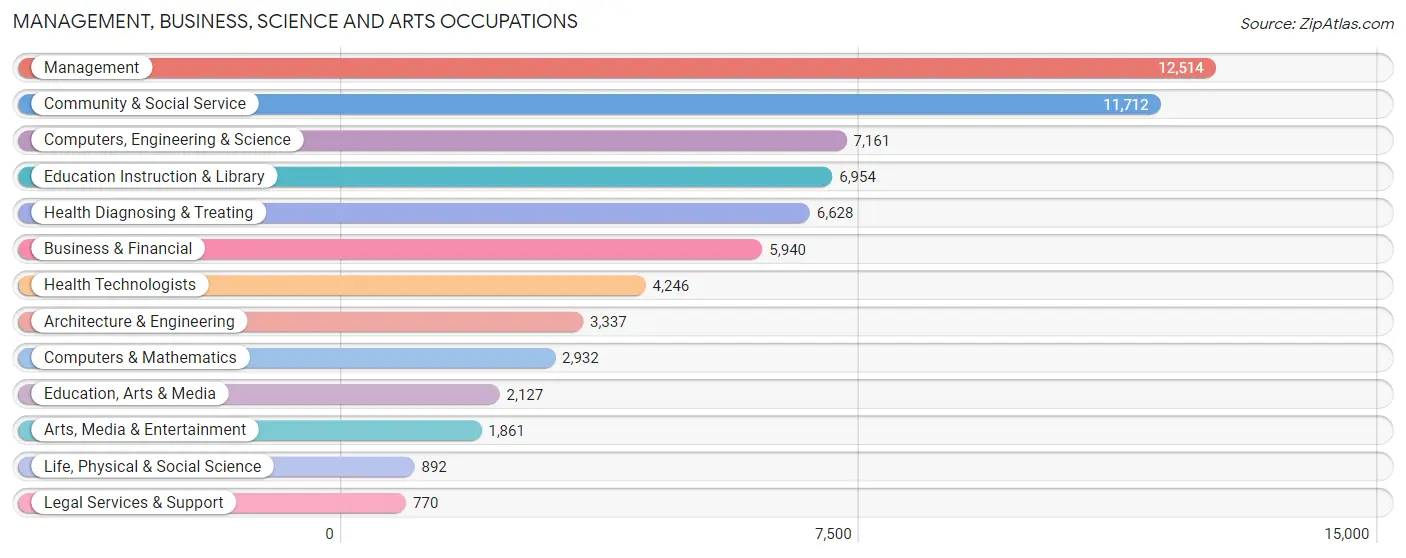
Management, Business, Science and Arts Occupations
The most common Management, Business, Science and Arts occupations in York County are Management (12,514 | 11.1%), Community & Social Service (11,712 | 10.4%), Computers, Engineering & Science (7,161 | 6.4%), Education Instruction & Library (6,954 | 6.2%), and Health Diagnosing & Treating (6,628 | 5.9%).
Management, Business, Science and Arts Occupations by Sex
Within the Management, Business, Science and Arts occupations in York County, the most male-oriented occupations are Architecture & Engineering (86.9%), Computers, Engineering & Science (78.2%), and Computers & Mathematics (74.1%), while the most female-oriented occupations are Health Diagnosing & Treating (81.2%), Health Technologists (79.2%), and Education, Arts & Media (78.1%).
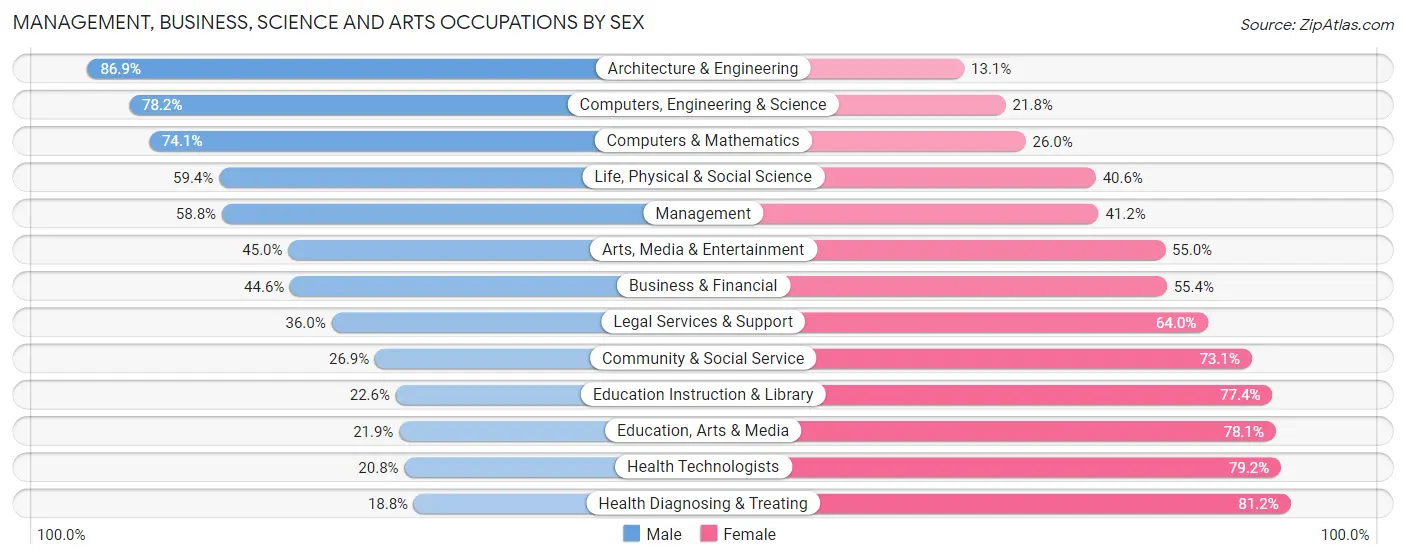
| Occupation | Male | Female |
| Management | 7,363 (58.8%) | 5,151 (41.2%) |
| Business & Financial | 2,649 (44.6%) | 3,291 (55.4%) |
| Computers, Engineering & Science | 5,600 (78.2%) | 1,561 (21.8%) |
| Computers & Mathematics | 2,171 (74.1%) | 761 (26.0%) |
| Architecture & Engineering | 2,899 (86.9%) | 438 (13.1%) |
| Life, Physical & Social Science | 530 (59.4%) | 362 (40.6%) |
| Community & Social Service | 3,148 (26.9%) | 8,564 (73.1%) |
| Education, Arts & Media | 465 (21.9%) | 1,662 (78.1%) |
| Legal Services & Support | 277 (36.0%) | 493 (64.0%) |
| Education Instruction & Library | 1,569 (22.6%) | 5,385 (77.4%) |
| Arts, Media & Entertainment | 837 (45.0%) | 1,024 (55.0%) |
| Health Diagnosing & Treating | 1,245 (18.8%) | 5,383 (81.2%) |
| Health Technologists | 882 (20.8%) | 3,364 (79.2%) |
| Total (Category) | 20,005 (45.5%) | 23,950 (54.5%) |
| Total (Overall) | 58,737 (52.1%) | 53,999 (47.9%) |
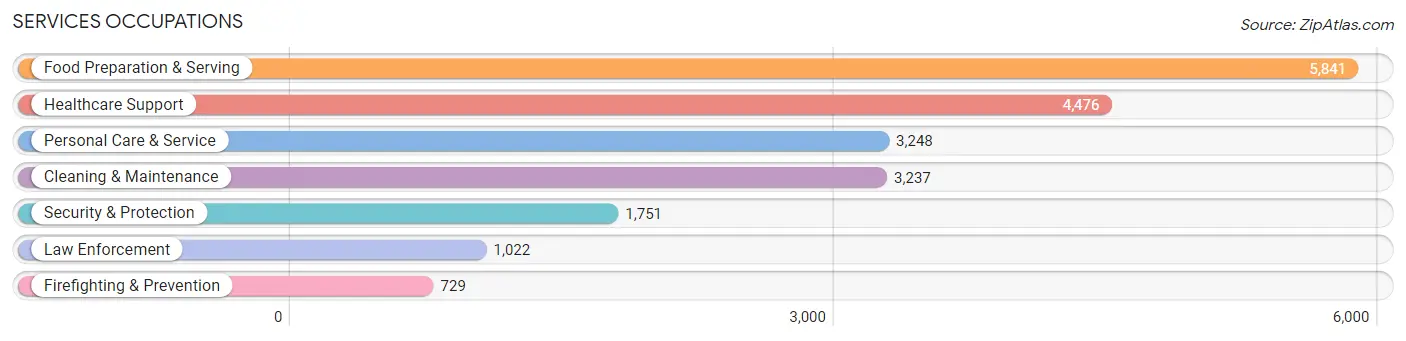
Services Occupations
The most common Services occupations in York County are Food Preparation & Serving (5,841 | 5.2%), Healthcare Support (4,476 | 4.0%), Personal Care & Service (3,248 | 2.9%), Cleaning & Maintenance (3,237 | 2.9%), and Security & Protection (1,751 | 1.5%).
Services Occupations by Sex
Within the Services occupations in York County, the most male-oriented occupations are Law Enforcement (89.0%), Security & Protection (83.3%), and Firefighting & Prevention (75.2%), while the most female-oriented occupations are Healthcare Support (88.2%), Personal Care & Service (80.3%), and Food Preparation & Serving (59.4%).
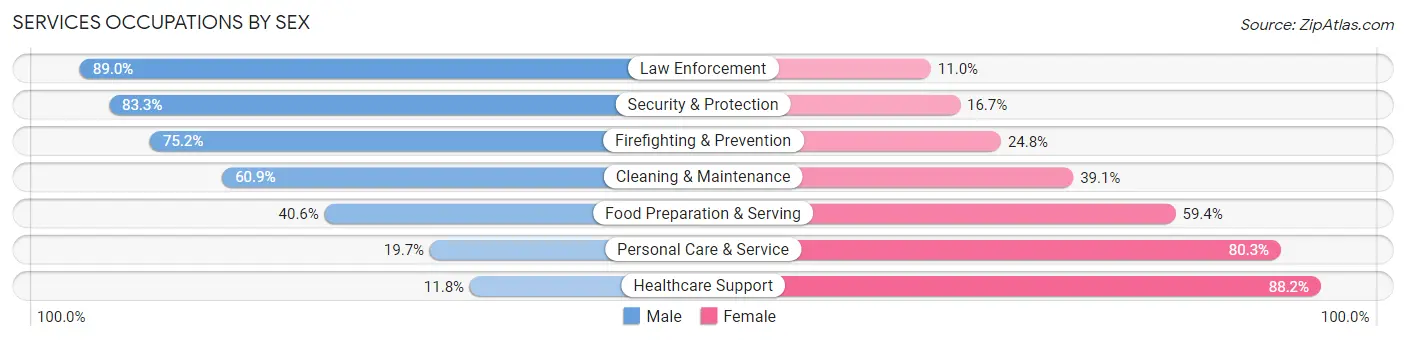
| Occupation | Male | Female |
| Healthcare Support | 529 (11.8%) | 3,947 (88.2%) |
| Security & Protection | 1,458 (83.3%) | 293 (16.7%) |
| Firefighting & Prevention | 548 (75.2%) | 181 (24.8%) |
| Law Enforcement | 910 (89.0%) | 112 (11.0%) |
| Food Preparation & Serving | 2,371 (40.6%) | 3,470 (59.4%) |
| Cleaning & Maintenance | 1,970 (60.9%) | 1,267 (39.1%) |
| Personal Care & Service | 641 (19.7%) | 2,607 (80.3%) |
| Total (Category) | 6,969 (37.6%) | 11,584 (62.4%) |
| Total (Overall) | 58,737 (52.1%) | 53,999 (47.9%) |
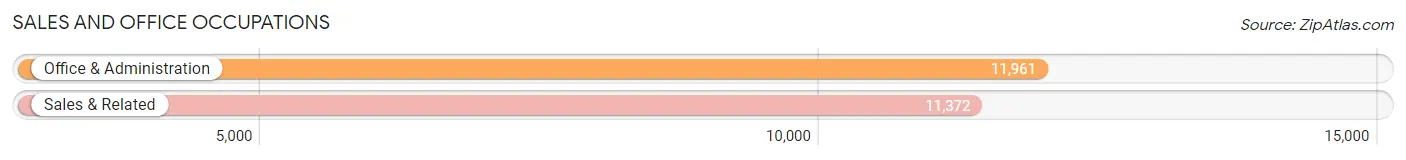
Sales and Office Occupations
The most common Sales and Office occupations in York County are Office & Administration (11,961 | 10.6%), and Sales & Related (11,372 | 10.1%).
Sales and Office Occupations by Sex
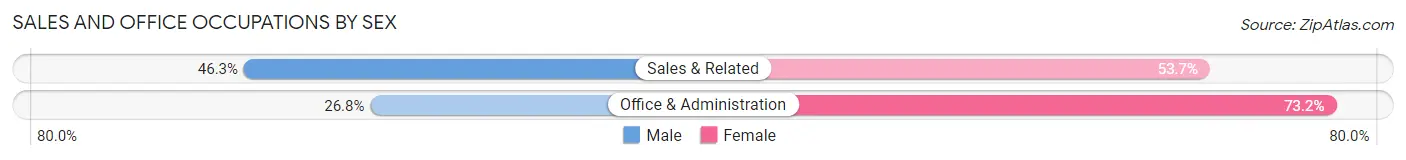
| Occupation | Male | Female |
| Sales & Related | 5,262 (46.3%) | 6,110 (53.7%) |
| Office & Administration | 3,208 (26.8%) | 8,753 (73.2%) |
| Total (Category) | 8,470 (36.3%) | 14,863 (63.7%) |
| Total (Overall) | 58,737 (52.1%) | 53,999 (47.9%) |
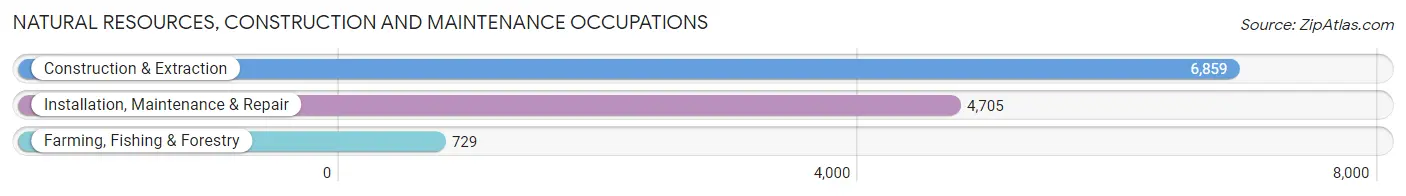
Natural Resources, Construction and Maintenance Occupations
The most common Natural Resources, Construction and Maintenance occupations in York County are Construction & Extraction (6,859 | 6.1%), Installation, Maintenance & Repair (4,705 | 4.2%), and Farming, Fishing & Forestry (729 | 0.6%).
Natural Resources, Construction and Maintenance Occupations by Sex
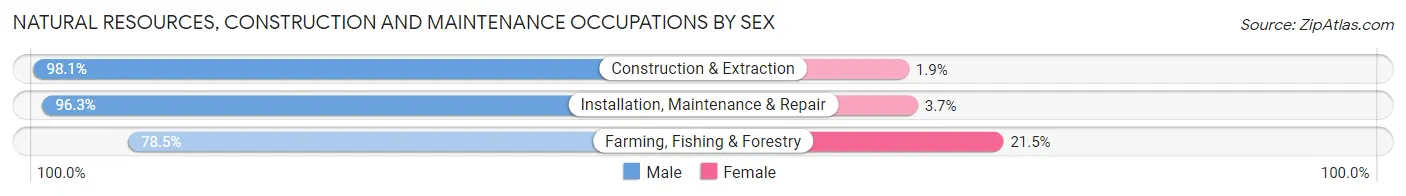
| Occupation | Male | Female |
| Farming, Fishing & Forestry | 572 (78.5%) | 157 (21.5%) |
| Construction & Extraction | 6,731 (98.1%) | 128 (1.9%) |
| Installation, Maintenance & Repair | 4,530 (96.3%) | 175 (3.7%) |
| Total (Category) | 11,833 (96.3%) | 460 (3.7%) |
| Total (Overall) | 58,737 (52.1%) | 53,999 (47.9%) |
Production, Transportation and Moving Occupations
The most common Production, Transportation and Moving occupations in York County are Production (7,176 | 6.4%), Transportation (3,987 | 3.5%), and Material Moving (3,439 | 3.0%).
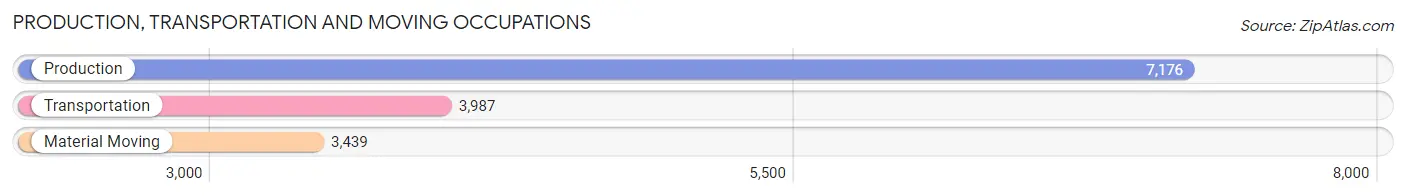
Production, Transportation and Moving Occupations by Sex
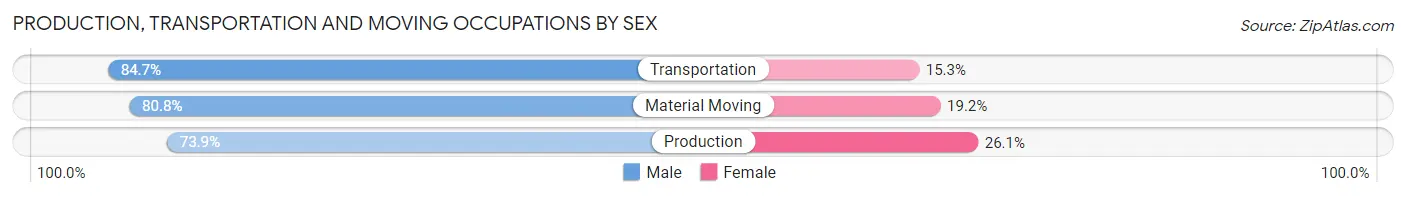
| Occupation | Male | Female |
| Production | 5,303 (73.9%) | 1,873 (26.1%) |
| Transportation | 3,378 (84.7%) | 609 (15.3%) |
| Material Moving | 2,779 (80.8%) | 660 (19.2%) |
| Total (Category) | 11,460 (78.5%) | 3,142 (21.5%) |
| Total (Overall) | 58,737 (52.1%) | 53,999 (47.9%) |
Employment Industries by Sex in York County
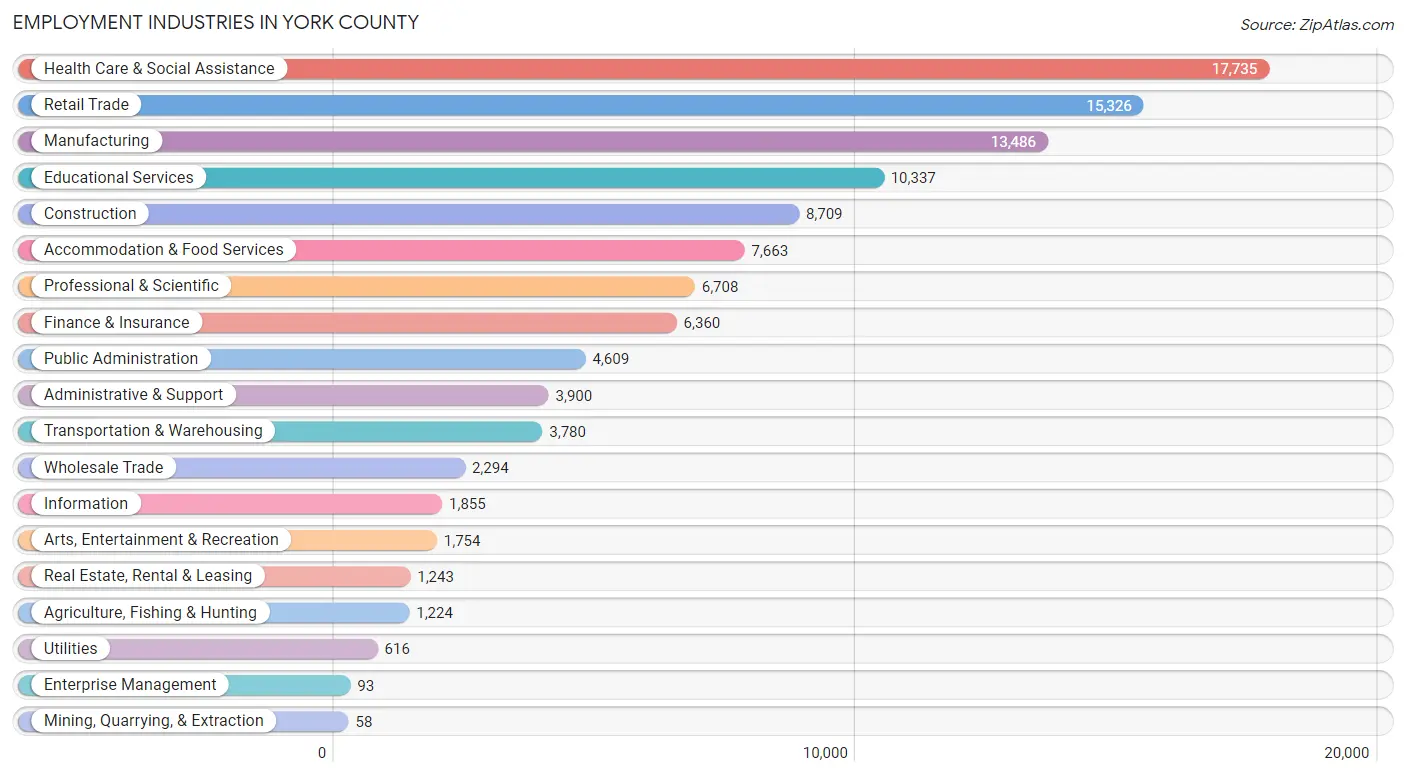
Employment Industries in York County
The major employment industries in York County include Health Care & Social Assistance (17,735 | 15.7%), Retail Trade (15,326 | 13.6%), Manufacturing (13,486 | 12.0%), Educational Services (10,337 | 9.2%), and Construction (8,709 | 7.7%).
Employment Industries by Sex in York County
The York County industries that see more men than women are Mining, Quarrying, & Extraction (94.8%), Utilities (91.1%), and Construction (90.7%), whereas the industries that tend to have a higher number of women are Enterprise Management (83.9%), Health Care & Social Assistance (81.2%), and Educational Services (69.5%).
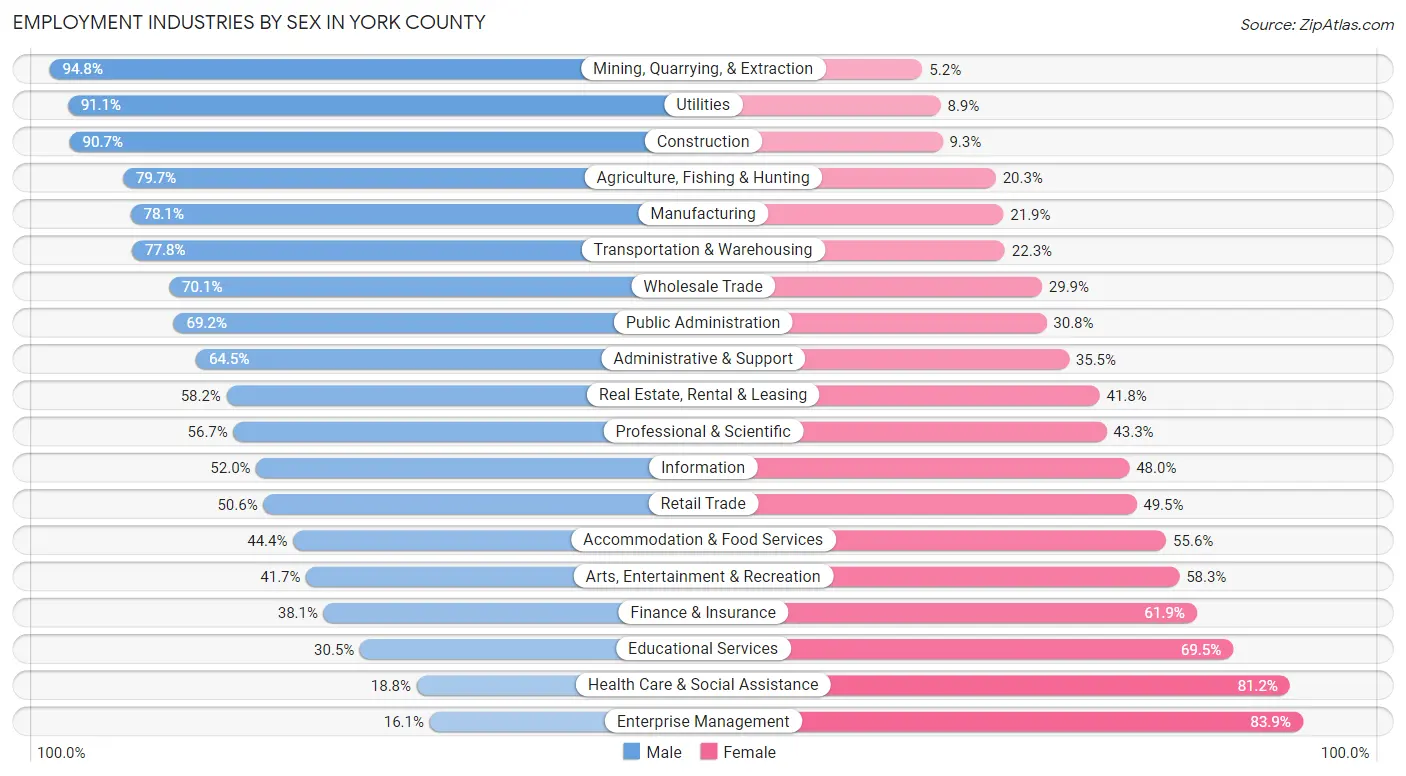
| Industry | Male | Female |
| Agriculture, Fishing & Hunting | 975 (79.7%) | 249 (20.3%) |
| Mining, Quarrying, & Extraction | 55 (94.8%) | 3 (5.2%) |
| Construction | 7,897 (90.7%) | 812 (9.3%) |
| Manufacturing | 10,529 (78.1%) | 2,957 (21.9%) |
| Wholesale Trade | 1,608 (70.1%) | 686 (29.9%) |
| Retail Trade | 7,748 (50.5%) | 7,578 (49.4%) |
| Transportation & Warehousing | 2,939 (77.7%) | 841 (22.3%) |
| Utilities | 561 (91.1%) | 55 (8.9%) |
| Information | 965 (52.0%) | 890 (48.0%) |
| Finance & Insurance | 2,421 (38.1%) | 3,939 (61.9%) |
| Real Estate, Rental & Leasing | 723 (58.2%) | 520 (41.8%) |
| Professional & Scientific | 3,806 (56.7%) | 2,902 (43.3%) |
| Enterprise Management | 15 (16.1%) | 78 (83.9%) |
| Administrative & Support | 2,516 (64.5%) | 1,384 (35.5%) |
| Educational Services | 3,157 (30.5%) | 7,180 (69.5%) |
| Health Care & Social Assistance | 3,336 (18.8%) | 14,399 (81.2%) |
| Arts, Entertainment & Recreation | 731 (41.7%) | 1,023 (58.3%) |
| Accommodation & Food Services | 3,401 (44.4%) | 4,262 (55.6%) |
| Public Administration | 3,188 (69.2%) | 1,421 (30.8%) |
| Total | 58,737 (52.1%) | 53,999 (47.9%) |
Education in York County
School Enrollment in York County
The most common levels of schooling among the 40,639 students in York County are high school (9,651 | 23.7%), elementary school (8,815 | 21.7%), and middle school (8,586 | 21.1%).
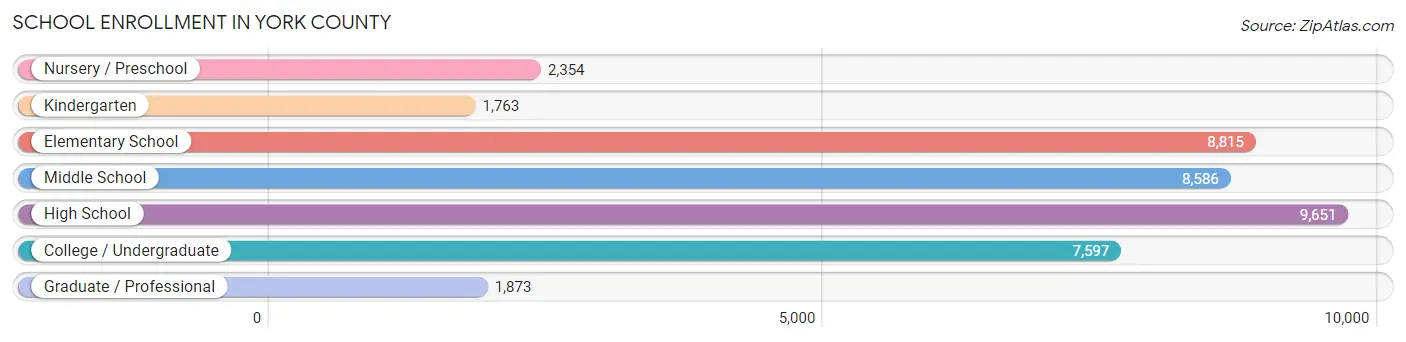
| School Level | # Students | % Students |
| Nursery / Preschool | 2,354 | 5.8% |
| Kindergarten | 1,763 | 4.3% |
| Elementary School | 8,815 | 21.7% |
| Middle School | 8,586 | 21.1% |
| High School | 9,651 | 23.7% |
| College / Undergraduate | 7,597 | 18.7% |
| Graduate / Professional | 1,873 | 4.6% |
| Total | 40,639 | 100.0% |
School Enrollment by Age by Funding Source in York County
Out of a total of 40,639 students who are enrolled in schools in York County, 8,290 (20.4%) attend a private institution, while the remaining 32,349 (79.6%) are enrolled in public schools. The age group of 3 to 4 year olds has the highest likelihood of being enrolled in private schools, with 848 (50.1% in the age bracket) enrolled. Conversely, the age group of 10 to 14 year olds has the lowest likelihood of being enrolled in a private school, with 10,130 (91.5% in the age bracket) attending a public institution.
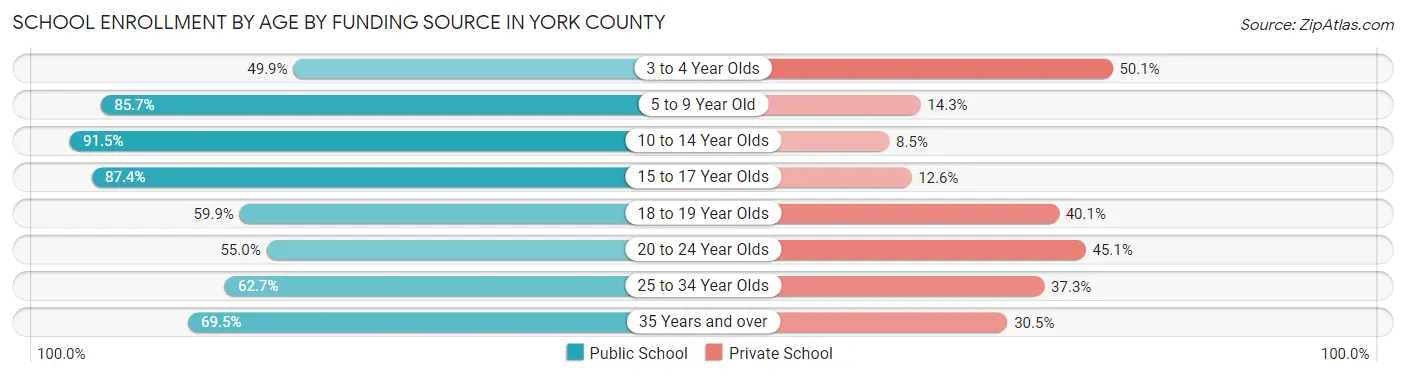
| Age Bracket | Public School | Private School |
| 3 to 4 Year Olds | 846 (49.9%) | 848 (50.1%) |
| 5 to 9 Year Old | 8,593 (85.7%) | 1,433 (14.3%) |
| 10 to 14 Year Olds | 10,130 (91.5%) | 937 (8.5%) |
| 15 to 17 Year Olds | 6,226 (87.4%) | 896 (12.6%) |
| 18 to 19 Year Olds | 1,631 (59.9%) | 1,090 (40.1%) |
| 20 to 24 Year Olds | 1,777 (54.9%) | 1,457 (45.1%) |
| 25 to 34 Year Olds | 1,495 (62.7%) | 891 (37.3%) |
| 35 Years and over | 1,661 (69.5%) | 728 (30.5%) |
| Total | 32,349 (79.6%) | 8,290 (20.4%) |
Educational Attainment by Field of Study in York County
Business (9,152 | 16.1%), education (7,667 | 13.5%), science & technology (5,691 | 10.0%), social sciences (5,145 | 9.0%), and bio, nature & agricultural (3,803 | 6.7%) are the most common fields of study among 57,023 individuals in York County who have obtained a bachelor's degree or higher.
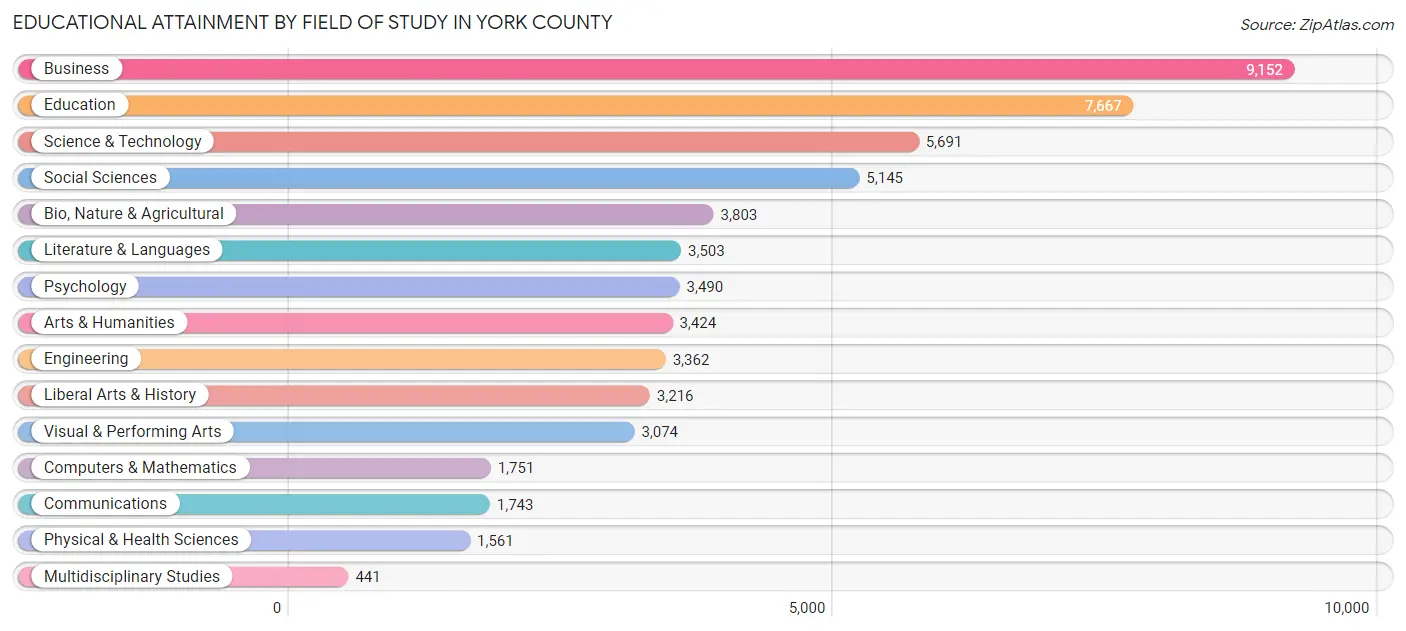
| Field of Study | # Graduates | % Graduates |
| Computers & Mathematics | 1,751 | 3.1% |
| Bio, Nature & Agricultural | 3,803 | 6.7% |
| Physical & Health Sciences | 1,561 | 2.7% |
| Psychology | 3,490 | 6.1% |
| Social Sciences | 5,145 | 9.0% |
| Engineering | 3,362 | 5.9% |
| Multidisciplinary Studies | 441 | 0.8% |
| Science & Technology | 5,691 | 10.0% |
| Business | 9,152 | 16.1% |
| Education | 7,667 | 13.5% |
| Literature & Languages | 3,503 | 6.1% |
| Liberal Arts & History | 3,216 | 5.6% |
| Visual & Performing Arts | 3,074 | 5.4% |
| Communications | 1,743 | 3.1% |
| Arts & Humanities | 3,424 | 6.0% |
| Total | 57,023 | 100.0% |
Transportation & Commute in York County
Vehicle Availability by Sex in York County
The most prevalent vehicle ownership categories in York County are males with 2 vehicles (25,580, accounting for 44.2%) and females with 2 vehicles (22,969, making up 48.8%).
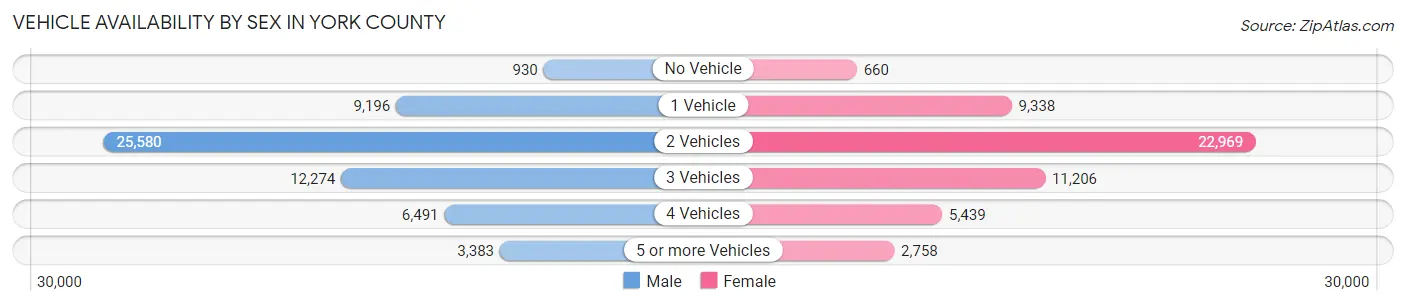
| Vehicles Available | Male | Female |
| No Vehicle | 930 (1.6%) | 660 (1.3%) |
| 1 Vehicle | 9,196 (15.9%) | 9,338 (17.8%) |
| 2 Vehicles | 25,580 (44.2%) | 22,969 (43.9%) |
| 3 Vehicles | 12,274 (21.2%) | 11,206 (21.4%) |
| 4 Vehicles | 6,491 (11.2%) | 5,439 (10.4%) |
| 5 or more Vehicles | 3,383 (5.9%) | 2,758 (5.3%) |
| Total | 57,854 (100.0%) | 52,370 (100.0%) |
Commute Time in York County
The most frequently occuring commute durations in York County are 20 to 24 minutes (14,102 commuters, 14.5%), 30 to 34 minutes (13,247 commuters, 13.7%), and 15 to 19 minutes (12,263 commuters, 12.7%).
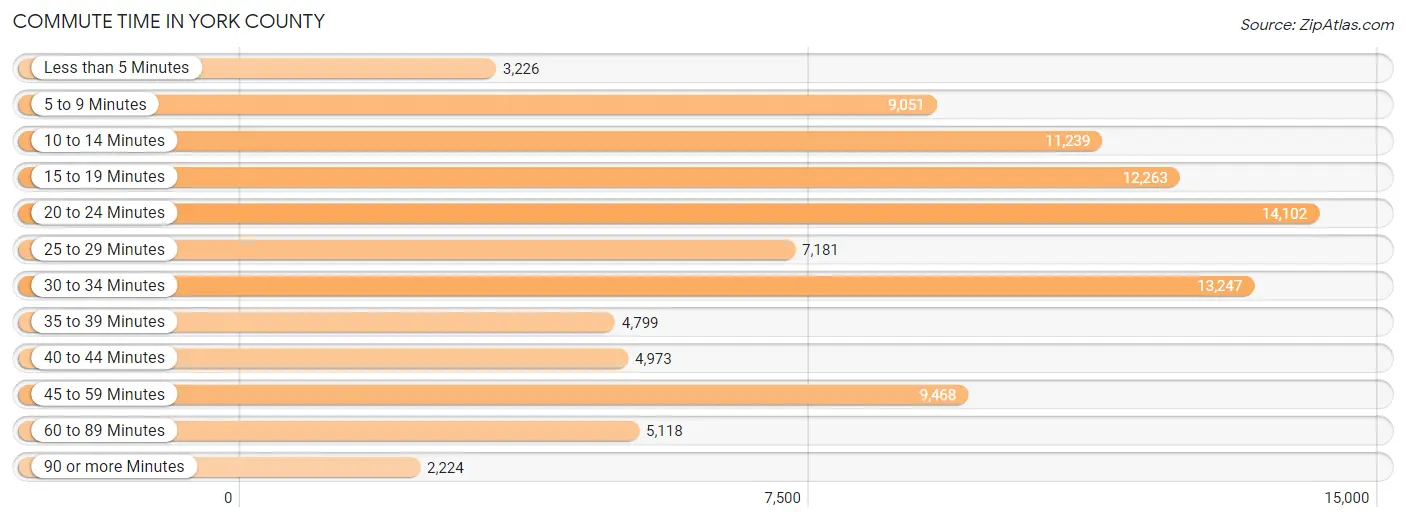
| Commute Time | # Commuters | % Commuters |
| Less than 5 Minutes | 3,226 | 3.3% |
| 5 to 9 Minutes | 9,051 | 9.3% |
| 10 to 14 Minutes | 11,239 | 11.6% |
| 15 to 19 Minutes | 12,263 | 12.7% |
| 20 to 24 Minutes | 14,102 | 14.5% |
| 25 to 29 Minutes | 7,181 | 7.4% |
| 30 to 34 Minutes | 13,247 | 13.7% |
| 35 to 39 Minutes | 4,799 | 5.0% |
| 40 to 44 Minutes | 4,973 | 5.1% |
| 45 to 59 Minutes | 9,468 | 9.8% |
| 60 to 89 Minutes | 5,118 | 5.3% |
| 90 or more Minutes | 2,224 | 2.3% |
Commute Time by Sex in York County
The most common commute times in York County are 20 to 24 minutes (7,872 commuters, 15.4%) for males and 30 to 34 minutes (6,427 commuters, 14.1%) for females.
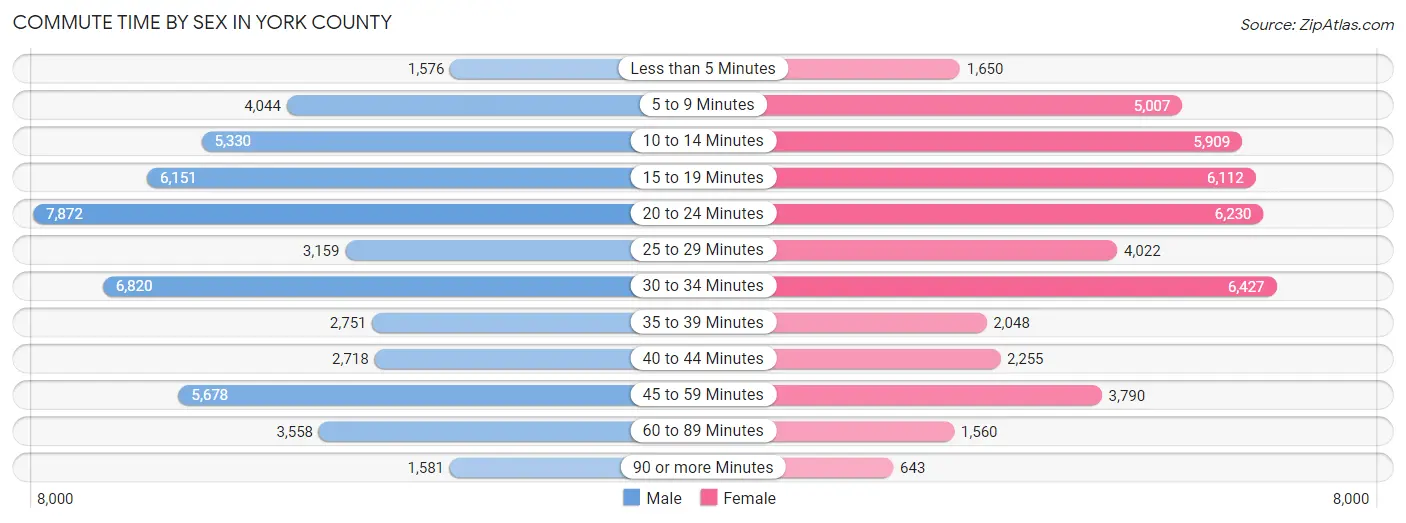
| Commute Time | Male | Female |
| Less than 5 Minutes | 1,576 (3.1%) | 1,650 (3.6%) |
| 5 to 9 Minutes | 4,044 (7.9%) | 5,007 (11.0%) |
| 10 to 14 Minutes | 5,330 (10.4%) | 5,909 (12.9%) |
| 15 to 19 Minutes | 6,151 (12.0%) | 6,112 (13.4%) |
| 20 to 24 Minutes | 7,872 (15.4%) | 6,230 (13.7%) |
| 25 to 29 Minutes | 3,159 (6.2%) | 4,022 (8.8%) |
| 30 to 34 Minutes | 6,820 (13.3%) | 6,427 (14.1%) |
| 35 to 39 Minutes | 2,751 (5.4%) | 2,048 (4.5%) |
| 40 to 44 Minutes | 2,718 (5.3%) | 2,255 (4.9%) |
| 45 to 59 Minutes | 5,678 (11.1%) | 3,790 (8.3%) |
| 60 to 89 Minutes | 3,558 (6.9%) | 1,560 (3.4%) |
| 90 or more Minutes | 1,581 (3.1%) | 643 (1.4%) |
Time of Departure to Work by Sex in York County
The most frequent times of departure to work in York County are 6:30 AM to 6:59 AM (7,017, 13.7%) for males and 7:00 AM to 7:29 AM (8,476, 18.6%) for females.
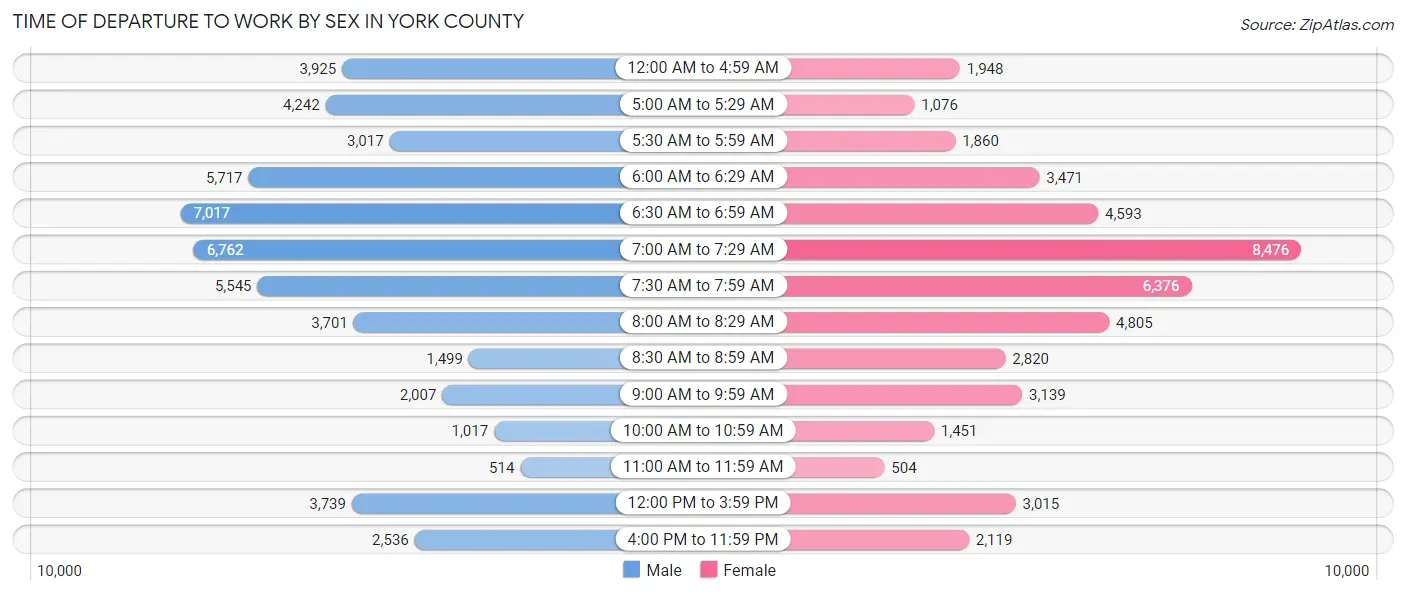
| Time of Departure | Male | Female |
| 12:00 AM to 4:59 AM | 3,925 (7.7%) | 1,948 (4.3%) |
| 5:00 AM to 5:29 AM | 4,242 (8.3%) | 1,076 (2.4%) |
| 5:30 AM to 5:59 AM | 3,017 (5.9%) | 1,860 (4.1%) |
| 6:00 AM to 6:29 AM | 5,717 (11.2%) | 3,471 (7.6%) |
| 6:30 AM to 6:59 AM | 7,017 (13.7%) | 4,593 (10.1%) |
| 7:00 AM to 7:29 AM | 6,762 (13.2%) | 8,476 (18.6%) |
| 7:30 AM to 7:59 AM | 5,545 (10.8%) | 6,376 (14.0%) |
| 8:00 AM to 8:29 AM | 3,701 (7.2%) | 4,805 (10.5%) |
| 8:30 AM to 8:59 AM | 1,499 (2.9%) | 2,820 (6.2%) |
| 9:00 AM to 9:59 AM | 2,007 (3.9%) | 3,139 (6.9%) |
| 10:00 AM to 10:59 AM | 1,017 (2.0%) | 1,451 (3.2%) |
| 11:00 AM to 11:59 AM | 514 (1.0%) | 504 (1.1%) |
| 12:00 PM to 3:59 PM | 3,739 (7.3%) | 3,015 (6.6%) |
| 4:00 PM to 11:59 PM | 2,536 (5.0%) | 2,119 (4.6%) |
| Total | 51,238 (100.0%) | 45,653 (100.0%) |
Housing Occupancy in York County
Occupancy by Ownership in York County
Of the total 89,404 dwellings in York County, owner-occupied units account for 67,158 (75.1%), while renter-occupied units make up 22,246 (24.9%).
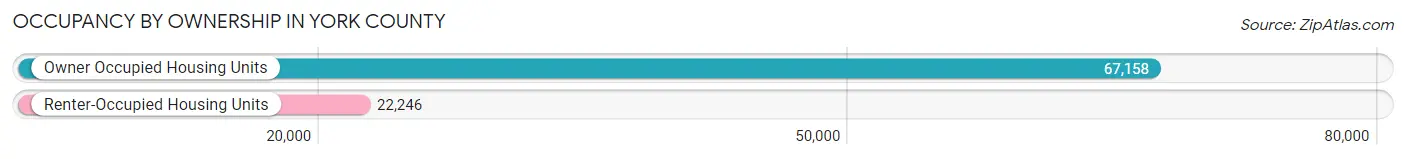
| Occupancy | # Housing Units | % Housing Units |
| Owner Occupied Housing Units | 67,158 | 75.1% |
| Renter-Occupied Housing Units | 22,246 | 24.9% |
| Total Occupied Housing Units | 89,404 | 100.0% |
Occupancy by Household Size in York County
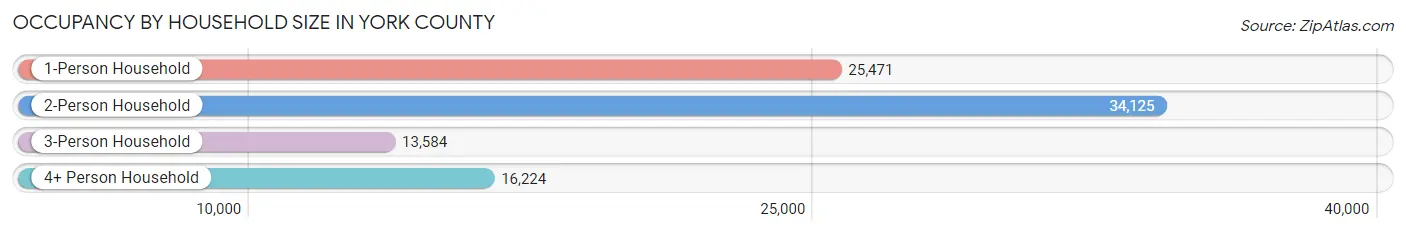
| Household Size | # Housing Units | % Housing Units |
| 1-Person Household | 25,471 | 28.5% |
| 2-Person Household | 34,125 | 38.2% |
| 3-Person Household | 13,584 | 15.2% |
| 4+ Person Household | 16,224 | 18.1% |
| Total Housing Units | 89,404 | 100.0% |
Occupancy by Ownership by Household Size in York County
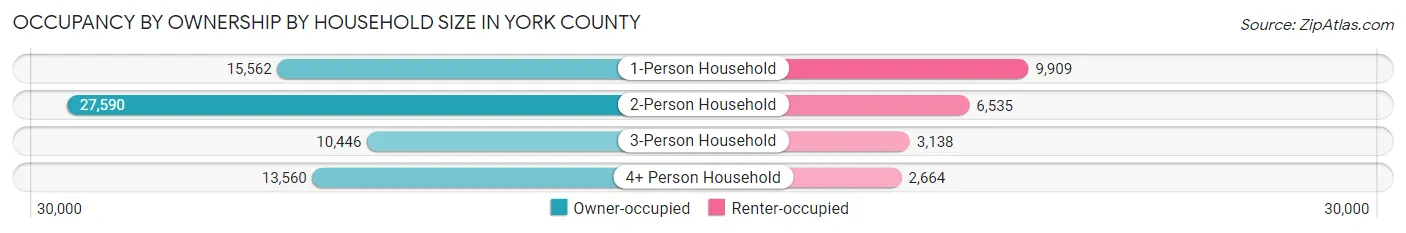
| Household Size | Owner-occupied | Renter-occupied |
| 1-Person Household | 15,562 (61.1%) | 9,909 (38.9%) |
| 2-Person Household | 27,590 (80.8%) | 6,535 (19.2%) |
| 3-Person Household | 10,446 (76.9%) | 3,138 (23.1%) |
| 4+ Person Household | 13,560 (83.6%) | 2,664 (16.4%) |
| Total Housing Units | 67,158 (75.1%) | 22,246 (24.9%) |
Occupancy by Educational Attainment in York County
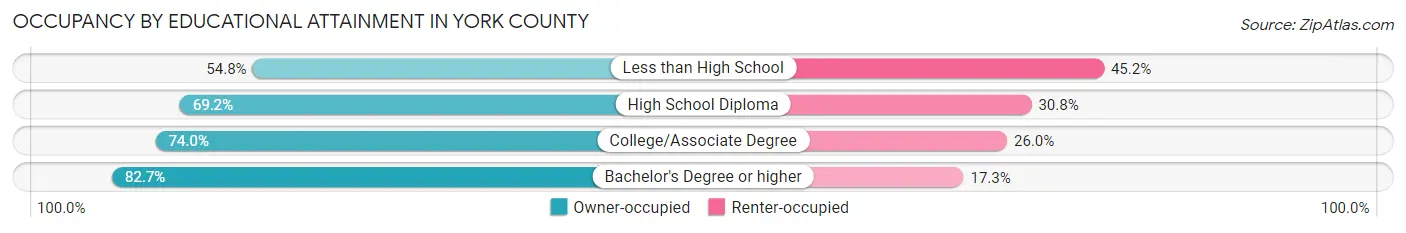
| Household Size | Owner-occupied | Renter-occupied |
| Less than High School | 2,009 (54.8%) | 1,655 (45.2%) |
| High School Diploma | 16,212 (69.2%) | 7,212 (30.8%) |
| College/Associate Degree | 22,155 (74.0%) | 7,767 (26.0%) |
| Bachelor's Degree or higher | 26,782 (82.7%) | 5,612 (17.3%) |
Occupancy by Age of Householder in York County
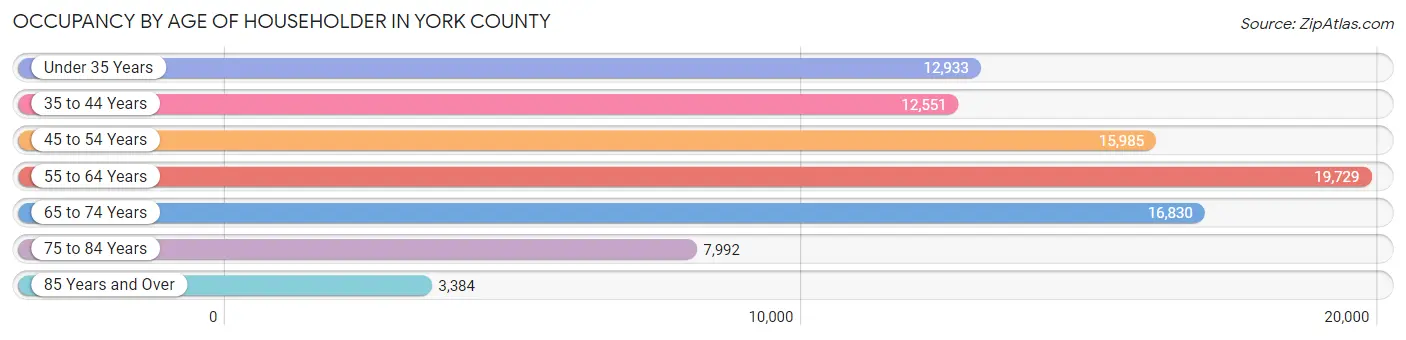
| Age Bracket | # Households | % Households |
| Under 35 Years | 12,933 | 14.5% |
| 35 to 44 Years | 12,551 | 14.0% |
| 45 to 54 Years | 15,985 | 17.9% |
| 55 to 64 Years | 19,729 | 22.1% |
| 65 to 74 Years | 16,830 | 18.8% |
| 75 to 84 Years | 7,992 | 8.9% |
| 85 Years and Over | 3,384 | 3.8% |
| Total | 89,404 | 100.0% |
Housing Finances in York County
Median Income by Occupancy in York County
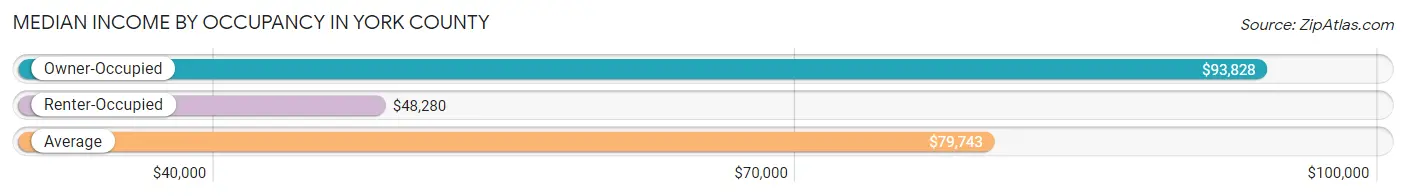
| Occupancy Type | # Households | Median Income |
| Owner-Occupied | 67,158 (75.1%) | $93,828 |
| Renter-Occupied | 22,246 (24.9%) | $48,280 |
| Average | 89,404 (100.0%) | $79,743 |
Occupancy by Householder Income Bracket in York County
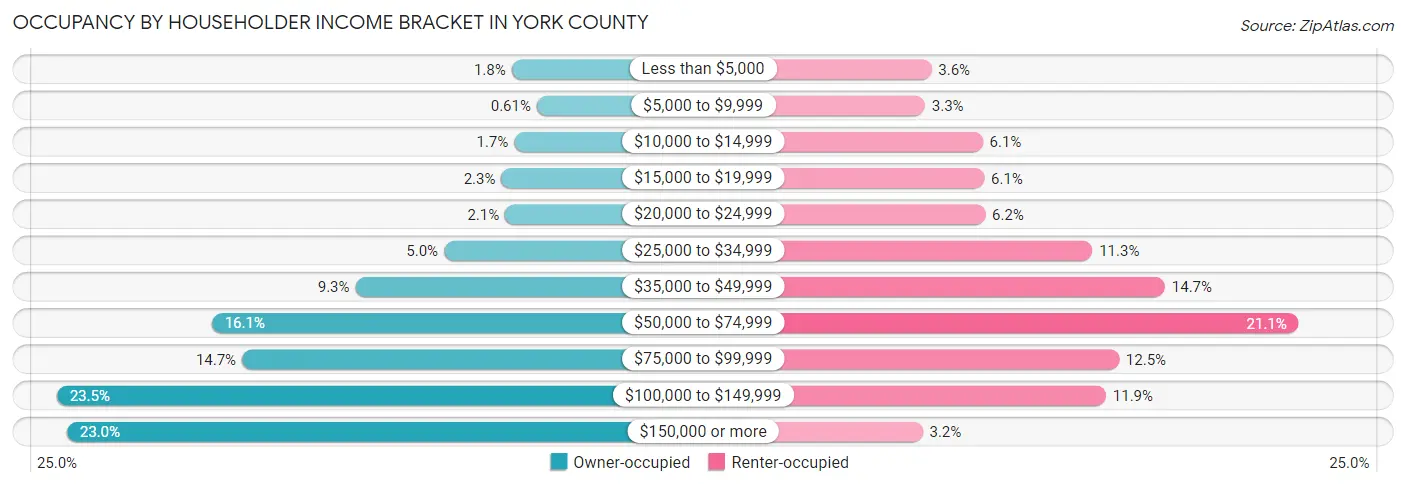
| Income Bracket | Owner-occupied | Renter-occupied |
| Less than $5,000 | 1,214 (1.8%) | 802 (3.6%) |
| $5,000 to $9,999 | 412 (0.6%) | 734 (3.3%) |
| $10,000 to $14,999 | 1,132 (1.7%) | 1,346 (6.0%) |
| $15,000 to $19,999 | 1,547 (2.3%) | 1,362 (6.1%) |
| $20,000 to $24,999 | 1,423 (2.1%) | 1,373 (6.2%) |
| $25,000 to $34,999 | 3,376 (5.0%) | 2,507 (11.3%) |
| $35,000 to $49,999 | 6,212 (9.2%) | 3,277 (14.7%) |
| $50,000 to $74,999 | 10,803 (16.1%) | 4,695 (21.1%) |
| $75,000 to $99,999 | 9,836 (14.6%) | 2,789 (12.5%) |
| $100,000 to $149,999 | 15,762 (23.5%) | 2,651 (11.9%) |
| $150,000 or more | 15,441 (23.0%) | 710 (3.2%) |
| Total | 67,158 (100.0%) | 22,246 (100.0%) |
Monthly Housing Cost Tiers in York County
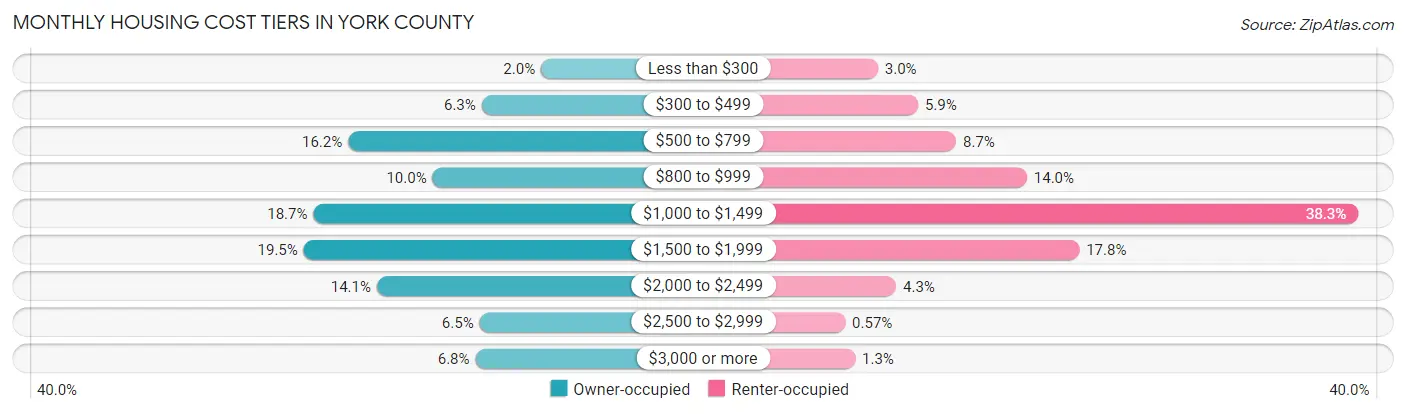
| Monthly Cost | Owner-occupied | Renter-occupied |
| Less than $300 | 1,325 (2.0%) | 664 (3.0%) |
| $300 to $499 | 4,255 (6.3%) | 1,319 (5.9%) |
| $500 to $799 | 10,864 (16.2%) | 1,944 (8.7%) |
| $800 to $999 | 6,686 (10.0%) | 3,104 (14.0%) |
| $1,000 to $1,499 | 12,587 (18.7%) | 8,529 (38.3%) |
| $1,500 to $1,999 | 13,062 (19.5%) | 3,961 (17.8%) |
| $2,000 to $2,499 | 9,445 (14.1%) | 961 (4.3%) |
| $2,500 to $2,999 | 4,365 (6.5%) | 127 (0.6%) |
| $3,000 or more | 4,569 (6.8%) | 289 (1.3%) |
| Total | 67,158 (100.0%) | 22,246 (100.0%) |
Physical Housing Characteristics in York County
Housing Structures in York County
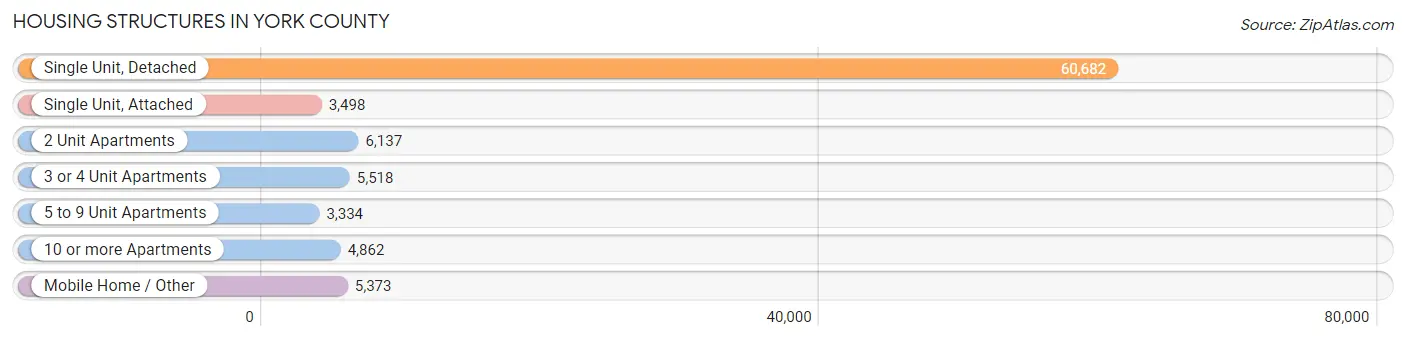
| Structure Type | # Housing Units | % Housing Units |
| Single Unit, Detached | 60,682 | 67.9% |
| Single Unit, Attached | 3,498 | 3.9% |
| 2 Unit Apartments | 6,137 | 6.9% |
| 3 or 4 Unit Apartments | 5,518 | 6.2% |
| 5 to 9 Unit Apartments | 3,334 | 3.7% |
| 10 or more Apartments | 4,862 | 5.4% |
| Mobile Home / Other | 5,373 | 6.0% |
| Total | 89,404 | 100.0% |
Housing Structures by Occupancy in York County
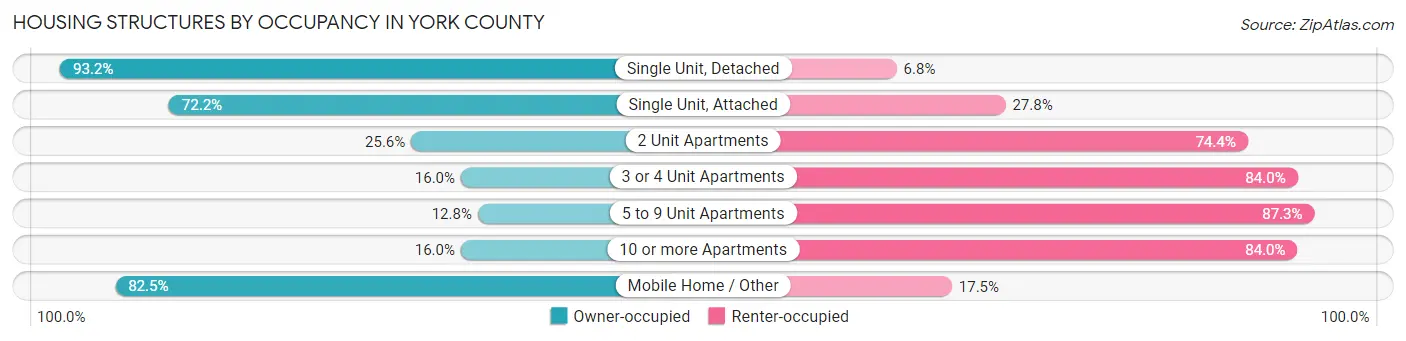
| Structure Type | Owner-occupied | Renter-occupied |
| Single Unit, Detached | 56,540 (93.2%) | 4,142 (6.8%) |
| Single Unit, Attached | 2,526 (72.2%) | 972 (27.8%) |
| 2 Unit Apartments | 1,570 (25.6%) | 4,567 (74.4%) |
| 3 or 4 Unit Apartments | 883 (16.0%) | 4,635 (84.0%) |
| 5 to 9 Unit Apartments | 425 (12.8%) | 2,909 (87.3%) |
| 10 or more Apartments | 779 (16.0%) | 4,083 (84.0%) |
| Mobile Home / Other | 4,435 (82.5%) | 938 (17.5%) |
| Total | 67,158 (75.1%) | 22,246 (24.9%) |
Housing Structures by Number of Rooms in York County
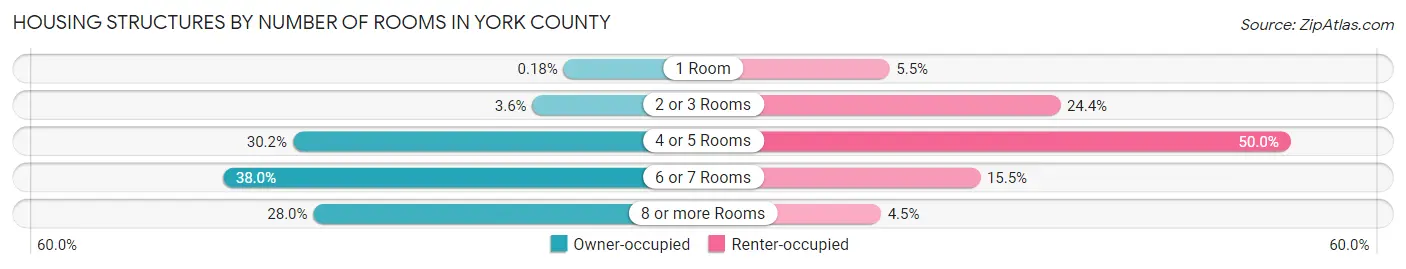
| Number of Rooms | Owner-occupied | Renter-occupied |
| 1 Room | 123 (0.2%) | 1,222 (5.5%) |
| 2 or 3 Rooms | 2,446 (3.6%) | 5,432 (24.4%) |
| 4 or 5 Rooms | 20,302 (30.2%) | 11,128 (50.0%) |
| 6 or 7 Rooms | 25,517 (38.0%) | 3,457 (15.5%) |
| 8 or more Rooms | 18,770 (28.0%) | 1,007 (4.5%) |
| Total | 67,158 (100.0%) | 22,246 (100.0%) |
Housing Structure by Heating Type in York County
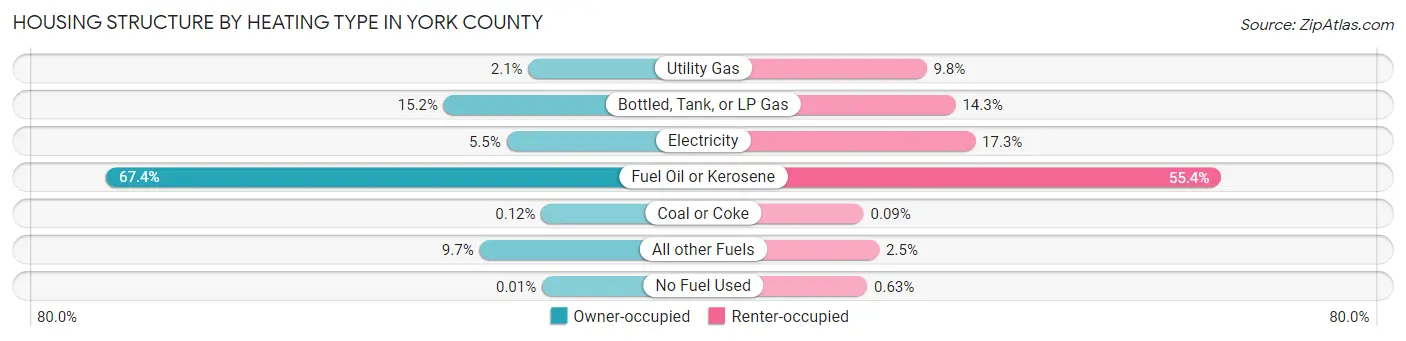
| Heating Type | Owner-occupied | Renter-occupied |
| Utility Gas | 1,416 (2.1%) | 2,183 (9.8%) |
| Bottled, Tank, or LP Gas | 10,199 (15.2%) | 3,179 (14.3%) |
| Electricity | 3,697 (5.5%) | 3,856 (17.3%) |
| Fuel Oil or Kerosene | 45,258 (67.4%) | 12,314 (55.3%) |
| Coal or Coke | 78 (0.1%) | 20 (0.1%) |
| All other Fuels | 6,504 (9.7%) | 553 (2.5%) |
| No Fuel Used | 6 (0.0%) | 141 (0.6%) |
| Total | 67,158 (100.0%) | 22,246 (100.0%) |
Household Vehicle Usage in York County
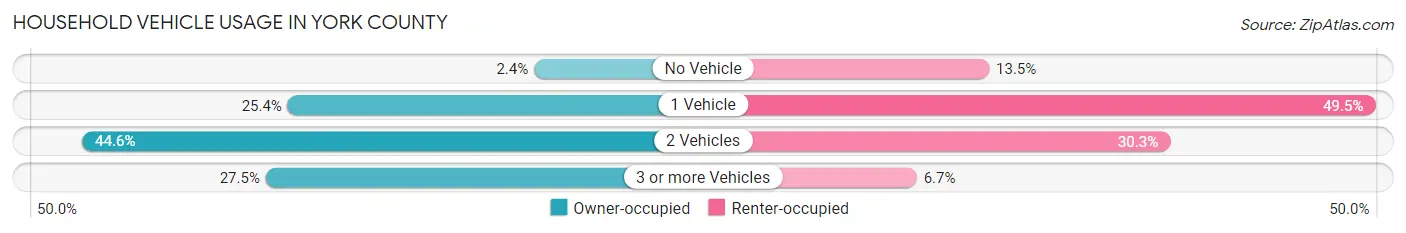
| Vehicles per Household | Owner-occupied | Renter-occupied |
| No Vehicle | 1,642 (2.4%) | 2,994 (13.5%) |
| 1 Vehicle | 17,086 (25.4%) | 11,012 (49.5%) |
| 2 Vehicles | 29,970 (44.6%) | 6,750 (30.3%) |
| 3 or more Vehicles | 18,460 (27.5%) | 1,490 (6.7%) |
| Total | 67,158 (100.0%) | 22,246 (100.0%) |
Real Estate & Mortgages in York County
Real Estate and Mortgage Overview in York County
| Characteristic | Without Mortgage | With Mortgage |
| Housing Units | 23,467 | 43,691 |
| Median Property Value | $319,800 | $325,100 |
| Median Household Income | $66,143 | $11,919 |
| Monthly Housing Costs | $683 | $4,508 |
| Real Estate Taxes | $3,475 | $276 |
Property Value by Mortgage Status in York County
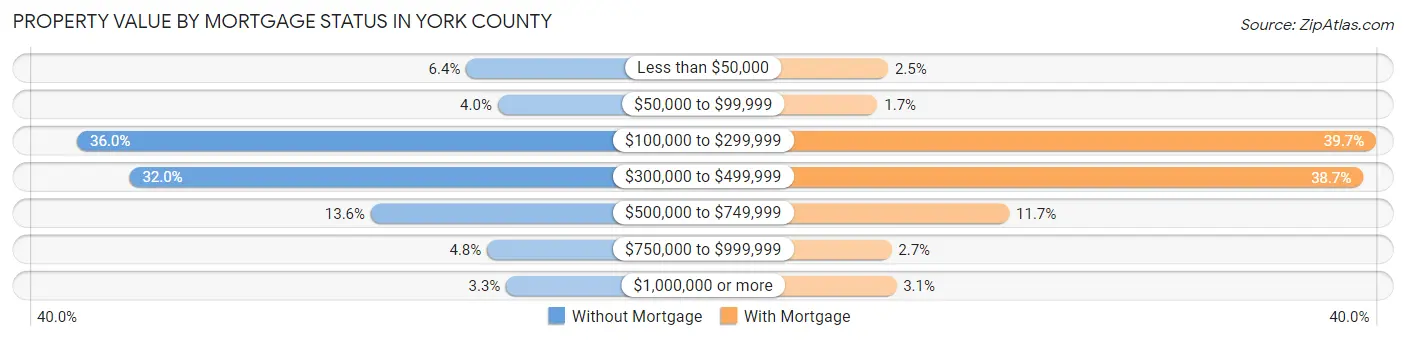
| Property Value | Without Mortgage | With Mortgage |
| Less than $50,000 | 1,489 (6.4%) | 1,080 (2.5%) |
| $50,000 to $99,999 | 928 (4.0%) | 726 (1.7%) |
| $100,000 to $299,999 | 8,449 (36.0%) | 17,326 (39.7%) |
| $300,000 to $499,999 | 7,512 (32.0%) | 16,901 (38.7%) |
| $500,000 to $749,999 | 3,197 (13.6%) | 5,112 (11.7%) |
| $750,000 to $999,999 | 1,116 (4.8%) | 1,193 (2.7%) |
| $1,000,000 or more | 776 (3.3%) | 1,353 (3.1%) |
| Total | 23,467 (100.0%) | 43,691 (100.0%) |
Household Income by Mortgage Status in York County
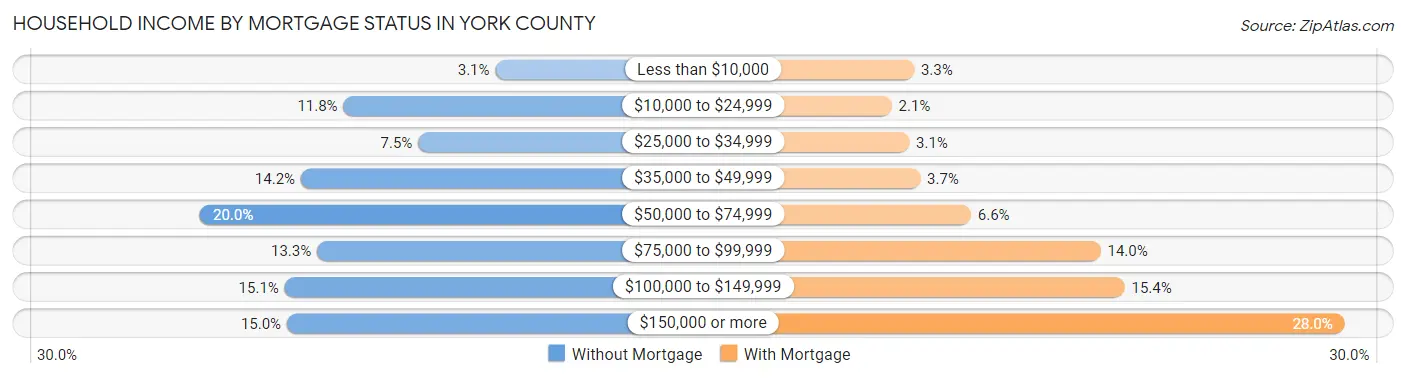
| Household Income | Without Mortgage | With Mortgage |
| Less than $10,000 | 727 (3.1%) | 1,458 (3.3%) |
| $10,000 to $24,999 | 2,764 (11.8%) | 899 (2.1%) |
| $25,000 to $34,999 | 1,763 (7.5%) | 1,338 (3.1%) |
| $35,000 to $49,999 | 3,334 (14.2%) | 1,613 (3.7%) |
| $50,000 to $74,999 | 4,686 (20.0%) | 2,878 (6.6%) |
| $75,000 to $99,999 | 3,119 (13.3%) | 6,117 (14.0%) |
| $100,000 to $149,999 | 3,552 (15.1%) | 6,717 (15.4%) |
| $150,000 or more | 3,522 (15.0%) | 12,210 (28.0%) |
| Total | 23,467 (100.0%) | 43,691 (100.0%) |
Property Value to Household Income Ratio in York County
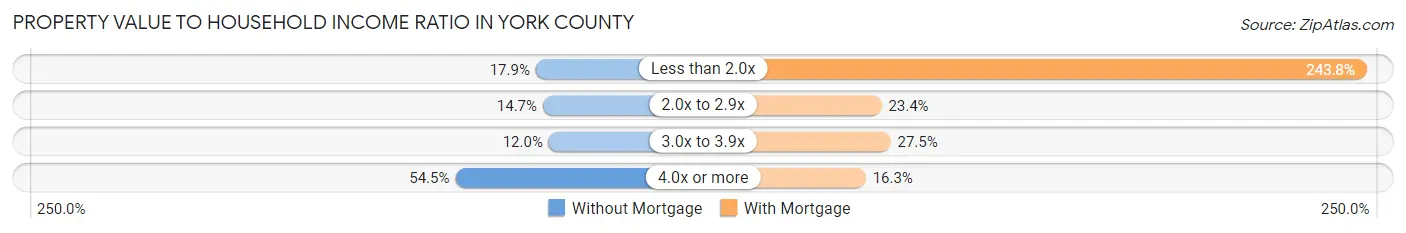
| Value-to-Income Ratio | Without Mortgage | With Mortgage |
| Less than 2.0x | 4,208 (17.9%) | 106,499 (243.8%) |
| 2.0x to 2.9x | 3,447 (14.7%) | 10,225 (23.4%) |
| 3.0x to 3.9x | 2,823 (12.0%) | 12,021 (27.5%) |
| 4.0x or more | 12,778 (54.4%) | 7,098 (16.3%) |
| Total | 23,467 (100.0%) | 43,691 (100.0%) |
Real Estate Taxes by Mortgage Status in York County
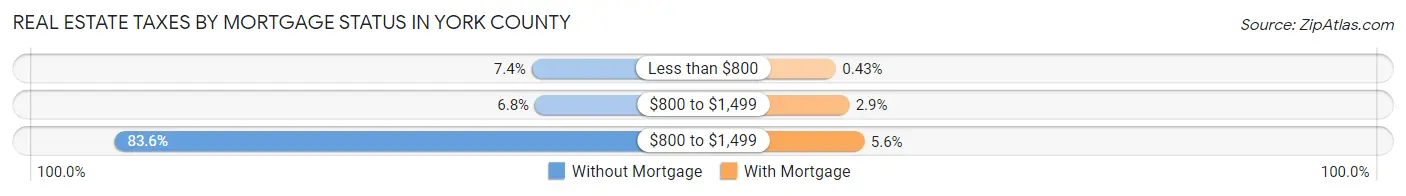
| Property Taxes | Without Mortgage | With Mortgage |
| Less than $800 | 1,741 (7.4%) | 186 (0.4%) |
| $800 to $1,499 | 1,594 (6.8%) | 1,249 (2.9%) |
| $800 to $1,499 | 19,610 (83.6%) | 2,460 (5.6%) |
| Total | 23,467 (100.0%) | 43,691 (100.0%) |
Health & Disability in York County
Health Insurance Coverage by Age in York County
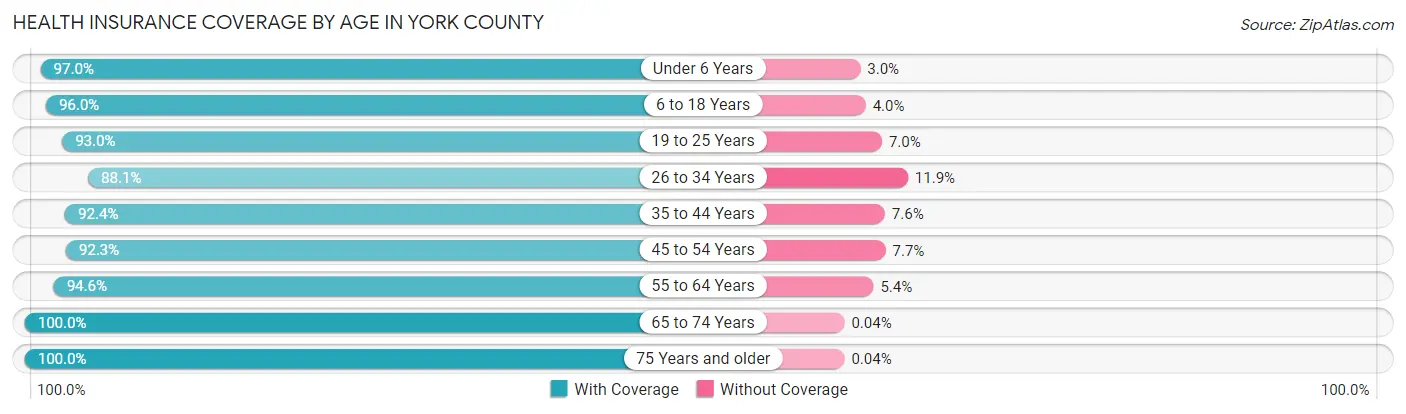
| Age Bracket | With Coverage | Without Coverage |
| Under 6 Years | 11,191 (97.0%) | 346 (3.0%) |
| 6 to 18 Years | 28,301 (96.0%) | 1,177 (4.0%) |
| 19 to 25 Years | 14,194 (93.0%) | 1,071 (7.0%) |
| 26 to 34 Years | 20,911 (88.1%) | 2,813 (11.9%) |
| 35 to 44 Years | 22,976 (92.4%) | 1,882 (7.6%) |
| 45 to 54 Years | 25,425 (92.3%) | 2,121 (7.7%) |
| 55 to 64 Years | 32,044 (94.6%) | 1,844 (5.4%) |
| 65 to 74 Years | 27,127 (100.0%) | 11 (0.0%) |
| 75 Years and older | 17,095 (100.0%) | 6 (0.0%) |
| Total | 199,264 (94.7%) | 11,271 (5.3%) |
Health Insurance Coverage by Citizenship Status in York County
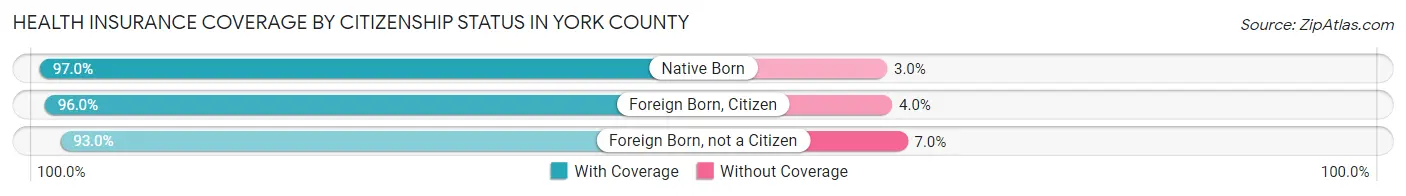
| Citizenship Status | With Coverage | Without Coverage |
| Native Born | 11,191 (97.0%) | 346 (3.0%) |
| Foreign Born, Citizen | 28,301 (96.0%) | 1,177 (4.0%) |
| Foreign Born, not a Citizen | 14,194 (93.0%) | 1,071 (7.0%) |
Health Insurance Coverage by Household Income in York County
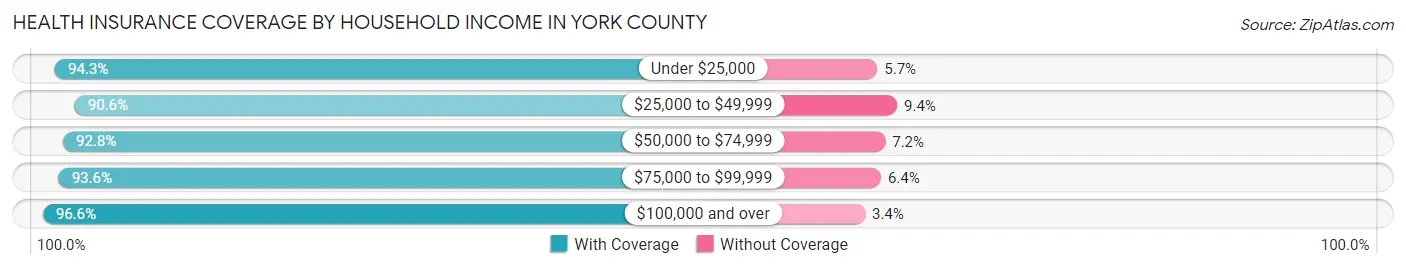
| Household Income | With Coverage | Without Coverage |
| Under $25,000 | 14,774 (94.3%) | 897 (5.7%) |
| $25,000 to $49,999 | 23,989 (90.6%) | 2,496 (9.4%) |
| $50,000 to $74,999 | 29,410 (92.8%) | 2,286 (7.2%) |
| $75,000 to $99,999 | 28,977 (93.6%) | 1,981 (6.4%) |
| $100,000 and over | 100,486 (96.6%) | 3,563 (3.4%) |
Public vs Private Health Insurance Coverage by Age in York County
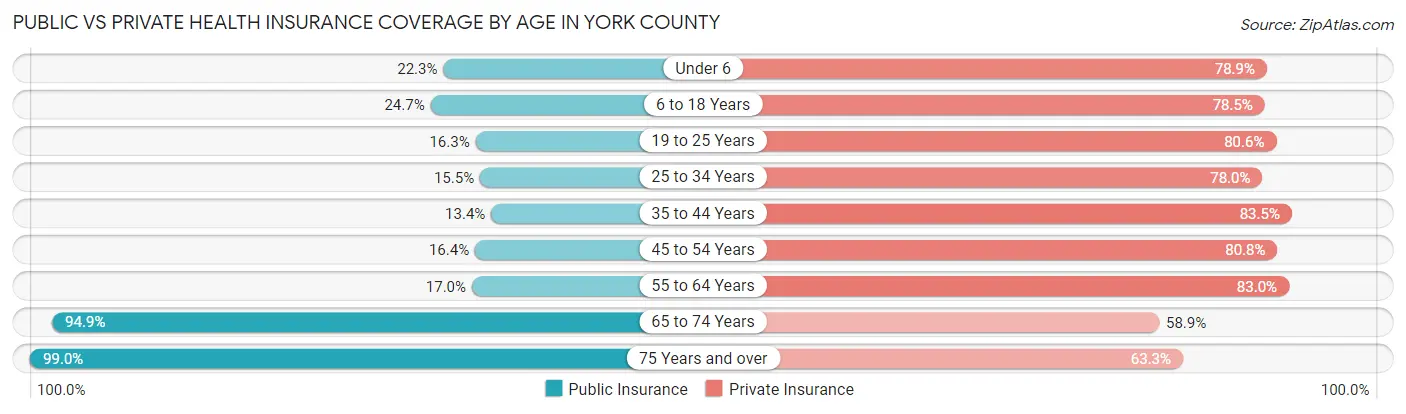
| Age Bracket | Public Insurance | Private Insurance |
| Under 6 | 2,571 (22.3%) | 9,100 (78.9%) |
| 6 to 18 Years | 7,270 (24.7%) | 23,136 (78.5%) |
| 19 to 25 Years | 2,490 (16.3%) | 12,308 (80.6%) |
| 25 to 34 Years | 3,669 (15.5%) | 18,514 (78.0%) |
| 35 to 44 Years | 3,331 (13.4%) | 20,759 (83.5%) |
| 45 to 54 Years | 4,517 (16.4%) | 22,266 (80.8%) |
| 55 to 64 Years | 5,754 (17.0%) | 28,119 (83.0%) |
| 65 to 74 Years | 25,754 (94.9%) | 15,978 (58.9%) |
| 75 Years and over | 16,930 (99.0%) | 10,825 (63.3%) |
| Total | 72,286 (34.3%) | 161,005 (76.5%) |
Disability Status by Sex by Age in York County
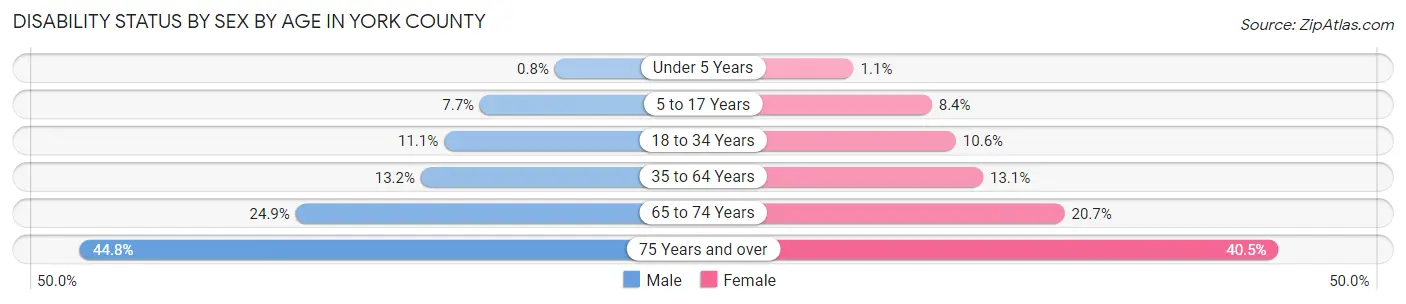
| Age Bracket | Male | Female |
| Under 5 Years | 39 (0.8%) | 52 (1.1%) |
| 5 to 17 Years | 1,165 (7.7%) | 1,171 (8.4%) |
| 18 to 34 Years | 2,295 (11.1%) | 2,185 (10.6%) |
| 35 to 64 Years | 5,647 (13.2%) | 5,717 (13.1%) |
| 65 to 74 Years | 3,172 (24.8%) | 2,971 (20.7%) |
| 75 Years and over | 3,270 (44.8%) | 3,974 (40.5%) |
Disability Class by Sex by Age in York County
Disability Class: Hearing Difficulty
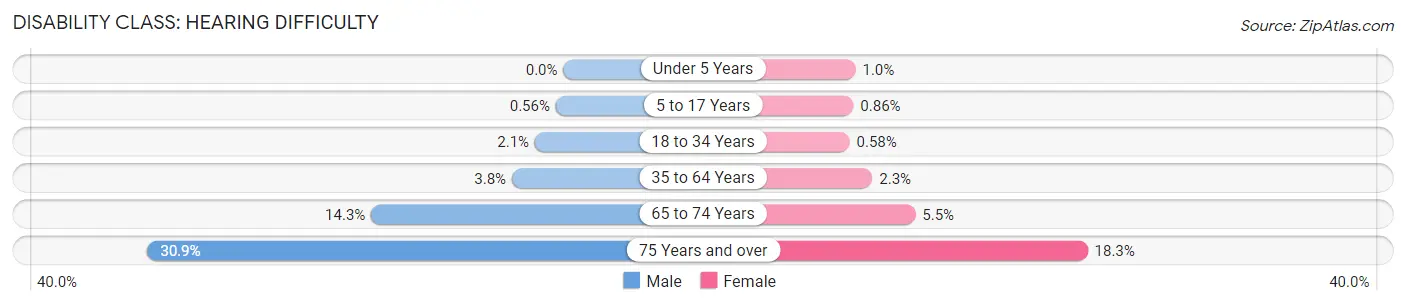
| Age Bracket | Male | Female |
| Under 5 Years | 0 (0.0%) | 48 (1.0%) |
| 5 to 17 Years | 84 (0.6%) | 120 (0.9%) |
| 18 to 34 Years | 437 (2.1%) | 119 (0.6%) |
| 35 to 64 Years | 1,632 (3.8%) | 990 (2.3%) |
| 65 to 74 Years | 1,821 (14.3%) | 785 (5.5%) |
| 75 Years and over | 2,253 (30.9%) | 1,790 (18.2%) |
Disability Class: Vision Difficulty
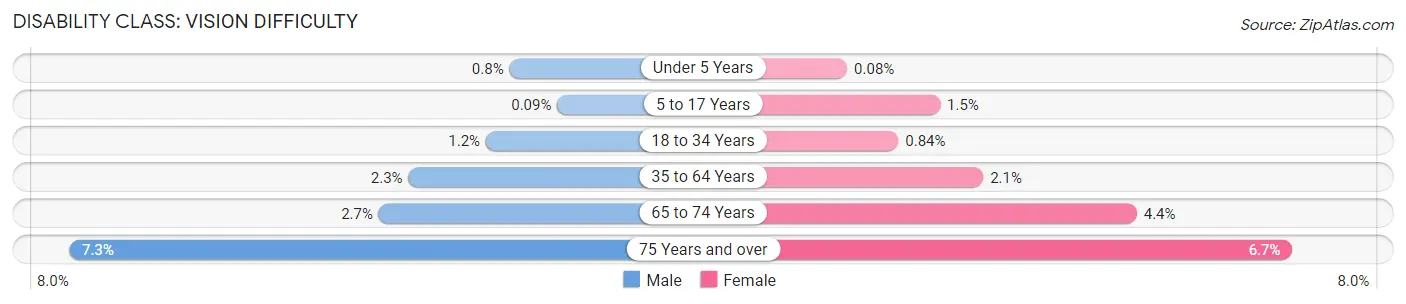
| Age Bracket | Male | Female |
| Under 5 Years | 39 (0.8%) | 4 (0.1%) |
| 5 to 17 Years | 14 (0.1%) | 205 (1.5%) |
| 18 to 34 Years | 238 (1.1%) | 174 (0.8%) |
| 35 to 64 Years | 981 (2.3%) | 915 (2.1%) |
| 65 to 74 Years | 350 (2.7%) | 629 (4.4%) |
| 75 Years and over | 535 (7.3%) | 656 (6.7%) |
Disability Class: Cognitive Difficulty
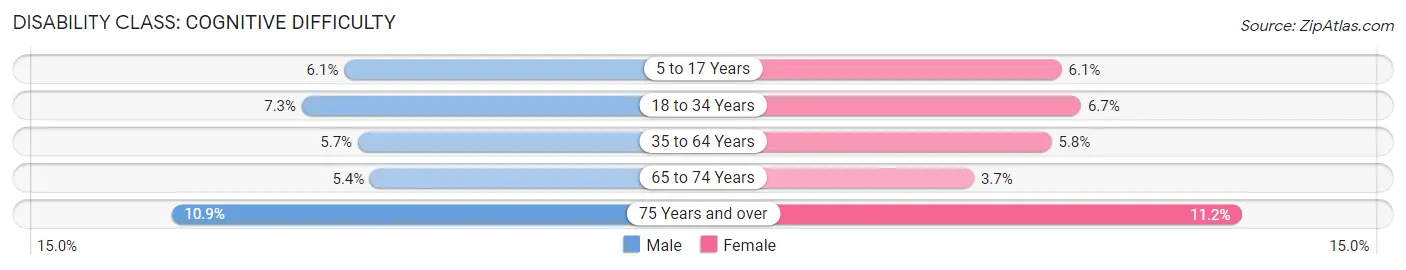
| Age Bracket | Male | Female |
| 5 to 17 Years | 917 (6.1%) | 858 (6.1%) |
| 18 to 34 Years | 1,510 (7.3%) | 1,373 (6.7%) |
| 35 to 64 Years | 2,440 (5.7%) | 2,546 (5.8%) |
| 65 to 74 Years | 687 (5.4%) | 529 (3.7%) |
| 75 Years and over | 796 (10.9%) | 1,094 (11.2%) |
Disability Class: Ambulatory Difficulty
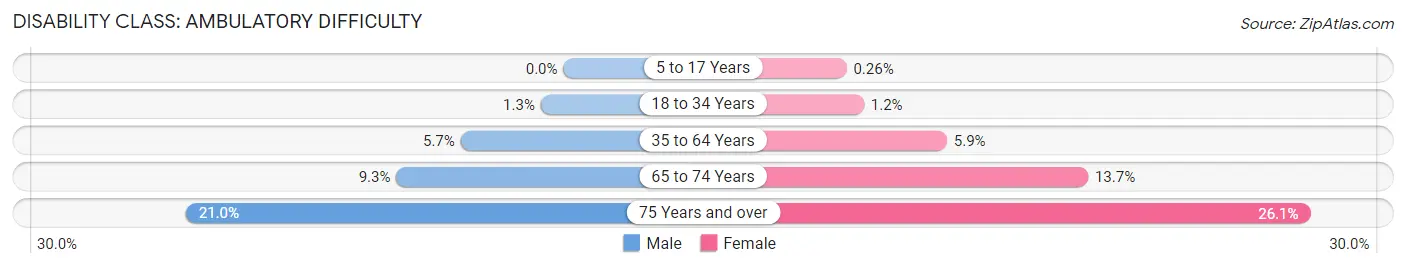
| Age Bracket | Male | Female |
| 5 to 17 Years | 0 (0.0%) | 37 (0.3%) |
| 18 to 34 Years | 261 (1.3%) | 253 (1.2%) |
| 35 to 64 Years | 2,439 (5.7%) | 2,550 (5.9%) |
| 65 to 74 Years | 1,187 (9.3%) | 1,971 (13.7%) |
| 75 Years and over | 1,533 (21.0%) | 2,559 (26.1%) |
Disability Class: Self-Care Difficulty
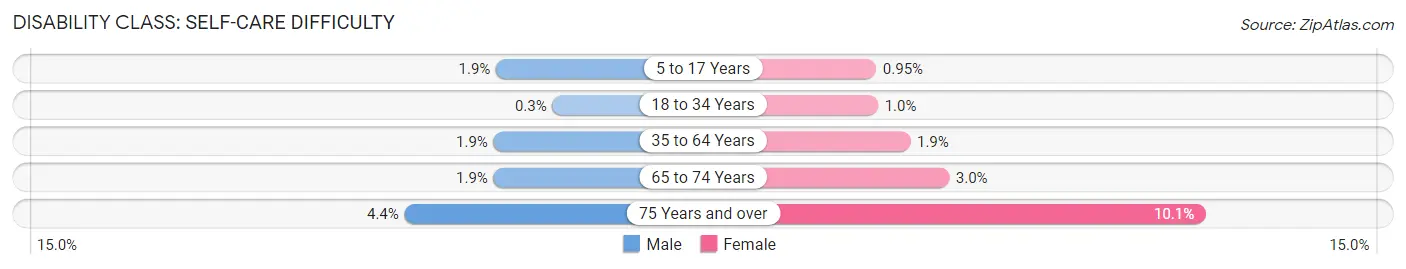
| Age Bracket | Male | Female |
| 5 to 17 Years | 282 (1.9%) | 133 (0.9%) |
| 18 to 34 Years | 63 (0.3%) | 206 (1.0%) |
| 35 to 64 Years | 826 (1.9%) | 830 (1.9%) |
| 65 to 74 Years | 248 (1.9%) | 429 (3.0%) |
| 75 Years and over | 322 (4.4%) | 995 (10.1%) |
Technology Access in York County
Computing Device Access in York County
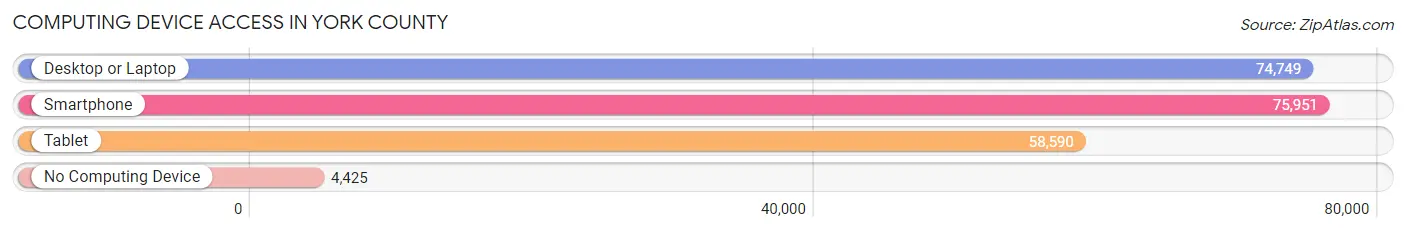
| Device Type | # Households | % Households |
| Desktop or Laptop | 74,749 | 83.6% |
| Smartphone | 75,951 | 85.0% |
| Tablet | 58,590 | 65.5% |
| No Computing Device | 4,425 | 5.0% |
| Total | 89,404 | 100.0% |
Internet Access in York County
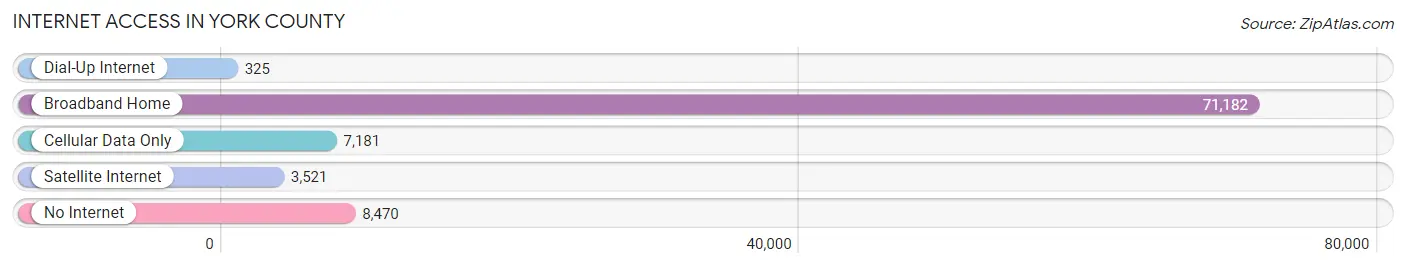
| Internet Type | # Households | % Households |
| Dial-Up Internet | 325 | 0.4% |
| Broadband Home | 71,182 | 79.6% |
| Cellular Data Only | 7,181 | 8.0% |
| Satellite Internet | 3,521 | 3.9% |
| No Internet | 8,470 | 9.5% |
| Total | 89,404 | 100.0% |
York County Summary
York County, Maine is located in the southern part of the state and is the most populous county in the state. It is bordered by Cumberland County to the north, Oxford County to the west, and Strafford County, New Hampshire to the south. The county seat is Alfred.
History
York County was established in 1636 as part of the Massachusetts Bay Colony. It was named after the city of York in England. The county was originally part of the Province of Maine, which was a part of Massachusetts until 1820 when Maine became a separate state.
The county was home to many Native American tribes, including the Abenaki, Passamaquoddy, and Penobscot. The first European settlers arrived in the area in the 1620s and established trading posts and settlements. The county was an important center of the lumber industry in the 19th century, and many of the towns in the county were founded during this period.
Geography
York County covers an area of 1,270 square miles and is the second largest county in Maine. It is located in the southern part of the state and is bordered by Cumberland County to the north, Oxford County to the west, and Strafford County, New Hampshire to the south. The county is mostly rural, with a few small towns and villages scattered throughout. The highest point in the county is Mount Agamenticus, which has an elevation of 1,170 feet.
The county is home to several rivers, including the Saco, Mousam, and York Rivers. The coastline of the county is dotted with numerous islands, including Seguin Island, Boon Island, and Cushing Island.
Economy
York County has a diverse economy, with a mix of manufacturing, agriculture, and tourism. The county is home to several large companies, including the Maine Energy Corporation, the York County Regional Airport, and the York County Regional Medical Center.
Agriculture is an important part of the economy, with dairy farming, poultry farming, and apple orchards being the main industries. Tourism is also an important part of the economy, with many visitors coming to the county to enjoy its beaches, parks, and other attractions.
Demographics
As of the 2010 census, York County had a population of 197,131. The population is mostly white (94.3%), with small percentages of African Americans (2.2%), Asians (1.2%), and Native Americans (0.5%). The median household income is $50,945, and the median age is 43.
York County is home to several colleges and universities, including the University of New England, York County Community College, and the Maine College of Art. The county is also home to several museums, including the York County Historical Society Museum and the Maine Maritime Museum.
Common Questions
What is Per Capita Income in York County?
Per Capita income in York County is $42,053.
What is the Median Family Income in York County?
Median Family Income in York County is $99,041.
What is the Median Household income in York County?
Median Household Income in York County is $79,743.
What is Income or Wage Gap in York County?
Income or Wage Gap in York County is 31.4%.
Women in York County earn 68.6 cents for every dollar earned by a man.
What is Family Income Deficit in York County?
Family Income Deficit in York County is $9,090.
Families that are below poverty line in York County earn $9,090 less on average than the poverty threshold level.
What is Inequality or Gini Index in York County?
Inequality or Gini Index in York County is 0.42.
What is the Total Population of York County?
Total Population of York County is 212,691.
What is the Total Male Population of York County?
Total Male Population of York County is 104,642.
What is the Total Female Population of York County?
Total Female Population of York County is 108,049.
What is the Ratio of Males per 100 Females in York County?
There are 96.85 Males per 100 Females in York County.
What is the Ratio of Females per 100 Males in York County?
There are 103.26 Females per 100 Males in York County.
What is the Median Population Age in York County?
Median Population Age in York County is 45.2 Years.
What is the Average Family Size in York County
Average Family Size in York County is 2.9 People.
What is the Average Household Size in York County
Average Household Size in York County is 2.3 People.
How Large is the Labor Force in York County?
There are 117,318 People in the Labor Forcein in York County.
What is the Percentage of People in the Labor Force in York County?
65.7% of People are in the Labor Force in York County.
What is the Unemployment Rate in York County?
Unemployment Rate in York County is 3.4%.