Newburg, WV Map & Demographics
Newburg Map
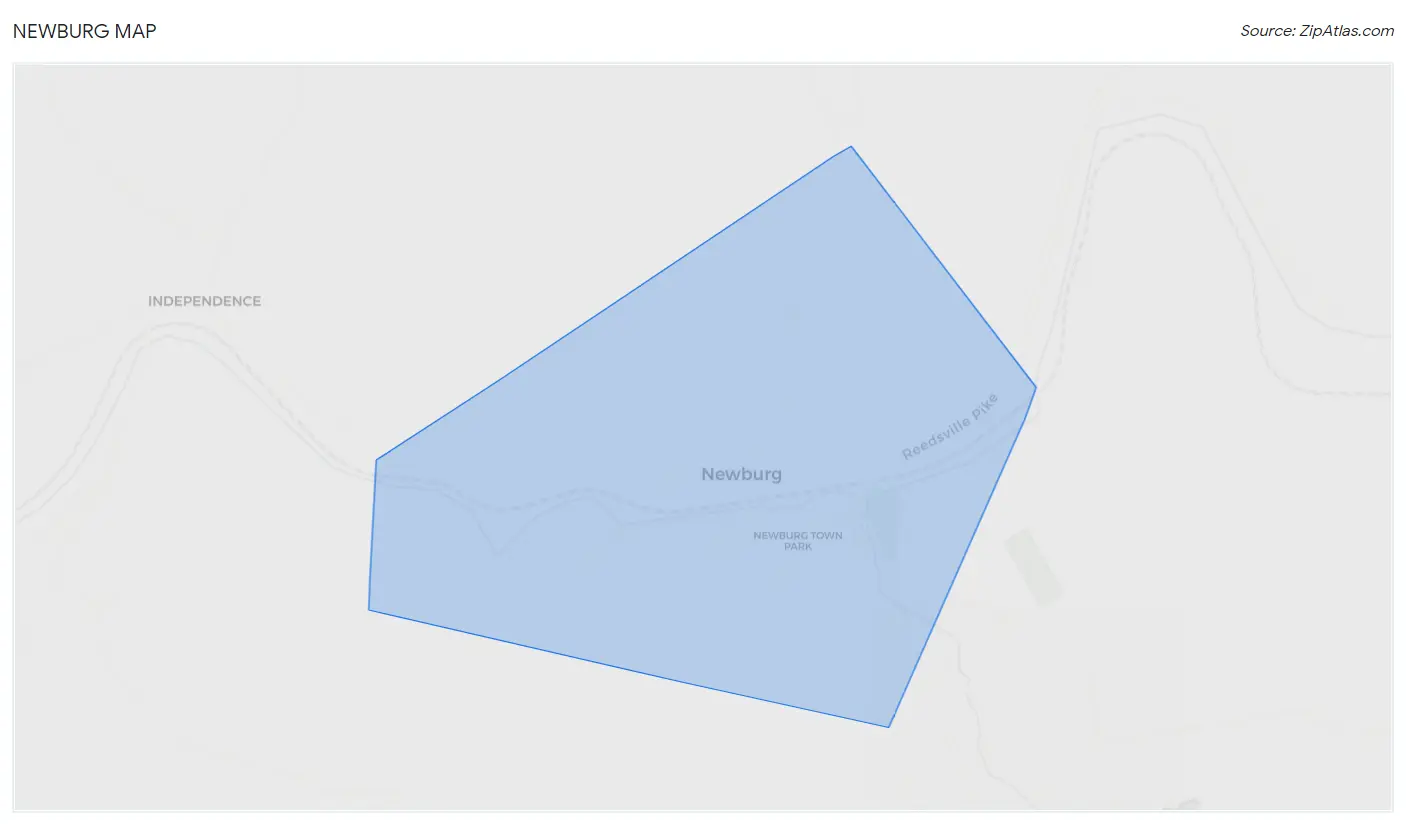
Newburg Overview
$28,978
PER CAPITA INCOME
$49,023
AVG FAMILY INCOME
$49,219
AVG HOUSEHOLD INCOME
56.1%
WAGE / INCOME GAP [ % ]
43.9¢/ $1
WAGE / INCOME GAP [ $ ]
0.31
INEQUALITY / GINI INDEX
237
TOTAL POPULATION
125
MALE POPULATION
112
FEMALE POPULATION
111.61
MALES / 100 FEMALES
89.60
FEMALES / 100 MALES
55.9
MEDIAN AGE
2.2
AVG FAMILY SIZE
2.0
AVG HOUSEHOLD SIZE
114
LABOR FORCE [ PEOPLE ]
54.8%
PERCENT IN LABOR FORCE
Newburg Zip Codes
Newburg Area Codes
Income in Newburg
Income Overview in Newburg
Per Capita Income in Newburg is $28,978, while median incomes of families and households are $49,023 and $49,219 respectively.
| Characteristic | Number | Measure |
| Per Capita Income | 237 | $28,978 |
| Median Family Income | 87 | $49,023 |
| Mean Family Income | 87 | $55,395 |
| Median Household Income | 116 | $49,219 |
| Mean Household Income | 116 | $57,253 |
| Income Deficit | 87 | $0 |
| Wage / Income Gap (%) | 237 | 56.05% |
| Wage / Income Gap ($) | 237 | 43.95¢ per $1 |
| Gini / Inequality Index | 237 | 0.31 |
Earnings by Sex in Newburg
Average Earnings in Newburg are $47,610, $49,301 for men and $21,667 for women, a difference of 56.0%.
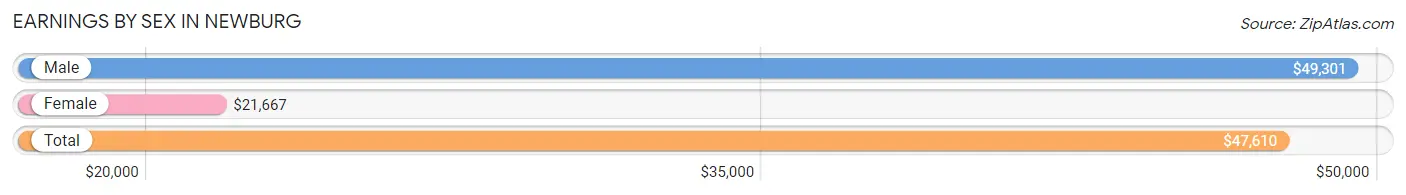
| Sex | Number | Average Earnings |
| Male | 75 (59.1%) | $49,301 |
| Female | 52 (40.9%) | $21,667 |
| Total | 127 (100.0%) | $47,610 |
Earnings by Sex by Income Bracket in Newburg
The most common earnings brackets in Newburg are $45,000 to $49,999 for men (37 | 49.3%) and $5,000 to $7,499 for women (7 | 13.5%).
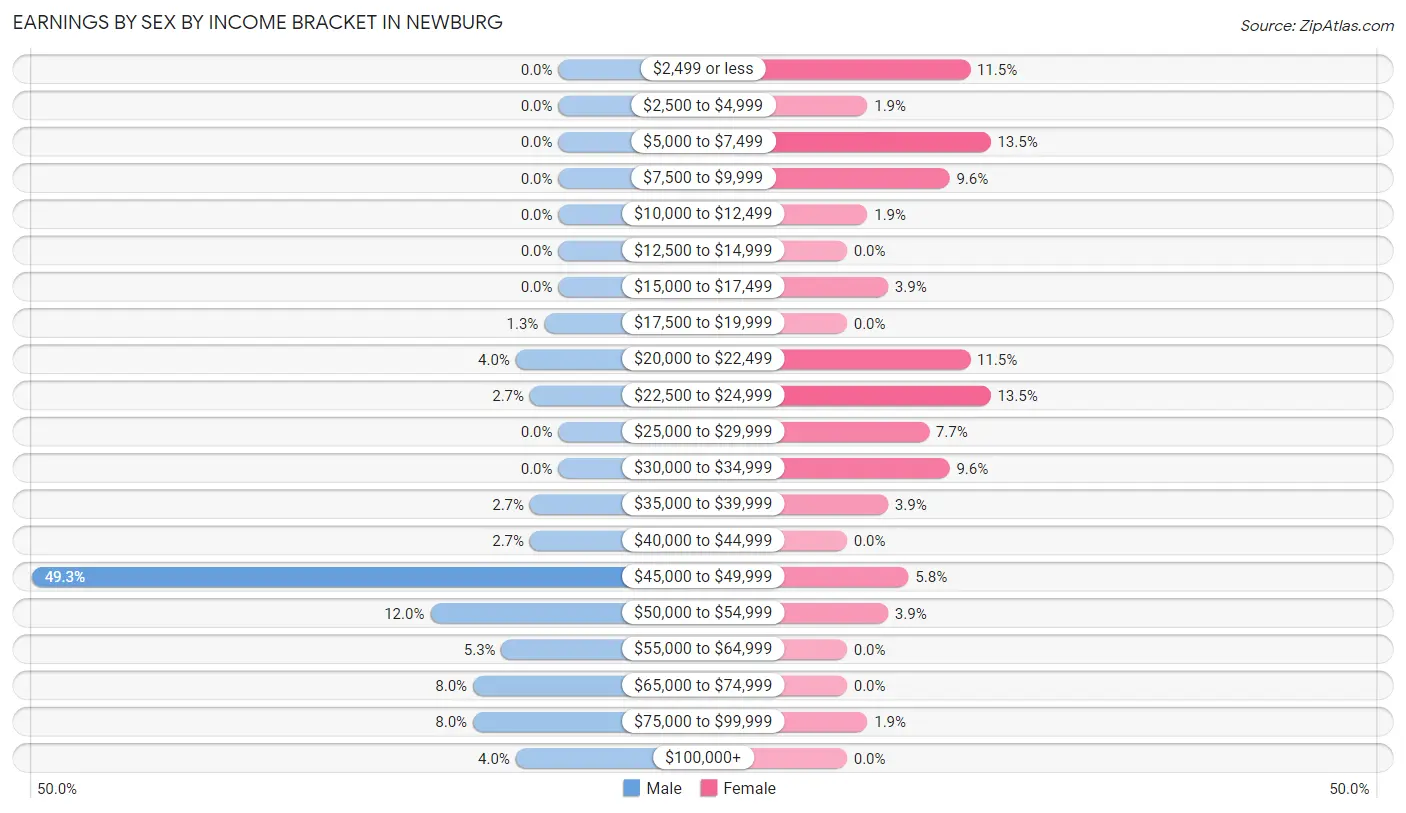
| Income | Male | Female |
| $2,499 or less | 0 (0.0%) | 6 (11.5%) |
| $2,500 to $4,999 | 0 (0.0%) | 1 (1.9%) |
| $5,000 to $7,499 | 0 (0.0%) | 7 (13.5%) |
| $7,500 to $9,999 | 0 (0.0%) | 5 (9.6%) |
| $10,000 to $12,499 | 0 (0.0%) | 1 (1.9%) |
| $12,500 to $14,999 | 0 (0.0%) | 0 (0.0%) |
| $15,000 to $17,499 | 0 (0.0%) | 2 (3.8%) |
| $17,500 to $19,999 | 1 (1.3%) | 0 (0.0%) |
| $20,000 to $22,499 | 3 (4.0%) | 6 (11.5%) |
| $22,500 to $24,999 | 2 (2.7%) | 7 (13.5%) |
| $25,000 to $29,999 | 0 (0.0%) | 4 (7.7%) |
| $30,000 to $34,999 | 0 (0.0%) | 5 (9.6%) |
| $35,000 to $39,999 | 2 (2.7%) | 2 (3.8%) |
| $40,000 to $44,999 | 2 (2.7%) | 0 (0.0%) |
| $45,000 to $49,999 | 37 (49.3%) | 3 (5.8%) |
| $50,000 to $54,999 | 9 (12.0%) | 2 (3.8%) |
| $55,000 to $64,999 | 4 (5.3%) | 0 (0.0%) |
| $65,000 to $74,999 | 6 (8.0%) | 0 (0.0%) |
| $75,000 to $99,999 | 6 (8.0%) | 1 (1.9%) |
| $100,000+ | 3 (4.0%) | 0 (0.0%) |
| Total | 75 (100.0%) | 52 (100.0%) |
Earnings by Sex by Educational Attainment in Newburg
Average earnings in Newburg are $49,228 for men and $21,563 for women, a difference of 56.2%. Men with an educational attainment of bachelor's degree enjoy the highest average annual earnings of $53,889, while those with high school diploma education earn the least with $48,750. Women with an educational attainment of high school diploma earn the most with the average annual earnings of $21,875, while those with high school diploma education have the smallest earnings of $21,875.
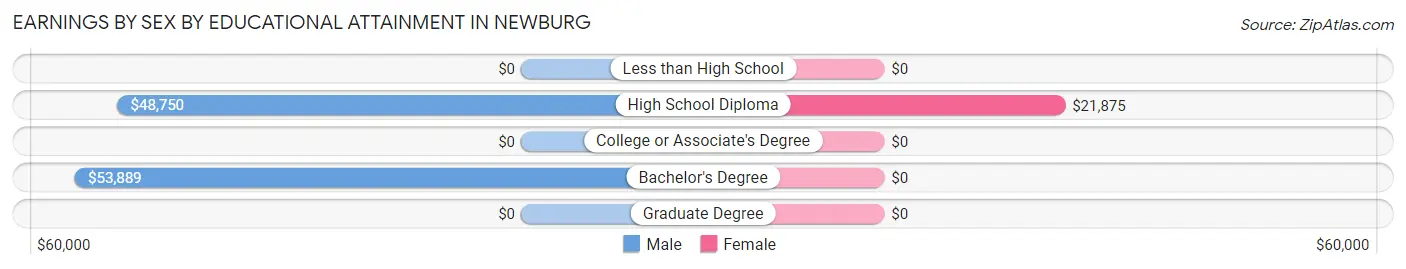
| Educational Attainment | Male Income | Female Income |
| Less than High School | - | - |
| High School Diploma | $48,750 | $21,875 |
| College or Associate's Degree | - | - |
| Bachelor's Degree | $53,889 | $0 |
| Graduate Degree | - | - |
| Total | $49,228 | $21,563 |
Family Income in Newburg
Family Income Brackets in Newburg
According to the Newburg family income data, there are 40 families falling into the $35,000 to $49,999 income range, which is the most common income bracket and makes up 46.0% of all families.
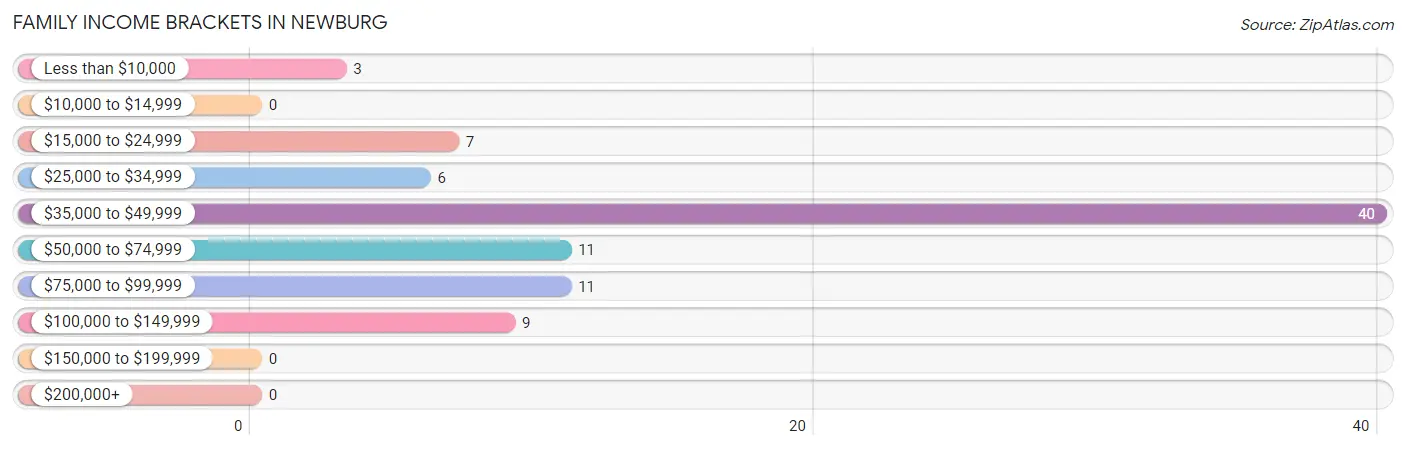
| Income Bracket | # Families | % Families |
| Less than $10,000 | 3 | 3.4% |
| $10,000 to $14,999 | 0 | 0.0% |
| $15,000 to $24,999 | 7 | 8.0% |
| $25,000 to $34,999 | 6 | 6.9% |
| $35,000 to $49,999 | 40 | 46.0% |
| $50,000 to $74,999 | 11 | 12.6% |
| $75,000 to $99,999 | 11 | 12.6% |
| $100,000 to $149,999 | 9 | 10.3% |
| $150,000 to $199,999 | 0 | 0.0% |
| $200,000+ | 0 | 0.0% |
Family Income by Famaliy Size in Newburg
4-person families (8 | 9.2%) account for the highest median family income in Newburg with $73,750 per family, while 2-person families (65 | 74.7%) have the highest median income of $24,590 per family member.
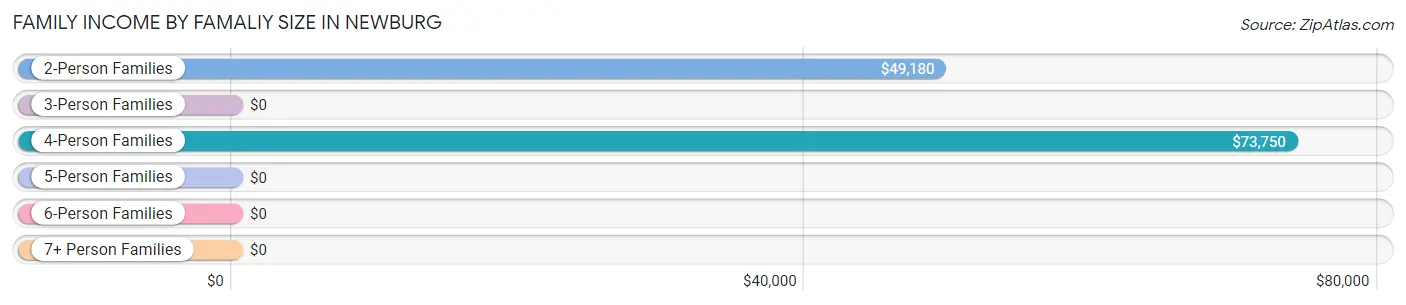
| Income Bracket | # Families | Median Income |
| 2-Person Families | 65 (74.7%) | $49,180 |
| 3-Person Families | 13 (14.9%) | $0 |
| 4-Person Families | 8 (9.2%) | $73,750 |
| 5-Person Families | 0 (0.0%) | $0 |
| 6-Person Families | 1 (1.1%) | $0 |
| 7+ Person Families | 0 (0.0%) | $0 |
| Total | 87 (100.0%) | $49,023 |
Family Income by Number of Earners in Newburg
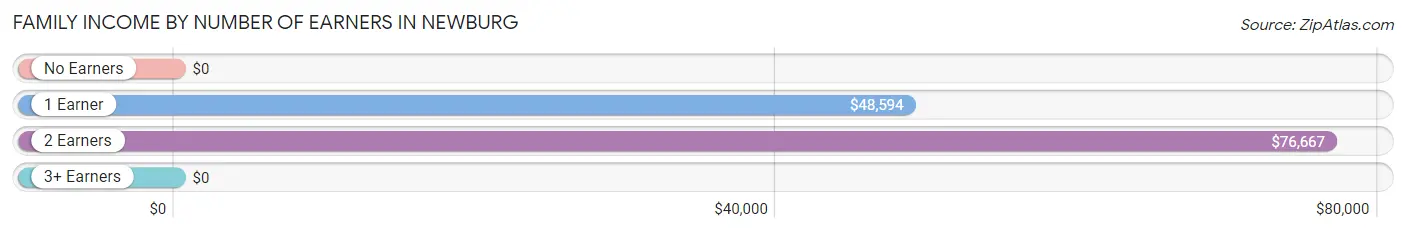
| Number of Earners | # Families | Median Income |
| No Earners | 15 (17.2%) | $0 |
| 1 Earner | 56 (64.4%) | $48,594 |
| 2 Earners | 14 (16.1%) | $76,667 |
| 3+ Earners | 2 (2.3%) | $0 |
| Total | 87 (100.0%) | $49,023 |
Household Income in Newburg
Household Income Brackets in Newburg
With 37 households falling in the category, the $35,000 to $49,999 income range is the most frequent in Newburg, accounting for 31.9% of all households.
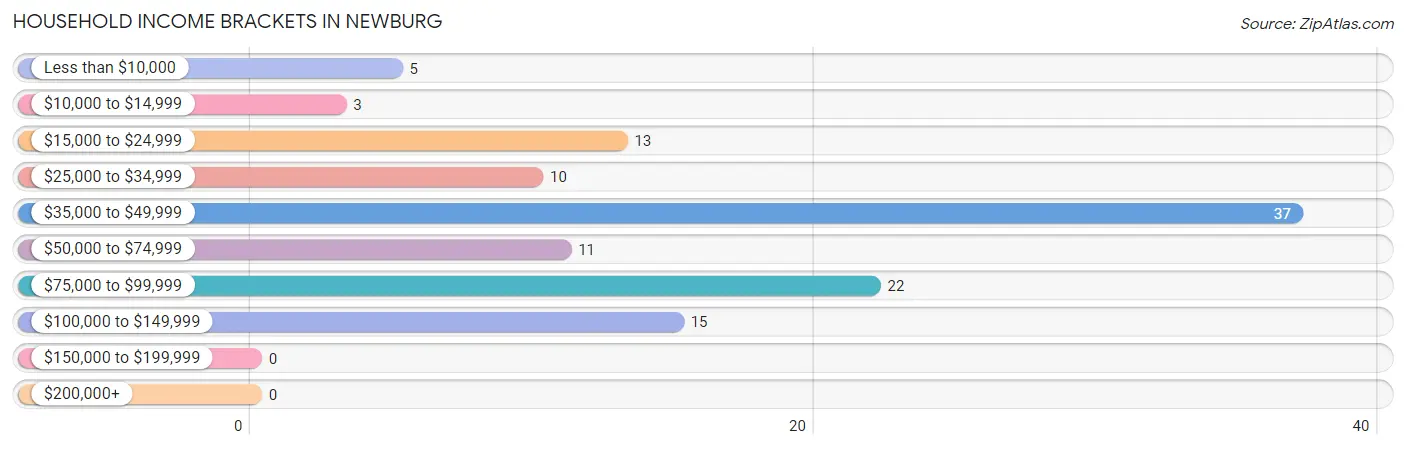
| Income Bracket | # Households | % Households |
| Less than $10,000 | 5 | 4.3% |
| $10,000 to $14,999 | 3 | 2.6% |
| $15,000 to $24,999 | 13 | 11.2% |
| $25,000 to $34,999 | 10 | 8.6% |
| $35,000 to $49,999 | 37 | 31.9% |
| $50,000 to $74,999 | 11 | 9.5% |
| $75,000 to $99,999 | 22 | 19.0% |
| $100,000 to $149,999 | 15 | 12.9% |
| $150,000 to $199,999 | 0 | 0.0% |
| $200,000+ | 0 | 0.0% |
Household Income by Householder Age in Newburg
The median household income in Newburg is $49,219, with the highest median household income of $76,250 found in the 25 to 44 years age bracket for the primary householder. A total of 28 households (24.1%) fall into this category.
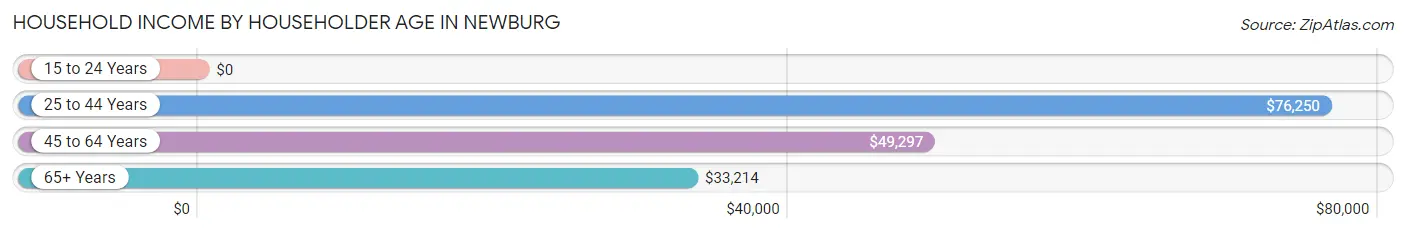
| Income Bracket | # Households | Median Income |
| 15 to 24 Years | 0 (0.0%) | $0 |
| 25 to 44 Years | 28 (24.1%) | $76,250 |
| 45 to 64 Years | 66 (56.9%) | $49,297 |
| 65+ Years | 22 (19.0%) | $33,214 |
| Total | 116 (100.0%) | $49,219 |
Poverty in Newburg
Income Below Poverty by Sex and Age in Newburg
With 16.8% poverty level for males and 17.0% for females among the residents of Newburg, 6 to 11 year old males and 12 to 14 year old females are the most vulnerable to poverty, with 5 males (71.4%) and 2 females (100.0%) in their respective age groups living below the poverty level.
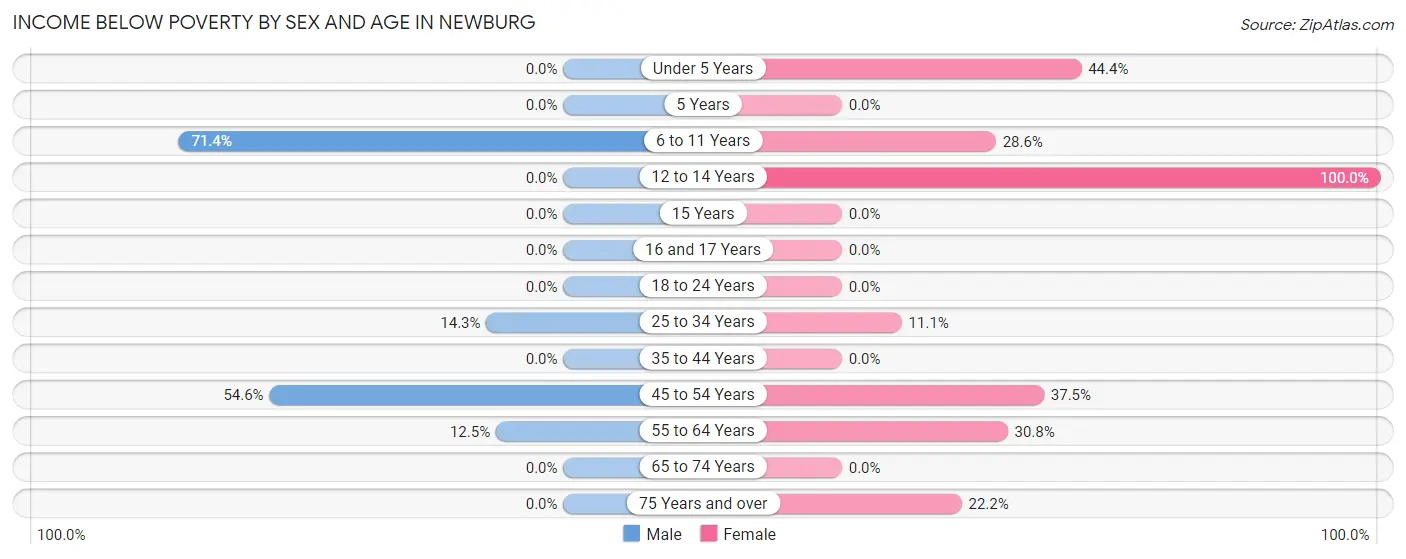
| Age Bracket | Male | Female |
| Under 5 Years | 0 (0.0%) | 4 (44.4%) |
| 5 Years | 0 (0.0%) | 0 (0.0%) |
| 6 to 11 Years | 5 (71.4%) | 2 (28.6%) |
| 12 to 14 Years | 0 (0.0%) | 2 (100.0%) |
| 15 Years | 0 (0.0%) | 0 (0.0%) |
| 16 and 17 Years | 0 (0.0%) | 0 (0.0%) |
| 18 to 24 Years | 0 (0.0%) | 0 (0.0%) |
| 25 to 34 Years | 3 (14.3%) | 2 (11.1%) |
| 35 to 44 Years | 0 (0.0%) | 0 (0.0%) |
| 45 to 54 Years | 6 (54.5%) | 3 (37.5%) |
| 55 to 64 Years | 7 (12.5%) | 4 (30.8%) |
| 65 to 74 Years | 0 (0.0%) | 0 (0.0%) |
| 75 Years and over | 0 (0.0%) | 2 (22.2%) |
| Total | 21 (16.8%) | 19 (17.0%) |
Income Above Poverty by Sex and Age in Newburg
According to the poverty statistics in Newburg, males aged under 5 years and females aged 18 to 24 years are the age groups that are most secure financially, with 100.0% of males and 100.0% of females in these age groups living above the poverty line.
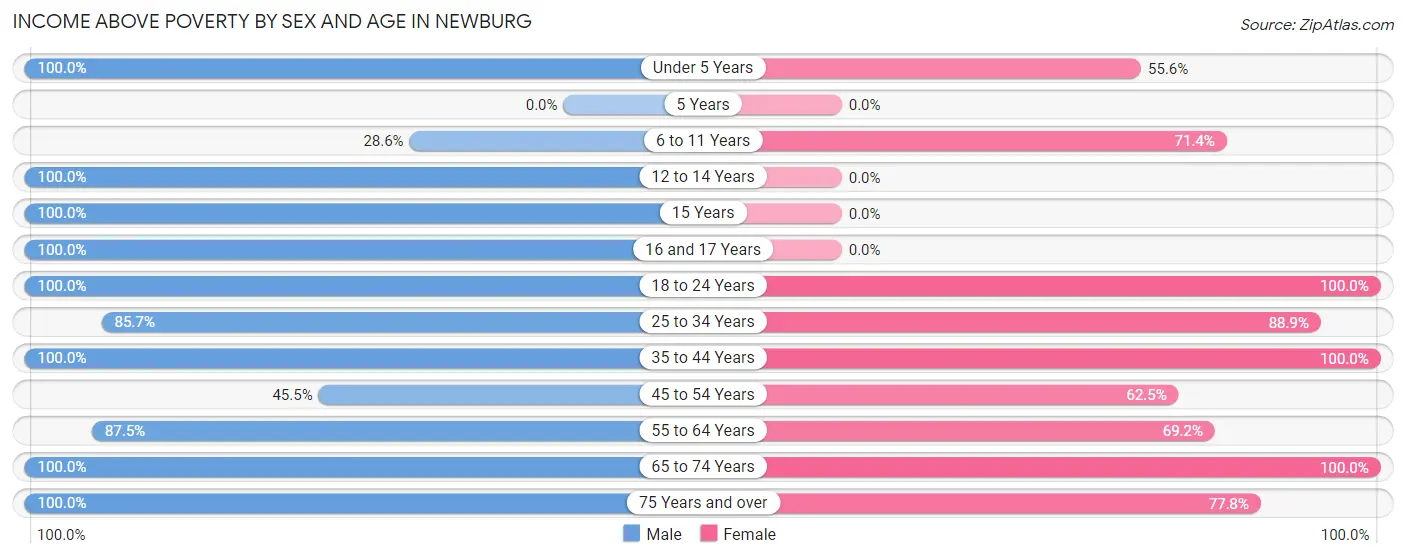
| Age Bracket | Male | Female |
| Under 5 Years | 1 (100.0%) | 5 (55.6%) |
| 5 Years | 0 (0.0%) | 0 (0.0%) |
| 6 to 11 Years | 2 (28.6%) | 5 (71.4%) |
| 12 to 14 Years | 1 (100.0%) | 0 (0.0%) |
| 15 Years | 2 (100.0%) | 0 (0.0%) |
| 16 and 17 Years | 2 (100.0%) | 0 (0.0%) |
| 18 to 24 Years | 4 (100.0%) | 5 (100.0%) |
| 25 to 34 Years | 18 (85.7%) | 16 (88.9%) |
| 35 to 44 Years | 9 (100.0%) | 8 (100.0%) |
| 45 to 54 Years | 5 (45.5%) | 5 (62.5%) |
| 55 to 64 Years | 49 (87.5%) | 9 (69.2%) |
| 65 to 74 Years | 9 (100.0%) | 33 (100.0%) |
| 75 Years and over | 2 (100.0%) | 7 (77.8%) |
| Total | 104 (83.2%) | 93 (83.0%) |
Income Below Poverty Among Married-Couple Families in Newburg
The poverty statistics for married-couple families in Newburg show that 6.9% or 5 of the total 72 families live below the poverty line. Families with 1 or 2 children have the highest poverty rate of 11.1%, comprising of 1 families. On the other hand, families with no children have the lowest poverty rate of 6.4%, which includes 4 families.
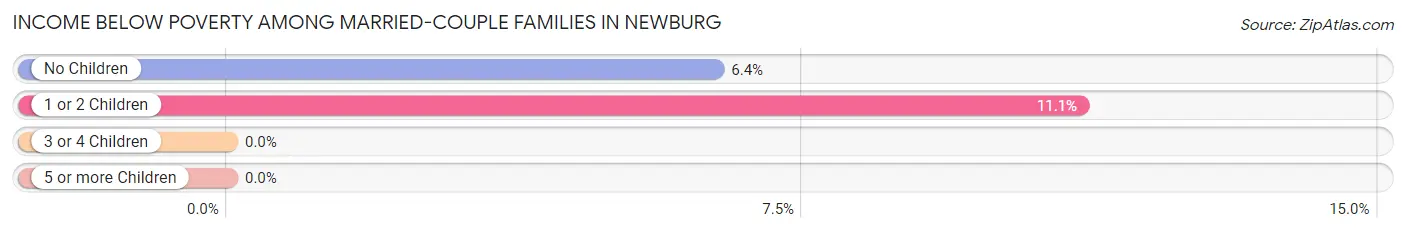
| Children | Above Poverty | Below Poverty |
| No Children | 59 (93.6%) | 4 (6.4%) |
| 1 or 2 Children | 8 (88.9%) | 1 (11.1%) |
| 3 or 4 Children | 0 (0.0%) | 0 (0.0%) |
| 5 or more Children | 0 (0.0%) | 0 (0.0%) |
| Total | 67 (93.1%) | 5 (6.9%) |
Income Below Poverty Among Single-Parent Households in Newburg
According to the poverty data in Newburg, 100.0% or 3 single-father households and 16.7% or 2 single-mother households are living below the poverty line. Among single-father households, those with 1 or 2 children have the highest poverty rate, with 3 households (100.0%) experiencing poverty. Likewise, among single-mother households, those with 1 or 2 children have the highest poverty rate, with 2 households (40.0%) falling below the poverty line.
| Children | Single Father | Single Mother |
| No Children | 0 (0.0%) | 0 (0.0%) |
| 1 or 2 Children | 3 (100.0%) | 2 (40.0%) |
| 3 or 4 Children | 0 (0.0%) | 0 (0.0%) |
| 5 or more Children | 0 (0.0%) | 0 (0.0%) |
| Total | 3 (100.0%) | 2 (16.7%) |
Income Below Poverty Among Married-Couple vs Single-Parent Households in Newburg
The poverty data for Newburg shows that 5 of the married-couple family households (6.9%) and 5 of the single-parent households (33.3%) are living below the poverty level. Within the married-couple family households, those with 1 or 2 children have the highest poverty rate, with 1 households (11.1%) falling below the poverty line. Among the single-parent households, those with 1 or 2 children have the highest poverty rate, with 5 household (62.5%) living below poverty.
| Children | Married-Couple Families | Single-Parent Households |
| No Children | 4 (6.4%) | 0 (0.0%) |
| 1 or 2 Children | 1 (11.1%) | 5 (62.5%) |
| 3 or 4 Children | 0 (0.0%) | 0 (0.0%) |
| 5 or more Children | 0 (0.0%) | 0 (0.0%) |
| Total | 5 (6.9%) | 5 (33.3%) |
Race in Newburg
The most populous races in Newburg are White / Caucasian (215 | 90.7%), Two or more Races (19 | 8.0%), and Asian (3 | 1.3%).
| Race | # Population | % Population |
| Asian | 3 | 1.3% |
| Black / African American | 0 | 0.0% |
| Hawaiian / Pacific | 0 | 0.0% |
| Hispanic or Latino | 2 | 0.8% |
| Native / Alaskan | 0 | 0.0% |
| White / Caucasian | 215 | 90.7% |
| Two or more Races | 19 | 8.0% |
| Some other Race | 0 | 0.0% |
| Total | 237 | 100.0% |
Ancestry in Newburg
The most populous ancestries reported in Newburg are German (82 | 34.6%), American (57 | 24.0%), Irish (37 | 15.6%), European (18 | 7.6%), and English (15 | 6.3%), together accounting for 88.2% of all Newburg residents.
| Ancestry | # Population | % Population |
| American | 57 | 24.0% |
| Dutch | 4 | 1.7% |
| English | 15 | 6.3% |
| European | 18 | 7.6% |
| French | 3 | 1.3% |
| German | 82 | 34.6% |
| Indian (Asian) | 3 | 1.3% |
| Irish | 37 | 15.6% |
| Italian | 5 | 2.1% |
| Scandinavian | 5 | 2.1% |
| Scottish | 4 | 1.7% |
| Slavic | 5 | 2.1% |
| Spanish | 2 | 0.8% |
| Swedish | 5 | 2.1% | View All 14 Rows |
Immigrants in Newburg
The most numerous immigrant groups reported in Newburg came from Asia (3 | 1.3%), China (3 | 1.3%), and Eastern Asia (3 | 1.3%), together accounting for 3.8% of all Newburg residents.
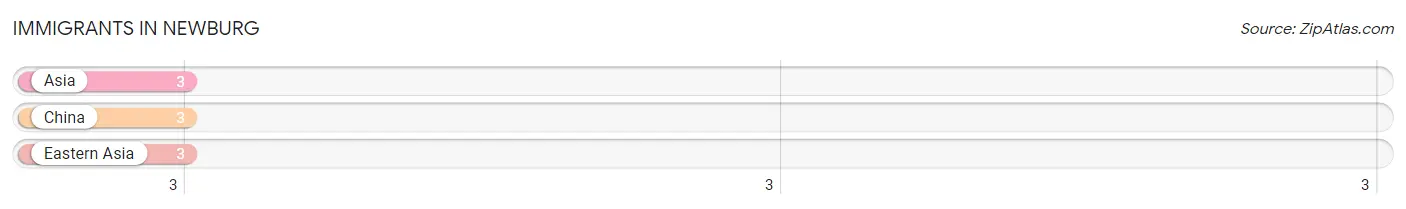
| Immigration Origin | # Population | % Population |
| Asia | 3 | 1.3% |
| China | 3 | 1.3% |
| Eastern Asia | 3 | 1.3% | View All 3 Rows |
Sex and Age in Newburg
Sex and Age in Newburg
The most populous age groups in Newburg are 60 to 64 Years (51 | 40.8%) for men and 65 to 69 Years (26 | 23.2%) for women.
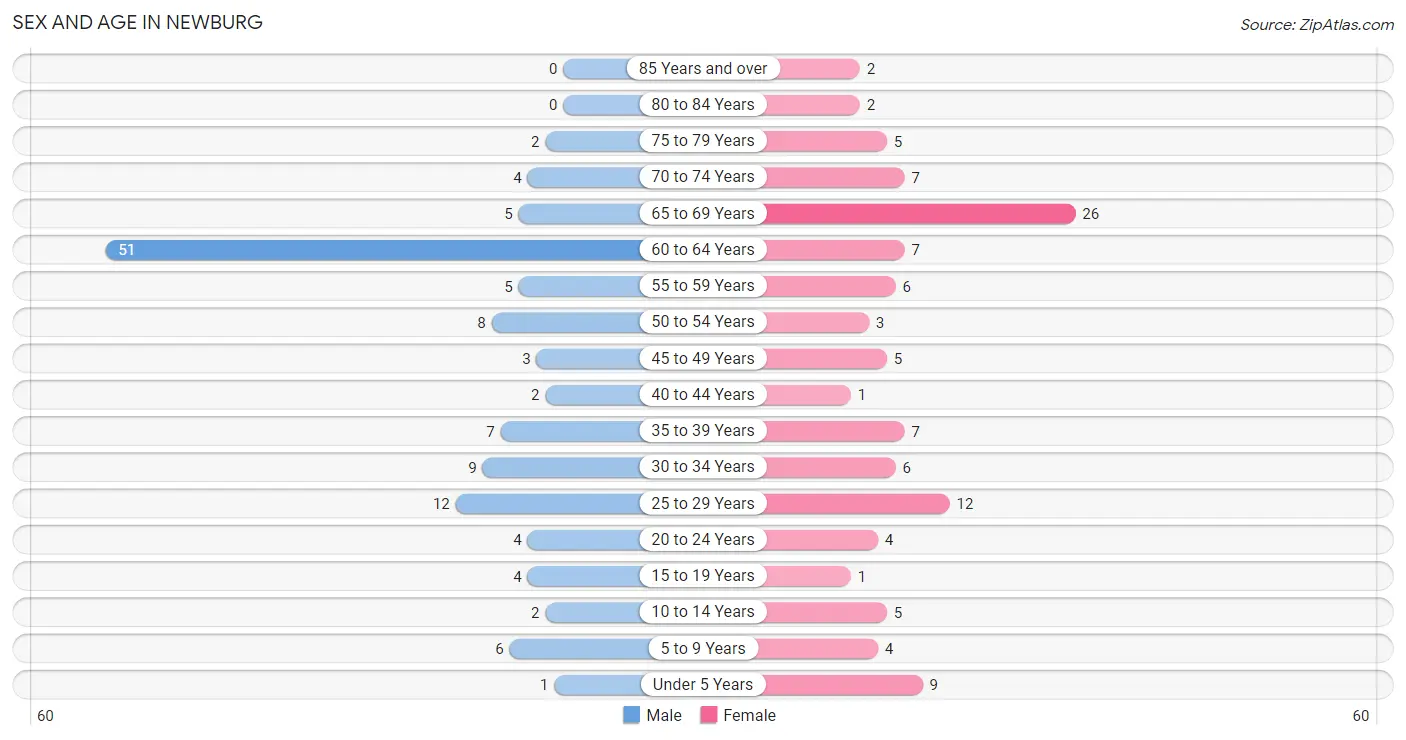
| Age Bracket | Male | Female |
| Under 5 Years | 1 (0.8%) | 9 (8.0%) |
| 5 to 9 Years | 6 (4.8%) | 4 (3.6%) |
| 10 to 14 Years | 2 (1.6%) | 5 (4.5%) |
| 15 to 19 Years | 4 (3.2%) | 1 (0.9%) |
| 20 to 24 Years | 4 (3.2%) | 4 (3.6%) |
| 25 to 29 Years | 12 (9.6%) | 12 (10.7%) |
| 30 to 34 Years | 9 (7.2%) | 6 (5.4%) |
| 35 to 39 Years | 7 (5.6%) | 7 (6.2%) |
| 40 to 44 Years | 2 (1.6%) | 1 (0.9%) |
| 45 to 49 Years | 3 (2.4%) | 5 (4.5%) |
| 50 to 54 Years | 8 (6.4%) | 3 (2.7%) |
| 55 to 59 Years | 5 (4.0%) | 6 (5.4%) |
| 60 to 64 Years | 51 (40.8%) | 7 (6.2%) |
| 65 to 69 Years | 5 (4.0%) | 26 (23.2%) |
| 70 to 74 Years | 4 (3.2%) | 7 (6.2%) |
| 75 to 79 Years | 2 (1.6%) | 5 (4.5%) |
| 80 to 84 Years | 0 (0.0%) | 2 (1.8%) |
| 85 Years and over | 0 (0.0%) | 2 (1.8%) |
| Total | 125 (100.0%) | 112 (100.0%) |
Families and Households in Newburg
Median Family Size in Newburg
The median family size in Newburg is 2.24 persons per family, with single male/father families (3 | 3.5%) accounting for the largest median family size of 3.67 persons per family. On the other hand, single female/mother families (12 | 13.8%) represent the smallest median family size with 1.92 persons per family.
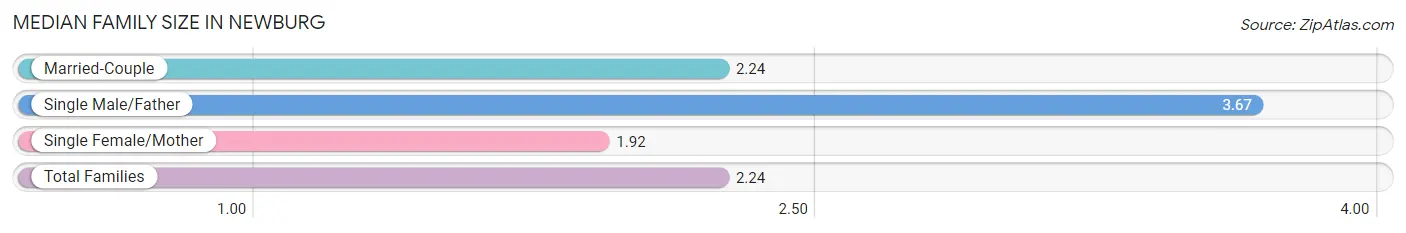
| Family Type | # Families | Family Size |
| Married-Couple | 72 (82.8%) | 2.24 |
| Single Male/Father | 3 (3.5%) | 3.67 |
| Single Female/Mother | 12 (13.8%) | 1.92 |
| Total Families | 87 (100.0%) | 2.24 |
Median Household Size in Newburg
The median household size in Newburg is 2.04 persons per household, with single male/father households (3 | 2.6%) accounting for the largest median household size of 3.67 persons per household. non-family households (29 | 25.0%) represent the smallest median household size with 1.38 persons per household.
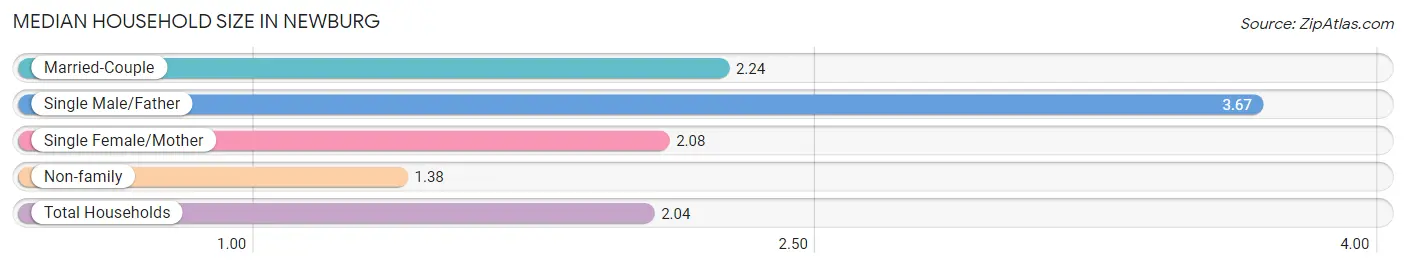
| Household Type | # Households | Household Size |
| Married-Couple | 72 (62.1%) | 2.24 |
| Single Male/Father | 3 (2.6%) | 3.67 |
| Single Female/Mother | 12 (10.3%) | 2.08 |
| Non-family | 29 (25.0%) | 1.38 |
| Total Households | 116 (100.0%) | 2.04 |
Household Size by Marriage Status in Newburg
Out of a total of 116 households in Newburg, 87 (75.0%) are family households, while 29 (25.0%) are nonfamily households. The most numerous type of family households are 2-person households, comprising 62, and the most common type of nonfamily households are 1-person households, comprising 17.
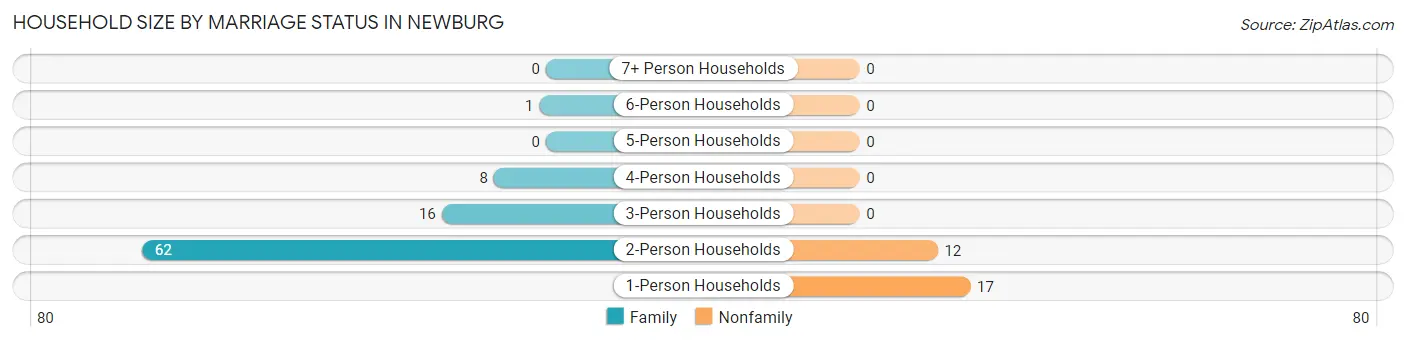
| Household Size | Family Households | Nonfamily Households |
| 1-Person Households | - | 17 (14.7%) |
| 2-Person Households | 62 (53.4%) | 12 (10.3%) |
| 3-Person Households | 16 (13.8%) | 0 (0.0%) |
| 4-Person Households | 8 (6.9%) | 0 (0.0%) |
| 5-Person Households | 0 (0.0%) | 0 (0.0%) |
| 6-Person Households | 1 (0.9%) | 0 (0.0%) |
| 7+ Person Households | 0 (0.0%) | 0 (0.0%) |
| Total | 87 (75.0%) | 29 (25.0%) |
Female Fertility in Newburg
Fertility by Age in Newburg
| Age Bracket | Women with Births | Births / 1,000 Women |
| 15 to 19 years | 0 (0.0%) | 0.0 |
| 20 to 34 years | 0 (0.0%) | 0.0 |
| 35 to 50 years | 0 (0.0%) | 0.0 |
| Total | 0 (0.0%) | 0.0 |
Fertility by Age by Marriage Status in Newburg
| Age Bracket | Married | Unmarried |
| 15 to 19 years | 0 (0.0%) | 0 (0.0%) |
| 20 to 34 years | 0 (0.0%) | 0 (0.0%) |
| 35 to 50 years | 0 (0.0%) | 0 (0.0%) |
| Total | 0 (0.0%) | 0 (0.0%) |
Fertility by Education in Newburg
| Educational Attainment | Women with Births | Births / 1,000 Women |
| Less than High School | 0 (0.0%) | 0.0 |
| High School Diploma | 0 (0.0%) | 0.0 |
| College or Associate's Degree | 0 (0.0%) | 0.0 |
| Bachelor's Degree | 0 (0.0%) | 0.0 |
| Graduate Degree | 0 (0.0%) | 0.0 |
| Total | 0 (0.0%) | 0.0 |
Fertility by Education by Marriage Status in Newburg
| Educational Attainment | Married | Unmarried |
| Less than High School | 0 (0.0%) | 0 (0.0%) |
| High School Diploma | 0 (0.0%) | 0 (0.0%) |
| College or Associate's Degree | 0 (0.0%) | 0 (0.0%) |
| Bachelor's Degree | 0 (0.0%) | 0 (0.0%) |
| Graduate Degree | 0 (0.0%) | 0 (0.0%) |
| Total | 0 (0.0%) | 0 (0.0%) |
Employment Characteristics in Newburg
Employment by Class of Employer in Newburg
Among the 114 employed individuals in Newburg, private company employees (96 | 84.2%), local government employees (5 | 4.4%), and federal government employees (5 | 4.4%) make up the most common classes of employment.
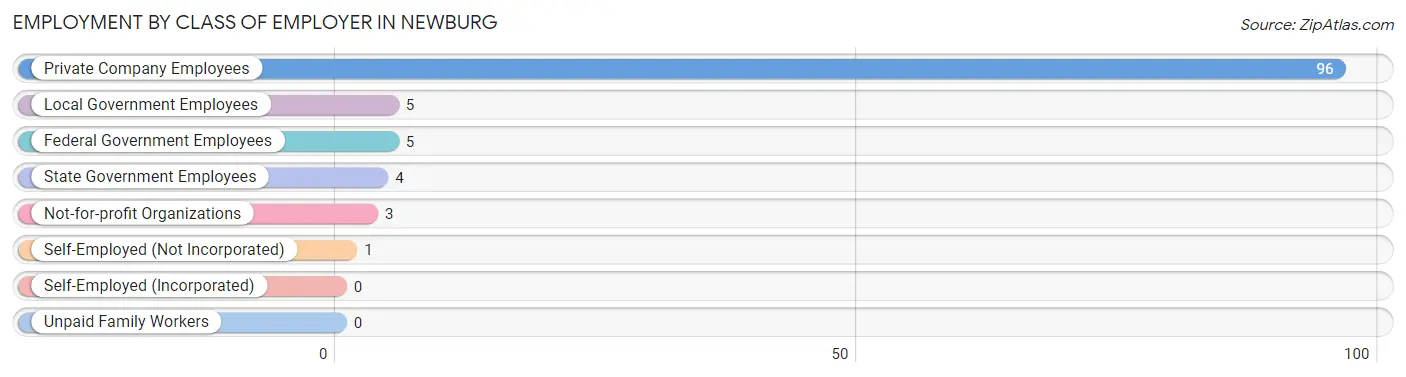
| Employer Class | # Employees | % Employees |
| Private Company Employees | 96 | 84.2% |
| Self-Employed (Incorporated) | 0 | 0.0% |
| Self-Employed (Not Incorporated) | 1 | 0.9% |
| Not-for-profit Organizations | 3 | 2.6% |
| Local Government Employees | 5 | 4.4% |
| State Government Employees | 4 | 3.5% |
| Federal Government Employees | 5 | 4.4% |
| Unpaid Family Workers | 0 | 0.0% |
| Total | 114 | 100.0% |
Employment Status by Age in Newburg
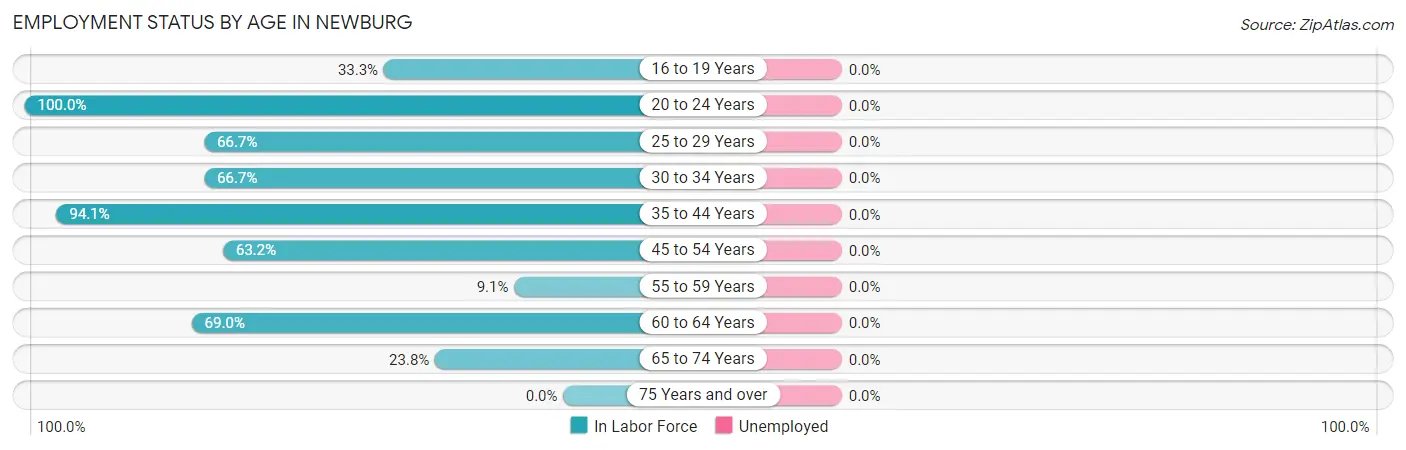
| Age Bracket | In Labor Force | Unemployed |
| 16 to 19 Years | 1 (33.3%) | 0 (0.0%) |
| 20 to 24 Years | 8 (100.0%) | 0 (0.0%) |
| 25 to 29 Years | 16 (66.7%) | 0 (0.0%) |
| 30 to 34 Years | 10 (66.7%) | 0 (0.0%) |
| 35 to 44 Years | 16 (94.1%) | 0 (0.0%) |
| 45 to 54 Years | 12 (63.2%) | 0 (0.0%) |
| 55 to 59 Years | 1 (9.1%) | 0 (0.0%) |
| 60 to 64 Years | 40 (69.0%) | 0 (0.0%) |
| 65 to 74 Years | 10 (23.8%) | 0 (0.0%) |
| 75 Years and over | 0 (0.0%) | 0 (0.0%) |
| Total | 114 (54.8%) | 0 (0.0%) |
Employment Status by Educational Attainment in Newburg
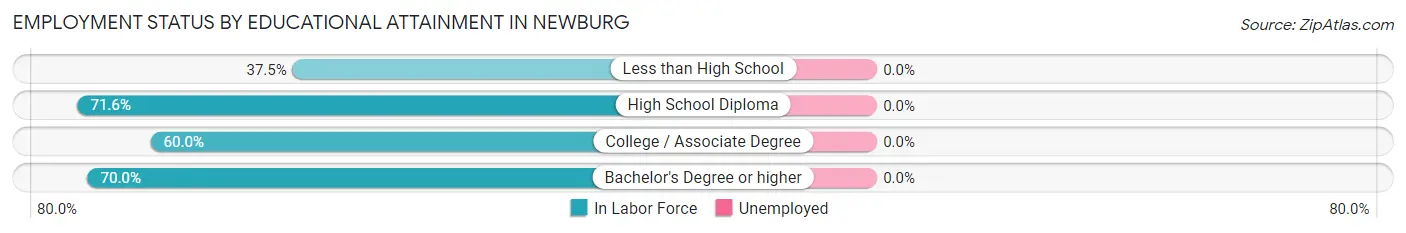
| Educational Attainment | In Labor Force | Unemployed |
| Less than High School | 6 (37.5%) | 0 (0.0%) |
| High School Diploma | 63 (71.6%) | 0 (0.0%) |
| College / Associate Degree | 12 (60.0%) | 0 (0.0%) |
| Bachelor's Degree or higher | 14 (70.0%) | 0 (0.0%) |
| Total | 95 (66.0%) | 0 (0.0%) |
Employment Occupations by Sex in Newburg
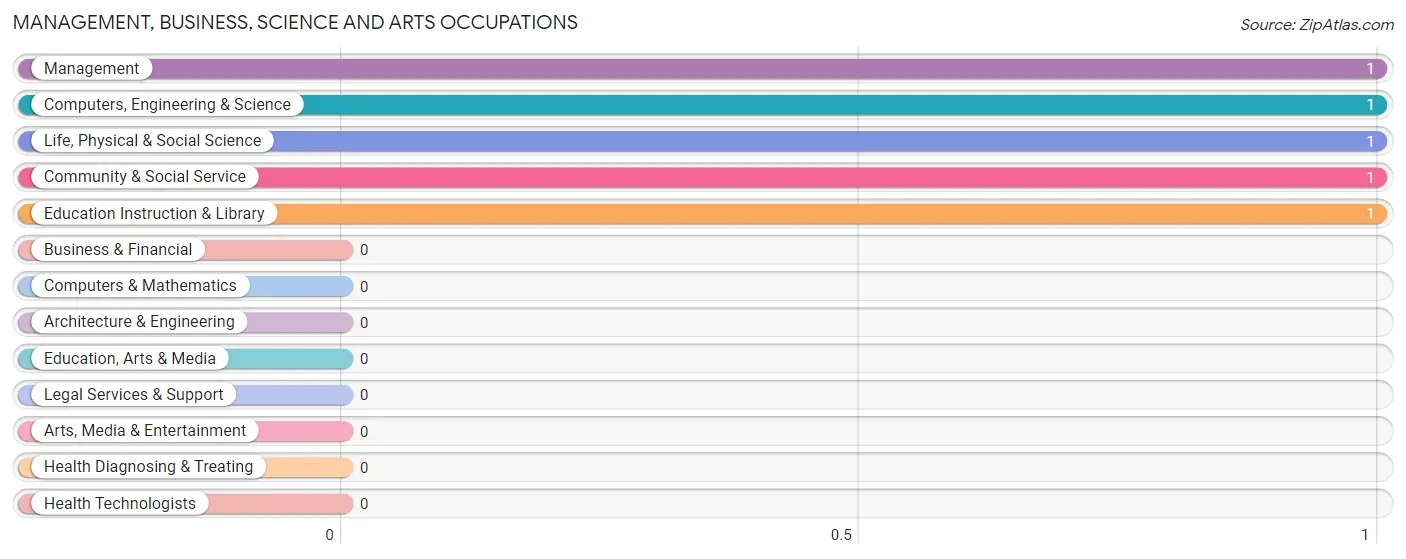
Management, Business, Science and Arts Occupations
The most common Management, Business, Science and Arts occupations in Newburg are Management (1 | 0.9%), Computers, Engineering & Science (1 | 0.9%), Life, Physical & Social Science (1 | 0.9%), Community & Social Service (1 | 0.9%), and Education Instruction & Library (1 | 0.9%).
Management, Business, Science and Arts Occupations by Sex
Within the Management, Business, Science and Arts occupations in Newburg, the most male-oriented occupations are Management (100.0%), Computers, Engineering & Science (100.0%), and Life, Physical & Social Science (100.0%), while the most female-oriented occupations are Community & Social Service (100.0%), and Education Instruction & Library (100.0%).
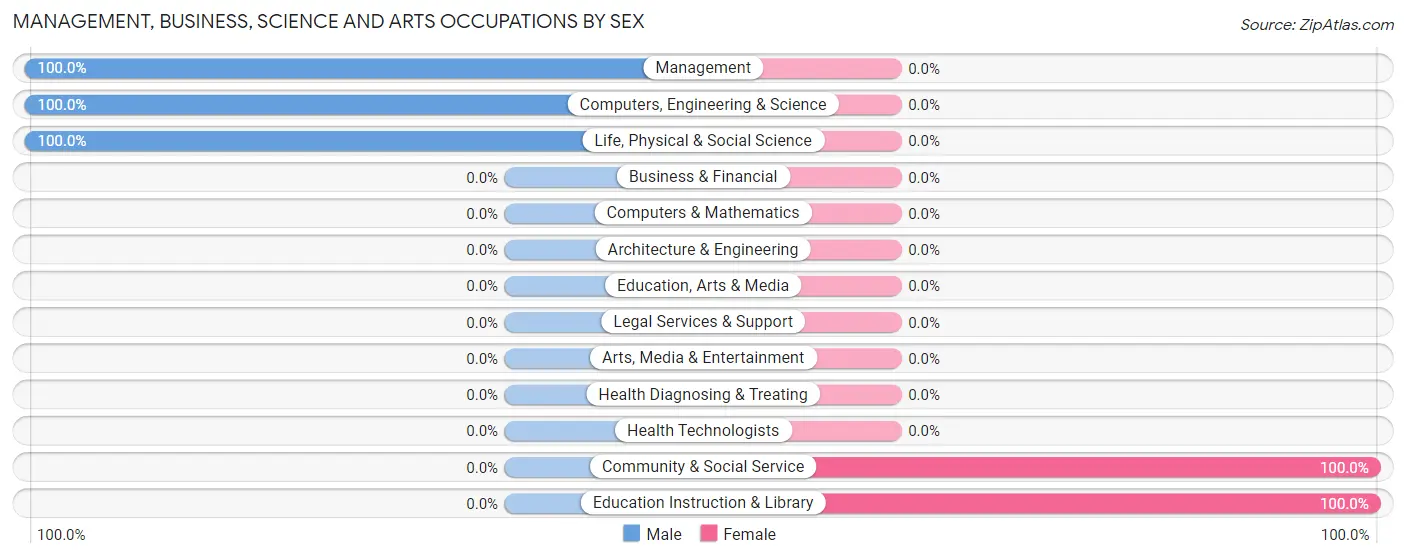
| Occupation | Male | Female |
| Management | 1 (100.0%) | 0 (0.0%) |
| Business & Financial | 0 (0.0%) | 0 (0.0%) |
| Computers, Engineering & Science | 1 (100.0%) | 0 (0.0%) |
| Computers & Mathematics | 0 (0.0%) | 0 (0.0%) |
| Architecture & Engineering | 0 (0.0%) | 0 (0.0%) |
| Life, Physical & Social Science | 1 (100.0%) | 0 (0.0%) |
| Community & Social Service | 0 (0.0%) | 1 (100.0%) |
| Education, Arts & Media | 0 (0.0%) | 0 (0.0%) |
| Legal Services & Support | 0 (0.0%) | 0 (0.0%) |
| Education Instruction & Library | 0 (0.0%) | 1 (100.0%) |
| Arts, Media & Entertainment | 0 (0.0%) | 0 (0.0%) |
| Health Diagnosing & Treating | 0 (0.0%) | 0 (0.0%) |
| Health Technologists | 0 (0.0%) | 0 (0.0%) |
| Total (Category) | 2 (66.7%) | 1 (33.3%) |
| Total (Overall) | 75 (65.8%) | 39 (34.2%) |
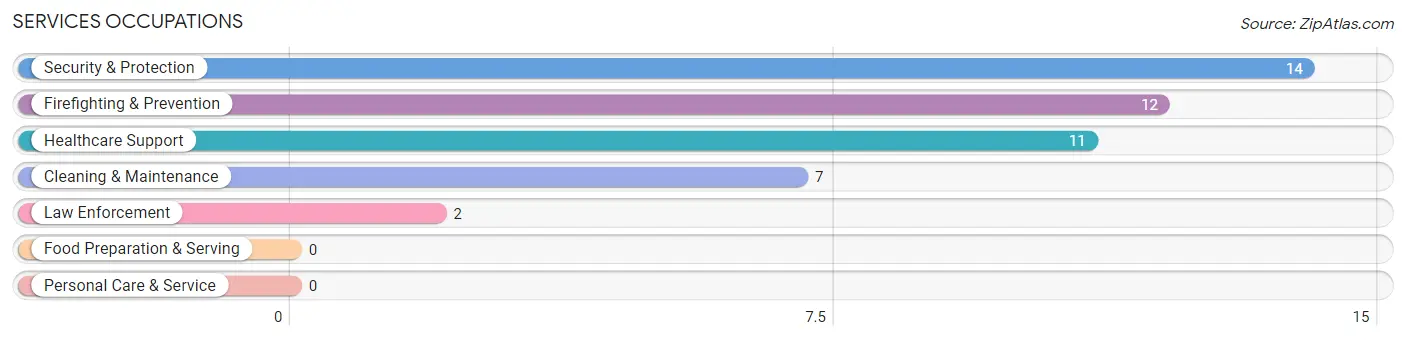
Services Occupations
The most common Services occupations in Newburg are Security & Protection (14 | 12.3%), Firefighting & Prevention (12 | 10.5%), Healthcare Support (11 | 9.7%), Cleaning & Maintenance (7 | 6.1%), and Law Enforcement (2 | 1.8%).
Services Occupations by Sex
Within the Services occupations in Newburg, the most male-oriented occupations are Security & Protection (100.0%), Firefighting & Prevention (100.0%), and Law Enforcement (100.0%), while the most female-oriented occupations are Healthcare Support (100.0%), and Cleaning & Maintenance (42.9%).
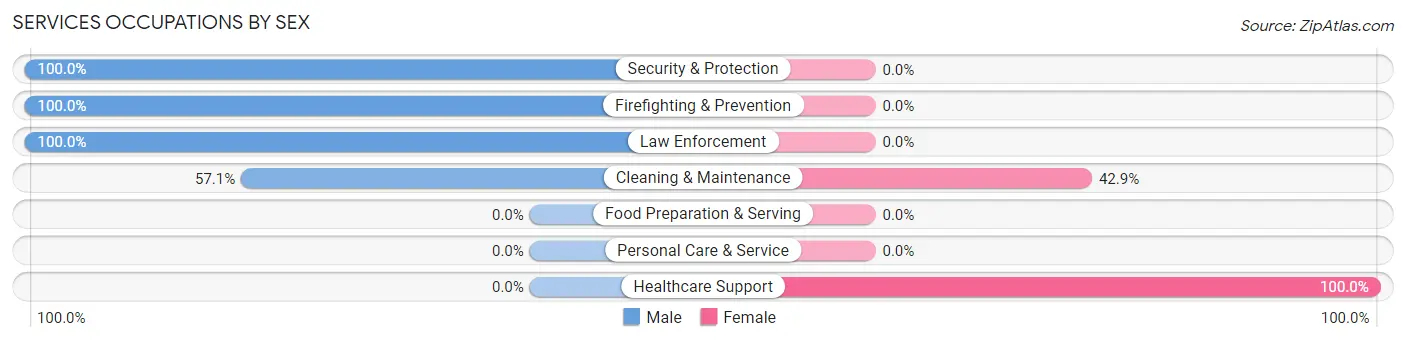
| Occupation | Male | Female |
| Healthcare Support | 0 (0.0%) | 11 (100.0%) |
| Security & Protection | 14 (100.0%) | 0 (0.0%) |
| Firefighting & Prevention | 12 (100.0%) | 0 (0.0%) |
| Law Enforcement | 2 (100.0%) | 0 (0.0%) |
| Food Preparation & Serving | 0 (0.0%) | 0 (0.0%) |
| Cleaning & Maintenance | 4 (57.1%) | 3 (42.9%) |
| Personal Care & Service | 0 (0.0%) | 0 (0.0%) |
| Total (Category) | 18 (56.2%) | 14 (43.8%) |
| Total (Overall) | 75 (65.8%) | 39 (34.2%) |
Sales and Office Occupations
The most common Sales and Office occupations in Newburg are Office & Administration (15 | 13.2%), and Sales & Related (11 | 9.7%).
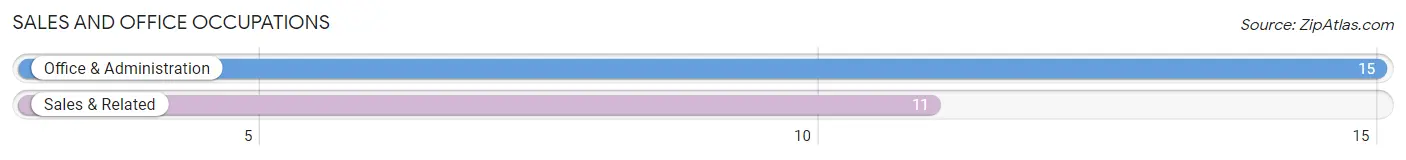
Sales and Office Occupations by Sex
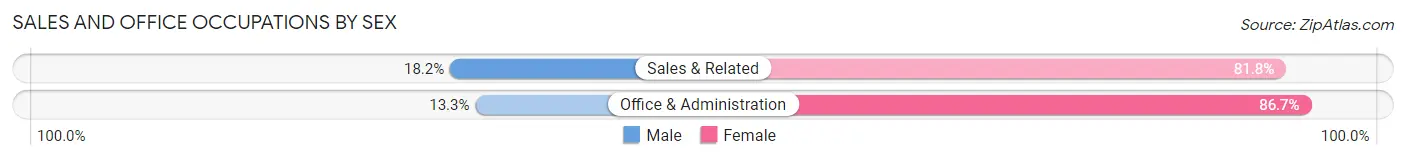
| Occupation | Male | Female |
| Sales & Related | 2 (18.2%) | 9 (81.8%) |
| Office & Administration | 2 (13.3%) | 13 (86.7%) |
| Total (Category) | 4 (15.4%) | 22 (84.6%) |
| Total (Overall) | 75 (65.8%) | 39 (34.2%) |
Natural Resources, Construction and Maintenance Occupations
The most common Natural Resources, Construction and Maintenance occupations in Newburg are Construction & Extraction (38 | 33.3%), and Installation, Maintenance & Repair (2 | 1.8%).
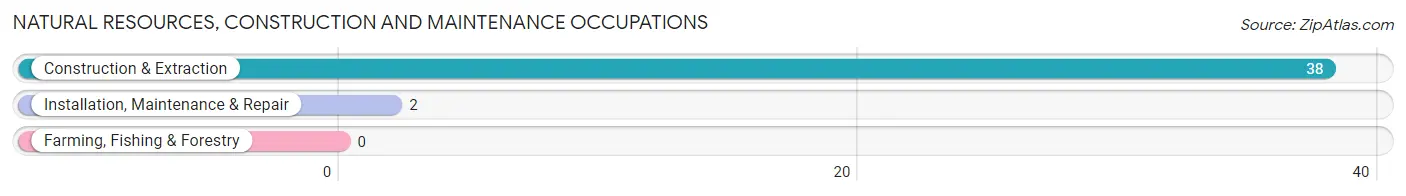
Natural Resources, Construction and Maintenance Occupations by Sex
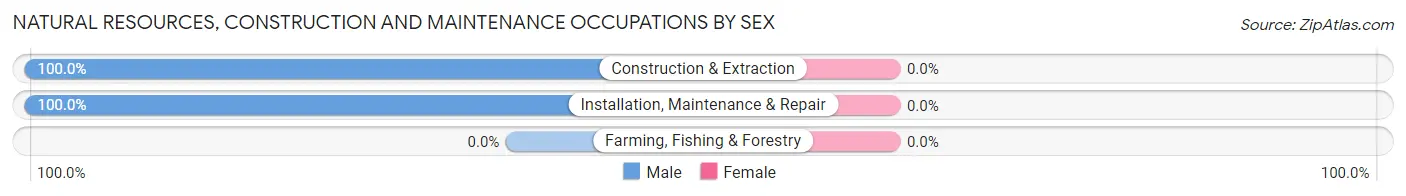
| Occupation | Male | Female |
| Farming, Fishing & Forestry | 0 (0.0%) | 0 (0.0%) |
| Construction & Extraction | 38 (100.0%) | 0 (0.0%) |
| Installation, Maintenance & Repair | 2 (100.0%) | 0 (0.0%) |
| Total (Category) | 40 (100.0%) | 0 (0.0%) |
| Total (Overall) | 75 (65.8%) | 39 (34.2%) |
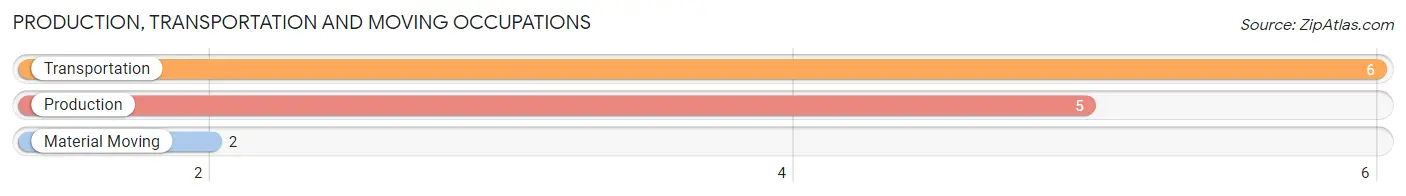
Production, Transportation and Moving Occupations
The most common Production, Transportation and Moving occupations in Newburg are Transportation (6 | 5.3%), Production (5 | 4.4%), and Material Moving (2 | 1.8%).
Production, Transportation and Moving Occupations by Sex
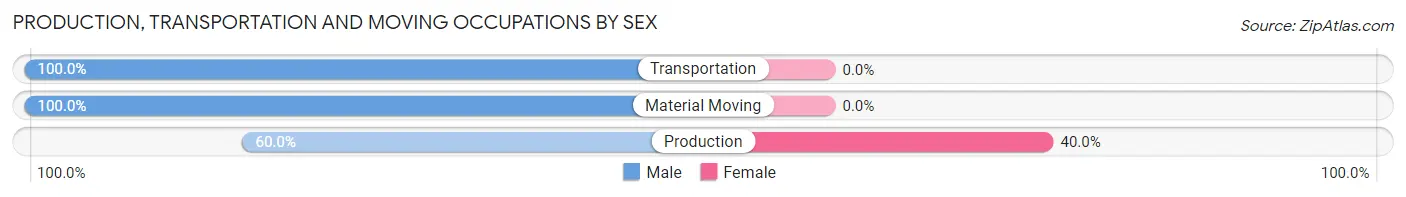
| Occupation | Male | Female |
| Production | 3 (60.0%) | 2 (40.0%) |
| Transportation | 6 (100.0%) | 0 (0.0%) |
| Material Moving | 2 (100.0%) | 0 (0.0%) |
| Total (Category) | 11 (84.6%) | 2 (15.4%) |
| Total (Overall) | 75 (65.8%) | 39 (34.2%) |
Employment Industries by Sex in Newburg
Employment Industries in Newburg
The major employment industries in Newburg include Mining, Quarrying, & Extraction (32 | 28.1%), Health Care & Social Assistance (17 | 14.9%), Administrative & Support (16 | 14.0%), Retail Trade (15 | 13.2%), and Construction (9 | 7.9%).
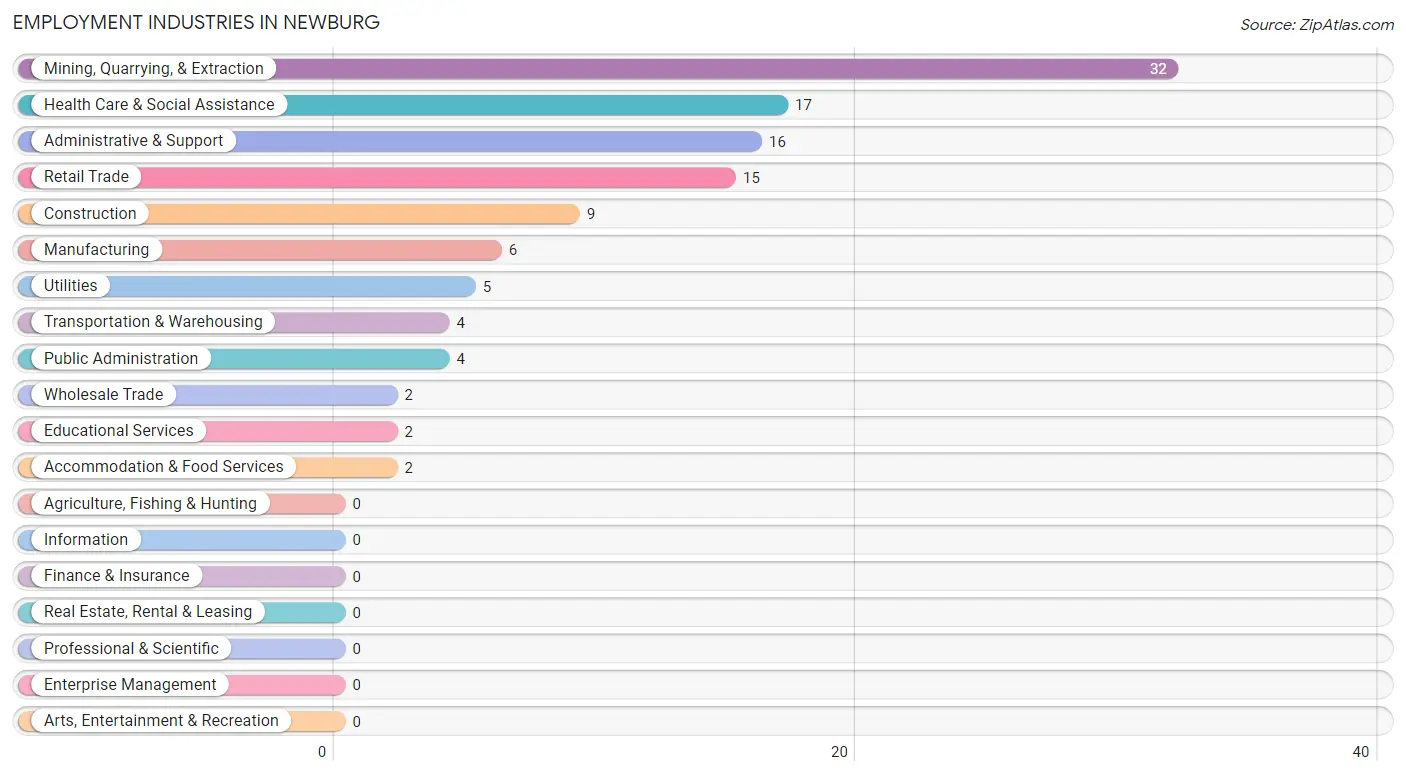
Employment Industries by Sex in Newburg
The Newburg industries that see more men than women are Mining, Quarrying, & Extraction (100.0%), Construction (100.0%), and Manufacturing (100.0%), whereas the industries that tend to have a higher number of women are Wholesale Trade (100.0%), Utilities (100.0%), and Educational Services (100.0%).
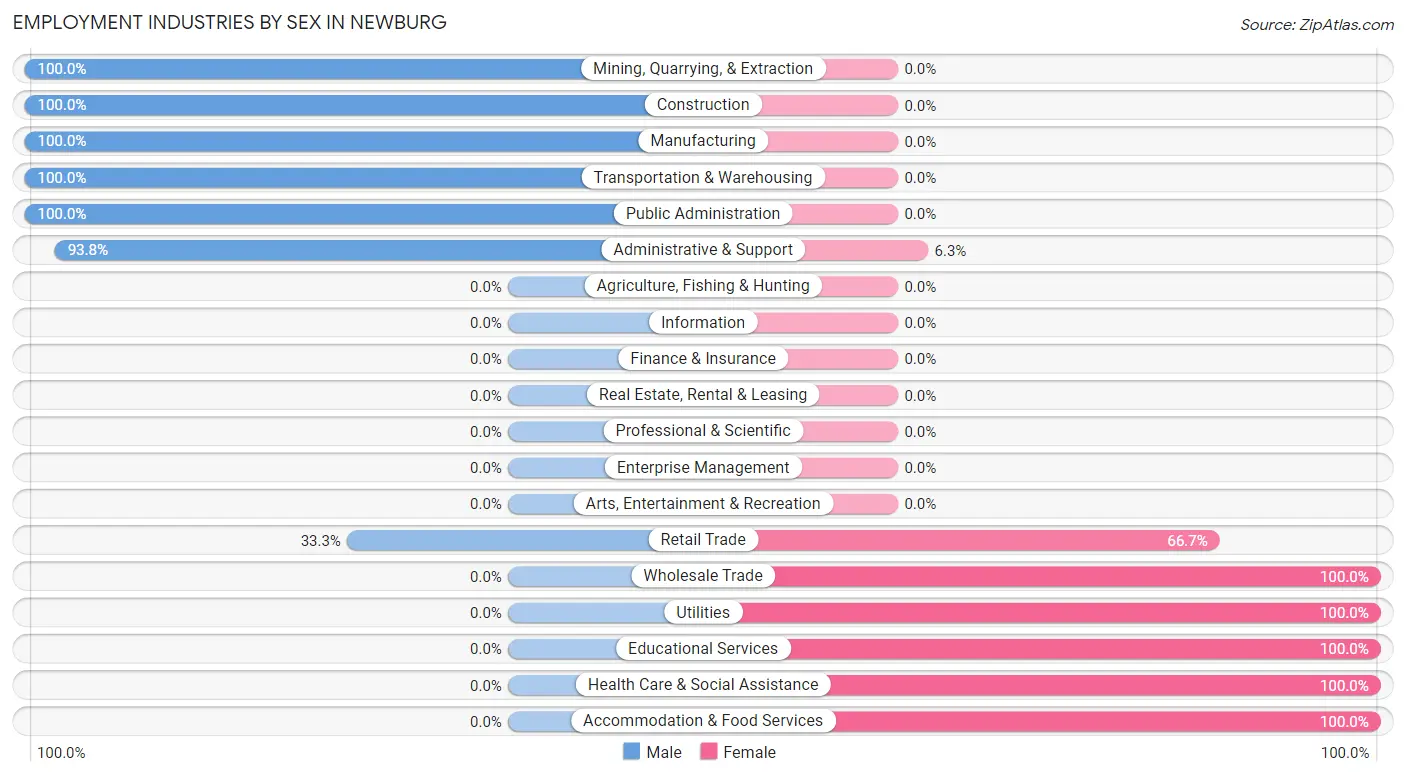
| Industry | Male | Female |
| Agriculture, Fishing & Hunting | 0 (0.0%) | 0 (0.0%) |
| Mining, Quarrying, & Extraction | 32 (100.0%) | 0 (0.0%) |
| Construction | 9 (100.0%) | 0 (0.0%) |
| Manufacturing | 6 (100.0%) | 0 (0.0%) |
| Wholesale Trade | 0 (0.0%) | 2 (100.0%) |
| Retail Trade | 5 (33.3%) | 10 (66.7%) |
| Transportation & Warehousing | 4 (100.0%) | 0 (0.0%) |
| Utilities | 0 (0.0%) | 5 (100.0%) |
| Information | 0 (0.0%) | 0 (0.0%) |
| Finance & Insurance | 0 (0.0%) | 0 (0.0%) |
| Real Estate, Rental & Leasing | 0 (0.0%) | 0 (0.0%) |
| Professional & Scientific | 0 (0.0%) | 0 (0.0%) |
| Enterprise Management | 0 (0.0%) | 0 (0.0%) |
| Administrative & Support | 15 (93.8%) | 1 (6.2%) |
| Educational Services | 0 (0.0%) | 2 (100.0%) |
| Health Care & Social Assistance | 0 (0.0%) | 17 (100.0%) |
| Arts, Entertainment & Recreation | 0 (0.0%) | 0 (0.0%) |
| Accommodation & Food Services | 0 (0.0%) | 2 (100.0%) |
| Public Administration | 4 (100.0%) | 0 (0.0%) |
| Total | 75 (65.8%) | 39 (34.2%) |
Education in Newburg
School Enrollment in Newburg
The most common levels of schooling among the 29 students in Newburg are college / undergraduate (8 | 27.6%), elementary school (7 | 24.1%), and middle school (6 | 20.7%).
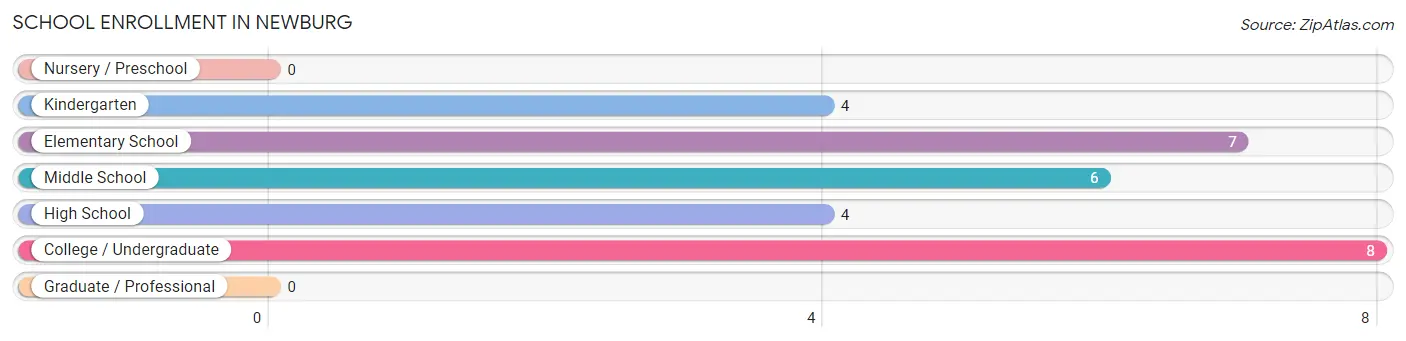
| School Level | # Students | % Students |
| Nursery / Preschool | 0 | 0.0% |
| Kindergarten | 4 | 13.8% |
| Elementary School | 7 | 24.1% |
| Middle School | 6 | 20.7% |
| High School | 4 | 13.8% |
| College / Undergraduate | 8 | 27.6% |
| Graduate / Professional | 0 | 0.0% |
| Total | 29 | 100.0% |
School Enrollment by Age by Funding Source in Newburg
Out of a total of 29 students who are enrolled in schools in Newburg, 8 (27.6%) attend a private institution, while the remaining 21 (72.4%) are enrolled in public schools. The age group of 25 to 34 year olds has the highest likelihood of being enrolled in private schools, with 4 (50.0% in the age bracket) enrolled. Conversely, the age group of 10 to 14 year olds has the lowest likelihood of being enrolled in a private school, with 7 (100.0% in the age bracket) attending a public institution.
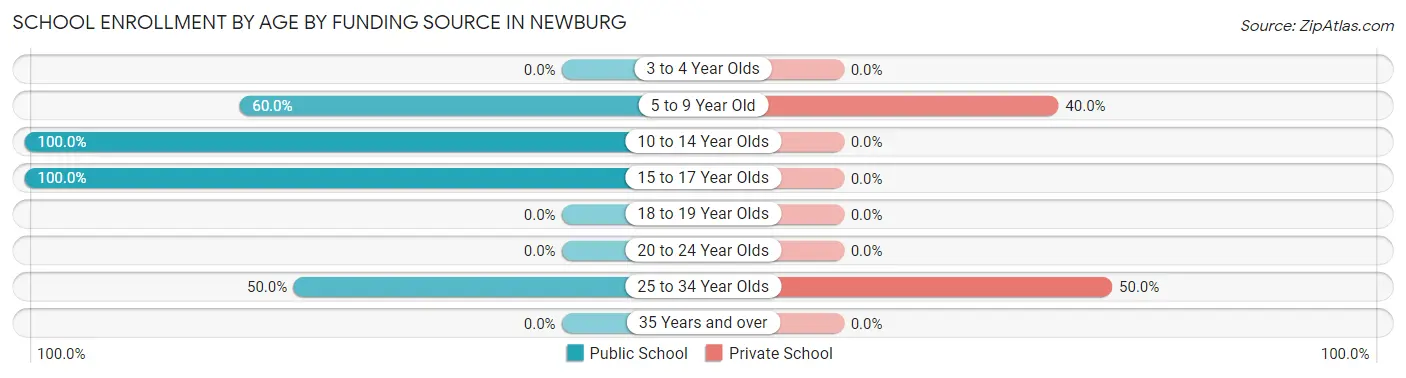
| Age Bracket | Public School | Private School |
| 3 to 4 Year Olds | 0 (0.0%) | 0 (0.0%) |
| 5 to 9 Year Old | 6 (60.0%) | 4 (40.0%) |
| 10 to 14 Year Olds | 7 (100.0%) | 0 (0.0%) |
| 15 to 17 Year Olds | 4 (100.0%) | 0 (0.0%) |
| 18 to 19 Year Olds | 0 (0.0%) | 0 (0.0%) |
| 20 to 24 Year Olds | 0 (0.0%) | 0 (0.0%) |
| 25 to 34 Year Olds | 4 (50.0%) | 4 (50.0%) |
| 35 Years and over | 0 (0.0%) | 0 (0.0%) |
| Total | 21 (72.4%) | 8 (27.6%) |
Educational Attainment by Field of Study in Newburg
Physical & health sciences (11 | 50.0%), liberal arts & history (5 | 22.7%), science & technology (3 | 13.6%), engineering (1 | 4.5%), and education (1 | 4.5%) are the most common fields of study among 22 individuals in Newburg who have obtained a bachelor's degree or higher.
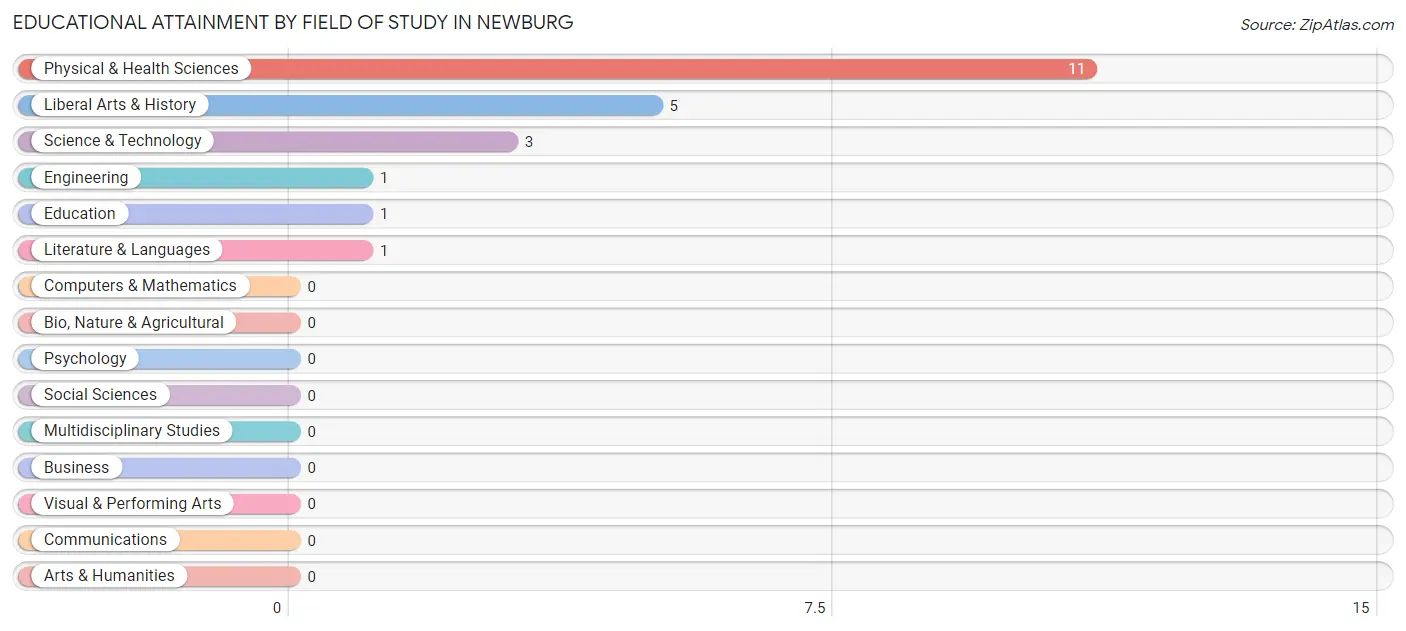
| Field of Study | # Graduates | % Graduates |
| Computers & Mathematics | 0 | 0.0% |
| Bio, Nature & Agricultural | 0 | 0.0% |
| Physical & Health Sciences | 11 | 50.0% |
| Psychology | 0 | 0.0% |
| Social Sciences | 0 | 0.0% |
| Engineering | 1 | 4.5% |
| Multidisciplinary Studies | 0 | 0.0% |
| Science & Technology | 3 | 13.6% |
| Business | 0 | 0.0% |
| Education | 1 | 4.5% |
| Literature & Languages | 1 | 4.5% |
| Liberal Arts & History | 5 | 22.7% |
| Visual & Performing Arts | 0 | 0.0% |
| Communications | 0 | 0.0% |
| Arts & Humanities | 0 | 0.0% |
| Total | 22 | 100.0% |
Transportation & Commute in Newburg
Vehicle Availability by Sex in Newburg
The most prevalent vehicle ownership categories in Newburg are males with 2 vehicles (50, accounting for 66.7%) and females with 2 vehicles (18, making up 128.2%).
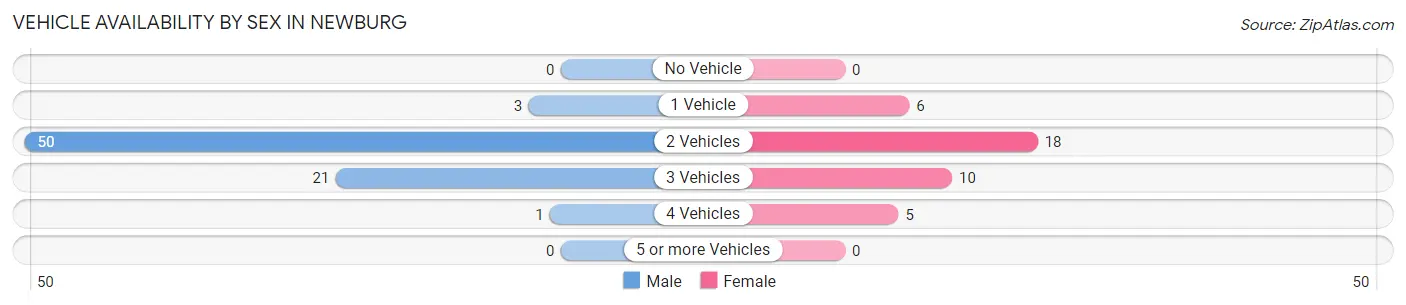
| Vehicles Available | Male | Female |
| No Vehicle | 0 (0.0%) | 0 (0.0%) |
| 1 Vehicle | 3 (4.0%) | 6 (15.4%) |
| 2 Vehicles | 50 (66.7%) | 18 (46.2%) |
| 3 Vehicles | 21 (28.0%) | 10 (25.6%) |
| 4 Vehicles | 1 (1.3%) | 5 (12.8%) |
| 5 or more Vehicles | 0 (0.0%) | 0 (0.0%) |
| Total | 75 (100.0%) | 39 (100.0%) |
Commute Time in Newburg
The most frequently occuring commute durations in Newburg are 90 or more minutes (37 commuters, 33.3%), 60 to 89 minutes (21 commuters, 18.9%), and 15 to 19 minutes (14 commuters, 12.6%).
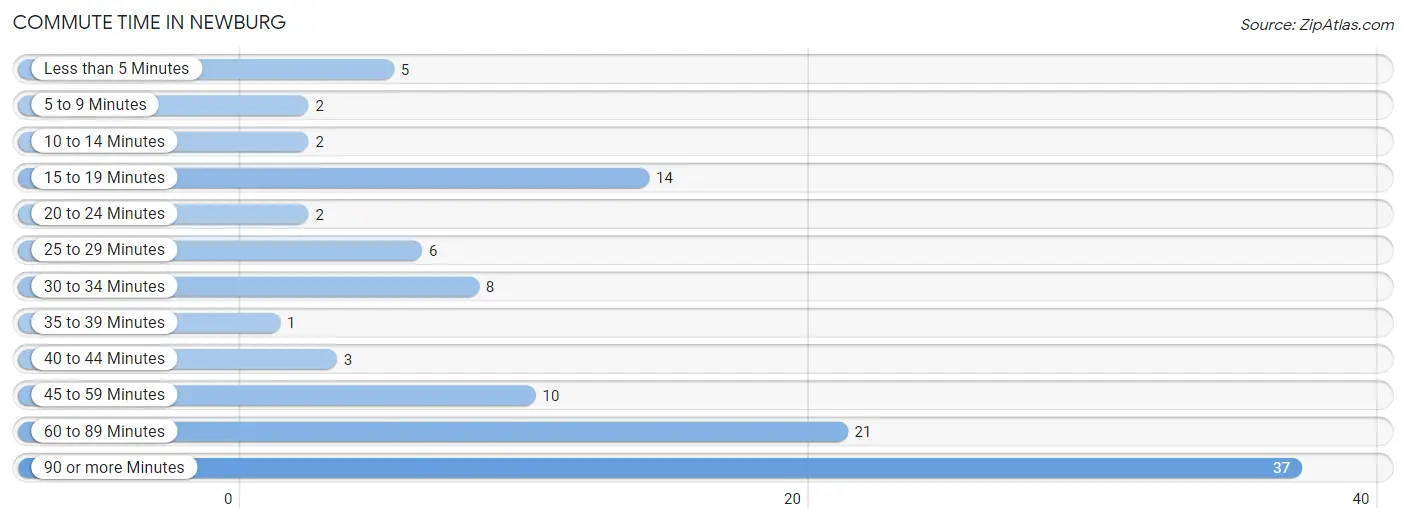
| Commute Time | # Commuters | % Commuters |
| Less than 5 Minutes | 5 | 4.5% |
| 5 to 9 Minutes | 2 | 1.8% |
| 10 to 14 Minutes | 2 | 1.8% |
| 15 to 19 Minutes | 14 | 12.6% |
| 20 to 24 Minutes | 2 | 1.8% |
| 25 to 29 Minutes | 6 | 5.4% |
| 30 to 34 Minutes | 8 | 7.2% |
| 35 to 39 Minutes | 1 | 0.9% |
| 40 to 44 Minutes | 3 | 2.7% |
| 45 to 59 Minutes | 10 | 9.0% |
| 60 to 89 Minutes | 21 | 18.9% |
| 90 or more Minutes | 37 | 33.3% |
Commute Time by Sex in Newburg
The most common commute times in Newburg are 90 or more minutes (37 commuters, 49.3%) for males and 60 to 89 minutes (9 commuters, 25.0%) for females.
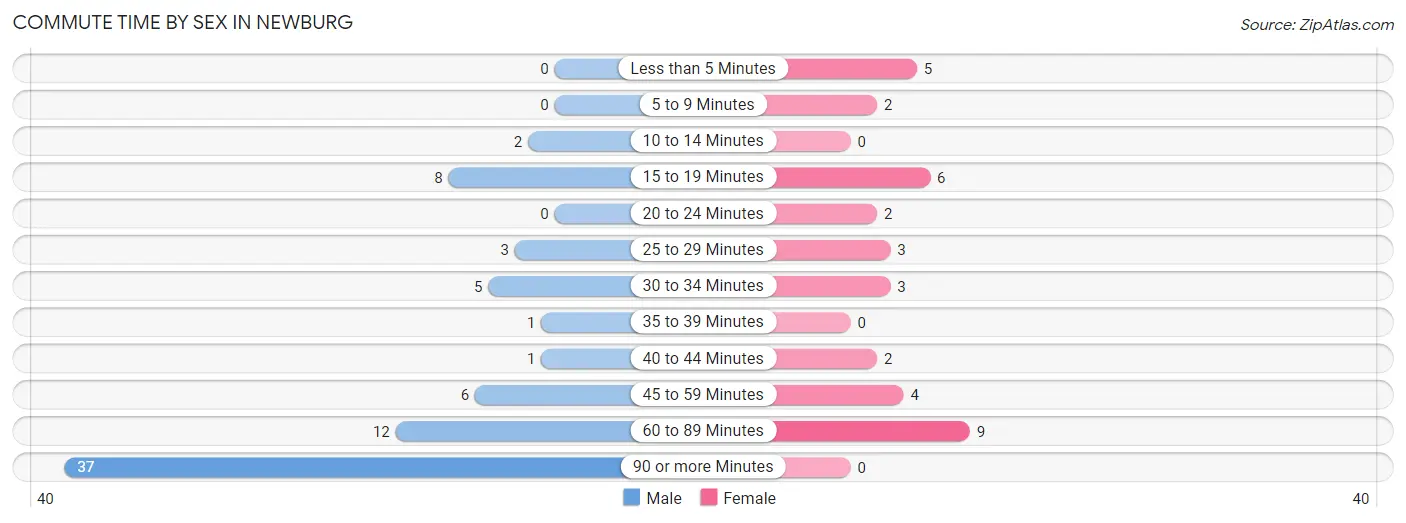
| Commute Time | Male | Female |
| Less than 5 Minutes | 0 (0.0%) | 5 (13.9%) |
| 5 to 9 Minutes | 0 (0.0%) | 2 (5.6%) |
| 10 to 14 Minutes | 2 (2.7%) | 0 (0.0%) |
| 15 to 19 Minutes | 8 (10.7%) | 6 (16.7%) |
| 20 to 24 Minutes | 0 (0.0%) | 2 (5.6%) |
| 25 to 29 Minutes | 3 (4.0%) | 3 (8.3%) |
| 30 to 34 Minutes | 5 (6.7%) | 3 (8.3%) |
| 35 to 39 Minutes | 1 (1.3%) | 0 (0.0%) |
| 40 to 44 Minutes | 1 (1.3%) | 2 (5.6%) |
| 45 to 59 Minutes | 6 (8.0%) | 4 (11.1%) |
| 60 to 89 Minutes | 12 (16.0%) | 9 (25.0%) |
| 90 or more Minutes | 37 (49.3%) | 0 (0.0%) |
Time of Departure to Work by Sex in Newburg
The most frequent times of departure to work in Newburg are 12:00 PM to 3:59 PM (32, 42.7%) for males and 6:30 AM to 6:59 AM (11, 30.6%) for females.
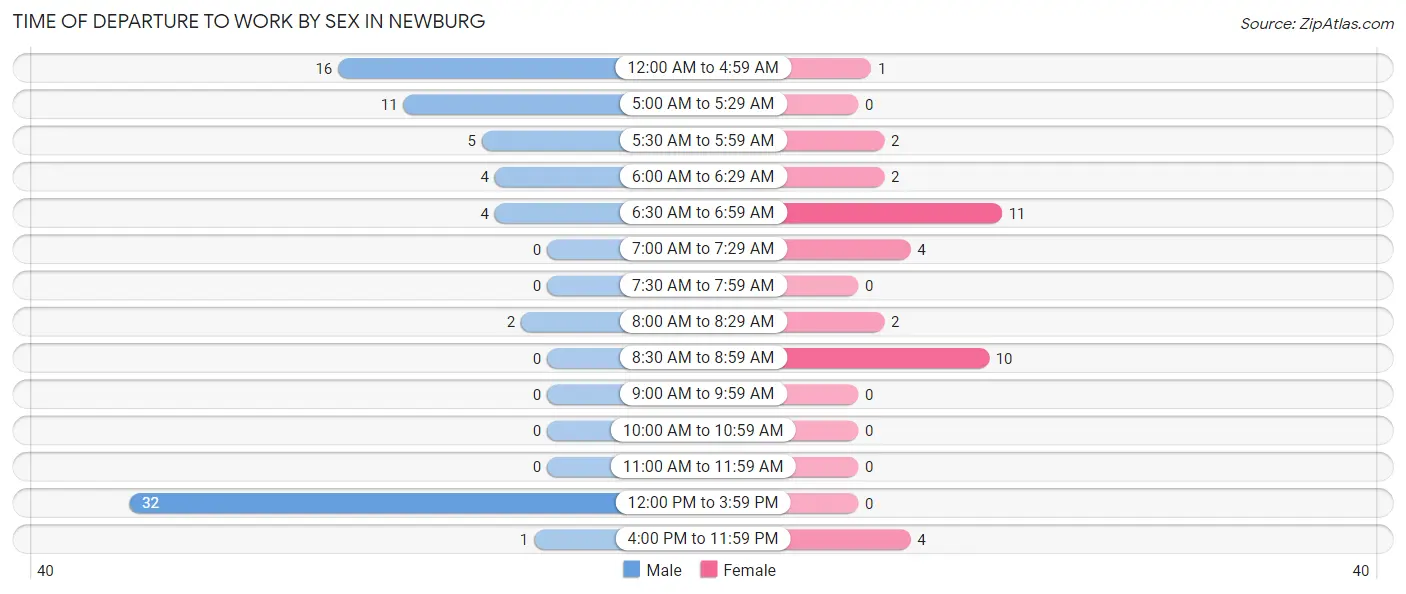
| Time of Departure | Male | Female |
| 12:00 AM to 4:59 AM | 16 (21.3%) | 1 (2.8%) |
| 5:00 AM to 5:29 AM | 11 (14.7%) | 0 (0.0%) |
| 5:30 AM to 5:59 AM | 5 (6.7%) | 2 (5.6%) |
| 6:00 AM to 6:29 AM | 4 (5.3%) | 2 (5.6%) |
| 6:30 AM to 6:59 AM | 4 (5.3%) | 11 (30.6%) |
| 7:00 AM to 7:29 AM | 0 (0.0%) | 4 (11.1%) |
| 7:30 AM to 7:59 AM | 0 (0.0%) | 0 (0.0%) |
| 8:00 AM to 8:29 AM | 2 (2.7%) | 2 (5.6%) |
| 8:30 AM to 8:59 AM | 0 (0.0%) | 10 (27.8%) |
| 9:00 AM to 9:59 AM | 0 (0.0%) | 0 (0.0%) |
| 10:00 AM to 10:59 AM | 0 (0.0%) | 0 (0.0%) |
| 11:00 AM to 11:59 AM | 0 (0.0%) | 0 (0.0%) |
| 12:00 PM to 3:59 PM | 32 (42.7%) | 0 (0.0%) |
| 4:00 PM to 11:59 PM | 1 (1.3%) | 4 (11.1%) |
| Total | 75 (100.0%) | 36 (100.0%) |
Housing Occupancy in Newburg
Occupancy by Ownership in Newburg
Of the total 116 dwellings in Newburg, owner-occupied units account for 97 (83.6%), while renter-occupied units make up 19 (16.4%).
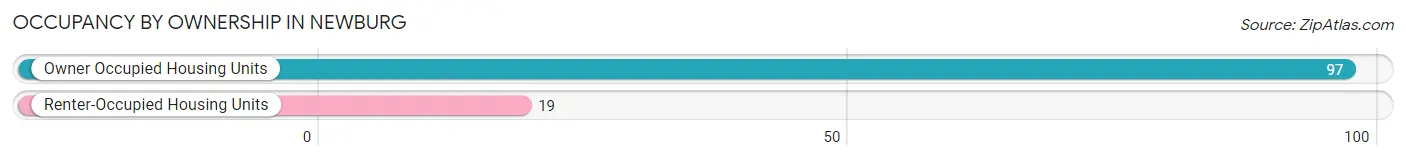
| Occupancy | # Housing Units | % Housing Units |
| Owner Occupied Housing Units | 97 | 83.6% |
| Renter-Occupied Housing Units | 19 | 16.4% |
| Total Occupied Housing Units | 116 | 100.0% |
Occupancy by Household Size in Newburg
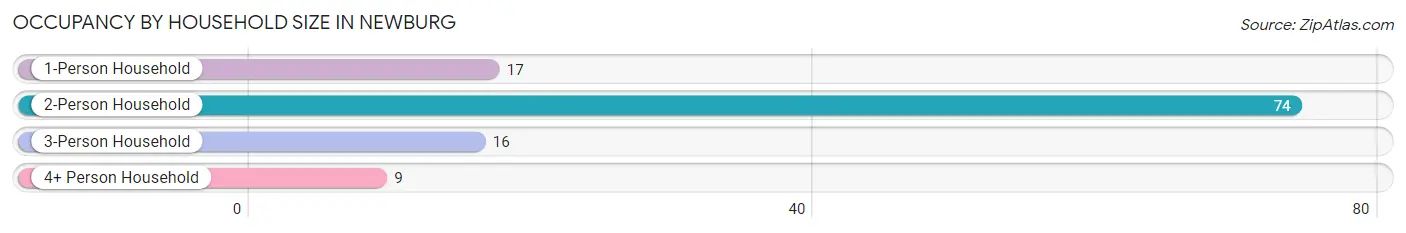
| Household Size | # Housing Units | % Housing Units |
| 1-Person Household | 17 | 14.7% |
| 2-Person Household | 74 | 63.8% |
| 3-Person Household | 16 | 13.8% |
| 4+ Person Household | 9 | 7.8% |
| Total Housing Units | 116 | 100.0% |
Occupancy by Ownership by Household Size in Newburg
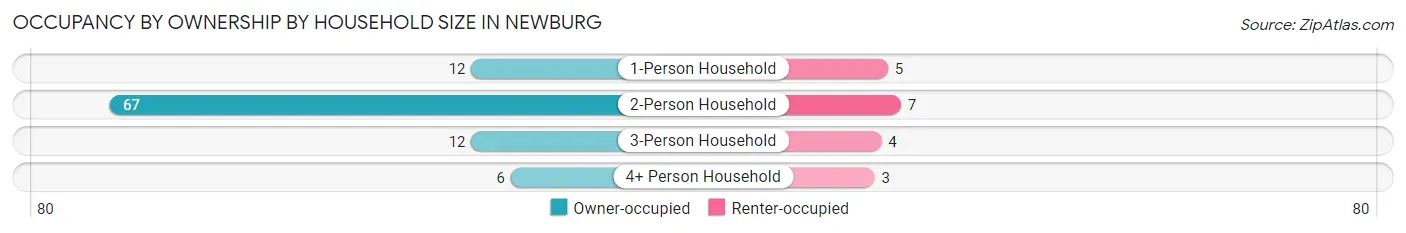
| Household Size | Owner-occupied | Renter-occupied |
| 1-Person Household | 12 (70.6%) | 5 (29.4%) |
| 2-Person Household | 67 (90.5%) | 7 (9.5%) |
| 3-Person Household | 12 (75.0%) | 4 (25.0%) |
| 4+ Person Household | 6 (66.7%) | 3 (33.3%) |
| Total Housing Units | 97 (83.6%) | 19 (16.4%) |
Occupancy by Educational Attainment in Newburg
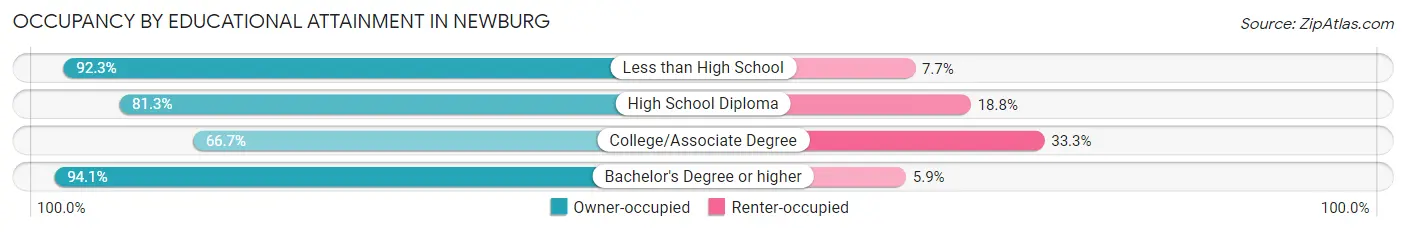
| Household Size | Owner-occupied | Renter-occupied |
| Less than High School | 12 (92.3%) | 1 (7.7%) |
| High School Diploma | 65 (81.2%) | 15 (18.8%) |
| College/Associate Degree | 4 (66.7%) | 2 (33.3%) |
| Bachelor's Degree or higher | 16 (94.1%) | 1 (5.9%) |
Occupancy by Age of Householder in Newburg
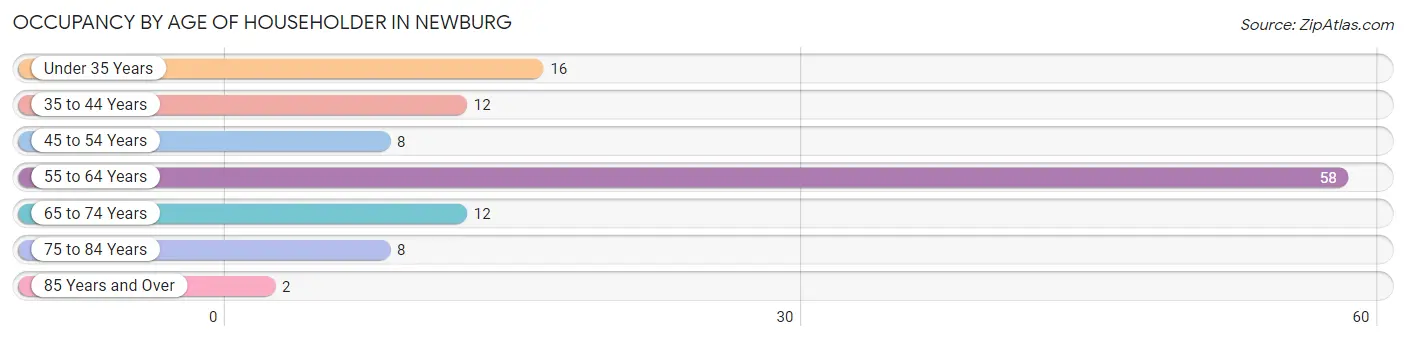
| Age Bracket | # Households | % Households |
| Under 35 Years | 16 | 13.8% |
| 35 to 44 Years | 12 | 10.3% |
| 45 to 54 Years | 8 | 6.9% |
| 55 to 64 Years | 58 | 50.0% |
| 65 to 74 Years | 12 | 10.3% |
| 75 to 84 Years | 8 | 6.9% |
| 85 Years and Over | 2 | 1.7% |
| Total | 116 | 100.0% |
Housing Finances in Newburg
Median Income by Occupancy in Newburg
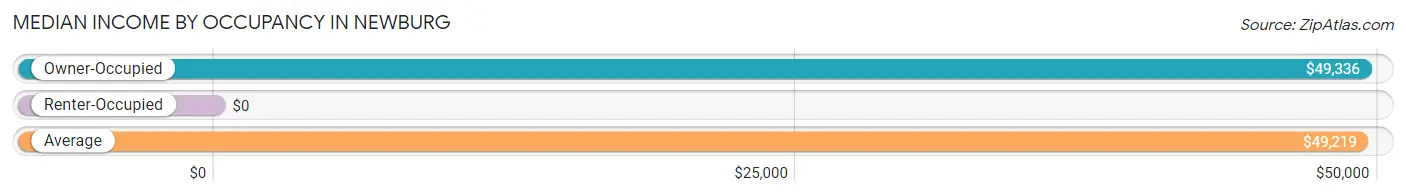
| Occupancy Type | # Households | Median Income |
| Owner-Occupied | 97 (83.6%) | $49,336 |
| Renter-Occupied | 19 (16.4%) | $0 |
| Average | 116 (100.0%) | $49,219 |
Occupancy by Householder Income Bracket in Newburg
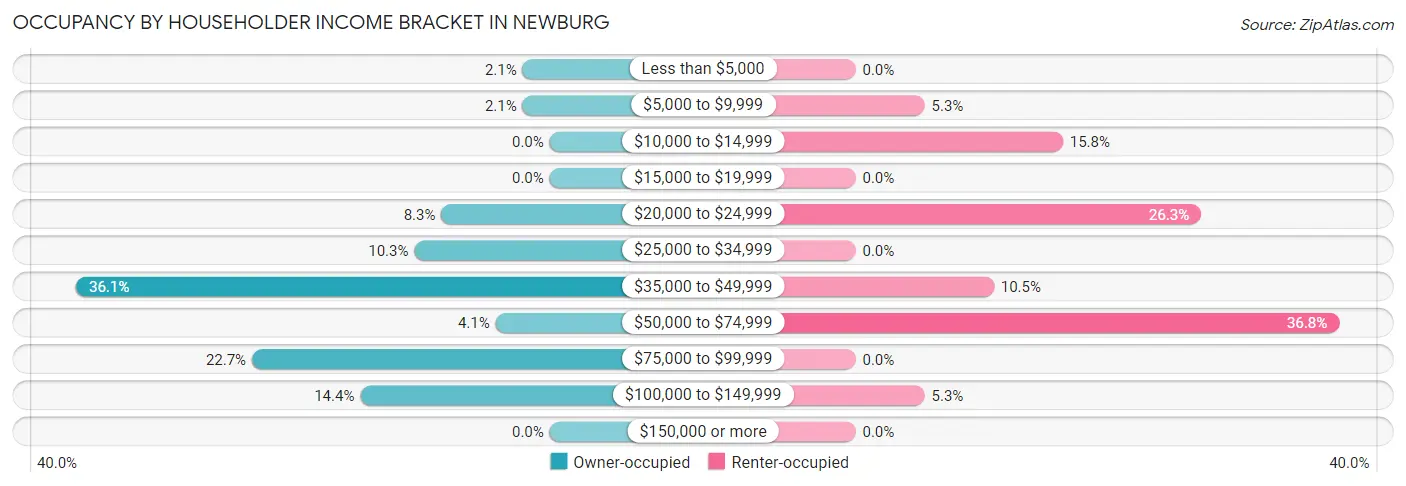
| Income Bracket | Owner-occupied | Renter-occupied |
| Less than $5,000 | 2 (2.1%) | 0 (0.0%) |
| $5,000 to $9,999 | 2 (2.1%) | 1 (5.3%) |
| $10,000 to $14,999 | 0 (0.0%) | 3 (15.8%) |
| $15,000 to $19,999 | 0 (0.0%) | 0 (0.0%) |
| $20,000 to $24,999 | 8 (8.3%) | 5 (26.3%) |
| $25,000 to $34,999 | 10 (10.3%) | 0 (0.0%) |
| $35,000 to $49,999 | 35 (36.1%) | 2 (10.5%) |
| $50,000 to $74,999 | 4 (4.1%) | 7 (36.8%) |
| $75,000 to $99,999 | 22 (22.7%) | 0 (0.0%) |
| $100,000 to $149,999 | 14 (14.4%) | 1 (5.3%) |
| $150,000 or more | 0 (0.0%) | 0 (0.0%) |
| Total | 97 (100.0%) | 19 (100.0%) |
Monthly Housing Cost Tiers in Newburg
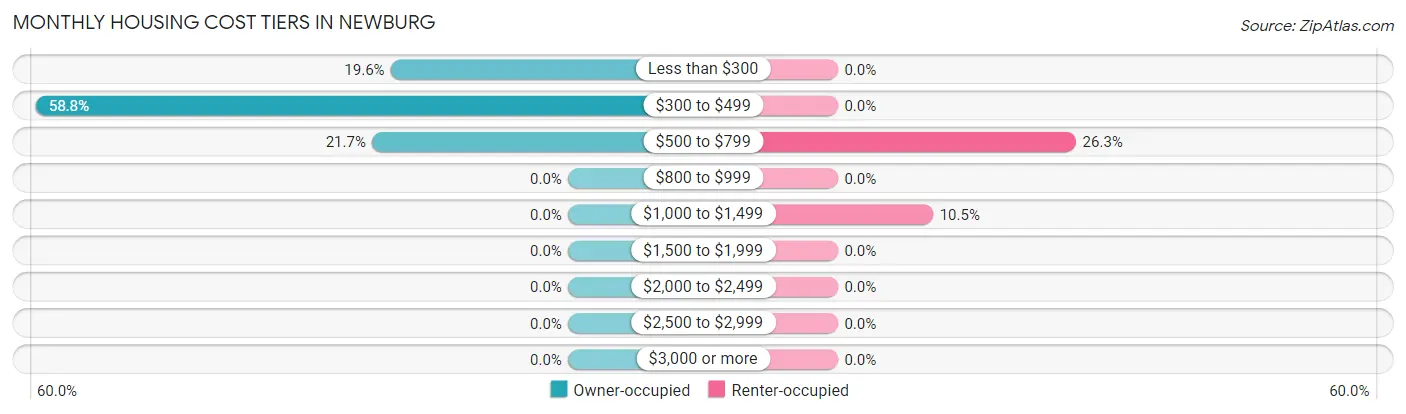
| Monthly Cost | Owner-occupied | Renter-occupied |
| Less than $300 | 19 (19.6%) | 0 (0.0%) |
| $300 to $499 | 57 (58.8%) | 0 (0.0%) |
| $500 to $799 | 21 (21.6%) | 5 (26.3%) |
| $800 to $999 | 0 (0.0%) | 0 (0.0%) |
| $1,000 to $1,499 | 0 (0.0%) | 2 (10.5%) |
| $1,500 to $1,999 | 0 (0.0%) | 0 (0.0%) |
| $2,000 to $2,499 | 0 (0.0%) | 0 (0.0%) |
| $2,500 to $2,999 | 0 (0.0%) | 0 (0.0%) |
| $3,000 or more | 0 (0.0%) | 0 (0.0%) |
| Total | 97 (100.0%) | 19 (100.0%) |
Physical Housing Characteristics in Newburg
Housing Structures in Newburg
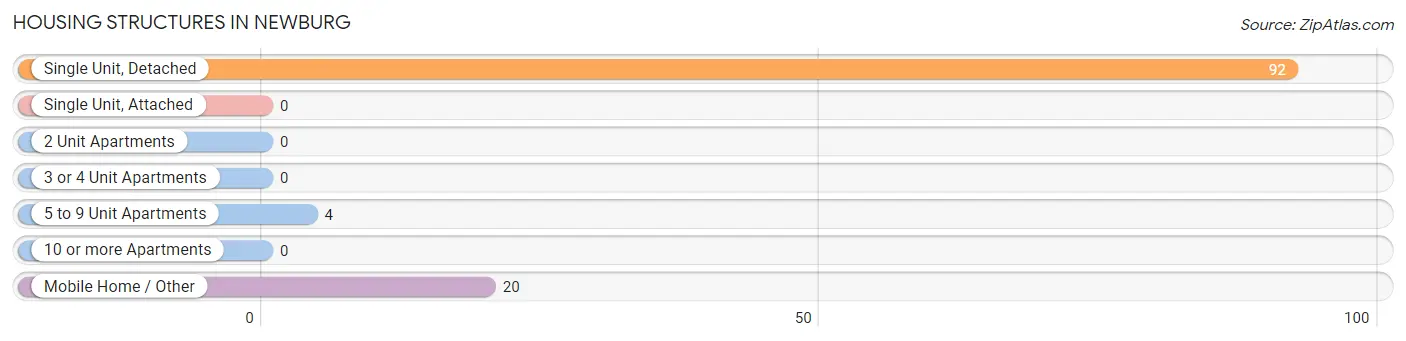
| Structure Type | # Housing Units | % Housing Units |
| Single Unit, Detached | 92 | 79.3% |
| Single Unit, Attached | 0 | 0.0% |
| 2 Unit Apartments | 0 | 0.0% |
| 3 or 4 Unit Apartments | 0 | 0.0% |
| 5 to 9 Unit Apartments | 4 | 3.5% |
| 10 or more Apartments | 0 | 0.0% |
| Mobile Home / Other | 20 | 17.2% |
| Total | 116 | 100.0% |
Housing Structures by Occupancy in Newburg
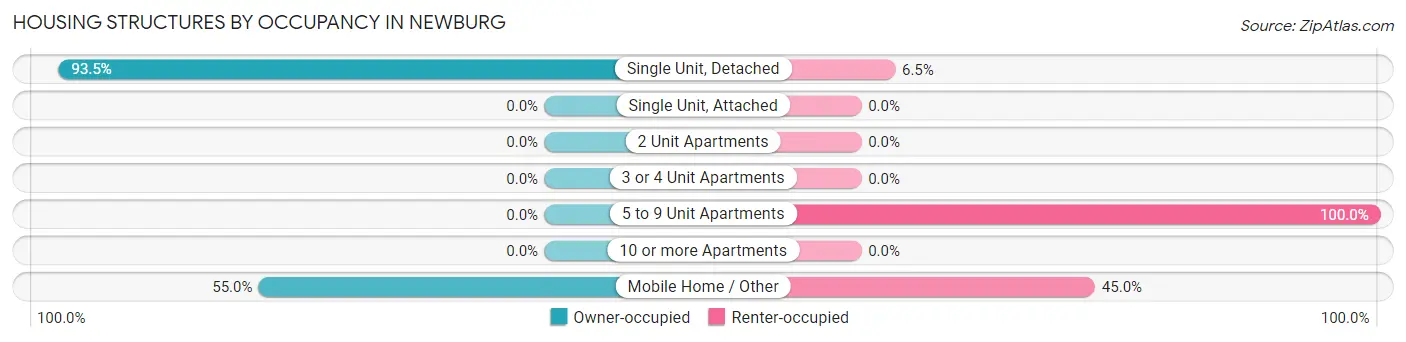
| Structure Type | Owner-occupied | Renter-occupied |
| Single Unit, Detached | 86 (93.5%) | 6 (6.5%) |
| Single Unit, Attached | 0 (0.0%) | 0 (0.0%) |
| 2 Unit Apartments | 0 (0.0%) | 0 (0.0%) |
| 3 or 4 Unit Apartments | 0 (0.0%) | 0 (0.0%) |
| 5 to 9 Unit Apartments | 0 (0.0%) | 4 (100.0%) |
| 10 or more Apartments | 0 (0.0%) | 0 (0.0%) |
| Mobile Home / Other | 11 (55.0%) | 9 (45.0%) |
| Total | 97 (83.6%) | 19 (16.4%) |
Housing Structures by Number of Rooms in Newburg
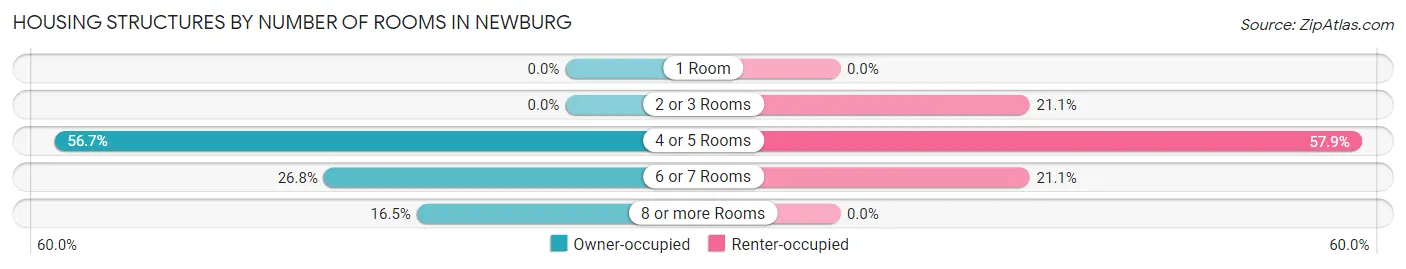
| Number of Rooms | Owner-occupied | Renter-occupied |
| 1 Room | 0 (0.0%) | 0 (0.0%) |
| 2 or 3 Rooms | 0 (0.0%) | 4 (21.0%) |
| 4 or 5 Rooms | 55 (56.7%) | 11 (57.9%) |
| 6 or 7 Rooms | 26 (26.8%) | 4 (21.0%) |
| 8 or more Rooms | 16 (16.5%) | 0 (0.0%) |
| Total | 97 (100.0%) | 19 (100.0%) |
Housing Structure by Heating Type in Newburg
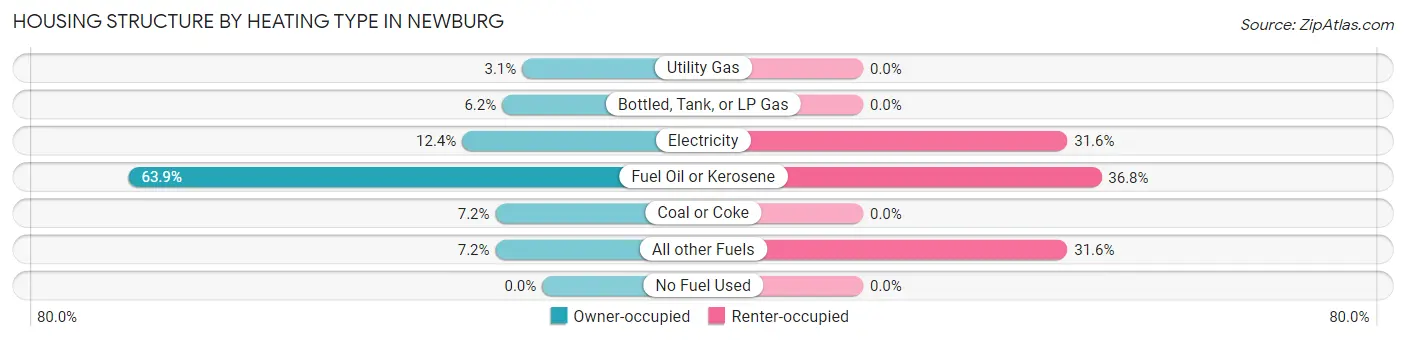
| Heating Type | Owner-occupied | Renter-occupied |
| Utility Gas | 3 (3.1%) | 0 (0.0%) |
| Bottled, Tank, or LP Gas | 6 (6.2%) | 0 (0.0%) |
| Electricity | 12 (12.4%) | 6 (31.6%) |
| Fuel Oil or Kerosene | 62 (63.9%) | 7 (36.8%) |
| Coal or Coke | 7 (7.2%) | 0 (0.0%) |
| All other Fuels | 7 (7.2%) | 6 (31.6%) |
| No Fuel Used | 0 (0.0%) | 0 (0.0%) |
| Total | 97 (100.0%) | 19 (100.0%) |
Household Vehicle Usage in Newburg
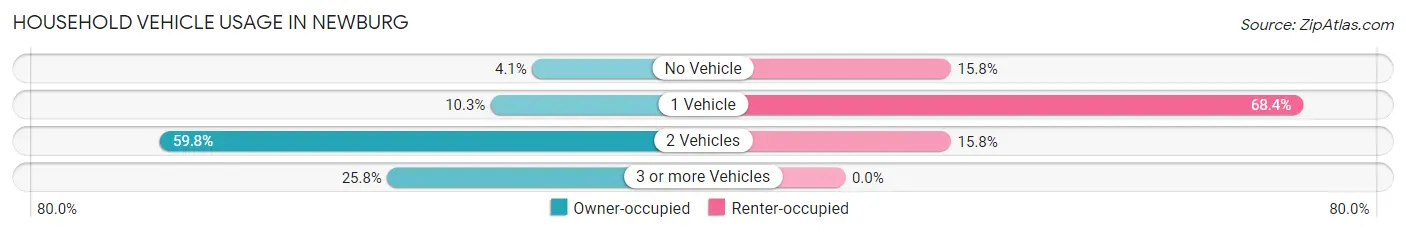
| Vehicles per Household | Owner-occupied | Renter-occupied |
| No Vehicle | 4 (4.1%) | 3 (15.8%) |
| 1 Vehicle | 10 (10.3%) | 13 (68.4%) |
| 2 Vehicles | 58 (59.8%) | 3 (15.8%) |
| 3 or more Vehicles | 25 (25.8%) | 0 (0.0%) |
| Total | 97 (100.0%) | 19 (100.0%) |
Real Estate & Mortgages in Newburg
Real Estate and Mortgage Overview in Newburg
| Characteristic | Without Mortgage | With Mortgage |
| Housing Units | 91 | 6 |
| Median Property Value | $47,200 | $131,300 |
| Median Household Income | $49,102 | $0 |
| Monthly Housing Costs | $376 | $0 |
| Real Estate Taxes | $622 | $0 |
Property Value by Mortgage Status in Newburg
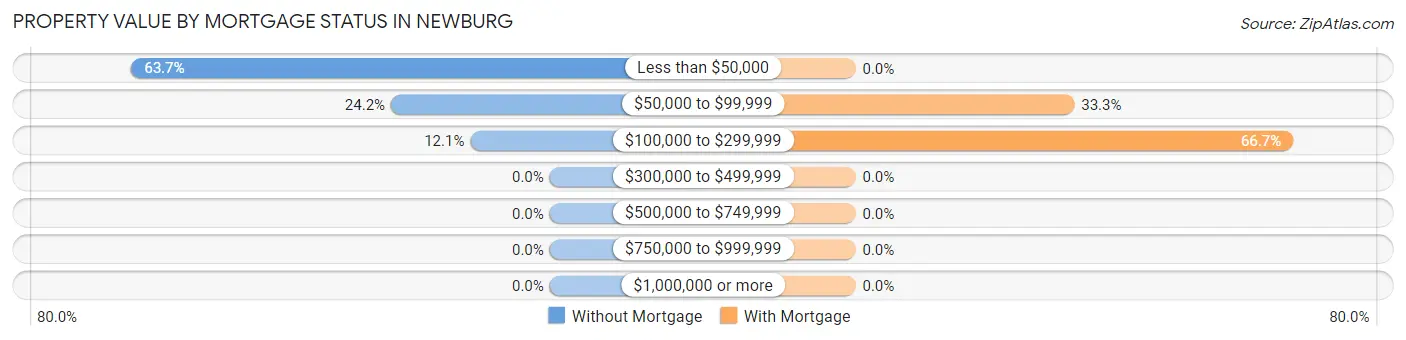
| Property Value | Without Mortgage | With Mortgage |
| Less than $50,000 | 58 (63.7%) | 0 (0.0%) |
| $50,000 to $99,999 | 22 (24.2%) | 2 (33.3%) |
| $100,000 to $299,999 | 11 (12.1%) | 4 (66.7%) |
| $300,000 to $499,999 | 0 (0.0%) | 0 (0.0%) |
| $500,000 to $749,999 | 0 (0.0%) | 0 (0.0%) |
| $750,000 to $999,999 | 0 (0.0%) | 0 (0.0%) |
| $1,000,000 or more | 0 (0.0%) | 0 (0.0%) |
| Total | 91 (100.0%) | 6 (100.0%) |
Household Income by Mortgage Status in Newburg
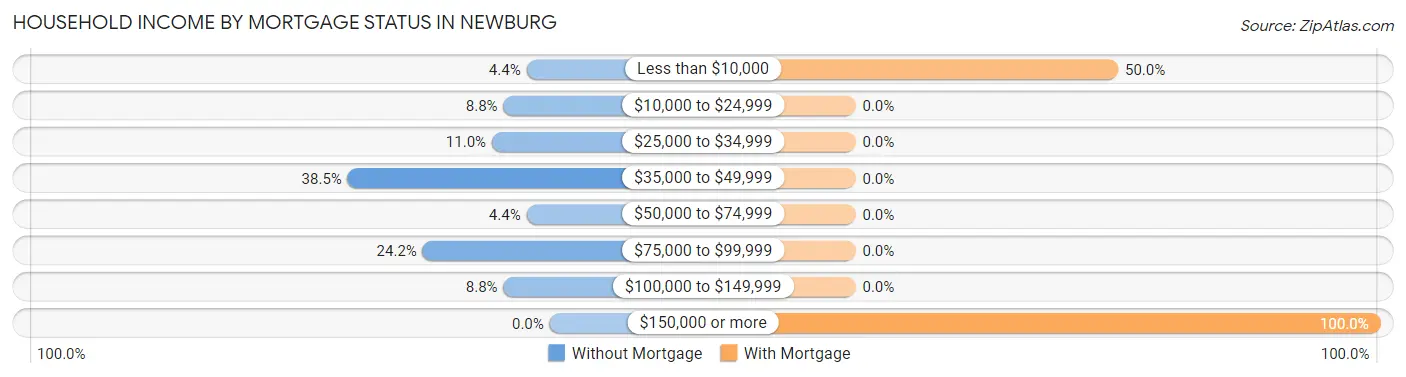
| Household Income | Without Mortgage | With Mortgage |
| Less than $10,000 | 4 (4.4%) | 3 (50.0%) |
| $10,000 to $24,999 | 8 (8.8%) | 0 (0.0%) |
| $25,000 to $34,999 | 10 (11.0%) | 0 (0.0%) |
| $35,000 to $49,999 | 35 (38.5%) | 0 (0.0%) |
| $50,000 to $74,999 | 4 (4.4%) | 0 (0.0%) |
| $75,000 to $99,999 | 22 (24.2%) | 0 (0.0%) |
| $100,000 to $149,999 | 8 (8.8%) | 0 (0.0%) |
| $150,000 or more | 0 (0.0%) | 6 (100.0%) |
| Total | 91 (100.0%) | 6 (100.0%) |
Property Value to Household Income Ratio in Newburg
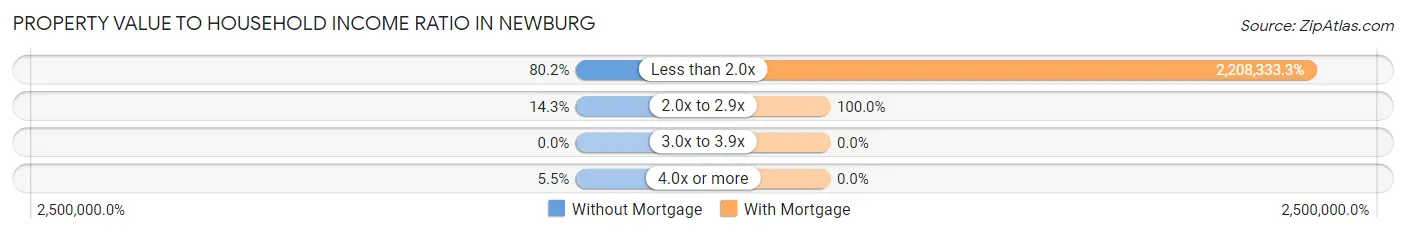
| Value-to-Income Ratio | Without Mortgage | With Mortgage |
| Less than 2.0x | 73 (80.2%) | 132,500 (2,208,333.3%) |
| 2.0x to 2.9x | 13 (14.3%) | 6 (100.0%) |
| 3.0x to 3.9x | 0 (0.0%) | 0 (0.0%) |
| 4.0x or more | 5 (5.5%) | 0 (0.0%) |
| Total | 91 (100.0%) | 6 (100.0%) |
Real Estate Taxes by Mortgage Status in Newburg
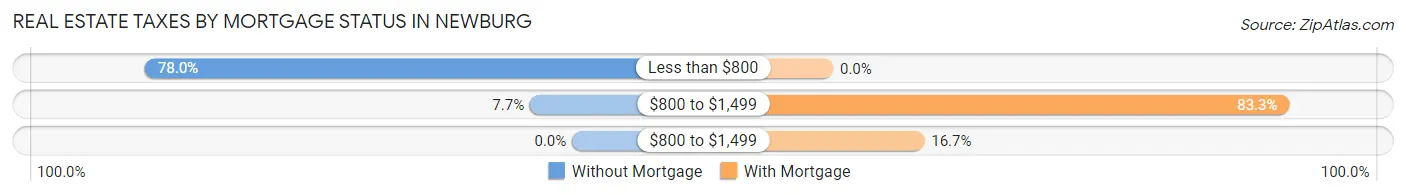
| Property Taxes | Without Mortgage | With Mortgage |
| Less than $800 | 71 (78.0%) | 0 (0.0%) |
| $800 to $1,499 | 7 (7.7%) | 5 (83.3%) |
| $800 to $1,499 | 0 (0.0%) | 1 (16.7%) |
| Total | 91 (100.0%) | 6 (100.0%) |
Health & Disability in Newburg
Health Insurance Coverage by Age in Newburg
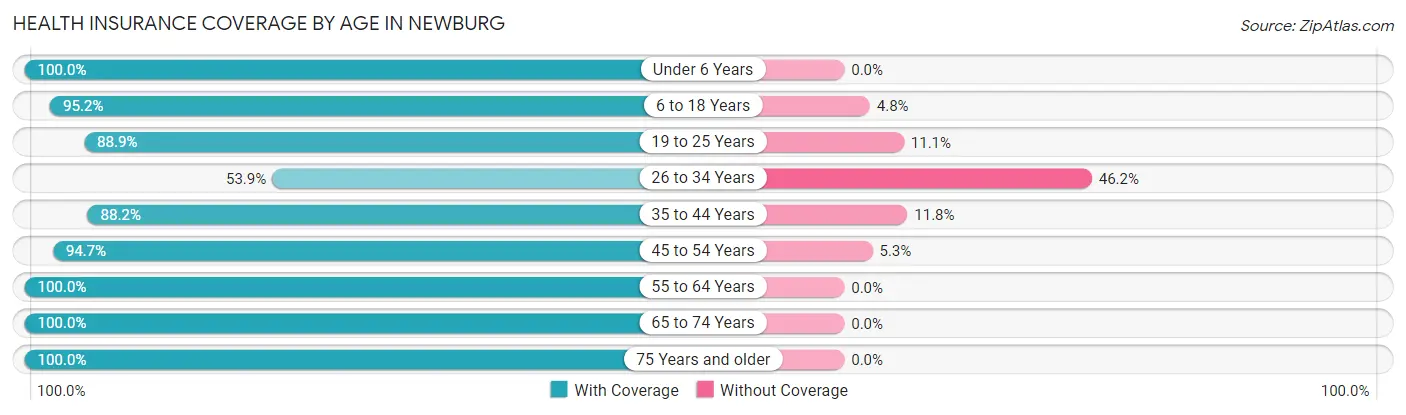
| Age Bracket | With Coverage | Without Coverage |
| Under 6 Years | 10 (100.0%) | 0 (0.0%) |
| 6 to 18 Years | 20 (95.2%) | 1 (4.8%) |
| 19 to 25 Years | 8 (88.9%) | 1 (11.1%) |
| 26 to 34 Years | 21 (53.8%) | 18 (46.2%) |
| 35 to 44 Years | 15 (88.2%) | 2 (11.8%) |
| 45 to 54 Years | 18 (94.7%) | 1 (5.3%) |
| 55 to 64 Years | 69 (100.0%) | 0 (0.0%) |
| 65 to 74 Years | 42 (100.0%) | 0 (0.0%) |
| 75 Years and older | 11 (100.0%) | 0 (0.0%) |
| Total | 214 (90.3%) | 23 (9.7%) |
Health Insurance Coverage by Citizenship Status in Newburg
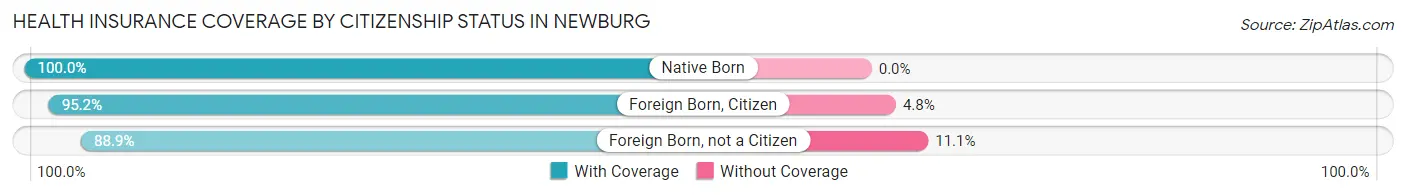
| Citizenship Status | With Coverage | Without Coverage |
| Native Born | 10 (100.0%) | 0 (0.0%) |
| Foreign Born, Citizen | 20 (95.2%) | 1 (4.8%) |
| Foreign Born, not a Citizen | 8 (88.9%) | 1 (11.1%) |
Health Insurance Coverage by Household Income in Newburg
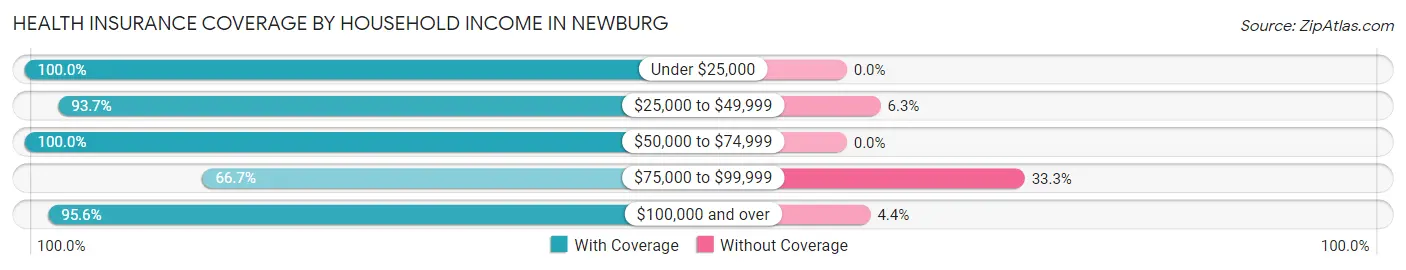
| Household Income | With Coverage | Without Coverage |
| Under $25,000 | 44 (100.0%) | 0 (0.0%) |
| $25,000 to $49,999 | 74 (93.7%) | 5 (6.3%) |
| $50,000 to $74,999 | 21 (100.0%) | 0 (0.0%) |
| $75,000 to $99,999 | 32 (66.7%) | 16 (33.3%) |
| $100,000 and over | 43 (95.6%) | 2 (4.4%) |
Public vs Private Health Insurance Coverage by Age in Newburg
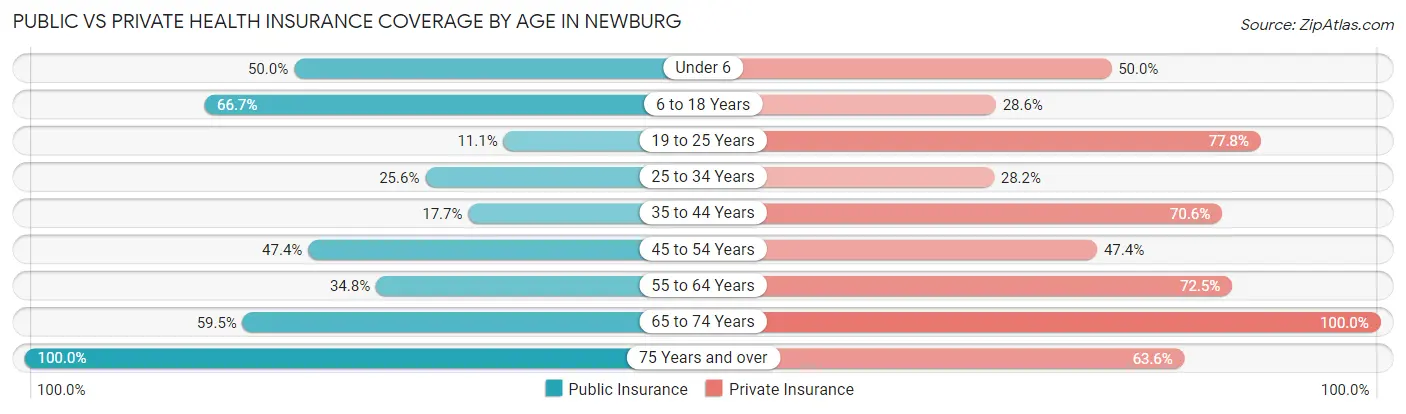
| Age Bracket | Public Insurance | Private Insurance |
| Under 6 | 5 (50.0%) | 5 (50.0%) |
| 6 to 18 Years | 14 (66.7%) | 6 (28.6%) |
| 19 to 25 Years | 1 (11.1%) | 7 (77.8%) |
| 25 to 34 Years | 10 (25.6%) | 11 (28.2%) |
| 35 to 44 Years | 3 (17.6%) | 12 (70.6%) |
| 45 to 54 Years | 9 (47.4%) | 9 (47.4%) |
| 55 to 64 Years | 24 (34.8%) | 50 (72.5%) |
| 65 to 74 Years | 25 (59.5%) | 42 (100.0%) |
| 75 Years and over | 11 (100.0%) | 7 (63.6%) |
| Total | 102 (43.0%) | 149 (62.9%) |
Disability Status by Sex by Age in Newburg
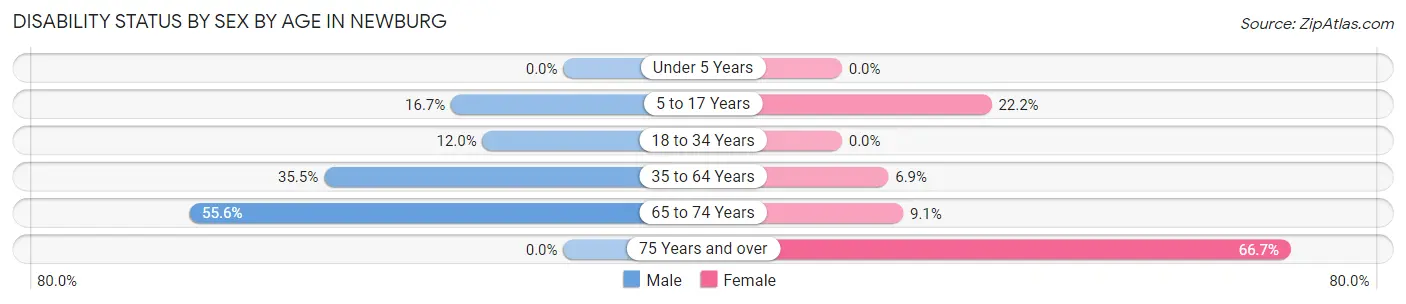
| Age Bracket | Male | Female |
| Under 5 Years | 0 (0.0%) | 0 (0.0%) |
| 5 to 17 Years | 2 (16.7%) | 2 (22.2%) |
| 18 to 34 Years | 3 (12.0%) | 0 (0.0%) |
| 35 to 64 Years | 27 (35.5%) | 2 (6.9%) |
| 65 to 74 Years | 5 (55.6%) | 3 (9.1%) |
| 75 Years and over | 0 (0.0%) | 6 (66.7%) |
Disability Class by Sex by Age in Newburg
Disability Class: Hearing Difficulty
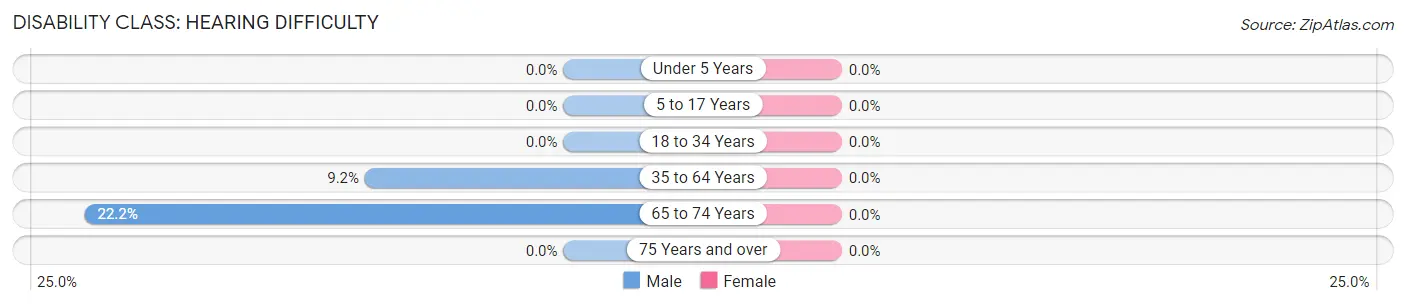
| Age Bracket | Male | Female |
| Under 5 Years | 0 (0.0%) | 0 (0.0%) |
| 5 to 17 Years | 0 (0.0%) | 0 (0.0%) |
| 18 to 34 Years | 0 (0.0%) | 0 (0.0%) |
| 35 to 64 Years | 7 (9.2%) | 0 (0.0%) |
| 65 to 74 Years | 2 (22.2%) | 0 (0.0%) |
| 75 Years and over | 0 (0.0%) | 0 (0.0%) |
Disability Class: Vision Difficulty
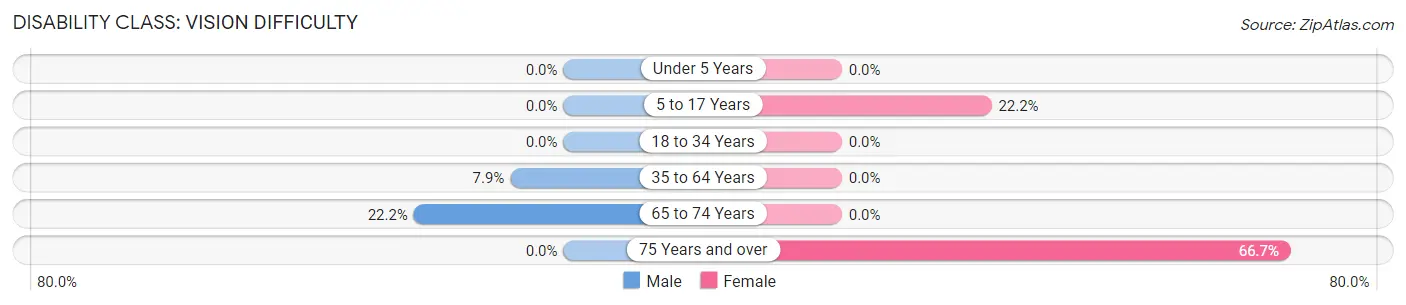
| Age Bracket | Male | Female |
| Under 5 Years | 0 (0.0%) | 0 (0.0%) |
| 5 to 17 Years | 0 (0.0%) | 2 (22.2%) |
| 18 to 34 Years | 0 (0.0%) | 0 (0.0%) |
| 35 to 64 Years | 6 (7.9%) | 0 (0.0%) |
| 65 to 74 Years | 2 (22.2%) | 0 (0.0%) |
| 75 Years and over | 0 (0.0%) | 6 (66.7%) |
Disability Class: Cognitive Difficulty
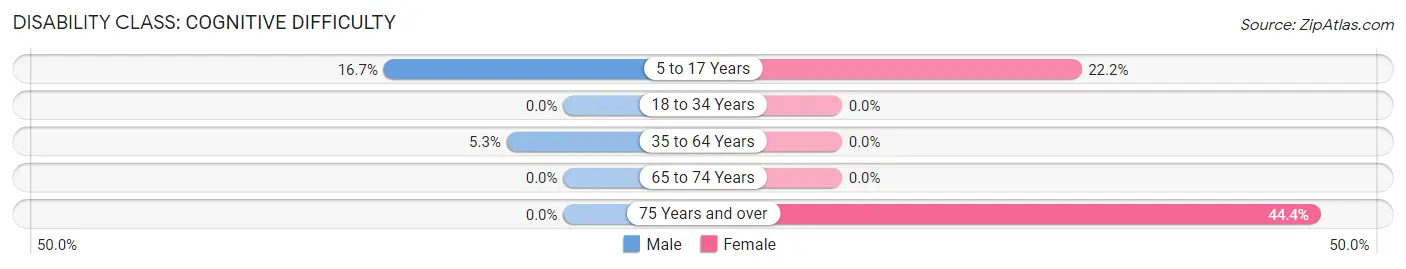
| Age Bracket | Male | Female |
| 5 to 17 Years | 2 (16.7%) | 2 (22.2%) |
| 18 to 34 Years | 0 (0.0%) | 0 (0.0%) |
| 35 to 64 Years | 4 (5.3%) | 0 (0.0%) |
| 65 to 74 Years | 0 (0.0%) | 0 (0.0%) |
| 75 Years and over | 0 (0.0%) | 4 (44.4%) |
Disability Class: Ambulatory Difficulty
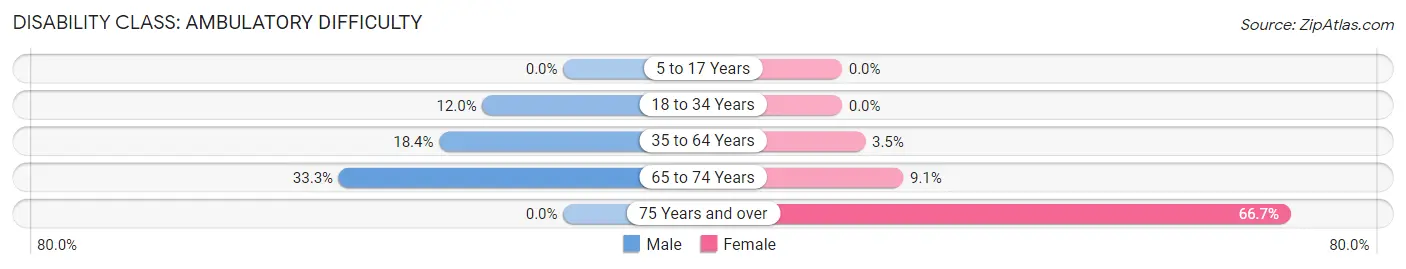
| Age Bracket | Male | Female |
| 5 to 17 Years | 0 (0.0%) | 0 (0.0%) |
| 18 to 34 Years | 3 (12.0%) | 0 (0.0%) |
| 35 to 64 Years | 14 (18.4%) | 1 (3.5%) |
| 65 to 74 Years | 3 (33.3%) | 3 (9.1%) |
| 75 Years and over | 0 (0.0%) | 6 (66.7%) |
Disability Class: Self-Care Difficulty
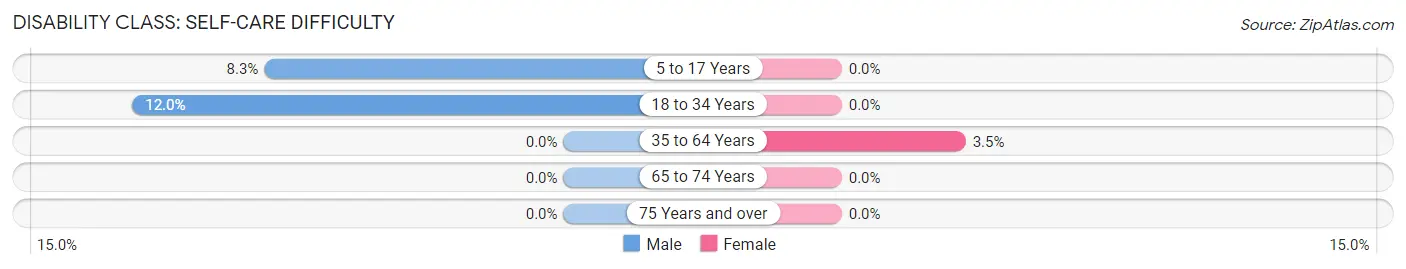
| Age Bracket | Male | Female |
| 5 to 17 Years | 1 (8.3%) | 0 (0.0%) |
| 18 to 34 Years | 3 (12.0%) | 0 (0.0%) |
| 35 to 64 Years | 0 (0.0%) | 1 (3.5%) |
| 65 to 74 Years | 0 (0.0%) | 0 (0.0%) |
| 75 Years and over | 0 (0.0%) | 0 (0.0%) |
Technology Access in Newburg
Computing Device Access in Newburg
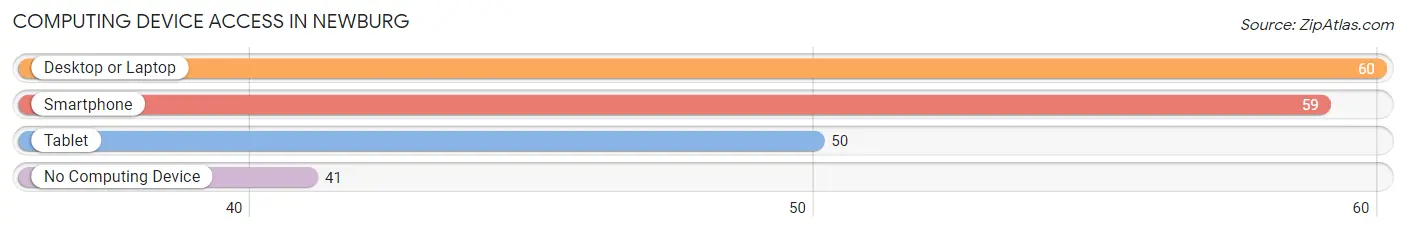
| Device Type | # Households | % Households |
| Desktop or Laptop | 60 | 51.7% |
| Smartphone | 59 | 50.9% |
| Tablet | 50 | 43.1% |
| No Computing Device | 41 | 35.3% |
| Total | 116 | 100.0% |
Internet Access in Newburg
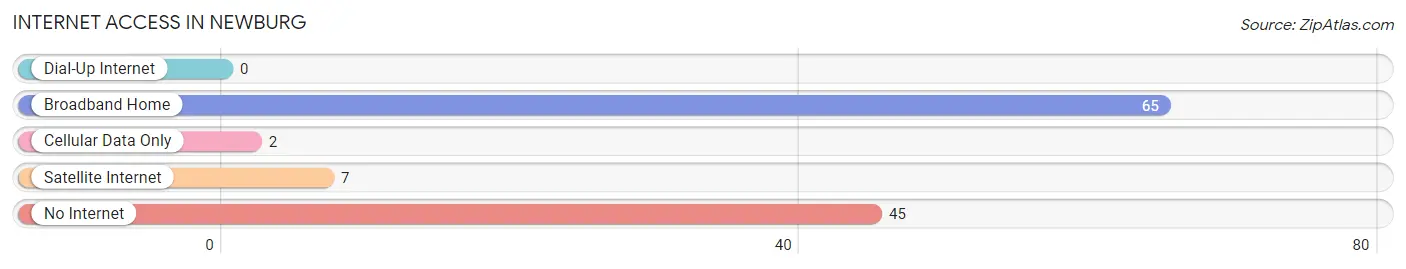
| Internet Type | # Households | % Households |
| Dial-Up Internet | 0 | 0.0% |
| Broadband Home | 65 | 56.0% |
| Cellular Data Only | 2 | 1.7% |
| Satellite Internet | 7 | 6.0% |
| No Internet | 45 | 38.8% |
| Total | 116 | 100.0% |
Newburg Summary
Newburg, West Virginia is a small town located in the eastern part of the state, in Preston County. It is situated along the banks of the Cheat River, and is part of the Morgantown Metropolitan Statistical Area. The town has a population of just over 1,000 people, and is known for its rural charm and small-town atmosphere.
History
Newburg was founded in 1817 by a group of settlers from Pennsylvania. The town was originally known as “Newburgh”, but the name was changed to “Newburg” in 1820. The town was incorporated in 1837, and the first post office was established in 1845.
The town was an important stop on the Baltimore and Ohio Railroad, and was a major shipping point for coal and timber. The railroad also brought many new residents to the area, and the population of Newburg grew steadily throughout the 19th century.
Geography
Newburg is located in the eastern part of Preston County, in the Appalachian Mountains. The town is situated along the banks of the Cheat River, and is surrounded by rolling hills and forests. The town is located about 25 miles south of Morgantown, and is part of the Morgantown Metropolitan Statistical Area.
The climate in Newburg is humid continental, with hot summers and cold winters. The average annual temperature is around 50 degrees Fahrenheit, and the average annual precipitation is around 40 inches.
Economy
The economy of Newburg is largely based on agriculture and tourism. The town is home to several small farms, and the surrounding area is known for its apple orchards and vineyards. The town is also a popular destination for outdoor recreation, and is home to several parks and trails.
The town is also home to several small businesses, including restaurants, shops, and a local newspaper. The town is served by the Preston County Public Library, and is home to a branch of the West Virginia University Institute of Technology.
Demographics
As of the 2010 census, the population of Newburg was 1,039. The racial makeup of the town was 97.3% White, 0.7% African American, 0.3% Native American, 0.2% Asian, and 1.5% from other races. The median household income was $37,500, and the median family income was $45,000.
The town is served by the Preston County School District, and is home to two elementary schools, one middle school, and one high school. The town is also home to a branch of the West Virginia University Institute of Technology.
Conclusion
Newburg, West Virginia is a small town located in the eastern part of the state, in Preston County. It is situated along the banks of the Cheat River, and is part of the Morgantown Metropolitan Statistical Area. The town has a population of just over 1,000 people, and is known for its rural charm and small-town atmosphere. The economy of Newburg is largely based on agriculture and tourism, and the town is home to several small businesses, including restaurants, shops, and a local newspaper. The town is served by the Preston County School District, and is home to two elementary schools, one middle school, and one high school. Newburg is a charming and welcoming town, and is a great place to live and visit.
Common Questions
What is Per Capita Income in Newburg?
Per Capita income in Newburg is $28,978.
What is the Median Family Income in Newburg?
Median Family Income in Newburg is $49,023.
What is the Median Household income in Newburg?
Median Household Income in Newburg is $49,219.
What is Income or Wage Gap in Newburg?
Income or Wage Gap in Newburg is 56.1%.
Women in Newburg earn 43.9 cents for every dollar earned by a man.
What is Inequality or Gini Index in Newburg?
Inequality or Gini Index in Newburg is 0.31.
What is the Total Population of Newburg?
Total Population of Newburg is 237.
What is the Total Male Population of Newburg?
Total Male Population of Newburg is 125.
What is the Total Female Population of Newburg?
Total Female Population of Newburg is 112.
What is the Ratio of Males per 100 Females in Newburg?
There are 111.61 Males per 100 Females in Newburg.
What is the Ratio of Females per 100 Males in Newburg?
There are 89.60 Females per 100 Males in Newburg.
What is the Median Population Age in Newburg?
Median Population Age in Newburg is 55.9 Years.
What is the Average Family Size in Newburg
Average Family Size in Newburg is 2.2 People.
What is the Average Household Size in Newburg
Average Household Size in Newburg is 2.0 People.
How Large is the Labor Force in Newburg?
There are 114 People in the Labor Forcein in Newburg.
What is the Percentage of People in the Labor Force in Newburg?
54.8% of People are in the Labor Force in Newburg.