Cities with the Highest Percentage of Population with a Degree in Physical and Health Sciences in Michigan
RELATED REPORTS & OPTIONS
Physical and Health Sciences
Michigan
Compare Cities
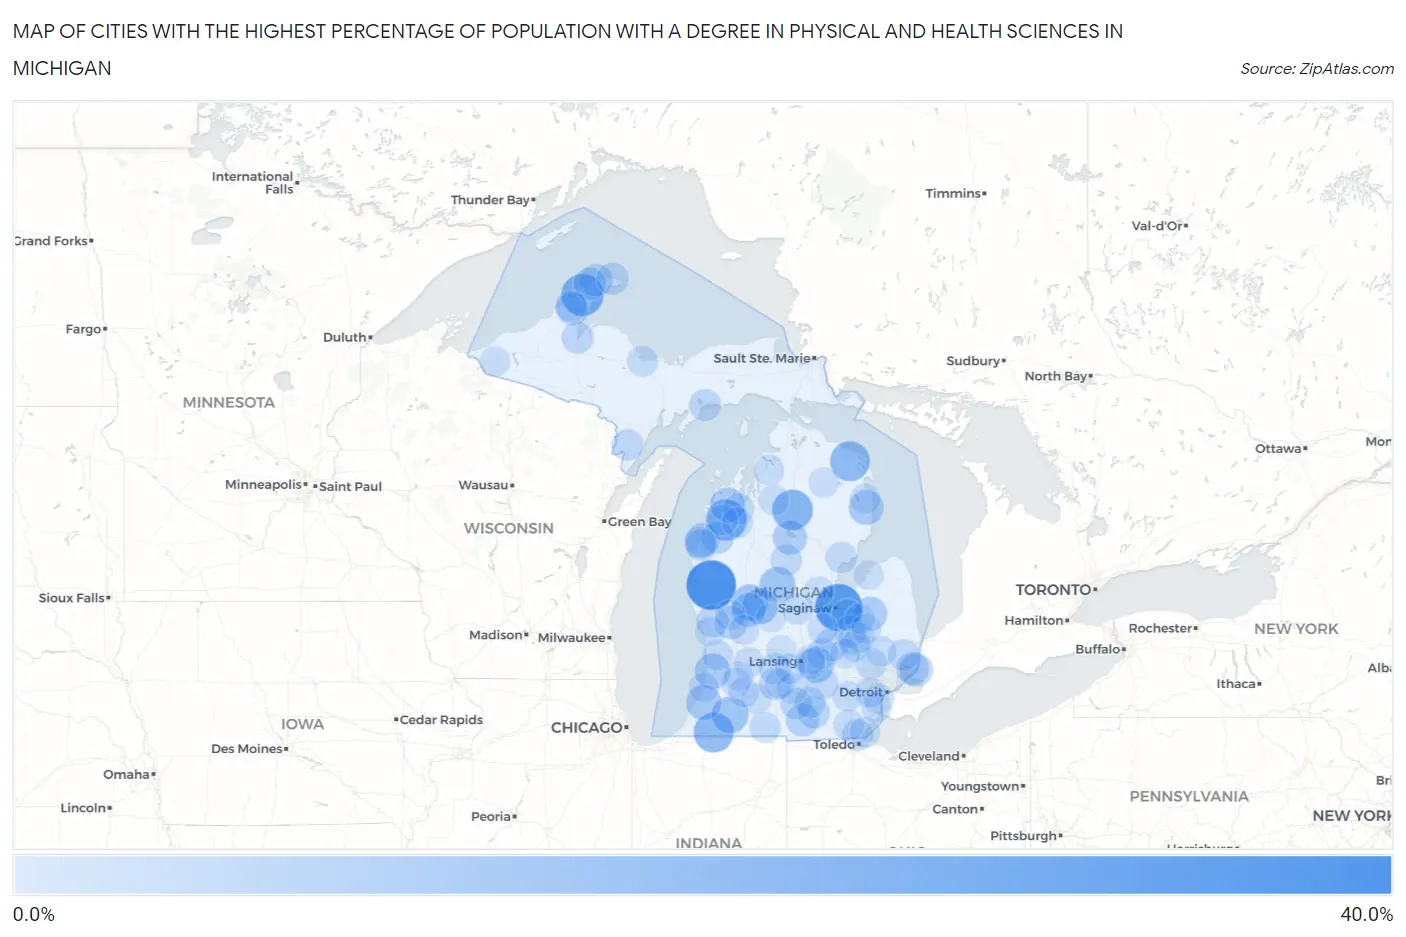
Map of Cities with the Highest Percentage of Population with a Degree in Physical and Health Sciences in Michigan
0.0%
40.0%
Cities with the Highest Percentage of Population with a Degree in Physical and Health Sciences in Michigan
| City | % Graduates | vs State | vs National | |
| 1. | Walkerville | 40.0% | 3.1%(+36.9)#1 | 3.1%(+36.9)#138 |
| 2. | Buena Vista | 35.6% | 3.1%(+32.5)#2 | 3.1%(+32.5)#188 |
| 3. | Riverdale | 28.0% | 3.1%(+24.9)#3 | 3.1%(+24.9)#301 |
| 4. | Copper City | 26.7% | 3.1%(+23.5)#4 | 3.1%(+23.6)#330 |
| 5. | Nessen City | 25.0% | 3.1%(+21.9)#5 | 3.1%(+21.9)#386 |
| 6. | Grayling | 23.9% | 3.1%(+20.8)#6 | 3.1%(+20.8)#414 |
| 7. | Edwardsburg | 22.8% | 3.1%(+19.6)#7 | 3.1%(+19.7)#446 |
| 8. | Posen | 22.2% | 3.1%(+19.1)#8 | 3.1%(+19.1)#460 |
| 9. | Marcellus | 16.8% | 3.1%(+13.7)#9 | 3.1%(+13.7)#707 |
| 10. | Morley | 16.3% | 3.1%(+13.1)#10 | 3.1%(+13.2)#764 |
| 11. | Weidman | 16.2% | 3.1%(+13.0)#11 | 3.1%(+13.1)#775 |
| 12. | Lakeview | 15.5% | 3.1%(+12.3)#12 | 3.1%(+12.4)#818 |
| 13. | Williamston | 15.3% | 3.1%(+12.1)#13 | 3.1%(+12.2)#849 |
| 14. | Scotts | 14.8% | 3.1%(+11.7)#14 | 3.1%(+11.7)#895 |
| 15. | Fennville | 14.6% | 3.1%(+11.5)#15 | 3.1%(+11.5)#917 |
| 16. | Watervliet | 14.4% | 3.1%(+11.3)#16 | 3.1%(+11.3)#930 |
| 17. | Lincoln | 13.8% | 3.1%(+10.7)#17 | 3.1%(+10.7)#1,010 |
| 18. | Maple Grove | 13.8% | 3.1%(+10.7)#18 | 3.1%(+10.7)#1,012 |
| 19. | Houghton Lake | 12.8% | 3.1%(+9.63)#19 | 3.1%(+9.66)#1,130 |
| 20. | Howard City | 12.7% | 3.1%(+9.60)#20 | 3.1%(+9.63)#1,131 |
| 21. | Mayville | 12.6% | 3.1%(+9.47)#21 | 3.1%(+9.50)#1,144 |
| 22. | Parkdale | 12.0% | 3.1%(+8.87)#22 | 3.1%(+8.90)#1,217 |
| 23. | Algonac | 11.3% | 3.1%(+8.12)#23 | 3.1%(+8.15)#1,332 |
| 24. | Ruby | 11.0% | 3.1%(+7.89)#24 | 3.1%(+7.92)#1,374 |
| 25. | North Adams | 10.9% | 3.1%(+7.78)#25 | 3.1%(+7.81)#1,386 |
| 26. | Vernon | 10.8% | 3.1%(+7.64)#26 | 3.1%(+7.67)#1,415 |
| 27. | Casnovia | 10.6% | 3.1%(+7.51)#27 | 3.1%(+7.54)#1,440 |
| 28. | Houghton | 10.5% | 3.1%(+7.35)#28 | 3.1%(+7.38)#1,484 |
| 29. | Pearl Beach | 10.2% | 3.1%(+7.09)#29 | 3.1%(+7.11)#1,559 |
| 30. | Brethren | 10.0% | 3.1%(+6.87)#30 | 3.1%(+6.90)#1,602 |
| 31. | Eagle Harbor | 10.0% | 3.1%(+6.87)#31 | 3.1%(+6.90)#1,616 |
| 32. | Eagle River | 10.0% | 3.1%(+6.87)#32 | 3.1%(+6.90)#1,622 |
| 33. | Wolf Lake | 9.4% | 3.1%(+6.29)#33 | 3.1%(+6.32)#1,747 |
| 34. | Bellevue | 9.4% | 3.1%(+6.27)#34 | 3.1%(+6.30)#1,753 |
| 35. | Copper Harbor | 9.3% | 3.1%(+6.17)#35 | 3.1%(+6.20)#1,784 |
| 36. | Cement City | 9.1% | 3.1%(+5.96)#36 | 3.1%(+5.99)#1,844 |
| 37. | Eureka | 9.1% | 3.1%(+5.96)#37 | 3.1%(+5.99)#1,864 |
| 38. | Manistique | 8.7% | 3.1%(+5.58)#38 | 3.1%(+5.61)#1,973 |
| 39. | Baraga | 8.6% | 3.1%(+5.47)#39 | 3.1%(+5.50)#2,020 |
| 40. | Concord | 8.6% | 3.1%(+5.46)#40 | 3.1%(+5.49)#2,027 |
| 41. | Hancock | 8.5% | 3.1%(+5.37)#41 | 3.1%(+5.40)#2,053 |
| 42. | Manistee | 8.4% | 3.1%(+5.26)#42 | 3.1%(+5.29)#2,087 |
| 43. | Stockbridge | 8.3% | 3.1%(+5.20)#43 | 3.1%(+5.23)#2,098 |
| 44. | Oak Hill | 8.3% | 3.1%(+5.20)#44 | 3.1%(+5.23)#2,106 |
| 45. | Daggett | 8.3% | 3.1%(+5.20)#45 | 3.1%(+5.23)#2,121 |
| 46. | Vermontville | 8.2% | 3.1%(+5.03)#46 | 3.1%(+5.06)#2,165 |
| 47. | Temperance | 8.0% | 3.1%(+4.87)#47 | 3.1%(+4.90)#2,225 |
| 48. | Mount Morris | 8.0% | 3.1%(+4.87)#48 | 3.1%(+4.90)#2,231 |
| 49. | Richmond | 8.0% | 3.1%(+4.85)#49 | 3.1%(+4.88)#2,252 |
| 50. | Harrison | 8.0% | 3.1%(+4.83)#50 | 3.1%(+4.85)#2,261 |
| 51. | Vandercook Lake | 7.9% | 3.1%(+4.74)#51 | 3.1%(+4.77)#2,288 |
| 52. | Frankenmuth | 7.8% | 3.1%(+4.70)#52 | 3.1%(+4.73)#2,304 |
| 53. | Bronson | 7.7% | 3.1%(+4.61)#53 | 3.1%(+4.64)#2,351 |
| 54. | Omer | 7.7% | 3.1%(+4.56)#54 | 3.1%(+4.59)#2,384 |
| 55. | Morrice | 7.6% | 3.1%(+4.46)#55 | 3.1%(+4.49)#2,433 |
| 56. | St Louis | 7.6% | 3.1%(+4.43)#56 | 3.1%(+4.46)#2,445 |
| 57. | Chums Corner | 7.6% | 3.1%(+4.43)#57 | 3.1%(+4.46)#2,447 |
| 58. | Lake Angelus | 7.5% | 3.1%(+4.33)#58 | 3.1%(+4.36)#2,491 |
| 59. | Springport | 7.1% | 3.1%(+4.01)#59 | 3.1%(+4.04)#2,681 |
| 60. | Grand Blanc | 6.9% | 3.1%(+3.80)#60 | 3.1%(+3.83)#2,812 |
| 61. | Buckley | 6.9% | 3.1%(+3.77)#61 | 3.1%(+3.80)#2,841 |
| 62. | Petersburg | 6.9% | 3.1%(+3.75)#62 | 3.1%(+3.78)#2,858 |
| 63. | Zeeland | 6.9% | 3.1%(+3.73)#63 | 3.1%(+3.76)#2,878 |
| 64. | Harvey | 6.8% | 3.1%(+3.72)#64 | 3.1%(+3.75)#2,882 |
| 65. | Manistee Lake | 6.8% | 3.1%(+3.63)#65 | 3.1%(+3.66)#2,930 |
| 66. | Climax | 6.7% | 3.1%(+3.59)#66 | 3.1%(+3.62)#2,947 |
| 67. | Lost Lake Woods | 6.7% | 3.1%(+3.58)#67 | 3.1%(+3.61)#2,958 |
| 68. | Middleville | 6.6% | 3.1%(+3.47)#68 | 3.1%(+3.50)#3,030 |
| 69. | Leonard | 6.6% | 3.1%(+3.46)#69 | 3.1%(+3.49)#3,032 |
| 70. | Luna Pier | 6.6% | 3.1%(+3.43)#70 | 3.1%(+3.46)#3,049 |
| 71. | East Jordan | 6.5% | 3.1%(+3.38)#71 | 3.1%(+3.41)#3,077 |
| 72. | Okemos | 6.5% | 3.1%(+3.32)#72 | 3.1%(+3.35)#3,104 |
| 73. | Ann Arbor | 6.4% | 3.1%(+3.30)#73 | 3.1%(+3.33)#3,139 |
| 74. | Olivet | 6.2% | 3.1%(+3.12)#74 | 3.1%(+3.15)#3,244 |
| 75. | Grant | 6.2% | 3.1%(+3.12)#75 | 3.1%(+3.15)#3,246 |
| 76. | Skanee | 6.2% | 3.1%(+3.12)#76 | 3.1%(+3.15)#3,274 |
| 77. | Parchment | 6.2% | 3.1%(+3.10)#77 | 3.1%(+3.13)#3,286 |
| 78. | Lincoln Park | 6.2% | 3.1%(+3.10)#78 | 3.1%(+3.12)#3,292 |
| 79. | Rockford | 6.2% | 3.1%(+3.05)#79 | 3.1%(+3.08)#3,321 |
| 80. | Fruitport | 6.2% | 3.1%(+3.05)#80 | 3.1%(+3.08)#3,327 |
| 81. | Burton | 6.2% | 3.1%(+3.04)#81 | 3.1%(+3.07)#3,335 |
| 82. | Woodhaven | 6.2% | 3.1%(+3.03)#82 | 3.1%(+3.06)#3,339 |
| 83. | Wakefield | 6.1% | 3.1%(+2.93)#83 | 3.1%(+2.96)#3,406 |
| 84. | Thompsonville | 6.1% | 3.1%(+2.93)#84 | 3.1%(+2.96)#3,413 |
| 85. | Garden City | 6.1% | 3.1%(+2.92)#85 | 3.1%(+2.95)#3,421 |
| 86. | South Haven | 5.9% | 3.1%(+2.81)#86 | 3.1%(+2.84)#3,515 |
| 87. | Otsego | 5.9% | 3.1%(+2.79)#87 | 3.1%(+2.82)#3,527 |
| 88. | Atlanta | 5.9% | 3.1%(+2.75)#88 | 3.1%(+2.78)#3,562 |
| 89. | Oakley | 5.9% | 3.1%(+2.75)#89 | 3.1%(+2.78)#3,573 |
| 90. | Potterville | 5.8% | 3.1%(+2.65)#90 | 3.1%(+2.68)#3,649 |
| 91. | Midland | 5.7% | 3.1%(+2.62)#91 | 3.1%(+2.65)#3,675 |
| 92. | Portland | 5.6% | 3.1%(+2.45)#92 | 3.1%(+2.48)#3,809 |
| 93. | Martin | 5.6% | 3.1%(+2.43)#93 | 3.1%(+2.46)#3,839 |
| 94. | Davison | 5.5% | 3.1%(+2.42)#94 | 3.1%(+2.45)#3,855 |
| 95. | Columbiaville | 5.5% | 3.1%(+2.37)#95 | 3.1%(+2.39)#3,902 |
| 96. | Haslett | 5.5% | 3.1%(+2.36)#96 | 3.1%(+2.39)#3,910 |
| 97. | Linden | 5.5% | 3.1%(+2.33)#97 | 3.1%(+2.35)#3,940 |
| 98. | Millington | 5.4% | 3.1%(+2.31)#98 | 3.1%(+2.34)#3,965 |
| 99. | Bay Port | 5.4% | 3.1%(+2.28)#99 | 3.1%(+2.31)#3,991 |
| 100. | Stanton | 5.3% | 3.1%(+2.20)#100 | 3.1%(+2.23)#4,073 |
Common Questions
What are the Top 10 Cities with the Highest Percentage of Population with a Degree in Physical and Health Sciences in Michigan?
Top 10 Cities with the Highest Percentage of Population with a Degree in Physical and Health Sciences in Michigan are:
#1
40.0%
#2
35.6%
#3
26.7%
#4
25.0%
#5
23.9%
#6
22.8%
#7
22.2%
#8
16.8%
#9
16.3%
#10
16.2%
What city has the Highest Percentage of Population with a Degree in Physical and Health Sciences in Michigan?
Walkerville has the Highest Percentage of Population with a Degree in Physical and Health Sciences in Michigan with 40.0%.
What is the Percentage of Population with a Degree in Physical and Health Sciences in the State of Michigan?
Percentage of Population with a Degree in Physical and Health Sciences in Michigan is 3.1%.
What is the Percentage of Population with a Degree in Physical and Health Sciences in the United States?
Percentage of Population with a Degree in Physical and Health Sciences in the United States is 3.1%.