Hallsboro, NC Map & Demographics
Hallsboro Map
Hallsboro Overview
$20,009
PER CAPITA INCOME
$64,076
AVG FAMILY INCOME
$63,478
AVG HOUSEHOLD INCOME
0.17
INEQUALITY / GINI INDEX
172
TOTAL POPULATION
62
MALE POPULATION
110
FEMALE POPULATION
56.36
MALES / 100 FEMALES
177.42
FEMALES / 100 MALES
42.9
MEDIAN AGE
2.8
AVG FAMILY SIZE
2.7
AVG HOUSEHOLD SIZE
42
LABOR FORCE [ PEOPLE ]
30.7%
PERCENT IN LABOR FORCE
50.0%
UNEMPLOYMENT RATE
Hallsboro Zip Codes
Hallsboro Area Codes
Income in Hallsboro
Income Overview in Hallsboro
Per Capita Income in Hallsboro is $20,009, while median incomes of families and households are $64,076 and $63,478 respectively.
| Characteristic | Number | Measure |
| Per Capita Income | 172 | $20,009 |
| Median Family Income | 47 | $64,076 |
| Mean Family Income | 47 | $63,681 |
| Median Household Income | 58 | $63,478 |
| Mean Household Income | 58 | $57,274 |
| Income Deficit | 47 | $0 |
| Wage / Income Gap (%) | 172 | 0.00% |
| Wage / Income Gap ($) | 172 | 100.00¢ per $1 |
| Gini / Inequality Index | 172 | 0.17 |
Earnings by Sex in Hallsboro
| Sex | Number | Average Earnings |
| Male | 0 (0.0%) | $0 |
| Female | 42 (100.0%) | $0 |
| Total | 42 (100.0%) | $0 |
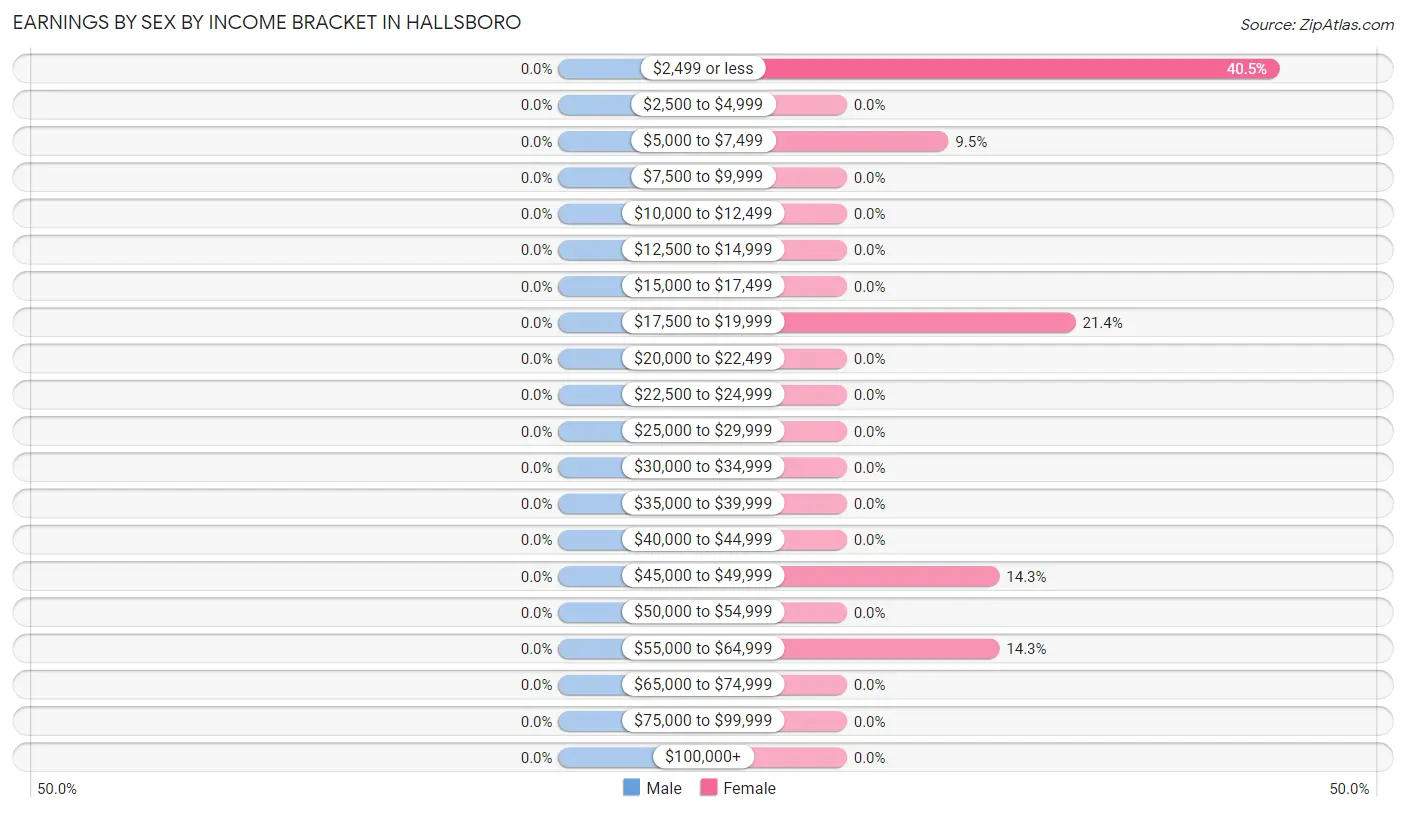
Earnings by Sex by Income Bracket in Hallsboro
| Income | Male | Female |
| $2,499 or less | 0 (0.0%) | 17 (40.5%) |
| $2,500 to $4,999 | 0 (0.0%) | 0 (0.0%) |
| $5,000 to $7,499 | 0 (0.0%) | 4 (9.5%) |
| $7,500 to $9,999 | 0 (0.0%) | 0 (0.0%) |
| $10,000 to $12,499 | 0 (0.0%) | 0 (0.0%) |
| $12,500 to $14,999 | 0 (0.0%) | 0 (0.0%) |
| $15,000 to $17,499 | 0 (0.0%) | 0 (0.0%) |
| $17,500 to $19,999 | 0 (0.0%) | 9 (21.4%) |
| $20,000 to $22,499 | 0 (0.0%) | 0 (0.0%) |
| $22,500 to $24,999 | 0 (0.0%) | 0 (0.0%) |
| $25,000 to $29,999 | 0 (0.0%) | 0 (0.0%) |
| $30,000 to $34,999 | 0 (0.0%) | 0 (0.0%) |
| $35,000 to $39,999 | 0 (0.0%) | 0 (0.0%) |
| $40,000 to $44,999 | 0 (0.0%) | 0 (0.0%) |
| $45,000 to $49,999 | 0 (0.0%) | 6 (14.3%) |
| $50,000 to $54,999 | 0 (0.0%) | 0 (0.0%) |
| $55,000 to $64,999 | 0 (0.0%) | 6 (14.3%) |
| $65,000 to $74,999 | 0 (0.0%) | 0 (0.0%) |
| $75,000 to $99,999 | 0 (0.0%) | 0 (0.0%) |
| $100,000+ | 0 (0.0%) | 0 (0.0%) |
| Total | 0 (0.0%) | 42 (100.0%) |
Earnings by Sex by Educational Attainment in Hallsboro
| Educational Attainment | Male Income | Female Income |
| Less than High School | - | - |
| High School Diploma | - | - |
| College or Associate's Degree | - | - |
| Bachelor's Degree | - | - |
| Graduate Degree | - | - |
| Total | - | - |
Family Income in Hallsboro
Family Income Brackets in Hallsboro
According to the Hallsboro family income data, there are 29 families falling into the $50,000 to $74,999 income range, which is the most common income bracket and makes up 61.7% of all families.
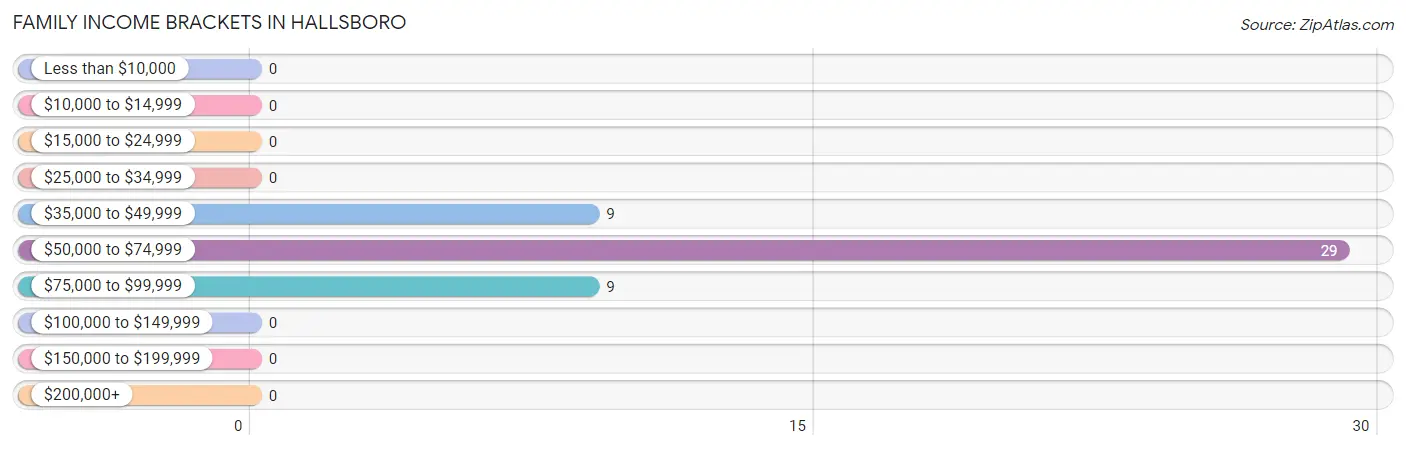
| Income Bracket | # Families | % Families |
| Less than $10,000 | 0 | 0.0% |
| $10,000 to $14,999 | 0 | 0.0% |
| $15,000 to $24,999 | 0 | 0.0% |
| $25,000 to $34,999 | 0 | 0.0% |
| $35,000 to $49,999 | 9 | 19.1% |
| $50,000 to $74,999 | 29 | 61.7% |
| $75,000 to $99,999 | 9 | 19.1% |
| $100,000 to $149,999 | 0 | 0.0% |
| $150,000 to $199,999 | 0 | 0.0% |
| $200,000+ | 0 | 0.0% |
Family Income by Famaliy Size in Hallsboro
2-person families (38 | 80.8%) account for the highest median family income in Hallsboro with $63,587 per family, while 2-person families (38 | 80.8%) have the highest median income of $31,794 per family member.
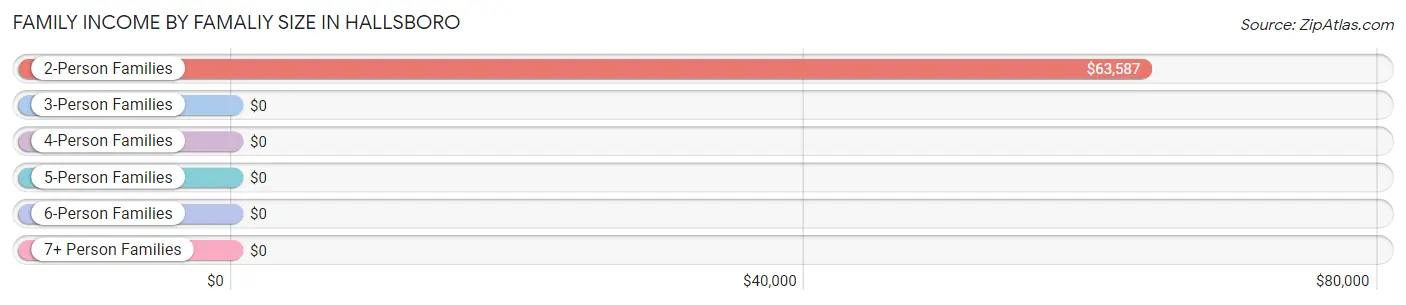
| Income Bracket | # Families | Median Income |
| 2-Person Families | 38 (80.8%) | $63,587 |
| 3-Person Families | 0 (0.0%) | $0 |
| 4-Person Families | 3 (6.4%) | $0 |
| 5-Person Families | 6 (12.8%) | $0 |
| 6-Person Families | 0 (0.0%) | $0 |
| 7+ Person Families | 0 (0.0%) | $0 |
| Total | 47 (100.0%) | $64,076 |
Family Income by Number of Earners in Hallsboro
| Number of Earners | # Families | Median Income |
| No Earners | 26 (55.3%) | $0 |
| 1 Earner | 15 (31.9%) | $0 |
| 2 Earners | 6 (12.8%) | $0 |
| 3+ Earners | 0 (0.0%) | $0 |
| Total | 47 (100.0%) | $64,076 |
Household Income in Hallsboro
Household Income Brackets in Hallsboro
With 29 households falling in the category, the $50,000 to $74,999 income range is the most frequent in Hallsboro, accounting for 50.0% of all households.
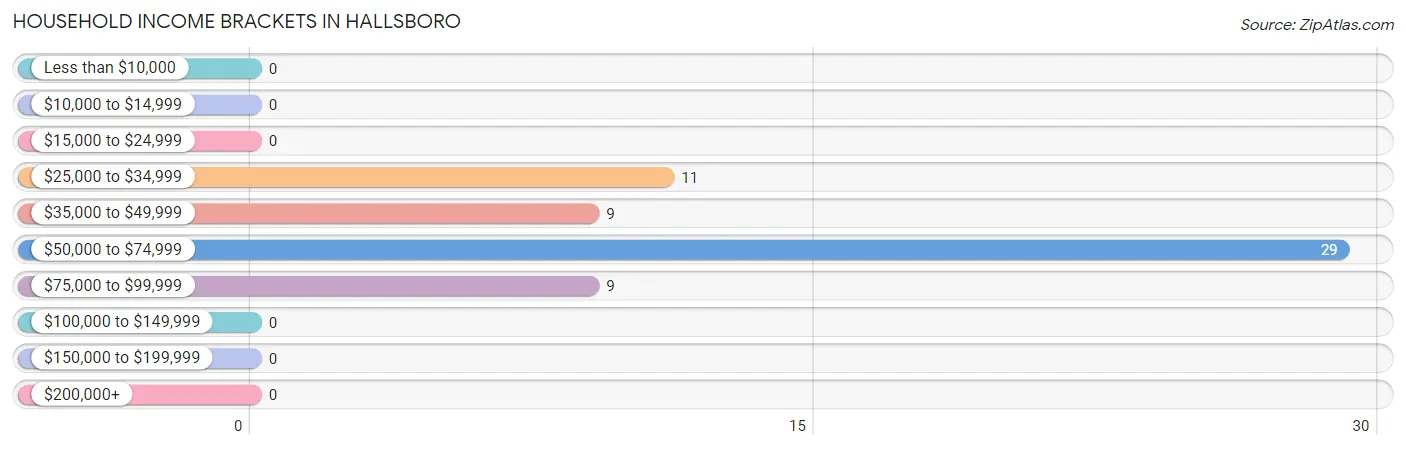
| Income Bracket | # Households | % Households |
| Less than $10,000 | 0 | 0.0% |
| $10,000 to $14,999 | 0 | 0.0% |
| $15,000 to $24,999 | 0 | 0.0% |
| $25,000 to $34,999 | 11 | 19.0% |
| $35,000 to $49,999 | 9 | 15.5% |
| $50,000 to $74,999 | 29 | 50.0% |
| $75,000 to $99,999 | 9 | 15.5% |
| $100,000 to $149,999 | 0 | 0.0% |
| $150,000 to $199,999 | 0 | 0.0% |
| $200,000+ | 0 | 0.0% |
Household Income by Householder Age in Hallsboro
The median household income in Hallsboro is $63,478, with the highest median household income of $70,625 found in the 25 to 44 years age bracket for the primary householder. A total of 21 households (36.2%) fall into this category.
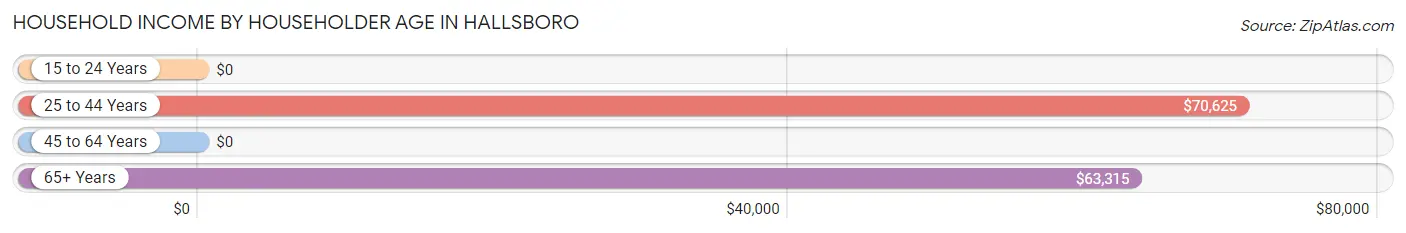
| Income Bracket | # Households | Median Income |
| 15 to 24 Years | 0 (0.0%) | $0 |
| 25 to 44 Years | 21 (36.2%) | $70,625 |
| 45 to 64 Years | 0 (0.0%) | $0 |
| 65+ Years | 37 (63.8%) | $63,315 |
| Total | 58 (100.0%) | $63,478 |
Poverty in Hallsboro
Income Below Poverty by Sex and Age in Hallsboro
With 21.0% poverty level for males and 15.4% for females among the residents of Hallsboro, 45 to 54 year old males and 18 to 24 year old females are the most vulnerable to poverty, with 13 males (100.0%) and 17 females (80.9%) in their respective age groups living below the poverty level.
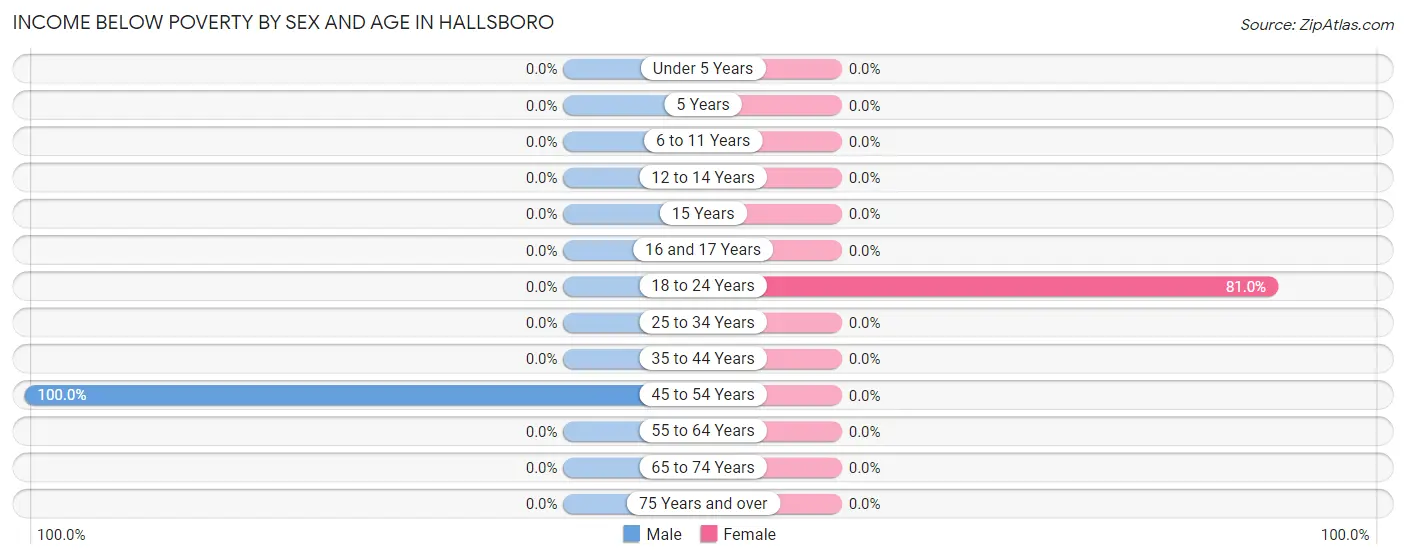
| Age Bracket | Male | Female |
| Under 5 Years | 0 (0.0%) | 0 (0.0%) |
| 5 Years | 0 (0.0%) | 0 (0.0%) |
| 6 to 11 Years | 0 (0.0%) | 0 (0.0%) |
| 12 to 14 Years | 0 (0.0%) | 0 (0.0%) |
| 15 Years | 0 (0.0%) | 0 (0.0%) |
| 16 and 17 Years | 0 (0.0%) | 0 (0.0%) |
| 18 to 24 Years | 0 (0.0%) | 17 (80.9%) |
| 25 to 34 Years | 0 (0.0%) | 0 (0.0%) |
| 35 to 44 Years | 0 (0.0%) | 0 (0.0%) |
| 45 to 54 Years | 13 (100.0%) | 0 (0.0%) |
| 55 to 64 Years | 0 (0.0%) | 0 (0.0%) |
| 65 to 74 Years | 0 (0.0%) | 0 (0.0%) |
| 75 Years and over | 0 (0.0%) | 0 (0.0%) |
| Total | 13 (21.0%) | 17 (15.4%) |
Income Above Poverty by Sex and Age in Hallsboro
According to the poverty statistics in Hallsboro, males aged under 5 years and females aged under 5 years are the age groups that are most secure financially, with 100.0% of males and 100.0% of females in these age groups living above the poverty line.
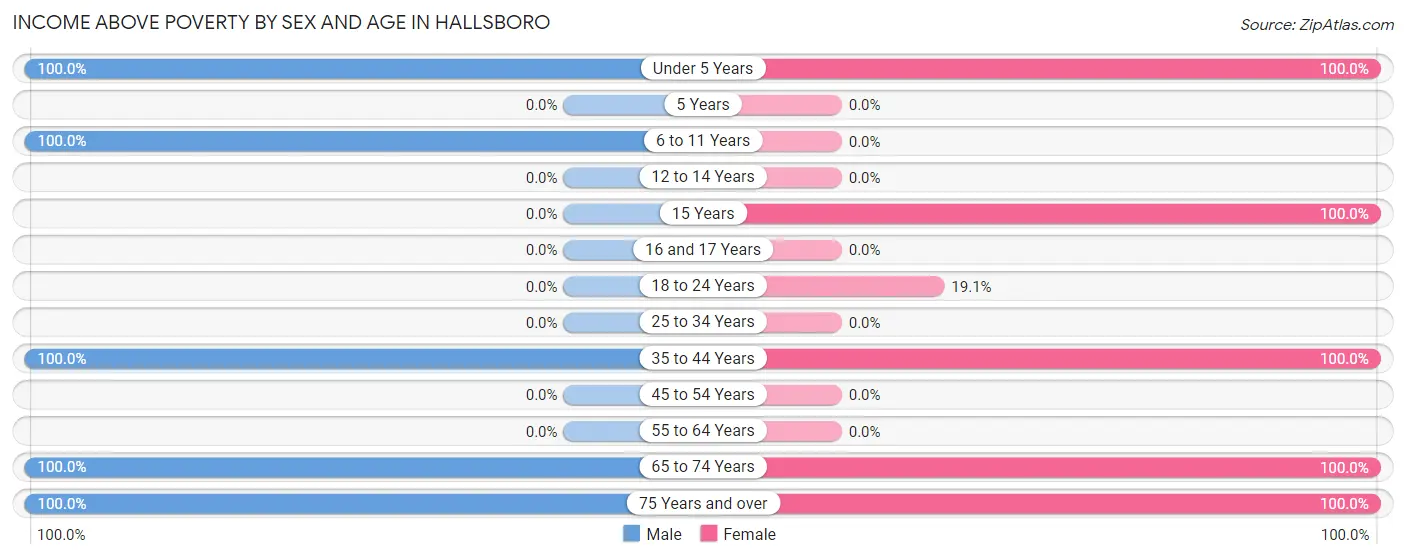
| Age Bracket | Male | Female |
| Under 5 Years | 10 (100.0%) | 12 (100.0%) |
| 5 Years | 0 (0.0%) | 0 (0.0%) |
| 6 to 11 Years | 4 (100.0%) | 0 (0.0%) |
| 12 to 14 Years | 0 (0.0%) | 0 (0.0%) |
| 15 Years | 0 (0.0%) | 9 (100.0%) |
| 16 and 17 Years | 0 (0.0%) | 0 (0.0%) |
| 18 to 24 Years | 0 (0.0%) | 4 (19.1%) |
| 25 to 34 Years | 0 (0.0%) | 0 (0.0%) |
| 35 to 44 Years | 10 (100.0%) | 21 (100.0%) |
| 45 to 54 Years | 0 (0.0%) | 0 (0.0%) |
| 55 to 64 Years | 0 (0.0%) | 0 (0.0%) |
| 65 to 74 Years | 3 (100.0%) | 3 (100.0%) |
| 75 Years and over | 22 (100.0%) | 44 (100.0%) |
| Total | 49 (79.0%) | 93 (84.6%) |
Income Below Poverty Among Married-Couple Families in Hallsboro
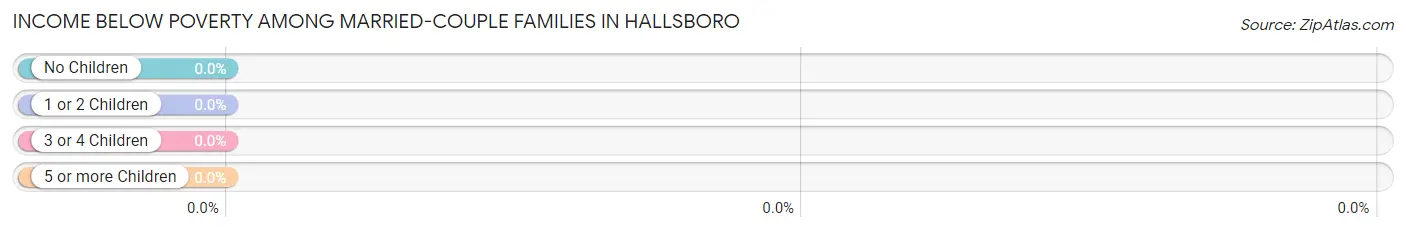
| Children | Above Poverty | Below Poverty |
| No Children | 32 (100.0%) | 0 (0.0%) |
| 1 or 2 Children | 3 (100.0%) | 0 (0.0%) |
| 3 or 4 Children | 0 (0.0%) | 0 (0.0%) |
| 5 or more Children | 0 (0.0%) | 0 (0.0%) |
| Total | 35 (100.0%) | 0 (0.0%) |
Income Below Poverty Among Single-Parent Households in Hallsboro
| Children | Single Father | Single Mother |
| No Children | 0 (0.0%) | 0 (0.0%) |
| 1 or 2 Children | 0 (0.0%) | 0 (0.0%) |
| 3 or 4 Children | 0 (0.0%) | 0 (0.0%) |
| 5 or more Children | 0 (0.0%) | 0 (0.0%) |
| Total | 0 (0.0%) | 0 (0.0%) |
Income Below Poverty Among Married-Couple vs Single-Parent Households in Hallsboro
| Children | Married-Couple Families | Single-Parent Households |
| No Children | 0 (0.0%) | 0 (0.0%) |
| 1 or 2 Children | 0 (0.0%) | 0 (0.0%) |
| 3 or 4 Children | 0 (0.0%) | 0 (0.0%) |
| 5 or more Children | 0 (0.0%) | 0 (0.0%) |
| Total | 0 (0.0%) | 0 (0.0%) |
Race in Hallsboro
The most populous races in Hallsboro are White / Caucasian (92 | 53.5%), Black / African American (70 | 40.7%), and Two or more Races (10 | 5.8%).
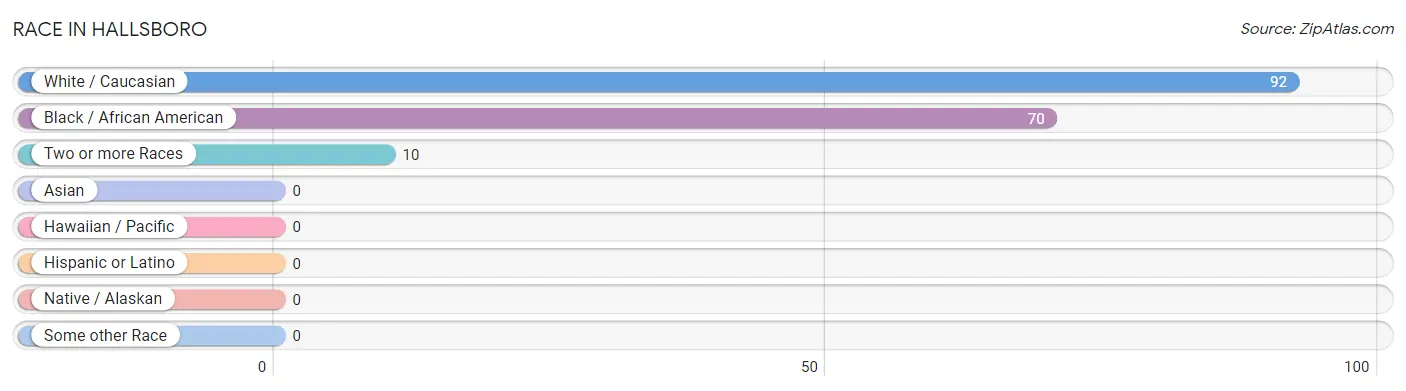
| Race | # Population | % Population |
| Asian | 0 | 0.0% |
| Black / African American | 70 | 40.7% |
| Hawaiian / Pacific | 0 | 0.0% |
| Hispanic or Latino | 0 | 0.0% |
| Native / Alaskan | 0 | 0.0% |
| White / Caucasian | 92 | 53.5% |
| Two or more Races | 10 | 5.8% |
| Some other Race | 0 | 0.0% |
| Total | 172 | 100.0% |
Ancestry in Hallsboro
The most populous ancestries reported in Hallsboro are Irish (27 | 15.7%), English (19 | 11.1%), Welsh (16 | 9.3%), American (13 | 7.6%), and German (10 | 5.8%), together accounting for 49.4% of all Hallsboro residents.
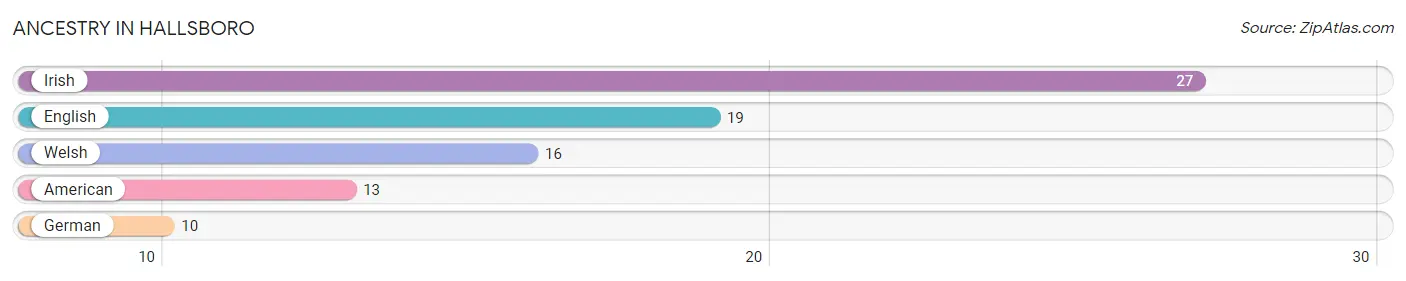
| Ancestry | # Population | % Population |
| American | 13 | 7.6% |
| English | 19 | 11.1% |
| German | 10 | 5.8% |
| Irish | 27 | 15.7% |
| Welsh | 16 | 9.3% | View All 5 Rows |
Immigrants in Hallsboro

| Immigration Origin | # Population | % Population | View All 0 Rows |
Sex and Age in Hallsboro
Sex and Age in Hallsboro
The most populous age groups in Hallsboro are 80 to 84 Years (22 | 35.5%) for men and 75 to 79 Years (34 | 30.9%) for women.
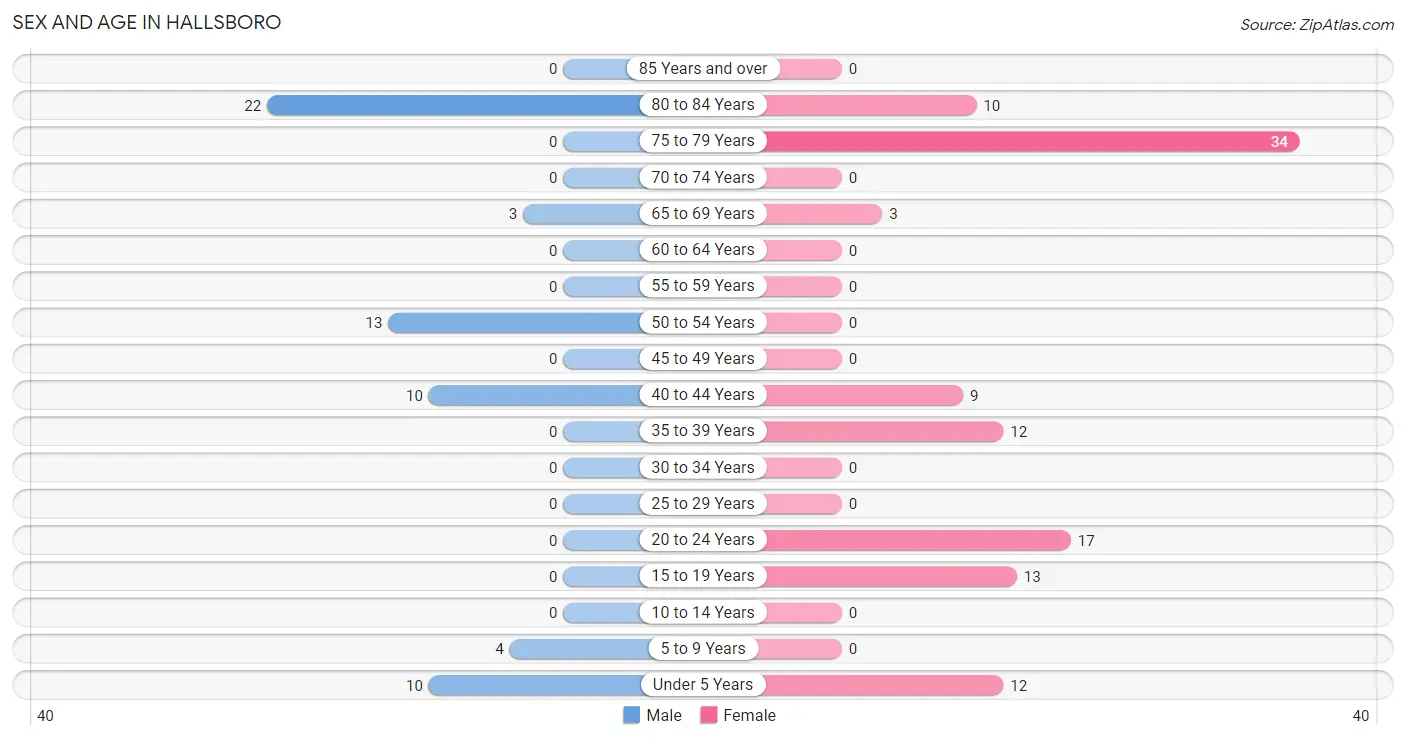
| Age Bracket | Male | Female |
| Under 5 Years | 10 (16.1%) | 12 (10.9%) |
| 5 to 9 Years | 4 (6.5%) | 0 (0.0%) |
| 10 to 14 Years | 0 (0.0%) | 0 (0.0%) |
| 15 to 19 Years | 0 (0.0%) | 13 (11.8%) |
| 20 to 24 Years | 0 (0.0%) | 17 (15.4%) |
| 25 to 29 Years | 0 (0.0%) | 0 (0.0%) |
| 30 to 34 Years | 0 (0.0%) | 0 (0.0%) |
| 35 to 39 Years | 0 (0.0%) | 12 (10.9%) |
| 40 to 44 Years | 10 (16.1%) | 9 (8.2%) |
| 45 to 49 Years | 0 (0.0%) | 0 (0.0%) |
| 50 to 54 Years | 13 (21.0%) | 0 (0.0%) |
| 55 to 59 Years | 0 (0.0%) | 0 (0.0%) |
| 60 to 64 Years | 0 (0.0%) | 0 (0.0%) |
| 65 to 69 Years | 3 (4.8%) | 3 (2.7%) |
| 70 to 74 Years | 0 (0.0%) | 0 (0.0%) |
| 75 to 79 Years | 0 (0.0%) | 34 (30.9%) |
| 80 to 84 Years | 22 (35.5%) | 10 (9.1%) |
| 85 Years and over | 0 (0.0%) | 0 (0.0%) |
| Total | 62 (100.0%) | 110 (100.0%) |
Families and Households in Hallsboro
Median Family Size in Hallsboro
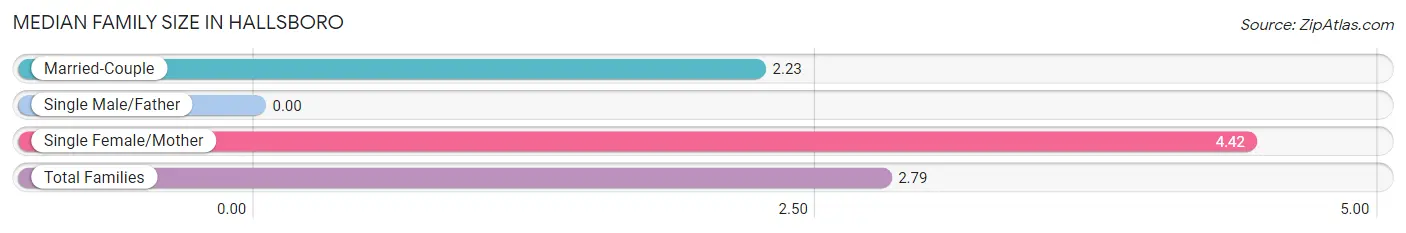
| Family Type | # Families | Family Size |
| Married-Couple | 35 (74.5%) | 2.23 |
| Single Male/Father | 0 (0.0%) | - |
| Single Female/Mother | 12 (25.5%) | 4.42 |
| Total Families | 47 (100.0%) | 2.79 |
Median Household Size in Hallsboro
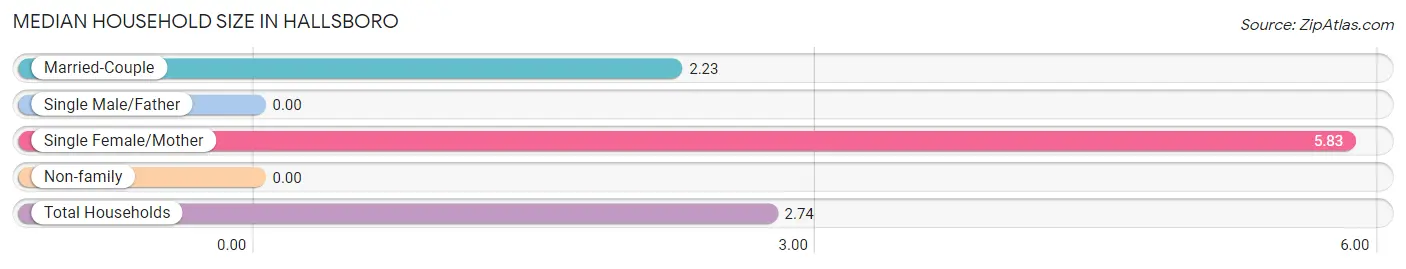
| Household Type | # Households | Household Size |
| Married-Couple | 35 (60.3%) | 2.23 |
| Single Male/Father | 0 (0.0%) | - |
| Single Female/Mother | 12 (20.7%) | 5.83 |
| Non-family | 11 (19.0%) | - |
| Total Households | 58 (100.0%) | 2.74 |
Household Size by Marriage Status in Hallsboro
Out of a total of 58 households in Hallsboro, 47 (81.0%) are family households, while 11 (19.0%) are nonfamily households. The most numerous type of family households are 2-person households, comprising 38, and the most common type of nonfamily households are 1-person households, comprising 11.
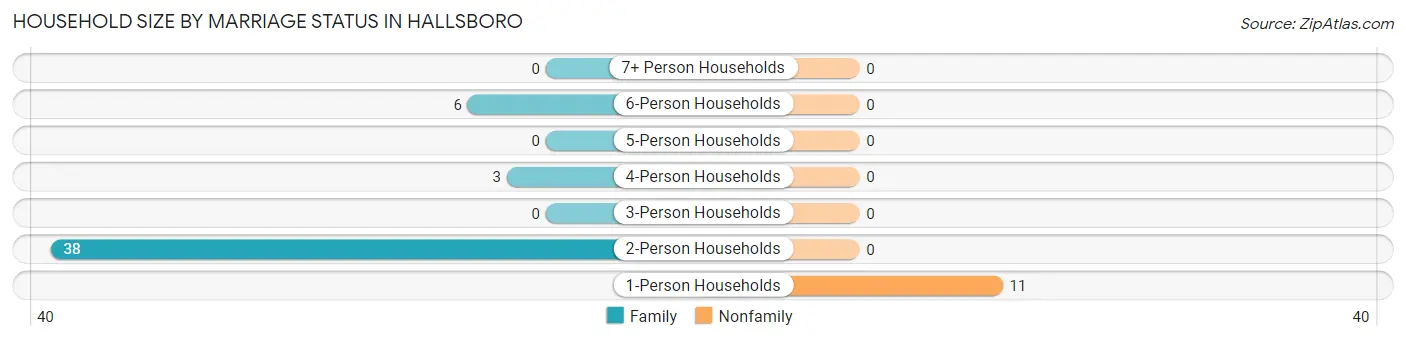
| Household Size | Family Households | Nonfamily Households |
| 1-Person Households | - | 11 (19.0%) |
| 2-Person Households | 38 (65.5%) | 0 (0.0%) |
| 3-Person Households | 0 (0.0%) | 0 (0.0%) |
| 4-Person Households | 3 (5.2%) | 0 (0.0%) |
| 5-Person Households | 0 (0.0%) | 0 (0.0%) |
| 6-Person Households | 6 (10.3%) | 0 (0.0%) |
| 7+ Person Households | 0 (0.0%) | 0 (0.0%) |
| Total | 47 (81.0%) | 11 (19.0%) |
Female Fertility in Hallsboro
Fertility by Age in Hallsboro
| Age Bracket | Women with Births | Births / 1,000 Women |
| 15 to 19 years | 0 (0.0%) | 0.0 |
| 20 to 34 years | 0 (0.0%) | 0.0 |
| 35 to 50 years | 0 (0.0%) | 0.0 |
| Total | 0 (0.0%) | 0.0 |
Fertility by Age by Marriage Status in Hallsboro
| Age Bracket | Married | Unmarried |
| 15 to 19 years | 0 (0.0%) | 0 (0.0%) |
| 20 to 34 years | 0 (0.0%) | 0 (0.0%) |
| 35 to 50 years | 0 (0.0%) | 0 (0.0%) |
| Total | 0 (0.0%) | 0 (0.0%) |
Fertility by Education in Hallsboro
| Educational Attainment | Women with Births | Births / 1,000 Women |
| Less than High School | 0 (0.0%) | 0.0 |
| High School Diploma | 0 (0.0%) | 0.0 |
| College or Associate's Degree | 0 (0.0%) | 0.0 |
| Bachelor's Degree | 0 (0.0%) | 0.0 |
| Graduate Degree | 0 (0.0%) | 0.0 |
| Total | 0 (0.0%) | 0.0 |
Fertility by Education by Marriage Status in Hallsboro
| Educational Attainment | Married | Unmarried |
| Less than High School | 0 (0.0%) | 0 (0.0%) |
| High School Diploma | 0 (0.0%) | 0 (0.0%) |
| College or Associate's Degree | 0 (0.0%) | 0 (0.0%) |
| Bachelor's Degree | 0 (0.0%) | 0 (0.0%) |
| Graduate Degree | 0 (0.0%) | 0 (0.0%) |
| Total | 0 (0.0%) | 0 (0.0%) |
Employment Characteristics in Hallsboro
Employment by Class of Employer in Hallsboro
Among the 21 employed individuals in Hallsboro, , and private company employees (21 | 100.0%) make up the most common classes of employment.
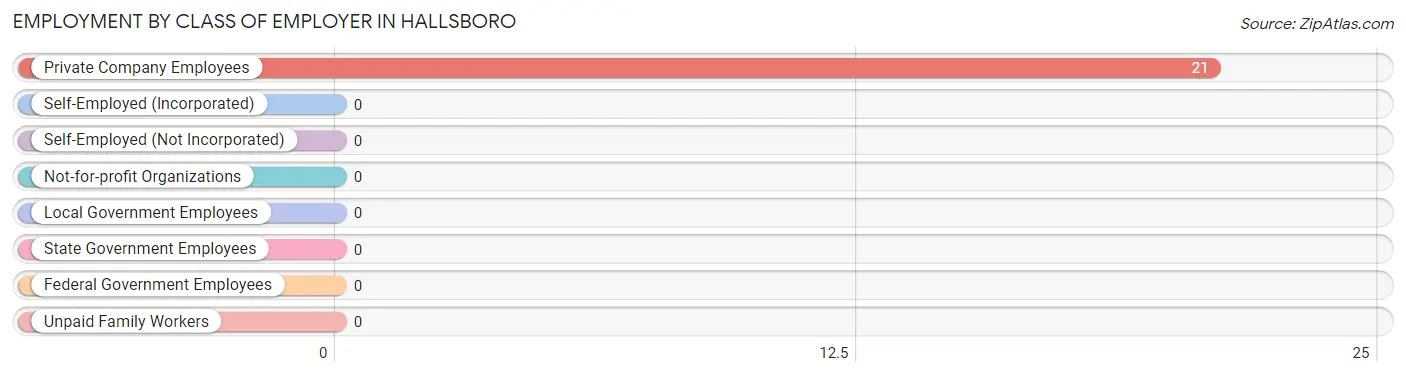
| Employer Class | # Employees | % Employees |
| Private Company Employees | 21 | 100.0% |
| Self-Employed (Incorporated) | 0 | 0.0% |
| Self-Employed (Not Incorporated) | 0 | 0.0% |
| Not-for-profit Organizations | 0 | 0.0% |
| Local Government Employees | 0 | 0.0% |
| State Government Employees | 0 | 0.0% |
| Federal Government Employees | 0 | 0.0% |
| Unpaid Family Workers | 0 | 0.0% |
| Total | 21 | 100.0% |
Employment Status by Age in Hallsboro
According to the labor force statistics for Hallsboro, out of the total population over 16 years of age (137), 30.7% or 42 individuals are in the labor force, with 50.0% or 21 of them unemployed. The age group with the highest labor force participation rate is 16 to 19 years, with 100.0% or 4 individuals in the labor force. Within the labor force, the 16 to 19 years age range has the highest percentage of unemployed individuals, with 100.0% or 4 of them being unemployed.
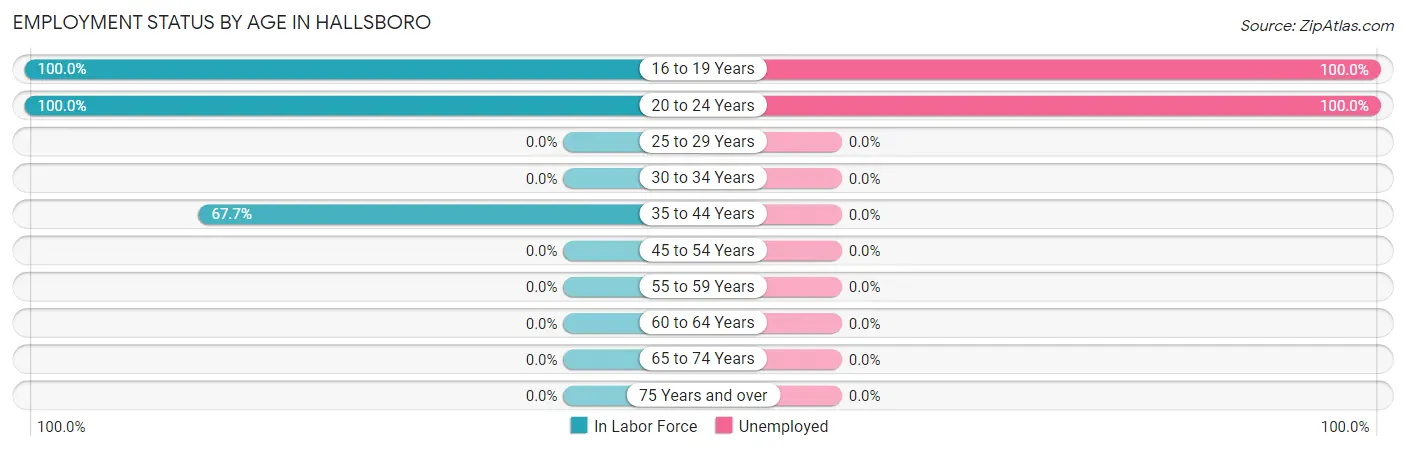
| Age Bracket | In Labor Force | Unemployed |
| 16 to 19 Years | 4 (100.0%) | 4 (100.0%) |
| 20 to 24 Years | 17 (100.0%) | 17 (100.0%) |
| 25 to 29 Years | 0 (0.0%) | 0 (0.0%) |
| 30 to 34 Years | 0 (0.0%) | 0 (0.0%) |
| 35 to 44 Years | 21 (67.7%) | 0 (0.0%) |
| 45 to 54 Years | 0 (0.0%) | 0 (0.0%) |
| 55 to 59 Years | 0 (0.0%) | 0 (0.0%) |
| 60 to 64 Years | 0 (0.0%) | 0 (0.0%) |
| 65 to 74 Years | 0 (0.0%) | 0 (0.0%) |
| 75 Years and over | 0 (0.0%) | 0 (0.0%) |
| Total | 42 (30.7%) | 21 (50.0%) |
Employment Status by Educational Attainment in Hallsboro
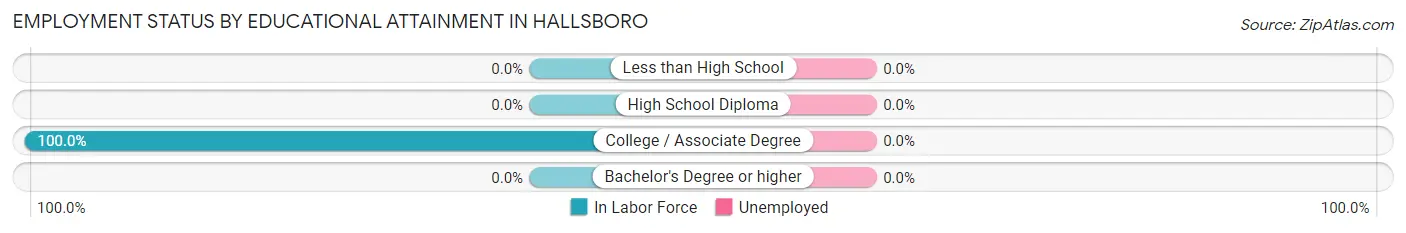
| Educational Attainment | In Labor Force | Unemployed |
| Less than High School | 0 (0.0%) | 0 (0.0%) |
| High School Diploma | 0 (0.0%) | 0 (0.0%) |
| College / Associate Degree | 21 (100.0%) | 0 (0.0%) |
| Bachelor's Degree or higher | 0 (0.0%) | 0 (0.0%) |
| Total | 21 (47.7%) | 0 (0.0%) |
Employment Occupations by Sex in Hallsboro
Management, Business, Science and Arts Occupations
The most common Management, Business, Science and Arts occupations in Hallsboro are Health Diagnosing & Treating (15 | 71.4%), Business & Financial (6 | 28.6%), and Health Technologists (6 | 28.6%).
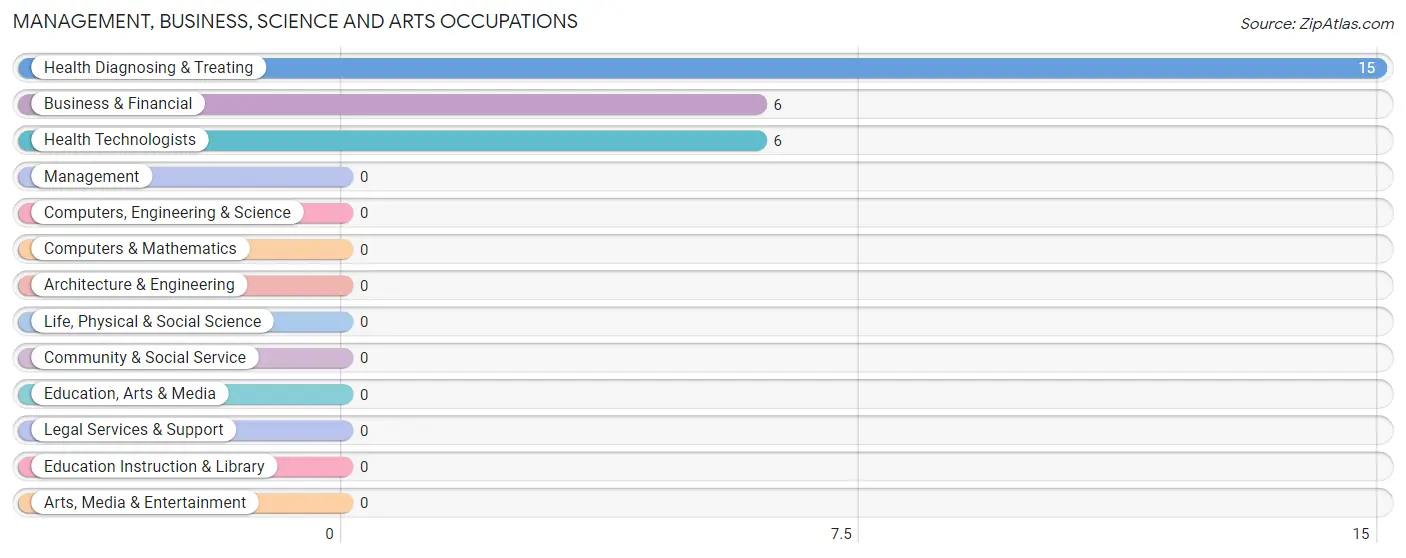
Management, Business, Science and Arts Occupations by Sex
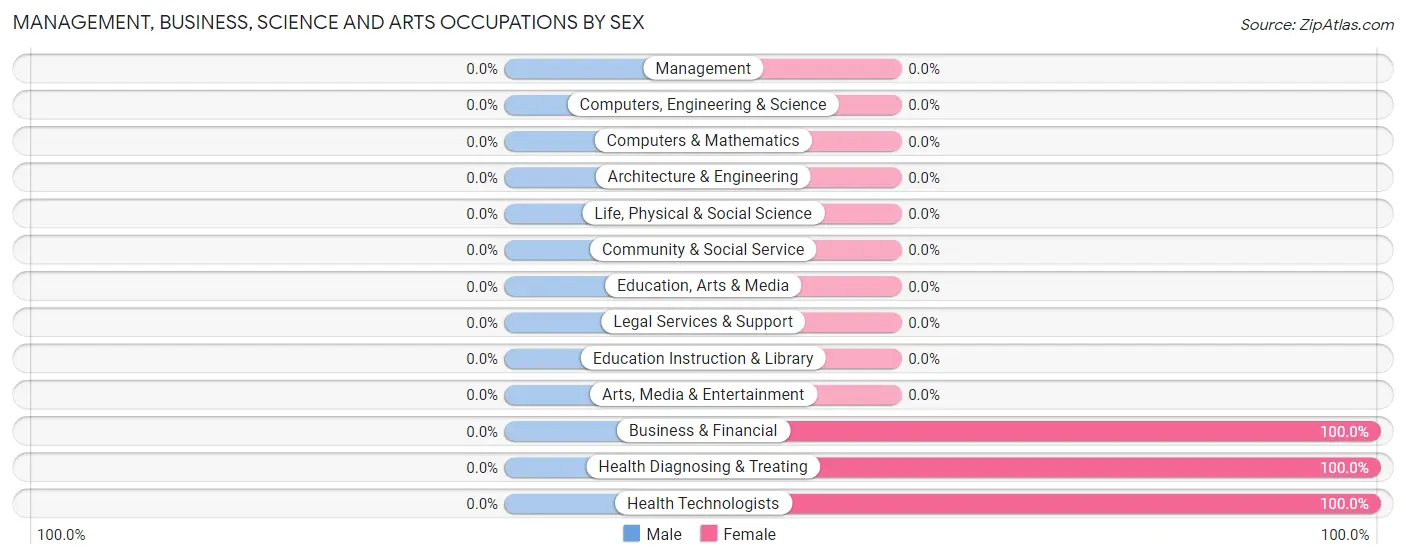
| Occupation | Male | Female |
| Management | 0 (0.0%) | 0 (0.0%) |
| Business & Financial | 0 (0.0%) | 6 (100.0%) |
| Computers, Engineering & Science | 0 (0.0%) | 0 (0.0%) |
| Computers & Mathematics | 0 (0.0%) | 0 (0.0%) |
| Architecture & Engineering | 0 (0.0%) | 0 (0.0%) |
| Life, Physical & Social Science | 0 (0.0%) | 0 (0.0%) |
| Community & Social Service | 0 (0.0%) | 0 (0.0%) |
| Education, Arts & Media | 0 (0.0%) | 0 (0.0%) |
| Legal Services & Support | 0 (0.0%) | 0 (0.0%) |
| Education Instruction & Library | 0 (0.0%) | 0 (0.0%) |
| Arts, Media & Entertainment | 0 (0.0%) | 0 (0.0%) |
| Health Diagnosing & Treating | 0 (0.0%) | 15 (100.0%) |
| Health Technologists | 0 (0.0%) | 6 (100.0%) |
| Total (Category) | 0 (0.0%) | 21 (100.0%) |
| Total (Overall) | 0 (0.0%) | 21 (100.0%) |
Services Occupations
Services Occupations by Sex
| Occupation | Male | Female |
| Healthcare Support | 0 (0.0%) | 0 (0.0%) |
| Security & Protection | 0 (0.0%) | 0 (0.0%) |
| Firefighting & Prevention | 0 (0.0%) | 0 (0.0%) |
| Law Enforcement | 0 (0.0%) | 0 (0.0%) |
| Food Preparation & Serving | 0 (0.0%) | 0 (0.0%) |
| Cleaning & Maintenance | 0 (0.0%) | 0 (0.0%) |
| Personal Care & Service | 0 (0.0%) | 0 (0.0%) |
| Total (Category) | 0 (0.0%) | 0 (0.0%) |
| Total (Overall) | 0 (0.0%) | 21 (100.0%) |
Sales and Office Occupations
Sales and Office Occupations by Sex
| Occupation | Male | Female |
| Sales & Related | 0 (0.0%) | 0 (0.0%) |
| Office & Administration | 0 (0.0%) | 0 (0.0%) |
| Total (Category) | 0 (0.0%) | 0 (0.0%) |
| Total (Overall) | 0 (0.0%) | 21 (100.0%) |
Natural Resources, Construction and Maintenance Occupations
Natural Resources, Construction and Maintenance Occupations by Sex
| Occupation | Male | Female |
| Farming, Fishing & Forestry | 0 (0.0%) | 0 (0.0%) |
| Construction & Extraction | 0 (0.0%) | 0 (0.0%) |
| Installation, Maintenance & Repair | 0 (0.0%) | 0 (0.0%) |
| Total (Category) | 0 (0.0%) | 0 (0.0%) |
| Total (Overall) | 0 (0.0%) | 21 (100.0%) |
Production, Transportation and Moving Occupations
Production, Transportation and Moving Occupations by Sex
| Occupation | Male | Female |
| Production | 0 (0.0%) | 0 (0.0%) |
| Transportation | 0 (0.0%) | 0 (0.0%) |
| Material Moving | 0 (0.0%) | 0 (0.0%) |
| Total (Category) | 0 (0.0%) | 0 (0.0%) |
| Total (Overall) | 0 (0.0%) | 21 (100.0%) |
Employment Industries by Sex in Hallsboro
Employment Industries in Hallsboro
The major employment industries in Hallsboro include Health Care & Social Assistance (15 | 71.4%), and Finance & Insurance (6 | 28.6%).
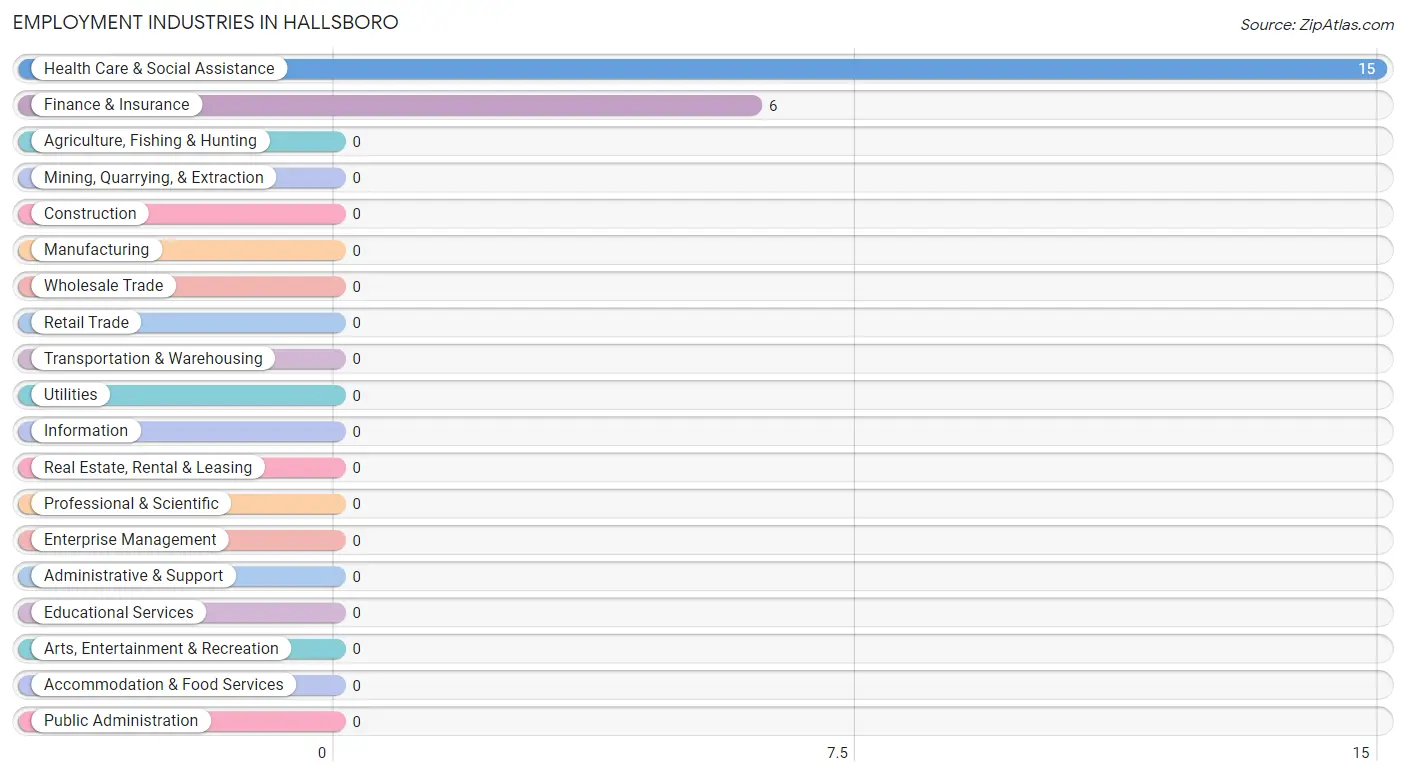
Employment Industries by Sex in Hallsboro
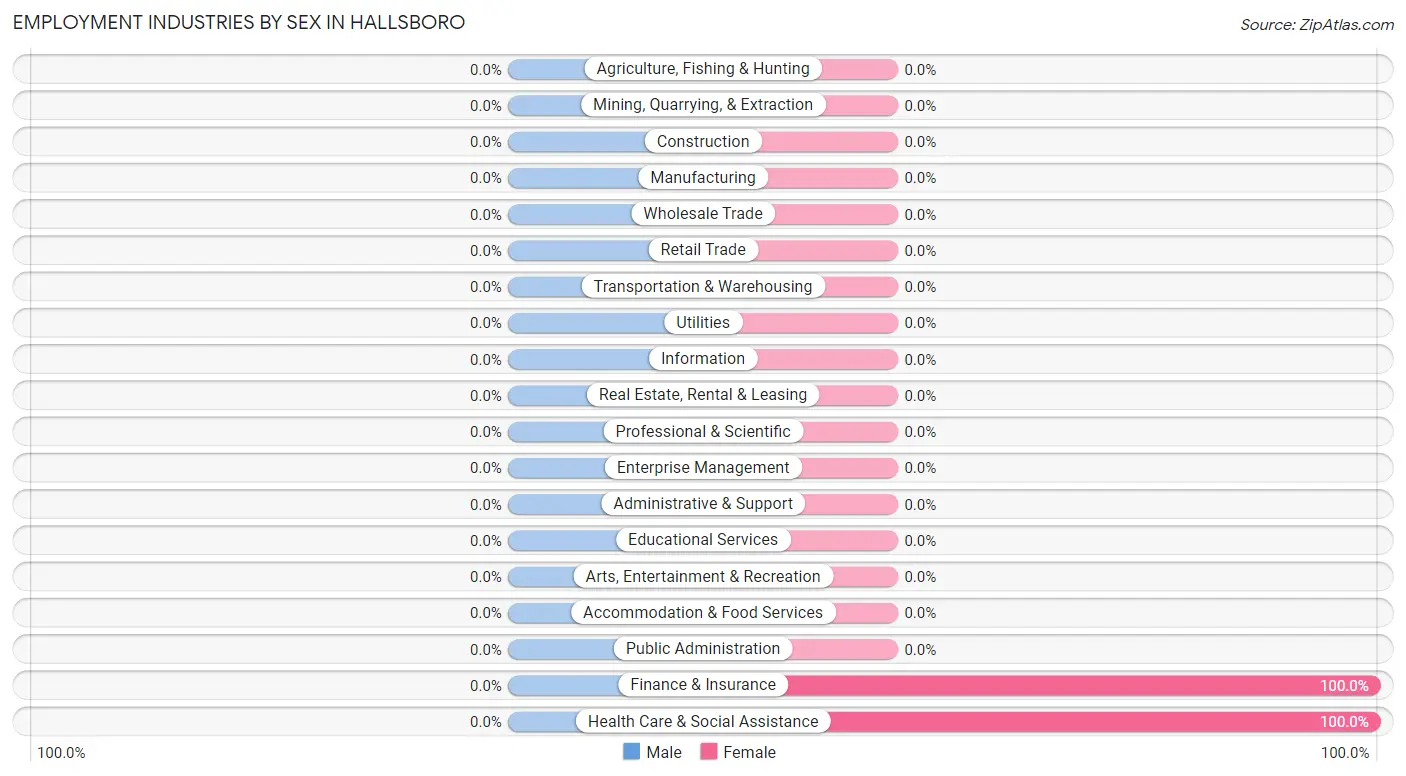
| Industry | Male | Female |
| Agriculture, Fishing & Hunting | 0 (0.0%) | 0 (0.0%) |
| Mining, Quarrying, & Extraction | 0 (0.0%) | 0 (0.0%) |
| Construction | 0 (0.0%) | 0 (0.0%) |
| Manufacturing | 0 (0.0%) | 0 (0.0%) |
| Wholesale Trade | 0 (0.0%) | 0 (0.0%) |
| Retail Trade | 0 (0.0%) | 0 (0.0%) |
| Transportation & Warehousing | 0 (0.0%) | 0 (0.0%) |
| Utilities | 0 (0.0%) | 0 (0.0%) |
| Information | 0 (0.0%) | 0 (0.0%) |
| Finance & Insurance | 0 (0.0%) | 6 (100.0%) |
| Real Estate, Rental & Leasing | 0 (0.0%) | 0 (0.0%) |
| Professional & Scientific | 0 (0.0%) | 0 (0.0%) |
| Enterprise Management | 0 (0.0%) | 0 (0.0%) |
| Administrative & Support | 0 (0.0%) | 0 (0.0%) |
| Educational Services | 0 (0.0%) | 0 (0.0%) |
| Health Care & Social Assistance | 0 (0.0%) | 15 (100.0%) |
| Arts, Entertainment & Recreation | 0 (0.0%) | 0 (0.0%) |
| Accommodation & Food Services | 0 (0.0%) | 0 (0.0%) |
| Public Administration | 0 (0.0%) | 0 (0.0%) |
| Total | 0 (0.0%) | 21 (100.0%) |
Education in Hallsboro
School Enrollment in Hallsboro
The most common levels of schooling among the 23 students in Hallsboro are high school (8 | 34.8%), college / undergraduate (6 | 26.1%), and middle school (5 | 21.7%).
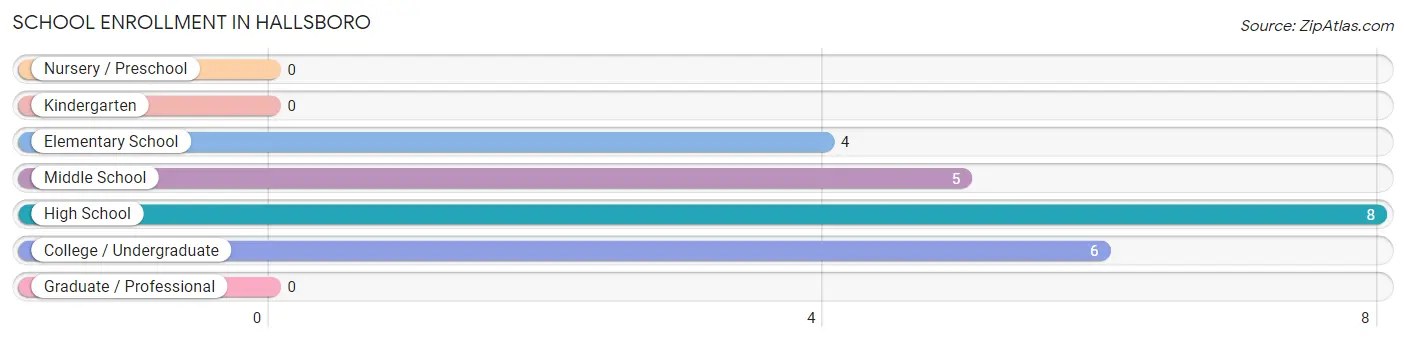
| School Level | # Students | % Students |
| Nursery / Preschool | 0 | 0.0% |
| Kindergarten | 0 | 0.0% |
| Elementary School | 4 | 17.4% |
| Middle School | 5 | 21.7% |
| High School | 8 | 34.8% |
| College / Undergraduate | 6 | 26.1% |
| Graduate / Professional | 0 | 0.0% |
| Total | 23 | 100.0% |
School Enrollment by Age by Funding Source in Hallsboro
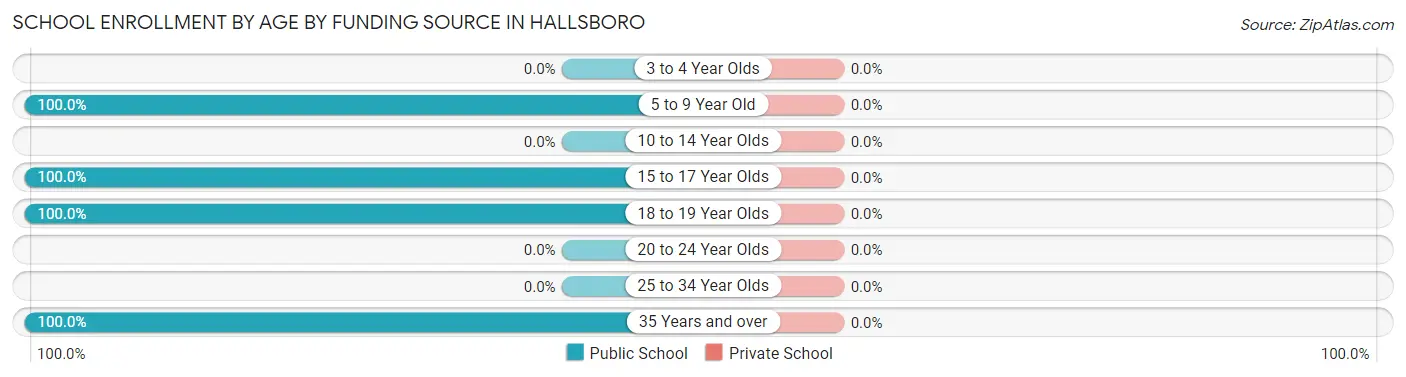
| Age Bracket | Public School | Private School |
| 3 to 4 Year Olds | 0 (0.0%) | 0 (0.0%) |
| 5 to 9 Year Old | 4 (100.0%) | 0 (0.0%) |
| 10 to 14 Year Olds | 0 (0.0%) | 0 (0.0%) |
| 15 to 17 Year Olds | 9 (100.0%) | 0 (0.0%) |
| 18 to 19 Year Olds | 4 (100.0%) | 0 (0.0%) |
| 20 to 24 Year Olds | 0 (0.0%) | 0 (0.0%) |
| 25 to 34 Year Olds | 0 (0.0%) | 0 (0.0%) |
| 35 Years and over | 6 (100.0%) | 0 (0.0%) |
| Total | 23 (100.0%) | 0 (0.0%) |
Educational Attainment by Field of Study in Hallsboro
, and physical & health sciences (10 | 100.0%) are the most common fields of study among 10 individuals in Hallsboro who have obtained a bachelor's degree or higher.
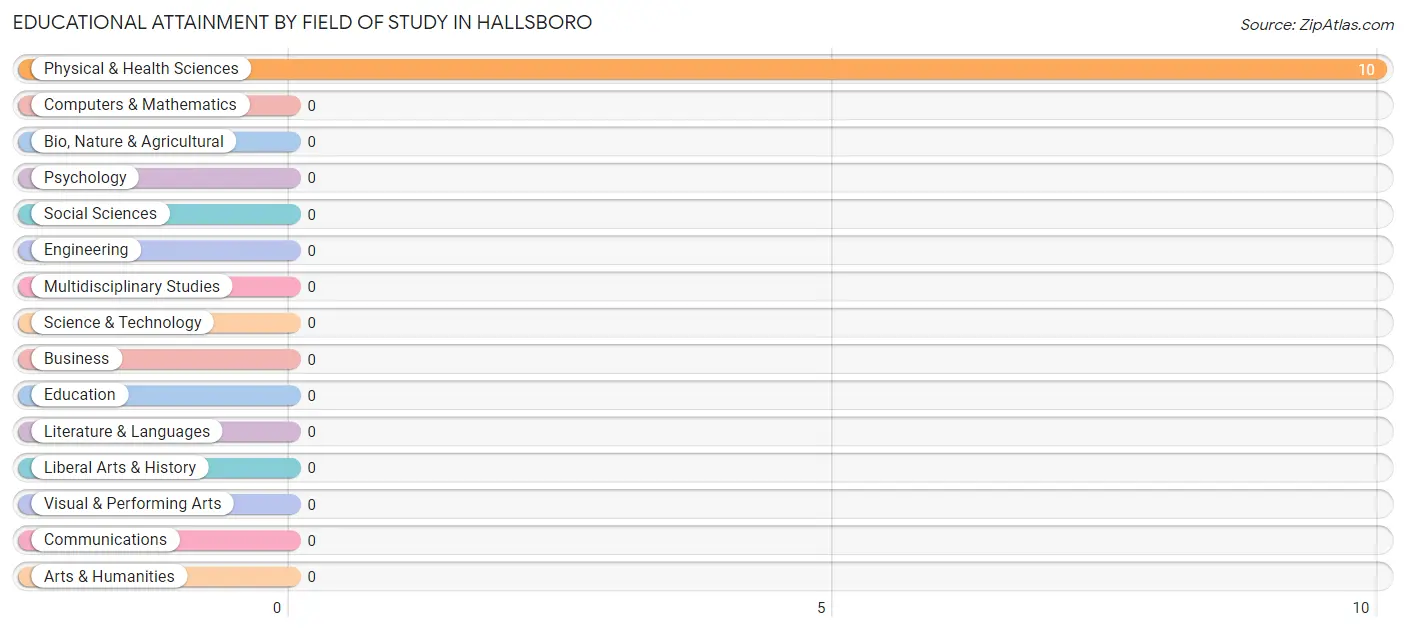
| Field of Study | # Graduates | % Graduates |
| Computers & Mathematics | 0 | 0.0% |
| Bio, Nature & Agricultural | 0 | 0.0% |
| Physical & Health Sciences | 10 | 100.0% |
| Psychology | 0 | 0.0% |
| Social Sciences | 0 | 0.0% |
| Engineering | 0 | 0.0% |
| Multidisciplinary Studies | 0 | 0.0% |
| Science & Technology | 0 | 0.0% |
| Business | 0 | 0.0% |
| Education | 0 | 0.0% |
| Literature & Languages | 0 | 0.0% |
| Liberal Arts & History | 0 | 0.0% |
| Visual & Performing Arts | 0 | 0.0% |
| Communications | 0 | 0.0% |
| Arts & Humanities | 0 | 0.0% |
| Total | 10 | 100.0% |
Transportation & Commute in Hallsboro
Vehicle Availability by Sex in Hallsboro
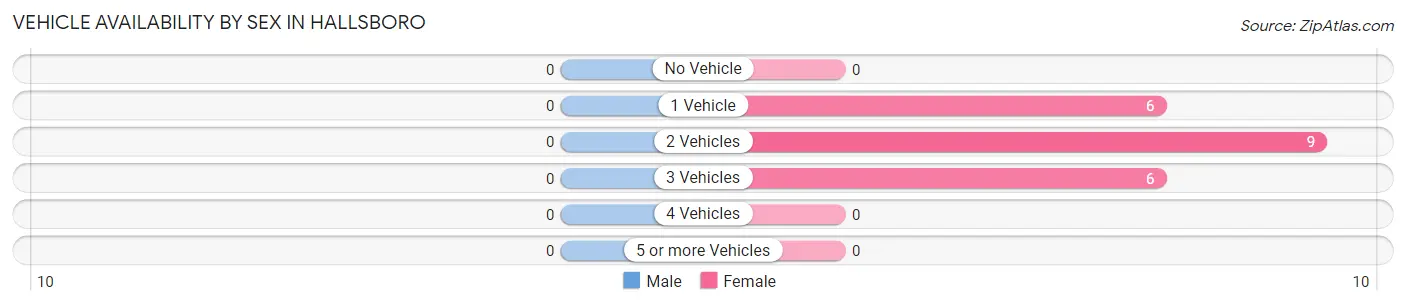
| Vehicles Available | Male | Female |
| No Vehicle | 0 (0.0%) | 0 (0.0%) |
| 1 Vehicle | 0 (0.0%) | 6 (28.6%) |
| 2 Vehicles | 0 (0.0%) | 9 (42.9%) |
| 3 Vehicles | 0 (0.0%) | 6 (28.6%) |
| 4 Vehicles | 0 (0.0%) | 0 (0.0%) |
| 5 or more Vehicles | 0 (0.0%) | 0 (0.0%) |
| Total | 0 (0.0%) | 21 (100.0%) |
Commute Time in Hallsboro
The most frequently occuring commute durations in Hallsboro are 10 to 14 minutes (9 commuters, 42.9%), less than 5 minutes (6 commuters, 28.6%), and 15 to 19 minutes (6 commuters, 28.6%).
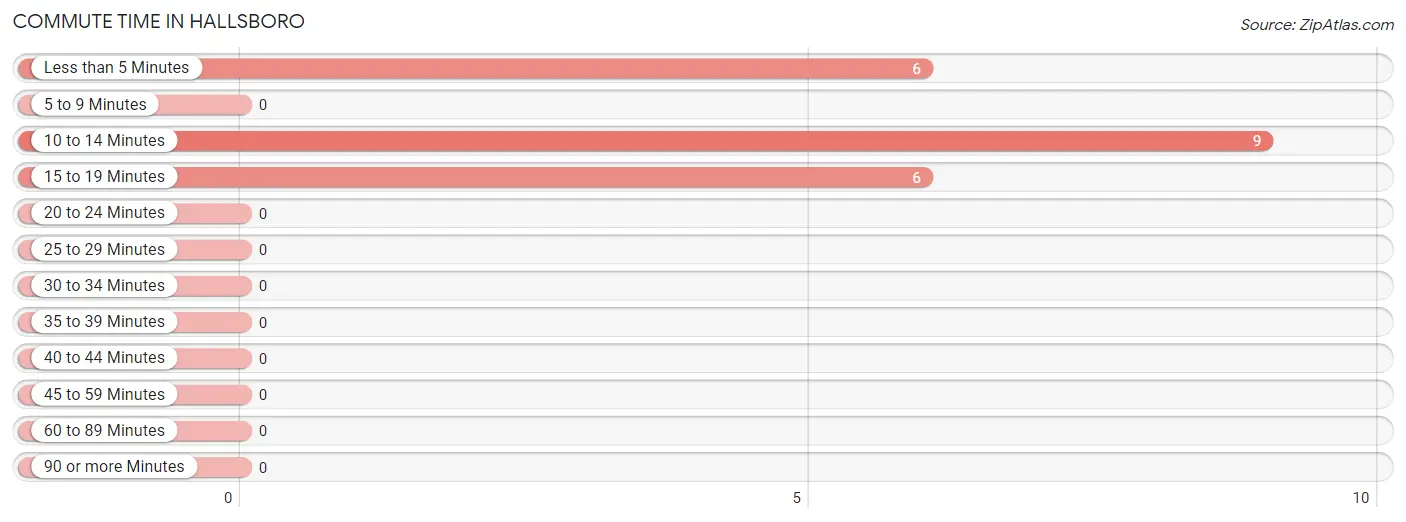
| Commute Time | # Commuters | % Commuters |
| Less than 5 Minutes | 6 | 28.6% |
| 5 to 9 Minutes | 0 | 0.0% |
| 10 to 14 Minutes | 9 | 42.9% |
| 15 to 19 Minutes | 6 | 28.6% |
| 20 to 24 Minutes | 0 | 0.0% |
| 25 to 29 Minutes | 0 | 0.0% |
| 30 to 34 Minutes | 0 | 0.0% |
| 35 to 39 Minutes | 0 | 0.0% |
| 40 to 44 Minutes | 0 | 0.0% |
| 45 to 59 Minutes | 0 | 0.0% |
| 60 to 89 Minutes | 0 | 0.0% |
| 90 or more Minutes | 0 | 0.0% |
Commute Time by Sex in Hallsboro
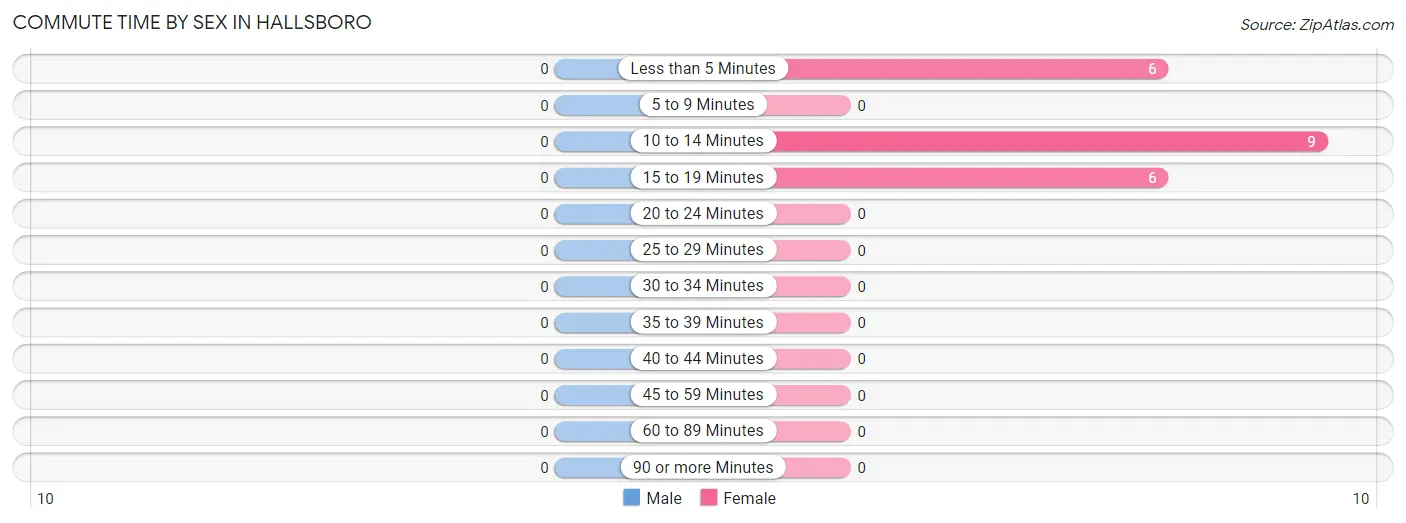
| Commute Time | Male | Female |
| Less than 5 Minutes | 0 (0.0%) | 6 (28.6%) |
| 5 to 9 Minutes | 0 (0.0%) | 0 (0.0%) |
| 10 to 14 Minutes | 0 (0.0%) | 9 (42.9%) |
| 15 to 19 Minutes | 0 (0.0%) | 6 (28.6%) |
| 20 to 24 Minutes | 0 (0.0%) | 0 (0.0%) |
| 25 to 29 Minutes | 0 (0.0%) | 0 (0.0%) |
| 30 to 34 Minutes | 0 (0.0%) | 0 (0.0%) |
| 35 to 39 Minutes | 0 (0.0%) | 0 (0.0%) |
| 40 to 44 Minutes | 0 (0.0%) | 0 (0.0%) |
| 45 to 59 Minutes | 0 (0.0%) | 0 (0.0%) |
| 60 to 89 Minutes | 0 (0.0%) | 0 (0.0%) |
| 90 or more Minutes | 0 (0.0%) | 0 (0.0%) |
Time of Departure to Work by Sex in Hallsboro
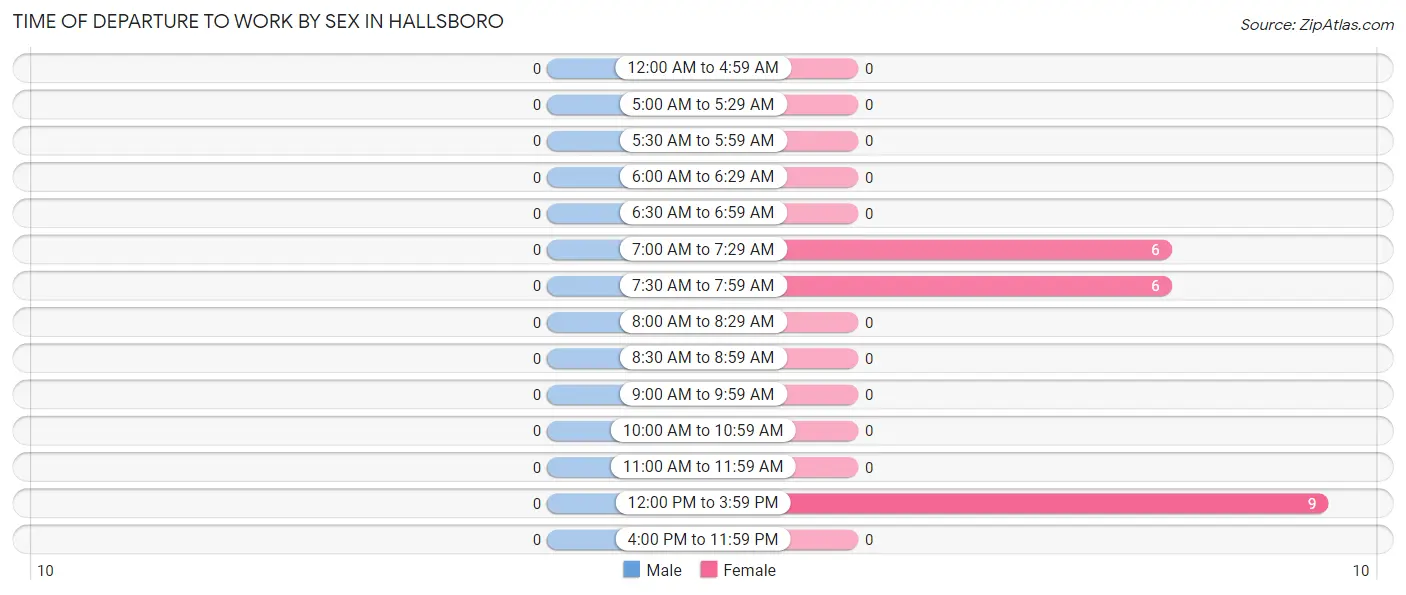
| Time of Departure | Male | Female |
| 12:00 AM to 4:59 AM | 0 (0.0%) | 0 (0.0%) |
| 5:00 AM to 5:29 AM | 0 (0.0%) | 0 (0.0%) |
| 5:30 AM to 5:59 AM | 0 (0.0%) | 0 (0.0%) |
| 6:00 AM to 6:29 AM | 0 (0.0%) | 0 (0.0%) |
| 6:30 AM to 6:59 AM | 0 (0.0%) | 0 (0.0%) |
| 7:00 AM to 7:29 AM | 0 (0.0%) | 6 (28.6%) |
| 7:30 AM to 7:59 AM | 0 (0.0%) | 6 (28.6%) |
| 8:00 AM to 8:29 AM | 0 (0.0%) | 0 (0.0%) |
| 8:30 AM to 8:59 AM | 0 (0.0%) | 0 (0.0%) |
| 9:00 AM to 9:59 AM | 0 (0.0%) | 0 (0.0%) |
| 10:00 AM to 10:59 AM | 0 (0.0%) | 0 (0.0%) |
| 11:00 AM to 11:59 AM | 0 (0.0%) | 0 (0.0%) |
| 12:00 PM to 3:59 PM | 0 (0.0%) | 9 (42.9%) |
| 4:00 PM to 11:59 PM | 0 (0.0%) | 0 (0.0%) |
| Total | 0 (0.0%) | 21 (100.0%) |
Housing Occupancy in Hallsboro
Occupancy by Ownership in Hallsboro
Of the total 58 dwellings in Hallsboro, owner-occupied units account for 43 (74.1%), while renter-occupied units make up 15 (25.9%).
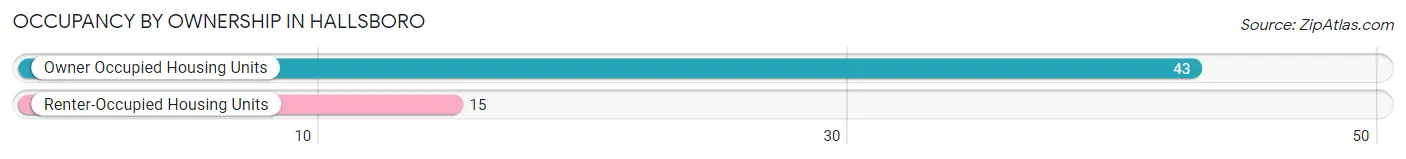
| Occupancy | # Housing Units | % Housing Units |
| Owner Occupied Housing Units | 43 | 74.1% |
| Renter-Occupied Housing Units | 15 | 25.9% |
| Total Occupied Housing Units | 58 | 100.0% |
Occupancy by Household Size in Hallsboro
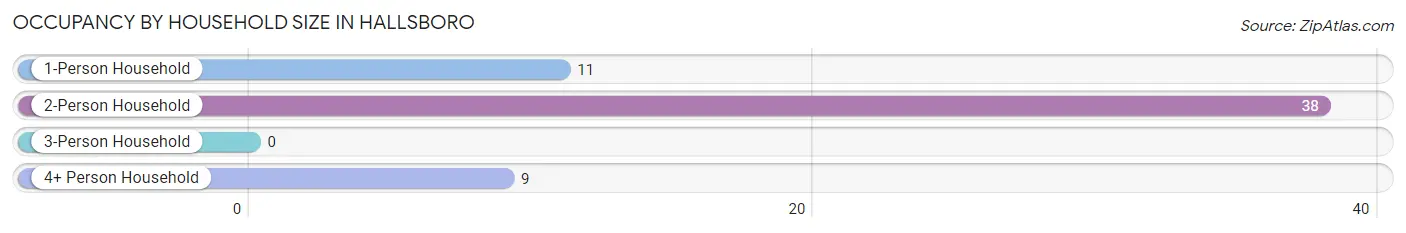
| Household Size | # Housing Units | % Housing Units |
| 1-Person Household | 11 | 19.0% |
| 2-Person Household | 38 | 65.5% |
| 3-Person Household | 0 | 0.0% |
| 4+ Person Household | 9 | 15.5% |
| Total Housing Units | 58 | 100.0% |
Occupancy by Ownership by Household Size in Hallsboro
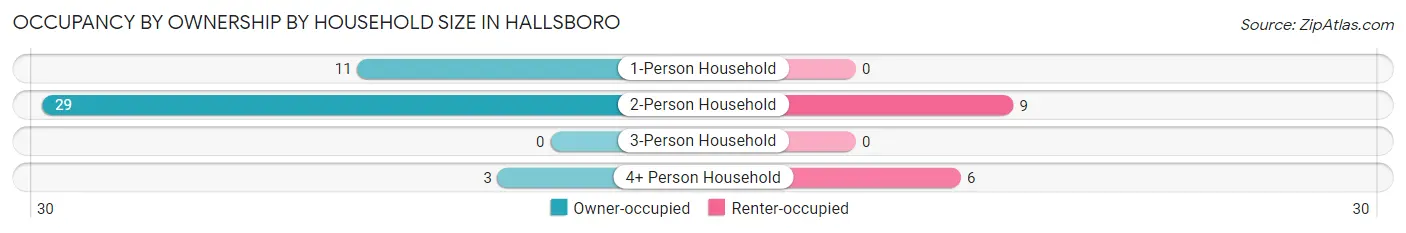
| Household Size | Owner-occupied | Renter-occupied |
| 1-Person Household | 11 (100.0%) | 0 (0.0%) |
| 2-Person Household | 29 (76.3%) | 9 (23.7%) |
| 3-Person Household | 0 (0.0%) | 0 (0.0%) |
| 4+ Person Household | 3 (33.3%) | 6 (66.7%) |
| Total Housing Units | 43 (74.1%) | 15 (25.9%) |
Occupancy by Educational Attainment in Hallsboro
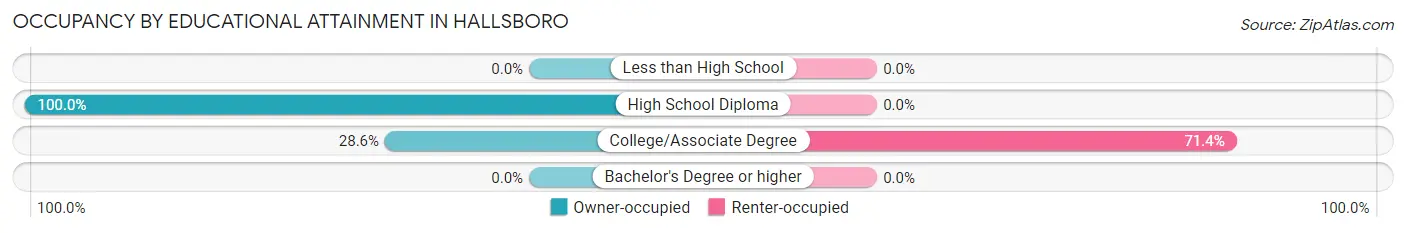
| Household Size | Owner-occupied | Renter-occupied |
| Less than High School | 0 (0.0%) | 0 (0.0%) |
| High School Diploma | 37 (100.0%) | 0 (0.0%) |
| College/Associate Degree | 6 (28.6%) | 15 (71.4%) |
| Bachelor's Degree or higher | 0 (0.0%) | 0 (0.0%) |
Occupancy by Age of Householder in Hallsboro
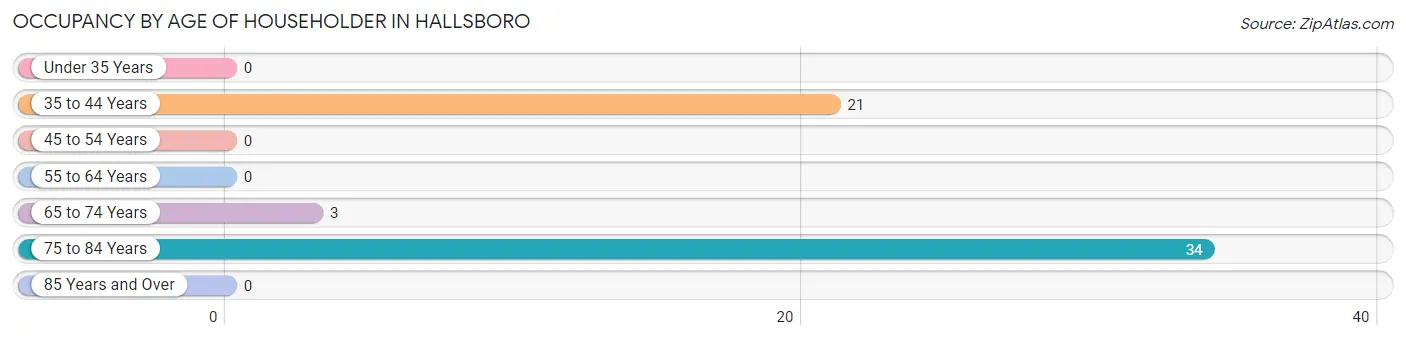
| Age Bracket | # Households | % Households |
| Under 35 Years | 0 | 0.0% |
| 35 to 44 Years | 21 | 36.2% |
| 45 to 54 Years | 0 | 0.0% |
| 55 to 64 Years | 0 | 0.0% |
| 65 to 74 Years | 3 | 5.2% |
| 75 to 84 Years | 34 | 58.6% |
| 85 Years and Over | 0 | 0.0% |
| Total | 58 | 100.0% |
Housing Finances in Hallsboro
Median Income by Occupancy in Hallsboro
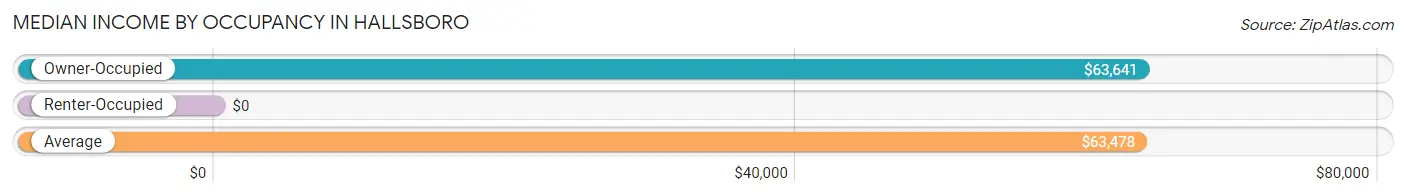
| Occupancy Type | # Households | Median Income |
| Owner-Occupied | 43 (74.1%) | $63,641 |
| Renter-Occupied | 15 (25.9%) | $0 |
| Average | 58 (100.0%) | $63,478 |
Occupancy by Householder Income Bracket in Hallsboro
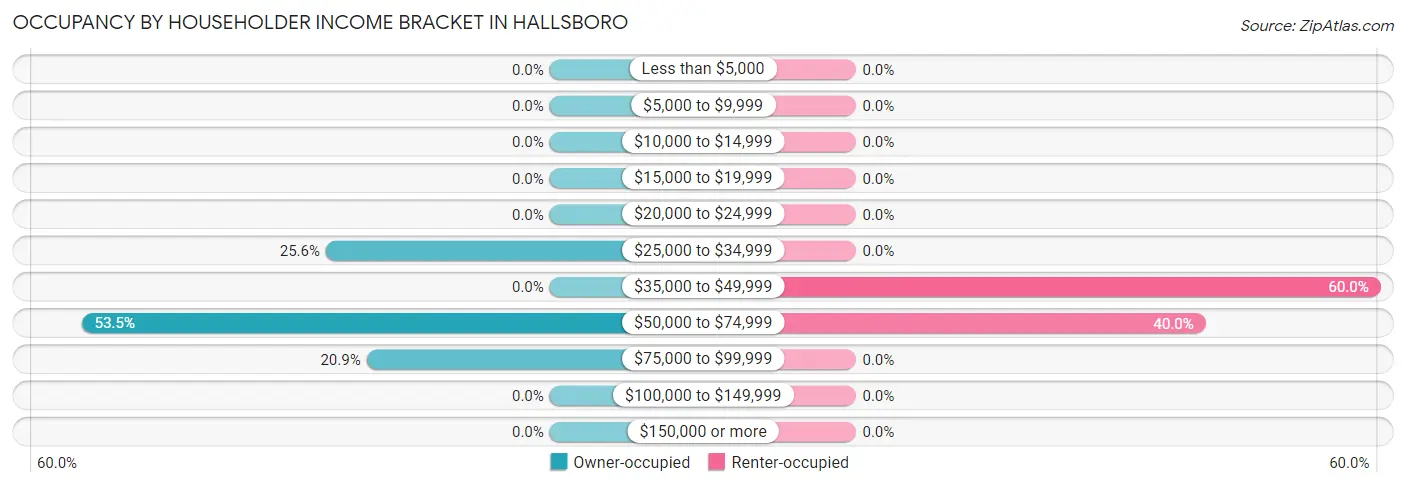
| Income Bracket | Owner-occupied | Renter-occupied |
| Less than $5,000 | 0 (0.0%) | 0 (0.0%) |
| $5,000 to $9,999 | 0 (0.0%) | 0 (0.0%) |
| $10,000 to $14,999 | 0 (0.0%) | 0 (0.0%) |
| $15,000 to $19,999 | 0 (0.0%) | 0 (0.0%) |
| $20,000 to $24,999 | 0 (0.0%) | 0 (0.0%) |
| $25,000 to $34,999 | 11 (25.6%) | 0 (0.0%) |
| $35,000 to $49,999 | 0 (0.0%) | 9 (60.0%) |
| $50,000 to $74,999 | 23 (53.5%) | 6 (40.0%) |
| $75,000 to $99,999 | 9 (20.9%) | 0 (0.0%) |
| $100,000 to $149,999 | 0 (0.0%) | 0 (0.0%) |
| $150,000 or more | 0 (0.0%) | 0 (0.0%) |
| Total | 43 (100.0%) | 15 (100.0%) |
Monthly Housing Cost Tiers in Hallsboro
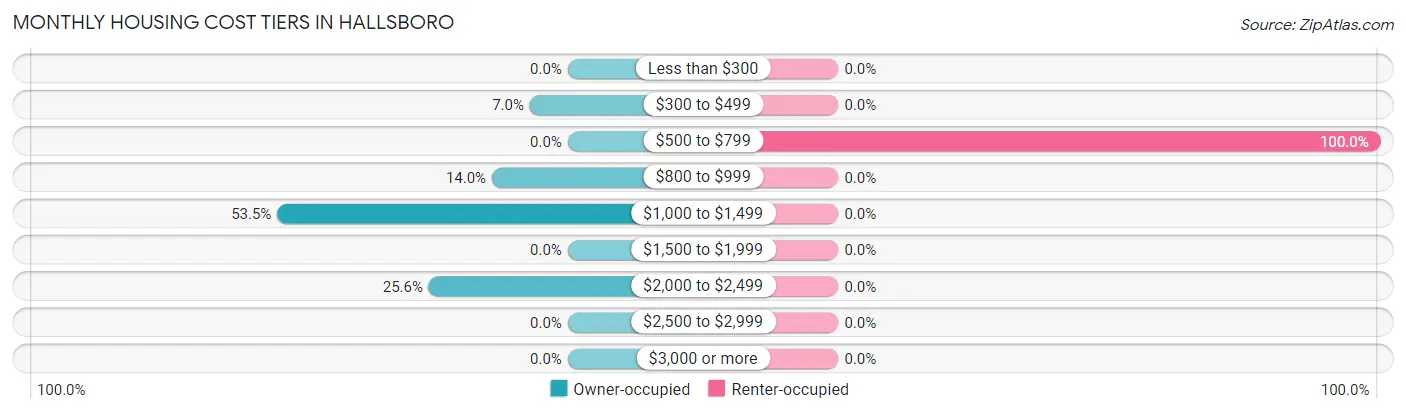
| Monthly Cost | Owner-occupied | Renter-occupied |
| Less than $300 | 0 (0.0%) | 0 (0.0%) |
| $300 to $499 | 3 (7.0%) | 0 (0.0%) |
| $500 to $799 | 0 (0.0%) | 15 (100.0%) |
| $800 to $999 | 6 (14.0%) | 0 (0.0%) |
| $1,000 to $1,499 | 23 (53.5%) | 0 (0.0%) |
| $1,500 to $1,999 | 0 (0.0%) | 0 (0.0%) |
| $2,000 to $2,499 | 11 (25.6%) | 0 (0.0%) |
| $2,500 to $2,999 | 0 (0.0%) | 0 (0.0%) |
| $3,000 or more | 0 (0.0%) | 0 (0.0%) |
| Total | 43 (100.0%) | 15 (100.0%) |
Physical Housing Characteristics in Hallsboro
Housing Structures in Hallsboro
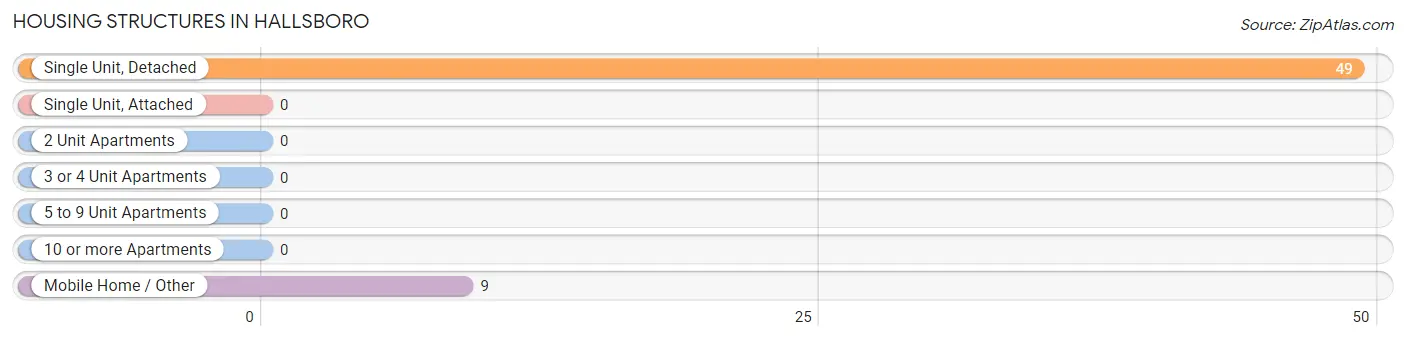
| Structure Type | # Housing Units | % Housing Units |
| Single Unit, Detached | 49 | 84.5% |
| Single Unit, Attached | 0 | 0.0% |
| 2 Unit Apartments | 0 | 0.0% |
| 3 or 4 Unit Apartments | 0 | 0.0% |
| 5 to 9 Unit Apartments | 0 | 0.0% |
| 10 or more Apartments | 0 | 0.0% |
| Mobile Home / Other | 9 | 15.5% |
| Total | 58 | 100.0% |
Housing Structures by Occupancy in Hallsboro
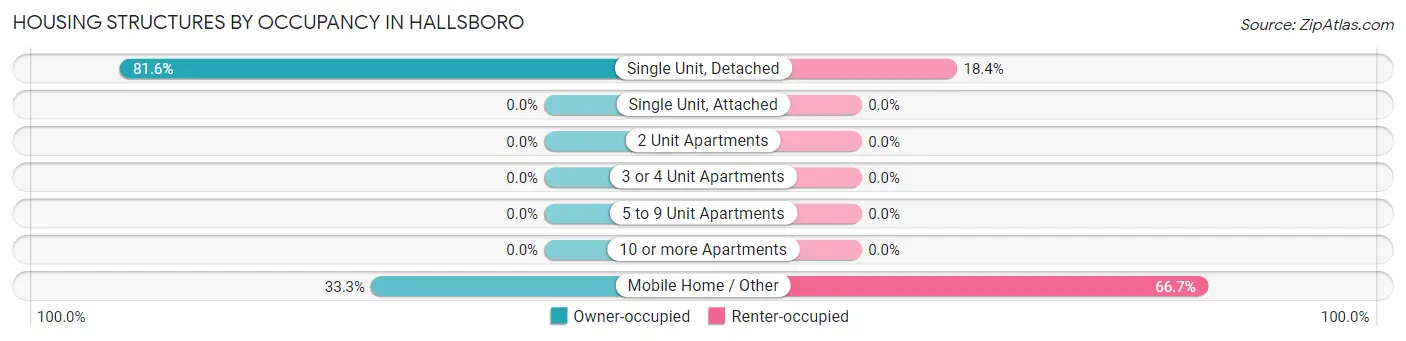
| Structure Type | Owner-occupied | Renter-occupied |
| Single Unit, Detached | 40 (81.6%) | 9 (18.4%) |
| Single Unit, Attached | 0 (0.0%) | 0 (0.0%) |
| 2 Unit Apartments | 0 (0.0%) | 0 (0.0%) |
| 3 or 4 Unit Apartments | 0 (0.0%) | 0 (0.0%) |
| 5 to 9 Unit Apartments | 0 (0.0%) | 0 (0.0%) |
| 10 or more Apartments | 0 (0.0%) | 0 (0.0%) |
| Mobile Home / Other | 3 (33.3%) | 6 (66.7%) |
| Total | 43 (74.1%) | 15 (25.9%) |
Housing Structures by Number of Rooms in Hallsboro
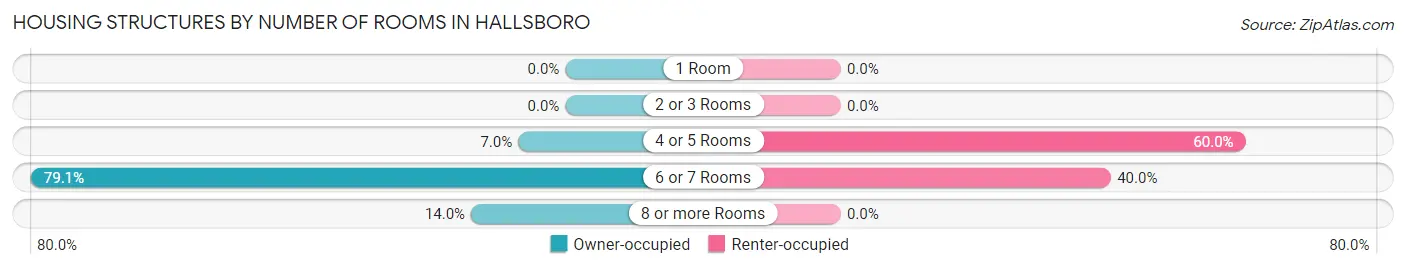
| Number of Rooms | Owner-occupied | Renter-occupied |
| 1 Room | 0 (0.0%) | 0 (0.0%) |
| 2 or 3 Rooms | 0 (0.0%) | 0 (0.0%) |
| 4 or 5 Rooms | 3 (7.0%) | 9 (60.0%) |
| 6 or 7 Rooms | 34 (79.1%) | 6 (40.0%) |
| 8 or more Rooms | 6 (14.0%) | 0 (0.0%) |
| Total | 43 (100.0%) | 15 (100.0%) |
Housing Structure by Heating Type in Hallsboro
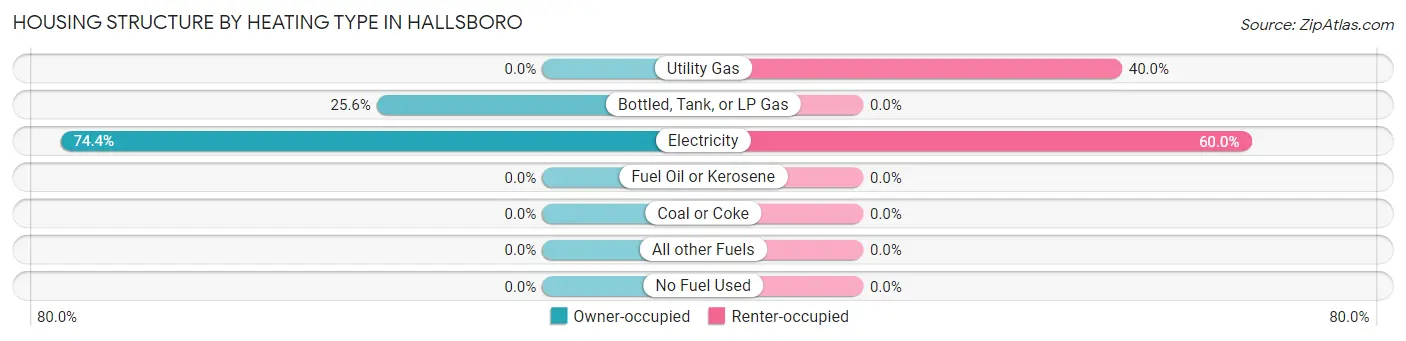
| Heating Type | Owner-occupied | Renter-occupied |
| Utility Gas | 0 (0.0%) | 6 (40.0%) |
| Bottled, Tank, or LP Gas | 11 (25.6%) | 0 (0.0%) |
| Electricity | 32 (74.4%) | 9 (60.0%) |
| Fuel Oil or Kerosene | 0 (0.0%) | 0 (0.0%) |
| Coal or Coke | 0 (0.0%) | 0 (0.0%) |
| All other Fuels | 0 (0.0%) | 0 (0.0%) |
| No Fuel Used | 0 (0.0%) | 0 (0.0%) |
| Total | 43 (100.0%) | 15 (100.0%) |
Household Vehicle Usage in Hallsboro
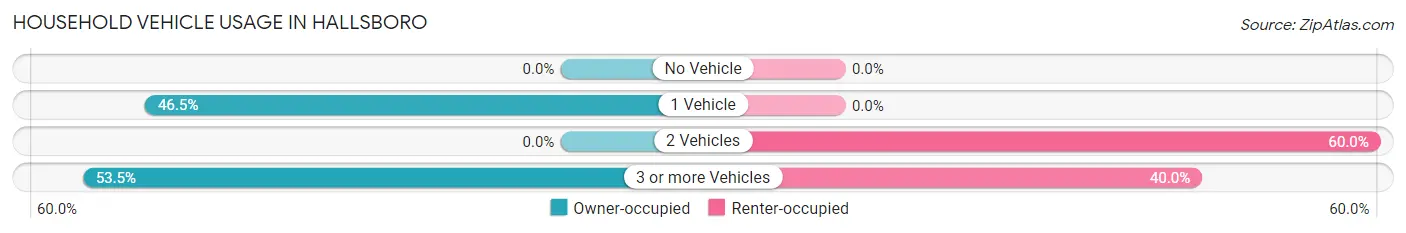
| Vehicles per Household | Owner-occupied | Renter-occupied |
| No Vehicle | 0 (0.0%) | 0 (0.0%) |
| 1 Vehicle | 20 (46.5%) | 0 (0.0%) |
| 2 Vehicles | 0 (0.0%) | 9 (60.0%) |
| 3 or more Vehicles | 23 (53.5%) | 6 (40.0%) |
| Total | 43 (100.0%) | 15 (100.0%) |
Real Estate & Mortgages in Hallsboro
Real Estate and Mortgage Overview in Hallsboro
| Characteristic | Without Mortgage | With Mortgage |
| Housing Units | 26 | 17 |
| Median Property Value | - | - |
| Median Household Income | - | - |
| Monthly Housing Costs | - | - |
| Real Estate Taxes | - | - |
Property Value by Mortgage Status in Hallsboro
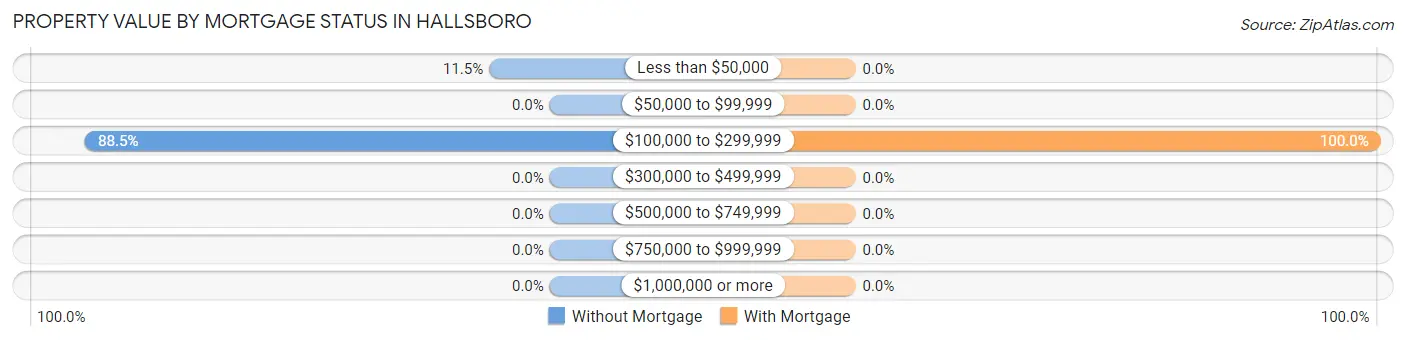
| Property Value | Without Mortgage | With Mortgage |
| Less than $50,000 | 3 (11.5%) | 0 (0.0%) |
| $50,000 to $99,999 | 0 (0.0%) | 0 (0.0%) |
| $100,000 to $299,999 | 23 (88.5%) | 17 (100.0%) |
| $300,000 to $499,999 | 0 (0.0%) | 0 (0.0%) |
| $500,000 to $749,999 | 0 (0.0%) | 0 (0.0%) |
| $750,000 to $999,999 | 0 (0.0%) | 0 (0.0%) |
| $1,000,000 or more | 0 (0.0%) | 0 (0.0%) |
| Total | 26 (100.0%) | 17 (100.0%) |
Household Income by Mortgage Status in Hallsboro
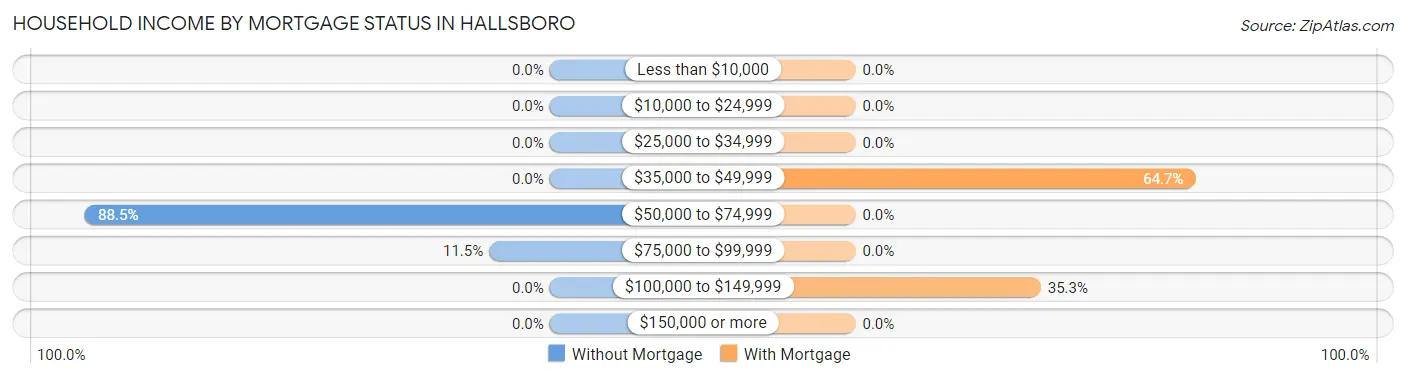
| Household Income | Without Mortgage | With Mortgage |
| Less than $10,000 | 0 (0.0%) | 0 (0.0%) |
| $10,000 to $24,999 | 0 (0.0%) | 0 (0.0%) |
| $25,000 to $34,999 | 0 (0.0%) | 0 (0.0%) |
| $35,000 to $49,999 | 0 (0.0%) | 11 (64.7%) |
| $50,000 to $74,999 | 23 (88.5%) | 0 (0.0%) |
| $75,000 to $99,999 | 3 (11.5%) | 0 (0.0%) |
| $100,000 to $149,999 | 0 (0.0%) | 6 (35.3%) |
| $150,000 or more | 0 (0.0%) | 0 (0.0%) |
| Total | 26 (100.0%) | 17 (100.0%) |
Property Value to Household Income Ratio in Hallsboro
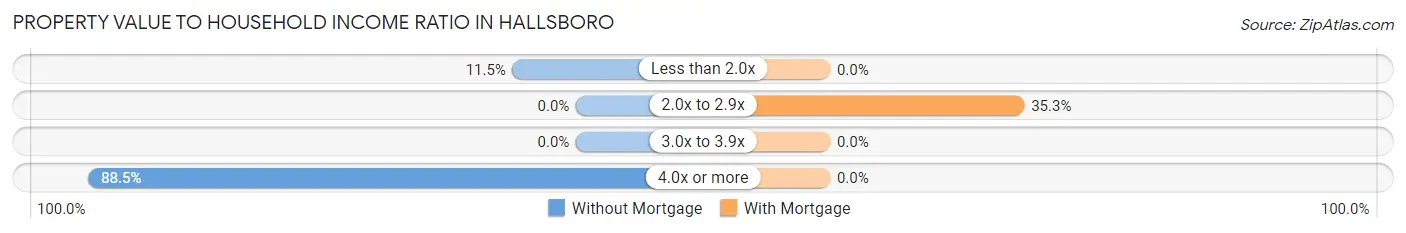
| Value-to-Income Ratio | Without Mortgage | With Mortgage |
| Less than 2.0x | 3 (11.5%) | 0 (0.0%) |
| 2.0x to 2.9x | 0 (0.0%) | 6 (35.3%) |
| 3.0x to 3.9x | 0 (0.0%) | 0 (0.0%) |
| 4.0x or more | 23 (88.5%) | 0 (0.0%) |
| Total | 26 (100.0%) | 17 (100.0%) |
Real Estate Taxes by Mortgage Status in Hallsboro
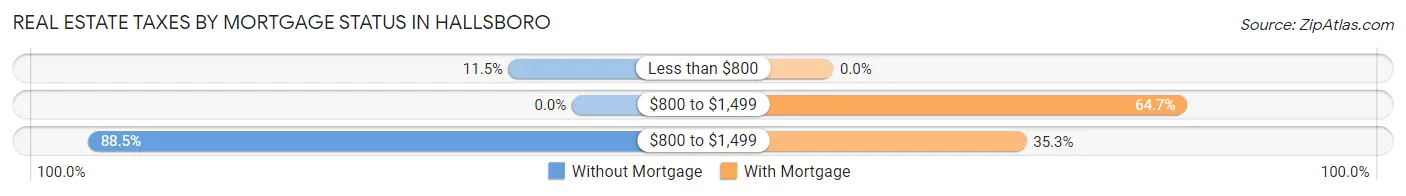
| Property Taxes | Without Mortgage | With Mortgage |
| Less than $800 | 3 (11.5%) | 0 (0.0%) |
| $800 to $1,499 | 0 (0.0%) | 11 (64.7%) |
| $800 to $1,499 | 23 (88.5%) | 6 (35.3%) |
| Total | 26 (100.0%) | 17 (100.0%) |
Health & Disability in Hallsboro
Health Insurance Coverage by Age in Hallsboro
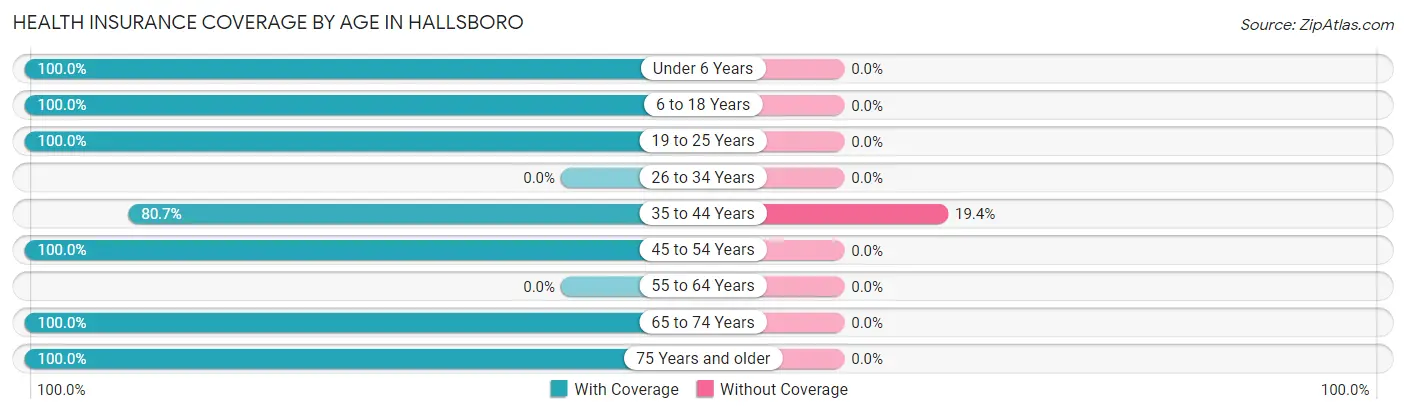
| Age Bracket | With Coverage | Without Coverage |
| Under 6 Years | 22 (100.0%) | 0 (0.0%) |
| 6 to 18 Years | 17 (100.0%) | 0 (0.0%) |
| 19 to 25 Years | 17 (100.0%) | 0 (0.0%) |
| 26 to 34 Years | 0 (0.0%) | 0 (0.0%) |
| 35 to 44 Years | 25 (80.6%) | 6 (19.4%) |
| 45 to 54 Years | 13 (100.0%) | 0 (0.0%) |
| 55 to 64 Years | 0 (0.0%) | 0 (0.0%) |
| 65 to 74 Years | 6 (100.0%) | 0 (0.0%) |
| 75 Years and older | 66 (100.0%) | 0 (0.0%) |
| Total | 166 (96.5%) | 6 (3.5%) |
Health Insurance Coverage by Citizenship Status in Hallsboro
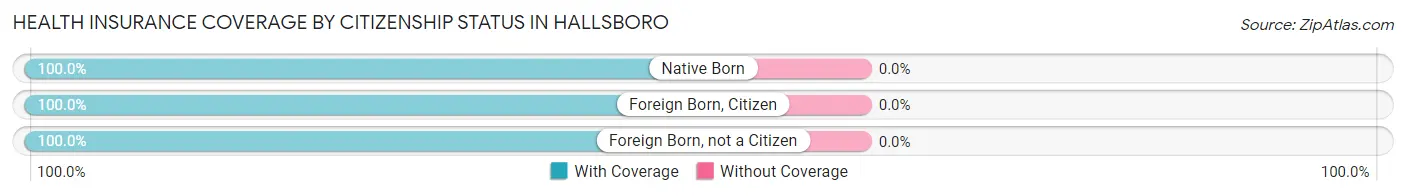
| Citizenship Status | With Coverage | Without Coverage |
| Native Born | 22 (100.0%) | 0 (0.0%) |
| Foreign Born, Citizen | 17 (100.0%) | 0 (0.0%) |
| Foreign Born, not a Citizen | 17 (100.0%) | 0 (0.0%) |
Health Insurance Coverage by Household Income in Hallsboro
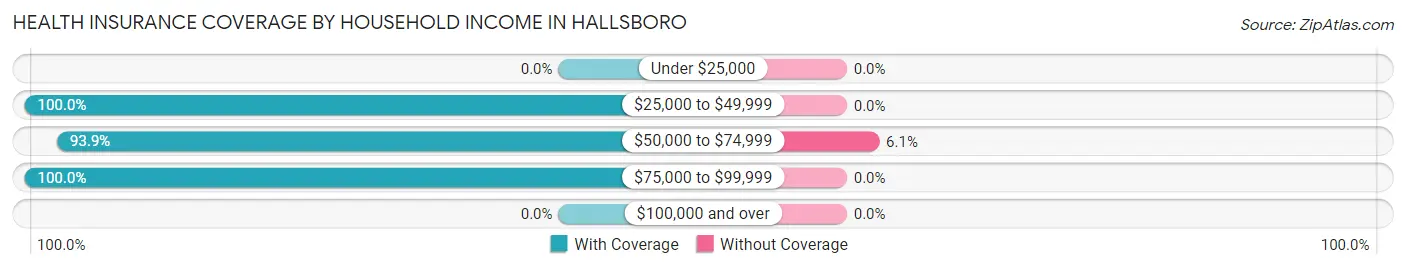
| Household Income | With Coverage | Without Coverage |
| Under $25,000 | 0 (0.0%) | 0 (0.0%) |
| $25,000 to $49,999 | 30 (100.0%) | 0 (0.0%) |
| $50,000 to $74,999 | 93 (93.9%) | 6 (6.1%) |
| $75,000 to $99,999 | 30 (100.0%) | 0 (0.0%) |
| $100,000 and over | 0 (0.0%) | 0 (0.0%) |
Public vs Private Health Insurance Coverage by Age in Hallsboro
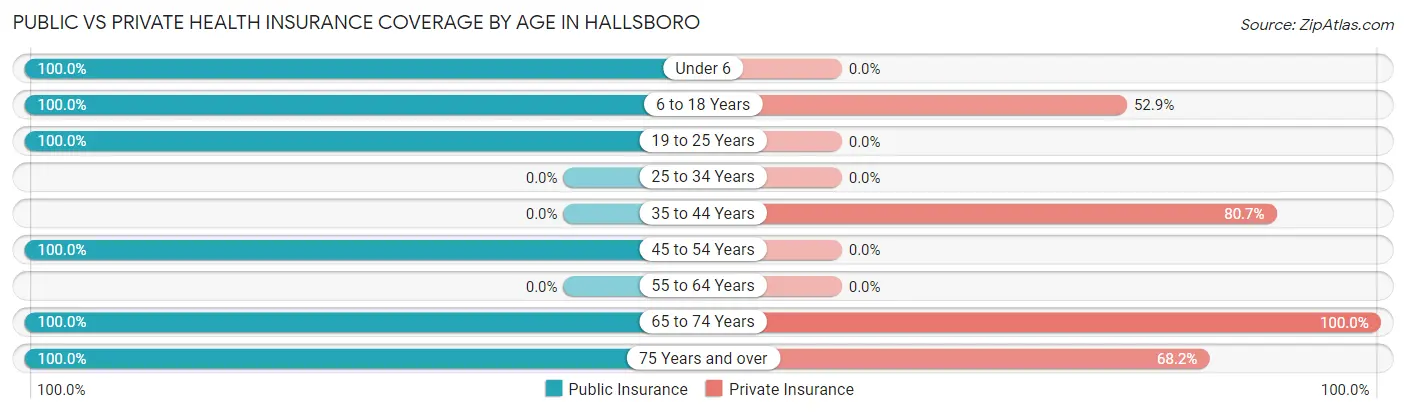
| Age Bracket | Public Insurance | Private Insurance |
| Under 6 | 22 (100.0%) | 0 (0.0%) |
| 6 to 18 Years | 17 (100.0%) | 9 (52.9%) |
| 19 to 25 Years | 17 (100.0%) | 0 (0.0%) |
| 25 to 34 Years | 0 (0.0%) | 0 (0.0%) |
| 35 to 44 Years | 0 (0.0%) | 25 (80.6%) |
| 45 to 54 Years | 13 (100.0%) | 0 (0.0%) |
| 55 to 64 Years | 0 (0.0%) | 0 (0.0%) |
| 65 to 74 Years | 6 (100.0%) | 6 (100.0%) |
| 75 Years and over | 66 (100.0%) | 45 (68.2%) |
| Total | 141 (82.0%) | 85 (49.4%) |
Disability Status by Sex by Age in Hallsboro
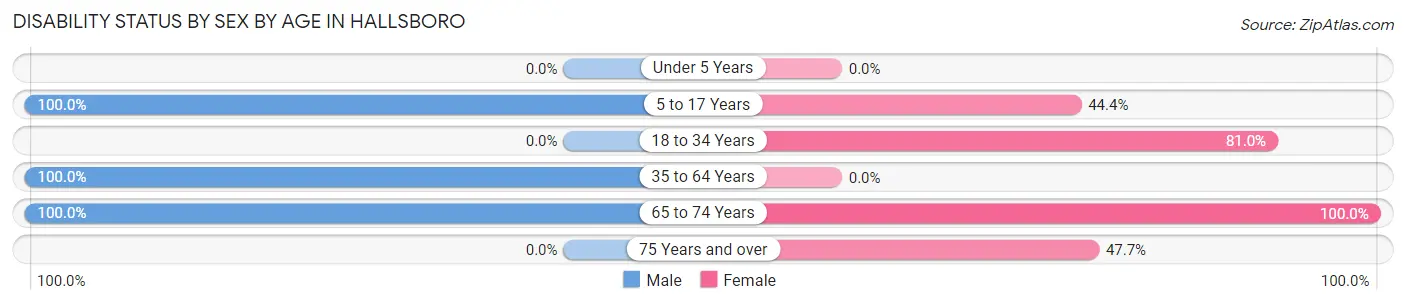
| Age Bracket | Male | Female |
| Under 5 Years | 0 (0.0%) | 0 (0.0%) |
| 5 to 17 Years | 4 (100.0%) | 4 (44.4%) |
| 18 to 34 Years | 0 (0.0%) | 17 (80.9%) |
| 35 to 64 Years | 23 (100.0%) | 0 (0.0%) |
| 65 to 74 Years | 3 (100.0%) | 3 (100.0%) |
| 75 Years and over | 0 (0.0%) | 21 (47.7%) |
Disability Class by Sex by Age in Hallsboro
Disability Class: Hearing Difficulty
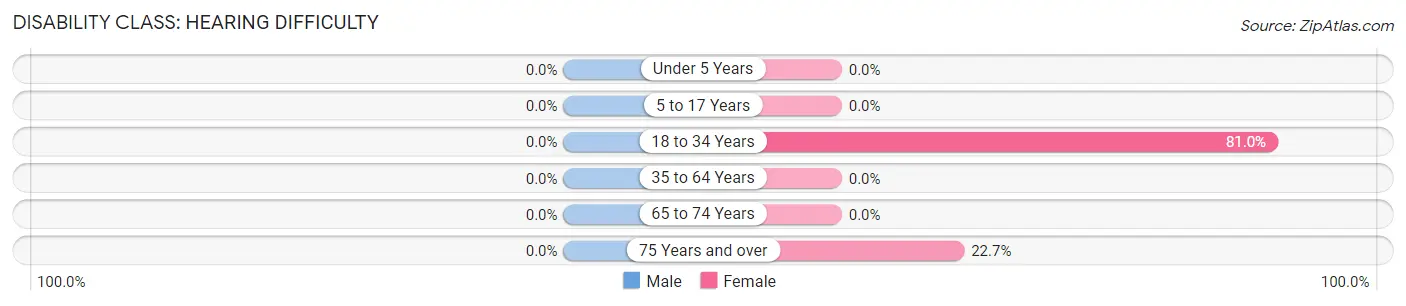
| Age Bracket | Male | Female |
| Under 5 Years | 0 (0.0%) | 0 (0.0%) |
| 5 to 17 Years | 0 (0.0%) | 0 (0.0%) |
| 18 to 34 Years | 0 (0.0%) | 17 (80.9%) |
| 35 to 64 Years | 0 (0.0%) | 0 (0.0%) |
| 65 to 74 Years | 0 (0.0%) | 0 (0.0%) |
| 75 Years and over | 0 (0.0%) | 10 (22.7%) |
Disability Class: Vision Difficulty
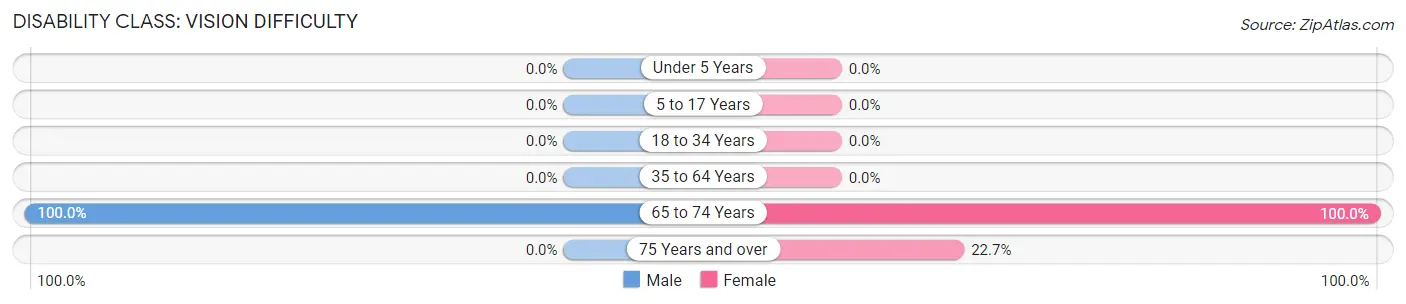
| Age Bracket | Male | Female |
| Under 5 Years | 0 (0.0%) | 0 (0.0%) |
| 5 to 17 Years | 0 (0.0%) | 0 (0.0%) |
| 18 to 34 Years | 0 (0.0%) | 0 (0.0%) |
| 35 to 64 Years | 0 (0.0%) | 0 (0.0%) |
| 65 to 74 Years | 3 (100.0%) | 3 (100.0%) |
| 75 Years and over | 0 (0.0%) | 10 (22.7%) |
Disability Class: Cognitive Difficulty
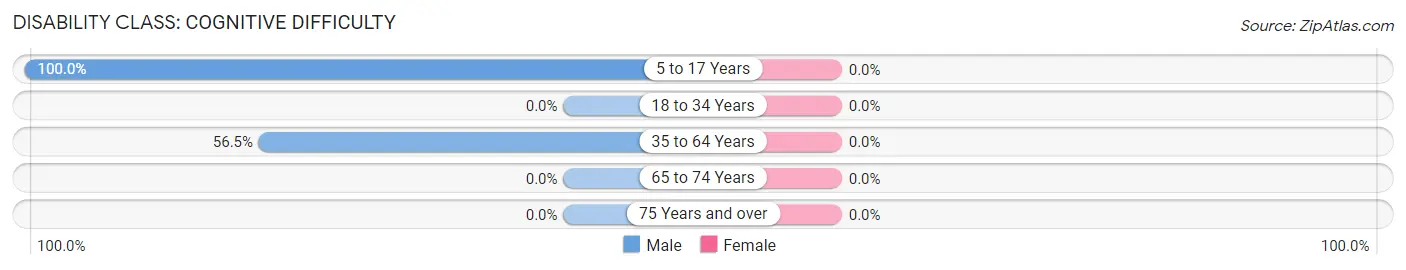
| Age Bracket | Male | Female |
| 5 to 17 Years | 4 (100.0%) | 0 (0.0%) |
| 18 to 34 Years | 0 (0.0%) | 0 (0.0%) |
| 35 to 64 Years | 13 (56.5%) | 0 (0.0%) |
| 65 to 74 Years | 0 (0.0%) | 0 (0.0%) |
| 75 Years and over | 0 (0.0%) | 0 (0.0%) |
Disability Class: Ambulatory Difficulty
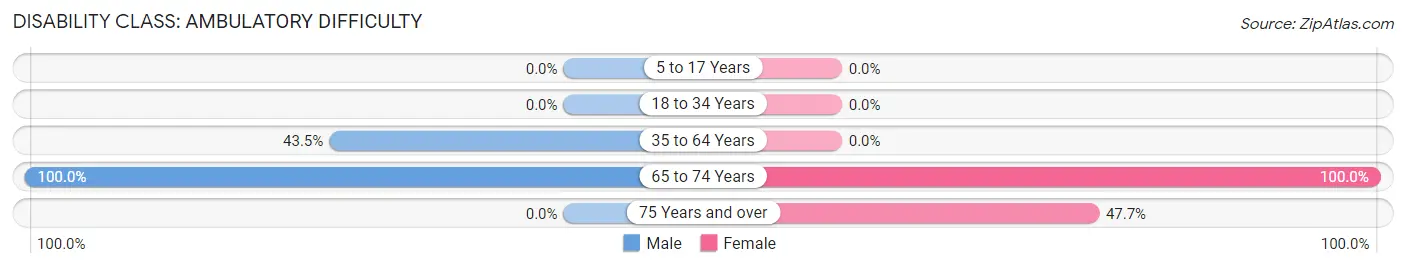
| Age Bracket | Male | Female |
| 5 to 17 Years | 0 (0.0%) | 0 (0.0%) |
| 18 to 34 Years | 0 (0.0%) | 0 (0.0%) |
| 35 to 64 Years | 10 (43.5%) | 0 (0.0%) |
| 65 to 74 Years | 3 (100.0%) | 3 (100.0%) |
| 75 Years and over | 0 (0.0%) | 21 (47.7%) |
Disability Class: Self-Care Difficulty
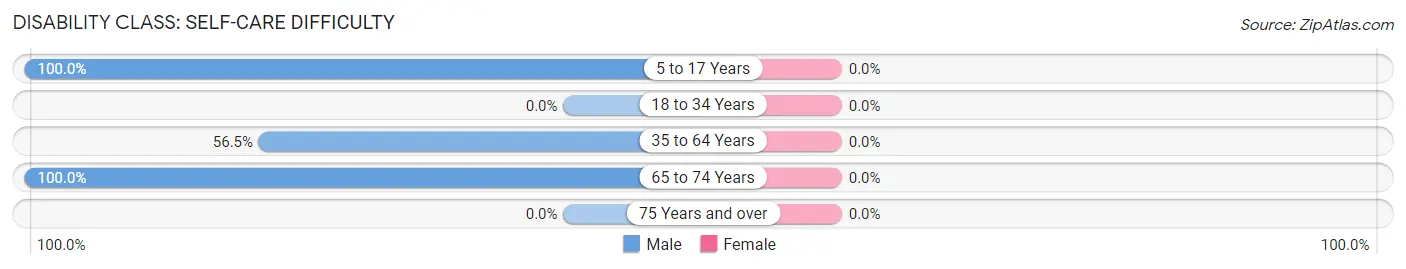
| Age Bracket | Male | Female |
| 5 to 17 Years | 4 (100.0%) | 0 (0.0%) |
| 18 to 34 Years | 0 (0.0%) | 0 (0.0%) |
| 35 to 64 Years | 13 (56.5%) | 0 (0.0%) |
| 65 to 74 Years | 3 (100.0%) | 0 (0.0%) |
| 75 Years and over | 0 (0.0%) | 0 (0.0%) |
Technology Access in Hallsboro
Computing Device Access in Hallsboro
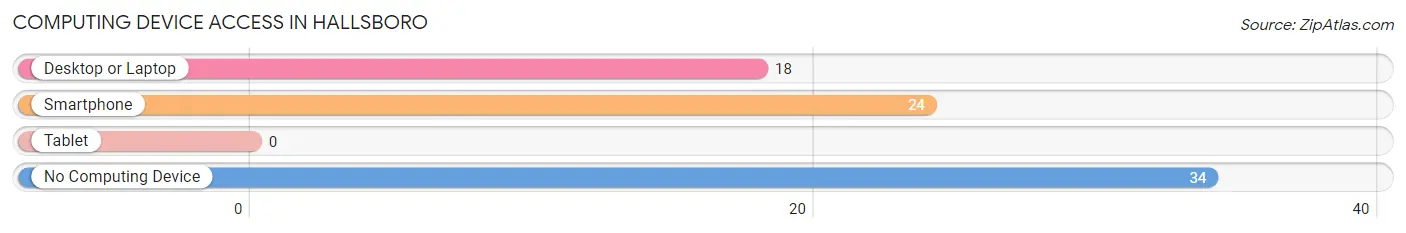
| Device Type | # Households | % Households |
| Desktop or Laptop | 18 | 31.0% |
| Smartphone | 24 | 41.4% |
| Tablet | 0 | 0.0% |
| No Computing Device | 34 | 58.6% |
| Total | 58 | 100.0% |
Internet Access in Hallsboro
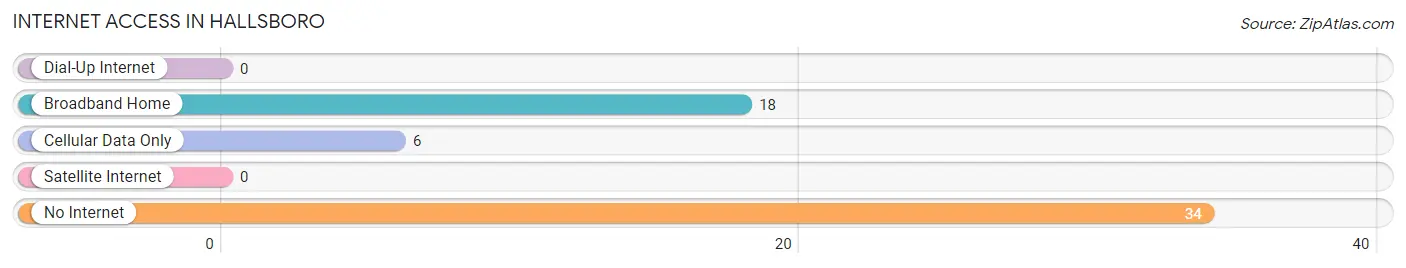
| Internet Type | # Households | % Households |
| Dial-Up Internet | 0 | 0.0% |
| Broadband Home | 18 | 31.0% |
| Cellular Data Only | 6 | 10.3% |
| Satellite Internet | 0 | 0.0% |
| No Internet | 34 | 58.6% |
| Total | 58 | 100.0% |
Hallsboro Summary
Hallsboro is a small town located in Columbus County, North Carolina. It is situated on the banks of the Lumber River, about 20 miles south of Whiteville. The town was founded in 1887 and named after the Hall family, who were early settlers in the area. The population of Hallsboro was estimated to be 545 in 2020.
Geography
Hallsboro is located in the southeastern corner of Columbus County, North Carolina. It is situated on the banks of the Lumber River, about 20 miles south of Whiteville. The town is surrounded by a number of small towns and villages, including Evergreen, Bolton, and Chadbourn. The terrain around Hallsboro is mostly flat, with some rolling hills in the area. The climate is humid subtropical, with hot summers and mild winters.
Economy
Hallsboro’s economy is largely based on agriculture and forestry. The town is home to several farms, which produce a variety of crops, including corn, soybeans, cotton, and tobacco. The town also has a number of timber companies, which harvest and process timber for use in furniture and other products. In addition, Hallsboro is home to several small businesses, including restaurants, convenience stores, and auto repair shops.
Demographics
According to the 2010 census, the population of Hallsboro was 545. The racial makeup of the town was 79.2% White, 17.3% African American, 0.2% Native American, 0.4% Asian, and 2.9% from other races. The median household income was $30,938, and the median family income was $37,813. The per capita income was $14,945.
History
Hallsboro was founded in 1887 by the Hall family, who were early settlers in the area. The town was named after the family, and the first post office was established in 1891. The town grew slowly over the years, and by the early 20th century, it had become a thriving agricultural and timber center. In the 1950s, Hallsboro was home to several sawmills and other industries. In the late 20th century, the town began to decline as the timber industry declined and the population shifted to larger cities. Today, Hallsboro is a small, rural town with a population of just over 500.
Common Questions
What is Per Capita Income in Hallsboro?
Per Capita income in Hallsboro is $20,009.
What is the Median Family Income in Hallsboro?
Median Family Income in Hallsboro is $64,076.
What is the Median Household income in Hallsboro?
Median Household Income in Hallsboro is $63,478.
What is Inequality or Gini Index in Hallsboro?
Inequality or Gini Index in Hallsboro is 0.17.
What is the Total Population of Hallsboro?
Total Population of Hallsboro is 172.
What is the Total Male Population of Hallsboro?
Total Male Population of Hallsboro is 62.
What is the Total Female Population of Hallsboro?
Total Female Population of Hallsboro is 110.
What is the Ratio of Males per 100 Females in Hallsboro?
There are 56.36 Males per 100 Females in Hallsboro.
What is the Ratio of Females per 100 Males in Hallsboro?
There are 177.42 Females per 100 Males in Hallsboro.
What is the Median Population Age in Hallsboro?
Median Population Age in Hallsboro is 42.9 Years.
What is the Average Family Size in Hallsboro
Average Family Size in Hallsboro is 2.8 People.
What is the Average Household Size in Hallsboro
Average Household Size in Hallsboro is 2.7 People.
How Large is the Labor Force in Hallsboro?
There are 42 People in the Labor Forcein in Hallsboro.
What is the Percentage of People in the Labor Force in Hallsboro?
30.7% of People are in the Labor Force in Hallsboro.
What is the Unemployment Rate in Hallsboro?
Unemployment Rate in Hallsboro is 50.0%.