Conehatta, MS Map & Demographics
Conehatta Map
Conehatta Overview
$15,473
PER CAPITA INCOME
$44,509
AVG FAMILY INCOME
$43,728
AVG HOUSEHOLD INCOME
33.8%
WAGE / INCOME GAP [ % ]
66.2¢/ $1
WAGE / INCOME GAP [ $ ]
0.44
INEQUALITY / GINI INDEX
1,240
TOTAL POPULATION
733
MALE POPULATION
507
FEMALE POPULATION
144.58
MALES / 100 FEMALES
69.17
FEMALES / 100 MALES
29.4
MEDIAN AGE
3.2
AVG FAMILY SIZE
3.0
AVG HOUSEHOLD SIZE
358
LABOR FORCE [ PEOPLE ]
40.4%
PERCENT IN LABOR FORCE
Conehatta Zip Codes
Income in Conehatta
Income Overview in Conehatta
Per Capita Income in Conehatta is $15,473, while median incomes of families and households are $44,509 and $43,728 respectively.
| Characteristic | Number | Measure |
| Per Capita Income | 1,240 | $15,473 |
| Median Family Income | 372 | $44,509 |
| Mean Family Income | 372 | $53,381 |
| Median Household Income | 407 | $43,728 |
| Mean Household Income | 407 | $49,729 |
| Income Deficit | 372 | $0 |
| Wage / Income Gap (%) | 1,240 | 33.82% |
| Wage / Income Gap ($) | 1,240 | 66.18¢ per $1 |
| Gini / Inequality Index | 1,240 | 0.44 |
Earnings by Sex in Conehatta
Average Earnings in Conehatta are $32,745, $43,007 for men and $28,463 for women, a difference of 33.8%.
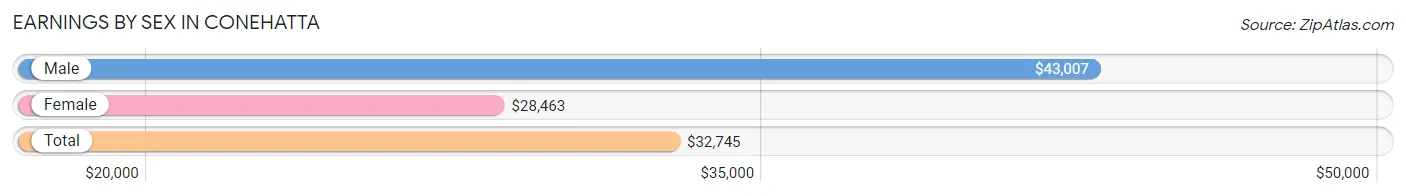
| Sex | Number | Average Earnings |
| Male | 167 (45.6%) | $43,007 |
| Female | 199 (54.4%) | $28,463 |
| Total | 366 (100.0%) | $32,745 |
Earnings by Sex by Income Bracket in Conehatta
The most common earnings brackets in Conehatta are $30,000 to $34,999 for men (51 | 30.5%) and $25,000 to $29,999 for women (87 | 43.7%).
| Income | Male | Female |
| $2,499 or less | 17 (10.2%) | 0 (0.0%) |
| $2,500 to $4,999 | 0 (0.0%) | 0 (0.0%) |
| $5,000 to $7,499 | 0 (0.0%) | 0 (0.0%) |
| $7,500 to $9,999 | 0 (0.0%) | 0 (0.0%) |
| $10,000 to $12,499 | 0 (0.0%) | 0 (0.0%) |
| $12,500 to $14,999 | 0 (0.0%) | 0 (0.0%) |
| $15,000 to $17,499 | 0 (0.0%) | 0 (0.0%) |
| $17,500 to $19,999 | 0 (0.0%) | 0 (0.0%) |
| $20,000 to $22,499 | 0 (0.0%) | 66 (33.2%) |
| $22,500 to $24,999 | 0 (0.0%) | 0 (0.0%) |
| $25,000 to $29,999 | 8 (4.8%) | 87 (43.7%) |
| $30,000 to $34,999 | 51 (30.5%) | 0 (0.0%) |
| $35,000 to $39,999 | 0 (0.0%) | 25 (12.6%) |
| $40,000 to $44,999 | 37 (22.2%) | 21 (10.5%) |
| $45,000 to $49,999 | 0 (0.0%) | 0 (0.0%) |
| $50,000 to $54,999 | 7 (4.2%) | 0 (0.0%) |
| $55,000 to $64,999 | 23 (13.8%) | 0 (0.0%) |
| $65,000 to $74,999 | 0 (0.0%) | 0 (0.0%) |
| $75,000 to $99,999 | 0 (0.0%) | 0 (0.0%) |
| $100,000+ | 24 (14.4%) | 0 (0.0%) |
| Total | 167 (100.0%) | 199 (100.0%) |
Earnings by Sex by Educational Attainment in Conehatta
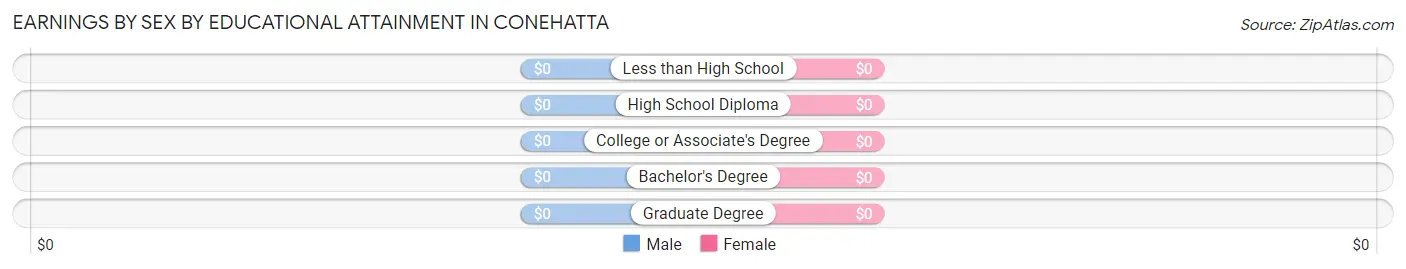
| Educational Attainment | Male Income | Female Income |
| Less than High School | - | - |
| High School Diploma | - | - |
| College or Associate's Degree | - | - |
| Bachelor's Degree | - | - |
| Graduate Degree | - | - |
| Total | $43,581 | $28,463 |
Family Income in Conehatta
Family Income Brackets in Conehatta
According to the Conehatta family income data, there are 128 families falling into the $50,000 to $74,999 income range, which is the most common income bracket and makes up 34.4% of all families.
| Income Bracket | # Families | % Families |
| Less than $10,000 | 59 | 15.9% |
| $10,000 to $14,999 | 0 | 0.0% |
| $15,000 to $24,999 | 7 | 1.9% |
| $25,000 to $34,999 | 75 | 20.2% |
| $35,000 to $49,999 | 56 | 15.1% |
| $50,000 to $74,999 | 128 | 34.4% |
| $75,000 to $99,999 | 23 | 6.2% |
| $100,000 to $149,999 | 0 | 0.0% |
| $150,000 to $199,999 | 24 | 6.5% |
| $200,000+ | 0 | 0.0% |
Family Income by Famaliy Size in Conehatta
2-person families (88 | 23.7%) account for the highest median family income in Conehatta with $65,833 per family, while 2-person families (88 | 23.7%) have the highest median income of $32,916 per family member.
| Income Bracket | # Families | Median Income |
| 2-Person Families | 88 (23.7%) | $65,833 |
| 3-Person Families | 69 (18.5%) | $0 |
| 4-Person Families | 117 (31.5%) | $0 |
| 5-Person Families | 23 (6.2%) | $0 |
| 6-Person Families | 0 (0.0%) | $0 |
| 7+ Person Families | 75 (20.2%) | $0 |
| Total | 372 (100.0%) | $44,509 |
Family Income by Number of Earners in Conehatta
| Number of Earners | # Families | Median Income |
| No Earners | 122 (32.8%) | $0 |
| 1 Earner | 125 (33.6%) | $0 |
| 2 Earners | 101 (27.2%) | $66,458 |
| 3+ Earners | 24 (6.5%) | $0 |
| Total | 372 (100.0%) | $44,509 |
Household Income in Conehatta
Household Income Brackets in Conehatta
With 128 households falling in the category, the $50,000 to $74,999 income range is the most frequent in Conehatta, accounting for 31.5% of all households.
| Income Bracket | # Households | % Households |
| Less than $10,000 | 59 | 14.5% |
| $10,000 to $14,999 | 35 | 8.6% |
| $15,000 to $24,999 | 7 | 1.7% |
| $25,000 to $34,999 | 75 | 18.4% |
| $35,000 to $49,999 | 56 | 13.8% |
| $50,000 to $74,999 | 128 | 31.4% |
| $75,000 to $99,999 | 23 | 5.7% |
| $100,000 to $149,999 | 0 | 0.0% |
| $150,000 to $199,999 | 24 | 5.9% |
| $200,000+ | 0 | 0.0% |
Household Income by Householder Age in Conehatta
The median household income in Conehatta is $43,728, with the highest median household income of $65,492 found in the 45 to 64 years age bracket for the primary householder. A total of 106 households (26.0%) fall into this category.
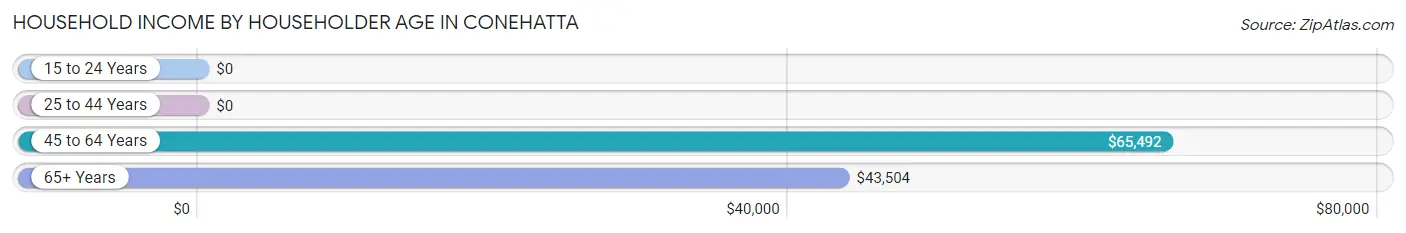
| Income Bracket | # Households | Median Income |
| 15 to 24 Years | 0 (0.0%) | $0 |
| 25 to 44 Years | 228 (56.0%) | $0 |
| 45 to 64 Years | 106 (26.0%) | $65,492 |
| 65+ Years | 73 (17.9%) | $43,504 |
| Total | 407 (100.0%) | $43,728 |
Poverty in Conehatta
Income Below Poverty by Sex and Age in Conehatta
With 55.7% poverty level for males and 48.9% for females among the residents of Conehatta, 5 year old males and 6 to 11 year old females are the most vulnerable to poverty, with 23 males (100.0%) and 37 females (100.0%) in their respective age groups living below the poverty level.
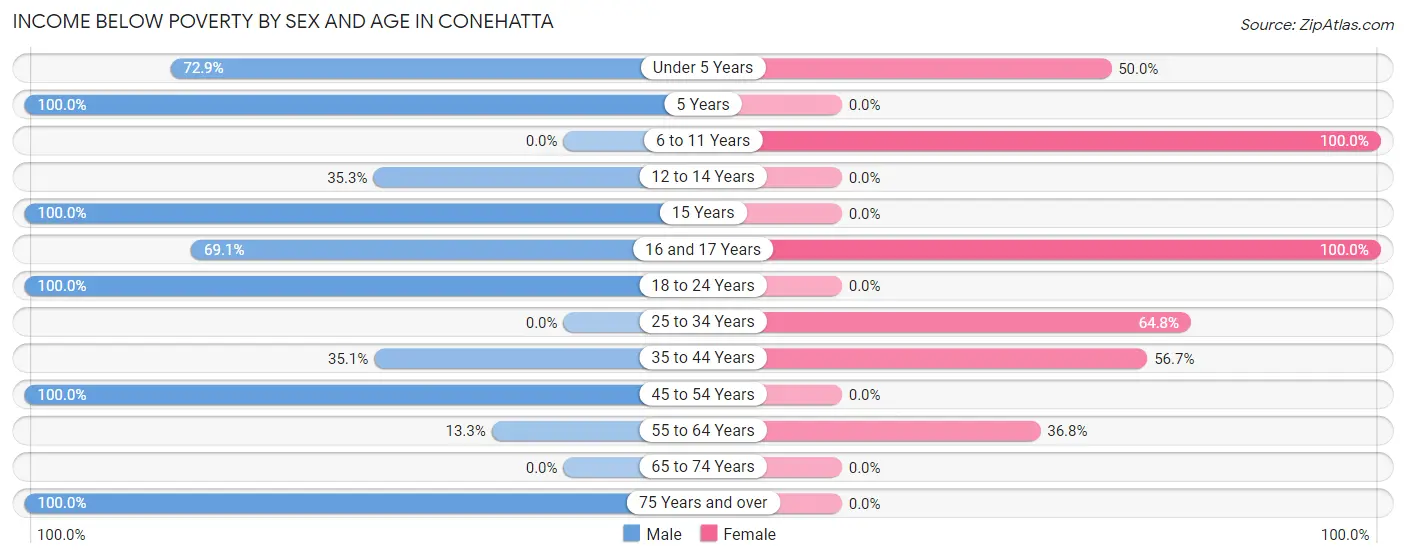
| Age Bracket | Male | Female |
| Under 5 Years | 62 (72.9%) | 24 (50.0%) |
| 5 Years | 23 (100.0%) | 0 (0.0%) |
| 6 to 11 Years | 0 (0.0%) | 37 (100.0%) |
| 12 to 14 Years | 6 (35.3%) | 0 (0.0%) |
| 15 Years | 76 (100.0%) | 0 (0.0%) |
| 16 and 17 Years | 38 (69.1%) | 45 (100.0%) |
| 18 to 24 Years | 147 (100.0%) | 0 (0.0%) |
| 25 to 34 Years | 0 (0.0%) | 46 (64.8%) |
| 35 to 44 Years | 13 (35.1%) | 89 (56.7%) |
| 45 to 54 Years | 21 (100.0%) | 0 (0.0%) |
| 55 to 64 Years | 8 (13.3%) | 7 (36.8%) |
| 65 to 74 Years | 0 (0.0%) | 0 (0.0%) |
| 75 Years and over | 14 (100.0%) | 0 (0.0%) |
| Total | 408 (55.7%) | 248 (48.9%) |
Income Above Poverty by Sex and Age in Conehatta
According to the poverty statistics in Conehatta, males aged 6 to 11 years and females aged 45 to 54 years are the age groups that are most secure financially, with 100.0% of males and 100.0% of females in these age groups living above the poverty line.
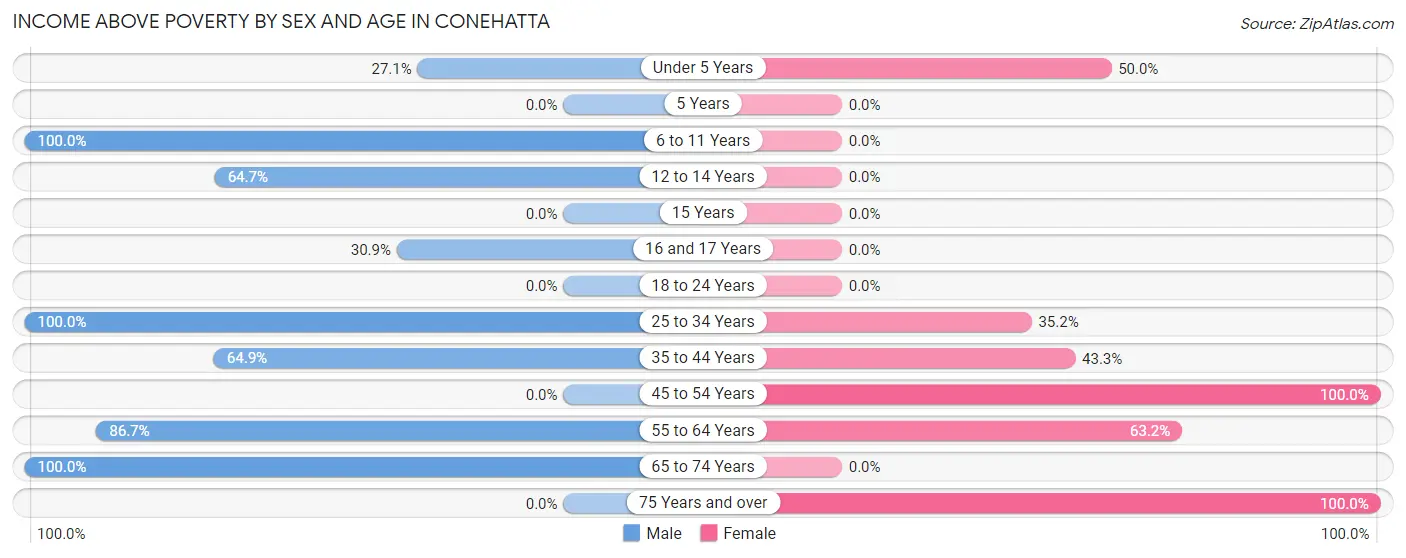
| Age Bracket | Male | Female |
| Under 5 Years | 23 (27.1%) | 24 (50.0%) |
| 5 Years | 0 (0.0%) | 0 (0.0%) |
| 6 to 11 Years | 68 (100.0%) | 0 (0.0%) |
| 12 to 14 Years | 11 (64.7%) | 0 (0.0%) |
| 15 Years | 0 (0.0%) | 0 (0.0%) |
| 16 and 17 Years | 17 (30.9%) | 0 (0.0%) |
| 18 to 24 Years | 0 (0.0%) | 0 (0.0%) |
| 25 to 34 Years | 74 (100.0%) | 25 (35.2%) |
| 35 to 44 Years | 24 (64.9%) | 68 (43.3%) |
| 45 to 54 Years | 0 (0.0%) | 66 (100.0%) |
| 55 to 64 Years | 52 (86.7%) | 12 (63.2%) |
| 65 to 74 Years | 56 (100.0%) | 0 (0.0%) |
| 75 Years and over | 0 (0.0%) | 64 (100.0%) |
| Total | 325 (44.3%) | 259 (51.1%) |
Income Below Poverty Among Married-Couple Families in Conehatta
The poverty statistics for married-couple families in Conehatta show that 3.0% or 7 of the total 235 families live below the poverty line. Families with no children have the highest poverty rate of 8.2%, comprising of 7 families. On the other hand, families with 1 or 2 children have the lowest poverty rate of 0.0%, which includes 0 families.
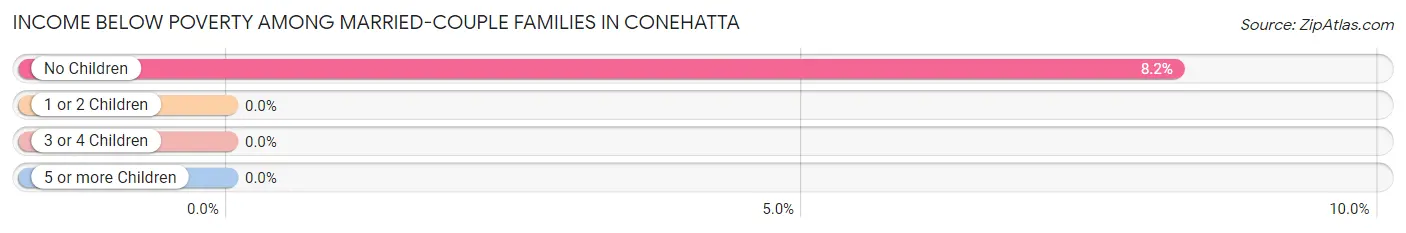
| Children | Above Poverty | Below Poverty |
| No Children | 78 (91.8%) | 7 (8.2%) |
| 1 or 2 Children | 127 (100.0%) | 0 (0.0%) |
| 3 or 4 Children | 23 (100.0%) | 0 (0.0%) |
| 5 or more Children | 0 (0.0%) | 0 (0.0%) |
| Total | 228 (97.0%) | 7 (3.0%) |
Income Below Poverty Among Single-Parent Households in Conehatta
According to the poverty data in Conehatta, 100.0% or 13 single-father households and 97.6% or 121 single-mother households are living below the poverty line. Among single-father households, those with 1 or 2 children have the highest poverty rate, with 13 households (100.0%) experiencing poverty. Likewise, among single-mother households, those with 3 or 4 children have the highest poverty rate, with 46 households (100.0%) falling below the poverty line.
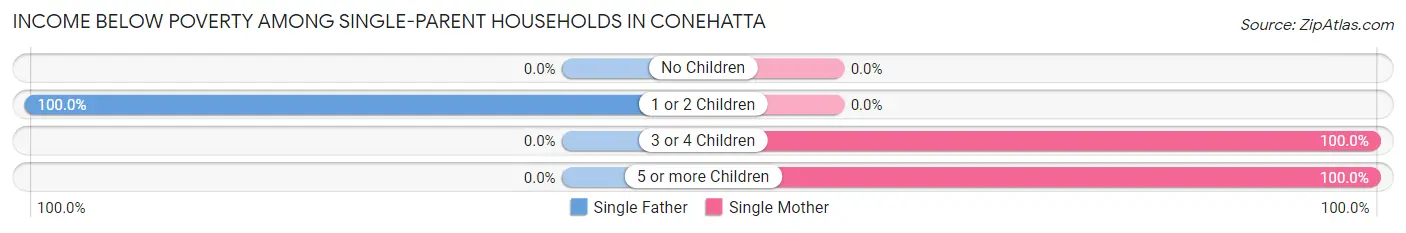
| Children | Single Father | Single Mother |
| No Children | 0 (0.0%) | 0 (0.0%) |
| 1 or 2 Children | 13 (100.0%) | 0 (0.0%) |
| 3 or 4 Children | 0 (0.0%) | 46 (100.0%) |
| 5 or more Children | 0 (0.0%) | 75 (100.0%) |
| Total | 13 (100.0%) | 121 (97.6%) |
Income Below Poverty Among Married-Couple vs Single-Parent Households in Conehatta
The poverty data for Conehatta shows that 7 of the married-couple family households (3.0%) and 134 of the single-parent households (97.8%) are living below the poverty level. Within the married-couple family households, those with no children have the highest poverty rate, with 7 households (8.2%) falling below the poverty line. Among the single-parent households, those with 1 or 2 children have the highest poverty rate, with 13 household (100.0%) living below poverty.
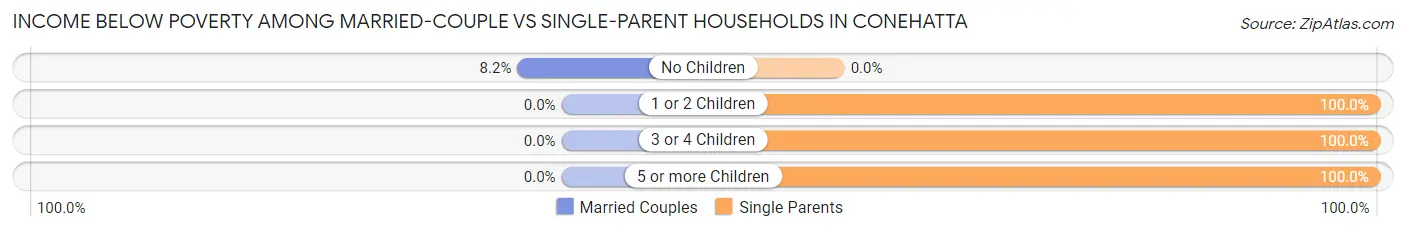
| Children | Married-Couple Families | Single-Parent Households |
| No Children | 7 (8.2%) | 0 (0.0%) |
| 1 or 2 Children | 0 (0.0%) | 13 (100.0%) |
| 3 or 4 Children | 0 (0.0%) | 46 (100.0%) |
| 5 or more Children | 0 (0.0%) | 75 (100.0%) |
| Total | 7 (3.0%) | 134 (97.8%) |
Race in Conehatta
The most populous races in Conehatta are Native / Alaskan (638 | 51.4%), Some other Race (374 | 30.2%), and White / Caucasian (218 | 17.6%).
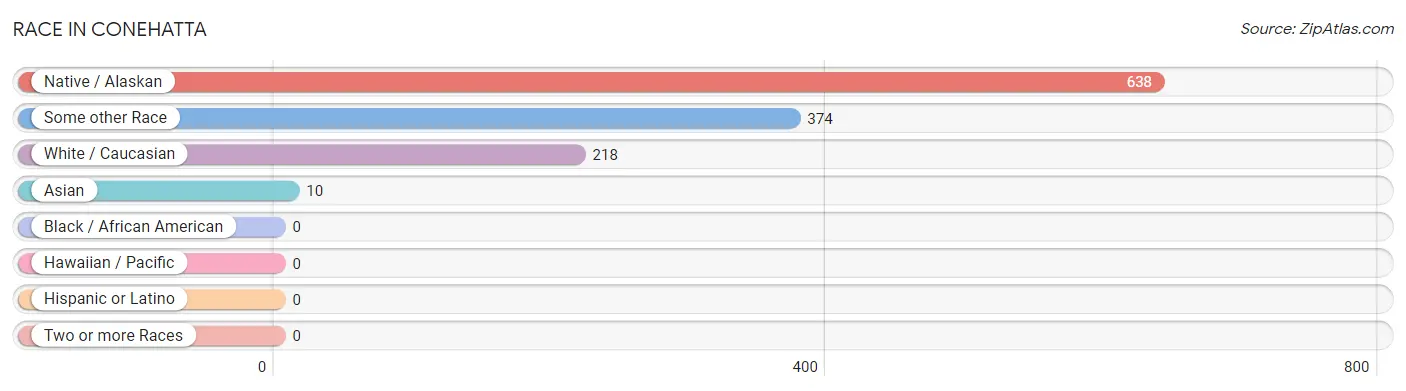
| Race | # Population | % Population |
| Asian | 10 | 0.8% |
| Black / African American | 0 | 0.0% |
| Hawaiian / Pacific | 0 | 0.0% |
| Hispanic or Latino | 0 | 0.0% |
| Native / Alaskan | 638 | 51.4% |
| White / Caucasian | 218 | 17.6% |
| Two or more Races | 0 | 0.0% |
| Some other Race | 374 | 30.2% |
| Total | 1,240 | 100.0% |
Ancestry in Conehatta
The most populous ancestries reported in Conehatta are Choctaw (563 | 45.4%), American (132 | 10.6%), Scottish (12 | 1.0%), Indian (Asian) (10 | 0.8%), and Irish (8 | 0.6%), together accounting for 58.5% of all Conehatta residents.
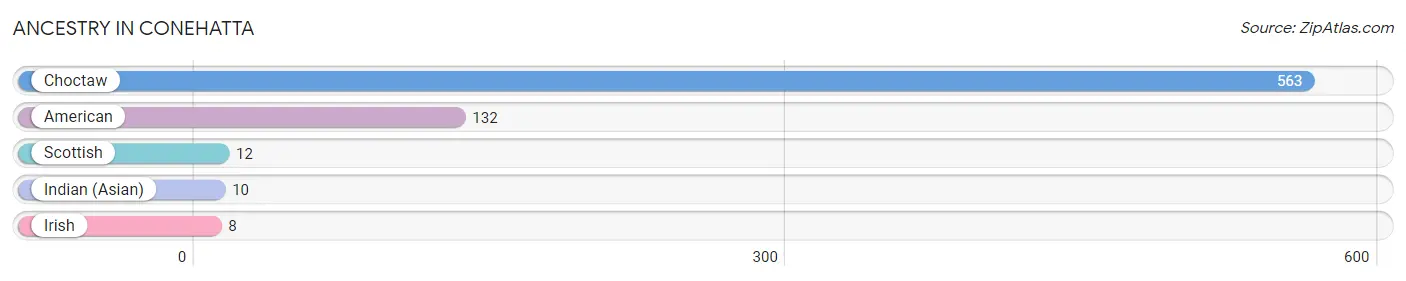
| Ancestry | # Population | % Population |
| American | 132 | 10.6% |
| Choctaw | 563 | 45.4% |
| Indian (Asian) | 10 | 0.8% |
| Irish | 8 | 0.6% |
| Scottish | 12 | 1.0% | View All 5 Rows |
Immigrants in Conehatta
The most numerous immigrant groups reported in Conehatta came from Asia (3 | 0.2%), China (3 | 0.2%), and Eastern Asia (3 | 0.2%), together accounting for 0.7% of all Conehatta residents.
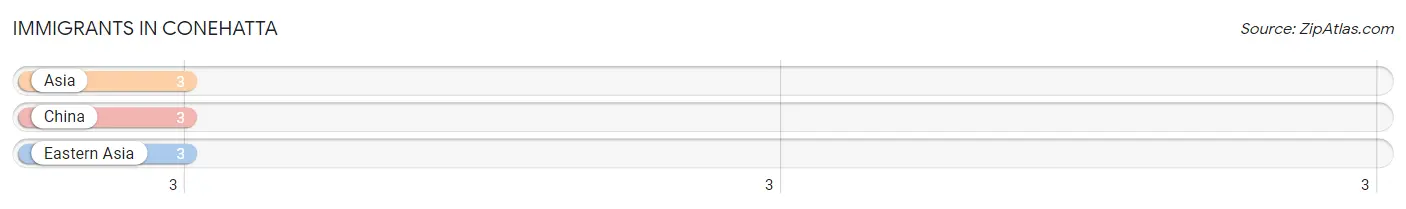
| Immigration Origin | # Population | % Population |
| Asia | 3 | 0.2% |
| China | 3 | 0.2% |
| Eastern Asia | 3 | 0.2% | View All 3 Rows |
Sex and Age in Conehatta
Sex and Age in Conehatta
The most populous age groups in Conehatta are 15 to 19 Years (278 | 37.9%) for men and 35 to 39 Years (122 | 24.1%) for women.
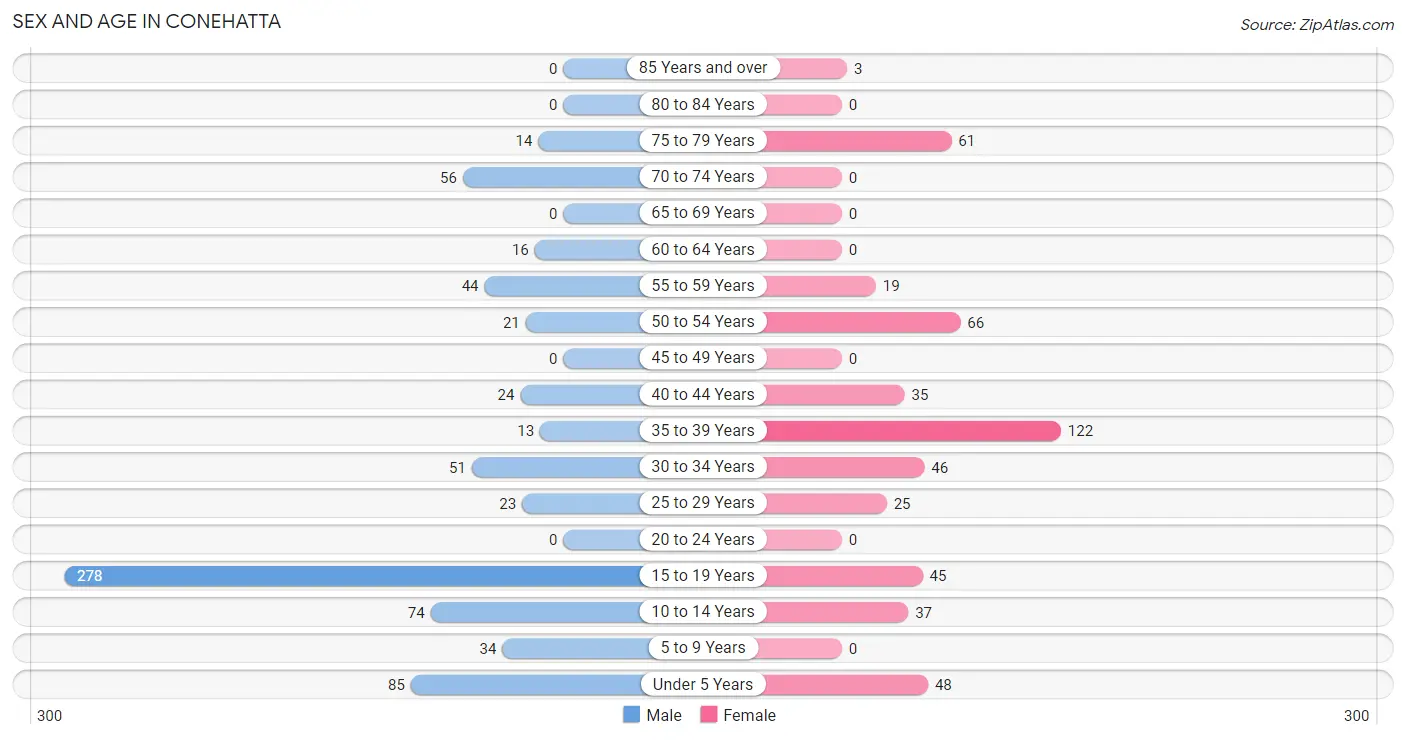
| Age Bracket | Male | Female |
| Under 5 Years | 85 (11.6%) | 48 (9.5%) |
| 5 to 9 Years | 34 (4.6%) | 0 (0.0%) |
| 10 to 14 Years | 74 (10.1%) | 37 (7.3%) |
| 15 to 19 Years | 278 (37.9%) | 45 (8.9%) |
| 20 to 24 Years | 0 (0.0%) | 0 (0.0%) |
| 25 to 29 Years | 23 (3.1%) | 25 (4.9%) |
| 30 to 34 Years | 51 (7.0%) | 46 (9.1%) |
| 35 to 39 Years | 13 (1.8%) | 122 (24.1%) |
| 40 to 44 Years | 24 (3.3%) | 35 (6.9%) |
| 45 to 49 Years | 0 (0.0%) | 0 (0.0%) |
| 50 to 54 Years | 21 (2.9%) | 66 (13.0%) |
| 55 to 59 Years | 44 (6.0%) | 19 (3.7%) |
| 60 to 64 Years | 16 (2.2%) | 0 (0.0%) |
| 65 to 69 Years | 0 (0.0%) | 0 (0.0%) |
| 70 to 74 Years | 56 (7.6%) | 0 (0.0%) |
| 75 to 79 Years | 14 (1.9%) | 61 (12.0%) |
| 80 to 84 Years | 0 (0.0%) | 0 (0.0%) |
| 85 Years and over | 0 (0.0%) | 3 (0.6%) |
| Total | 733 (100.0%) | 507 (100.0%) |
Families and Households in Conehatta
Median Family Size in Conehatta
The median family size in Conehatta is 3.20 persons per family, with single female/mother families (124 | 33.3%) accounting for the largest median family size of 4.65 persons per family. On the other hand, single male/father families (13 | 3.5%) represent the smallest median family size with 2.00 persons per family.
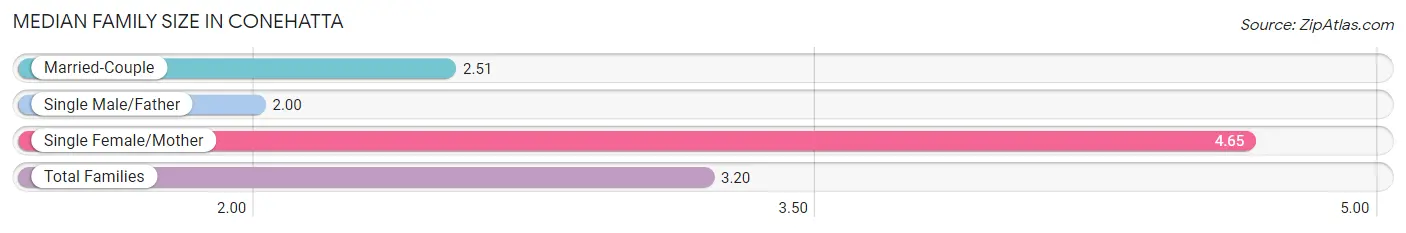
| Family Type | # Families | Family Size |
| Married-Couple | 235 (63.2%) | 2.51 |
| Single Male/Father | 13 (3.5%) | 2.00 |
| Single Female/Mother | 124 (33.3%) | 4.65 |
| Total Families | 372 (100.0%) | 3.20 |
Median Household Size in Conehatta
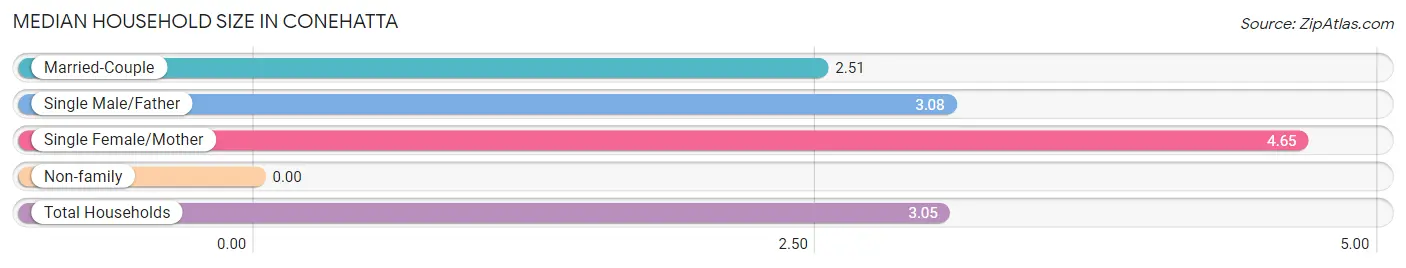
| Household Type | # Households | Household Size |
| Married-Couple | 235 (57.7%) | 2.51 |
| Single Male/Father | 13 (3.2%) | 3.08 |
| Single Female/Mother | 124 (30.5%) | 4.65 |
| Non-family | 35 (8.6%) | - |
| Total Households | 407 (100.0%) | 3.05 |
Household Size by Marriage Status in Conehatta
Out of a total of 407 households in Conehatta, 372 (91.4%) are family households, while 35 (8.6%) are nonfamily households. The most numerous type of family households are 4-person households, comprising 130, and the most common type of nonfamily households are 1-person households, comprising 35.
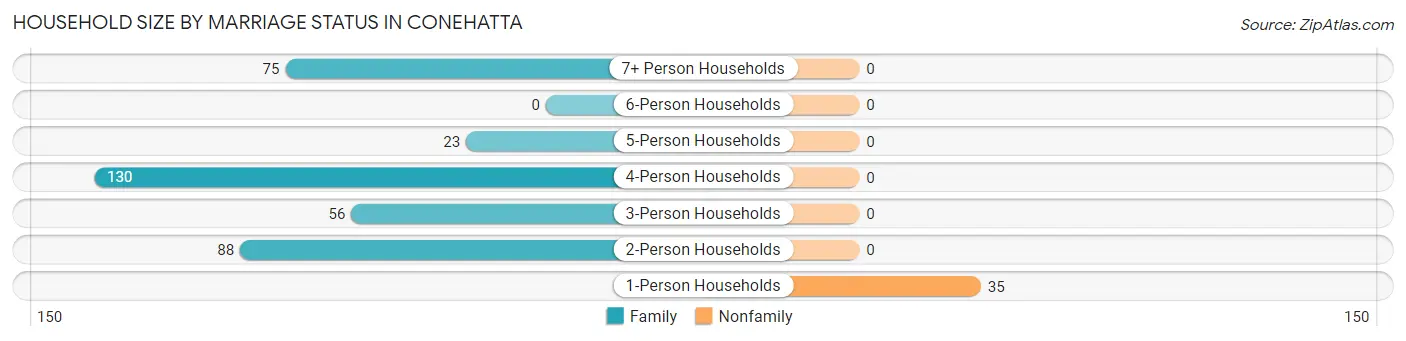
| Household Size | Family Households | Nonfamily Households |
| 1-Person Households | - | 35 (8.6%) |
| 2-Person Households | 88 (21.6%) | 0 (0.0%) |
| 3-Person Households | 56 (13.8%) | 0 (0.0%) |
| 4-Person Households | 130 (31.9%) | 0 (0.0%) |
| 5-Person Households | 23 (5.7%) | 0 (0.0%) |
| 6-Person Households | 0 (0.0%) | 0 (0.0%) |
| 7+ Person Households | 75 (18.4%) | 0 (0.0%) |
| Total | 372 (91.4%) | 35 (8.6%) |
Female Fertility in Conehatta
Fertility by Age in Conehatta
Average fertility rate in Conehatta is 136.0 births per 1,000 women. Women in the age bracket of 20 to 34 years have the highest fertility rate with 648.0 births per 1,000 women. Women in the age bracket of 20 to 34 years acount for 100.0% of all women with births.
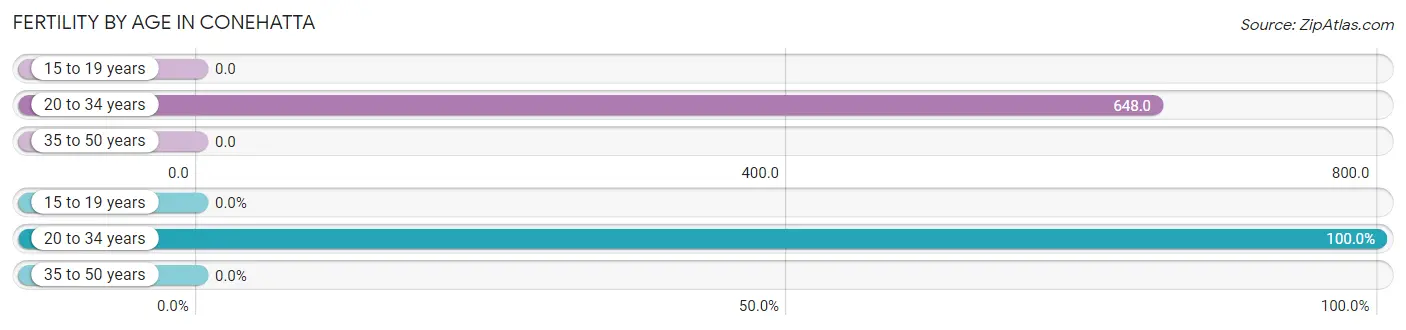
| Age Bracket | Women with Births | Births / 1,000 Women |
| 15 to 19 years | 0 (0.0%) | 0.0 |
| 20 to 34 years | 46 (100.0%) | 648.0 |
| 35 to 50 years | 0 (0.0%) | 0.0 |
| Total | 46 (100.0%) | 136.0 |
Fertility by Age by Marriage Status in Conehatta
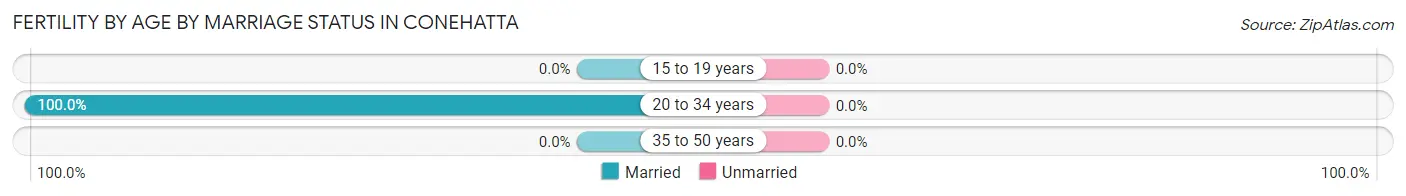
| Age Bracket | Married | Unmarried |
| 15 to 19 years | 0 (0.0%) | 0 (0.0%) |
| 20 to 34 years | 46 (100.0%) | 0 (0.0%) |
| 35 to 50 years | 0 (0.0%) | 0 (0.0%) |
| Total | 46 (100.0%) | 0 (0.0%) |
Fertility by Education in Conehatta
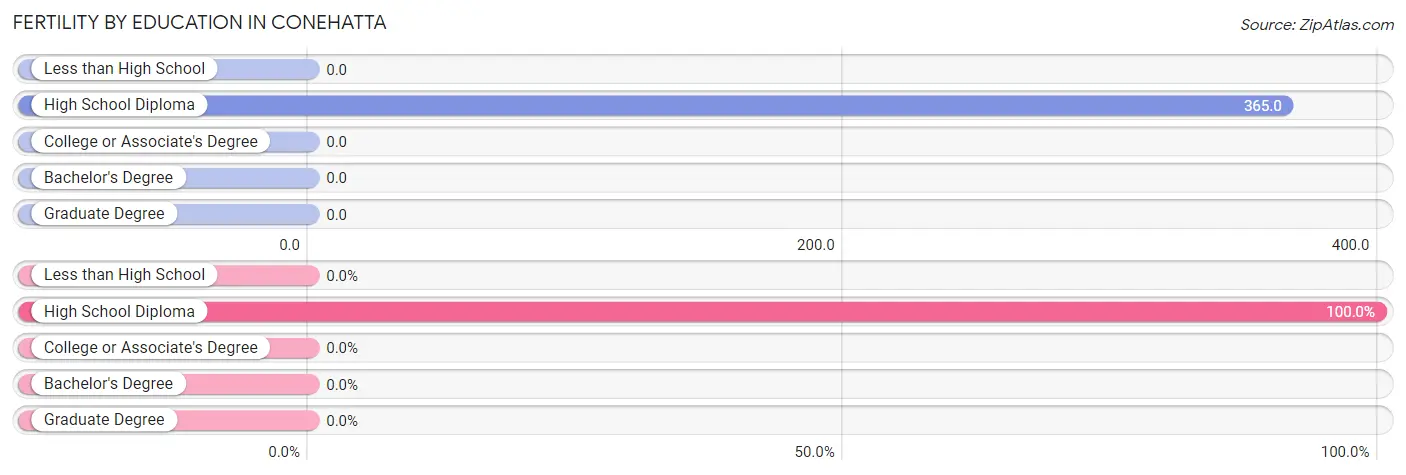
| Educational Attainment | Women with Births | Births / 1,000 Women |
| Less than High School | 0 (0.0%) | 0.0 |
| High School Diploma | 46 (100.0%) | 365.0 |
| College or Associate's Degree | 0 (0.0%) | 0.0 |
| Bachelor's Degree | 0 (0.0%) | 0.0 |
| Graduate Degree | 0 (0.0%) | 0.0 |
| Total | 46 (100.0%) | 136.0 |
Fertility by Education by Marriage Status in Conehatta
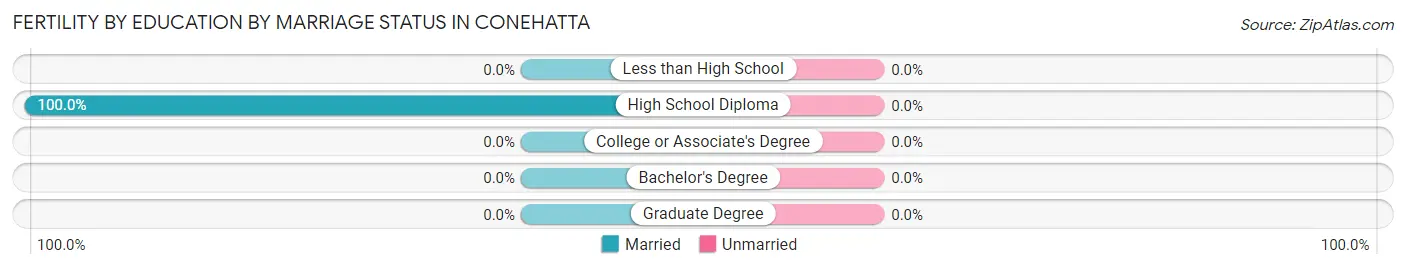
| Educational Attainment | Married | Unmarried |
| Less than High School | 0 (0.0%) | 0 (0.0%) |
| High School Diploma | 46 (100.0%) | 0 (0.0%) |
| College or Associate's Degree | 0 (0.0%) | 0 (0.0%) |
| Bachelor's Degree | 0 (0.0%) | 0 (0.0%) |
| Graduate Degree | 0 (0.0%) | 0 (0.0%) |
| Total | 46 (100.0%) | 0 (0.0%) |
Employment Characteristics in Conehatta
Employment by Class of Employer in Conehatta
Among the 292 employed individuals in Conehatta, private company employees (108 | 37.0%), state government employees (99 | 33.9%), and federal government employees (48 | 16.4%) make up the most common classes of employment.
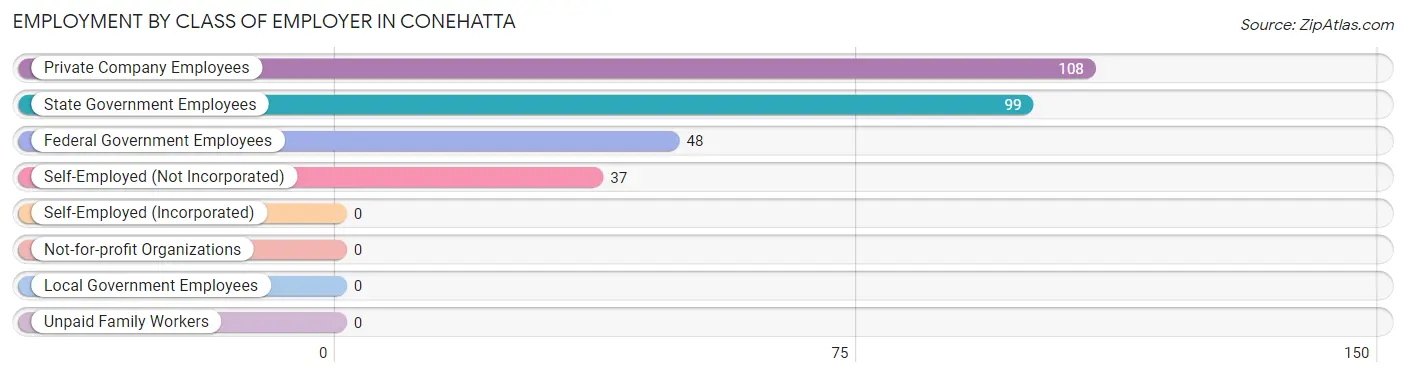
| Employer Class | # Employees | % Employees |
| Private Company Employees | 108 | 37.0% |
| Self-Employed (Incorporated) | 0 | 0.0% |
| Self-Employed (Not Incorporated) | 37 | 12.7% |
| Not-for-profit Organizations | 0 | 0.0% |
| Local Government Employees | 0 | 0.0% |
| State Government Employees | 99 | 33.9% |
| Federal Government Employees | 48 | 16.4% |
| Unpaid Family Workers | 0 | 0.0% |
| Total | 292 | 100.0% |
Employment Status by Age in Conehatta
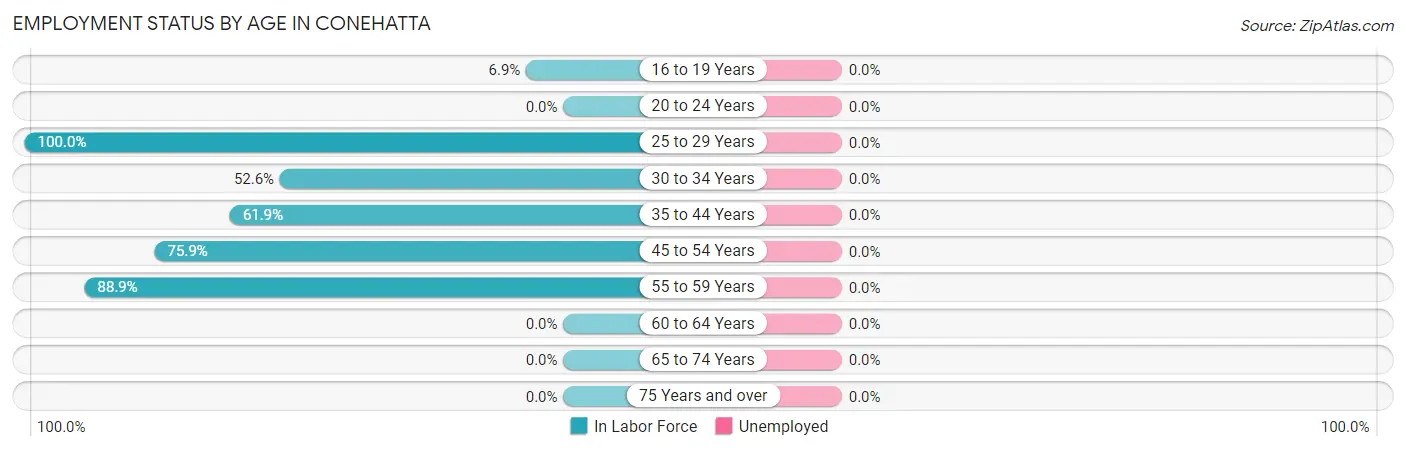
| Age Bracket | In Labor Force | Unemployed |
| 16 to 19 Years | 17 (6.9%) | 0 (0.0%) |
| 20 to 24 Years | 0 (0.0%) | 0 (0.0%) |
| 25 to 29 Years | 48 (100.0%) | 0 (0.0%) |
| 30 to 34 Years | 51 (52.6%) | 0 (0.0%) |
| 35 to 44 Years | 120 (61.9%) | 0 (0.0%) |
| 45 to 54 Years | 66 (75.9%) | 0 (0.0%) |
| 55 to 59 Years | 56 (88.9%) | 0 (0.0%) |
| 60 to 64 Years | 0 (0.0%) | 0 (0.0%) |
| 65 to 74 Years | 0 (0.0%) | 0 (0.0%) |
| 75 Years and over | 0 (0.0%) | 0 (0.0%) |
| Total | 358 (40.4%) | 0 (0.0%) |
Employment Status by Educational Attainment in Conehatta
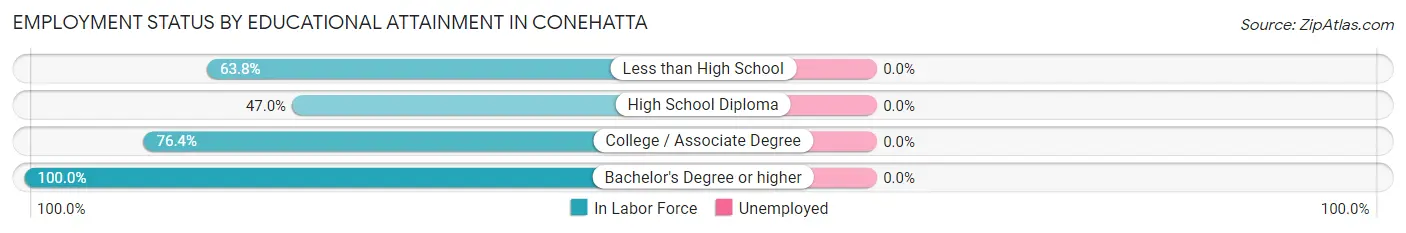
| Educational Attainment | In Labor Force | Unemployed |
| Less than High School | 37 (63.8%) | 0 (0.0%) |
| High School Diploma | 78 (47.0%) | 0 (0.0%) |
| College / Associate Degree | 178 (76.4%) | 0 (0.0%) |
| Bachelor's Degree or higher | 48 (100.0%) | 0 (0.0%) |
| Total | 341 (67.5%) | 0 (0.0%) |
Employment Occupations by Sex in Conehatta
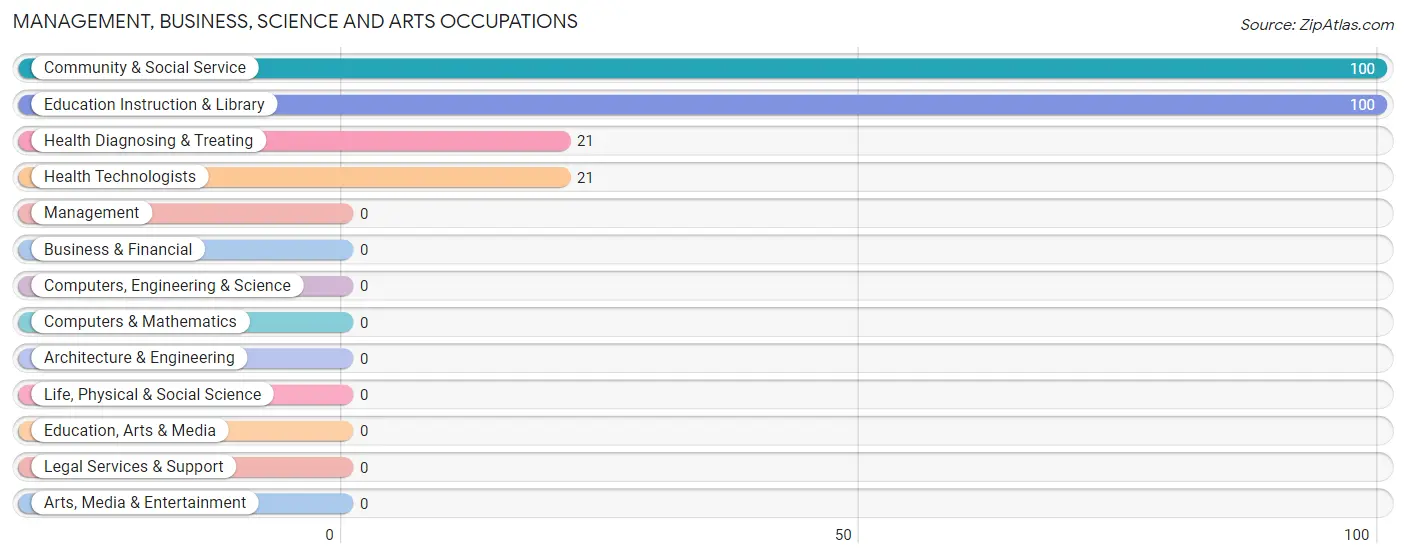
Management, Business, Science and Arts Occupations
The most common Management, Business, Science and Arts occupations in Conehatta are Community & Social Service (100 | 27.9%), Education Instruction & Library (100 | 27.9%), Health Diagnosing & Treating (21 | 5.9%), and Health Technologists (21 | 5.9%).
Management, Business, Science and Arts Occupations by Sex
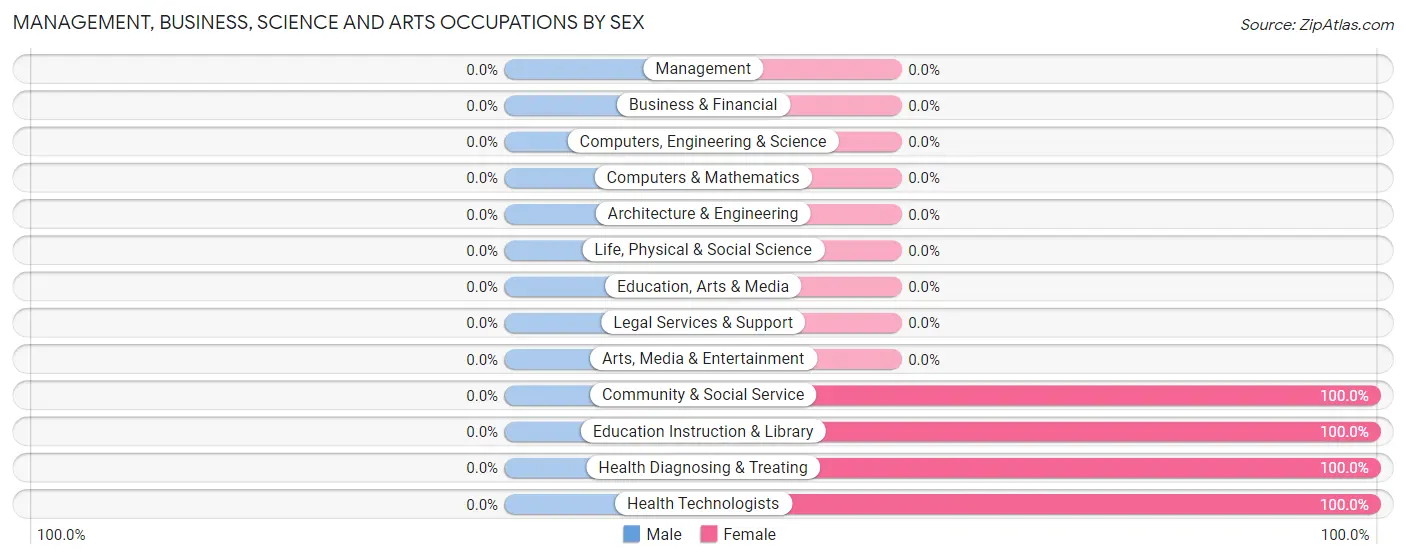
| Occupation | Male | Female |
| Management | 0 (0.0%) | 0 (0.0%) |
| Business & Financial | 0 (0.0%) | 0 (0.0%) |
| Computers, Engineering & Science | 0 (0.0%) | 0 (0.0%) |
| Computers & Mathematics | 0 (0.0%) | 0 (0.0%) |
| Architecture & Engineering | 0 (0.0%) | 0 (0.0%) |
| Life, Physical & Social Science | 0 (0.0%) | 0 (0.0%) |
| Community & Social Service | 0 (0.0%) | 100 (100.0%) |
| Education, Arts & Media | 0 (0.0%) | 0 (0.0%) |
| Legal Services & Support | 0 (0.0%) | 0 (0.0%) |
| Education Instruction & Library | 0 (0.0%) | 100 (100.0%) |
| Arts, Media & Entertainment | 0 (0.0%) | 0 (0.0%) |
| Health Diagnosing & Treating | 0 (0.0%) | 21 (100.0%) |
| Health Technologists | 0 (0.0%) | 21 (100.0%) |
| Total (Category) | 0 (0.0%) | 121 (100.0%) |
| Total (Overall) | 159 (44.4%) | 199 (55.6%) |
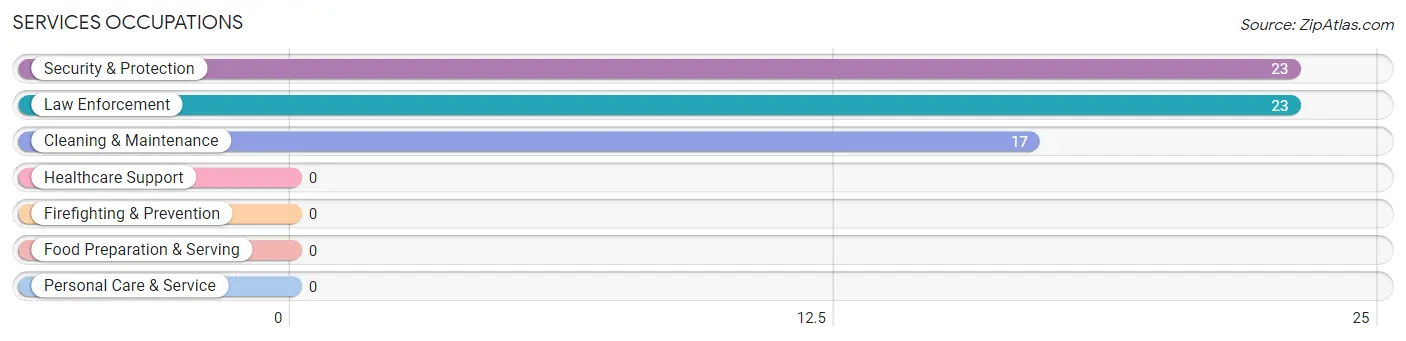
Services Occupations
The most common Services occupations in Conehatta are Security & Protection (23 | 6.4%), Law Enforcement (23 | 6.4%), and Cleaning & Maintenance (17 | 4.8%).
Services Occupations by Sex
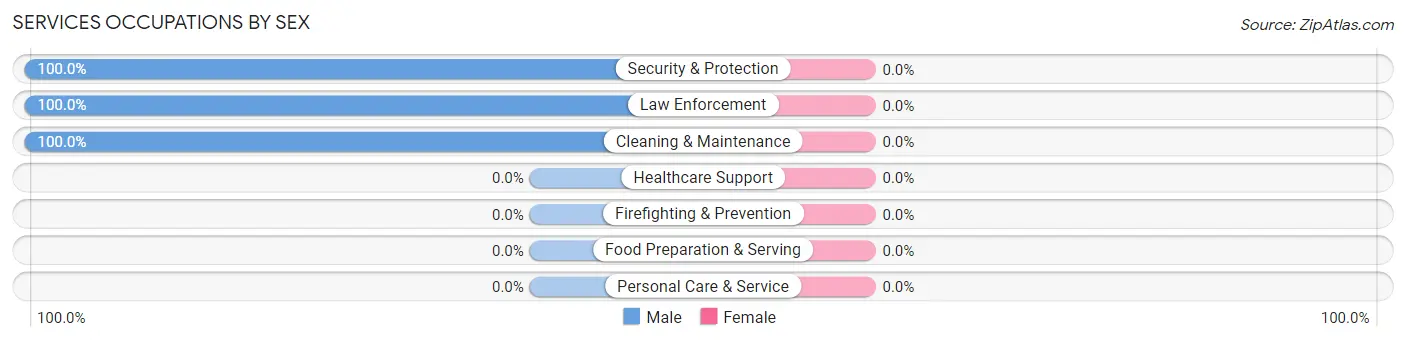
| Occupation | Male | Female |
| Healthcare Support | 0 (0.0%) | 0 (0.0%) |
| Security & Protection | 23 (100.0%) | 0 (0.0%) |
| Firefighting & Prevention | 0 (0.0%) | 0 (0.0%) |
| Law Enforcement | 23 (100.0%) | 0 (0.0%) |
| Food Preparation & Serving | 0 (0.0%) | 0 (0.0%) |
| Cleaning & Maintenance | 17 (100.0%) | 0 (0.0%) |
| Personal Care & Service | 0 (0.0%) | 0 (0.0%) |
| Total (Category) | 40 (100.0%) | 0 (0.0%) |
| Total (Overall) | 159 (44.4%) | 199 (55.6%) |
Sales and Office Occupations
The most common Sales and Office occupations in Conehatta are , and Office & Administration (51 | 14.2%).
Sales and Office Occupations by Sex

| Occupation | Male | Female |
| Sales & Related | 0 (0.0%) | 0 (0.0%) |
| Office & Administration | 51 (100.0%) | 0 (0.0%) |
| Total (Category) | 51 (100.0%) | 0 (0.0%) |
| Total (Overall) | 159 (44.4%) | 199 (55.6%) |
Natural Resources, Construction and Maintenance Occupations
The most common Natural Resources, Construction and Maintenance occupations in Conehatta are Construction & Extraction (61 | 17.0%), and Installation, Maintenance & Repair (7 | 2.0%).
Natural Resources, Construction and Maintenance Occupations by Sex
| Occupation | Male | Female |
| Farming, Fishing & Forestry | 0 (0.0%) | 0 (0.0%) |
| Construction & Extraction | 61 (100.0%) | 0 (0.0%) |
| Installation, Maintenance & Repair | 7 (100.0%) | 0 (0.0%) |
| Total (Category) | 68 (100.0%) | 0 (0.0%) |
| Total (Overall) | 159 (44.4%) | 199 (55.6%) |
Production, Transportation and Moving Occupations
The most common Production, Transportation and Moving occupations in Conehatta are Production (66 | 18.4%), and Material Moving (12 | 3.4%).
Production, Transportation and Moving Occupations by Sex
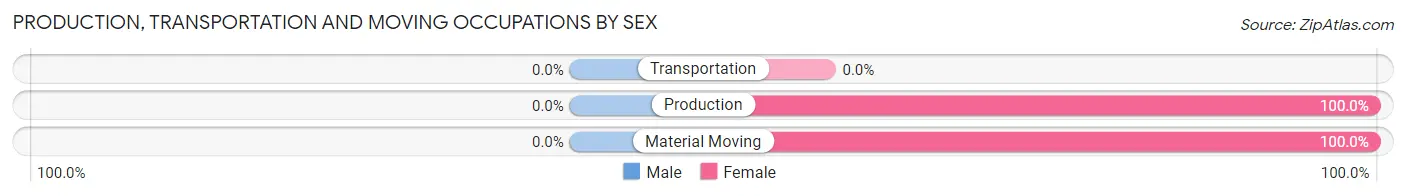
| Occupation | Male | Female |
| Production | 0 (0.0%) | 66 (100.0%) |
| Transportation | 0 (0.0%) | 0 (0.0%) |
| Material Moving | 0 (0.0%) | 12 (100.0%) |
| Total (Category) | 0 (0.0%) | 78 (100.0%) |
| Total (Overall) | 159 (44.4%) | 199 (55.6%) |
Employment Industries by Sex in Conehatta
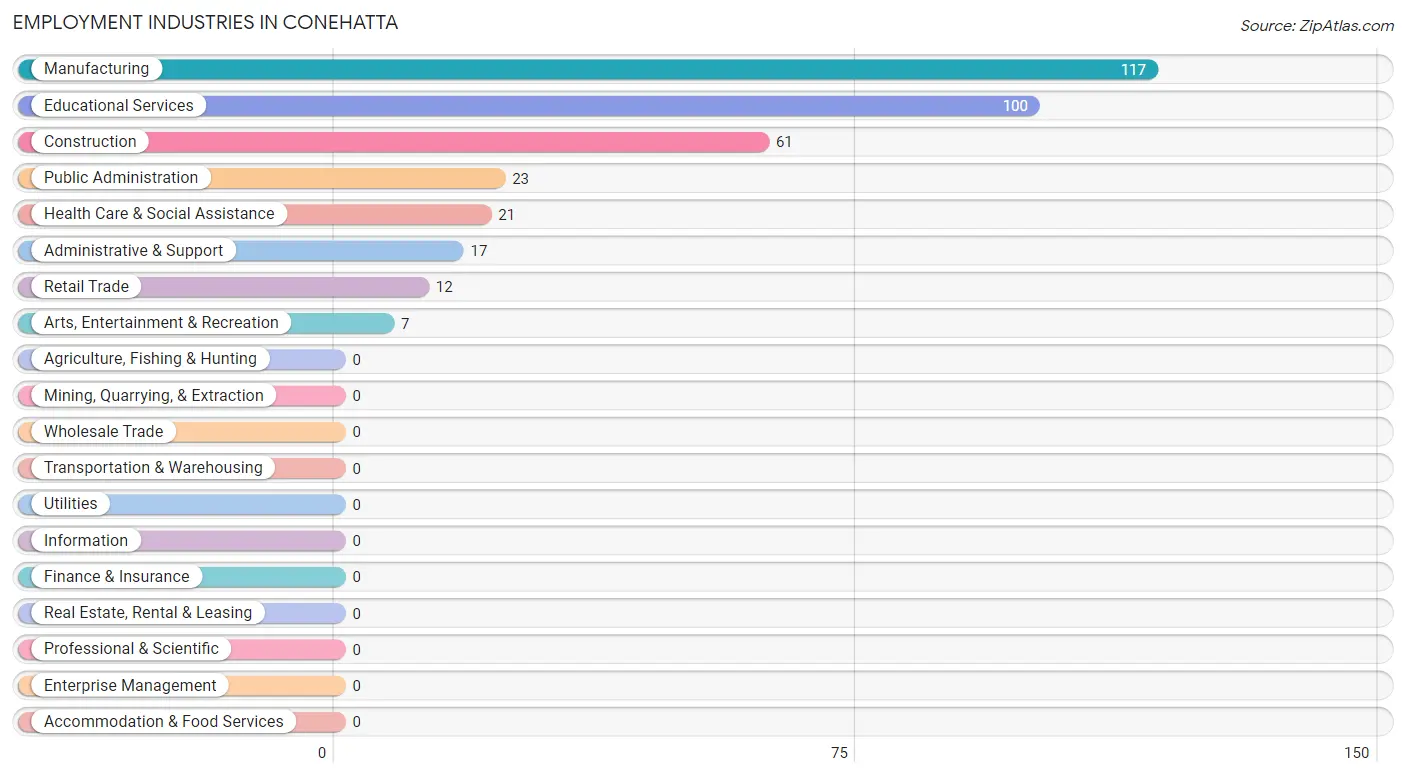
Employment Industries in Conehatta
The major employment industries in Conehatta include Manufacturing (117 | 32.7%), Educational Services (100 | 27.9%), Construction (61 | 17.0%), Public Administration (23 | 6.4%), and Health Care & Social Assistance (21 | 5.9%).
Employment Industries by Sex in Conehatta
The Conehatta industries that see more men than women are Construction (100.0%), Administrative & Support (100.0%), and Arts, Entertainment & Recreation (100.0%), whereas the industries that tend to have a higher number of women are Retail Trade (100.0%), Educational Services (100.0%), and Health Care & Social Assistance (100.0%).
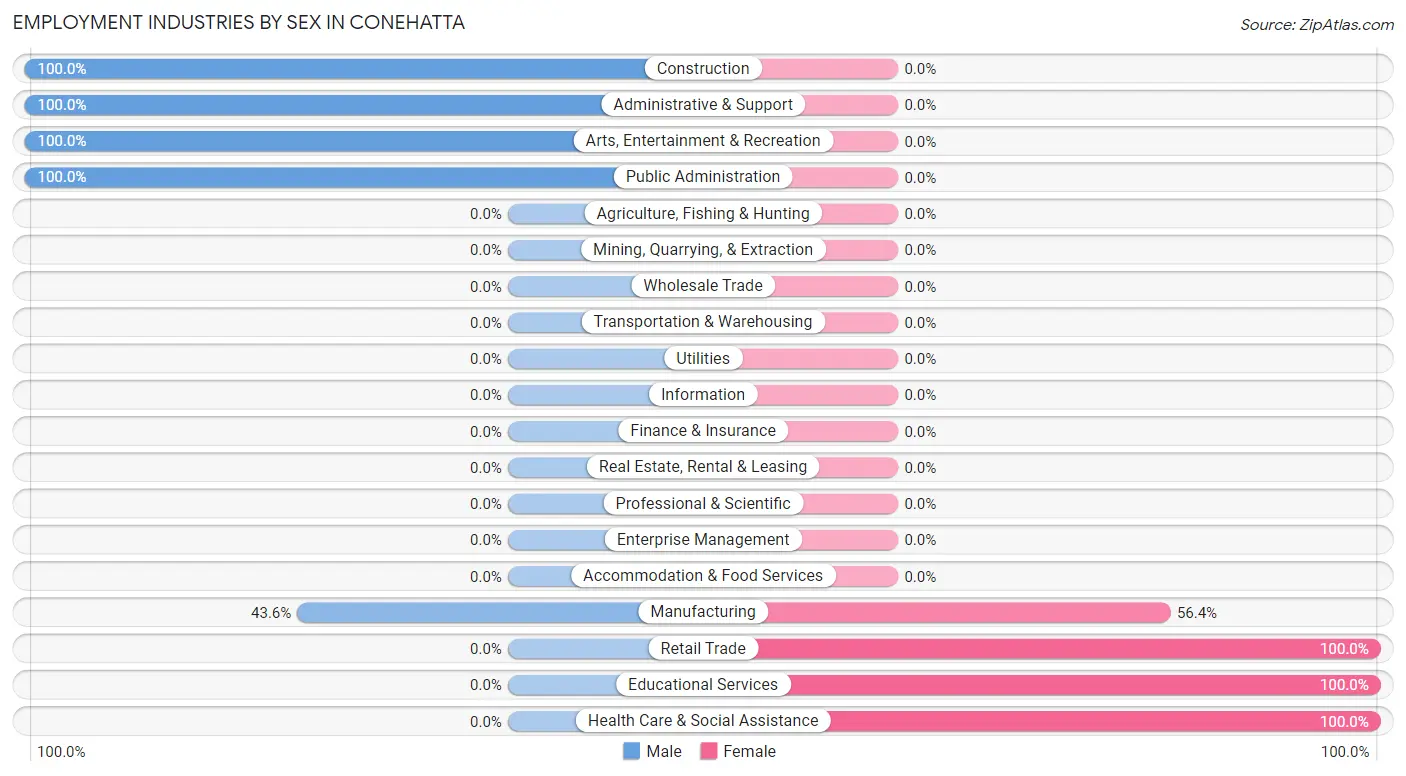
| Industry | Male | Female |
| Agriculture, Fishing & Hunting | 0 (0.0%) | 0 (0.0%) |
| Mining, Quarrying, & Extraction | 0 (0.0%) | 0 (0.0%) |
| Construction | 61 (100.0%) | 0 (0.0%) |
| Manufacturing | 51 (43.6%) | 66 (56.4%) |
| Wholesale Trade | 0 (0.0%) | 0 (0.0%) |
| Retail Trade | 0 (0.0%) | 12 (100.0%) |
| Transportation & Warehousing | 0 (0.0%) | 0 (0.0%) |
| Utilities | 0 (0.0%) | 0 (0.0%) |
| Information | 0 (0.0%) | 0 (0.0%) |
| Finance & Insurance | 0 (0.0%) | 0 (0.0%) |
| Real Estate, Rental & Leasing | 0 (0.0%) | 0 (0.0%) |
| Professional & Scientific | 0 (0.0%) | 0 (0.0%) |
| Enterprise Management | 0 (0.0%) | 0 (0.0%) |
| Administrative & Support | 17 (100.0%) | 0 (0.0%) |
| Educational Services | 0 (0.0%) | 100 (100.0%) |
| Health Care & Social Assistance | 0 (0.0%) | 21 (100.0%) |
| Arts, Entertainment & Recreation | 7 (100.0%) | 0 (0.0%) |
| Accommodation & Food Services | 0 (0.0%) | 0 (0.0%) |
| Public Administration | 23 (100.0%) | 0 (0.0%) |
| Total | 159 (44.4%) | 199 (55.6%) |
Education in Conehatta
School Enrollment in Conehatta
The most common levels of schooling among the 577 students in Conehatta are high school (285 | 49.4%), middle school (122 | 21.1%), and college / undergraduate (75 | 13.0%).
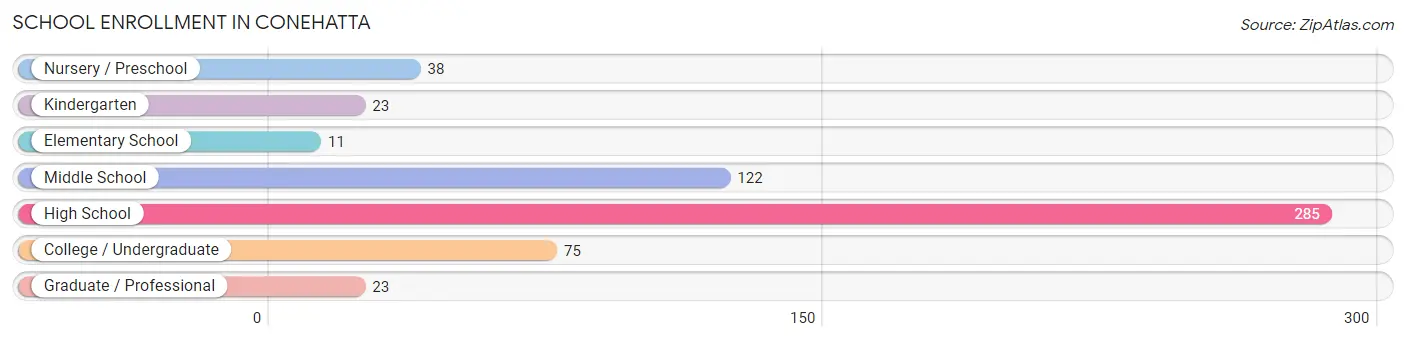
| School Level | # Students | % Students |
| Nursery / Preschool | 38 | 6.6% |
| Kindergarten | 23 | 4.0% |
| Elementary School | 11 | 1.9% |
| Middle School | 122 | 21.1% |
| High School | 285 | 49.4% |
| College / Undergraduate | 75 | 13.0% |
| Graduate / Professional | 23 | 4.0% |
| Total | 577 | 100.0% |
School Enrollment by Age by Funding Source in Conehatta
Out of a total of 577 students who are enrolled in schools in Conehatta, 98 (17.0%) attend a private institution, while the remaining 479 (83.0%) are enrolled in public schools. The age group of 25 to 34 year olds has the highest likelihood of being enrolled in private schools, with 23 (100.0% in the age bracket) enrolled. Conversely, the age group of 3 to 4 year olds has the lowest likelihood of being enrolled in a private school, with 38 (100.0% in the age bracket) attending a public institution.
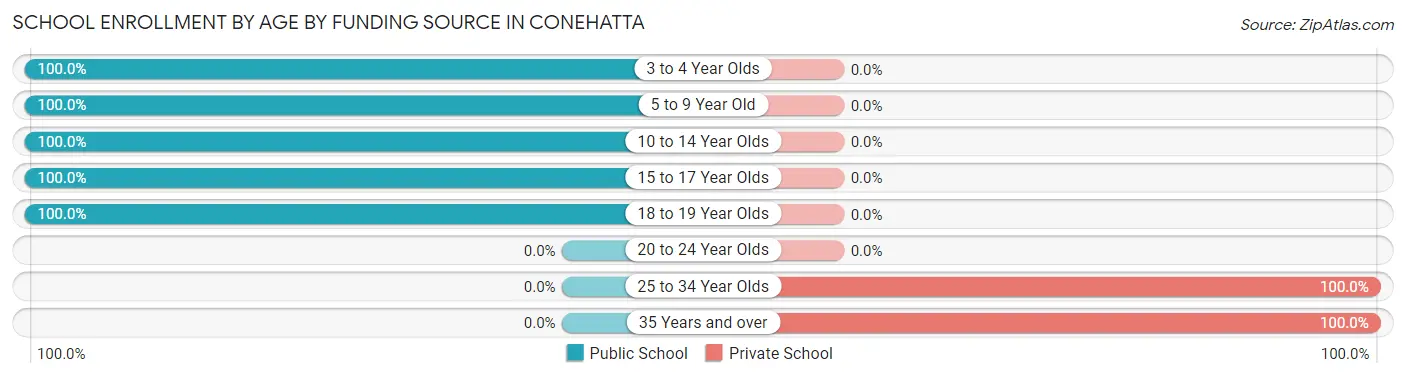
| Age Bracket | Public School | Private School |
| 3 to 4 Year Olds | 38 (100.0%) | 0 (0.0%) |
| 5 to 9 Year Old | 34 (100.0%) | 0 (0.0%) |
| 10 to 14 Year Olds | 84 (100.0%) | 0 (0.0%) |
| 15 to 17 Year Olds | 176 (100.0%) | 0 (0.0%) |
| 18 to 19 Year Olds | 147 (100.0%) | 0 (0.0%) |
| 20 to 24 Year Olds | 0 (0.0%) | 0 (0.0%) |
| 25 to 34 Year Olds | 0 (0.0%) | 23 (100.0%) |
| 35 Years and over | 0 (0.0%) | 75 (100.0%) |
| Total | 479 (83.0%) | 98 (17.0%) |
Educational Attainment by Field of Study in Conehatta
Physical & health sciences (56 | 53.8%), education (25 | 24.0%), and psychology (23 | 22.1%) are the most common fields of study among 104 individuals in Conehatta who have obtained a bachelor's degree or higher.
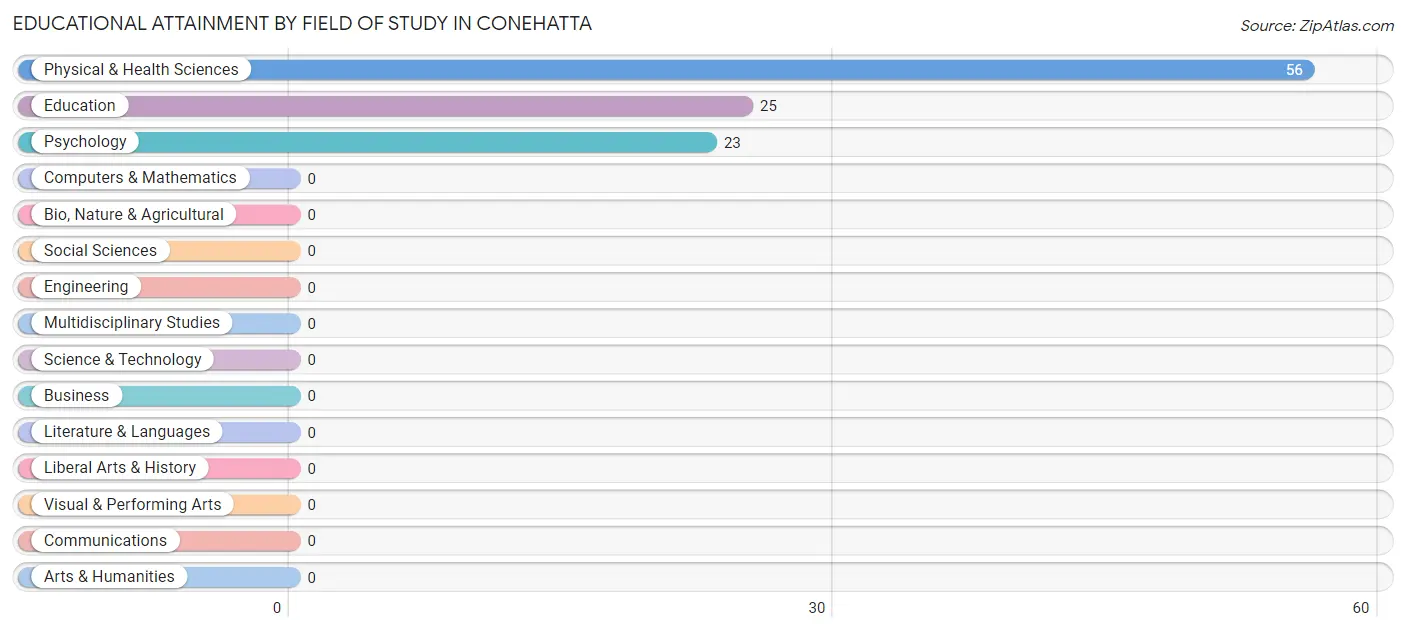
| Field of Study | # Graduates | % Graduates |
| Computers & Mathematics | 0 | 0.0% |
| Bio, Nature & Agricultural | 0 | 0.0% |
| Physical & Health Sciences | 56 | 53.8% |
| Psychology | 23 | 22.1% |
| Social Sciences | 0 | 0.0% |
| Engineering | 0 | 0.0% |
| Multidisciplinary Studies | 0 | 0.0% |
| Science & Technology | 0 | 0.0% |
| Business | 0 | 0.0% |
| Education | 25 | 24.0% |
| Literature & Languages | 0 | 0.0% |
| Liberal Arts & History | 0 | 0.0% |
| Visual & Performing Arts | 0 | 0.0% |
| Communications | 0 | 0.0% |
| Arts & Humanities | 0 | 0.0% |
| Total | 104 | 100.0% |
Transportation & Commute in Conehatta
Vehicle Availability by Sex in Conehatta
The most prevalent vehicle ownership categories in Conehatta are males with 2 vehicles (118, accounting for 74.2%) and females with 2 vehicles (112, making up 88.7%).
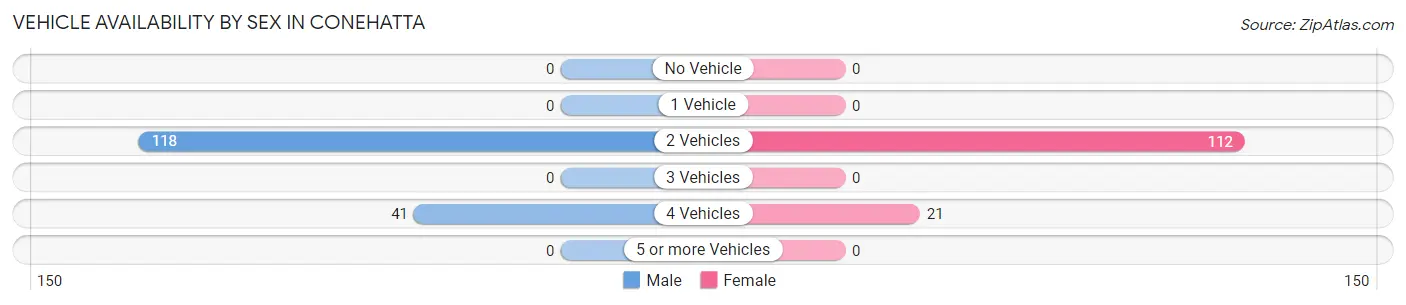
| Vehicles Available | Male | Female |
| No Vehicle | 0 (0.0%) | 0 (0.0%) |
| 1 Vehicle | 0 (0.0%) | 0 (0.0%) |
| 2 Vehicles | 118 (74.2%) | 112 (84.2%) |
| 3 Vehicles | 0 (0.0%) | 0 (0.0%) |
| 4 Vehicles | 41 (25.8%) | 21 (15.8%) |
| 5 or more Vehicles | 0 (0.0%) | 0 (0.0%) |
| Total | 159 (100.0%) | 133 (100.0%) |
Commute Time in Conehatta
The most frequently occuring commute durations in Conehatta are 5 to 9 minutes (75 commuters, 25.7%), 25 to 29 minutes (72 commuters, 24.7%), and 45 to 59 minutes (44 commuters, 15.1%).
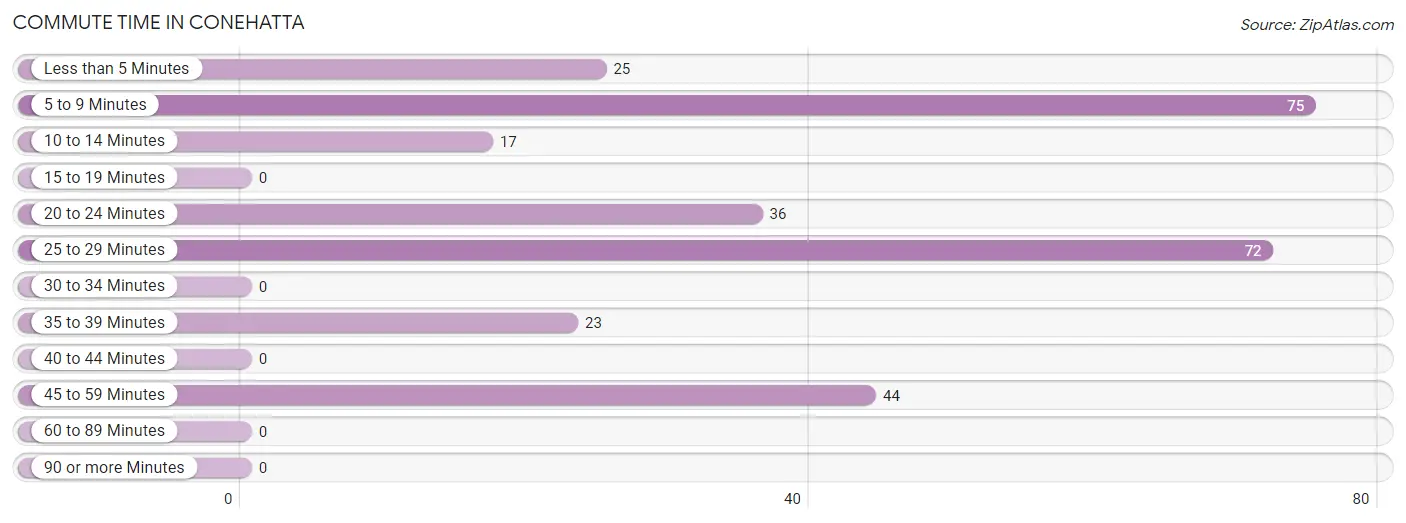
| Commute Time | # Commuters | % Commuters |
| Less than 5 Minutes | 25 | 8.6% |
| 5 to 9 Minutes | 75 | 25.7% |
| 10 to 14 Minutes | 17 | 5.8% |
| 15 to 19 Minutes | 0 | 0.0% |
| 20 to 24 Minutes | 36 | 12.3% |
| 25 to 29 Minutes | 72 | 24.7% |
| 30 to 34 Minutes | 0 | 0.0% |
| 35 to 39 Minutes | 23 | 7.9% |
| 40 to 44 Minutes | 0 | 0.0% |
| 45 to 59 Minutes | 44 | 15.1% |
| 60 to 89 Minutes | 0 | 0.0% |
| 90 or more Minutes | 0 | 0.0% |
Commute Time by Sex in Conehatta
The most common commute times in Conehatta are 25 to 29 minutes (51 commuters, 32.1%) for males and 5 to 9 minutes (75 commuters, 56.4%) for females.
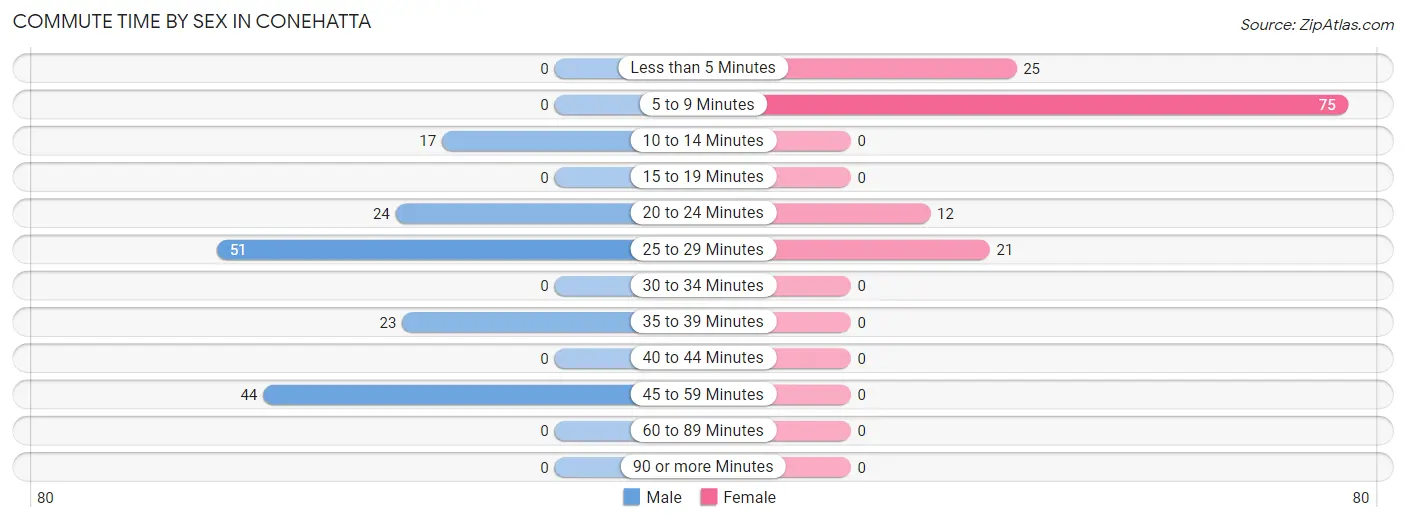
| Commute Time | Male | Female |
| Less than 5 Minutes | 0 (0.0%) | 25 (18.8%) |
| 5 to 9 Minutes | 0 (0.0%) | 75 (56.4%) |
| 10 to 14 Minutes | 17 (10.7%) | 0 (0.0%) |
| 15 to 19 Minutes | 0 (0.0%) | 0 (0.0%) |
| 20 to 24 Minutes | 24 (15.1%) | 12 (9.0%) |
| 25 to 29 Minutes | 51 (32.1%) | 21 (15.8%) |
| 30 to 34 Minutes | 0 (0.0%) | 0 (0.0%) |
| 35 to 39 Minutes | 23 (14.5%) | 0 (0.0%) |
| 40 to 44 Minutes | 0 (0.0%) | 0 (0.0%) |
| 45 to 59 Minutes | 44 (27.7%) | 0 (0.0%) |
| 60 to 89 Minutes | 0 (0.0%) | 0 (0.0%) |
| 90 or more Minutes | 0 (0.0%) | 0 (0.0%) |
Time of Departure to Work by Sex in Conehatta
The most frequent times of departure to work in Conehatta are 7:00 AM to 7:29 AM (51, 32.1%) for males and 7:00 AM to 7:29 AM (121, 91.0%) for females.
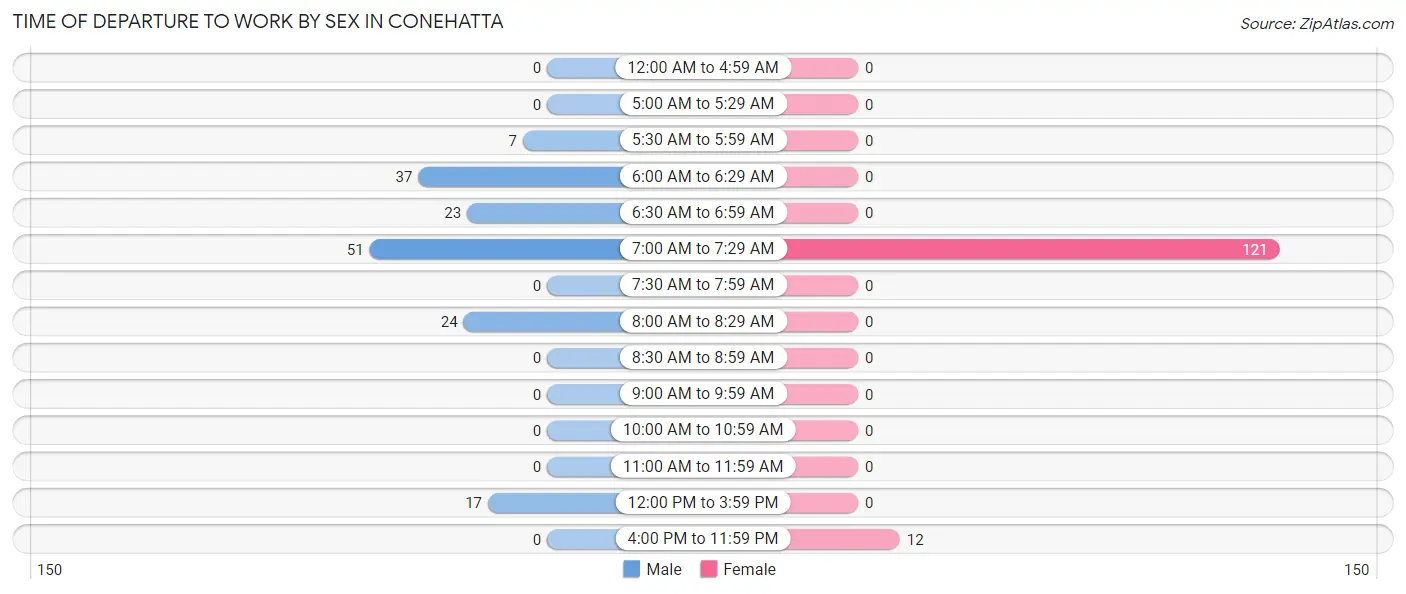
| Time of Departure | Male | Female |
| 12:00 AM to 4:59 AM | 0 (0.0%) | 0 (0.0%) |
| 5:00 AM to 5:29 AM | 0 (0.0%) | 0 (0.0%) |
| 5:30 AM to 5:59 AM | 7 (4.4%) | 0 (0.0%) |
| 6:00 AM to 6:29 AM | 37 (23.3%) | 0 (0.0%) |
| 6:30 AM to 6:59 AM | 23 (14.5%) | 0 (0.0%) |
| 7:00 AM to 7:29 AM | 51 (32.1%) | 121 (91.0%) |
| 7:30 AM to 7:59 AM | 0 (0.0%) | 0 (0.0%) |
| 8:00 AM to 8:29 AM | 24 (15.1%) | 0 (0.0%) |
| 8:30 AM to 8:59 AM | 0 (0.0%) | 0 (0.0%) |
| 9:00 AM to 9:59 AM | 0 (0.0%) | 0 (0.0%) |
| 10:00 AM to 10:59 AM | 0 (0.0%) | 0 (0.0%) |
| 11:00 AM to 11:59 AM | 0 (0.0%) | 0 (0.0%) |
| 12:00 PM to 3:59 PM | 17 (10.7%) | 0 (0.0%) |
| 4:00 PM to 11:59 PM | 0 (0.0%) | 12 (9.0%) |
| Total | 159 (100.0%) | 133 (100.0%) |
Housing Occupancy in Conehatta
Occupancy by Ownership in Conehatta
Of the total 407 dwellings in Conehatta, owner-occupied units account for 361 (88.7%), while renter-occupied units make up 46 (11.3%).
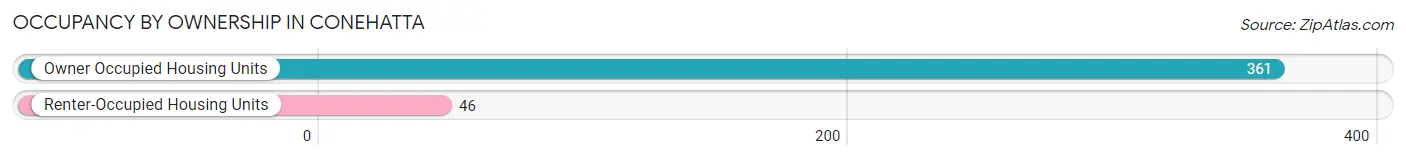
| Occupancy | # Housing Units | % Housing Units |
| Owner Occupied Housing Units | 361 | 88.7% |
| Renter-Occupied Housing Units | 46 | 11.3% |
| Total Occupied Housing Units | 407 | 100.0% |
Occupancy by Household Size in Conehatta
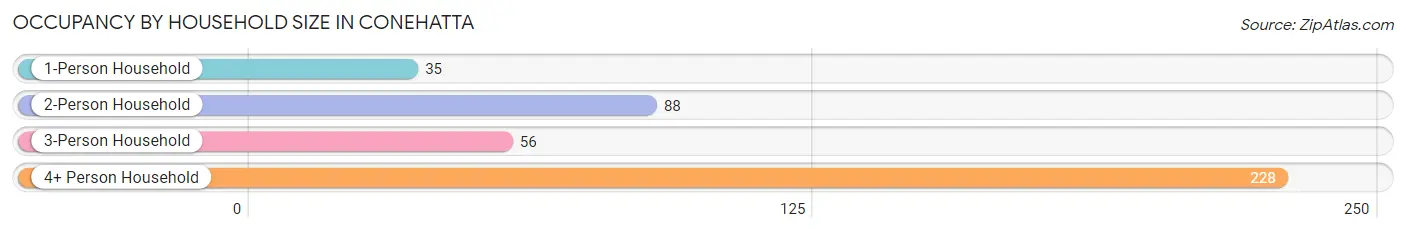
| Household Size | # Housing Units | % Housing Units |
| 1-Person Household | 35 | 8.6% |
| 2-Person Household | 88 | 21.6% |
| 3-Person Household | 56 | 13.8% |
| 4+ Person Household | 228 | 56.0% |
| Total Housing Units | 407 | 100.0% |
Occupancy by Ownership by Household Size in Conehatta
| Household Size | Owner-occupied | Renter-occupied |
| 1-Person Household | 35 (100.0%) | 0 (0.0%) |
| 2-Person Household | 88 (100.0%) | 0 (0.0%) |
| 3-Person Household | 56 (100.0%) | 0 (0.0%) |
| 4+ Person Household | 182 (79.8%) | 46 (20.2%) |
| Total Housing Units | 361 (88.7%) | 46 (11.3%) |
Occupancy by Educational Attainment in Conehatta
| Household Size | Owner-occupied | Renter-occupied |
| Less than High School | 24 (100.0%) | 0 (0.0%) |
| High School Diploma | 112 (70.9%) | 46 (29.1%) |
| College/Associate Degree | 146 (100.0%) | 0 (0.0%) |
| Bachelor's Degree or higher | 79 (100.0%) | 0 (0.0%) |
Occupancy by Age of Householder in Conehatta
| Age Bracket | # Households | % Households |
| Under 35 Years | 69 | 17.0% |
| 35 to 44 Years | 159 | 39.1% |
| 45 to 54 Years | 87 | 21.4% |
| 55 to 64 Years | 19 | 4.7% |
| 65 to 74 Years | 56 | 13.8% |
| 75 to 84 Years | 14 | 3.4% |
| 85 Years and Over | 3 | 0.7% |
| Total | 407 | 100.0% |
Housing Finances in Conehatta
Median Income by Occupancy in Conehatta
| Occupancy Type | # Households | Median Income |
| Owner-Occupied | 361 (88.7%) | $44,754 |
| Renter-Occupied | 46 (11.3%) | $0 |
| Average | 407 (100.0%) | $43,728 |
Occupancy by Householder Income Bracket in Conehatta
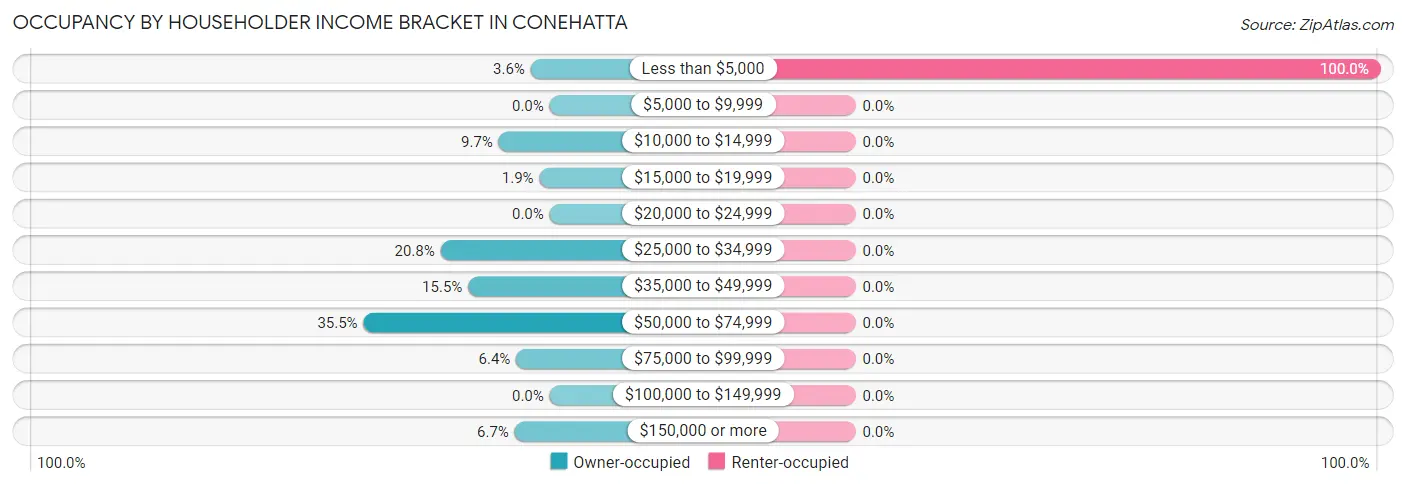
| Income Bracket | Owner-occupied | Renter-occupied |
| Less than $5,000 | 13 (3.6%) | 46 (100.0%) |
| $5,000 to $9,999 | 0 (0.0%) | 0 (0.0%) |
| $10,000 to $14,999 | 35 (9.7%) | 0 (0.0%) |
| $15,000 to $19,999 | 7 (1.9%) | 0 (0.0%) |
| $20,000 to $24,999 | 0 (0.0%) | 0 (0.0%) |
| $25,000 to $34,999 | 75 (20.8%) | 0 (0.0%) |
| $35,000 to $49,999 | 56 (15.5%) | 0 (0.0%) |
| $50,000 to $74,999 | 128 (35.5%) | 0 (0.0%) |
| $75,000 to $99,999 | 23 (6.4%) | 0 (0.0%) |
| $100,000 to $149,999 | 0 (0.0%) | 0 (0.0%) |
| $150,000 or more | 24 (6.7%) | 0 (0.0%) |
| Total | 361 (100.0%) | 46 (100.0%) |
Monthly Housing Cost Tiers in Conehatta
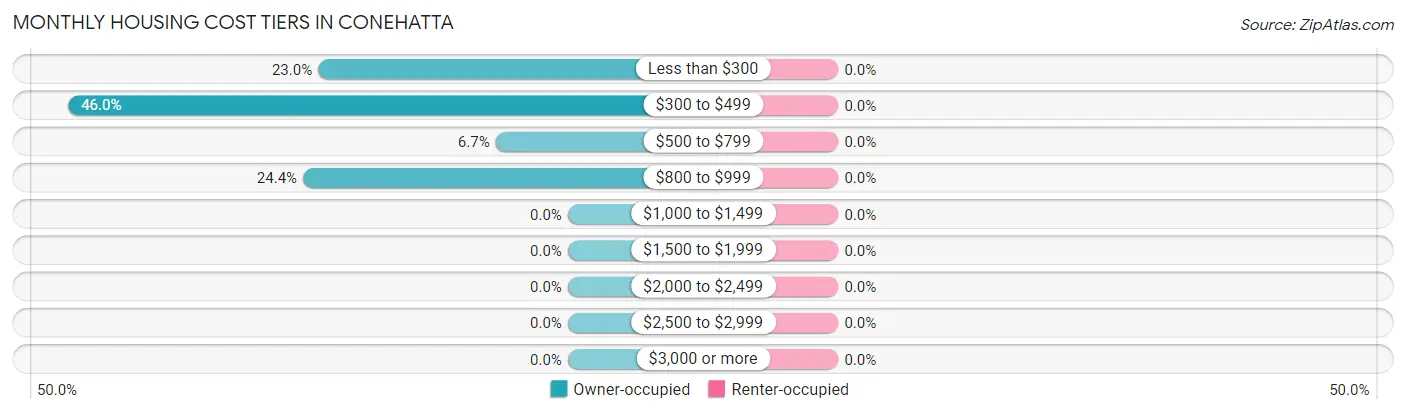
| Monthly Cost | Owner-occupied | Renter-occupied |
| Less than $300 | 83 (23.0%) | 0 (0.0%) |
| $300 to $499 | 166 (46.0%) | 0 (0.0%) |
| $500 to $799 | 24 (6.7%) | 0 (0.0%) |
| $800 to $999 | 88 (24.4%) | 0 (0.0%) |
| $1,000 to $1,499 | 0 (0.0%) | 0 (0.0%) |
| $1,500 to $1,999 | 0 (0.0%) | 0 (0.0%) |
| $2,000 to $2,499 | 0 (0.0%) | 0 (0.0%) |
| $2,500 to $2,999 | 0 (0.0%) | 0 (0.0%) |
| $3,000 or more | 0 (0.0%) | 0 (0.0%) |
| Total | 361 (100.0%) | 46 (100.0%) |
Physical Housing Characteristics in Conehatta
Housing Structures in Conehatta
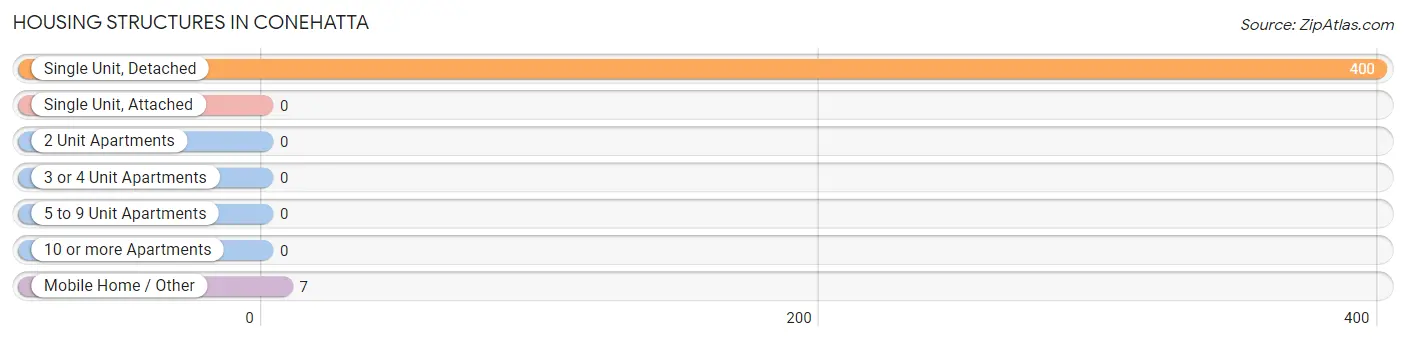
| Structure Type | # Housing Units | % Housing Units |
| Single Unit, Detached | 400 | 98.3% |
| Single Unit, Attached | 0 | 0.0% |
| 2 Unit Apartments | 0 | 0.0% |
| 3 or 4 Unit Apartments | 0 | 0.0% |
| 5 to 9 Unit Apartments | 0 | 0.0% |
| 10 or more Apartments | 0 | 0.0% |
| Mobile Home / Other | 7 | 1.7% |
| Total | 407 | 100.0% |
Housing Structures by Occupancy in Conehatta
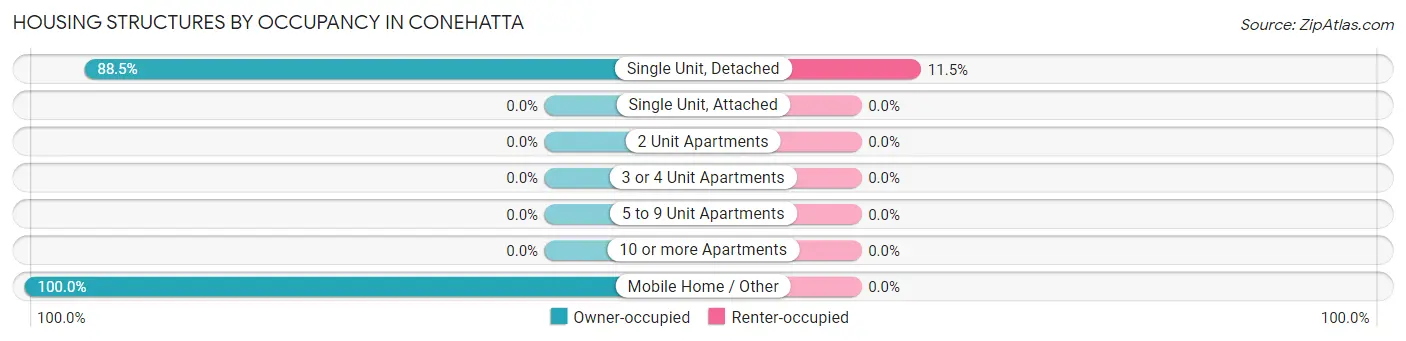
| Structure Type | Owner-occupied | Renter-occupied |
| Single Unit, Detached | 354 (88.5%) | 46 (11.5%) |
| Single Unit, Attached | 0 (0.0%) | 0 (0.0%) |
| 2 Unit Apartments | 0 (0.0%) | 0 (0.0%) |
| 3 or 4 Unit Apartments | 0 (0.0%) | 0 (0.0%) |
| 5 to 9 Unit Apartments | 0 (0.0%) | 0 (0.0%) |
| 10 or more Apartments | 0 (0.0%) | 0 (0.0%) |
| Mobile Home / Other | 7 (100.0%) | 0 (0.0%) |
| Total | 361 (88.7%) | 46 (11.3%) |
Housing Structures by Number of Rooms in Conehatta
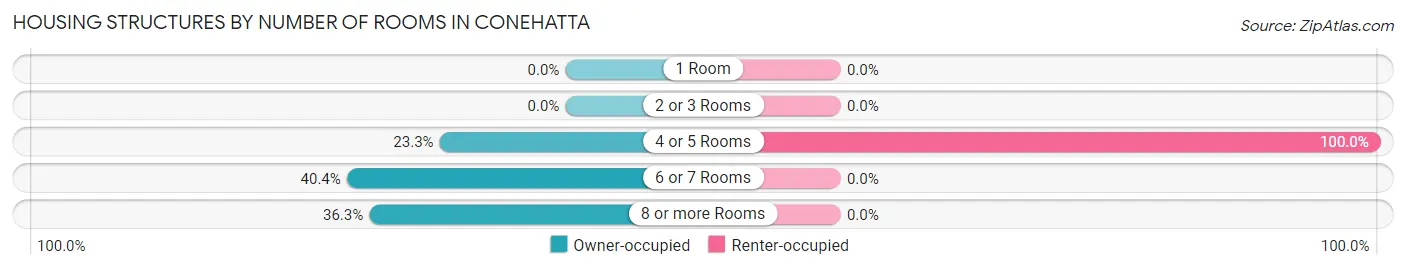
| Number of Rooms | Owner-occupied | Renter-occupied |
| 1 Room | 0 (0.0%) | 0 (0.0%) |
| 2 or 3 Rooms | 0 (0.0%) | 0 (0.0%) |
| 4 or 5 Rooms | 84 (23.3%) | 46 (100.0%) |
| 6 or 7 Rooms | 146 (40.4%) | 0 (0.0%) |
| 8 or more Rooms | 131 (36.3%) | 0 (0.0%) |
| Total | 361 (100.0%) | 46 (100.0%) |
Housing Structure by Heating Type in Conehatta
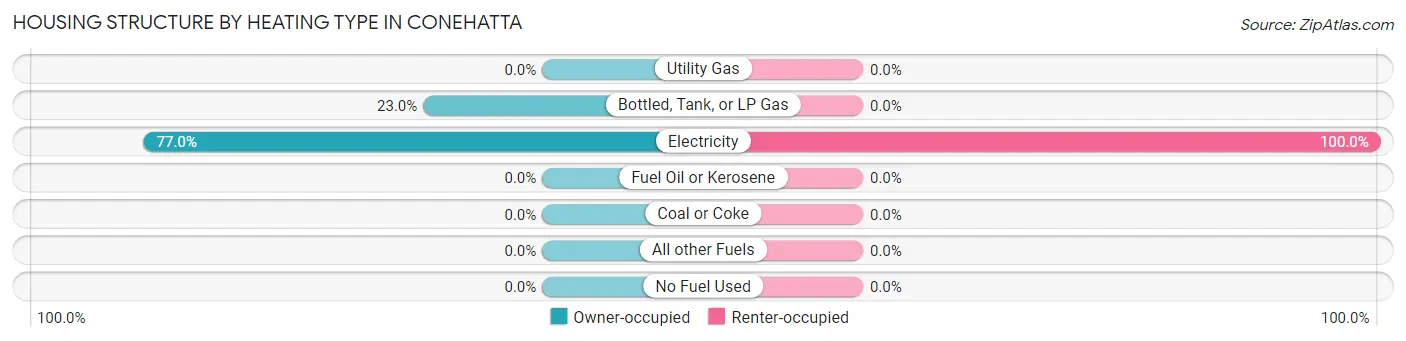
| Heating Type | Owner-occupied | Renter-occupied |
| Utility Gas | 0 (0.0%) | 0 (0.0%) |
| Bottled, Tank, or LP Gas | 83 (23.0%) | 0 (0.0%) |
| Electricity | 278 (77.0%) | 46 (100.0%) |
| Fuel Oil or Kerosene | 0 (0.0%) | 0 (0.0%) |
| Coal or Coke | 0 (0.0%) | 0 (0.0%) |
| All other Fuels | 0 (0.0%) | 0 (0.0%) |
| No Fuel Used | 0 (0.0%) | 0 (0.0%) |
| Total | 361 (100.0%) | 46 (100.0%) |
Household Vehicle Usage in Conehatta
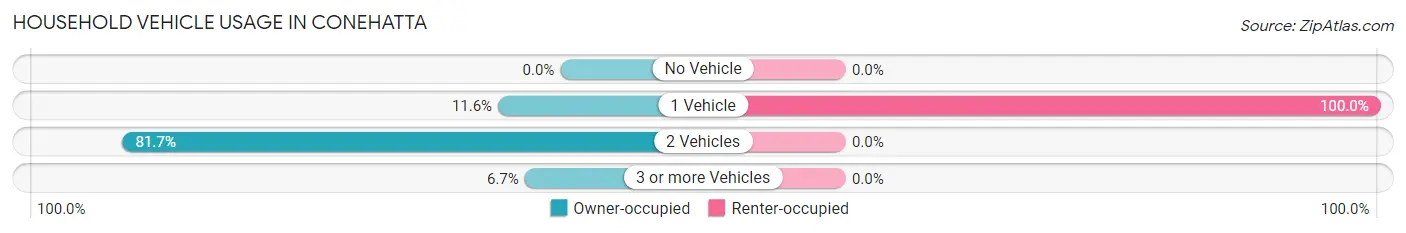
| Vehicles per Household | Owner-occupied | Renter-occupied |
| No Vehicle | 0 (0.0%) | 0 (0.0%) |
| 1 Vehicle | 42 (11.6%) | 46 (100.0%) |
| 2 Vehicles | 295 (81.7%) | 0 (0.0%) |
| 3 or more Vehicles | 24 (6.7%) | 0 (0.0%) |
| Total | 361 (100.0%) | 46 (100.0%) |
Real Estate & Mortgages in Conehatta
Real Estate and Mortgage Overview in Conehatta
| Characteristic | Without Mortgage | With Mortgage |
| Housing Units | 273 | 88 |
| Median Property Value | $111,400 | $0 |
| Median Household Income | $65,890 | $0 |
| Monthly Housing Costs | $372 | $0 |
| Real Estate Taxes | - | - |
Property Value by Mortgage Status in Conehatta
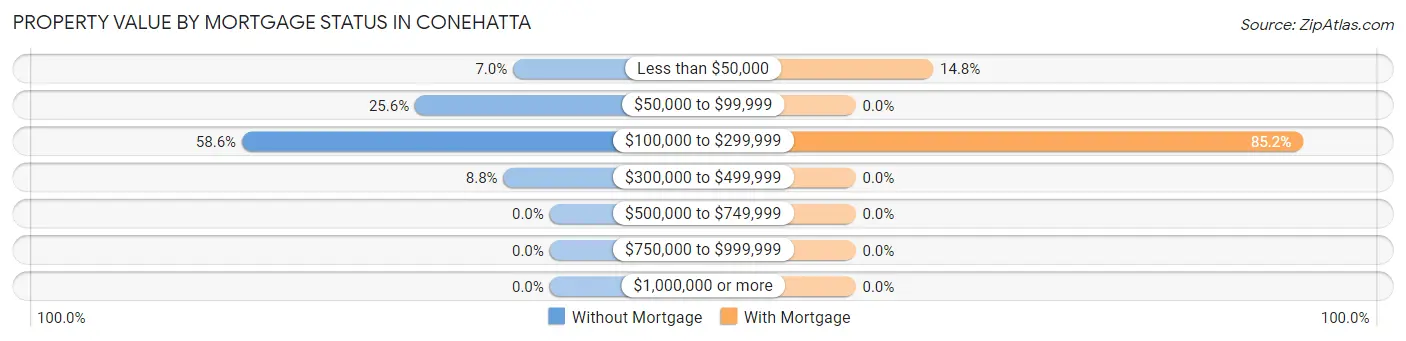
| Property Value | Without Mortgage | With Mortgage |
| Less than $50,000 | 19 (7.0%) | 13 (14.8%) |
| $50,000 to $99,999 | 70 (25.6%) | 0 (0.0%) |
| $100,000 to $299,999 | 160 (58.6%) | 75 (85.2%) |
| $300,000 to $499,999 | 24 (8.8%) | 0 (0.0%) |
| $500,000 to $749,999 | 0 (0.0%) | 0 (0.0%) |
| $750,000 to $999,999 | 0 (0.0%) | 0 (0.0%) |
| $1,000,000 or more | 0 (0.0%) | 0 (0.0%) |
| Total | 273 (100.0%) | 88 (100.0%) |
Household Income by Mortgage Status in Conehatta
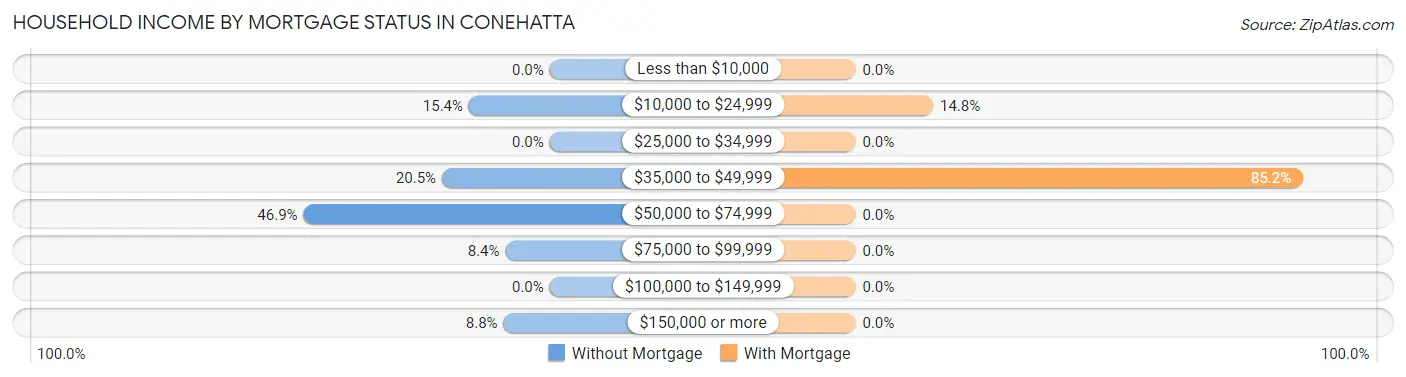
| Household Income | Without Mortgage | With Mortgage |
| Less than $10,000 | 0 (0.0%) | 0 (0.0%) |
| $10,000 to $24,999 | 42 (15.4%) | 13 (14.8%) |
| $25,000 to $34,999 | 0 (0.0%) | 0 (0.0%) |
| $35,000 to $49,999 | 56 (20.5%) | 75 (85.2%) |
| $50,000 to $74,999 | 128 (46.9%) | 0 (0.0%) |
| $75,000 to $99,999 | 23 (8.4%) | 0 (0.0%) |
| $100,000 to $149,999 | 0 (0.0%) | 0 (0.0%) |
| $150,000 or more | 24 (8.8%) | 0 (0.0%) |
| Total | 273 (100.0%) | 88 (100.0%) |
Property Value to Household Income Ratio in Conehatta
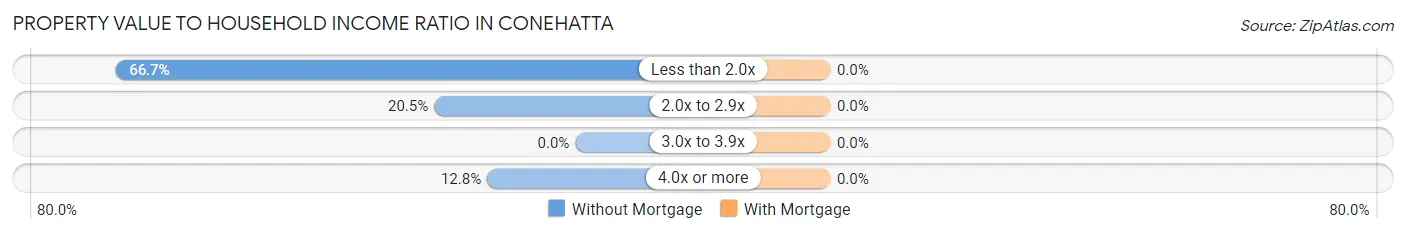
| Value-to-Income Ratio | Without Mortgage | With Mortgage |
| Less than 2.0x | 182 (66.7%) | 0 (0.0%) |
| 2.0x to 2.9x | 56 (20.5%) | 0 (0.0%) |
| 3.0x to 3.9x | 0 (0.0%) | 0 (0.0%) |
| 4.0x or more | 35 (12.8%) | 0 (0.0%) |
| Total | 273 (100.0%) | 88 (100.0%) |
Real Estate Taxes by Mortgage Status in Conehatta
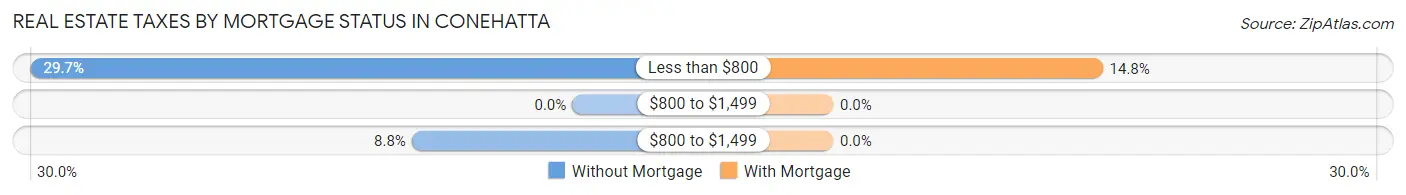
| Property Taxes | Without Mortgage | With Mortgage |
| Less than $800 | 81 (29.7%) | 13 (14.8%) |
| $800 to $1,499 | 0 (0.0%) | 0 (0.0%) |
| $800 to $1,499 | 24 (8.8%) | 0 (0.0%) |
| Total | 273 (100.0%) | 88 (100.0%) |
Health & Disability in Conehatta
Health Insurance Coverage by Age in Conehatta
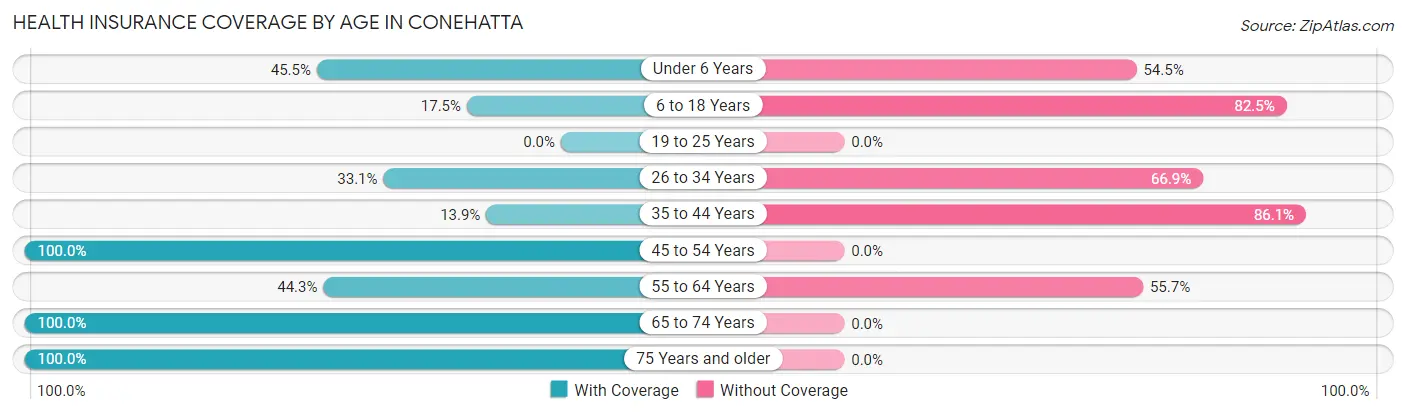
| Age Bracket | With Coverage | Without Coverage |
| Under 6 Years | 71 (45.5%) | 85 (54.5%) |
| 6 to 18 Years | 78 (17.5%) | 367 (82.5%) |
| 19 to 25 Years | 0 (0.0%) | 0 (0.0%) |
| 26 to 34 Years | 48 (33.1%) | 97 (66.9%) |
| 35 to 44 Years | 27 (13.9%) | 167 (86.1%) |
| 45 to 54 Years | 87 (100.0%) | 0 (0.0%) |
| 55 to 64 Years | 35 (44.3%) | 44 (55.7%) |
| 65 to 74 Years | 56 (100.0%) | 0 (0.0%) |
| 75 Years and older | 78 (100.0%) | 0 (0.0%) |
| Total | 480 (38.7%) | 760 (61.3%) |
Health Insurance Coverage by Citizenship Status in Conehatta
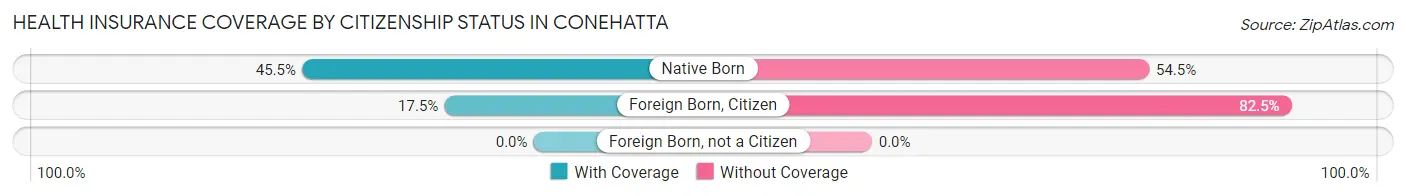
| Citizenship Status | With Coverage | Without Coverage |
| Native Born | 71 (45.5%) | 85 (54.5%) |
| Foreign Born, Citizen | 78 (17.5%) | 367 (82.5%) |
| Foreign Born, not a Citizen | 0 (0.0%) | 0 (0.0%) |
Health Insurance Coverage by Household Income in Conehatta
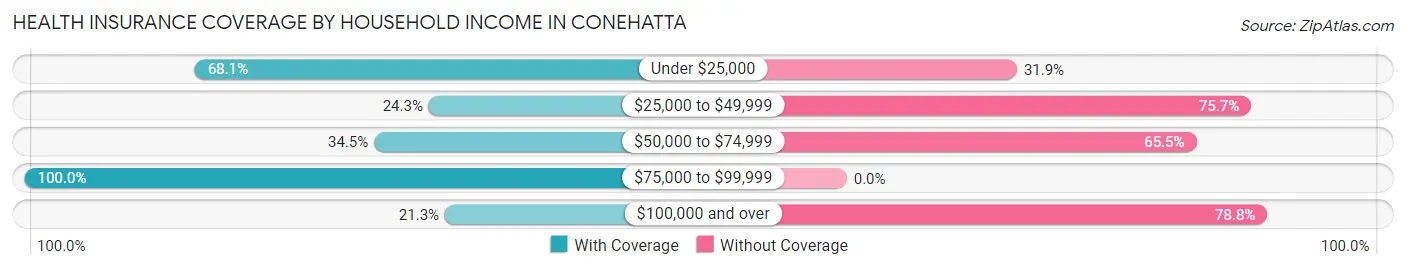
| Household Income | With Coverage | Without Coverage |
| Under $25,000 | 141 (68.1%) | 66 (31.9%) |
| $25,000 to $49,999 | 144 (24.3%) | 449 (75.7%) |
| $50,000 to $74,999 | 96 (34.5%) | 182 (65.5%) |
| $75,000 to $99,999 | 82 (100.0%) | 0 (0.0%) |
| $100,000 and over | 17 (21.2%) | 63 (78.7%) |
Public vs Private Health Insurance Coverage by Age in Conehatta
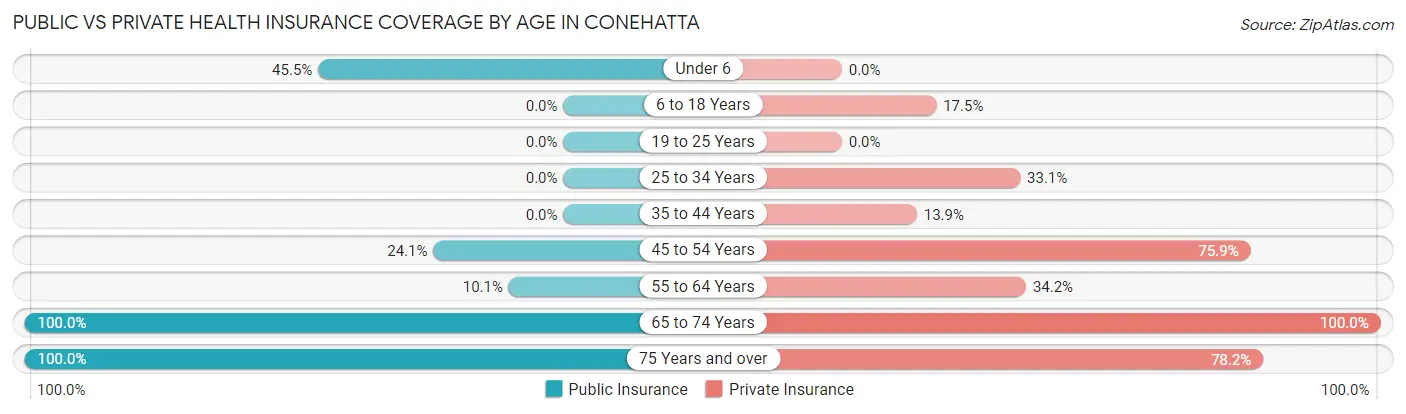
| Age Bracket | Public Insurance | Private Insurance |
| Under 6 | 71 (45.5%) | 0 (0.0%) |
| 6 to 18 Years | 0 (0.0%) | 78 (17.5%) |
| 19 to 25 Years | 0 (0.0%) | 0 (0.0%) |
| 25 to 34 Years | 0 (0.0%) | 48 (33.1%) |
| 35 to 44 Years | 0 (0.0%) | 27 (13.9%) |
| 45 to 54 Years | 21 (24.1%) | 66 (75.9%) |
| 55 to 64 Years | 8 (10.1%) | 27 (34.2%) |
| 65 to 74 Years | 56 (100.0%) | 56 (100.0%) |
| 75 Years and over | 78 (100.0%) | 61 (78.2%) |
| Total | 234 (18.9%) | 363 (29.3%) |
Disability Status by Sex by Age in Conehatta
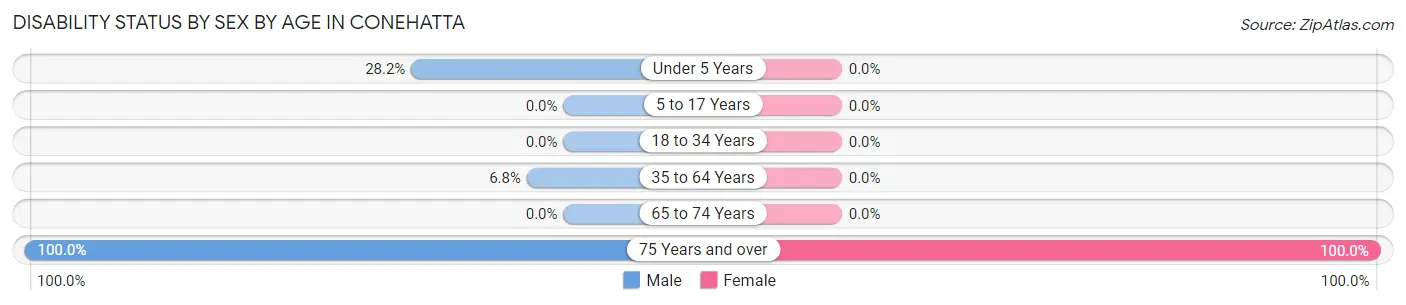
| Age Bracket | Male | Female |
| Under 5 Years | 24 (28.2%) | 0 (0.0%) |
| 5 to 17 Years | 0 (0.0%) | 0 (0.0%) |
| 18 to 34 Years | 0 (0.0%) | 0 (0.0%) |
| 35 to 64 Years | 8 (6.8%) | 0 (0.0%) |
| 65 to 74 Years | 0 (0.0%) | 0 (0.0%) |
| 75 Years and over | 14 (100.0%) | 64 (100.0%) |
Disability Class by Sex by Age in Conehatta
Disability Class: Hearing Difficulty
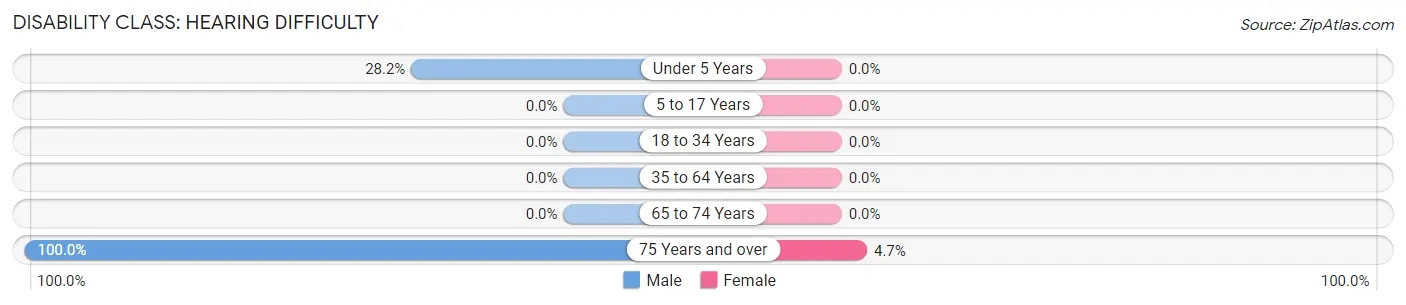
| Age Bracket | Male | Female |
| Under 5 Years | 24 (28.2%) | 0 (0.0%) |
| 5 to 17 Years | 0 (0.0%) | 0 (0.0%) |
| 18 to 34 Years | 0 (0.0%) | 0 (0.0%) |
| 35 to 64 Years | 0 (0.0%) | 0 (0.0%) |
| 65 to 74 Years | 0 (0.0%) | 0 (0.0%) |
| 75 Years and over | 14 (100.0%) | 3 (4.7%) |
Disability Class: Vision Difficulty
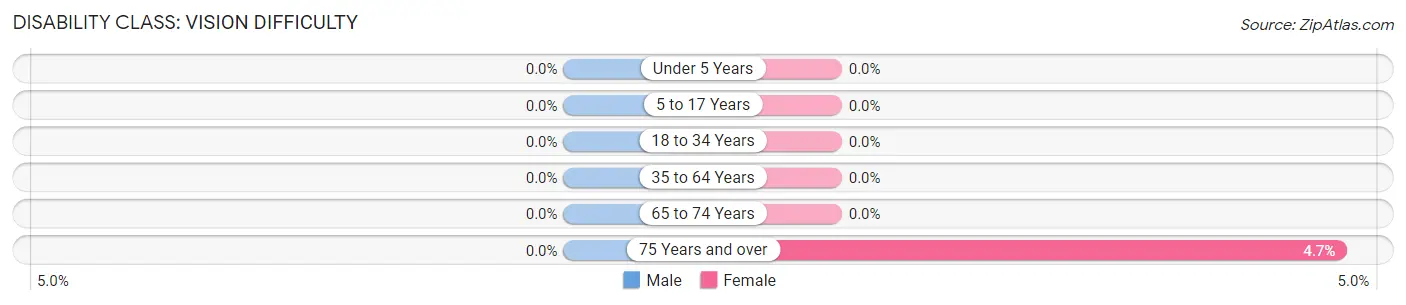
| Age Bracket | Male | Female |
| Under 5 Years | 0 (0.0%) | 0 (0.0%) |
| 5 to 17 Years | 0 (0.0%) | 0 (0.0%) |
| 18 to 34 Years | 0 (0.0%) | 0 (0.0%) |
| 35 to 64 Years | 0 (0.0%) | 0 (0.0%) |
| 65 to 74 Years | 0 (0.0%) | 0 (0.0%) |
| 75 Years and over | 0 (0.0%) | 3 (4.7%) |
Disability Class: Cognitive Difficulty
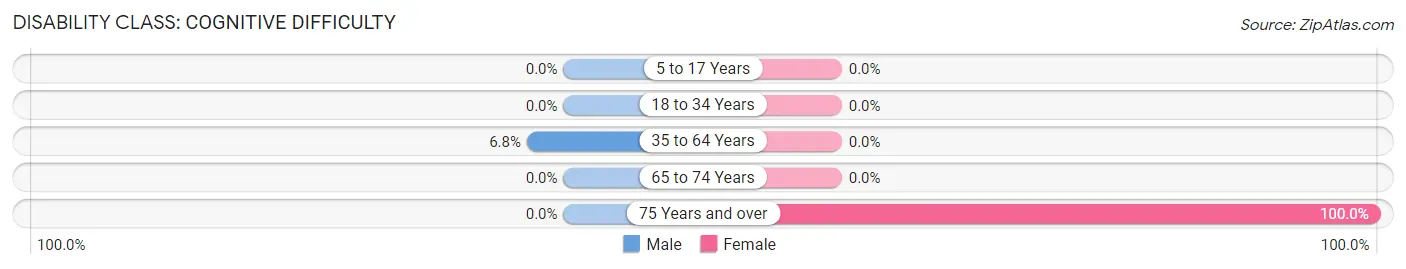
| Age Bracket | Male | Female |
| 5 to 17 Years | 0 (0.0%) | 0 (0.0%) |
| 18 to 34 Years | 0 (0.0%) | 0 (0.0%) |
| 35 to 64 Years | 8 (6.8%) | 0 (0.0%) |
| 65 to 74 Years | 0 (0.0%) | 0 (0.0%) |
| 75 Years and over | 0 (0.0%) | 64 (100.0%) |
Disability Class: Ambulatory Difficulty
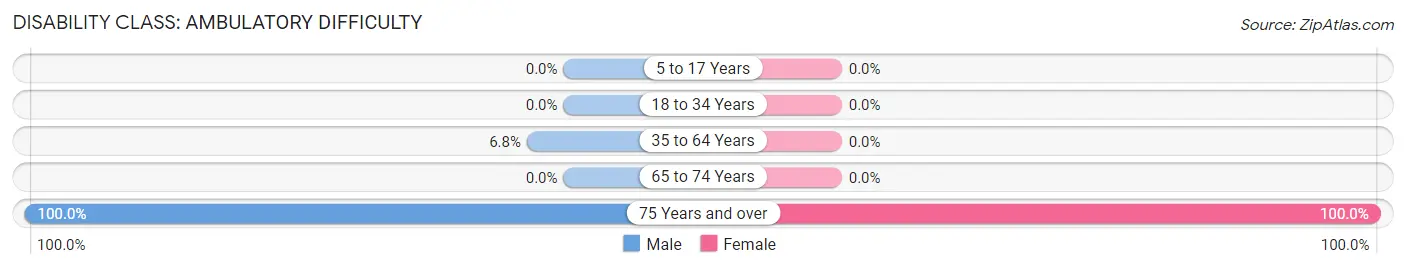
| Age Bracket | Male | Female |
| 5 to 17 Years | 0 (0.0%) | 0 (0.0%) |
| 18 to 34 Years | 0 (0.0%) | 0 (0.0%) |
| 35 to 64 Years | 8 (6.8%) | 0 (0.0%) |
| 65 to 74 Years | 0 (0.0%) | 0 (0.0%) |
| 75 Years and over | 14 (100.0%) | 64 (100.0%) |
Disability Class: Self-Care Difficulty
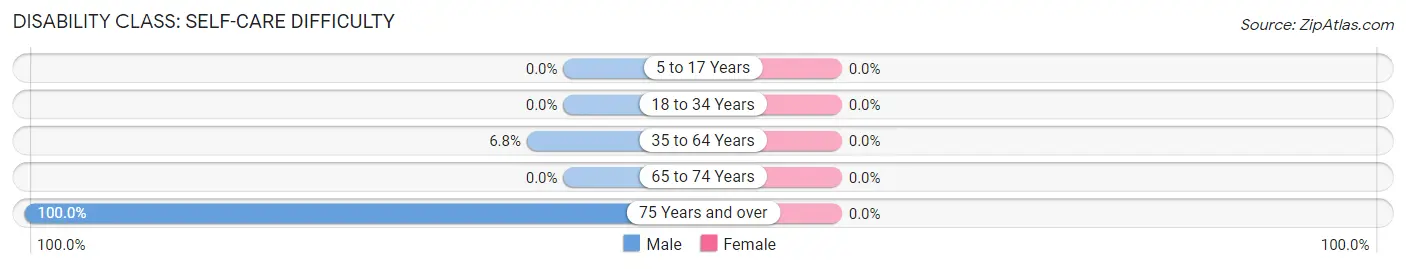
| Age Bracket | Male | Female |
| 5 to 17 Years | 0 (0.0%) | 0 (0.0%) |
| 18 to 34 Years | 0 (0.0%) | 0 (0.0%) |
| 35 to 64 Years | 8 (6.8%) | 0 (0.0%) |
| 65 to 74 Years | 0 (0.0%) | 0 (0.0%) |
| 75 Years and over | 14 (100.0%) | 0 (0.0%) |
Technology Access in Conehatta
Computing Device Access in Conehatta
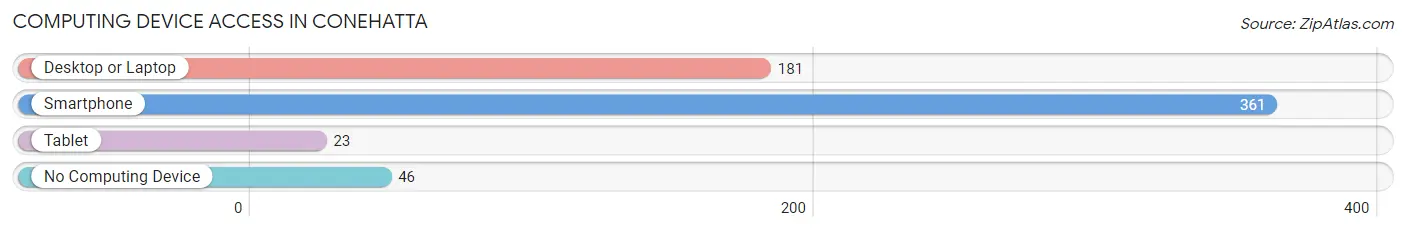
| Device Type | # Households | % Households |
| Desktop or Laptop | 181 | 44.5% |
| Smartphone | 361 | 88.7% |
| Tablet | 23 | 5.7% |
| No Computing Device | 46 | 11.3% |
| Total | 407 | 100.0% |
Internet Access in Conehatta
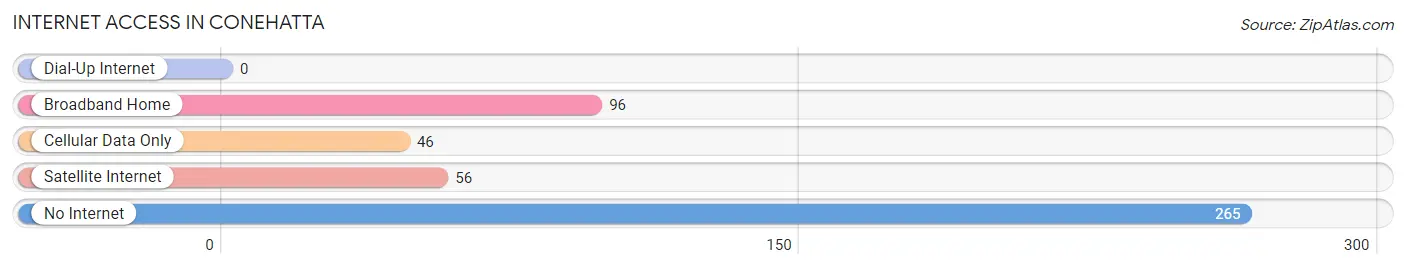
| Internet Type | # Households | % Households |
| Dial-Up Internet | 0 | 0.0% |
| Broadband Home | 96 | 23.6% |
| Cellular Data Only | 46 | 11.3% |
| Satellite Internet | 56 | 13.8% |
| No Internet | 265 | 65.1% |
| Total | 407 | 100.0% |
Conehatta Summary
Conehatta is a small unincorporated community located in Newton County, Mississippi. It is situated in the southeastern part of the state, approximately 20 miles south of Meridian and 40 miles east of Hattiesburg. The population of Conehatta was estimated to be around 500 in 2020.
History
Conehatta was founded in 1837 by a group of Choctaw Indians who had been relocated from their ancestral lands in the southeastern United States. The town was named after Chief Conehatta, a prominent Choctaw leader who had been instrumental in negotiating the Treaty of Dancing Rabbit Creek in 1830. The treaty had resulted in the Choctaw Nation ceding their lands in the southeastern United States to the United States government in exchange for land in what is now Oklahoma.
The town of Conehatta quickly grew and became a center of commerce for the Choctaw Nation. The town was home to a number of businesses, including a general store, a blacksmith shop, and a cotton gin. The town also had a post office, which was established in 1845.
In the late 19th century, Conehatta began to decline as the Choctaw Nation was forced to cede more of its land to the United States government. By the early 20th century, the town had become a small, rural community.
Geography
Conehatta is located in the southeastern part of Mississippi, approximately 20 miles south of Meridian and 40 miles east of Hattiesburg. The town is situated in the rolling hills of the Piney Woods region of the state. The terrain is mostly flat, with some areas of rolling hills. The town is located near the Chunky River, which flows through the area.
The climate in Conehatta is humid subtropical, with hot, humid summers and mild winters. The average annual temperature is around 70 degrees Fahrenheit, with average highs in the summer reaching into the mid-90s and average lows in the winter dipping into the mid-30s.
Economy
The economy of Conehatta is largely based on agriculture. The town is home to several farms, which produce a variety of crops, including cotton, corn, soybeans, and wheat. The town also has a number of small businesses, including a general store, a gas station, and a few restaurants.
Demographics
As of the 2010 census, the population of Conehatta was estimated to be around 500. The town is predominantly white, with a small African American population. The median household income in Conehatta is around $30,000, and the median home value is around $90,000. The town has a high rate of poverty, with around 30% of the population living below the poverty line.
Common Questions
What is Per Capita Income in Conehatta?
Per Capita income in Conehatta is $15,473.
What is the Median Family Income in Conehatta?
Median Family Income in Conehatta is $44,509.
What is the Median Household income in Conehatta?
Median Household Income in Conehatta is $43,728.
What is Income or Wage Gap in Conehatta?
Income or Wage Gap in Conehatta is 33.8%.
Women in Conehatta earn 66.2 cents for every dollar earned by a man.
What is Inequality or Gini Index in Conehatta?
Inequality or Gini Index in Conehatta is 0.44.
What is the Total Population of Conehatta?
Total Population of Conehatta is 1,240.
What is the Total Male Population of Conehatta?
Total Male Population of Conehatta is 733.
What is the Total Female Population of Conehatta?
Total Female Population of Conehatta is 507.
What is the Ratio of Males per 100 Females in Conehatta?
There are 144.58 Males per 100 Females in Conehatta.
What is the Ratio of Females per 100 Males in Conehatta?
There are 69.17 Females per 100 Males in Conehatta.
What is the Median Population Age in Conehatta?
Median Population Age in Conehatta is 29.4 Years.
What is the Average Family Size in Conehatta
Average Family Size in Conehatta is 3.2 People.
What is the Average Household Size in Conehatta
Average Household Size in Conehatta is 3.0 People.
How Large is the Labor Force in Conehatta?
There are 358 People in the Labor Forcein in Conehatta.
What is the Percentage of People in the Labor Force in Conehatta?
40.4% of People are in the Labor Force in Conehatta.