Vallecito, CA Map & Demographics
Vallecito Map
Vallecito Overview
$44,312
PER CAPITA INCOME
$88,333
AVG FAMILY INCOME
0.53
INEQUALITY / GINI INDEX
213
TOTAL POPULATION
80
MALE POPULATION
133
FEMALE POPULATION
60.15
MALES / 100 FEMALES
166.25
FEMALES / 100 MALES
65.8
MEDIAN AGE
1.9
AVG FAMILY SIZE
1.6
AVG HOUSEHOLD SIZE
96
LABOR FORCE [ PEOPLE ]
45.1%
PERCENT IN LABOR FORCE
Vallecito Zip Codes
Vallecito Area Codes
Income in Vallecito
Income Overview in Vallecito
| Characteristic | Number | Measure |
| Per Capita Income | 213 | $44,312 |
| Median Family Income | 86 | $88,333 |
| Mean Family Income | 86 | $105,171 |
| Median Household Income | 136 | $0 |
| Mean Household Income | 136 | $73,196 |
| Income Deficit | 86 | $0 |
| Wage / Income Gap (%) | 213 | 0.00% |
| Wage / Income Gap ($) | 213 | 100.00¢ per $1 |
| Gini / Inequality Index | 213 | 0.53 |
Earnings by Sex in Vallecito
| Sex | Number | Average Earnings |
| Male | 59 (54.6%) | $0 |
| Female | 49 (45.4%) | $0 |
| Total | 108 (100.0%) | $0 |
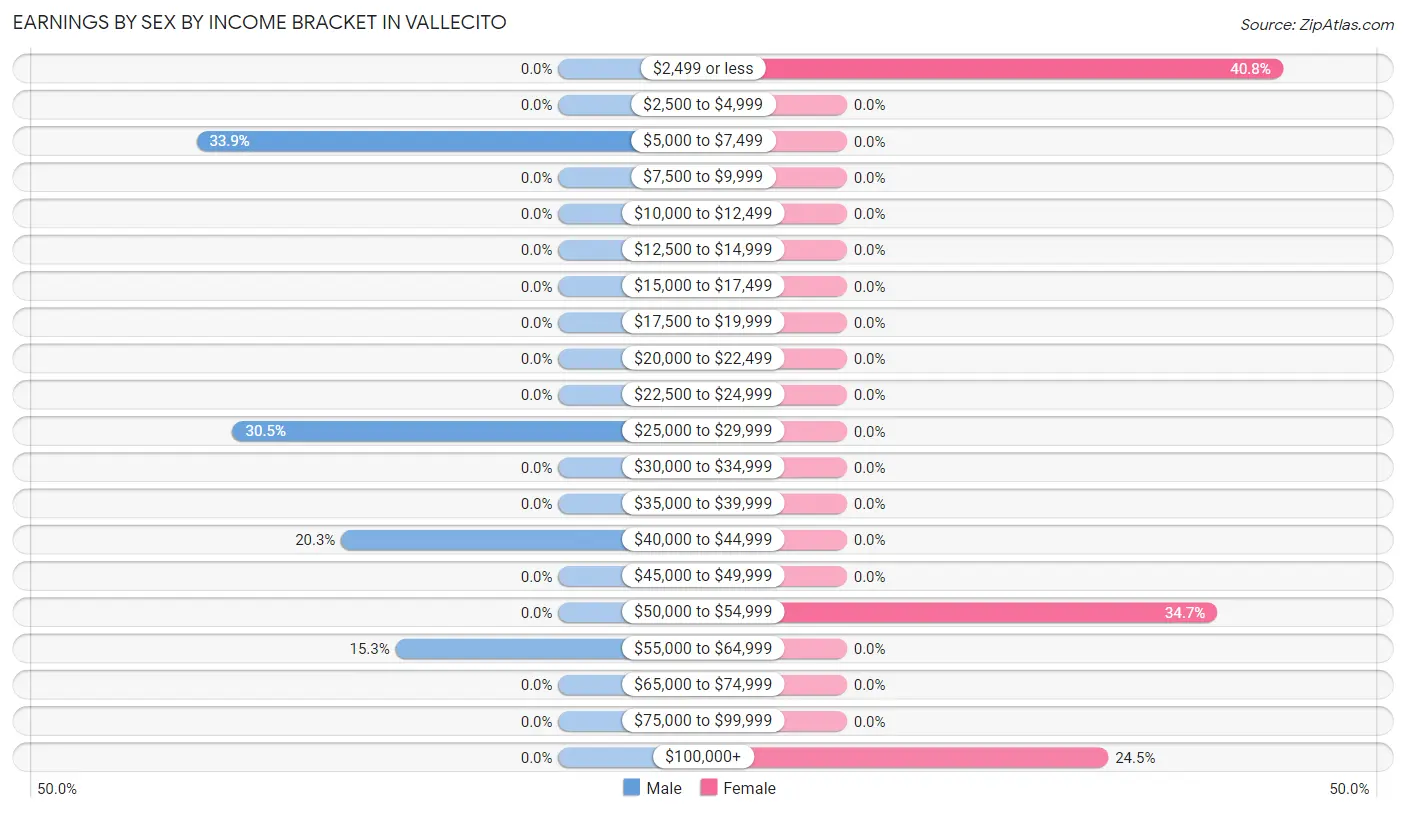
Earnings by Sex by Income Bracket in Vallecito
The most common earnings brackets in Vallecito are $5,000 to $7,499 for men (20 | 33.9%) and $2,499 or less for women (20 | 40.8%).
| Income | Male | Female |
| $2,499 or less | 0 (0.0%) | 20 (40.8%) |
| $2,500 to $4,999 | 0 (0.0%) | 0 (0.0%) |
| $5,000 to $7,499 | 20 (33.9%) | 0 (0.0%) |
| $7,500 to $9,999 | 0 (0.0%) | 0 (0.0%) |
| $10,000 to $12,499 | 0 (0.0%) | 0 (0.0%) |
| $12,500 to $14,999 | 0 (0.0%) | 0 (0.0%) |
| $15,000 to $17,499 | 0 (0.0%) | 0 (0.0%) |
| $17,500 to $19,999 | 0 (0.0%) | 0 (0.0%) |
| $20,000 to $22,499 | 0 (0.0%) | 0 (0.0%) |
| $22,500 to $24,999 | 0 (0.0%) | 0 (0.0%) |
| $25,000 to $29,999 | 18 (30.5%) | 0 (0.0%) |
| $30,000 to $34,999 | 0 (0.0%) | 0 (0.0%) |
| $35,000 to $39,999 | 0 (0.0%) | 0 (0.0%) |
| $40,000 to $44,999 | 12 (20.3%) | 0 (0.0%) |
| $45,000 to $49,999 | 0 (0.0%) | 0 (0.0%) |
| $50,000 to $54,999 | 0 (0.0%) | 17 (34.7%) |
| $55,000 to $64,999 | 9 (15.2%) | 0 (0.0%) |
| $65,000 to $74,999 | 0 (0.0%) | 0 (0.0%) |
| $75,000 to $99,999 | 0 (0.0%) | 0 (0.0%) |
| $100,000+ | 0 (0.0%) | 12 (24.5%) |
| Total | 59 (100.0%) | 49 (100.0%) |
Earnings by Sex by Educational Attainment in Vallecito
| Educational Attainment | Male Income | Female Income |
| Less than High School | - | - |
| High School Diploma | - | - |
| College or Associate's Degree | - | - |
| Bachelor's Degree | - | - |
| Graduate Degree | - | - |
| Total | - | - |
Family Income in Vallecito
Family Income Brackets in Vallecito
According to the Vallecito family income data, there are 21 families falling into the $75,000 to $99,999 income range, which is the most common income bracket and makes up 24.4% of all families.
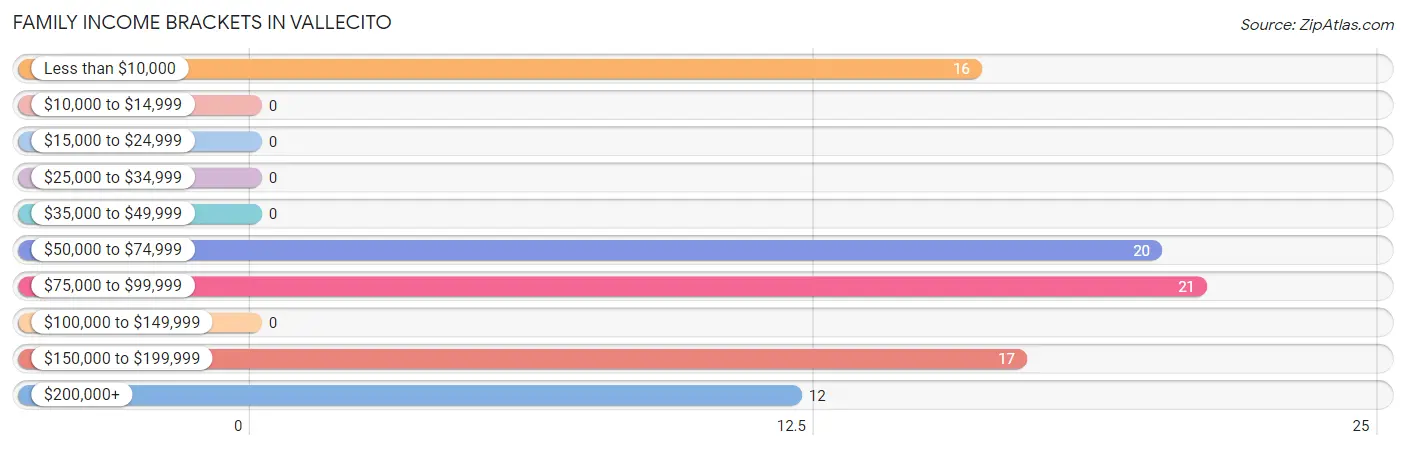
| Income Bracket | # Families | % Families |
| Less than $10,000 | 16 | 18.6% |
| $10,000 to $14,999 | 0 | 0.0% |
| $15,000 to $24,999 | 0 | 0.0% |
| $25,000 to $34,999 | 0 | 0.0% |
| $35,000 to $49,999 | 0 | 0.0% |
| $50,000 to $74,999 | 20 | 23.3% |
| $75,000 to $99,999 | 21 | 24.4% |
| $100,000 to $149,999 | 0 | 0.0% |
| $150,000 to $199,999 | 17 | 19.8% |
| $200,000+ | 12 | 14.0% |
Family Income by Famaliy Size in Vallecito
2-person families (86 | 100.0%) account for the highest median family income in Vallecito with $88,333 per family, while 2-person families (86 | 100.0%) have the highest median income of $44,166 per family member.
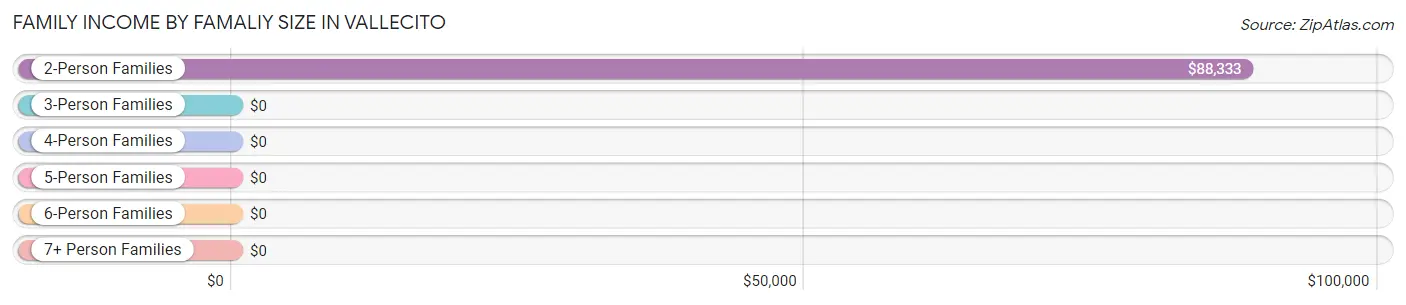
| Income Bracket | # Families | Median Income |
| 2-Person Families | 86 (100.0%) | $88,333 |
| 3-Person Families | 0 (0.0%) | $0 |
| 4-Person Families | 0 (0.0%) | $0 |
| 5-Person Families | 0 (0.0%) | $0 |
| 6-Person Families | 0 (0.0%) | $0 |
| 7+ Person Families | 0 (0.0%) | $0 |
| Total | 86 (100.0%) | $88,333 |
Family Income by Number of Earners in Vallecito
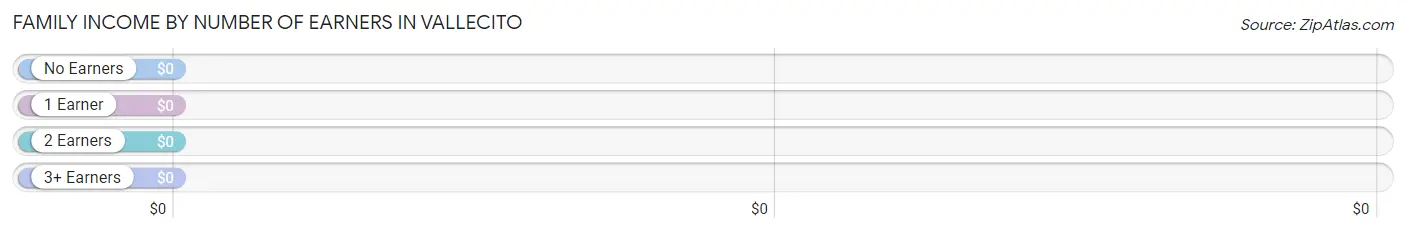
| Number of Earners | # Families | Median Income |
| No Earners | 21 (24.4%) | $0 |
| 1 Earner | 16 (18.6%) | $0 |
| 2 Earners | 49 (57.0%) | $0 |
| 3+ Earners | 0 (0.0%) | $0 |
| Total | 86 (100.0%) | $88,333 |
Household Income in Vallecito
Household Income Brackets in Vallecito
With 50 households falling in the category, the $15,000 to $24,999 income range is the most frequent in Vallecito, accounting for 36.8% of all households.
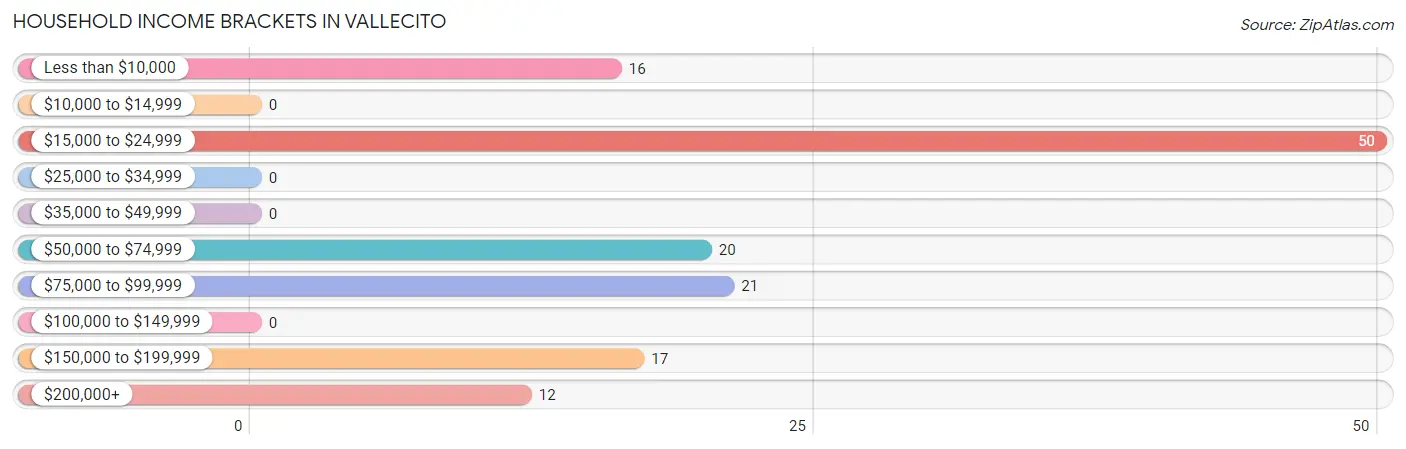
| Income Bracket | # Households | % Households |
| Less than $10,000 | 16 | 11.8% |
| $10,000 to $14,999 | 0 | 0.0% |
| $15,000 to $24,999 | 50 | 36.8% |
| $25,000 to $34,999 | 0 | 0.0% |
| $35,000 to $49,999 | 0 | 0.0% |
| $50,000 to $74,999 | 20 | 14.7% |
| $75,000 to $99,999 | 21 | 15.4% |
| $100,000 to $149,999 | 0 | 0.0% |
| $150,000 to $199,999 | 17 | 12.5% |
| $200,000+ | 12 | 8.8% |
Household Income by Householder Age in Vallecito
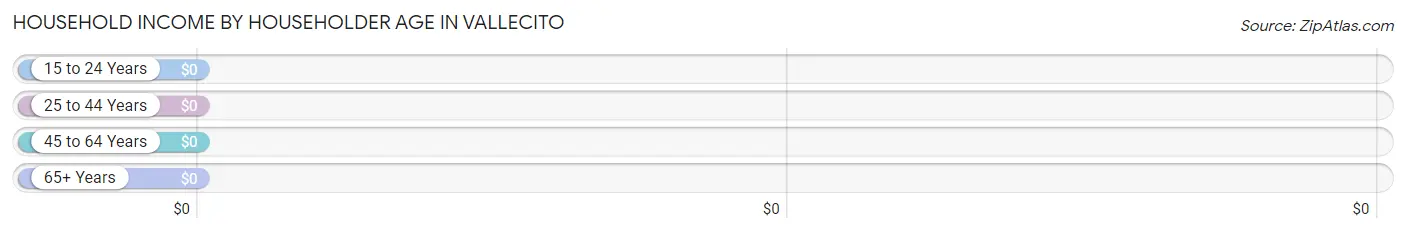
| Income Bracket | # Households | Median Income |
| 15 to 24 Years | 0 (0.0%) | $0 |
| 25 to 44 Years | 20 (14.7%) | $0 |
| 45 to 64 Years | 17 (12.5%) | $0 |
| 65+ Years | 99 (72.8%) | $0 |
| Total | 136 (100.0%) | $0 |
Poverty in Vallecito
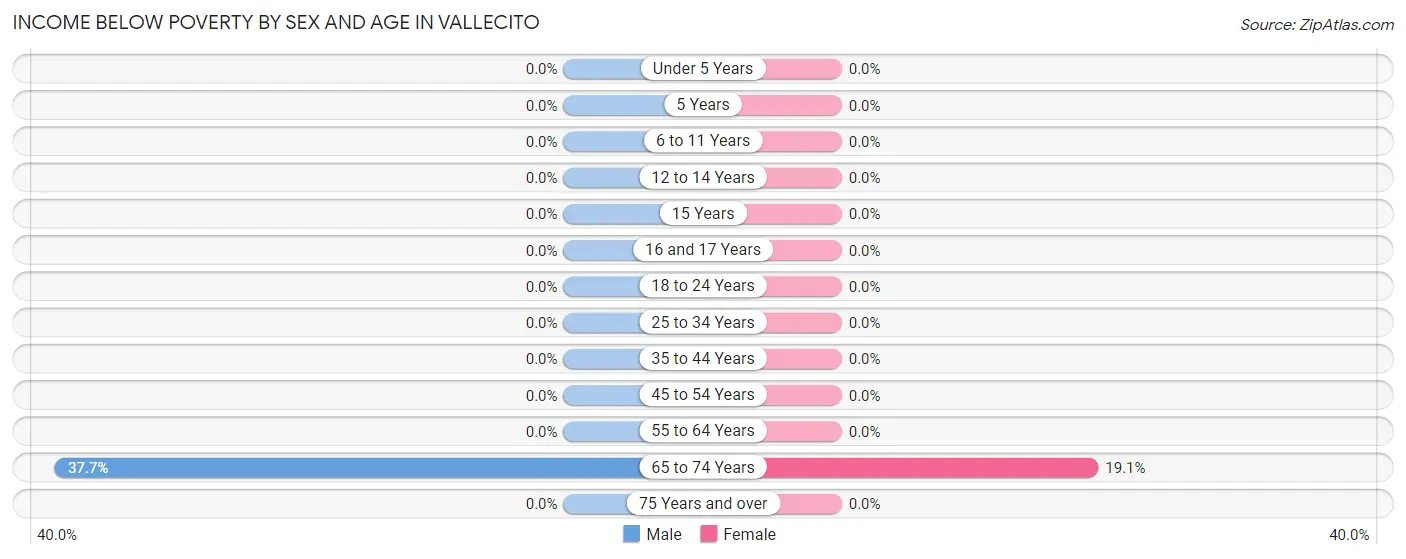
Income Below Poverty by Sex and Age in Vallecito
With 25.0% poverty level for males and 12.0% for females among the residents of Vallecito, 65 to 74 year old males and 65 to 74 year old females are the most vulnerable to poverty, with 20 males (37.7%) and 16 females (19.1%) in their respective age groups living below the poverty level.
| Age Bracket | Male | Female |
| Under 5 Years | 0 (0.0%) | 0 (0.0%) |
| 5 Years | 0 (0.0%) | 0 (0.0%) |
| 6 to 11 Years | 0 (0.0%) | 0 (0.0%) |
| 12 to 14 Years | 0 (0.0%) | 0 (0.0%) |
| 15 Years | 0 (0.0%) | 0 (0.0%) |
| 16 and 17 Years | 0 (0.0%) | 0 (0.0%) |
| 18 to 24 Years | 0 (0.0%) | 0 (0.0%) |
| 25 to 34 Years | 0 (0.0%) | 0 (0.0%) |
| 35 to 44 Years | 0 (0.0%) | 0 (0.0%) |
| 45 to 54 Years | 0 (0.0%) | 0 (0.0%) |
| 55 to 64 Years | 0 (0.0%) | 0 (0.0%) |
| 65 to 74 Years | 20 (37.7%) | 16 (19.1%) |
| 75 Years and over | 0 (0.0%) | 0 (0.0%) |
| Total | 20 (25.0%) | 16 (12.0%) |
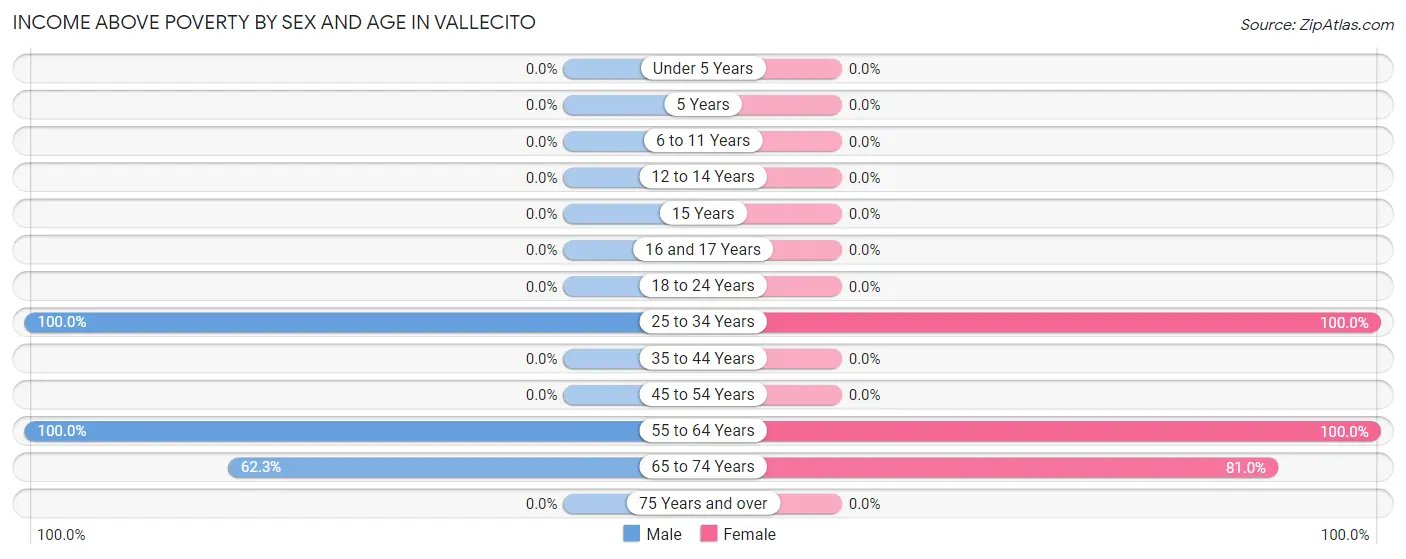
Income Above Poverty by Sex and Age in Vallecito
According to the poverty statistics in Vallecito, males aged 25 to 34 years and females aged 25 to 34 years are the age groups that are most secure financially, with 100.0% of males and 100.0% of females in these age groups living above the poverty line.
| Age Bracket | Male | Female |
| Under 5 Years | 0 (0.0%) | 0 (0.0%) |
| 5 Years | 0 (0.0%) | 0 (0.0%) |
| 6 to 11 Years | 0 (0.0%) | 0 (0.0%) |
| 12 to 14 Years | 0 (0.0%) | 0 (0.0%) |
| 15 Years | 0 (0.0%) | 0 (0.0%) |
| 16 and 17 Years | 0 (0.0%) | 0 (0.0%) |
| 18 to 24 Years | 0 (0.0%) | 0 (0.0%) |
| 25 to 34 Years | 9 (100.0%) | 20 (100.0%) |
| 35 to 44 Years | 0 (0.0%) | 0 (0.0%) |
| 45 to 54 Years | 0 (0.0%) | 0 (0.0%) |
| 55 to 64 Years | 18 (100.0%) | 29 (100.0%) |
| 65 to 74 Years | 33 (62.3%) | 68 (80.9%) |
| 75 Years and over | 0 (0.0%) | 0 (0.0%) |
| Total | 60 (75.0%) | 117 (88.0%) |
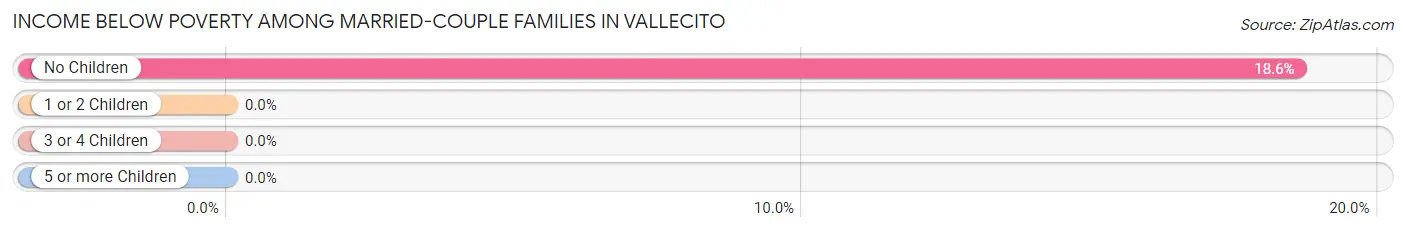
Income Below Poverty Among Married-Couple Families in Vallecito
The poverty statistics for married-couple families in Vallecito show that 18.6% or 16 of the total 86 families live below the poverty line. Families with no children have the highest poverty rate of 18.6%, comprising of 16 families. On the other hand, families with no children have the lowest poverty rate of 18.6%, which includes 16 families.
| Children | Above Poverty | Below Poverty |
| No Children | 70 (81.4%) | 16 (18.6%) |
| 1 or 2 Children | 0 (0.0%) | 0 (0.0%) |
| 3 or 4 Children | 0 (0.0%) | 0 (0.0%) |
| 5 or more Children | 0 (0.0%) | 0 (0.0%) |
| Total | 70 (81.4%) | 16 (18.6%) |
Income Below Poverty Among Single-Parent Households in Vallecito
| Children | Single Father | Single Mother |
| No Children | 0 (0.0%) | 0 (0.0%) |
| 1 or 2 Children | 0 (0.0%) | 0 (0.0%) |
| 3 or 4 Children | 0 (0.0%) | 0 (0.0%) |
| 5 or more Children | 0 (0.0%) | 0 (0.0%) |
| Total | 0 (0.0%) | 0 (0.0%) |
Income Below Poverty Among Married-Couple vs Single-Parent Households in Vallecito
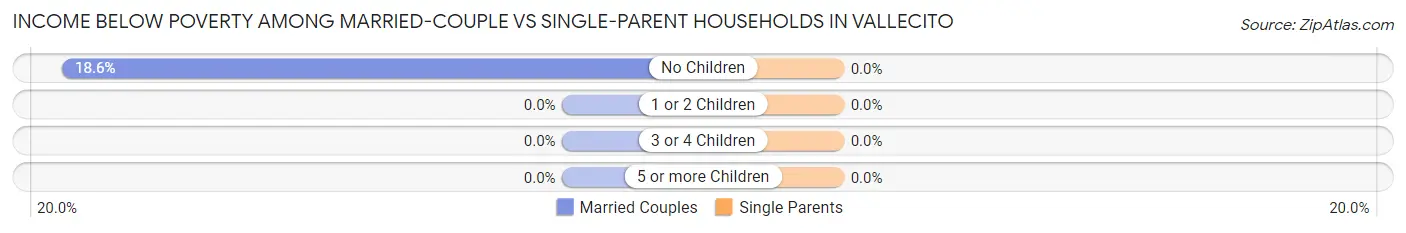
| Children | Married-Couple Families | Single-Parent Households |
| No Children | 16 (18.6%) | 0 (0.0%) |
| 1 or 2 Children | 0 (0.0%) | 0 (0.0%) |
| 3 or 4 Children | 0 (0.0%) | 0 (0.0%) |
| 5 or more Children | 0 (0.0%) | 0 (0.0%) |
| Total | 16 (18.6%) | 0 (0.0%) |
Race in Vallecito
The most populous races in Vallecito are , and White / Caucasian (213 | 100.0%).
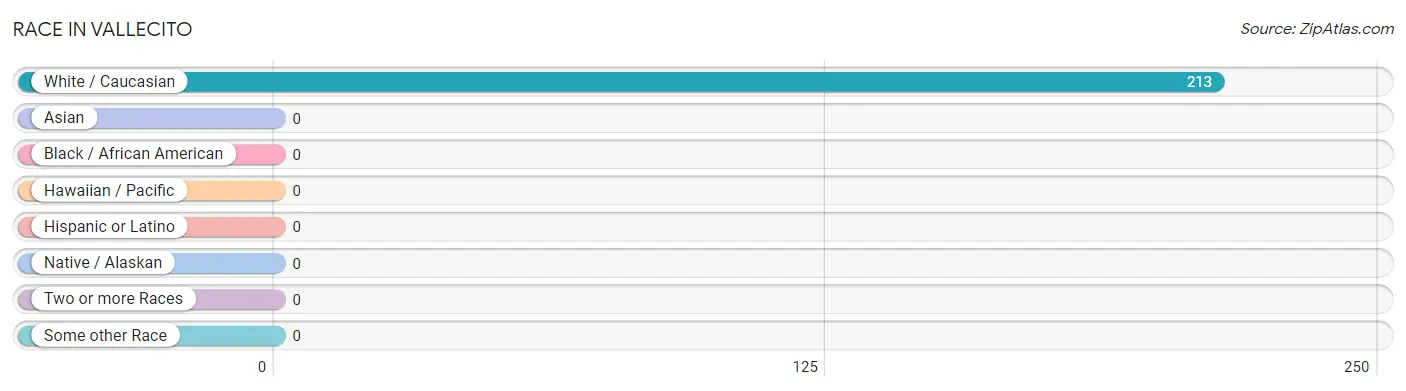
| Race | # Population | % Population |
| Asian | 0 | 0.0% |
| Black / African American | 0 | 0.0% |
| Hawaiian / Pacific | 0 | 0.0% |
| Hispanic or Latino | 0 | 0.0% |
| Native / Alaskan | 0 | 0.0% |
| White / Caucasian | 213 | 100.0% |
| Two or more Races | 0 | 0.0% |
| Some other Race | 0 | 0.0% |
| Total | 213 | 100.0% |
Ancestry in Vallecito
The most populous ancestries reported in Vallecito are Polish (50 | 23.5%), Irish (47 | 22.1%), English (39 | 18.3%), German (24 | 11.3%), and Scottish (12 | 5.6%), together accounting for 80.8% of all Vallecito residents.
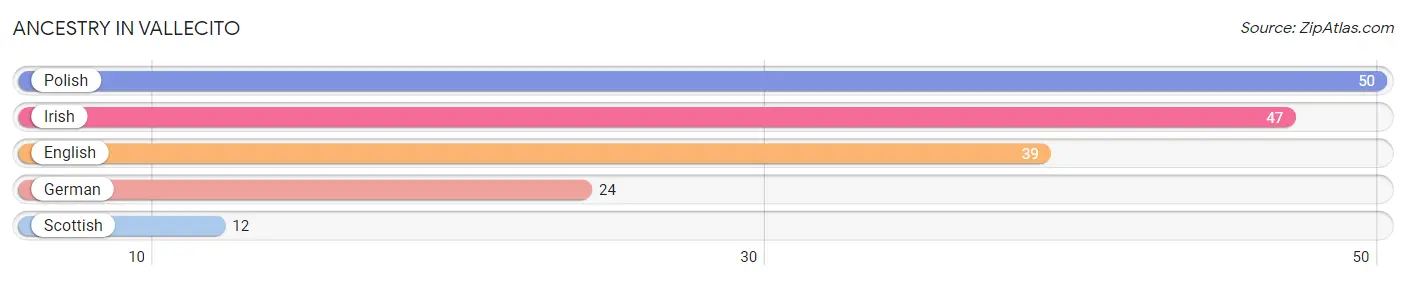
| Ancestry | # Population | % Population |
| English | 39 | 18.3% |
| German | 24 | 11.3% |
| Irish | 47 | 22.1% |
| Polish | 50 | 23.5% |
| Scottish | 12 | 5.6% | View All 5 Rows |
Immigrants in Vallecito

| Immigration Origin | # Population | % Population | View All 0 Rows |
Sex and Age in Vallecito
Sex and Age in Vallecito
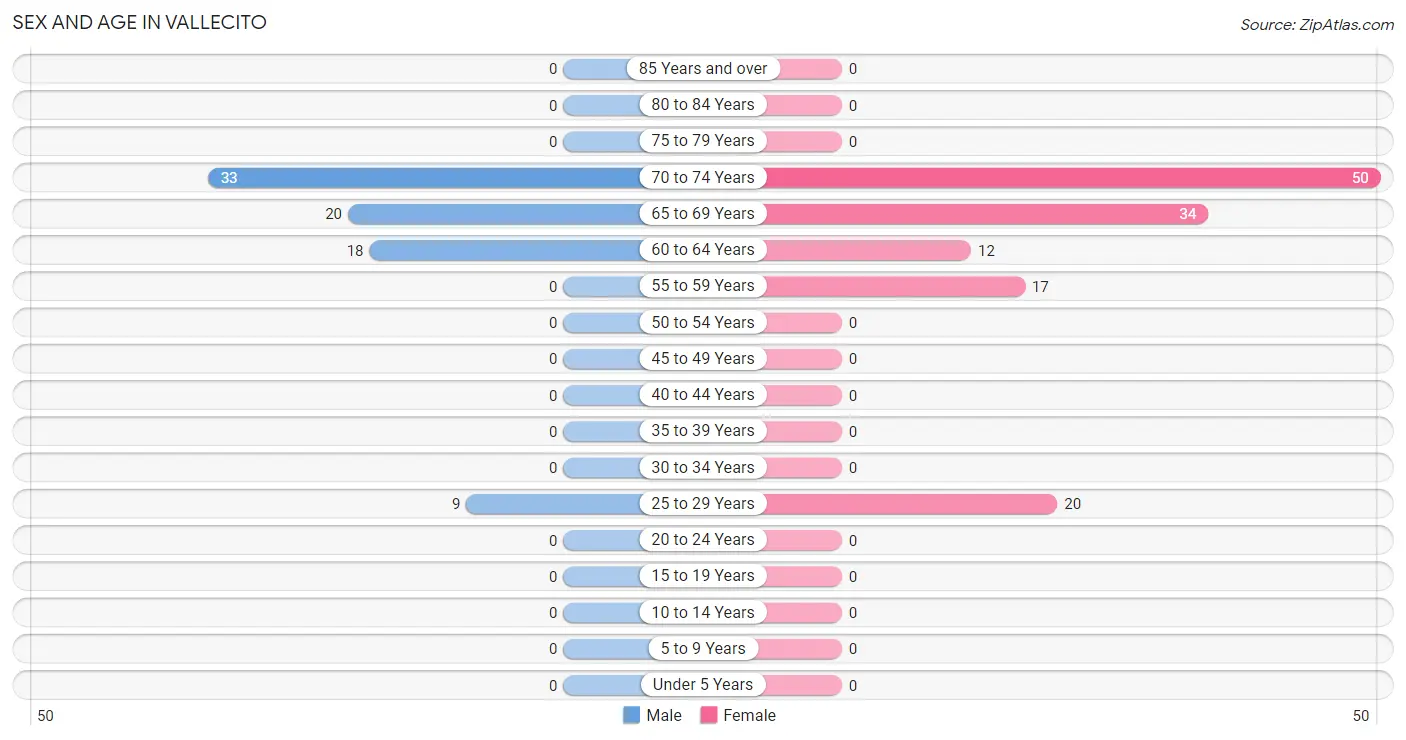
The most populous age groups in Vallecito are 70 to 74 Years (33 | 41.2%) for men and 70 to 74 Years (50 | 37.6%) for women.
| Age Bracket | Male | Female |
| Under 5 Years | 0 (0.0%) | 0 (0.0%) |
| 5 to 9 Years | 0 (0.0%) | 0 (0.0%) |
| 10 to 14 Years | 0 (0.0%) | 0 (0.0%) |
| 15 to 19 Years | 0 (0.0%) | 0 (0.0%) |
| 20 to 24 Years | 0 (0.0%) | 0 (0.0%) |
| 25 to 29 Years | 9 (11.3%) | 20 (15.0%) |
| 30 to 34 Years | 0 (0.0%) | 0 (0.0%) |
| 35 to 39 Years | 0 (0.0%) | 0 (0.0%) |
| 40 to 44 Years | 0 (0.0%) | 0 (0.0%) |
| 45 to 49 Years | 0 (0.0%) | 0 (0.0%) |
| 50 to 54 Years | 0 (0.0%) | 0 (0.0%) |
| 55 to 59 Years | 0 (0.0%) | 17 (12.8%) |
| 60 to 64 Years | 18 (22.5%) | 12 (9.0%) |
| 65 to 69 Years | 20 (25.0%) | 34 (25.6%) |
| 70 to 74 Years | 33 (41.2%) | 50 (37.6%) |
| 75 to 79 Years | 0 (0.0%) | 0 (0.0%) |
| 80 to 84 Years | 0 (0.0%) | 0 (0.0%) |
| 85 Years and over | 0 (0.0%) | 0 (0.0%) |
| Total | 80 (100.0%) | 133 (100.0%) |
Families and Households in Vallecito
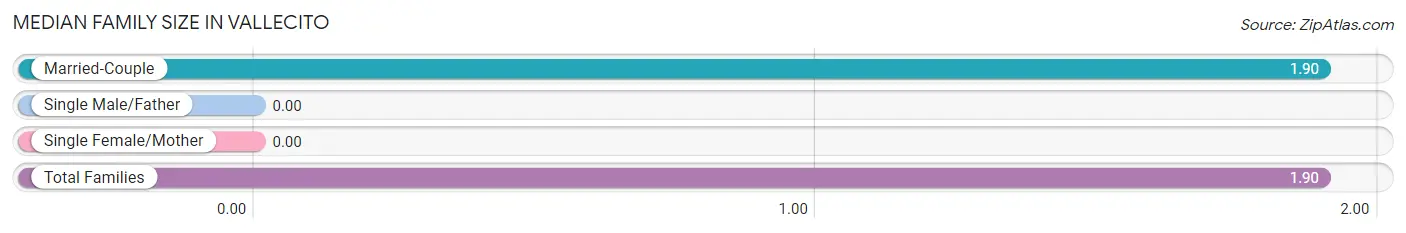
Median Family Size in Vallecito
| Family Type | # Families | Family Size |
| Married-Couple | 86 (100.0%) | 1.90 |
| Single Male/Father | 0 (0.0%) | - |
| Single Female/Mother | 0 (0.0%) | - |
| Total Families | 86 (100.0%) | 1.90 |
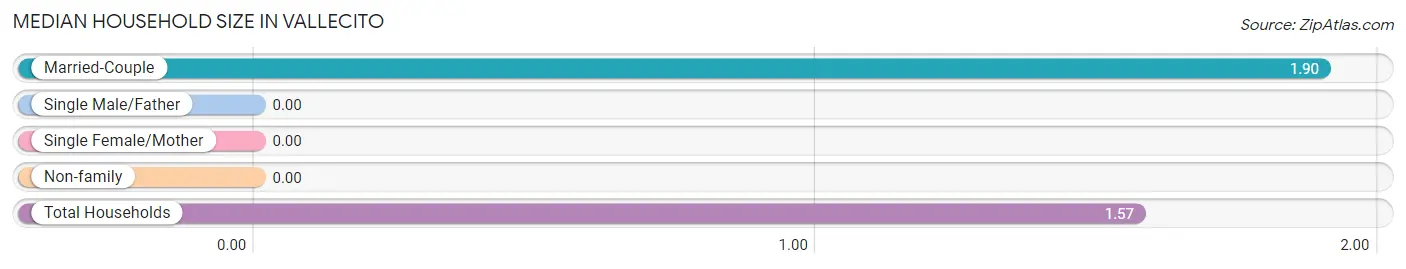
Median Household Size in Vallecito
| Household Type | # Households | Household Size |
| Married-Couple | 86 (63.2%) | 1.90 |
| Single Male/Father | 0 (0.0%) | - |
| Single Female/Mother | 0 (0.0%) | - |
| Non-family | 50 (36.8%) | - |
| Total Households | 136 (100.0%) | 1.57 |
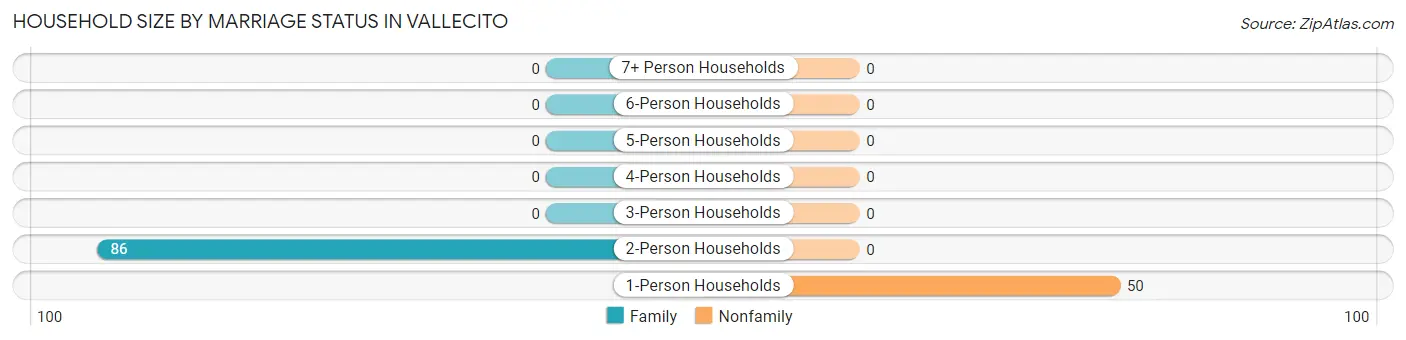
Household Size by Marriage Status in Vallecito
Out of a total of 136 households in Vallecito, 86 (63.2%) are family households, while 50 (36.8%) are nonfamily households. The most numerous type of family households are 2-person households, comprising 86, and the most common type of nonfamily households are 1-person households, comprising 50.
| Household Size | Family Households | Nonfamily Households |
| 1-Person Households | - | 50 (36.8%) |
| 2-Person Households | 86 (63.2%) | 0 (0.0%) |
| 3-Person Households | 0 (0.0%) | 0 (0.0%) |
| 4-Person Households | 0 (0.0%) | 0 (0.0%) |
| 5-Person Households | 0 (0.0%) | 0 (0.0%) |
| 6-Person Households | 0 (0.0%) | 0 (0.0%) |
| 7+ Person Households | 0 (0.0%) | 0 (0.0%) |
| Total | 86 (63.2%) | 50 (36.8%) |
Female Fertility in Vallecito
Fertility by Age in Vallecito
Average fertility rate in Vallecito is 1,000.0 births per 1,000 women. Women in the age bracket of 20 to 34 years have the highest fertility rate with 1,000.0 births per 1,000 women. Women in the age bracket of 20 to 34 years acount for 100.0% of all women with births.
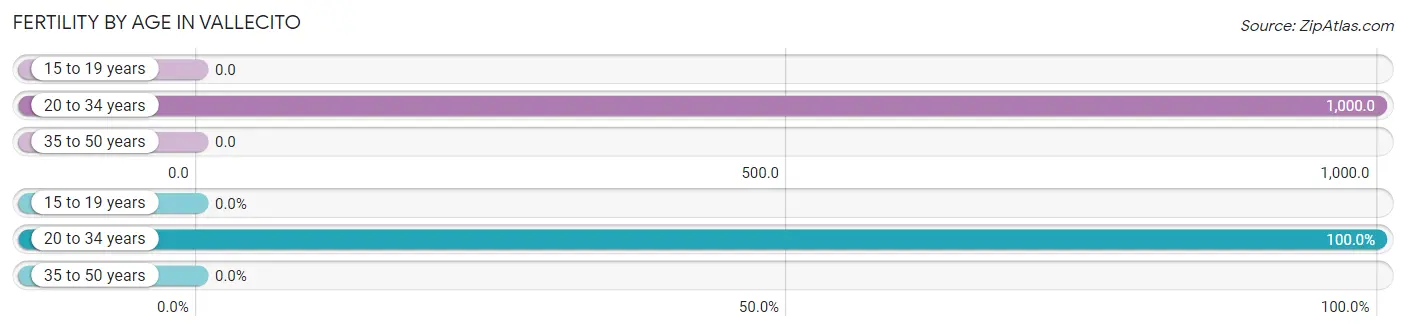
| Age Bracket | Women with Births | Births / 1,000 Women |
| 15 to 19 years | 0 (0.0%) | 0.0 |
| 20 to 34 years | 20 (100.0%) | 1,000.0 |
| 35 to 50 years | 0 (0.0%) | 0.0 |
| Total | 20 (100.0%) | 1,000.0 |
Fertility by Age by Marriage Status in Vallecito
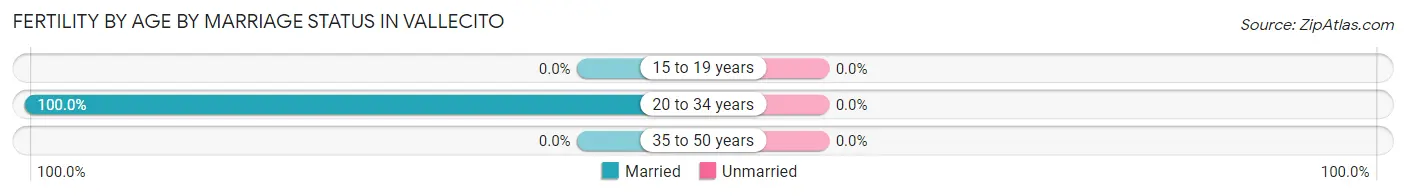
| Age Bracket | Married | Unmarried |
| 15 to 19 years | 0 (0.0%) | 0 (0.0%) |
| 20 to 34 years | 20 (100.0%) | 0 (0.0%) |
| 35 to 50 years | 0 (0.0%) | 0 (0.0%) |
| Total | 20 (100.0%) | 0 (0.0%) |
Fertility by Education in Vallecito
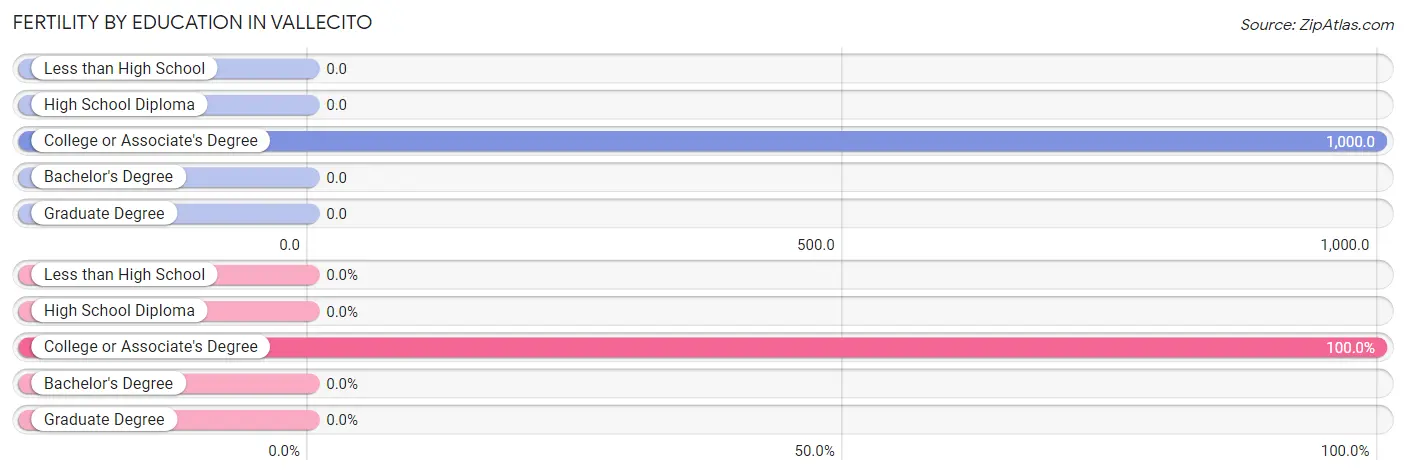
| Educational Attainment | Women with Births | Births / 1,000 Women |
| Less than High School | 0 (0.0%) | 0.0 |
| High School Diploma | 0 (0.0%) | 0.0 |
| College or Associate's Degree | 20 (100.0%) | 1,000.0 |
| Bachelor's Degree | 0 (0.0%) | 0.0 |
| Graduate Degree | 0 (0.0%) | 0.0 |
| Total | 20 (100.0%) | 1,000.0 |
Fertility by Education by Marriage Status in Vallecito
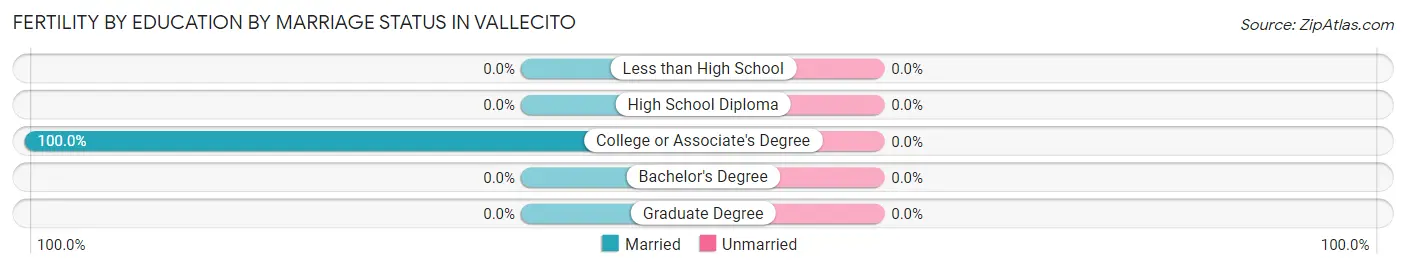
| Educational Attainment | Married | Unmarried |
| Less than High School | 0 (0.0%) | 0 (0.0%) |
| High School Diploma | 0 (0.0%) | 0 (0.0%) |
| College or Associate's Degree | 20 (100.0%) | 0 (0.0%) |
| Bachelor's Degree | 0 (0.0%) | 0 (0.0%) |
| Graduate Degree | 0 (0.0%) | 0 (0.0%) |
| Total | 20 (100.0%) | 0 (0.0%) |
Employment Characteristics in Vallecito
Employment by Class of Employer in Vallecito
Among the 96 employed individuals in Vallecito, private company employees (64 | 66.7%), self-employed (not incorporated) (20 | 20.8%), and not-for-profit organizations (12 | 12.5%) make up the most common classes of employment.
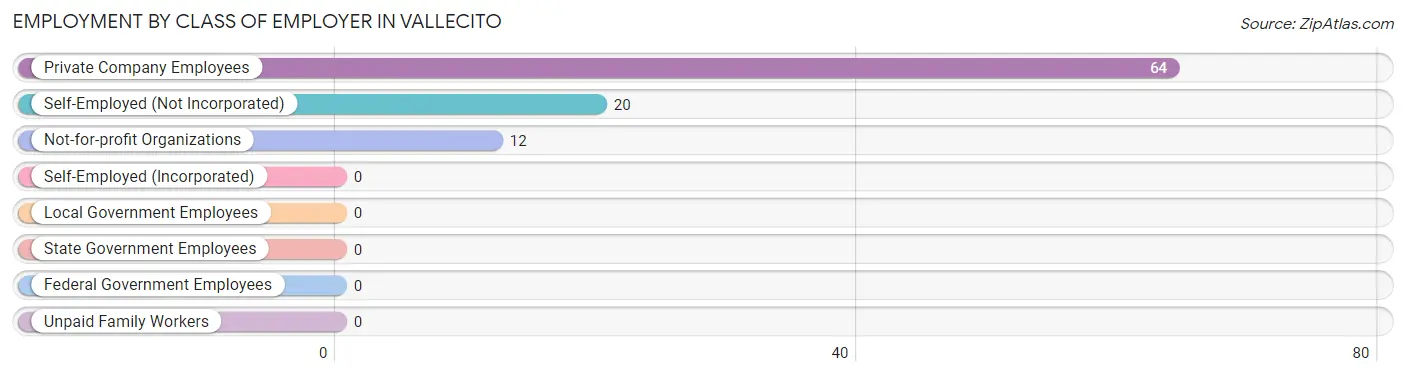
| Employer Class | # Employees | % Employees |
| Private Company Employees | 64 | 66.7% |
| Self-Employed (Incorporated) | 0 | 0.0% |
| Self-Employed (Not Incorporated) | 20 | 20.8% |
| Not-for-profit Organizations | 12 | 12.5% |
| Local Government Employees | 0 | 0.0% |
| State Government Employees | 0 | 0.0% |
| Federal Government Employees | 0 | 0.0% |
| Unpaid Family Workers | 0 | 0.0% |
| Total | 96 | 100.0% |
Employment Status by Age in Vallecito
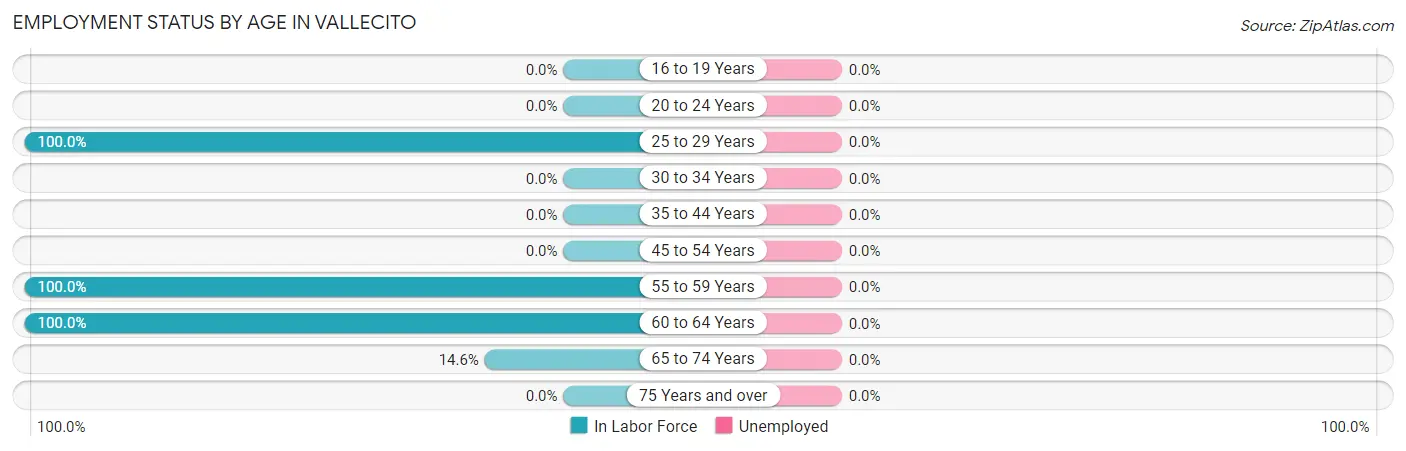
| Age Bracket | In Labor Force | Unemployed |
| 16 to 19 Years | 0 (0.0%) | 0 (0.0%) |
| 20 to 24 Years | 0 (0.0%) | 0 (0.0%) |
| 25 to 29 Years | 29 (100.0%) | 0 (0.0%) |
| 30 to 34 Years | 0 (0.0%) | 0 (0.0%) |
| 35 to 44 Years | 0 (0.0%) | 0 (0.0%) |
| 45 to 54 Years | 0 (0.0%) | 0 (0.0%) |
| 55 to 59 Years | 17 (100.0%) | 0 (0.0%) |
| 60 to 64 Years | 30 (100.0%) | 0 (0.0%) |
| 65 to 74 Years | 20 (14.6%) | 0 (0.0%) |
| 75 Years and over | 0 (0.0%) | 0 (0.0%) |
| Total | 96 (45.1%) | 0 (0.0%) |
Employment Status by Educational Attainment in Vallecito
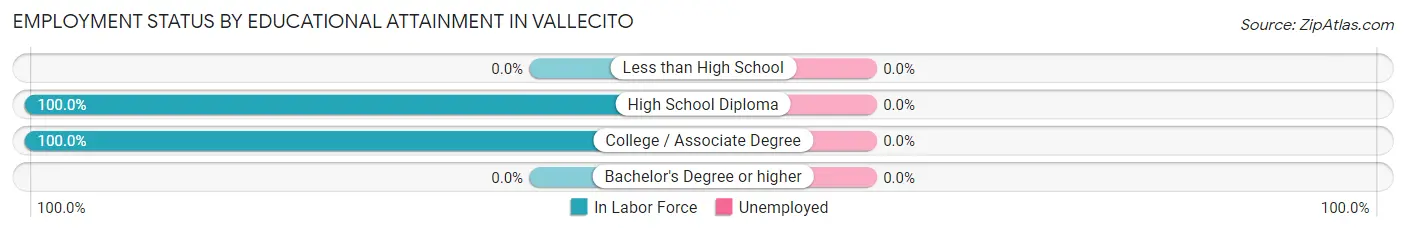
| Educational Attainment | In Labor Force | Unemployed |
| Less than High School | 0 (0.0%) | 0 (0.0%) |
| High School Diploma | 18 (100.0%) | 0 (0.0%) |
| College / Associate Degree | 58 (100.0%) | 0 (0.0%) |
| Bachelor's Degree or higher | 0 (0.0%) | 0 (0.0%) |
| Total | 76 (100.0%) | 0 (0.0%) |
Employment Occupations by Sex in Vallecito
Management, Business, Science and Arts Occupations
The most common Management, Business, Science and Arts occupations in Vallecito are Management (20 | 20.8%), Health Diagnosing & Treating (12 | 12.5%), and Health Technologists (12 | 12.5%).
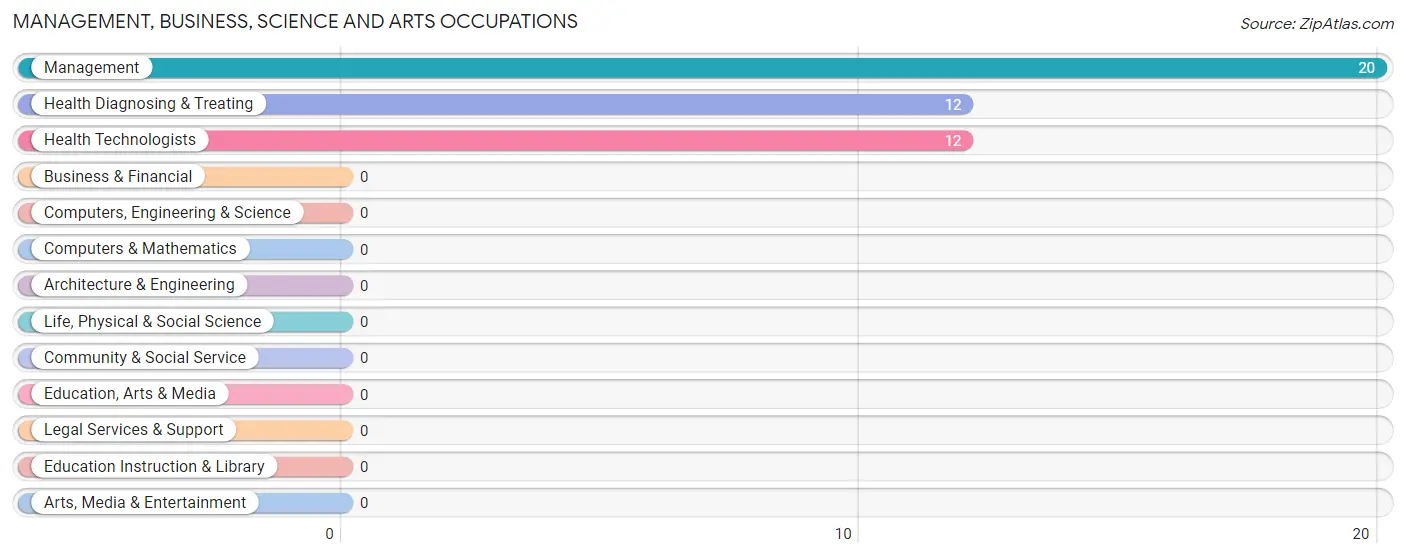
Management, Business, Science and Arts Occupations by Sex
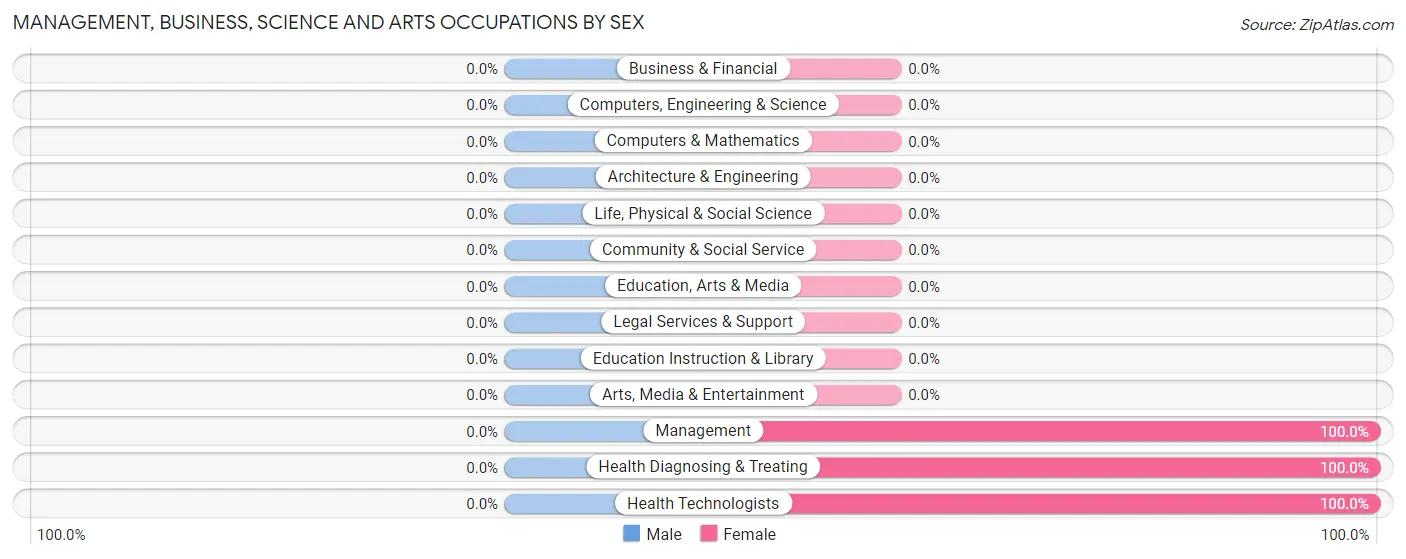
| Occupation | Male | Female |
| Management | 0 (0.0%) | 20 (100.0%) |
| Business & Financial | 0 (0.0%) | 0 (0.0%) |
| Computers, Engineering & Science | 0 (0.0%) | 0 (0.0%) |
| Computers & Mathematics | 0 (0.0%) | 0 (0.0%) |
| Architecture & Engineering | 0 (0.0%) | 0 (0.0%) |
| Life, Physical & Social Science | 0 (0.0%) | 0 (0.0%) |
| Community & Social Service | 0 (0.0%) | 0 (0.0%) |
| Education, Arts & Media | 0 (0.0%) | 0 (0.0%) |
| Legal Services & Support | 0 (0.0%) | 0 (0.0%) |
| Education Instruction & Library | 0 (0.0%) | 0 (0.0%) |
| Arts, Media & Entertainment | 0 (0.0%) | 0 (0.0%) |
| Health Diagnosing & Treating | 0 (0.0%) | 12 (100.0%) |
| Health Technologists | 0 (0.0%) | 12 (100.0%) |
| Total (Category) | 0 (0.0%) | 32 (100.0%) |
| Total (Overall) | 47 (49.0%) | 49 (51.0%) |
Services Occupations
Services Occupations by Sex
| Occupation | Male | Female |
| Healthcare Support | 0 (0.0%) | 0 (0.0%) |
| Security & Protection | 0 (0.0%) | 0 (0.0%) |
| Firefighting & Prevention | 0 (0.0%) | 0 (0.0%) |
| Law Enforcement | 0 (0.0%) | 0 (0.0%) |
| Food Preparation & Serving | 0 (0.0%) | 0 (0.0%) |
| Cleaning & Maintenance | 0 (0.0%) | 0 (0.0%) |
| Personal Care & Service | 0 (0.0%) | 0 (0.0%) |
| Total (Category) | 0 (0.0%) | 0 (0.0%) |
| Total (Overall) | 47 (49.0%) | 49 (51.0%) |
Sales and Office Occupations
The most common Sales and Office occupations in Vallecito are , and Sales & Related (26 | 27.1%).
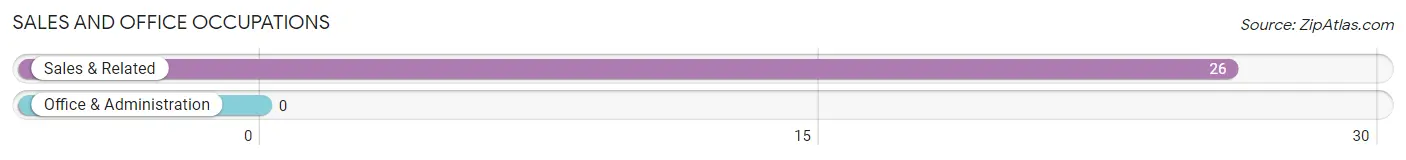
Sales and Office Occupations by Sex
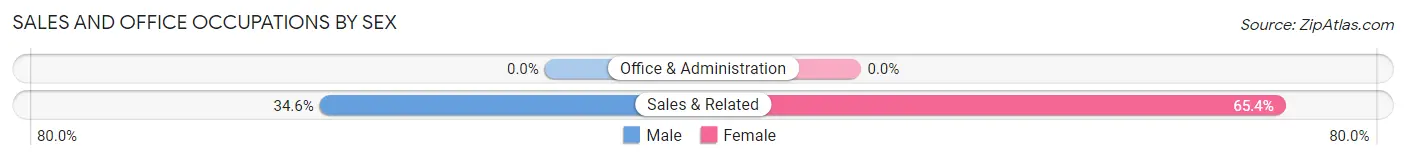
| Occupation | Male | Female |
| Sales & Related | 9 (34.6%) | 17 (65.4%) |
| Office & Administration | 0 (0.0%) | 0 (0.0%) |
| Total (Category) | 9 (34.6%) | 17 (65.4%) |
| Total (Overall) | 47 (49.0%) | 49 (51.0%) |
Natural Resources, Construction and Maintenance Occupations
The most common Natural Resources, Construction and Maintenance occupations in Vallecito are , and Construction & Extraction (20 | 20.8%).
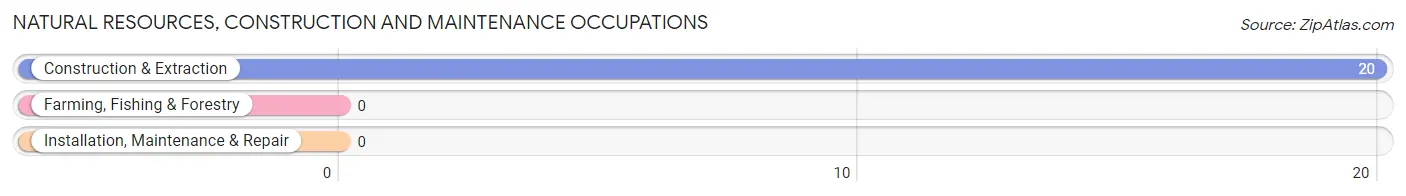
Natural Resources, Construction and Maintenance Occupations by Sex
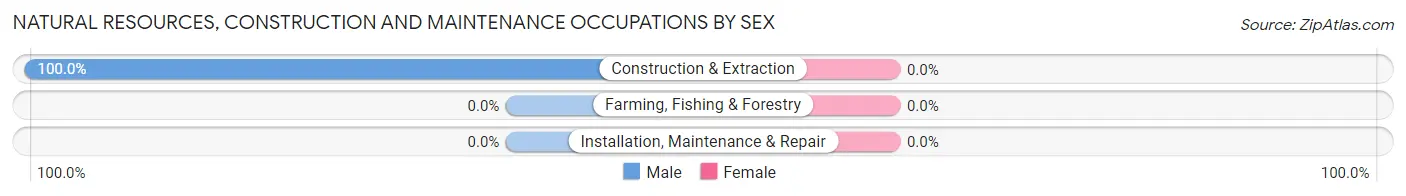
| Occupation | Male | Female |
| Farming, Fishing & Forestry | 0 (0.0%) | 0 (0.0%) |
| Construction & Extraction | 20 (100.0%) | 0 (0.0%) |
| Installation, Maintenance & Repair | 0 (0.0%) | 0 (0.0%) |
| Total (Category) | 20 (100.0%) | 0 (0.0%) |
| Total (Overall) | 47 (49.0%) | 49 (51.0%) |
Production, Transportation and Moving Occupations
The most common Production, Transportation and Moving occupations in Vallecito are , and Transportation (18 | 18.8%).
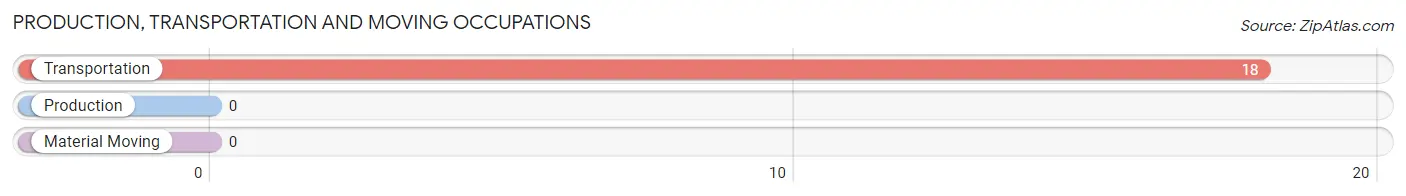
Production, Transportation and Moving Occupations by Sex
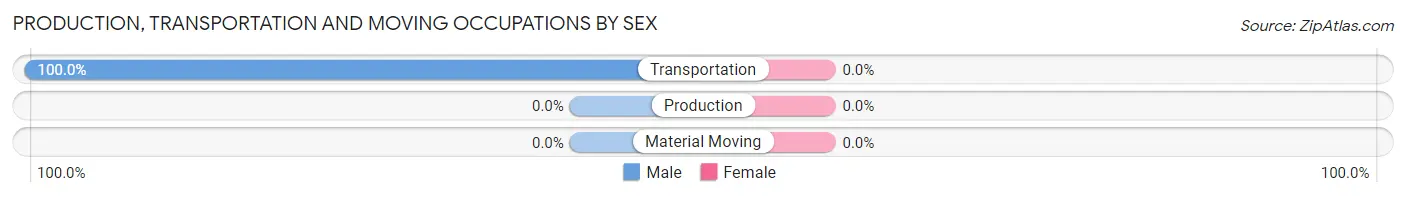
| Occupation | Male | Female |
| Production | 0 (0.0%) | 0 (0.0%) |
| Transportation | 18 (100.0%) | 0 (0.0%) |
| Material Moving | 0 (0.0%) | 0 (0.0%) |
| Total (Category) | 18 (100.0%) | 0 (0.0%) |
| Total (Overall) | 47 (49.0%) | 49 (51.0%) |
Employment Industries by Sex in Vallecito
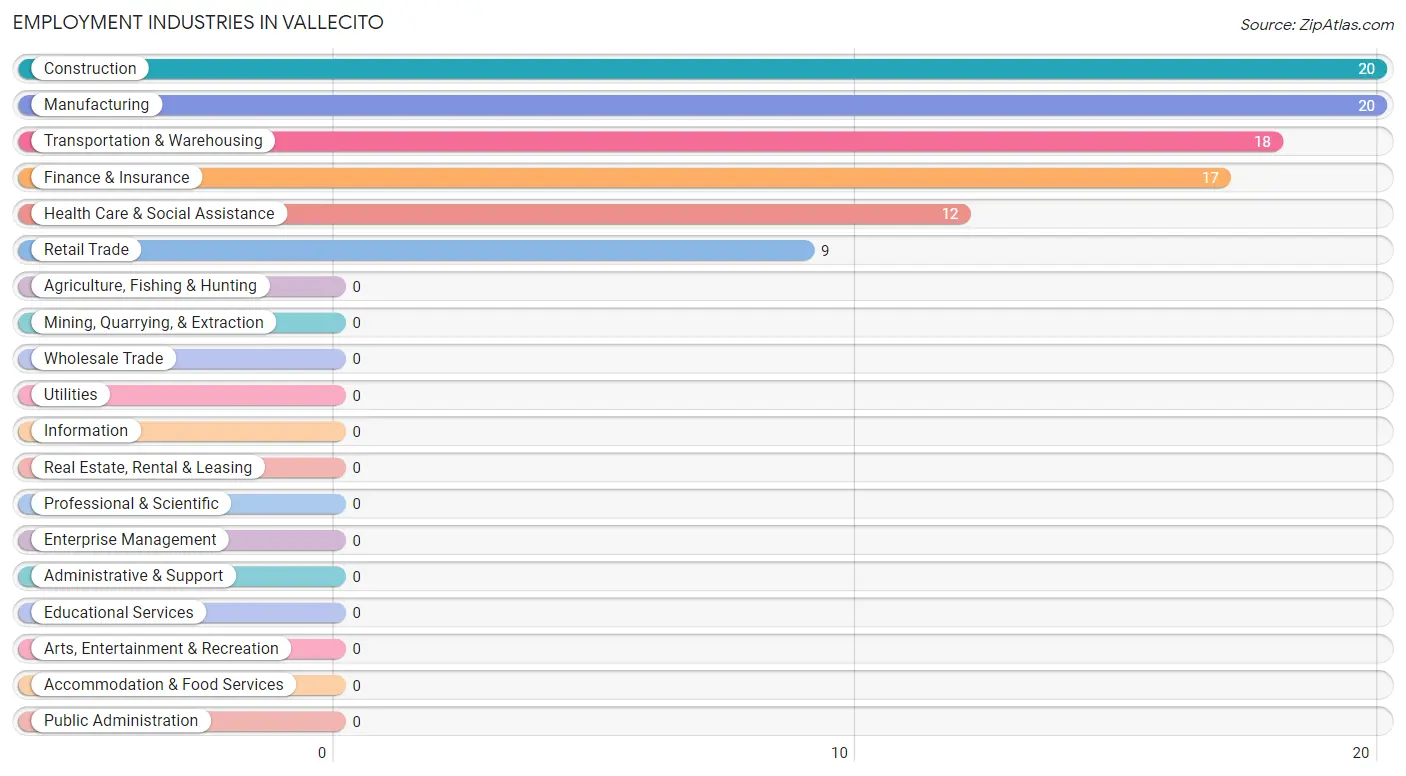
Employment Industries in Vallecito
The major employment industries in Vallecito include Construction (20 | 20.8%), Manufacturing (20 | 20.8%), Transportation & Warehousing (18 | 18.8%), Finance & Insurance (17 | 17.7%), and Health Care & Social Assistance (12 | 12.5%).
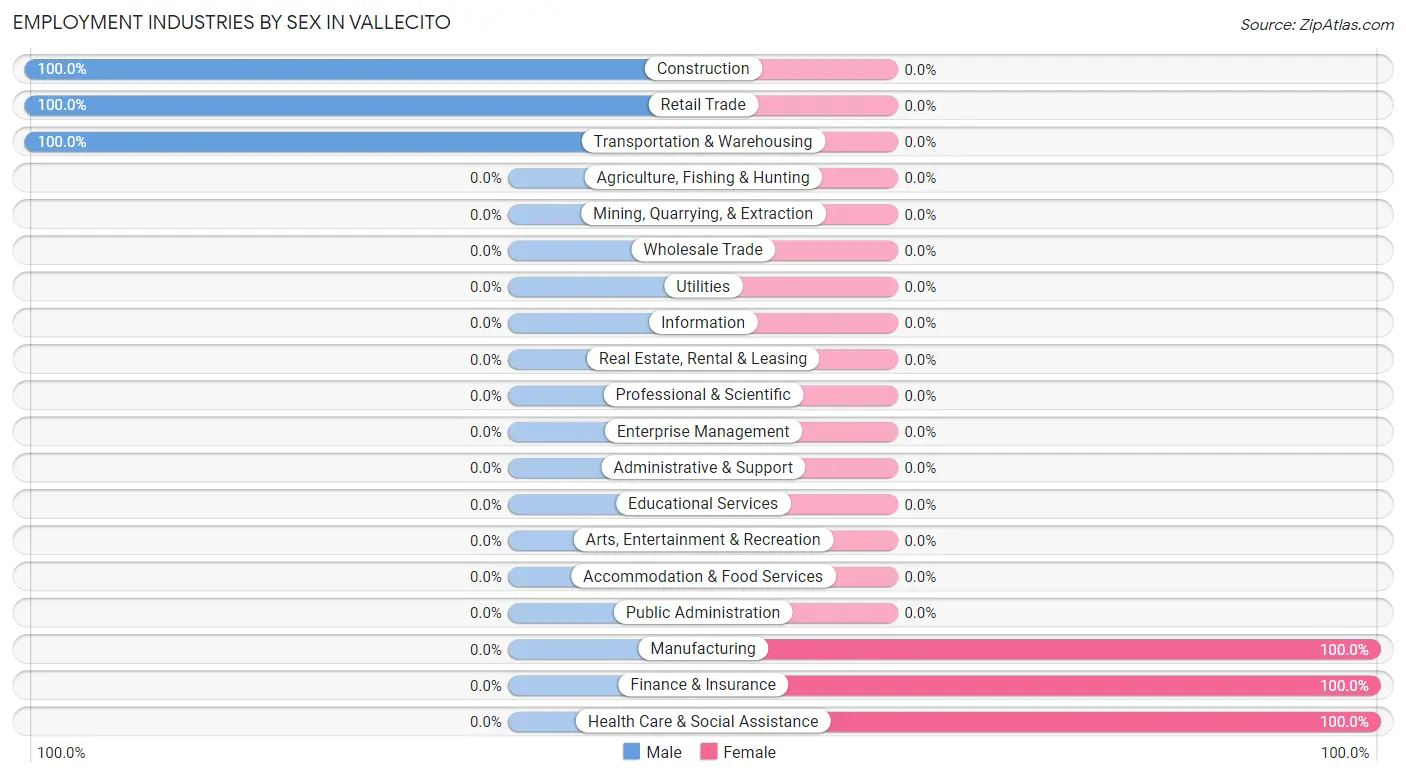
Employment Industries by Sex in Vallecito
The Vallecito industries that see more men than women are Construction (100.0%), Retail Trade (100.0%), and Transportation & Warehousing (100.0%), whereas the industries that tend to have a higher number of women are Manufacturing (100.0%), Finance & Insurance (100.0%), and Health Care & Social Assistance (100.0%).
| Industry | Male | Female |
| Agriculture, Fishing & Hunting | 0 (0.0%) | 0 (0.0%) |
| Mining, Quarrying, & Extraction | 0 (0.0%) | 0 (0.0%) |
| Construction | 20 (100.0%) | 0 (0.0%) |
| Manufacturing | 0 (0.0%) | 20 (100.0%) |
| Wholesale Trade | 0 (0.0%) | 0 (0.0%) |
| Retail Trade | 9 (100.0%) | 0 (0.0%) |
| Transportation & Warehousing | 18 (100.0%) | 0 (0.0%) |
| Utilities | 0 (0.0%) | 0 (0.0%) |
| Information | 0 (0.0%) | 0 (0.0%) |
| Finance & Insurance | 0 (0.0%) | 17 (100.0%) |
| Real Estate, Rental & Leasing | 0 (0.0%) | 0 (0.0%) |
| Professional & Scientific | 0 (0.0%) | 0 (0.0%) |
| Enterprise Management | 0 (0.0%) | 0 (0.0%) |
| Administrative & Support | 0 (0.0%) | 0 (0.0%) |
| Educational Services | 0 (0.0%) | 0 (0.0%) |
| Health Care & Social Assistance | 0 (0.0%) | 12 (100.0%) |
| Arts, Entertainment & Recreation | 0 (0.0%) | 0 (0.0%) |
| Accommodation & Food Services | 0 (0.0%) | 0 (0.0%) |
| Public Administration | 0 (0.0%) | 0 (0.0%) |
| Total | 47 (49.0%) | 49 (51.0%) |
Education in Vallecito
School Enrollment in Vallecito
| School Level | # Students | % Students |
| Nursery / Preschool | 0 | 0.0% |
| Kindergarten | 0 | 0.0% |
| Elementary School | 0 | 0.0% |
| Middle School | 0 | 0.0% |
| High School | 0 | 0.0% |
| College / Undergraduate | 0 | 0.0% |
| Graduate / Professional | 0 | 0.0% |
| Total | 0 | 0.0% |
School Enrollment by Age by Funding Source in Vallecito
| Age Bracket | Public School | Private School |
| 3 to 4 Year Olds | 0 (0.0%) | 0 (0.0%) |
| 5 to 9 Year Old | 0 (0.0%) | 0 (0.0%) |
| 10 to 14 Year Olds | 0 (0.0%) | 0 (0.0%) |
| 15 to 17 Year Olds | 0 (0.0%) | 0 (0.0%) |
| 18 to 19 Year Olds | 0 (0.0%) | 0 (0.0%) |
| 20 to 24 Year Olds | 0 (0.0%) | 0 (0.0%) |
| 25 to 34 Year Olds | 0 (0.0%) | 0 (0.0%) |
| 35 Years and over | 0 (0.0%) | 0 (0.0%) |
| Total | 0 (0.0%) | 0 (0.0%) |
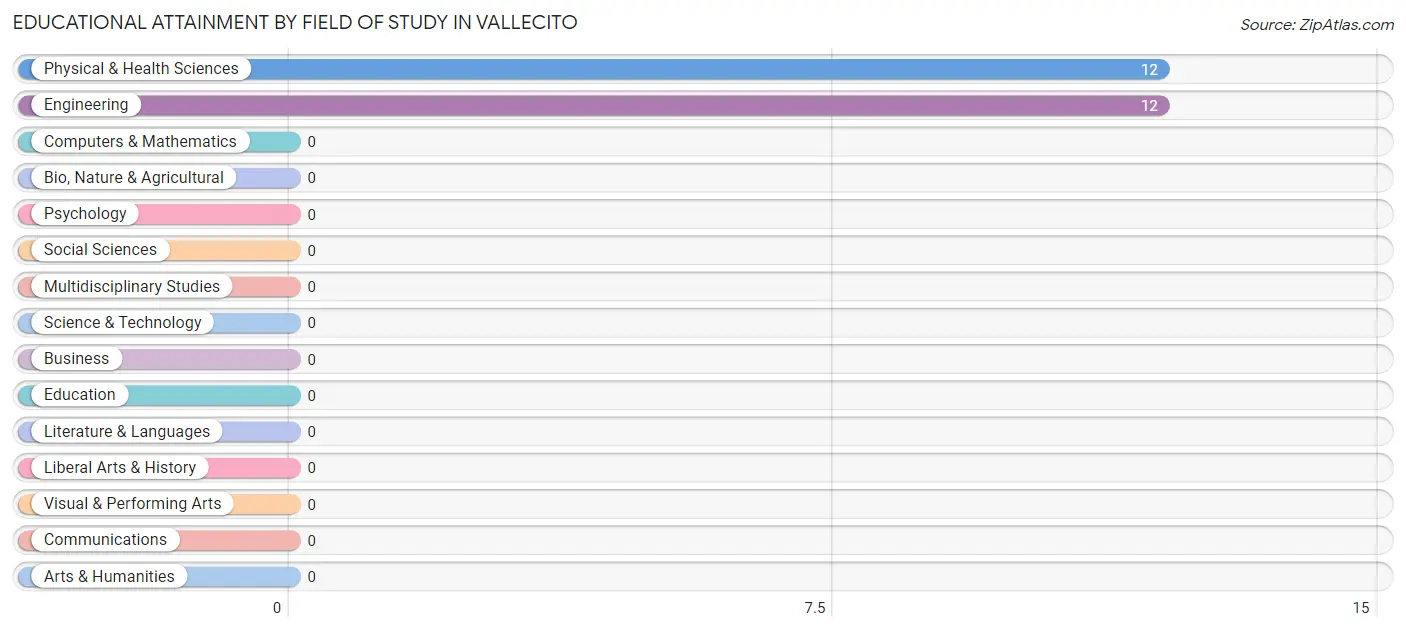
Educational Attainment by Field of Study in Vallecito
Physical & health sciences (12 | 50.0%), and engineering (12 | 50.0%) are the most common fields of study among 24 individuals in Vallecito who have obtained a bachelor's degree or higher.
| Field of Study | # Graduates | % Graduates |
| Computers & Mathematics | 0 | 0.0% |
| Bio, Nature & Agricultural | 0 | 0.0% |
| Physical & Health Sciences | 12 | 50.0% |
| Psychology | 0 | 0.0% |
| Social Sciences | 0 | 0.0% |
| Engineering | 12 | 50.0% |
| Multidisciplinary Studies | 0 | 0.0% |
| Science & Technology | 0 | 0.0% |
| Business | 0 | 0.0% |
| Education | 0 | 0.0% |
| Literature & Languages | 0 | 0.0% |
| Liberal Arts & History | 0 | 0.0% |
| Visual & Performing Arts | 0 | 0.0% |
| Communications | 0 | 0.0% |
| Arts & Humanities | 0 | 0.0% |
| Total | 24 | 100.0% |
Transportation & Commute in Vallecito
Vehicle Availability by Sex in Vallecito
The most prevalent vehicle ownership categories in Vallecito are males with 3 vehicles (20, accounting for 42.5%) and females with 3 vehicles (12, making up 40.8%).
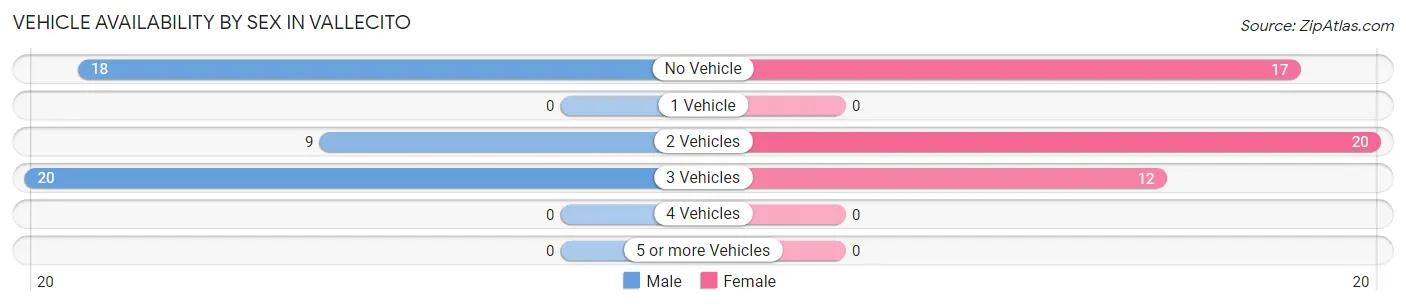
| Vehicles Available | Male | Female |
| No Vehicle | 18 (38.3%) | 17 (34.7%) |
| 1 Vehicle | 0 (0.0%) | 0 (0.0%) |
| 2 Vehicles | 9 (19.2%) | 20 (40.8%) |
| 3 Vehicles | 20 (42.5%) | 12 (24.5%) |
| 4 Vehicles | 0 (0.0%) | 0 (0.0%) |
| 5 or more Vehicles | 0 (0.0%) | 0 (0.0%) |
| Total | 47 (100.0%) | 49 (100.0%) |
Commute Time in Vallecito
The most frequently occuring commute durations in Vallecito are 10 to 14 minutes (44 commuters, 45.8%), less than 5 minutes (20 commuters, 20.8%), and 5 to 9 minutes (20 commuters, 20.8%).
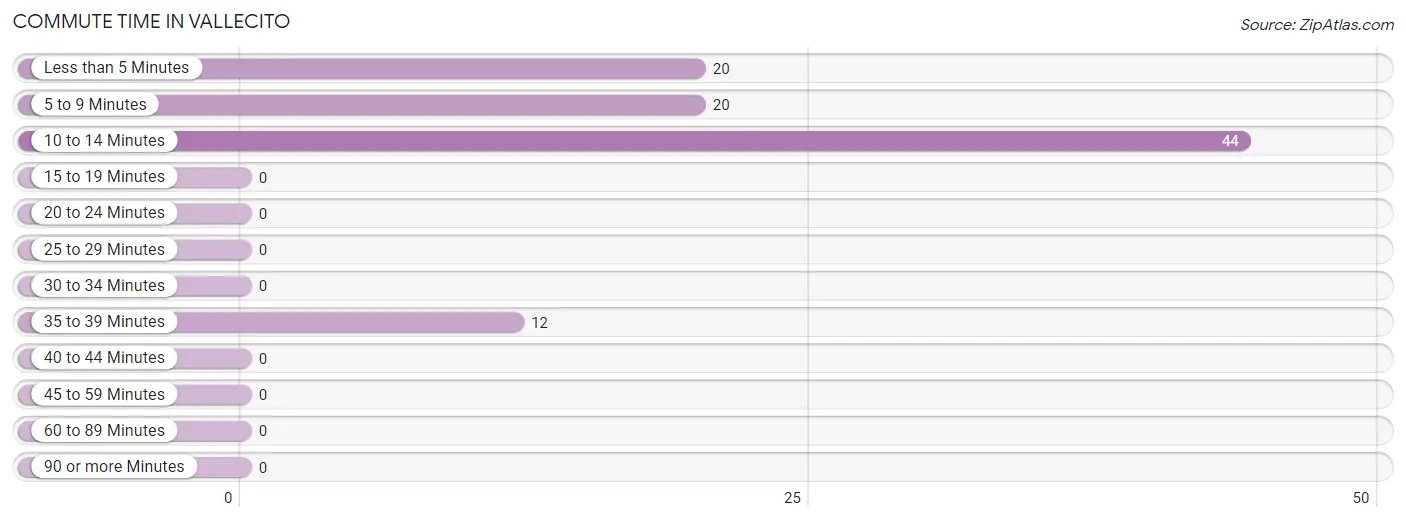
| Commute Time | # Commuters | % Commuters |
| Less than 5 Minutes | 20 | 20.8% |
| 5 to 9 Minutes | 20 | 20.8% |
| 10 to 14 Minutes | 44 | 45.8% |
| 15 to 19 Minutes | 0 | 0.0% |
| 20 to 24 Minutes | 0 | 0.0% |
| 25 to 29 Minutes | 0 | 0.0% |
| 30 to 34 Minutes | 0 | 0.0% |
| 35 to 39 Minutes | 12 | 12.5% |
| 40 to 44 Minutes | 0 | 0.0% |
| 45 to 59 Minutes | 0 | 0.0% |
| 60 to 89 Minutes | 0 | 0.0% |
| 90 or more Minutes | 0 | 0.0% |
Commute Time by Sex in Vallecito
The most common commute times in Vallecito are 10 to 14 minutes (27 commuters, 57.5%) for males and 5 to 9 minutes (20 commuters, 40.8%) for females.
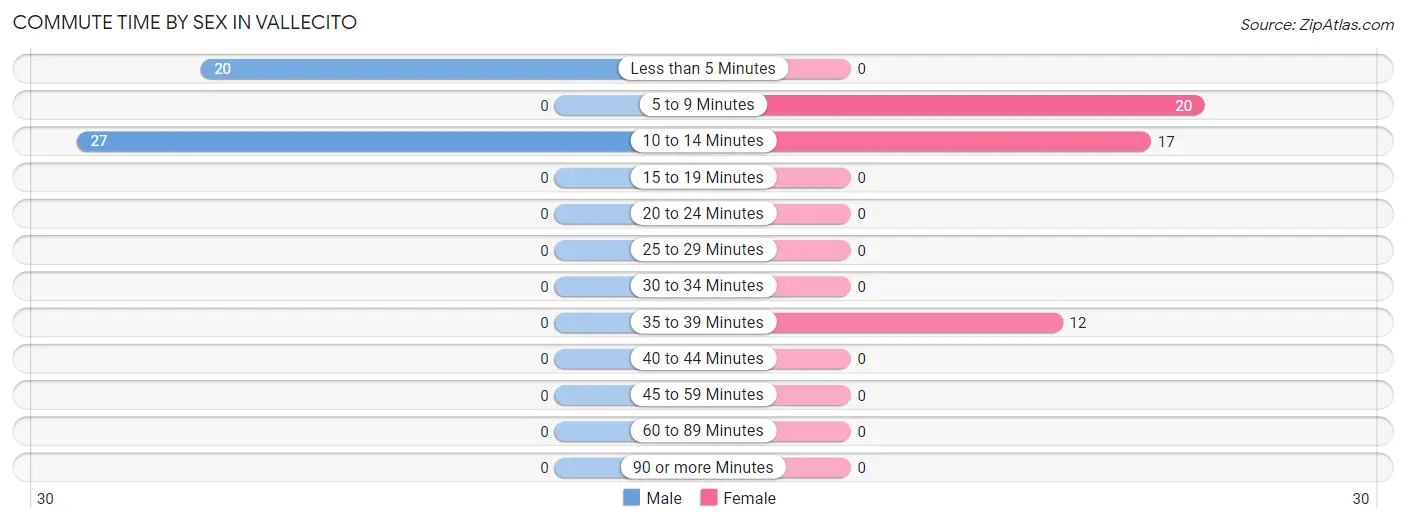
| Commute Time | Male | Female |
| Less than 5 Minutes | 20 (42.5%) | 0 (0.0%) |
| 5 to 9 Minutes | 0 (0.0%) | 20 (40.8%) |
| 10 to 14 Minutes | 27 (57.5%) | 17 (34.7%) |
| 15 to 19 Minutes | 0 (0.0%) | 0 (0.0%) |
| 20 to 24 Minutes | 0 (0.0%) | 0 (0.0%) |
| 25 to 29 Minutes | 0 (0.0%) | 0 (0.0%) |
| 30 to 34 Minutes | 0 (0.0%) | 0 (0.0%) |
| 35 to 39 Minutes | 0 (0.0%) | 12 (24.5%) |
| 40 to 44 Minutes | 0 (0.0%) | 0 (0.0%) |
| 45 to 59 Minutes | 0 (0.0%) | 0 (0.0%) |
| 60 to 89 Minutes | 0 (0.0%) | 0 (0.0%) |
| 90 or more Minutes | 0 (0.0%) | 0 (0.0%) |
Time of Departure to Work by Sex in Vallecito
The most frequent times of departure to work in Vallecito are 7:00 AM to 7:29 AM (20, 42.5%) for males and 9:00 AM to 9:59 AM (20, 40.8%) for females.
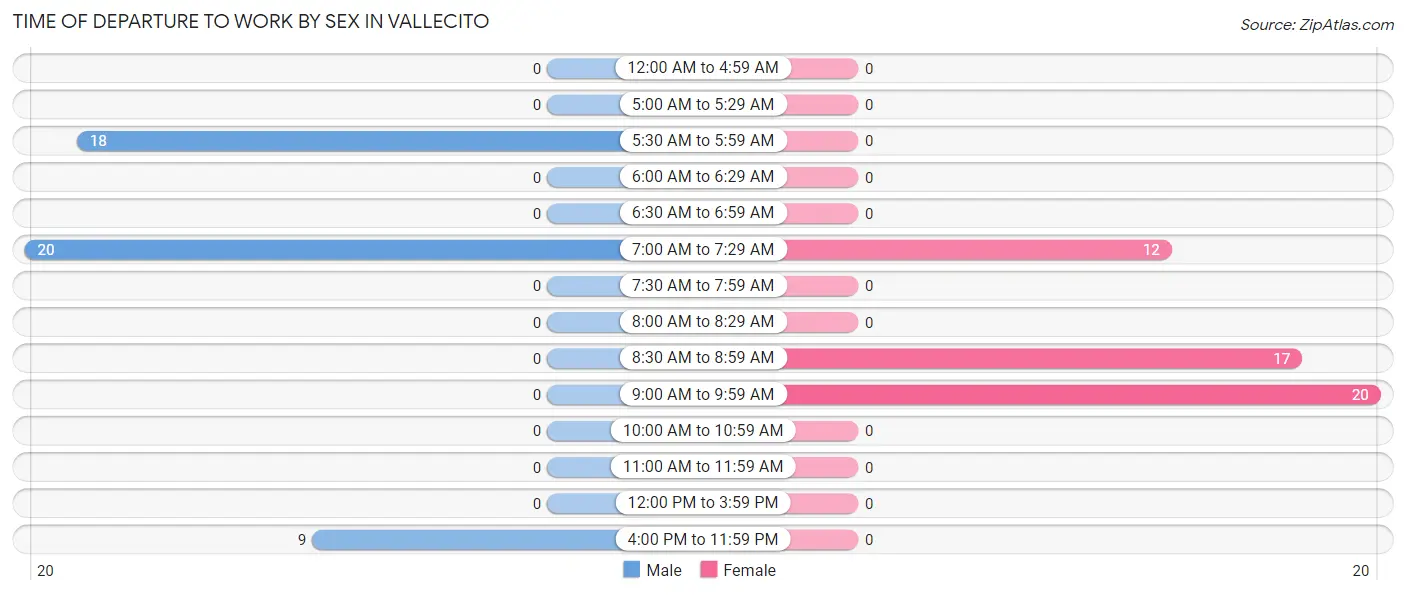
| Time of Departure | Male | Female |
| 12:00 AM to 4:59 AM | 0 (0.0%) | 0 (0.0%) |
| 5:00 AM to 5:29 AM | 0 (0.0%) | 0 (0.0%) |
| 5:30 AM to 5:59 AM | 18 (38.3%) | 0 (0.0%) |
| 6:00 AM to 6:29 AM | 0 (0.0%) | 0 (0.0%) |
| 6:30 AM to 6:59 AM | 0 (0.0%) | 0 (0.0%) |
| 7:00 AM to 7:29 AM | 20 (42.5%) | 12 (24.5%) |
| 7:30 AM to 7:59 AM | 0 (0.0%) | 0 (0.0%) |
| 8:00 AM to 8:29 AM | 0 (0.0%) | 0 (0.0%) |
| 8:30 AM to 8:59 AM | 0 (0.0%) | 17 (34.7%) |
| 9:00 AM to 9:59 AM | 0 (0.0%) | 20 (40.8%) |
| 10:00 AM to 10:59 AM | 0 (0.0%) | 0 (0.0%) |
| 11:00 AM to 11:59 AM | 0 (0.0%) | 0 (0.0%) |
| 12:00 PM to 3:59 PM | 0 (0.0%) | 0 (0.0%) |
| 4:00 PM to 11:59 PM | 9 (19.2%) | 0 (0.0%) |
| Total | 47 (100.0%) | 49 (100.0%) |
Housing Occupancy in Vallecito
Occupancy by Ownership in Vallecito
Of the total 136 dwellings in Vallecito, owner-occupied units account for 66 (48.5%), while renter-occupied units make up 70 (51.5%).
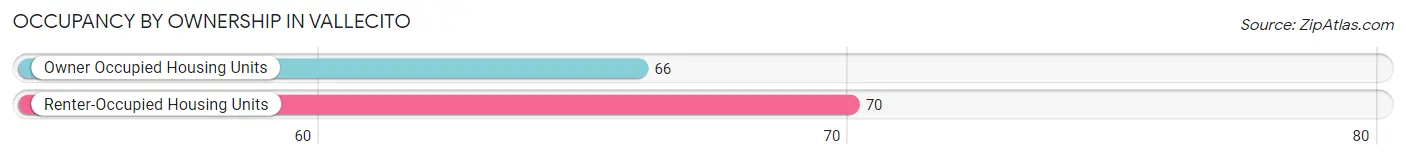
| Occupancy | # Housing Units | % Housing Units |
| Owner Occupied Housing Units | 66 | 48.5% |
| Renter-Occupied Housing Units | 70 | 51.5% |
| Total Occupied Housing Units | 136 | 100.0% |
Occupancy by Household Size in Vallecito
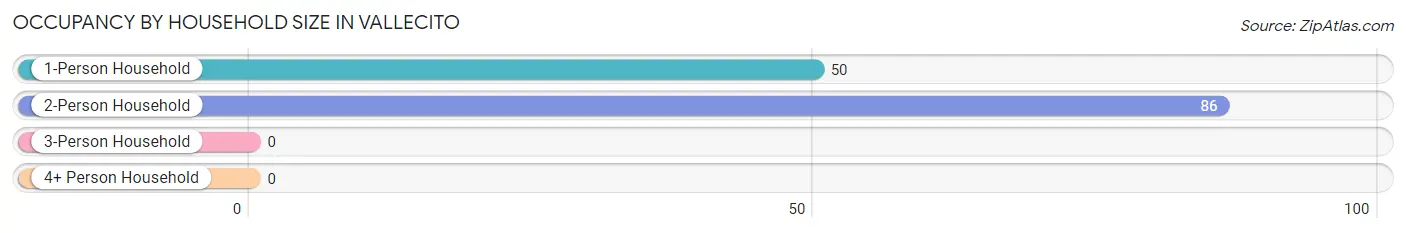
| Household Size | # Housing Units | % Housing Units |
| 1-Person Household | 50 | 36.8% |
| 2-Person Household | 86 | 63.2% |
| 3-Person Household | 0 | 0.0% |
| 4+ Person Household | 0 | 0.0% |
| Total Housing Units | 136 | 100.0% |
Occupancy by Ownership by Household Size in Vallecito
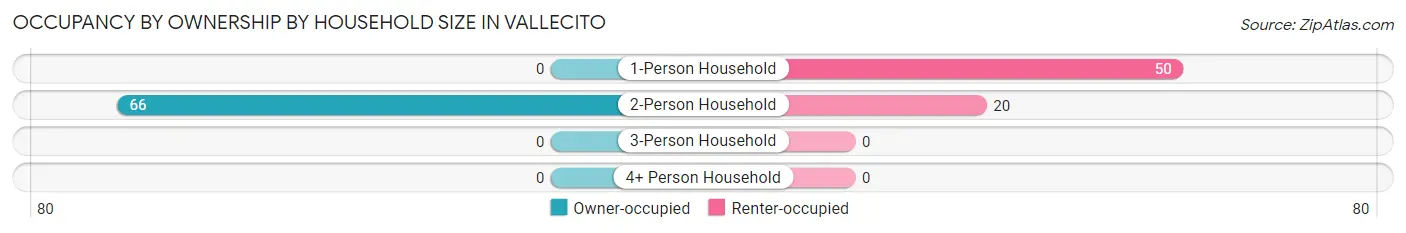
| Household Size | Owner-occupied | Renter-occupied |
| 1-Person Household | 0 (0.0%) | 50 (100.0%) |
| 2-Person Household | 66 (76.7%) | 20 (23.3%) |
| 3-Person Household | 0 (0.0%) | 0 (0.0%) |
| 4+ Person Household | 0 (0.0%) | 0 (0.0%) |
| Total Housing Units | 66 (48.5%) | 70 (51.5%) |
Occupancy by Educational Attainment in Vallecito
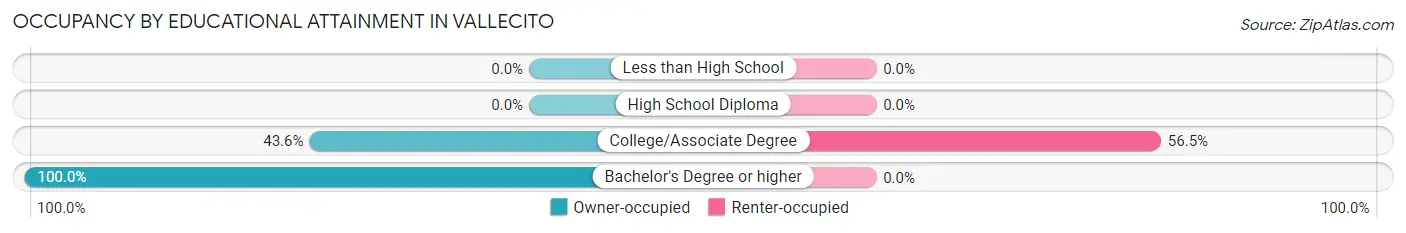
| Household Size | Owner-occupied | Renter-occupied |
| Less than High School | 0 (0.0%) | 0 (0.0%) |
| High School Diploma | 0 (0.0%) | 0 (0.0%) |
| College/Associate Degree | 54 (43.5%) | 70 (56.5%) |
| Bachelor's Degree or higher | 12 (100.0%) | 0 (0.0%) |
Occupancy by Age of Householder in Vallecito
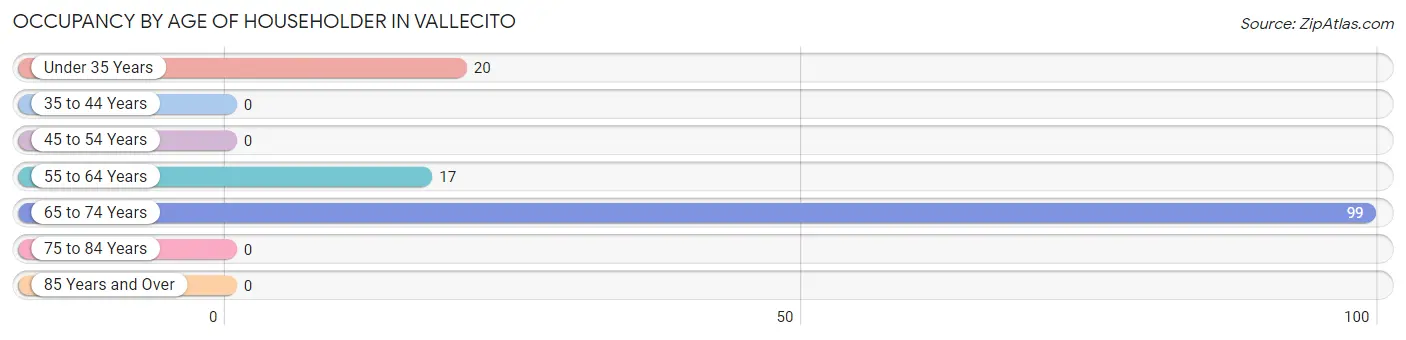
| Age Bracket | # Households | % Households |
| Under 35 Years | 20 | 14.7% |
| 35 to 44 Years | 0 | 0.0% |
| 45 to 54 Years | 0 | 0.0% |
| 55 to 64 Years | 17 | 12.5% |
| 65 to 74 Years | 99 | 72.8% |
| 75 to 84 Years | 0 | 0.0% |
| 85 Years and Over | 0 | 0.0% |
| Total | 136 | 100.0% |
Housing Finances in Vallecito
Median Income by Occupancy in Vallecito
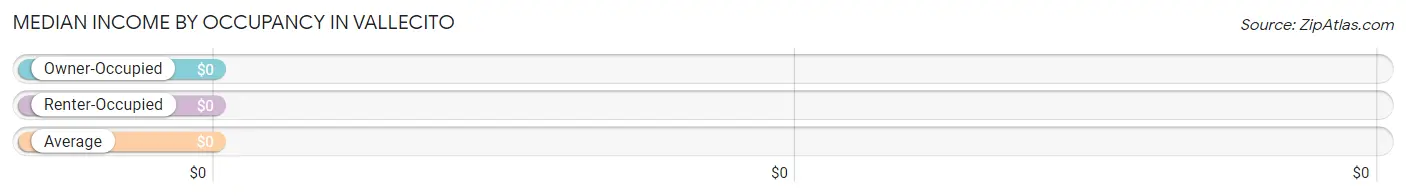
| Occupancy Type | # Households | Median Income |
| Owner-Occupied | 66 (48.5%) | $0 |
| Renter-Occupied | 70 (51.5%) | $0 |
| Average | 136 (100.0%) | $0 |
Occupancy by Householder Income Bracket in Vallecito
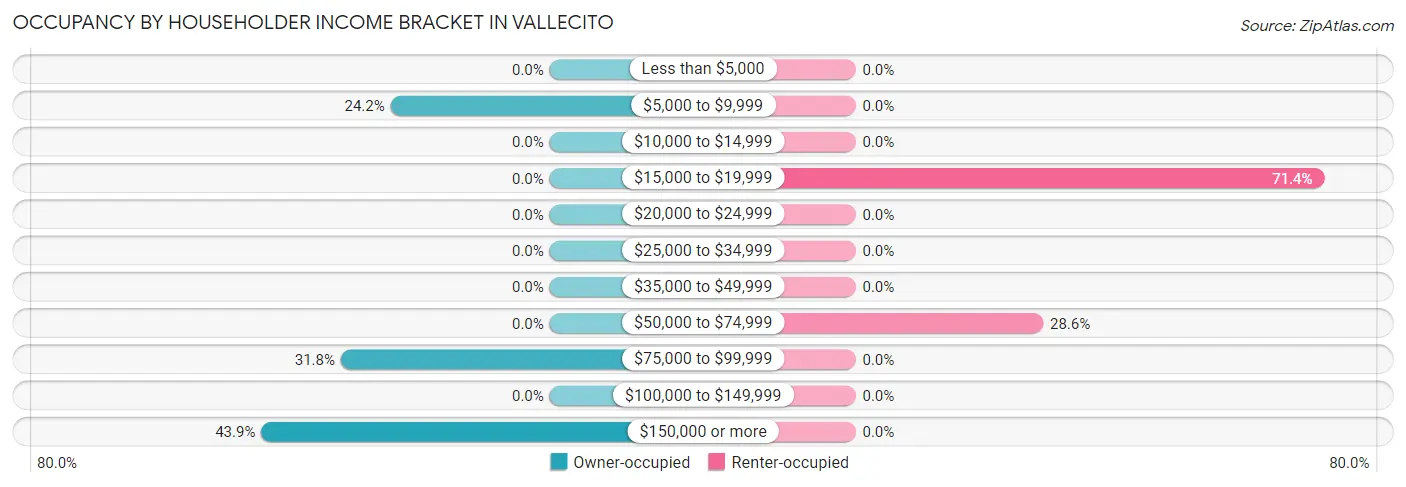
| Income Bracket | Owner-occupied | Renter-occupied |
| Less than $5,000 | 0 (0.0%) | 0 (0.0%) |
| $5,000 to $9,999 | 16 (24.2%) | 0 (0.0%) |
| $10,000 to $14,999 | 0 (0.0%) | 0 (0.0%) |
| $15,000 to $19,999 | 0 (0.0%) | 50 (71.4%) |
| $20,000 to $24,999 | 0 (0.0%) | 0 (0.0%) |
| $25,000 to $34,999 | 0 (0.0%) | 0 (0.0%) |
| $35,000 to $49,999 | 0 (0.0%) | 0 (0.0%) |
| $50,000 to $74,999 | 0 (0.0%) | 20 (28.6%) |
| $75,000 to $99,999 | 21 (31.8%) | 0 (0.0%) |
| $100,000 to $149,999 | 0 (0.0%) | 0 (0.0%) |
| $150,000 or more | 29 (43.9%) | 0 (0.0%) |
| Total | 66 (100.0%) | 70 (100.0%) |
Monthly Housing Cost Tiers in Vallecito
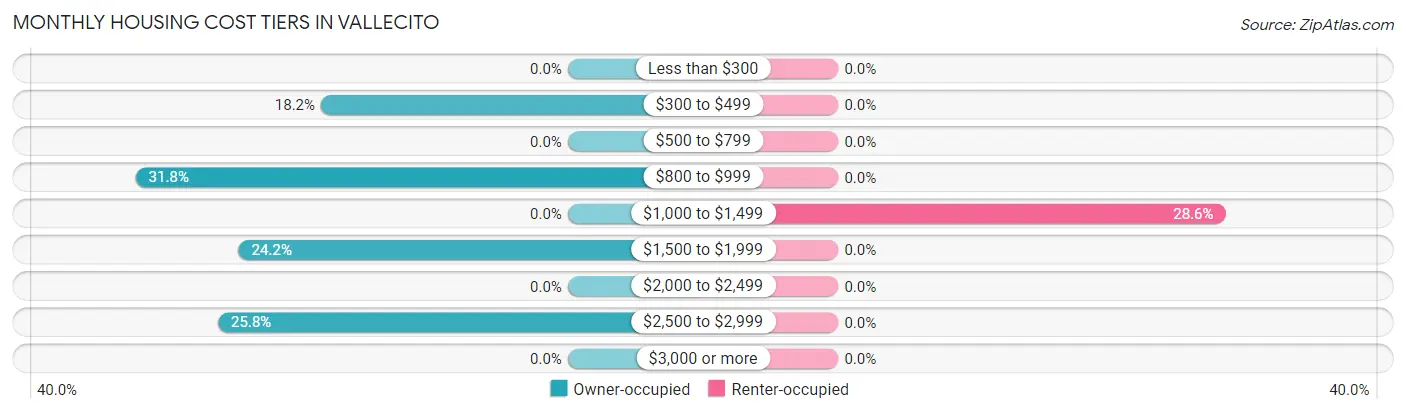
| Monthly Cost | Owner-occupied | Renter-occupied |
| Less than $300 | 0 (0.0%) | 0 (0.0%) |
| $300 to $499 | 12 (18.2%) | 0 (0.0%) |
| $500 to $799 | 0 (0.0%) | 0 (0.0%) |
| $800 to $999 | 21 (31.8%) | 0 (0.0%) |
| $1,000 to $1,499 | 0 (0.0%) | 20 (28.6%) |
| $1,500 to $1,999 | 16 (24.2%) | 0 (0.0%) |
| $2,000 to $2,499 | 0 (0.0%) | 0 (0.0%) |
| $2,500 to $2,999 | 17 (25.8%) | 0 (0.0%) |
| $3,000 or more | 0 (0.0%) | 0 (0.0%) |
| Total | 66 (100.0%) | 70 (100.0%) |
Physical Housing Characteristics in Vallecito
Housing Structures in Vallecito
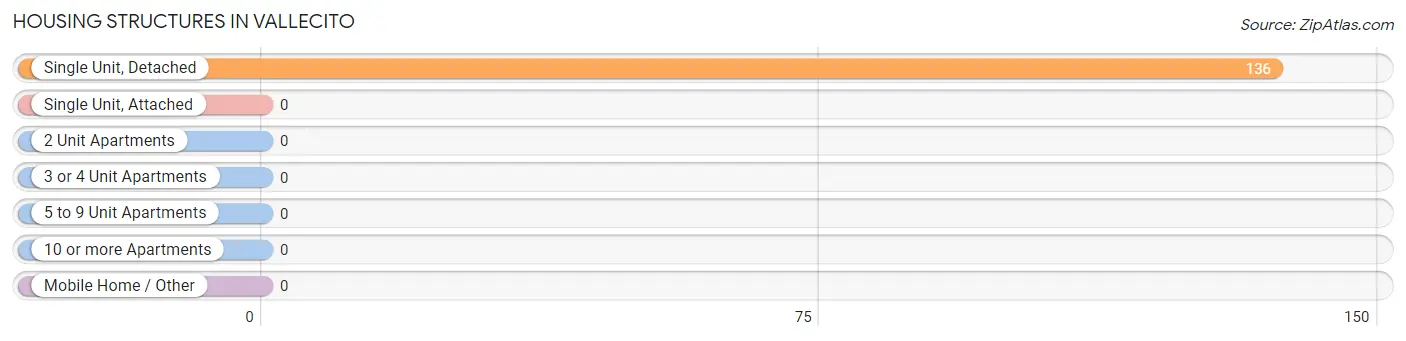
| Structure Type | # Housing Units | % Housing Units |
| Single Unit, Detached | 136 | 100.0% |
| Single Unit, Attached | 0 | 0.0% |
| 2 Unit Apartments | 0 | 0.0% |
| 3 or 4 Unit Apartments | 0 | 0.0% |
| 5 to 9 Unit Apartments | 0 | 0.0% |
| 10 or more Apartments | 0 | 0.0% |
| Mobile Home / Other | 0 | 0.0% |
| Total | 136 | 100.0% |
Housing Structures by Occupancy in Vallecito
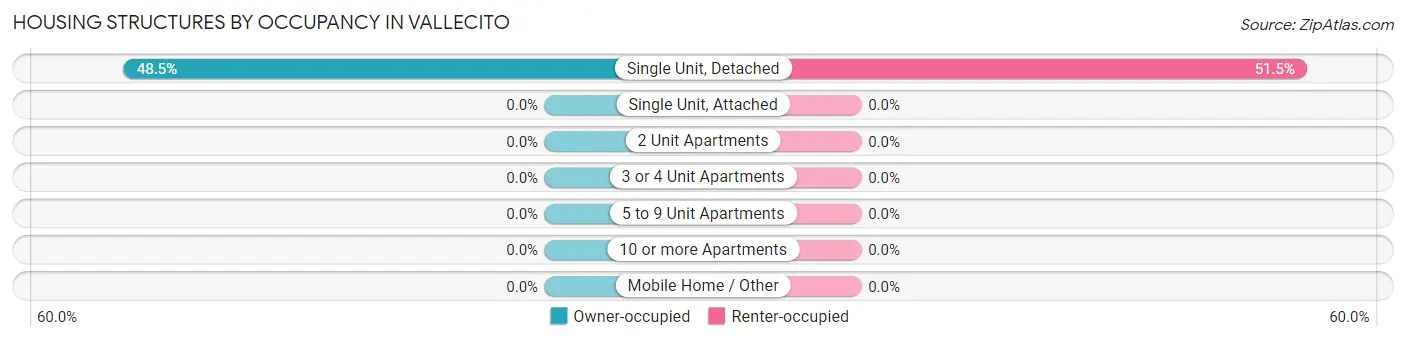
| Structure Type | Owner-occupied | Renter-occupied |
| Single Unit, Detached | 66 (48.5%) | 70 (51.5%) |
| Single Unit, Attached | 0 (0.0%) | 0 (0.0%) |
| 2 Unit Apartments | 0 (0.0%) | 0 (0.0%) |
| 3 or 4 Unit Apartments | 0 (0.0%) | 0 (0.0%) |
| 5 to 9 Unit Apartments | 0 (0.0%) | 0 (0.0%) |
| 10 or more Apartments | 0 (0.0%) | 0 (0.0%) |
| Mobile Home / Other | 0 (0.0%) | 0 (0.0%) |
| Total | 66 (48.5%) | 70 (51.5%) |
Housing Structures by Number of Rooms in Vallecito
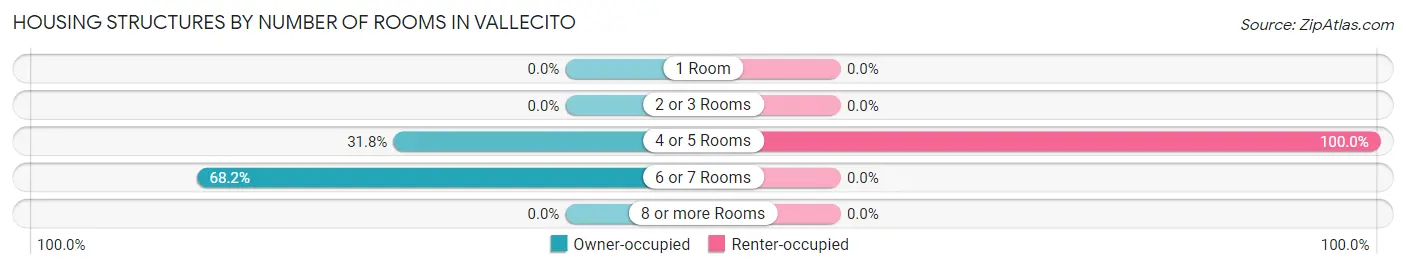
| Number of Rooms | Owner-occupied | Renter-occupied |
| 1 Room | 0 (0.0%) | 0 (0.0%) |
| 2 or 3 Rooms | 0 (0.0%) | 0 (0.0%) |
| 4 or 5 Rooms | 21 (31.8%) | 70 (100.0%) |
| 6 or 7 Rooms | 45 (68.2%) | 0 (0.0%) |
| 8 or more Rooms | 0 (0.0%) | 0 (0.0%) |
| Total | 66 (100.0%) | 70 (100.0%) |
Housing Structure by Heating Type in Vallecito
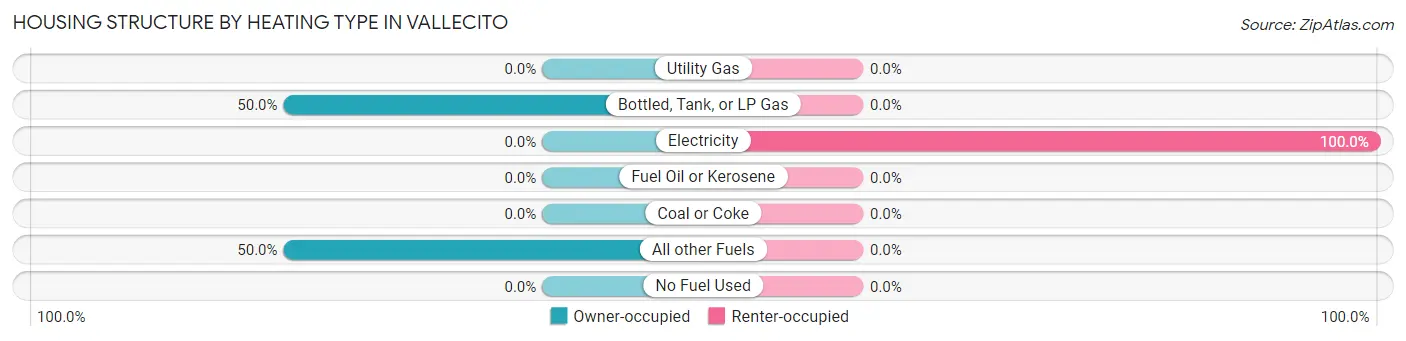
| Heating Type | Owner-occupied | Renter-occupied |
| Utility Gas | 0 (0.0%) | 0 (0.0%) |
| Bottled, Tank, or LP Gas | 33 (50.0%) | 0 (0.0%) |
| Electricity | 0 (0.0%) | 70 (100.0%) |
| Fuel Oil or Kerosene | 0 (0.0%) | 0 (0.0%) |
| Coal or Coke | 0 (0.0%) | 0 (0.0%) |
| All other Fuels | 33 (50.0%) | 0 (0.0%) |
| No Fuel Used | 0 (0.0%) | 0 (0.0%) |
| Total | 66 (100.0%) | 70 (100.0%) |
Household Vehicle Usage in Vallecito
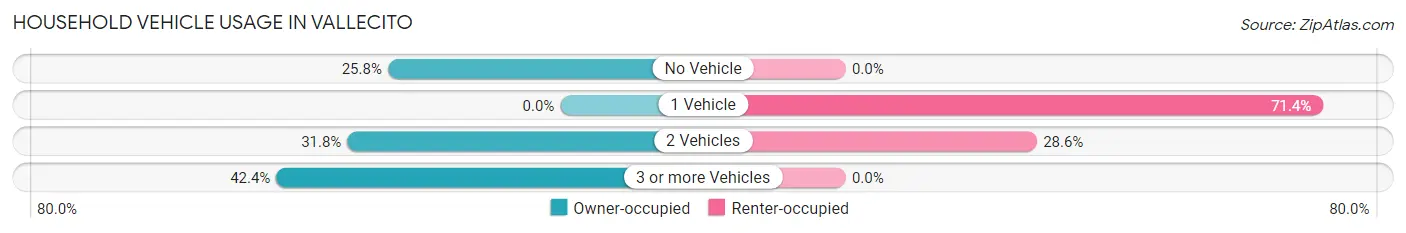
| Vehicles per Household | Owner-occupied | Renter-occupied |
| No Vehicle | 17 (25.8%) | 0 (0.0%) |
| 1 Vehicle | 0 (0.0%) | 50 (71.4%) |
| 2 Vehicles | 21 (31.8%) | 20 (28.6%) |
| 3 or more Vehicles | 28 (42.4%) | 0 (0.0%) |
| Total | 66 (100.0%) | 70 (100.0%) |
Real Estate & Mortgages in Vallecito
Real Estate and Mortgage Overview in Vallecito
| Characteristic | Without Mortgage | With Mortgage |
| Housing Units | 33 | 33 |
| Median Property Value | - | - |
| Median Household Income | - | - |
| Monthly Housing Costs | - | - |
| Real Estate Taxes | - | - |
Property Value by Mortgage Status in Vallecito
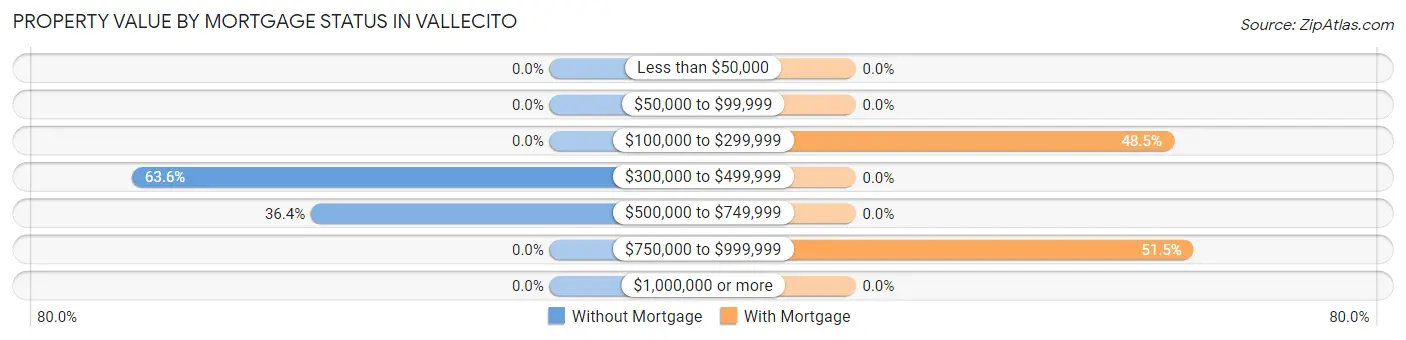
| Property Value | Without Mortgage | With Mortgage |
| Less than $50,000 | 0 (0.0%) | 0 (0.0%) |
| $50,000 to $99,999 | 0 (0.0%) | 0 (0.0%) |
| $100,000 to $299,999 | 0 (0.0%) | 16 (48.5%) |
| $300,000 to $499,999 | 21 (63.6%) | 0 (0.0%) |
| $500,000 to $749,999 | 12 (36.4%) | 0 (0.0%) |
| $750,000 to $999,999 | 0 (0.0%) | 17 (51.5%) |
| $1,000,000 or more | 0 (0.0%) | 0 (0.0%) |
| Total | 33 (100.0%) | 33 (100.0%) |
Household Income by Mortgage Status in Vallecito
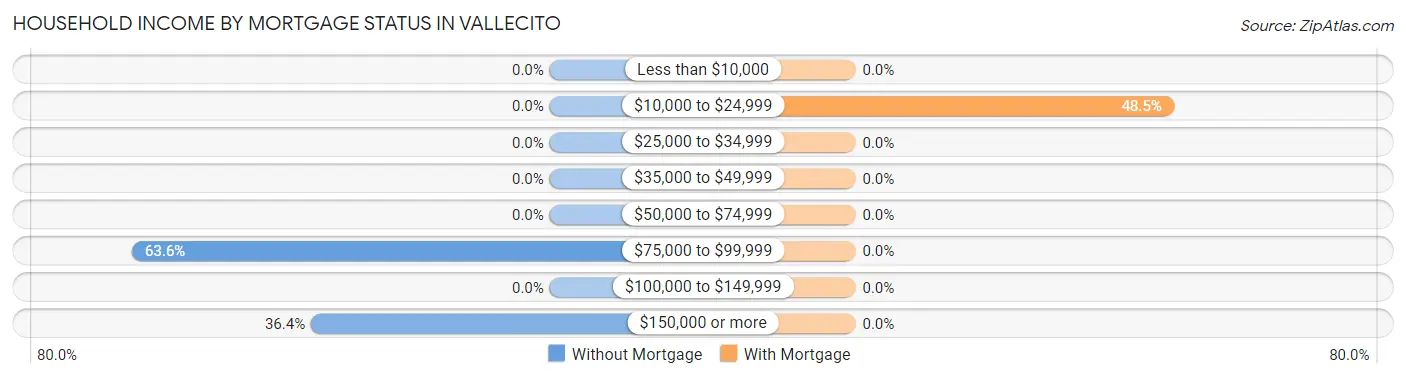
| Household Income | Without Mortgage | With Mortgage |
| Less than $10,000 | 0 (0.0%) | 0 (0.0%) |
| $10,000 to $24,999 | 0 (0.0%) | 16 (48.5%) |
| $25,000 to $34,999 | 0 (0.0%) | 0 (0.0%) |
| $35,000 to $49,999 | 0 (0.0%) | 0 (0.0%) |
| $50,000 to $74,999 | 0 (0.0%) | 0 (0.0%) |
| $75,000 to $99,999 | 21 (63.6%) | 0 (0.0%) |
| $100,000 to $149,999 | 0 (0.0%) | 0 (0.0%) |
| $150,000 or more | 12 (36.4%) | 0 (0.0%) |
| Total | 33 (100.0%) | 33 (100.0%) |
Property Value to Household Income Ratio in Vallecito
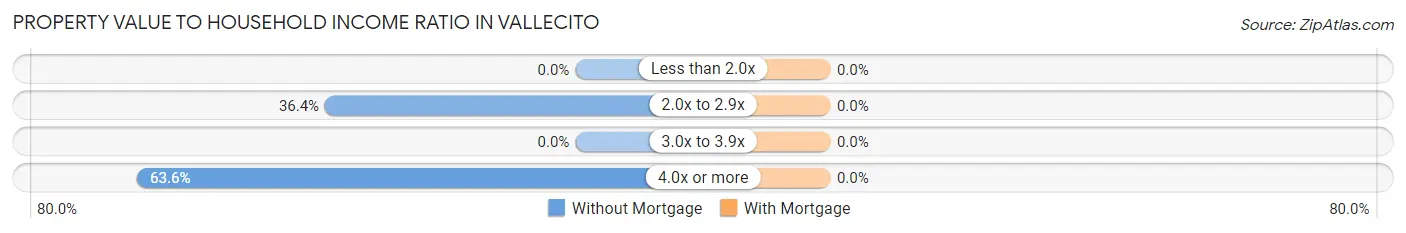
| Value-to-Income Ratio | Without Mortgage | With Mortgage |
| Less than 2.0x | 0 (0.0%) | 0 (0.0%) |
| 2.0x to 2.9x | 12 (36.4%) | 0 (0.0%) |
| 3.0x to 3.9x | 0 (0.0%) | 0 (0.0%) |
| 4.0x or more | 21 (63.6%) | 0 (0.0%) |
| Total | 33 (100.0%) | 33 (100.0%) |
Real Estate Taxes by Mortgage Status in Vallecito
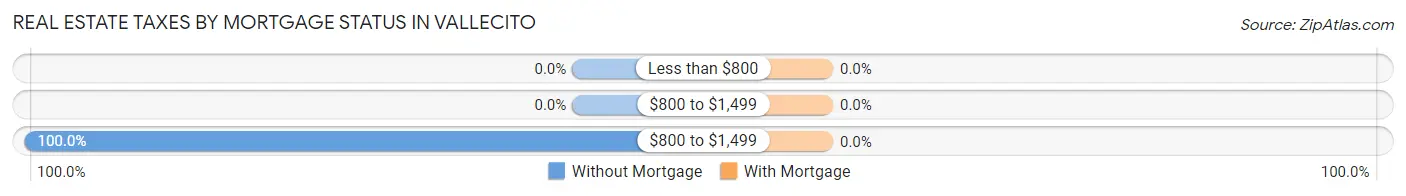
| Property Taxes | Without Mortgage | With Mortgage |
| Less than $800 | 0 (0.0%) | 0 (0.0%) |
| $800 to $1,499 | 0 (0.0%) | 0 (0.0%) |
| $800 to $1,499 | 33 (100.0%) | 0 (0.0%) |
| Total | 33 (100.0%) | 33 (100.0%) |
Health & Disability in Vallecito
Health Insurance Coverage by Age in Vallecito
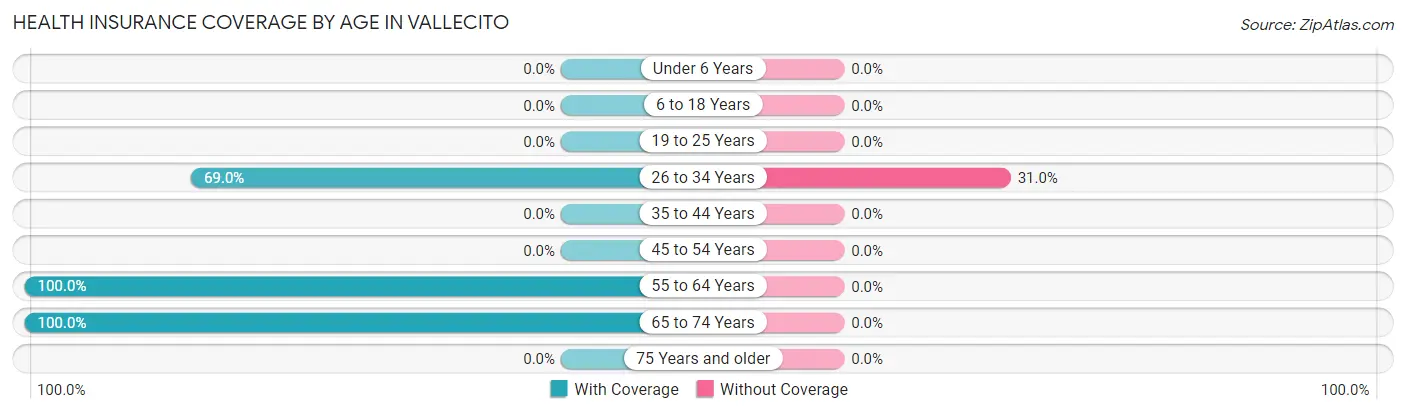
| Age Bracket | With Coverage | Without Coverage |
| Under 6 Years | 0 (0.0%) | 0 (0.0%) |
| 6 to 18 Years | 0 (0.0%) | 0 (0.0%) |
| 19 to 25 Years | 0 (0.0%) | 0 (0.0%) |
| 26 to 34 Years | 20 (69.0%) | 9 (31.0%) |
| 35 to 44 Years | 0 (0.0%) | 0 (0.0%) |
| 45 to 54 Years | 0 (0.0%) | 0 (0.0%) |
| 55 to 64 Years | 47 (100.0%) | 0 (0.0%) |
| 65 to 74 Years | 137 (100.0%) | 0 (0.0%) |
| 75 Years and older | 0 (0.0%) | 0 (0.0%) |
| Total | 204 (95.8%) | 9 (4.2%) |
Health Insurance Coverage by Citizenship Status in Vallecito
| Citizenship Status | With Coverage | Without Coverage |
| Native Born | 0 (0.0%) | 0 (0.0%) |
| Foreign Born, Citizen | 0 (0.0%) | 0 (0.0%) |
| Foreign Born, not a Citizen | 0 (0.0%) | 0 (0.0%) |
Health Insurance Coverage by Household Income in Vallecito
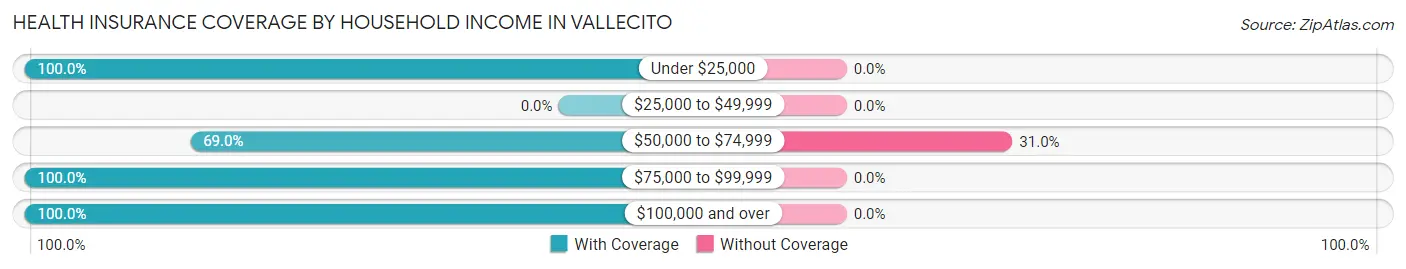
| Household Income | With Coverage | Without Coverage |
| Under $25,000 | 86 (100.0%) | 0 (0.0%) |
| $25,000 to $49,999 | 0 (0.0%) | 0 (0.0%) |
| $50,000 to $74,999 | 20 (69.0%) | 9 (31.0%) |
| $75,000 to $99,999 | 39 (100.0%) | 0 (0.0%) |
| $100,000 and over | 59 (100.0%) | 0 (0.0%) |
Public vs Private Health Insurance Coverage by Age in Vallecito
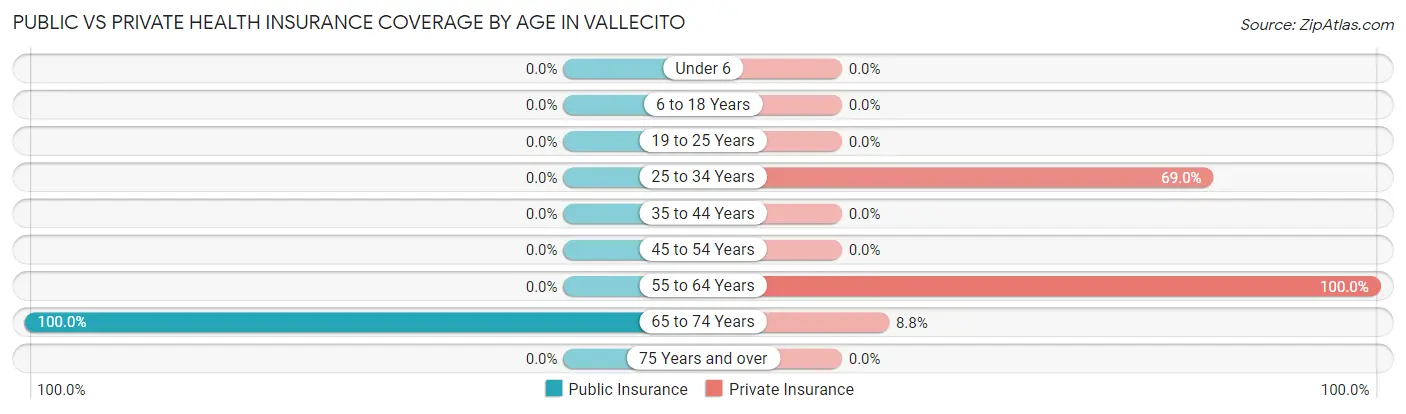
| Age Bracket | Public Insurance | Private Insurance |
| Under 6 | 0 (0.0%) | 0 (0.0%) |
| 6 to 18 Years | 0 (0.0%) | 0 (0.0%) |
| 19 to 25 Years | 0 (0.0%) | 0 (0.0%) |
| 25 to 34 Years | 0 (0.0%) | 20 (69.0%) |
| 35 to 44 Years | 0 (0.0%) | 0 (0.0%) |
| 45 to 54 Years | 0 (0.0%) | 0 (0.0%) |
| 55 to 64 Years | 0 (0.0%) | 47 (100.0%) |
| 65 to 74 Years | 137 (100.0%) | 12 (8.8%) |
| 75 Years and over | 0 (0.0%) | 0 (0.0%) |
| Total | 137 (64.3%) | 79 (37.1%) |
Disability Status by Sex by Age in Vallecito
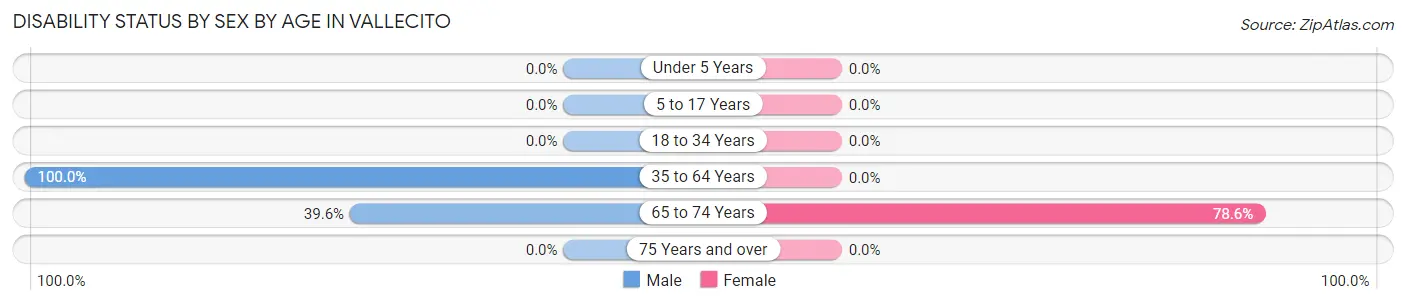
| Age Bracket | Male | Female |
| Under 5 Years | 0 (0.0%) | 0 (0.0%) |
| 5 to 17 Years | 0 (0.0%) | 0 (0.0%) |
| 18 to 34 Years | 0 (0.0%) | 0 (0.0%) |
| 35 to 64 Years | 18 (100.0%) | 0 (0.0%) |
| 65 to 74 Years | 21 (39.6%) | 66 (78.6%) |
| 75 Years and over | 0 (0.0%) | 0 (0.0%) |
Disability Class by Sex by Age in Vallecito
Disability Class: Hearing Difficulty
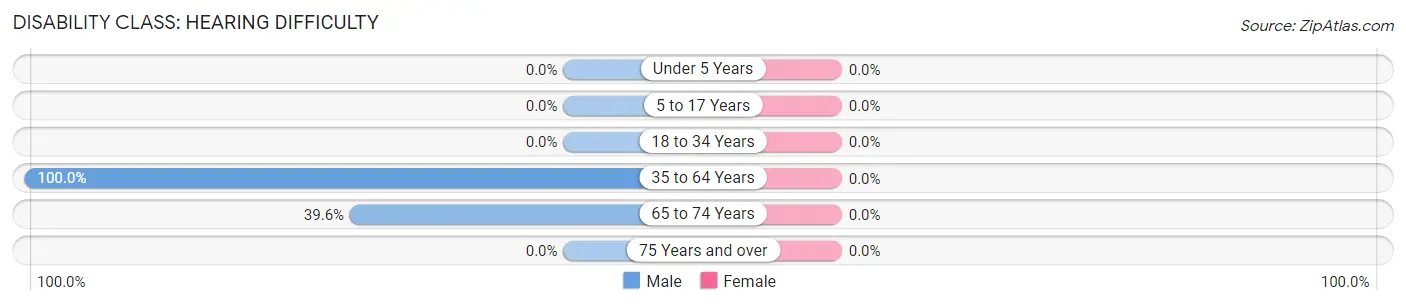
| Age Bracket | Male | Female |
| Under 5 Years | 0 (0.0%) | 0 (0.0%) |
| 5 to 17 Years | 0 (0.0%) | 0 (0.0%) |
| 18 to 34 Years | 0 (0.0%) | 0 (0.0%) |
| 35 to 64 Years | 18 (100.0%) | 0 (0.0%) |
| 65 to 74 Years | 21 (39.6%) | 0 (0.0%) |
| 75 Years and over | 0 (0.0%) | 0 (0.0%) |
Disability Class: Vision Difficulty
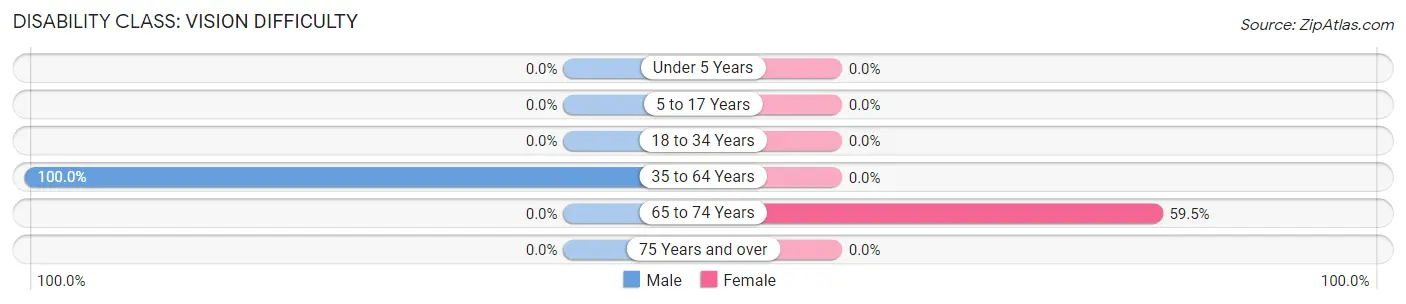
| Age Bracket | Male | Female |
| Under 5 Years | 0 (0.0%) | 0 (0.0%) |
| 5 to 17 Years | 0 (0.0%) | 0 (0.0%) |
| 18 to 34 Years | 0 (0.0%) | 0 (0.0%) |
| 35 to 64 Years | 18 (100.0%) | 0 (0.0%) |
| 65 to 74 Years | 0 (0.0%) | 50 (59.5%) |
| 75 Years and over | 0 (0.0%) | 0 (0.0%) |
Disability Class: Cognitive Difficulty

| Age Bracket | Male | Female |
| 5 to 17 Years | 0 (0.0%) | 0 (0.0%) |
| 18 to 34 Years | 0 (0.0%) | 0 (0.0%) |
| 35 to 64 Years | 18 (100.0%) | 0 (0.0%) |
| 65 to 74 Years | 0 (0.0%) | 0 (0.0%) |
| 75 Years and over | 0 (0.0%) | 0 (0.0%) |
Disability Class: Ambulatory Difficulty
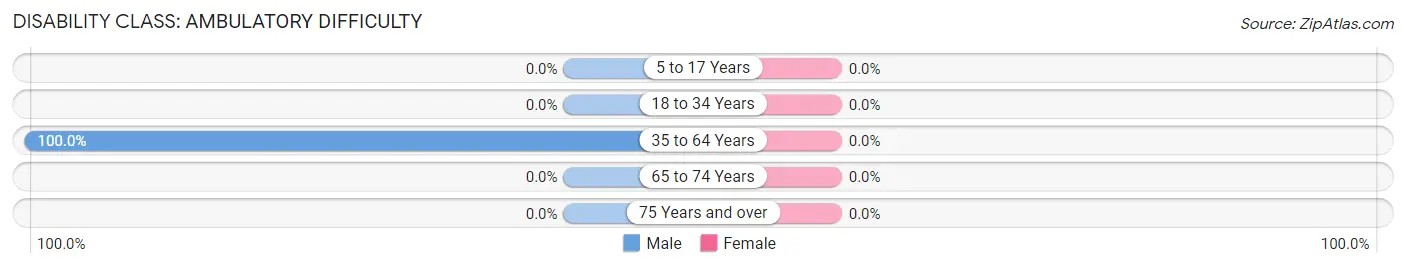
| Age Bracket | Male | Female |
| 5 to 17 Years | 0 (0.0%) | 0 (0.0%) |
| 18 to 34 Years | 0 (0.0%) | 0 (0.0%) |
| 35 to 64 Years | 18 (100.0%) | 0 (0.0%) |
| 65 to 74 Years | 0 (0.0%) | 0 (0.0%) |
| 75 Years and over | 0 (0.0%) | 0 (0.0%) |
Disability Class: Self-Care Difficulty
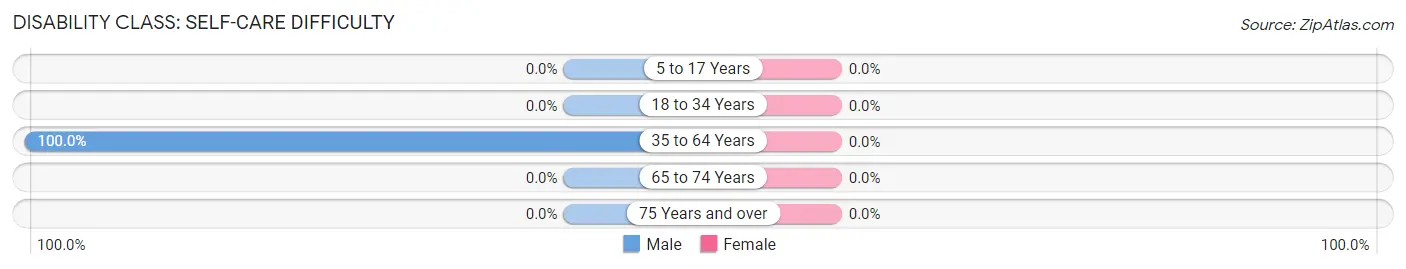
| Age Bracket | Male | Female |
| 5 to 17 Years | 0 (0.0%) | 0 (0.0%) |
| 18 to 34 Years | 0 (0.0%) | 0 (0.0%) |
| 35 to 64 Years | 18 (100.0%) | 0 (0.0%) |
| 65 to 74 Years | 0 (0.0%) | 0 (0.0%) |
| 75 Years and over | 0 (0.0%) | 0 (0.0%) |
Technology Access in Vallecito
Computing Device Access in Vallecito
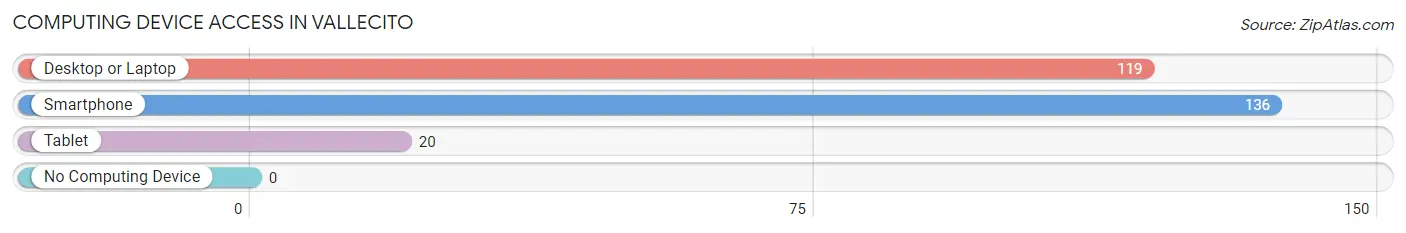
| Device Type | # Households | % Households |
| Desktop or Laptop | 119 | 87.5% |
| Smartphone | 136 | 100.0% |
| Tablet | 20 | 14.7% |
| No Computing Device | 0 | 0.0% |
| Total | 136 | 100.0% |
Internet Access in Vallecito
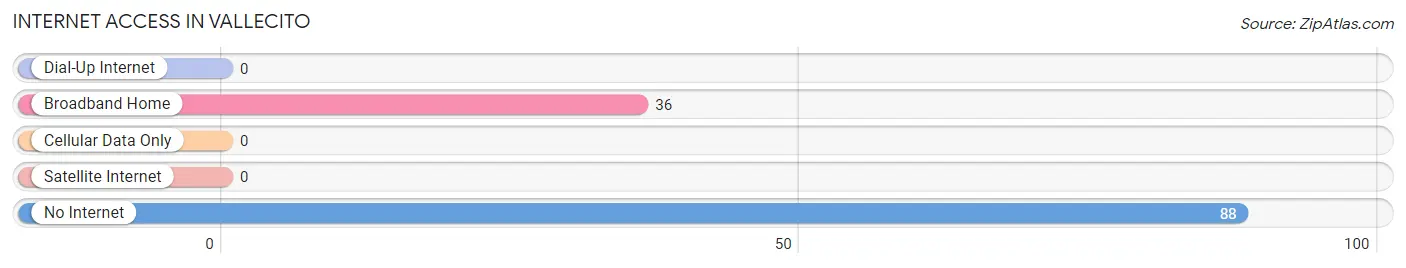
| Internet Type | # Households | % Households |
| Dial-Up Internet | 0 | 0.0% |
| Broadband Home | 36 | 26.5% |
| Cellular Data Only | 0 | 0.0% |
| Satellite Internet | 0 | 0.0% |
| No Internet | 88 | 64.7% |
| Total | 136 | 100.0% |
Vallecito Summary
Vallecito is a small unincorporated community located in Calaveras County, California. It is situated in the foothills of the Sierra Nevada Mountains, approximately 25 miles northeast of the city of Angels Camp. Vallecito is a rural community with a population of approximately 1,000 people.
History
Vallecito was first settled in the late 1840s by Mexican miners who were attracted to the area by the gold rush. The town was originally known as “Little Valley”, but was later changed to Vallecito, which means “little valley” in Spanish. The town was officially established in 1851 and was home to a number of businesses, including a hotel, saloon, and general store.
In the late 1800s, Vallecito was a popular destination for tourists who wanted to experience the beauty of the Sierra Nevada Mountains. The town was also home to a number of ranches and farms, which provided the local economy with a steady source of income.
Geography
Vallecito is located in the foothills of the Sierra Nevada Mountains, approximately 25 miles northeast of the city of Angels Camp. The town is situated at an elevation of 1,890 feet and is surrounded by rolling hills and oak-studded meadows. The nearby Stanislaus River provides a scenic backdrop to the town.
The climate in Vallecito is mild and temperate, with hot summers and cool winters. The average annual temperature is around 60 degrees Fahrenheit. The area receives an average of 20 inches of precipitation per year, most of which falls in the form of snow during the winter months.
Economy
The economy of Vallecito is largely based on agriculture and tourism. The town is home to a number of ranches and farms, which produce a variety of crops, including apples, pears, and walnuts. The nearby Stanislaus River also provides a steady source of income for the local fishing industry.
In addition to agriculture, Vallecito is also home to a number of small businesses, including restaurants, shops, and lodging. The town is also a popular destination for tourists who want to experience the beauty of the Sierra Nevada Mountains.
Demographics
As of the 2010 census, the population of Vallecito was 1,000 people. The racial makeup of the town was 94.2% White, 0.7% African American, 0.7% Native American, 0.7% Asian, 0.7% Pacific Islander, and 2.7% from other races. The median household income was $45,000, and the median age was 44 years.
Conclusion
Vallecito is a small unincorporated community located in Calaveras County, California. It is situated in the foothills of the Sierra Nevada Mountains, approximately 25 miles northeast of the city of Angels Camp. Vallecito is a rural community with a population of approximately 1,000 people. The economy of Vallecito is largely based on agriculture and tourism, and the town is home to a number of small businesses, including restaurants, shops, and lodging. The racial makeup of the town is 94.2% White, 0.7% African American, 0.7% Native American, 0.7% Asian, 0.7% Pacific Islander, and 2.7% from other races. The median household income was $45,000, and the median age was 44 years. Vallecito is a beautiful and peaceful community that offers its residents and visitors a unique and enjoyable experience.
Common Questions
What is Per Capita Income in Vallecito?
Per Capita income in Vallecito is $44,312.
What is the Median Family Income in Vallecito?
Median Family Income in Vallecito is $88,333.
What is Inequality or Gini Index in Vallecito?
Inequality or Gini Index in Vallecito is 0.53.
What is the Total Population of Vallecito?
Total Population of Vallecito is 213.
What is the Total Male Population of Vallecito?
Total Male Population of Vallecito is 80.
What is the Total Female Population of Vallecito?
Total Female Population of Vallecito is 133.
What is the Ratio of Males per 100 Females in Vallecito?
There are 60.15 Males per 100 Females in Vallecito.
What is the Ratio of Females per 100 Males in Vallecito?
There are 166.25 Females per 100 Males in Vallecito.
What is the Median Population Age in Vallecito?
Median Population Age in Vallecito is 65.8 Years.
What is the Average Family Size in Vallecito
Average Family Size in Vallecito is 1.9 People.
What is the Average Household Size in Vallecito
Average Household Size in Vallecito is 1.6 People.
How Large is the Labor Force in Vallecito?
There are 96 People in the Labor Forcein in Vallecito.
What is the Percentage of People in the Labor Force in Vallecito?
45.1% of People are in the Labor Force in Vallecito.