Crawfordville, GA Map & Demographics
Crawfordville Map
Crawfordville Overview
$26,178
PER CAPITA INCOME
$47,016
AVG FAMILY INCOME
$42,341
AVG HOUSEHOLD INCOME
31.0%
WAGE / INCOME GAP [ % ]
69.0¢/ $1
WAGE / INCOME GAP [ $ ]
0.34
INEQUALITY / GINI INDEX
589
TOTAL POPULATION
279
MALE POPULATION
310
FEMALE POPULATION
90.00
MALES / 100 FEMALES
111.11
FEMALES / 100 MALES
47.3
MEDIAN AGE
3.3
AVG FAMILY SIZE
2.0
AVG HOUSEHOLD SIZE
232
LABOR FORCE [ PEOPLE ]
45.6%
PERCENT IN LABOR FORCE
Crawfordville Zip Codes
Crawfordville Area Codes
Income in Crawfordville
Income Overview in Crawfordville
Per Capita Income in Crawfordville is $26,178, while median incomes of families and households are $47,016 and $42,341 respectively.
| Characteristic | Number | Measure |
| Per Capita Income | 589 | $26,178 |
| Median Family Income | 108 | $47,016 |
| Mean Family Income | 108 | $66,767 |
| Median Household Income | 287 | $42,341 |
| Mean Household Income | 287 | $50,768 |
| Income Deficit | 108 | $0 |
| Wage / Income Gap (%) | 589 | 30.95% |
| Wage / Income Gap ($) | 589 | 69.05¢ per $1 |
| Gini / Inequality Index | 589 | 0.34 |
Earnings by Sex in Crawfordville
Average Earnings in Crawfordville are $32,270, $40,882 for men and $28,229 for women, a difference of 30.9%.
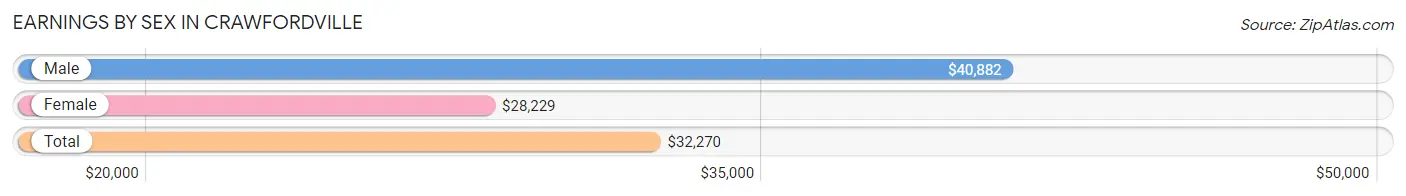
| Sex | Number | Average Earnings |
| Male | 122 (45.7%) | $40,882 |
| Female | 145 (54.3%) | $28,229 |
| Total | 267 (100.0%) | $32,270 |
Earnings by Sex by Income Bracket in Crawfordville
The most common earnings brackets in Crawfordville are $45,000 to $49,999 for men (29 | 23.8%) and $15,000 to $17,499 for women (36 | 24.8%).
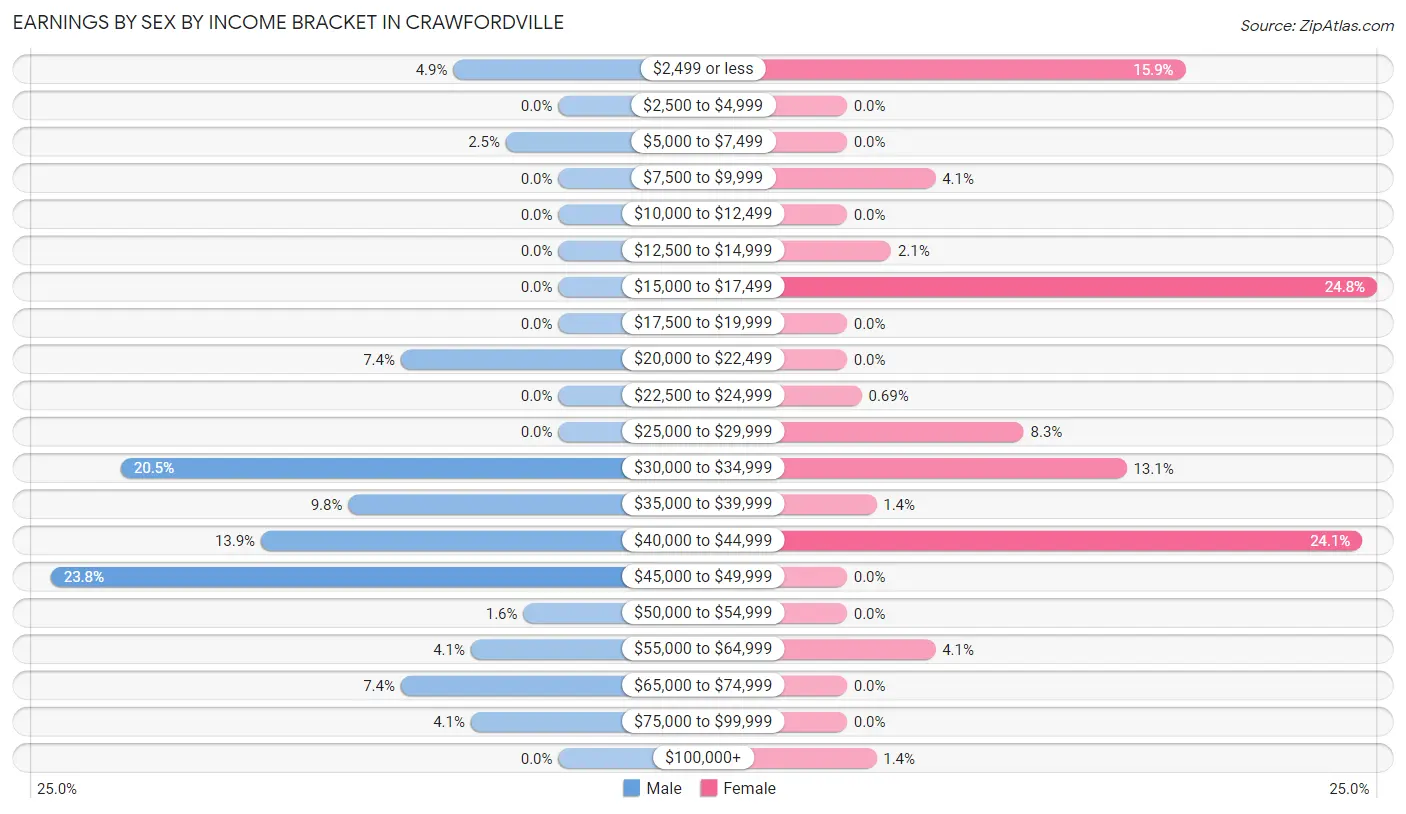
| Income | Male | Female |
| $2,499 or less | 6 (4.9%) | 23 (15.9%) |
| $2,500 to $4,999 | 0 (0.0%) | 0 (0.0%) |
| $5,000 to $7,499 | 3 (2.5%) | 0 (0.0%) |
| $7,500 to $9,999 | 0 (0.0%) | 6 (4.1%) |
| $10,000 to $12,499 | 0 (0.0%) | 0 (0.0%) |
| $12,500 to $14,999 | 0 (0.0%) | 3 (2.1%) |
| $15,000 to $17,499 | 0 (0.0%) | 36 (24.8%) |
| $17,500 to $19,999 | 0 (0.0%) | 0 (0.0%) |
| $20,000 to $22,499 | 9 (7.4%) | 0 (0.0%) |
| $22,500 to $24,999 | 0 (0.0%) | 1 (0.7%) |
| $25,000 to $29,999 | 0 (0.0%) | 12 (8.3%) |
| $30,000 to $34,999 | 25 (20.5%) | 19 (13.1%) |
| $35,000 to $39,999 | 12 (9.8%) | 2 (1.4%) |
| $40,000 to $44,999 | 17 (13.9%) | 35 (24.1%) |
| $45,000 to $49,999 | 29 (23.8%) | 0 (0.0%) |
| $50,000 to $54,999 | 2 (1.6%) | 0 (0.0%) |
| $55,000 to $64,999 | 5 (4.1%) | 6 (4.1%) |
| $65,000 to $74,999 | 9 (7.4%) | 0 (0.0%) |
| $75,000 to $99,999 | 5 (4.1%) | 0 (0.0%) |
| $100,000+ | 0 (0.0%) | 2 (1.4%) |
| Total | 122 (100.0%) | 145 (100.0%) |
Earnings by Sex by Educational Attainment in Crawfordville
Average earnings in Crawfordville are $35,875 for men and $30,833 for women, a difference of 14.1%. Men with an educational attainment of college or associate's degree enjoy the highest average annual earnings of $41,618, while those with high school diploma education earn the least with $36,875. Women with an educational attainment of high school diploma earn the most with the average annual earnings of $29,375, while those with high school diploma education have the smallest earnings of $29,375.
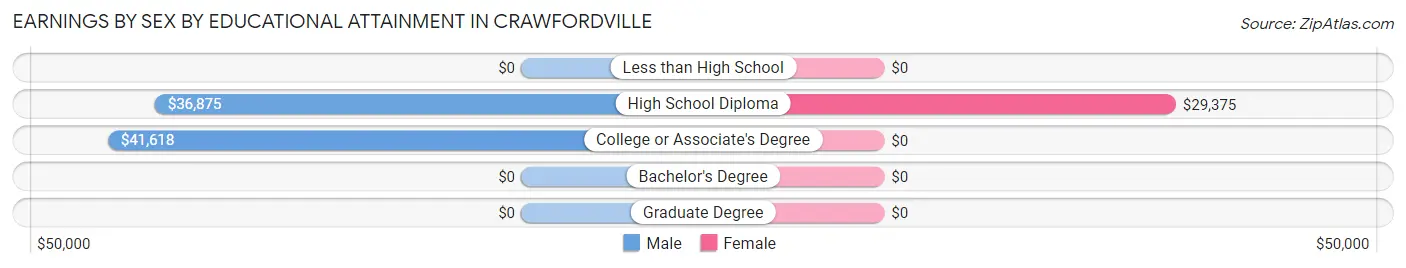
| Educational Attainment | Male Income | Female Income |
| Less than High School | - | - |
| High School Diploma | $36,875 | $29,375 |
| College or Associate's Degree | $41,618 | $0 |
| Bachelor's Degree | - | - |
| Graduate Degree | - | - |
| Total | $35,875 | $30,833 |
Family Income in Crawfordville
Family Income Brackets in Crawfordville
According to the Crawfordville family income data, there are 42 families falling into the $35,000 to $49,999 income range, which is the most common income bracket and makes up 38.9% of all families.
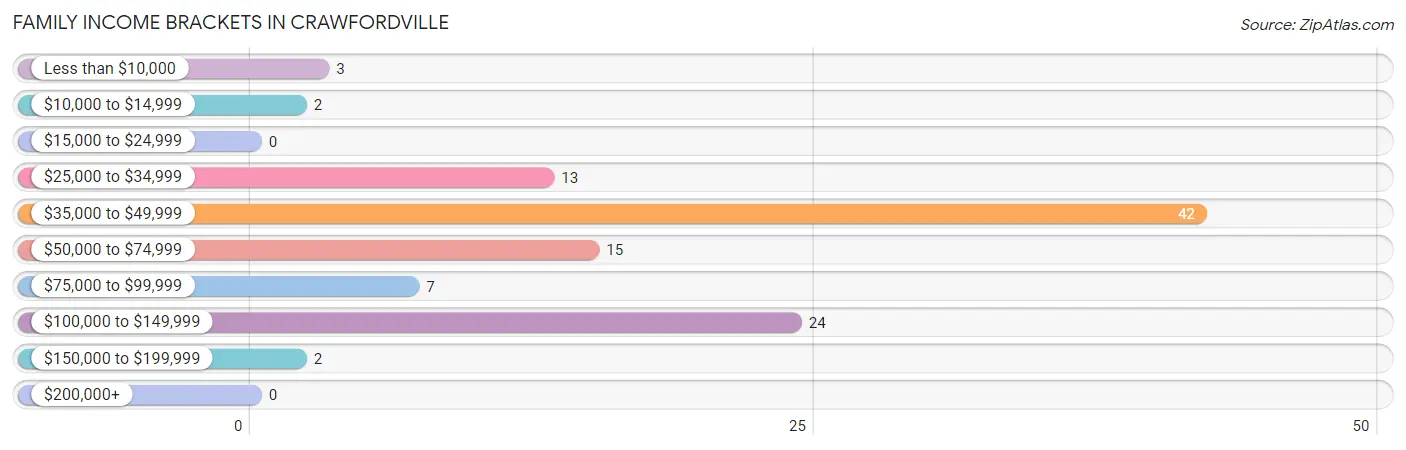
| Income Bracket | # Families | % Families |
| Less than $10,000 | 3 | 2.8% |
| $10,000 to $14,999 | 2 | 1.9% |
| $15,000 to $24,999 | 0 | 0.0% |
| $25,000 to $34,999 | 13 | 12.0% |
| $35,000 to $49,999 | 42 | 38.9% |
| $50,000 to $74,999 | 15 | 13.9% |
| $75,000 to $99,999 | 7 | 6.5% |
| $100,000 to $149,999 | 24 | 22.2% |
| $150,000 to $199,999 | 2 | 1.9% |
| $200,000+ | 0 | 0.0% |
Family Income by Famaliy Size in Crawfordville
4-person families (10 | 9.3%) account for the highest median family income in Crawfordville with $132,917 per family, while 4-person families (10 | 9.3%) have the highest median income of $33,229 per family member.
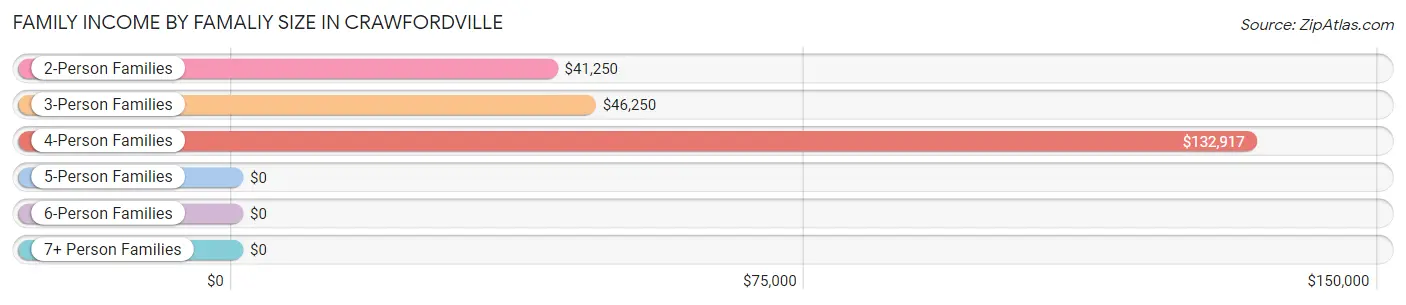
| Income Bracket | # Families | Median Income |
| 2-Person Families | 47 (43.5%) | $41,250 |
| 3-Person Families | 35 (32.4%) | $46,250 |
| 4-Person Families | 10 (9.3%) | $132,917 |
| 5-Person Families | 16 (14.8%) | $0 |
| 6-Person Families | 0 (0.0%) | $0 |
| 7+ Person Families | 0 (0.0%) | $0 |
| Total | 108 (100.0%) | $47,016 |
Family Income by Number of Earners in Crawfordville
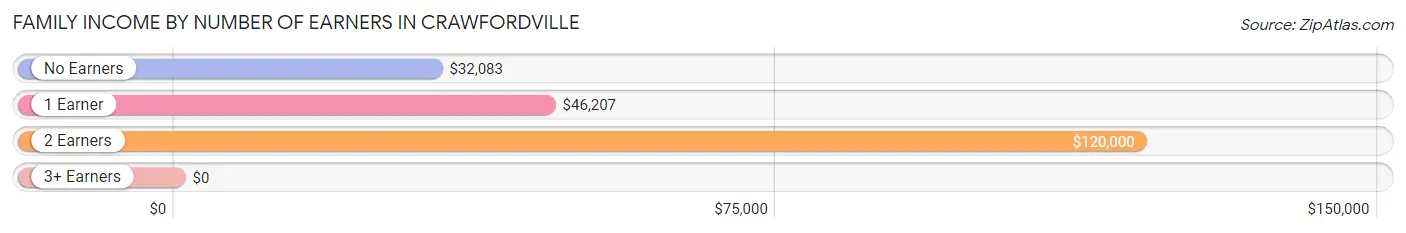
| Number of Earners | # Families | Median Income |
| No Earners | 26 (24.1%) | $32,083 |
| 1 Earner | 40 (37.0%) | $46,207 |
| 2 Earners | 42 (38.9%) | $120,000 |
| 3+ Earners | 0 (0.0%) | $0 |
| Total | 108 (100.0%) | $47,016 |
Household Income in Crawfordville
Household Income Brackets in Crawfordville
With 97 households falling in the category, the $50,000 to $74,999 income range is the most frequent in Crawfordville, accounting for 33.8% of all households.
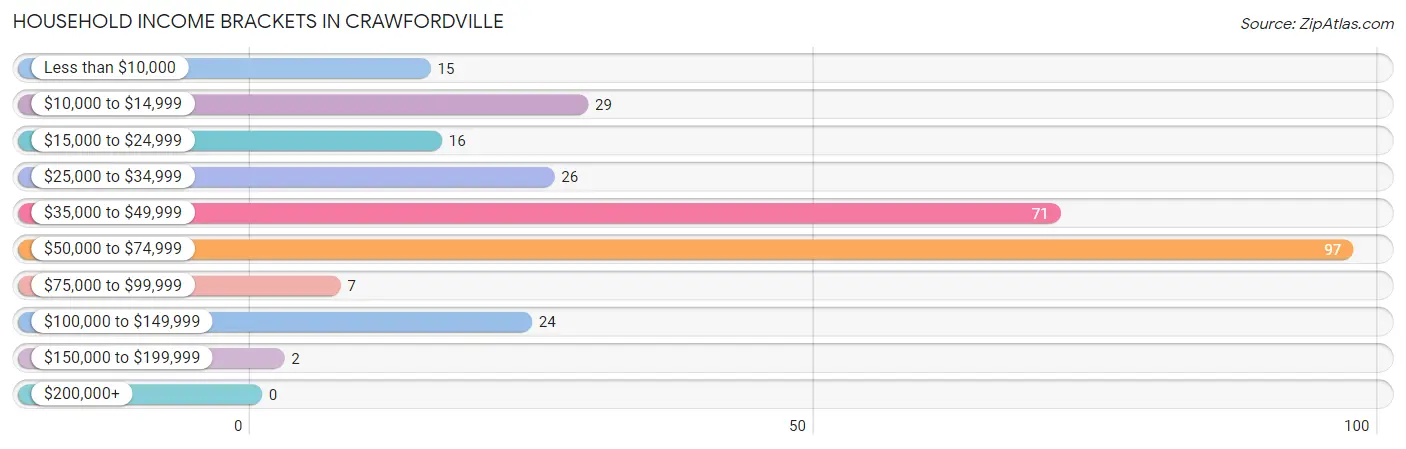
| Income Bracket | # Households | % Households |
| Less than $10,000 | 15 | 5.2% |
| $10,000 to $14,999 | 29 | 10.1% |
| $15,000 to $24,999 | 16 | 5.6% |
| $25,000 to $34,999 | 26 | 9.1% |
| $35,000 to $49,999 | 71 | 24.7% |
| $50,000 to $74,999 | 97 | 33.8% |
| $75,000 to $99,999 | 7 | 2.4% |
| $100,000 to $149,999 | 24 | 8.4% |
| $150,000 to $199,999 | 2 | 0.7% |
| $200,000+ | 0 | 0.0% |
Household Income by Householder Age in Crawfordville
The median household income in Crawfordville is $42,341, with the highest median household income of $57,610 found in the 45 to 64 years age bracket for the primary householder. A total of 111 households (38.7%) fall into this category. Meanwhile, the 15 to 24 years age bracket for the primary householder has the lowest median household income of $0, with 29 households (10.1%) in this group.
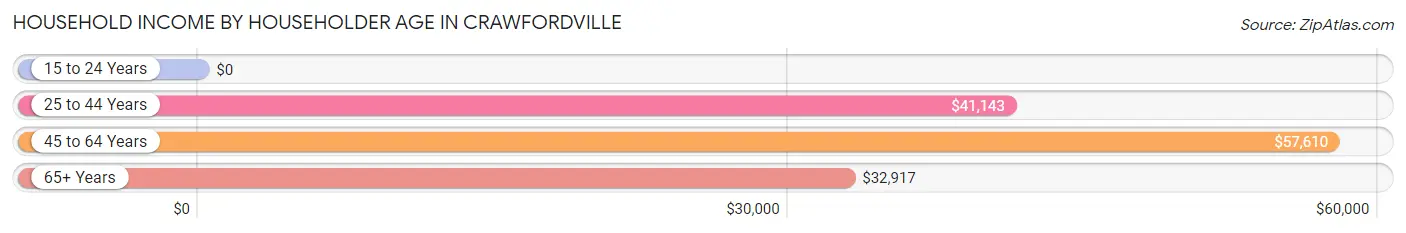
| Income Bracket | # Households | Median Income |
| 15 to 24 Years | 29 (10.1%) | $0 |
| 25 to 44 Years | 50 (17.4%) | $41,143 |
| 45 to 64 Years | 111 (38.7%) | $57,610 |
| 65+ Years | 97 (33.8%) | $32,917 |
| Total | 287 (100.0%) | $42,341 |
Poverty in Crawfordville
Income Below Poverty by Sex and Age in Crawfordville
With 12.2% poverty level for males and 13.2% for females among the residents of Crawfordville, 15 year old males and 35 to 44 year old females are the most vulnerable to poverty, with 6 males (100.0%) and 7 females (53.8%) in their respective age groups living below the poverty level.
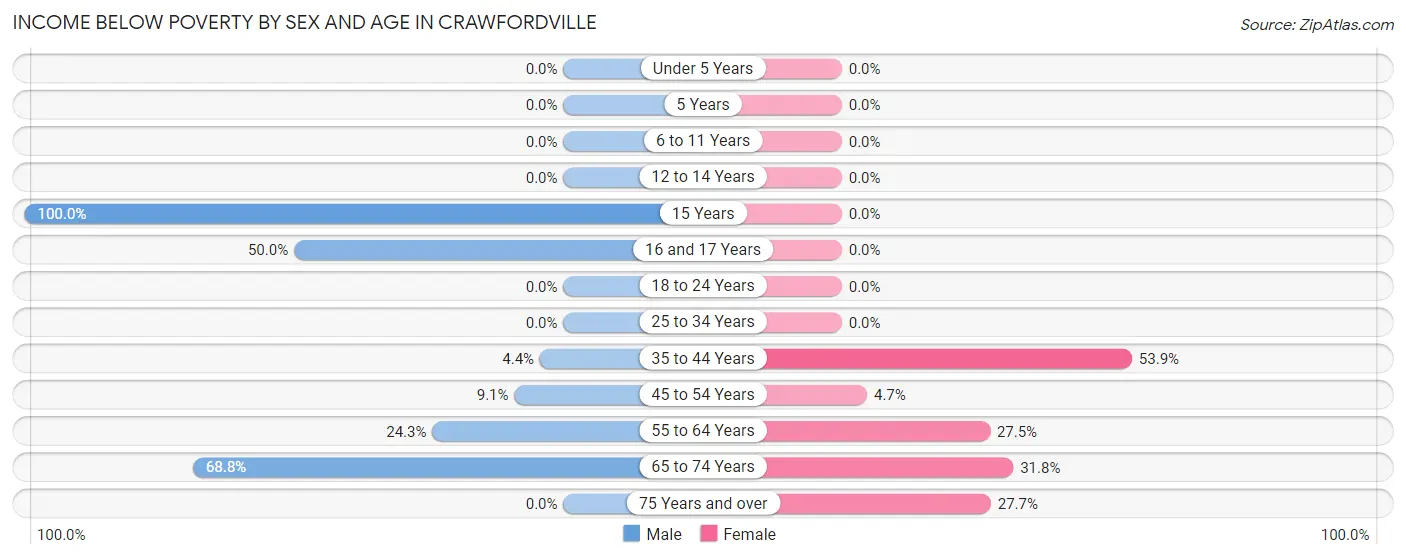
| Age Bracket | Male | Female |
| Under 5 Years | 0 (0.0%) | 0 (0.0%) |
| 5 Years | 0 (0.0%) | 0 (0.0%) |
| 6 to 11 Years | 0 (0.0%) | 0 (0.0%) |
| 12 to 14 Years | 0 (0.0%) | 0 (0.0%) |
| 15 Years | 6 (100.0%) | 0 (0.0%) |
| 16 and 17 Years | 3 (50.0%) | 0 (0.0%) |
| 18 to 24 Years | 0 (0.0%) | 0 (0.0%) |
| 25 to 34 Years | 0 (0.0%) | 0 (0.0%) |
| 35 to 44 Years | 2 (4.3%) | 7 (53.8%) |
| 45 to 54 Years | 3 (9.1%) | 3 (4.7%) |
| 55 to 64 Years | 9 (24.3%) | 11 (27.5%) |
| 65 to 74 Years | 11 (68.8%) | 7 (31.8%) |
| 75 Years and over | 0 (0.0%) | 13 (27.7%) |
| Total | 34 (12.2%) | 41 (13.2%) |
Income Above Poverty by Sex and Age in Crawfordville
According to the poverty statistics in Crawfordville, males aged under 5 years and females aged under 5 years are the age groups that are most secure financially, with 100.0% of males and 100.0% of females in these age groups living above the poverty line.
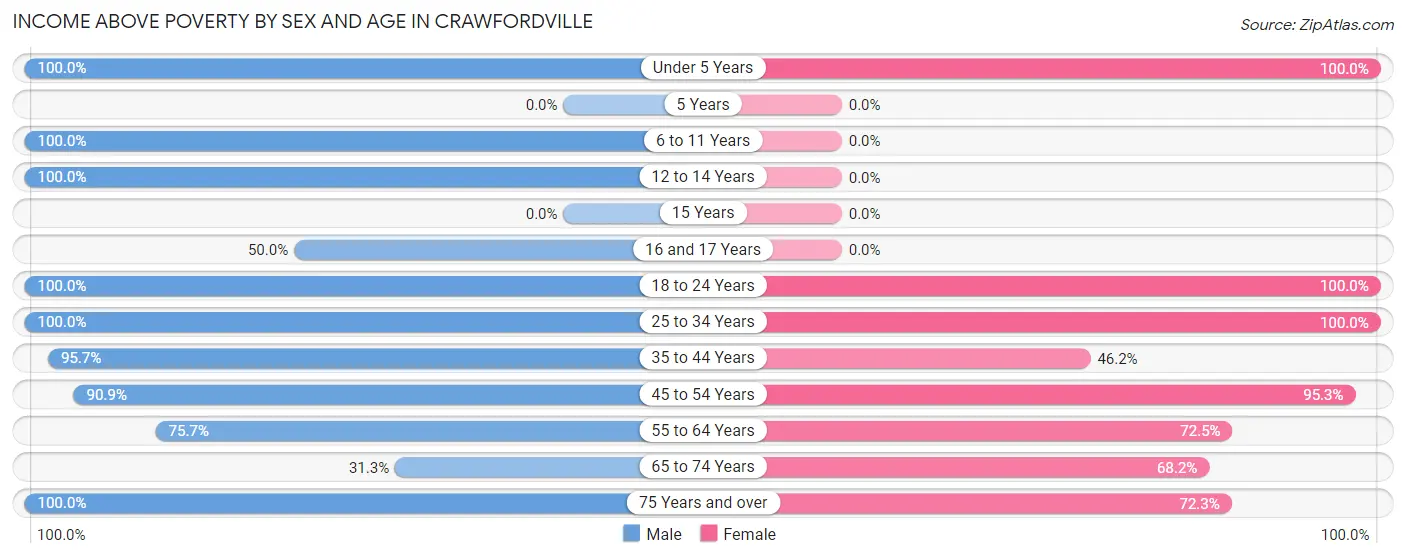
| Age Bracket | Male | Female |
| Under 5 Years | 41 (100.0%) | 26 (100.0%) |
| 5 Years | 0 (0.0%) | 0 (0.0%) |
| 6 to 11 Years | 4 (100.0%) | 0 (0.0%) |
| 12 to 14 Years | 3 (100.0%) | 0 (0.0%) |
| 15 Years | 0 (0.0%) | 0 (0.0%) |
| 16 and 17 Years | 3 (50.0%) | 0 (0.0%) |
| 18 to 24 Years | 29 (100.0%) | 27 (100.0%) |
| 25 to 34 Years | 11 (100.0%) | 71 (100.0%) |
| 35 to 44 Years | 44 (95.7%) | 6 (46.2%) |
| 45 to 54 Years | 30 (90.9%) | 61 (95.3%) |
| 55 to 64 Years | 28 (75.7%) | 29 (72.5%) |
| 65 to 74 Years | 5 (31.2%) | 15 (68.2%) |
| 75 Years and over | 47 (100.0%) | 34 (72.3%) |
| Total | 245 (87.8%) | 269 (86.8%) |
Income Below Poverty Among Married-Couple Families in Crawfordville
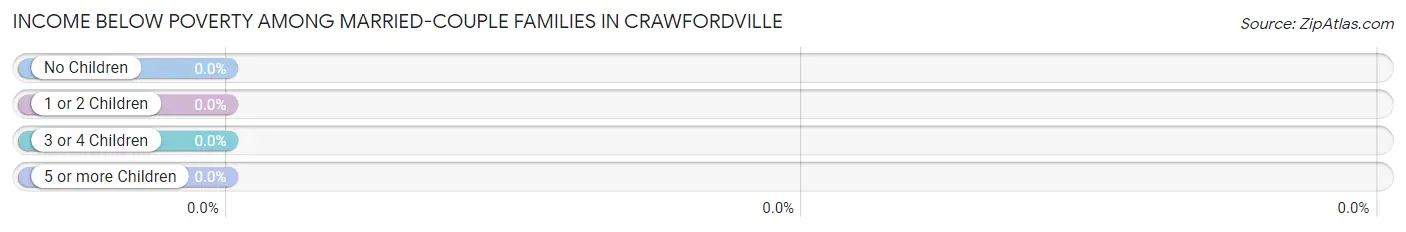
| Children | Above Poverty | Below Poverty |
| No Children | 31 (100.0%) | 0 (0.0%) |
| 1 or 2 Children | 24 (100.0%) | 0 (0.0%) |
| 3 or 4 Children | 0 (0.0%) | 0 (0.0%) |
| 5 or more Children | 0 (0.0%) | 0 (0.0%) |
| Total | 55 (100.0%) | 0 (0.0%) |
Income Below Poverty Among Single-Parent Households in Crawfordville
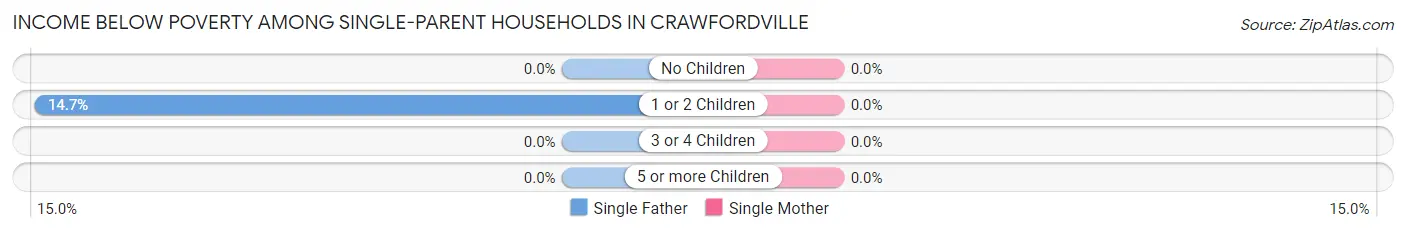
| Children | Single Father | Single Mother |
| No Children | 0 (0.0%) | 0 (0.0%) |
| 1 or 2 Children | 5 (14.7%) | 0 (0.0%) |
| 3 or 4 Children | 0 (0.0%) | 0 (0.0%) |
| 5 or more Children | 0 (0.0%) | 0 (0.0%) |
| Total | 5 (14.7%) | 0 (0.0%) |
Income Below Poverty Among Married-Couple vs Single-Parent Households in Crawfordville
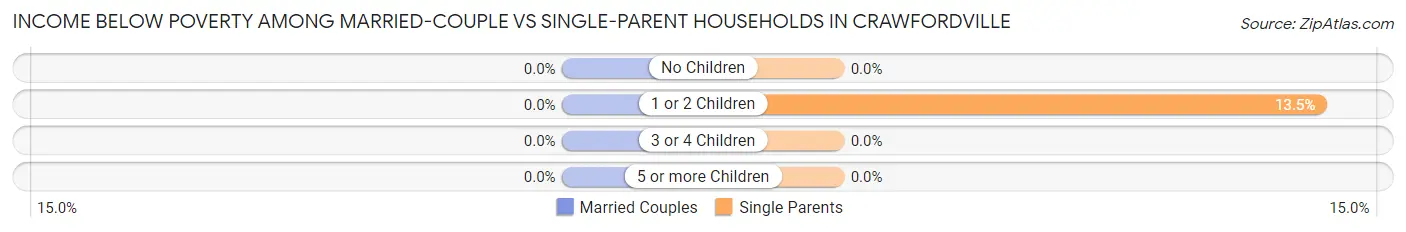
| Children | Married-Couple Families | Single-Parent Households |
| No Children | 0 (0.0%) | 0 (0.0%) |
| 1 or 2 Children | 0 (0.0%) | 5 (13.5%) |
| 3 or 4 Children | 0 (0.0%) | 0 (0.0%) |
| 5 or more Children | 0 (0.0%) | 0 (0.0%) |
| Total | 0 (0.0%) | 5 (9.4%) |
Race in Crawfordville
The most populous races in Crawfordville are White / Caucasian (303 | 51.4%), Black / African American (200 | 34.0%), and Two or more Races (82 | 13.9%).
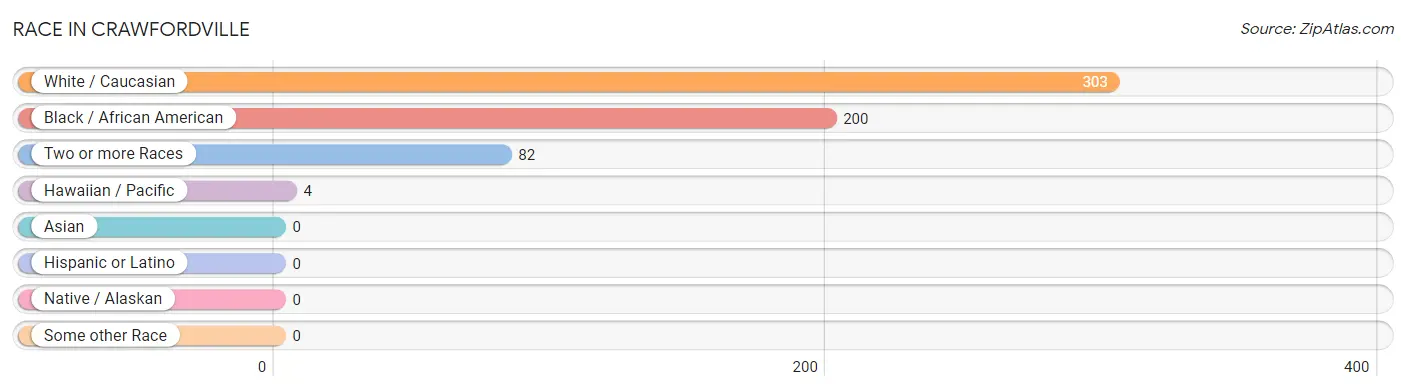
| Race | # Population | % Population |
| Asian | 0 | 0.0% |
| Black / African American | 200 | 34.0% |
| Hawaiian / Pacific | 4 | 0.7% |
| Hispanic or Latino | 0 | 0.0% |
| Native / Alaskan | 0 | 0.0% |
| White / Caucasian | 303 | 51.4% |
| Two or more Races | 82 | 13.9% |
| Some other Race | 0 | 0.0% |
| Total | 589 | 100.0% |
Ancestry in Crawfordville
The most populous ancestries reported in Crawfordville are English (62 | 10.5%), Bhutanese (34 | 5.8%), Irish (29 | 4.9%), Italian (28 | 4.8%), and American (12 | 2.0%), together accounting for 28.0% of all Crawfordville residents.
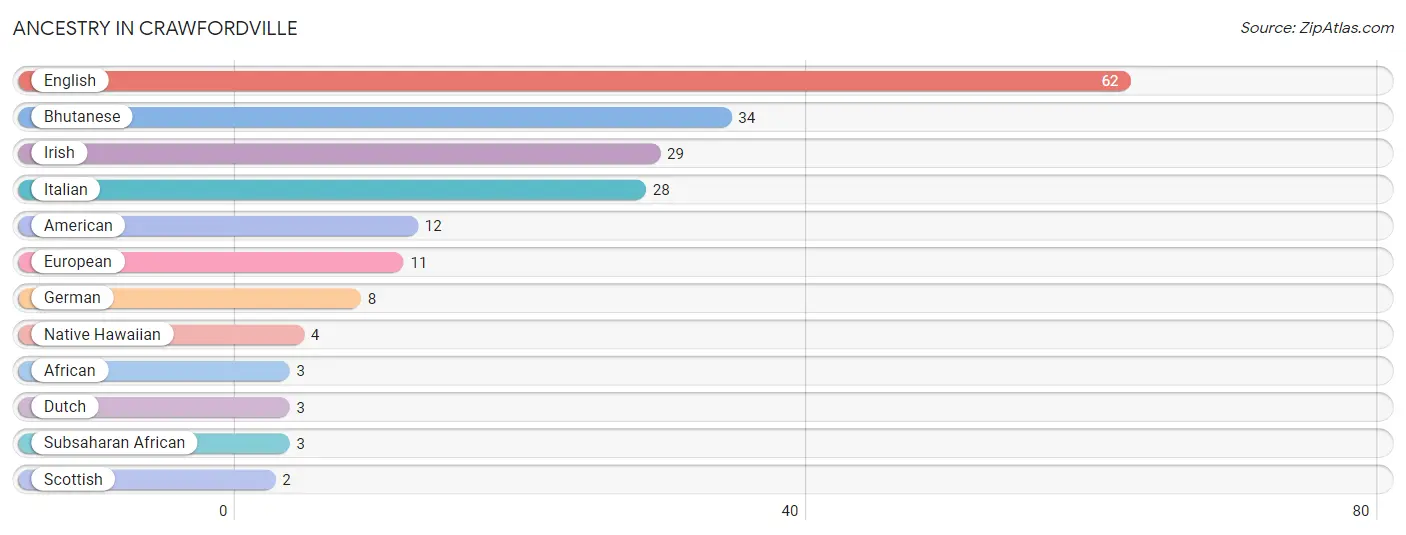
| Ancestry | # Population | % Population |
| African | 3 | 0.5% |
| American | 12 | 2.0% |
| Bhutanese | 34 | 5.8% |
| Dutch | 3 | 0.5% |
| English | 62 | 10.5% |
| European | 11 | 1.9% |
| German | 8 | 1.4% |
| Irish | 29 | 4.9% |
| Italian | 28 | 4.8% |
| Native Hawaiian | 4 | 0.7% |
| Scottish | 2 | 0.3% |
| Subsaharan African | 3 | 0.5% | View All 12 Rows |
Immigrants in Crawfordville

| Immigration Origin | # Population | % Population | View All 0 Rows |
Sex and Age in Crawfordville
Sex and Age in Crawfordville
The most populous age groups in Crawfordville are 40 to 44 Years (46 | 16.5%) for men and 25 to 29 Years (71 | 22.9%) for women.
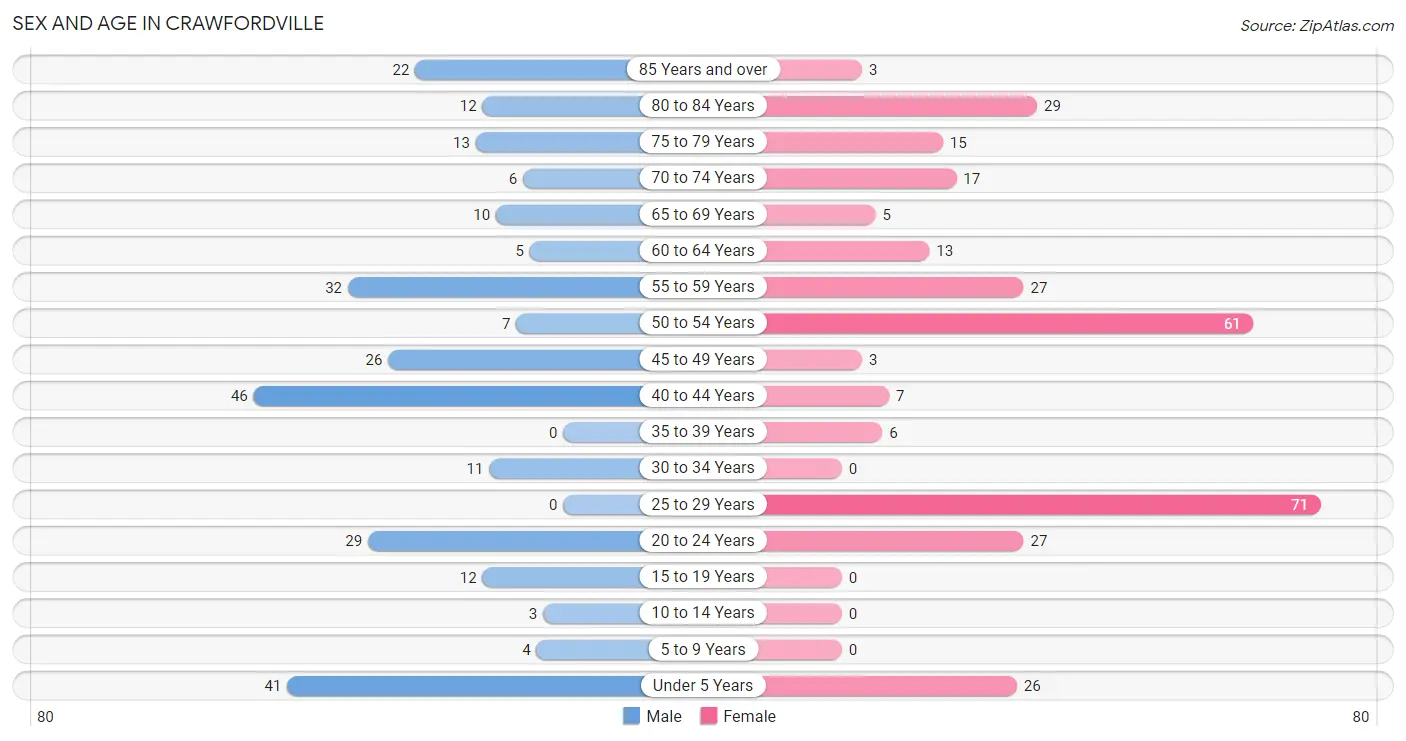
| Age Bracket | Male | Female |
| Under 5 Years | 41 (14.7%) | 26 (8.4%) |
| 5 to 9 Years | 4 (1.4%) | 0 (0.0%) |
| 10 to 14 Years | 3 (1.1%) | 0 (0.0%) |
| 15 to 19 Years | 12 (4.3%) | 0 (0.0%) |
| 20 to 24 Years | 29 (10.4%) | 27 (8.7%) |
| 25 to 29 Years | 0 (0.0%) | 71 (22.9%) |
| 30 to 34 Years | 11 (3.9%) | 0 (0.0%) |
| 35 to 39 Years | 0 (0.0%) | 6 (1.9%) |
| 40 to 44 Years | 46 (16.5%) | 7 (2.3%) |
| 45 to 49 Years | 26 (9.3%) | 3 (1.0%) |
| 50 to 54 Years | 7 (2.5%) | 61 (19.7%) |
| 55 to 59 Years | 32 (11.5%) | 27 (8.7%) |
| 60 to 64 Years | 5 (1.8%) | 13 (4.2%) |
| 65 to 69 Years | 10 (3.6%) | 5 (1.6%) |
| 70 to 74 Years | 6 (2.1%) | 17 (5.5%) |
| 75 to 79 Years | 13 (4.7%) | 15 (4.8%) |
| 80 to 84 Years | 12 (4.3%) | 29 (9.3%) |
| 85 Years and over | 22 (7.9%) | 3 (1.0%) |
| Total | 279 (100.0%) | 310 (100.0%) |
Families and Households in Crawfordville
Median Family Size in Crawfordville
The median family size in Crawfordville is 3.27 persons per family, with single female/mother families (19 | 17.6%) accounting for the largest median family size of 4.47 persons per family. On the other hand, single male/father families (34 | 31.5%) represent the smallest median family size with 2.26 persons per family.
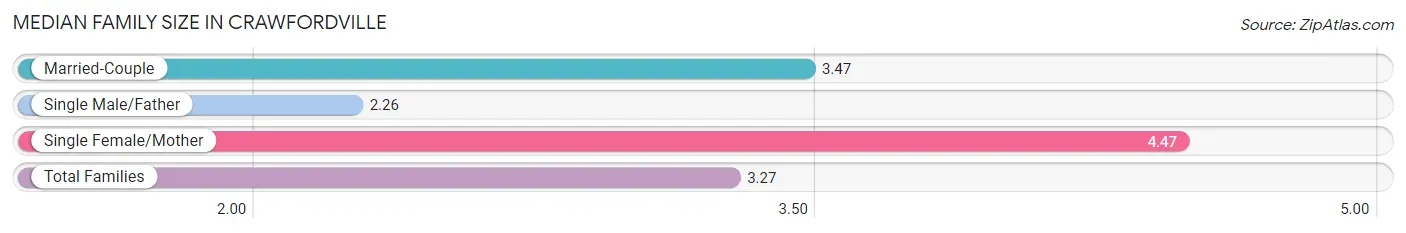
| Family Type | # Families | Family Size |
| Married-Couple | 55 (50.9%) | 3.47 |
| Single Male/Father | 34 (31.5%) | 2.26 |
| Single Female/Mother | 19 (17.6%) | 4.47 |
| Total Families | 108 (100.0%) | 3.27 |
Median Household Size in Crawfordville
The median household size in Crawfordville is 2.05 persons per household, with single female/mother households (19 | 6.6%) accounting for the largest median household size of 4.95 persons per household. non-family households (179 | 62.4%) represent the smallest median household size with 1.05 persons per household.
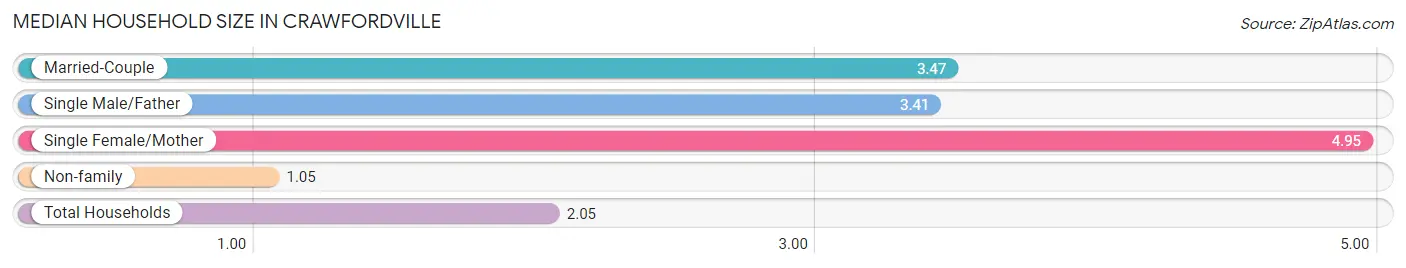
| Household Type | # Households | Household Size |
| Married-Couple | 55 (19.2%) | 3.47 |
| Single Male/Father | 34 (11.8%) | 3.41 |
| Single Female/Mother | 19 (6.6%) | 4.95 |
| Non-family | 179 (62.4%) | 1.05 |
| Total Households | 287 (100.0%) | 2.05 |
Household Size by Marriage Status in Crawfordville
Out of a total of 287 households in Crawfordville, 108 (37.6%) are family households, while 179 (62.4%) are nonfamily households. The most numerous type of family households are 4-person households, comprising 39, and the most common type of nonfamily households are 1-person households, comprising 172.
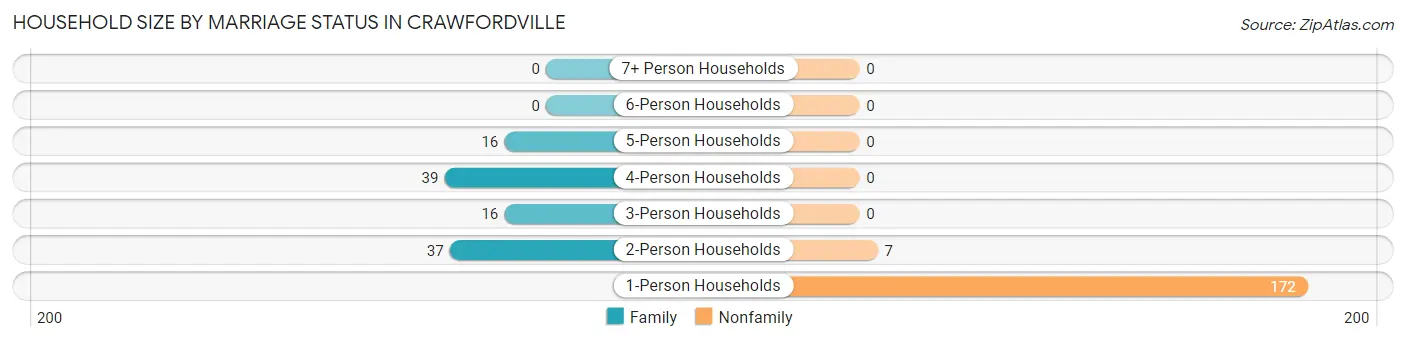
| Household Size | Family Households | Nonfamily Households |
| 1-Person Households | - | 172 (59.9%) |
| 2-Person Households | 37 (12.9%) | 7 (2.4%) |
| 3-Person Households | 16 (5.6%) | 0 (0.0%) |
| 4-Person Households | 39 (13.6%) | 0 (0.0%) |
| 5-Person Households | 16 (5.6%) | 0 (0.0%) |
| 6-Person Households | 0 (0.0%) | 0 (0.0%) |
| 7+ Person Households | 0 (0.0%) | 0 (0.0%) |
| Total | 108 (37.6%) | 179 (62.4%) |
Female Fertility in Crawfordville
Fertility by Age in Crawfordville
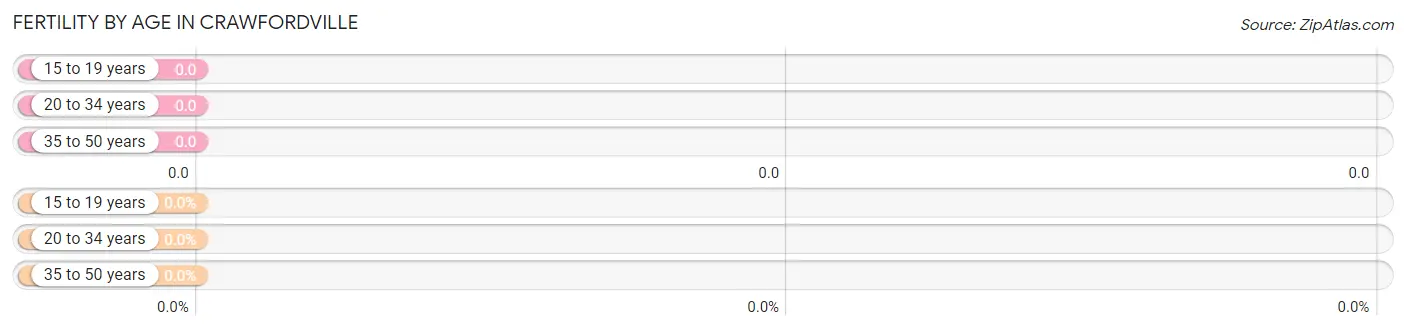
| Age Bracket | Women with Births | Births / 1,000 Women |
| 15 to 19 years | 0 (0.0%) | 0.0 |
| 20 to 34 years | 0 (0.0%) | 0.0 |
| 35 to 50 years | 0 (0.0%) | 0.0 |
| Total | 0 (0.0%) | 0.0 |
Fertility by Age by Marriage Status in Crawfordville
| Age Bracket | Married | Unmarried |
| 15 to 19 years | 0 (0.0%) | 0 (0.0%) |
| 20 to 34 years | 0 (0.0%) | 0 (0.0%) |
| 35 to 50 years | 0 (0.0%) | 0 (0.0%) |
| Total | 0 (0.0%) | 0 (0.0%) |
Fertility by Education in Crawfordville
| Educational Attainment | Women with Births | Births / 1,000 Women |
| Less than High School | 0 (0.0%) | 0.0 |
| High School Diploma | 0 (0.0%) | 0.0 |
| College or Associate's Degree | 0 (0.0%) | 0.0 |
| Bachelor's Degree | 0 (0.0%) | 0.0 |
| Graduate Degree | 0 (0.0%) | 0.0 |
| Total | 0 (0.0%) | 0.0 |
Fertility by Education by Marriage Status in Crawfordville
| Educational Attainment | Married | Unmarried |
| Less than High School | 0 (0.0%) | 0 (0.0%) |
| High School Diploma | 0 (0.0%) | 0 (0.0%) |
| College or Associate's Degree | 0 (0.0%) | 0 (0.0%) |
| Bachelor's Degree | 0 (0.0%) | 0 (0.0%) |
| Graduate Degree | 0 (0.0%) | 0 (0.0%) |
| Total | 0 (0.0%) | 0 (0.0%) |
Employment Characteristics in Crawfordville
Employment by Class of Employer in Crawfordville
Among the 232 employed individuals in Crawfordville, private company employees (115 | 49.6%), state government employees (60 | 25.9%), and self-employed (not incorporated) (32 | 13.8%) make up the most common classes of employment.
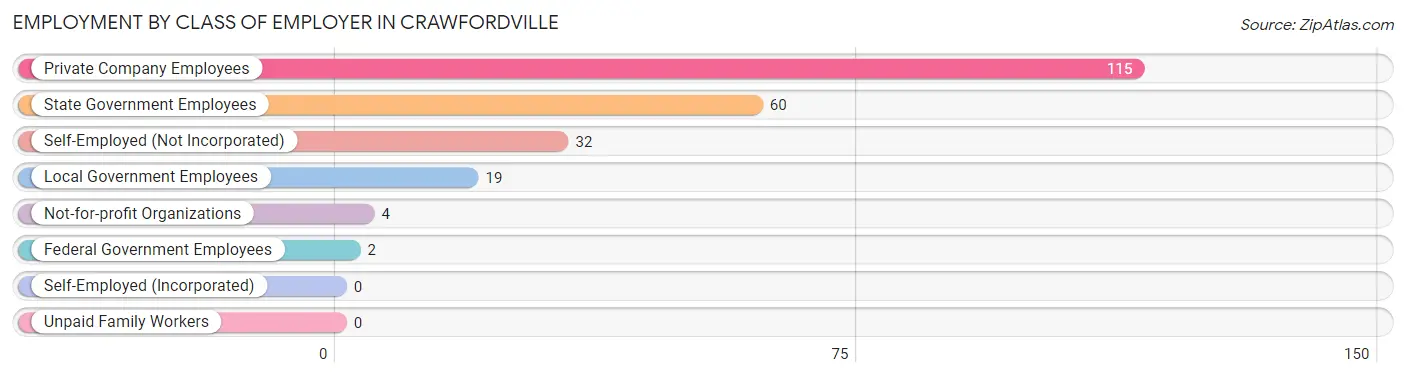
| Employer Class | # Employees | % Employees |
| Private Company Employees | 115 | 49.6% |
| Self-Employed (Incorporated) | 0 | 0.0% |
| Self-Employed (Not Incorporated) | 32 | 13.8% |
| Not-for-profit Organizations | 4 | 1.7% |
| Local Government Employees | 19 | 8.2% |
| State Government Employees | 60 | 25.9% |
| Federal Government Employees | 2 | 0.9% |
| Unpaid Family Workers | 0 | 0.0% |
| Total | 232 | 100.0% |
Employment Status by Age in Crawfordville
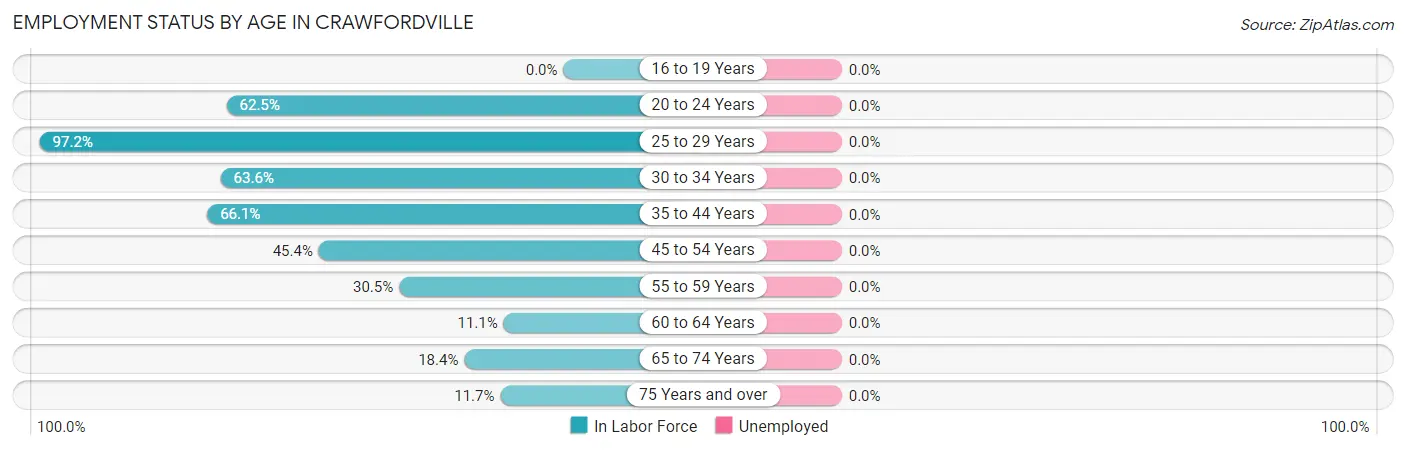
| Age Bracket | In Labor Force | Unemployed |
| 16 to 19 Years | 0 (0.0%) | 0 (0.0%) |
| 20 to 24 Years | 35 (62.5%) | 0 (0.0%) |
| 25 to 29 Years | 69 (97.2%) | 0 (0.0%) |
| 30 to 34 Years | 7 (63.6%) | 0 (0.0%) |
| 35 to 44 Years | 39 (66.1%) | 0 (0.0%) |
| 45 to 54 Years | 44 (45.4%) | 0 (0.0%) |
| 55 to 59 Years | 18 (30.5%) | 0 (0.0%) |
| 60 to 64 Years | 2 (11.1%) | 0 (0.0%) |
| 65 to 74 Years | 7 (18.4%) | 0 (0.0%) |
| 75 Years and over | 11 (11.7%) | 0 (0.0%) |
| Total | 232 (45.6%) | 0 (0.0%) |
Employment Status by Educational Attainment in Crawfordville
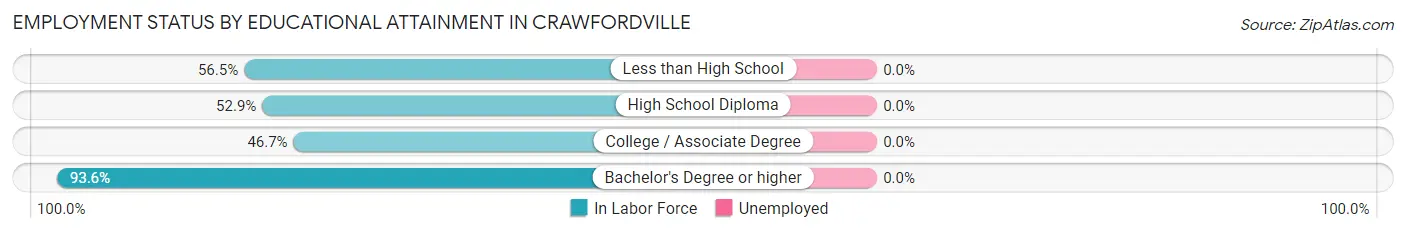
| Educational Attainment | In Labor Force | Unemployed |
| Less than High School | 26 (56.5%) | 0 (0.0%) |
| High School Diploma | 46 (52.9%) | 0 (0.0%) |
| College / Associate Degree | 63 (46.7%) | 0 (0.0%) |
| Bachelor's Degree or higher | 44 (93.6%) | 0 (0.0%) |
| Total | 179 (56.8%) | 0 (0.0%) |
Employment Occupations by Sex in Crawfordville
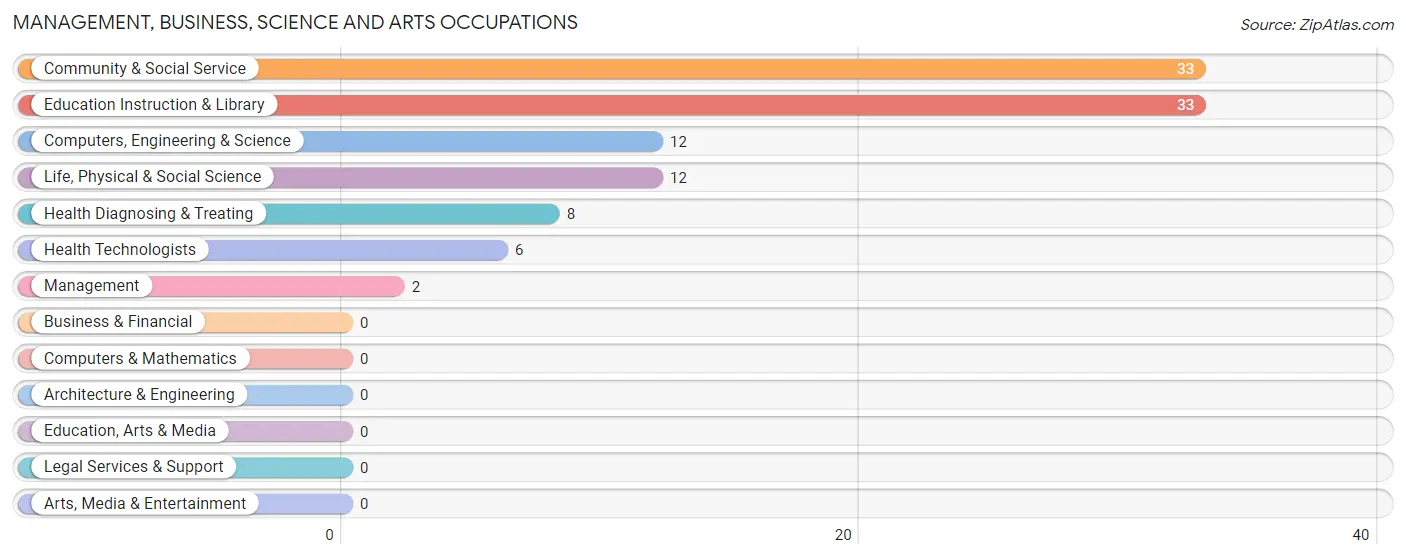
Management, Business, Science and Arts Occupations
The most common Management, Business, Science and Arts occupations in Crawfordville are Community & Social Service (33 | 14.3%), Education Instruction & Library (33 | 14.3%), Computers, Engineering & Science (12 | 5.2%), Life, Physical & Social Science (12 | 5.2%), and Health Diagnosing & Treating (8 | 3.5%).
Management, Business, Science and Arts Occupations by Sex
Within the Management, Business, Science and Arts occupations in Crawfordville, the most male-oriented occupations are Computers, Engineering & Science (100.0%), and Life, Physical & Social Science (100.0%), while the most female-oriented occupations are Management (100.0%), Community & Social Service (100.0%), and Education Instruction & Library (100.0%).
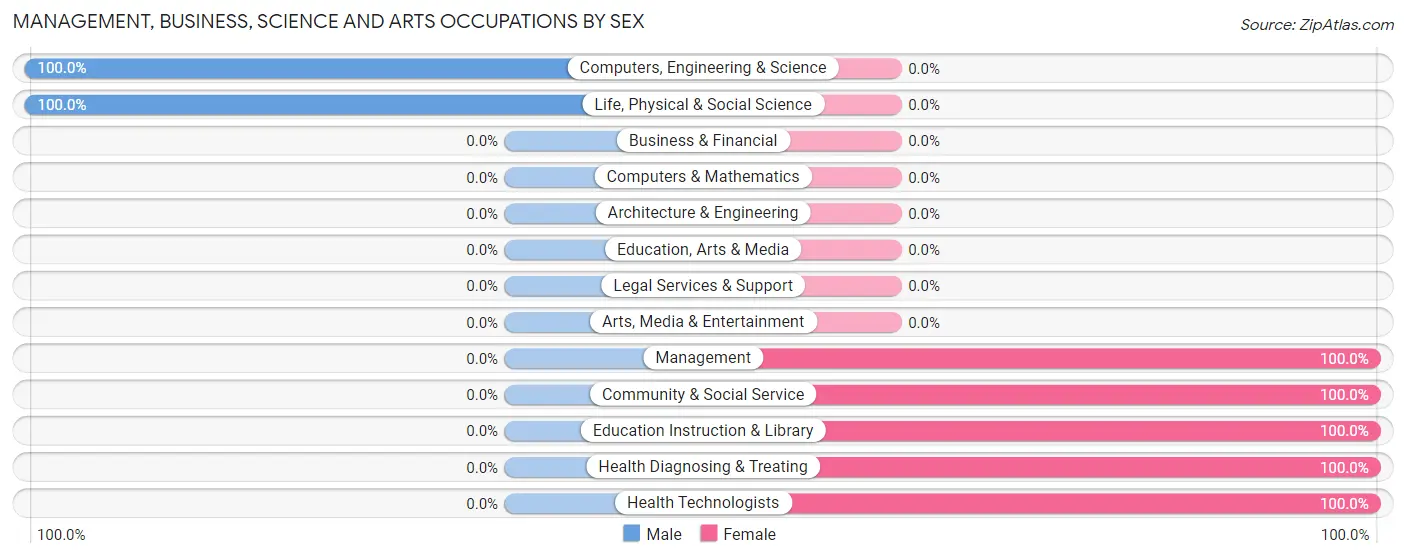
| Occupation | Male | Female |
| Management | 0 (0.0%) | 2 (100.0%) |
| Business & Financial | 0 (0.0%) | 0 (0.0%) |
| Computers, Engineering & Science | 12 (100.0%) | 0 (0.0%) |
| Computers & Mathematics | 0 (0.0%) | 0 (0.0%) |
| Architecture & Engineering | 0 (0.0%) | 0 (0.0%) |
| Life, Physical & Social Science | 12 (100.0%) | 0 (0.0%) |
| Community & Social Service | 0 (0.0%) | 33 (100.0%) |
| Education, Arts & Media | 0 (0.0%) | 0 (0.0%) |
| Legal Services & Support | 0 (0.0%) | 0 (0.0%) |
| Education Instruction & Library | 0 (0.0%) | 33 (100.0%) |
| Arts, Media & Entertainment | 0 (0.0%) | 0 (0.0%) |
| Health Diagnosing & Treating | 0 (0.0%) | 8 (100.0%) |
| Health Technologists | 0 (0.0%) | 6 (100.0%) |
| Total (Category) | 12 (21.8%) | 43 (78.2%) |
| Total (Overall) | 108 (47.0%) | 122 (53.0%) |
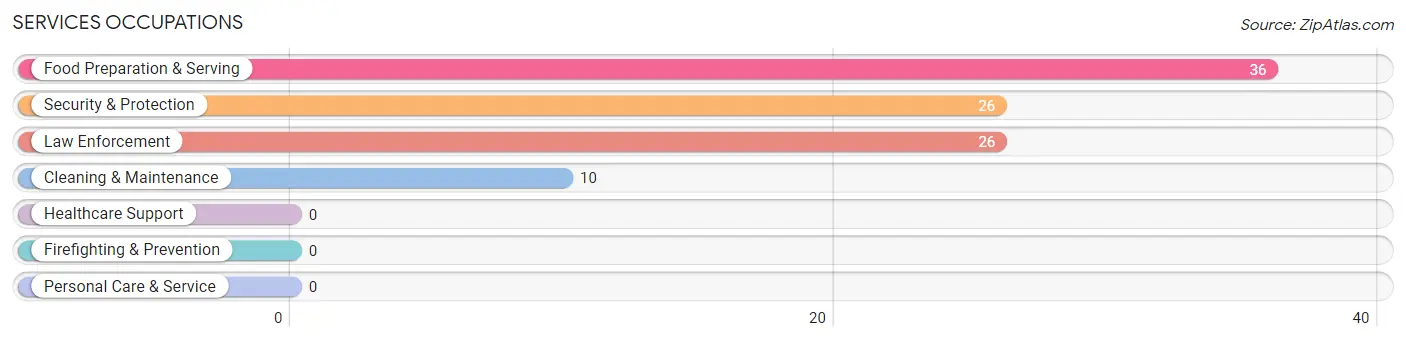
Services Occupations
The most common Services occupations in Crawfordville are Food Preparation & Serving (36 | 15.7%), Security & Protection (26 | 11.3%), Law Enforcement (26 | 11.3%), and Cleaning & Maintenance (10 | 4.3%).
Services Occupations by Sex
Within the Services occupations in Crawfordville, the most male-oriented occupations are Security & Protection (100.0%), and Law Enforcement (100.0%), while the most female-oriented occupations are Food Preparation & Serving (100.0%), and Cleaning & Maintenance (100.0%).
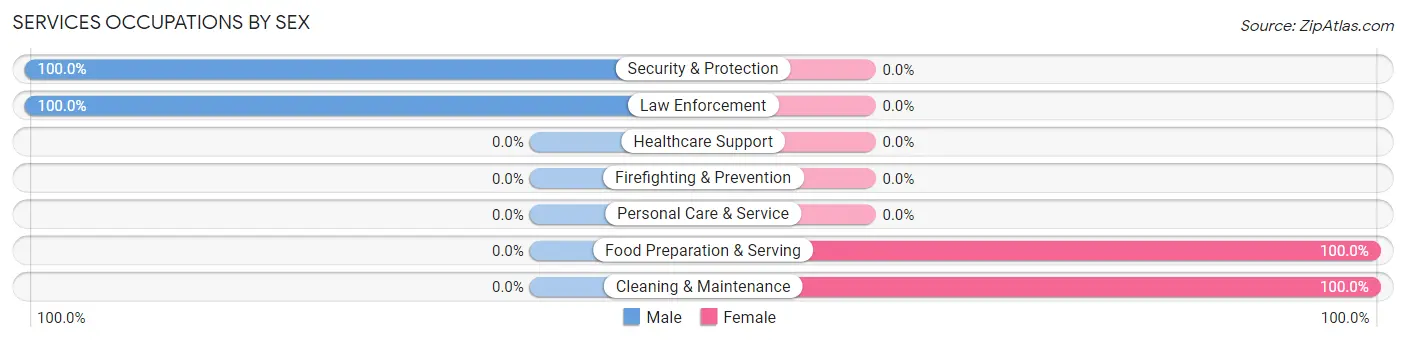
| Occupation | Male | Female |
| Healthcare Support | 0 (0.0%) | 0 (0.0%) |
| Security & Protection | 26 (100.0%) | 0 (0.0%) |
| Firefighting & Prevention | 0 (0.0%) | 0 (0.0%) |
| Law Enforcement | 26 (100.0%) | 0 (0.0%) |
| Food Preparation & Serving | 0 (0.0%) | 36 (100.0%) |
| Cleaning & Maintenance | 0 (0.0%) | 10 (100.0%) |
| Personal Care & Service | 0 (0.0%) | 0 (0.0%) |
| Total (Category) | 26 (36.1%) | 46 (63.9%) |
| Total (Overall) | 108 (47.0%) | 122 (53.0%) |
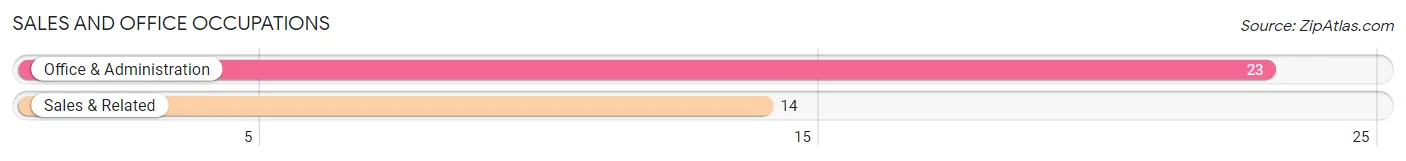
Sales and Office Occupations
The most common Sales and Office occupations in Crawfordville are Office & Administration (23 | 10.0%), and Sales & Related (14 | 6.1%).
Sales and Office Occupations by Sex
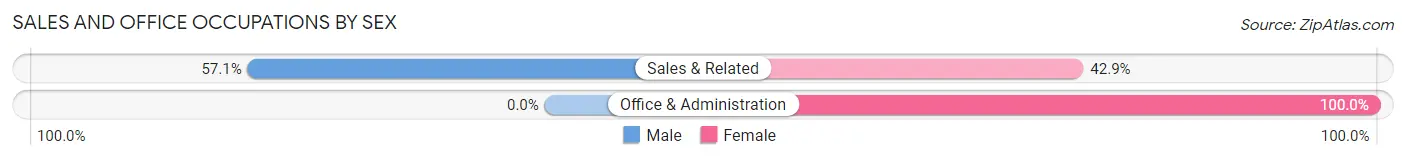
| Occupation | Male | Female |
| Sales & Related | 8 (57.1%) | 6 (42.9%) |
| Office & Administration | 0 (0.0%) | 23 (100.0%) |
| Total (Category) | 8 (21.6%) | 29 (78.4%) |
| Total (Overall) | 108 (47.0%) | 122 (53.0%) |
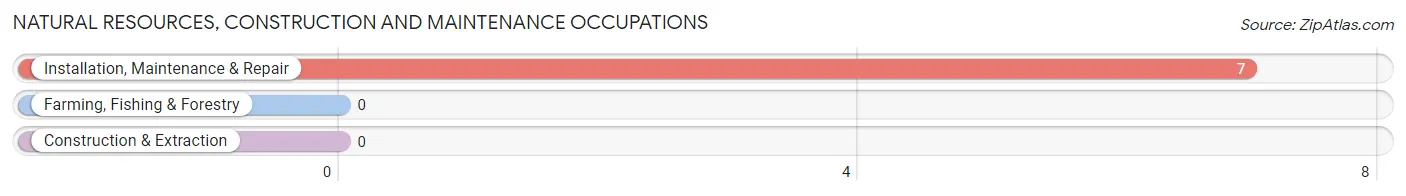
Natural Resources, Construction and Maintenance Occupations
The most common Natural Resources, Construction and Maintenance occupations in Crawfordville are , and Installation, Maintenance & Repair (7 | 3.0%).
Natural Resources, Construction and Maintenance Occupations by Sex
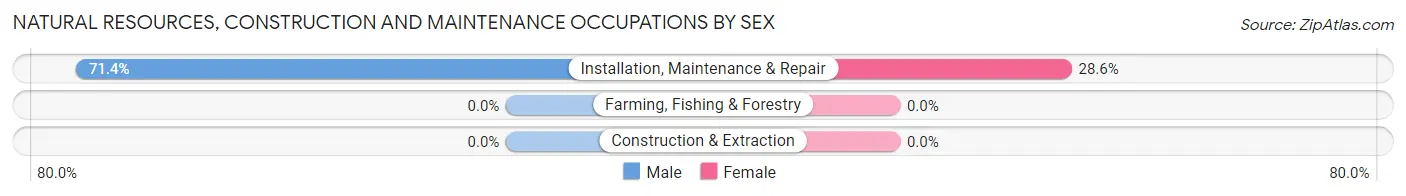
| Occupation | Male | Female |
| Farming, Fishing & Forestry | 0 (0.0%) | 0 (0.0%) |
| Construction & Extraction | 0 (0.0%) | 0 (0.0%) |
| Installation, Maintenance & Repair | 5 (71.4%) | 2 (28.6%) |
| Total (Category) | 5 (71.4%) | 2 (28.6%) |
| Total (Overall) | 108 (47.0%) | 122 (53.0%) |
Production, Transportation and Moving Occupations
The most common Production, Transportation and Moving occupations in Crawfordville are Production (30 | 13.0%), and Transportation (29 | 12.6%).
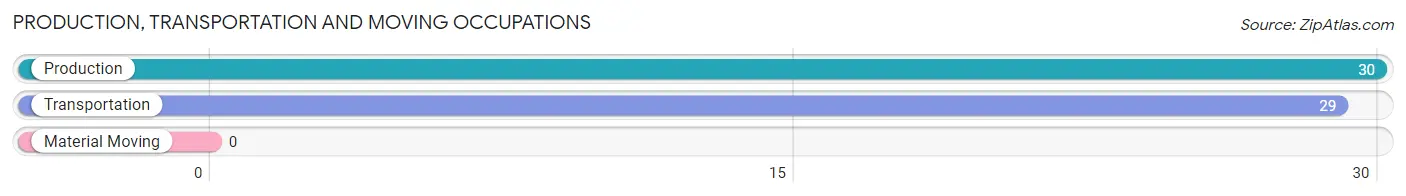
Production, Transportation and Moving Occupations by Sex
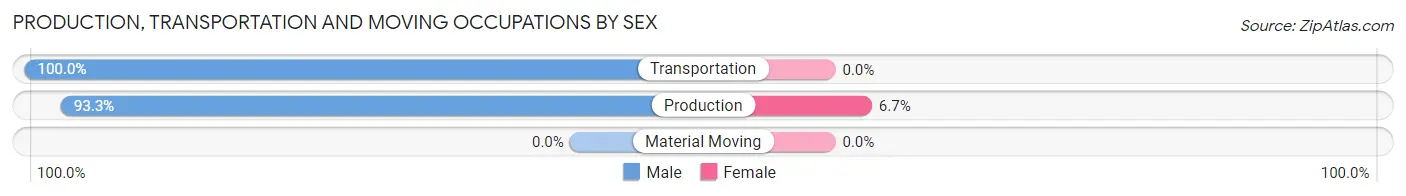
| Occupation | Male | Female |
| Production | 28 (93.3%) | 2 (6.7%) |
| Transportation | 29 (100.0%) | 0 (0.0%) |
| Material Moving | 0 (0.0%) | 0 (0.0%) |
| Total (Category) | 57 (96.6%) | 2 (3.4%) |
| Total (Overall) | 108 (47.0%) | 122 (53.0%) |
Employment Industries by Sex in Crawfordville
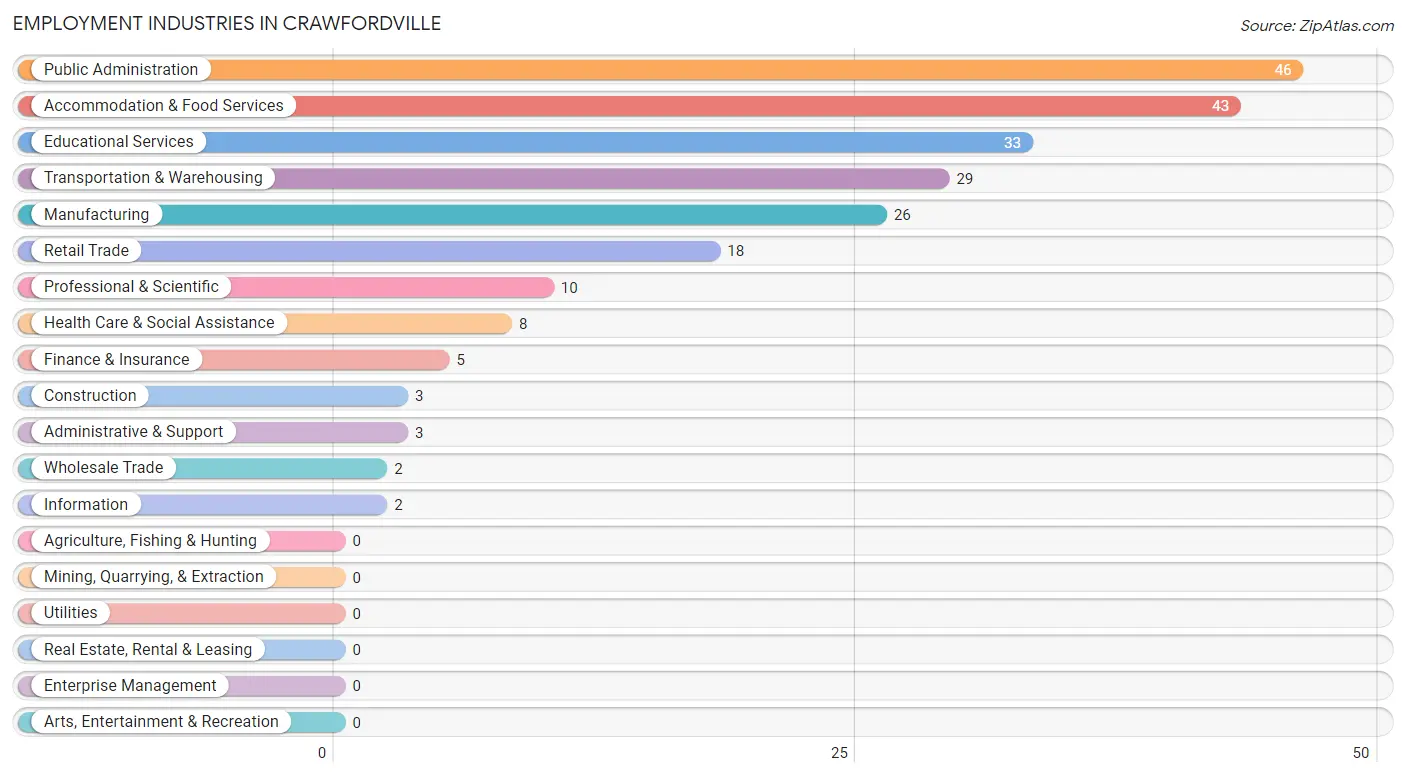
Employment Industries in Crawfordville
The major employment industries in Crawfordville include Public Administration (46 | 20.0%), Accommodation & Food Services (43 | 18.7%), Educational Services (33 | 14.3%), Transportation & Warehousing (29 | 12.6%), and Manufacturing (26 | 11.3%).
Employment Industries by Sex in Crawfordville
The Crawfordville industries that see more men than women are Construction (100.0%), Manufacturing (100.0%), and Wholesale Trade (100.0%), whereas the industries that tend to have a higher number of women are Information (100.0%), Finance & Insurance (100.0%), and Administrative & Support (100.0%).
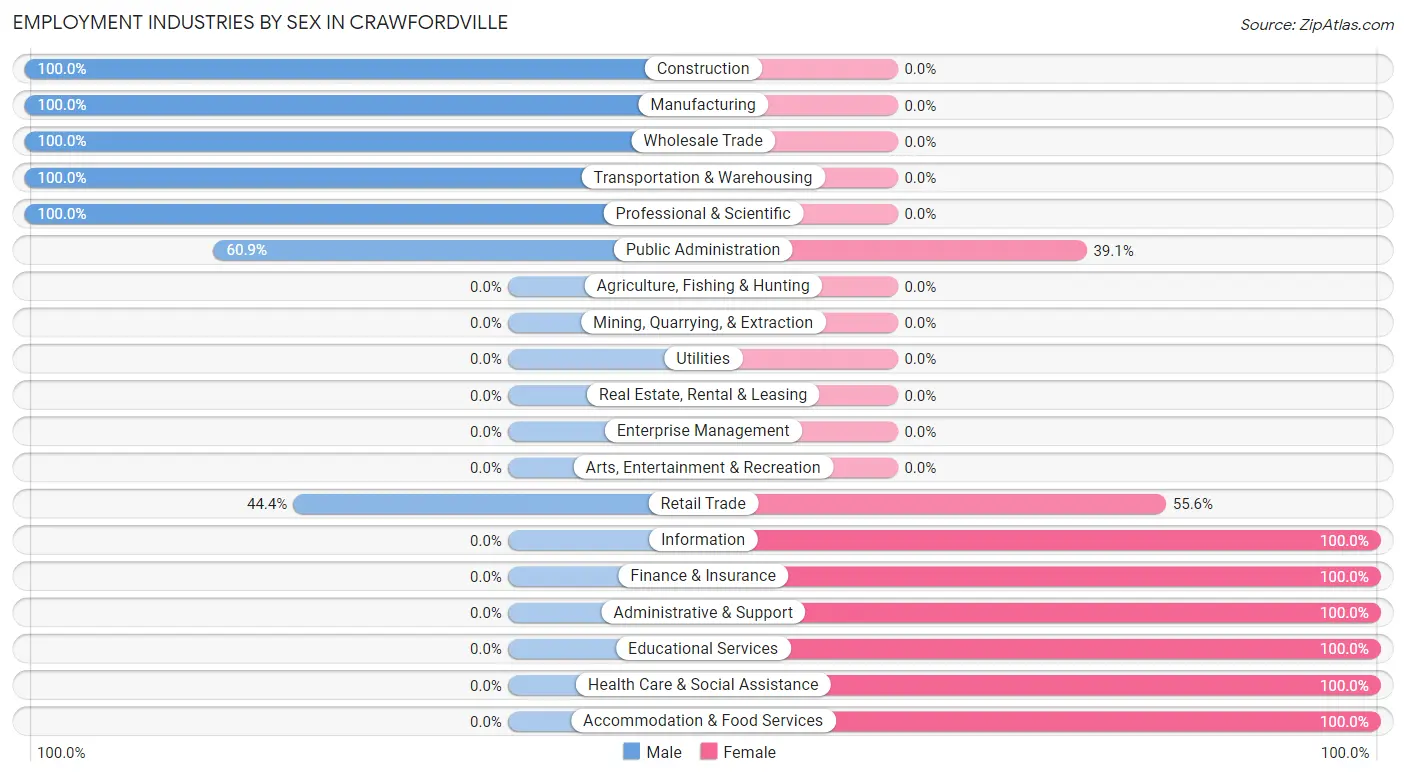
| Industry | Male | Female |
| Agriculture, Fishing & Hunting | 0 (0.0%) | 0 (0.0%) |
| Mining, Quarrying, & Extraction | 0 (0.0%) | 0 (0.0%) |
| Construction | 3 (100.0%) | 0 (0.0%) |
| Manufacturing | 26 (100.0%) | 0 (0.0%) |
| Wholesale Trade | 2 (100.0%) | 0 (0.0%) |
| Retail Trade | 8 (44.4%) | 10 (55.6%) |
| Transportation & Warehousing | 29 (100.0%) | 0 (0.0%) |
| Utilities | 0 (0.0%) | 0 (0.0%) |
| Information | 0 (0.0%) | 2 (100.0%) |
| Finance & Insurance | 0 (0.0%) | 5 (100.0%) |
| Real Estate, Rental & Leasing | 0 (0.0%) | 0 (0.0%) |
| Professional & Scientific | 10 (100.0%) | 0 (0.0%) |
| Enterprise Management | 0 (0.0%) | 0 (0.0%) |
| Administrative & Support | 0 (0.0%) | 3 (100.0%) |
| Educational Services | 0 (0.0%) | 33 (100.0%) |
| Health Care & Social Assistance | 0 (0.0%) | 8 (100.0%) |
| Arts, Entertainment & Recreation | 0 (0.0%) | 0 (0.0%) |
| Accommodation & Food Services | 0 (0.0%) | 43 (100.0%) |
| Public Administration | 28 (60.9%) | 18 (39.1%) |
| Total | 108 (47.0%) | 122 (53.0%) |
Education in Crawfordville
School Enrollment in Crawfordville
The most common levels of schooling among the 30 students in Crawfordville are high school (12 | 40.0%), nursery / preschool (11 | 36.7%), and elementary school (4 | 13.3%).
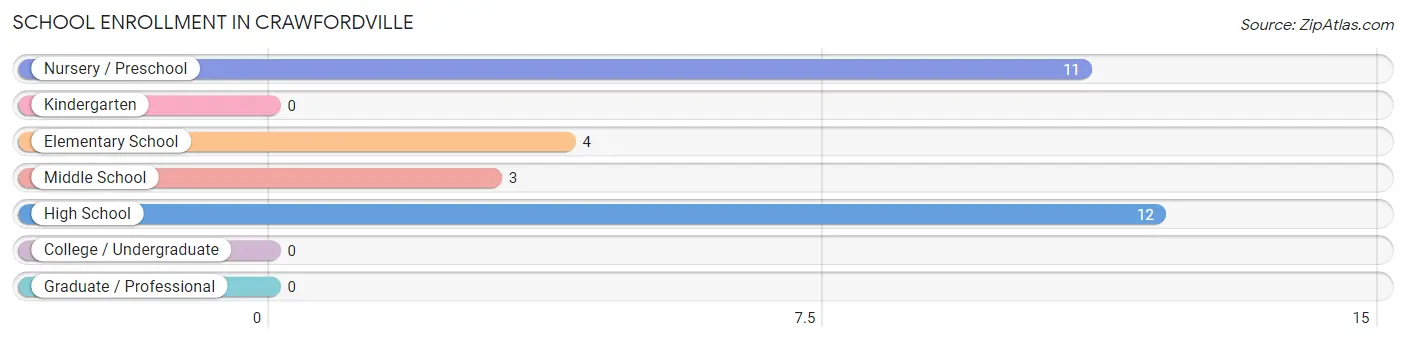
| School Level | # Students | % Students |
| Nursery / Preschool | 11 | 36.7% |
| Kindergarten | 0 | 0.0% |
| Elementary School | 4 | 13.3% |
| Middle School | 3 | 10.0% |
| High School | 12 | 40.0% |
| College / Undergraduate | 0 | 0.0% |
| Graduate / Professional | 0 | 0.0% |
| Total | 30 | 100.0% |
School Enrollment by Age by Funding Source in Crawfordville
Out of a total of 30 students who are enrolled in schools in Crawfordville, 16 (53.3%) attend a private institution, while the remaining 14 (46.7%) are enrolled in public schools. The age group of 10 to 14 year olds has the highest likelihood of being enrolled in private schools, with 3 (100.0% in the age bracket) enrolled. Conversely, the age group of 5 to 9 year old has the lowest likelihood of being enrolled in a private school, with 4 (100.0% in the age bracket) attending a public institution.
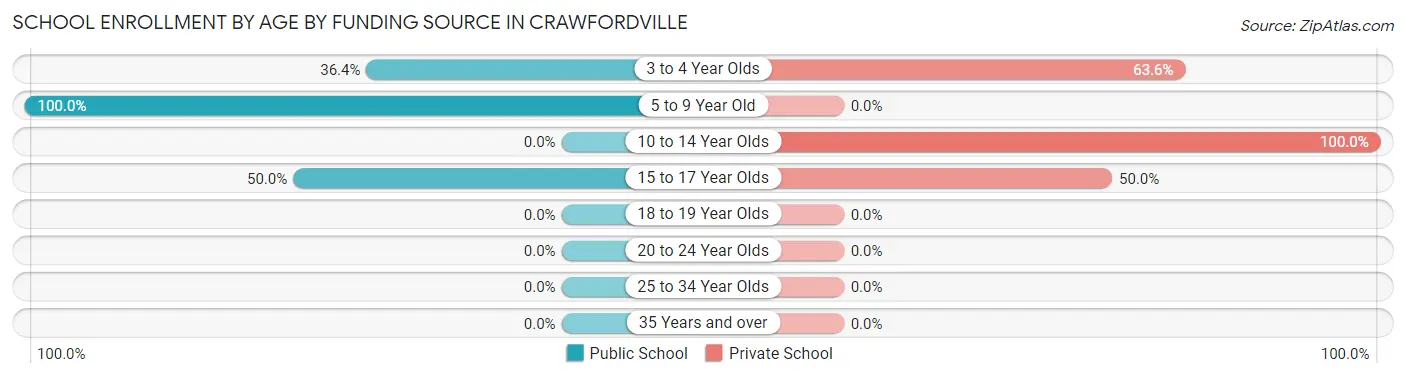
| Age Bracket | Public School | Private School |
| 3 to 4 Year Olds | 4 (36.4%) | 7 (63.6%) |
| 5 to 9 Year Old | 4 (100.0%) | 0 (0.0%) |
| 10 to 14 Year Olds | 0 (0.0%) | 3 (100.0%) |
| 15 to 17 Year Olds | 6 (50.0%) | 6 (50.0%) |
| 18 to 19 Year Olds | 0 (0.0%) | 0 (0.0%) |
| 20 to 24 Year Olds | 0 (0.0%) | 0 (0.0%) |
| 25 to 34 Year Olds | 0 (0.0%) | 0 (0.0%) |
| 35 Years and over | 0 (0.0%) | 0 (0.0%) |
| Total | 14 (46.7%) | 16 (53.3%) |
Educational Attainment by Field of Study in Crawfordville
Physical & health sciences (33 | 50.8%), science & technology (14 | 21.5%), engineering (13 | 20.0%), education (3 | 4.6%), and visual & performing arts (2 | 3.1%) are the most common fields of study among 65 individuals in Crawfordville who have obtained a bachelor's degree or higher.
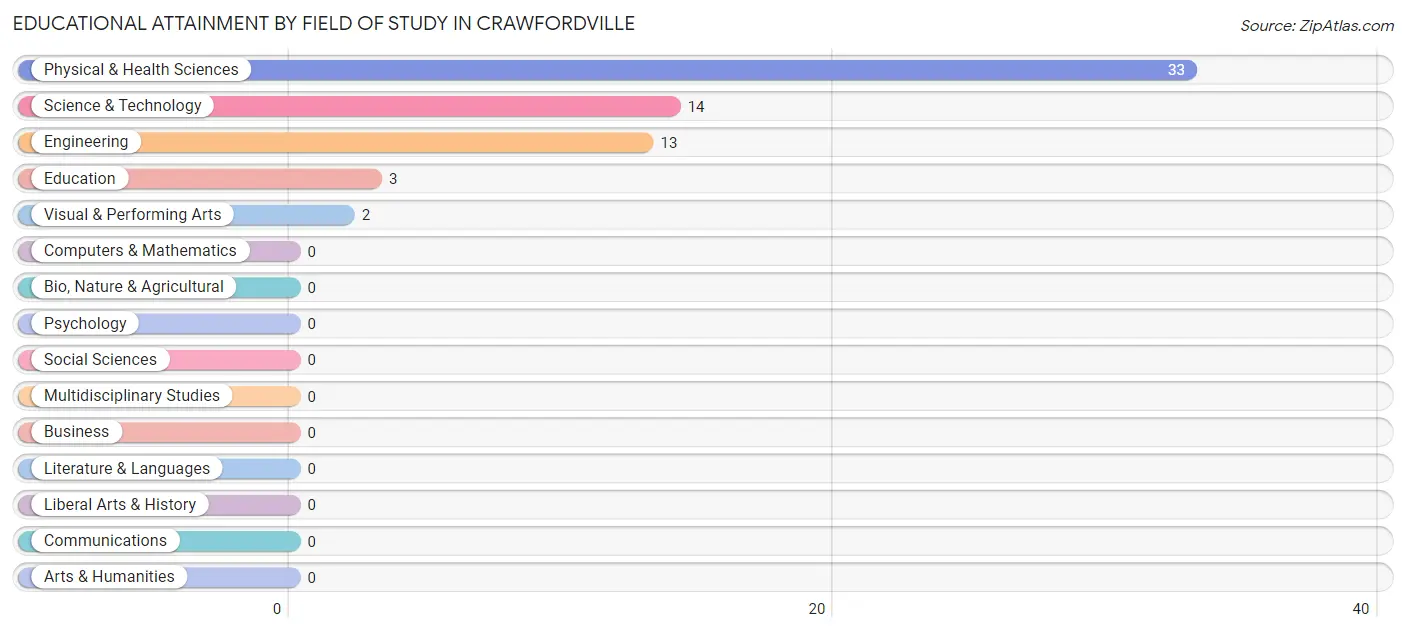
| Field of Study | # Graduates | % Graduates |
| Computers & Mathematics | 0 | 0.0% |
| Bio, Nature & Agricultural | 0 | 0.0% |
| Physical & Health Sciences | 33 | 50.8% |
| Psychology | 0 | 0.0% |
| Social Sciences | 0 | 0.0% |
| Engineering | 13 | 20.0% |
| Multidisciplinary Studies | 0 | 0.0% |
| Science & Technology | 14 | 21.5% |
| Business | 0 | 0.0% |
| Education | 3 | 4.6% |
| Literature & Languages | 0 | 0.0% |
| Liberal Arts & History | 0 | 0.0% |
| Visual & Performing Arts | 2 | 3.1% |
| Communications | 0 | 0.0% |
| Arts & Humanities | 0 | 0.0% |
| Total | 65 | 100.0% |
Transportation & Commute in Crawfordville
Vehicle Availability by Sex in Crawfordville
The most prevalent vehicle ownership categories in Crawfordville are males with 2 vehicles (78, accounting for 70.9%) and females with 2 vehicles (54, making up 63.9%).
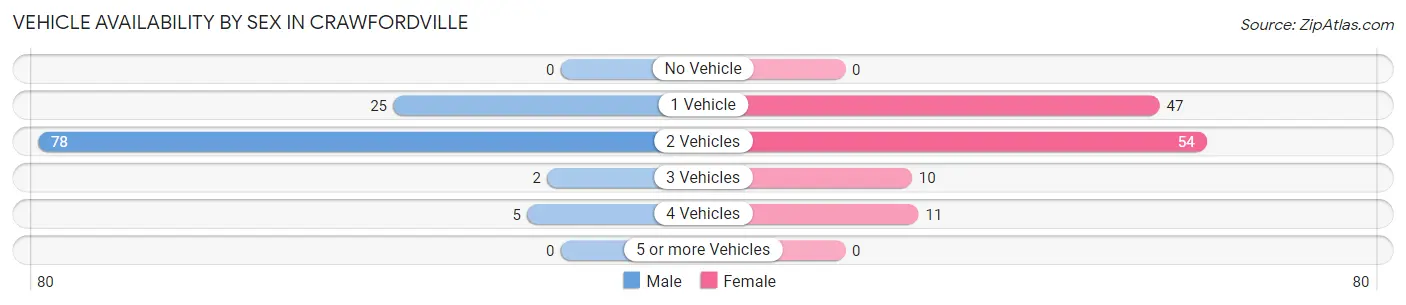
| Vehicles Available | Male | Female |
| No Vehicle | 0 (0.0%) | 0 (0.0%) |
| 1 Vehicle | 25 (22.7%) | 47 (38.5%) |
| 2 Vehicles | 78 (70.9%) | 54 (44.3%) |
| 3 Vehicles | 2 (1.8%) | 10 (8.2%) |
| 4 Vehicles | 5 (4.5%) | 11 (9.0%) |
| 5 or more Vehicles | 0 (0.0%) | 0 (0.0%) |
| Total | 110 (100.0%) | 122 (100.0%) |
Commute Time in Crawfordville
The most frequently occuring commute durations in Crawfordville are 45 to 59 minutes (82 commuters, 41.2%), 5 to 9 minutes (55 commuters, 27.6%), and 60 to 89 minutes (22 commuters, 11.1%).
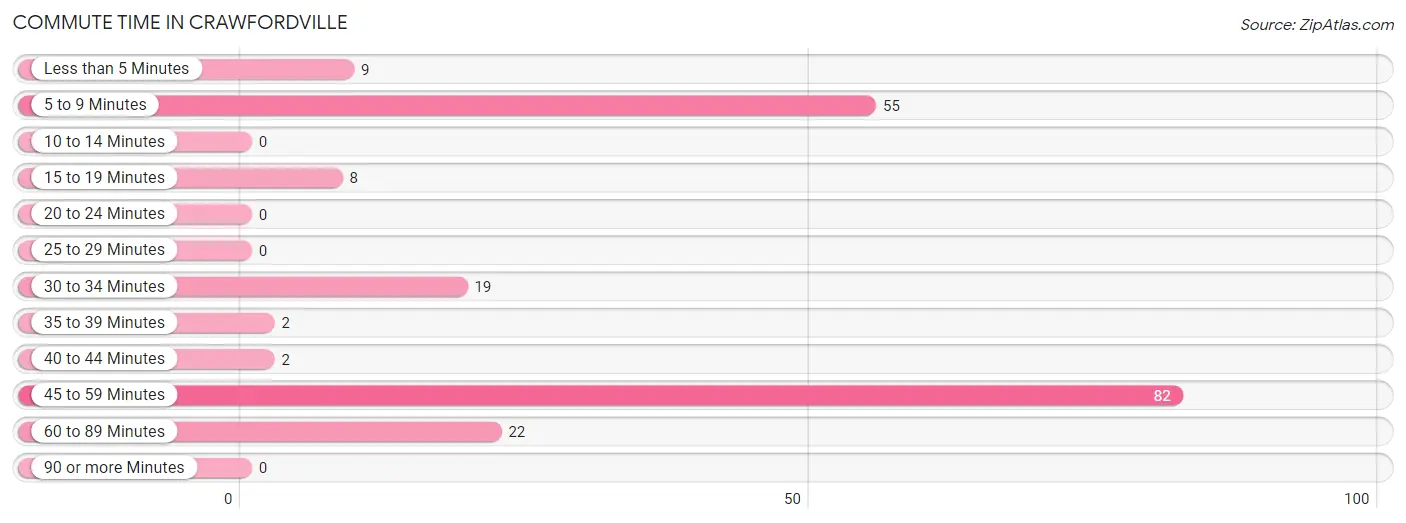
| Commute Time | # Commuters | % Commuters |
| Less than 5 Minutes | 9 | 4.5% |
| 5 to 9 Minutes | 55 | 27.6% |
| 10 to 14 Minutes | 0 | 0.0% |
| 15 to 19 Minutes | 8 | 4.0% |
| 20 to 24 Minutes | 0 | 0.0% |
| 25 to 29 Minutes | 0 | 0.0% |
| 30 to 34 Minutes | 19 | 9.6% |
| 35 to 39 Minutes | 2 | 1.0% |
| 40 to 44 Minutes | 2 | 1.0% |
| 45 to 59 Minutes | 82 | 41.2% |
| 60 to 89 Minutes | 22 | 11.1% |
| 90 or more Minutes | 0 | 0.0% |
Commute Time by Sex in Crawfordville
The most common commute times in Crawfordville are 45 to 59 minutes (41 commuters, 50.6%) for males and 5 to 9 minutes (43 commuters, 36.4%) for females.
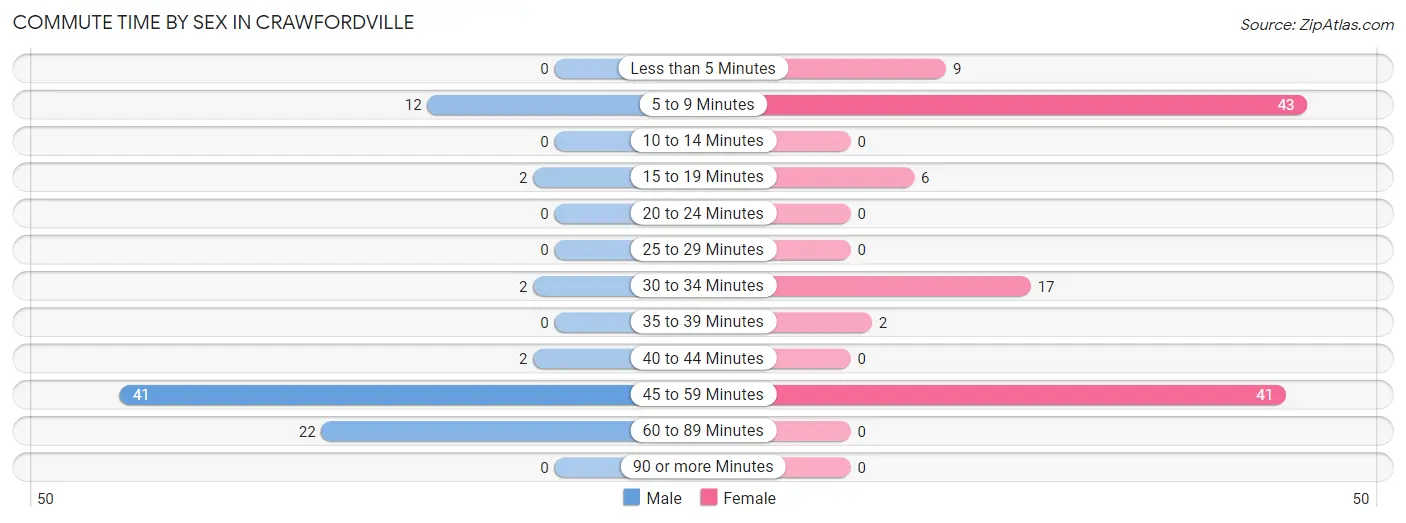
| Commute Time | Male | Female |
| Less than 5 Minutes | 0 (0.0%) | 9 (7.6%) |
| 5 to 9 Minutes | 12 (14.8%) | 43 (36.4%) |
| 10 to 14 Minutes | 0 (0.0%) | 0 (0.0%) |
| 15 to 19 Minutes | 2 (2.5%) | 6 (5.1%) |
| 20 to 24 Minutes | 0 (0.0%) | 0 (0.0%) |
| 25 to 29 Minutes | 0 (0.0%) | 0 (0.0%) |
| 30 to 34 Minutes | 2 (2.5%) | 17 (14.4%) |
| 35 to 39 Minutes | 0 (0.0%) | 2 (1.7%) |
| 40 to 44 Minutes | 2 (2.5%) | 0 (0.0%) |
| 45 to 59 Minutes | 41 (50.6%) | 41 (34.7%) |
| 60 to 89 Minutes | 22 (27.2%) | 0 (0.0%) |
| 90 or more Minutes | 0 (0.0%) | 0 (0.0%) |
Time of Departure to Work by Sex in Crawfordville
The most frequent times of departure to work in Crawfordville are 12:00 AM to 4:59 AM (25, 30.9%) for males and 7:30 AM to 7:59 AM (45, 38.1%) for females.
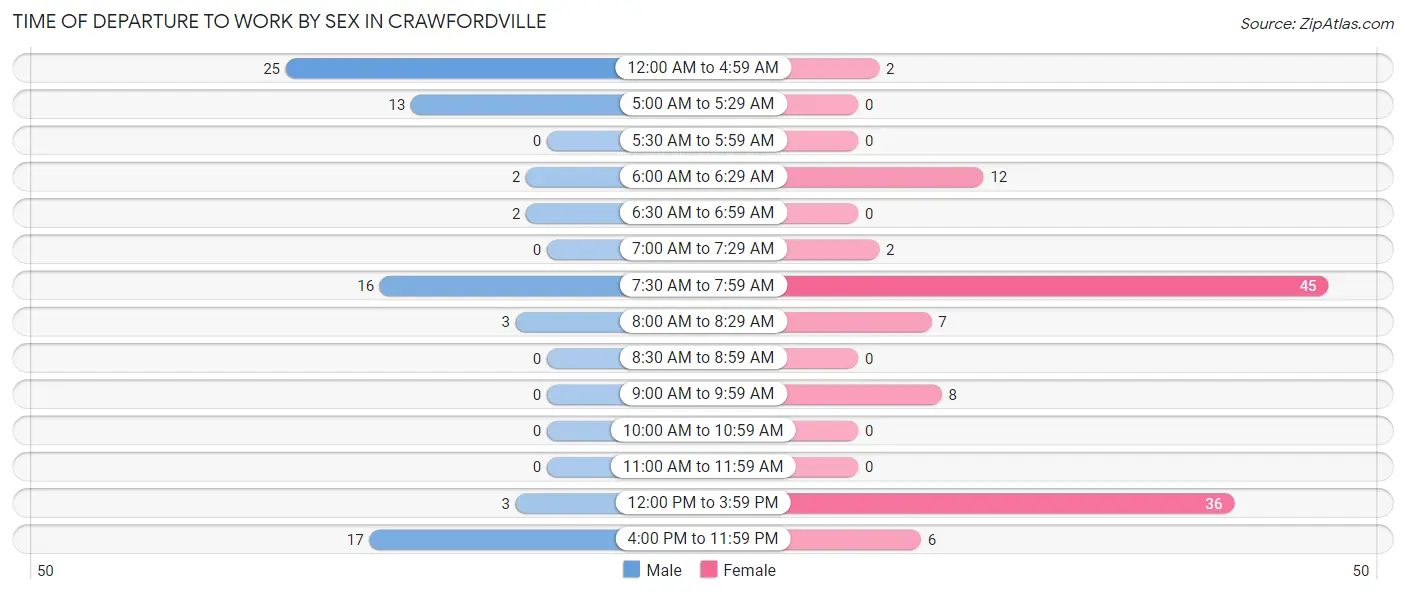
| Time of Departure | Male | Female |
| 12:00 AM to 4:59 AM | 25 (30.9%) | 2 (1.7%) |
| 5:00 AM to 5:29 AM | 13 (16.1%) | 0 (0.0%) |
| 5:30 AM to 5:59 AM | 0 (0.0%) | 0 (0.0%) |
| 6:00 AM to 6:29 AM | 2 (2.5%) | 12 (10.2%) |
| 6:30 AM to 6:59 AM | 2 (2.5%) | 0 (0.0%) |
| 7:00 AM to 7:29 AM | 0 (0.0%) | 2 (1.7%) |
| 7:30 AM to 7:59 AM | 16 (19.8%) | 45 (38.1%) |
| 8:00 AM to 8:29 AM | 3 (3.7%) | 7 (5.9%) |
| 8:30 AM to 8:59 AM | 0 (0.0%) | 0 (0.0%) |
| 9:00 AM to 9:59 AM | 0 (0.0%) | 8 (6.8%) |
| 10:00 AM to 10:59 AM | 0 (0.0%) | 0 (0.0%) |
| 11:00 AM to 11:59 AM | 0 (0.0%) | 0 (0.0%) |
| 12:00 PM to 3:59 PM | 3 (3.7%) | 36 (30.5%) |
| 4:00 PM to 11:59 PM | 17 (21.0%) | 6 (5.1%) |
| Total | 81 (100.0%) | 118 (100.0%) |
Housing Occupancy in Crawfordville
Occupancy by Ownership in Crawfordville
Of the total 287 dwellings in Crawfordville, owner-occupied units account for 174 (60.6%), while renter-occupied units make up 113 (39.4%).
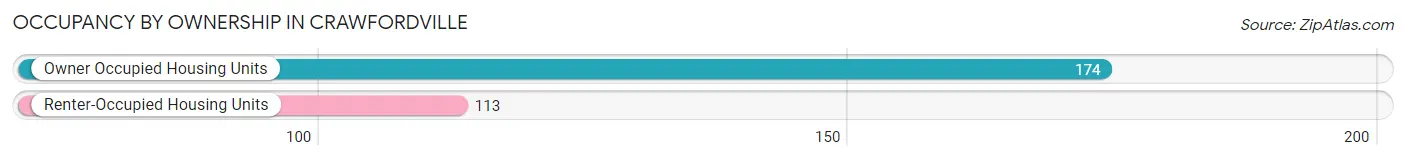
| Occupancy | # Housing Units | % Housing Units |
| Owner Occupied Housing Units | 174 | 60.6% |
| Renter-Occupied Housing Units | 113 | 39.4% |
| Total Occupied Housing Units | 287 | 100.0% |
Occupancy by Household Size in Crawfordville
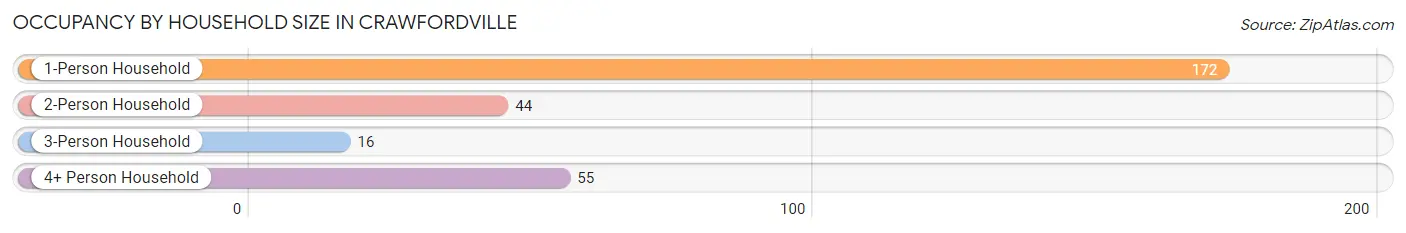
| Household Size | # Housing Units | % Housing Units |
| 1-Person Household | 172 | 59.9% |
| 2-Person Household | 44 | 15.3% |
| 3-Person Household | 16 | 5.6% |
| 4+ Person Household | 55 | 19.2% |
| Total Housing Units | 287 | 100.0% |
Occupancy by Ownership by Household Size in Crawfordville
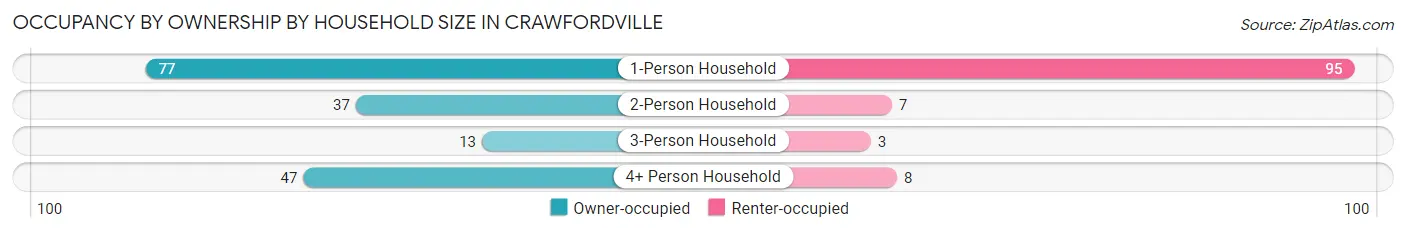
| Household Size | Owner-occupied | Renter-occupied |
| 1-Person Household | 77 (44.8%) | 95 (55.2%) |
| 2-Person Household | 37 (84.1%) | 7 (15.9%) |
| 3-Person Household | 13 (81.2%) | 3 (18.8%) |
| 4+ Person Household | 47 (85.5%) | 8 (14.5%) |
| Total Housing Units | 174 (60.6%) | 113 (39.4%) |
Occupancy by Educational Attainment in Crawfordville
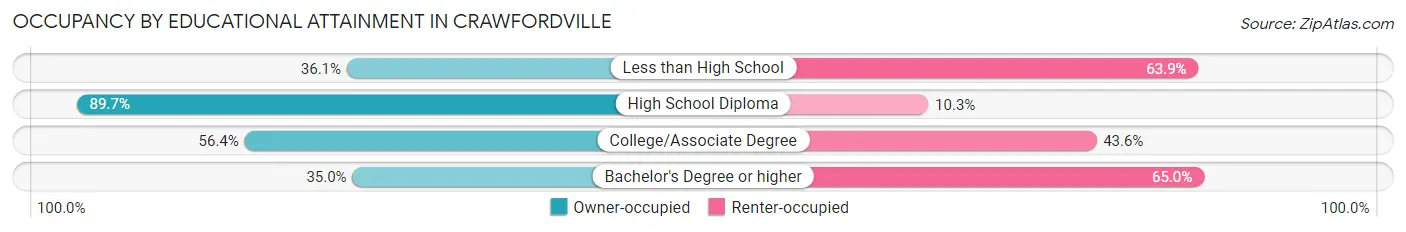
| Household Size | Owner-occupied | Renter-occupied |
| Less than High School | 13 (36.1%) | 23 (63.9%) |
| High School Diploma | 87 (89.7%) | 10 (10.3%) |
| College/Associate Degree | 53 (56.4%) | 41 (43.6%) |
| Bachelor's Degree or higher | 21 (35.0%) | 39 (65.0%) |
Occupancy by Age of Householder in Crawfordville
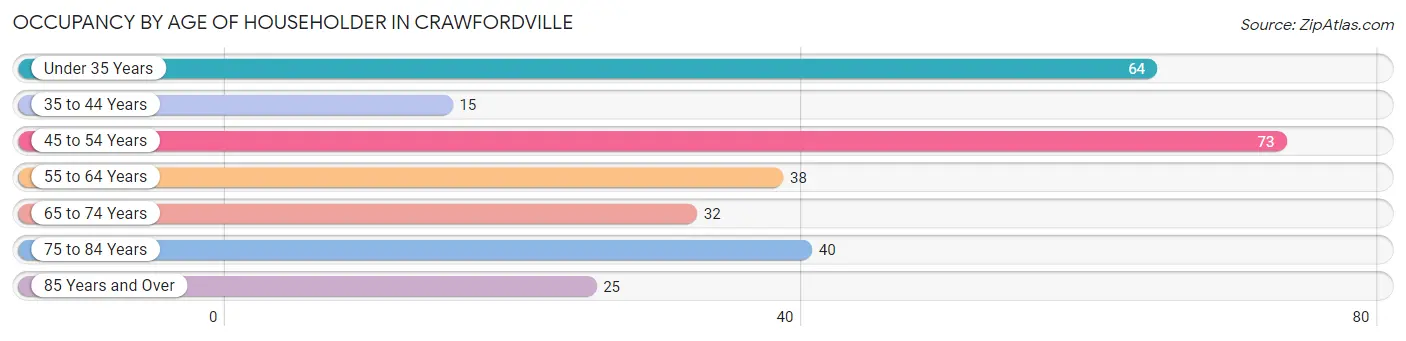
| Age Bracket | # Households | % Households |
| Under 35 Years | 64 | 22.3% |
| 35 to 44 Years | 15 | 5.2% |
| 45 to 54 Years | 73 | 25.4% |
| 55 to 64 Years | 38 | 13.2% |
| 65 to 74 Years | 32 | 11.2% |
| 75 to 84 Years | 40 | 13.9% |
| 85 Years and Over | 25 | 8.7% |
| Total | 287 | 100.0% |
Housing Finances in Crawfordville
Median Income by Occupancy in Crawfordville
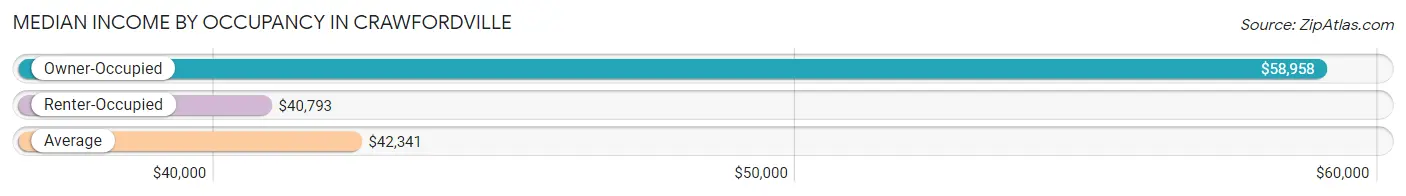
| Occupancy Type | # Households | Median Income |
| Owner-Occupied | 174 (60.6%) | $58,958 |
| Renter-Occupied | 113 (39.4%) | $40,793 |
| Average | 287 (100.0%) | $42,341 |
Occupancy by Householder Income Bracket in Crawfordville
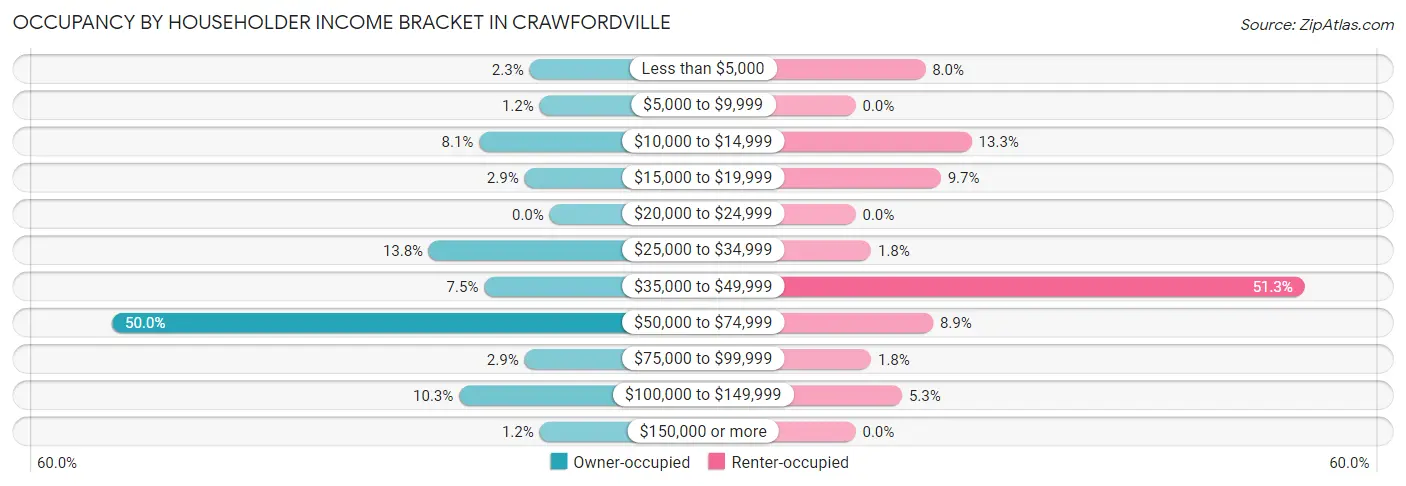
| Income Bracket | Owner-occupied | Renter-occupied |
| Less than $5,000 | 4 (2.3%) | 9 (8.0%) |
| $5,000 to $9,999 | 2 (1.1%) | 0 (0.0%) |
| $10,000 to $14,999 | 14 (8.1%) | 15 (13.3%) |
| $15,000 to $19,999 | 5 (2.9%) | 11 (9.7%) |
| $20,000 to $24,999 | 0 (0.0%) | 0 (0.0%) |
| $25,000 to $34,999 | 24 (13.8%) | 2 (1.8%) |
| $35,000 to $49,999 | 13 (7.5%) | 58 (51.3%) |
| $50,000 to $74,999 | 87 (50.0%) | 10 (8.8%) |
| $75,000 to $99,999 | 5 (2.9%) | 2 (1.8%) |
| $100,000 to $149,999 | 18 (10.3%) | 6 (5.3%) |
| $150,000 or more | 2 (1.1%) | 0 (0.0%) |
| Total | 174 (100.0%) | 113 (100.0%) |
Monthly Housing Cost Tiers in Crawfordville
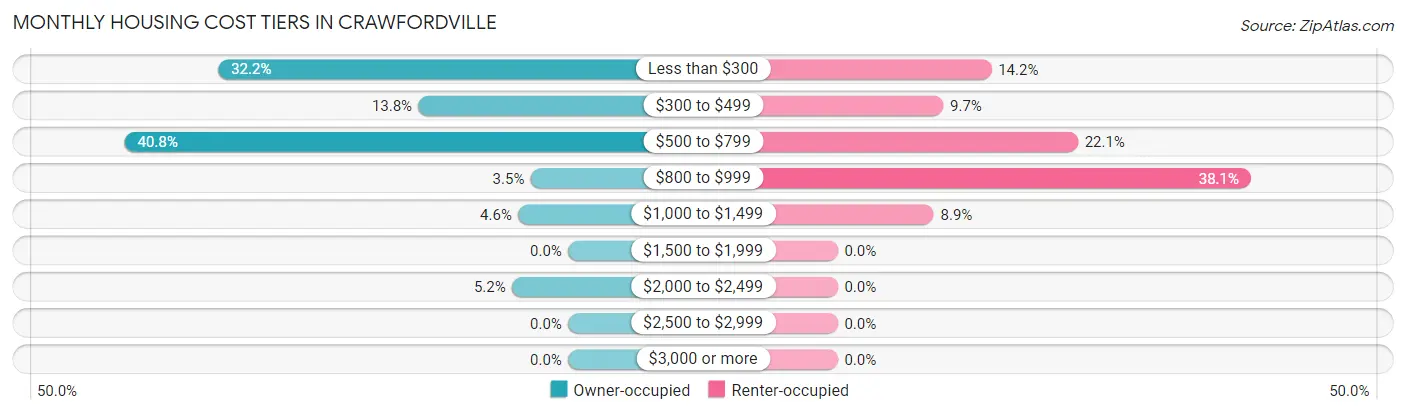
| Monthly Cost | Owner-occupied | Renter-occupied |
| Less than $300 | 56 (32.2%) | 16 (14.2%) |
| $300 to $499 | 24 (13.8%) | 11 (9.7%) |
| $500 to $799 | 71 (40.8%) | 25 (22.1%) |
| $800 to $999 | 6 (3.5%) | 43 (38.1%) |
| $1,000 to $1,499 | 8 (4.6%) | 10 (8.8%) |
| $1,500 to $1,999 | 0 (0.0%) | 0 (0.0%) |
| $2,000 to $2,499 | 9 (5.2%) | 0 (0.0%) |
| $2,500 to $2,999 | 0 (0.0%) | 0 (0.0%) |
| $3,000 or more | 0 (0.0%) | 0 (0.0%) |
| Total | 174 (100.0%) | 113 (100.0%) |
Physical Housing Characteristics in Crawfordville
Housing Structures in Crawfordville
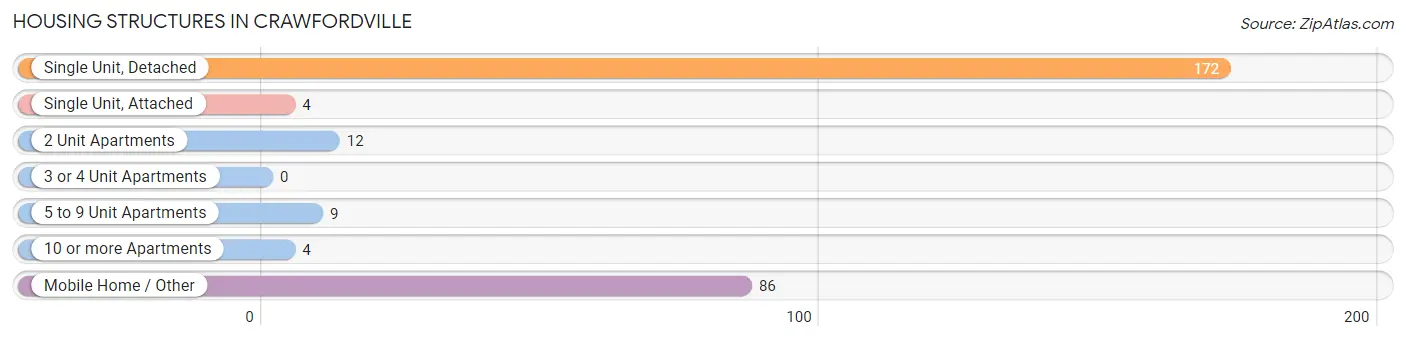
| Structure Type | # Housing Units | % Housing Units |
| Single Unit, Detached | 172 | 59.9% |
| Single Unit, Attached | 4 | 1.4% |
| 2 Unit Apartments | 12 | 4.2% |
| 3 or 4 Unit Apartments | 0 | 0.0% |
| 5 to 9 Unit Apartments | 9 | 3.1% |
| 10 or more Apartments | 4 | 1.4% |
| Mobile Home / Other | 86 | 30.0% |
| Total | 287 | 100.0% |
Housing Structures by Occupancy in Crawfordville
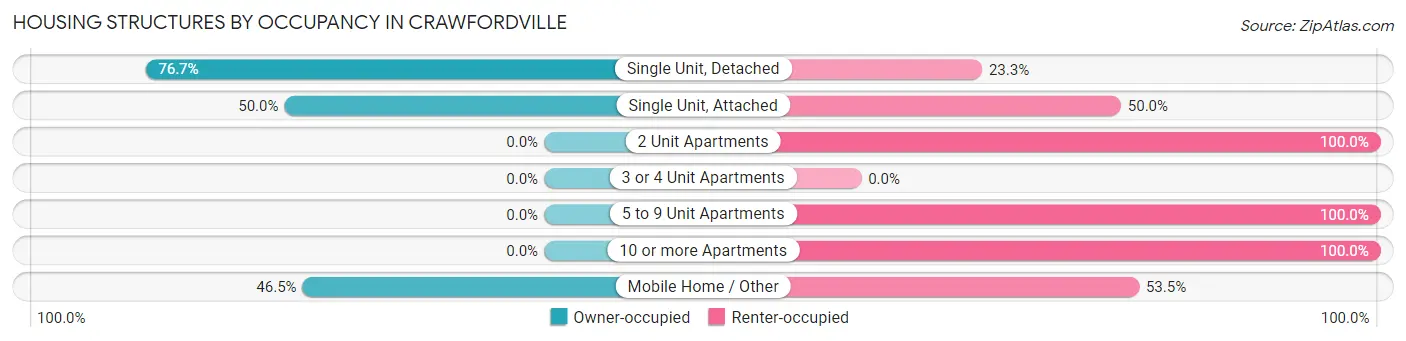
| Structure Type | Owner-occupied | Renter-occupied |
| Single Unit, Detached | 132 (76.7%) | 40 (23.3%) |
| Single Unit, Attached | 2 (50.0%) | 2 (50.0%) |
| 2 Unit Apartments | 0 (0.0%) | 12 (100.0%) |
| 3 or 4 Unit Apartments | 0 (0.0%) | 0 (0.0%) |
| 5 to 9 Unit Apartments | 0 (0.0%) | 9 (100.0%) |
| 10 or more Apartments | 0 (0.0%) | 4 (100.0%) |
| Mobile Home / Other | 40 (46.5%) | 46 (53.5%) |
| Total | 174 (60.6%) | 113 (39.4%) |
Housing Structures by Number of Rooms in Crawfordville
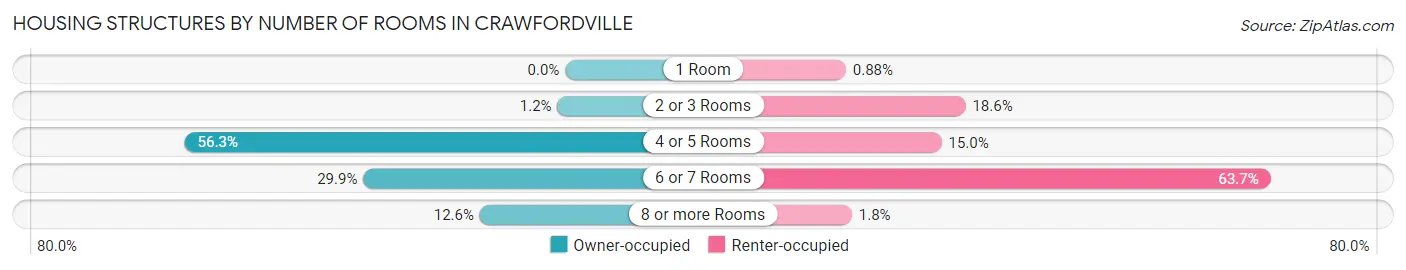
| Number of Rooms | Owner-occupied | Renter-occupied |
| 1 Room | 0 (0.0%) | 1 (0.9%) |
| 2 or 3 Rooms | 2 (1.1%) | 21 (18.6%) |
| 4 or 5 Rooms | 98 (56.3%) | 17 (15.0%) |
| 6 or 7 Rooms | 52 (29.9%) | 72 (63.7%) |
| 8 or more Rooms | 22 (12.6%) | 2 (1.8%) |
| Total | 174 (100.0%) | 113 (100.0%) |
Housing Structure by Heating Type in Crawfordville
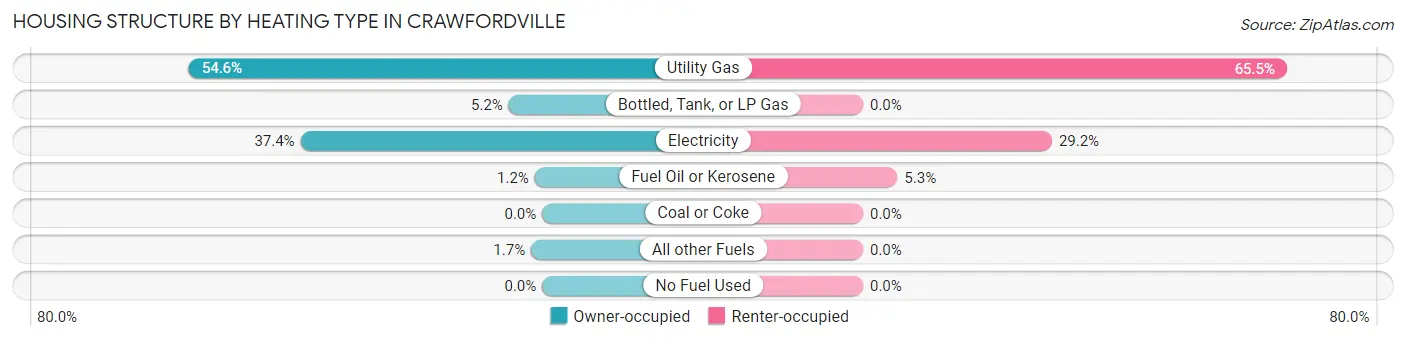
| Heating Type | Owner-occupied | Renter-occupied |
| Utility Gas | 95 (54.6%) | 74 (65.5%) |
| Bottled, Tank, or LP Gas | 9 (5.2%) | 0 (0.0%) |
| Electricity | 65 (37.4%) | 33 (29.2%) |
| Fuel Oil or Kerosene | 2 (1.1%) | 6 (5.3%) |
| Coal or Coke | 0 (0.0%) | 0 (0.0%) |
| All other Fuels | 3 (1.7%) | 0 (0.0%) |
| No Fuel Used | 0 (0.0%) | 0 (0.0%) |
| Total | 174 (100.0%) | 113 (100.0%) |
Household Vehicle Usage in Crawfordville
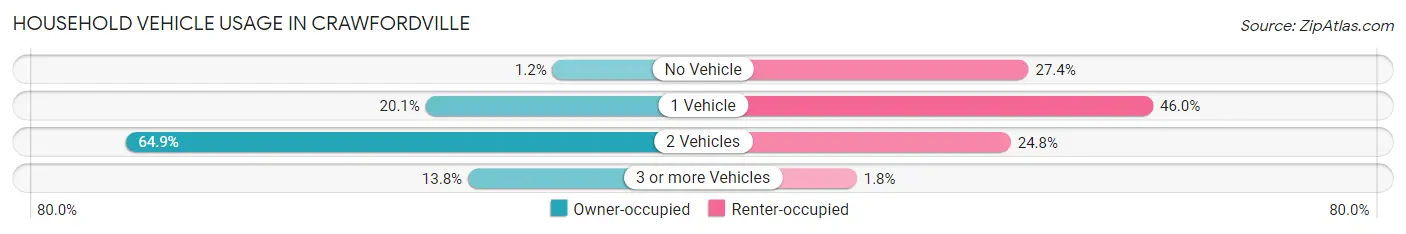
| Vehicles per Household | Owner-occupied | Renter-occupied |
| No Vehicle | 2 (1.1%) | 31 (27.4%) |
| 1 Vehicle | 35 (20.1%) | 52 (46.0%) |
| 2 Vehicles | 113 (64.9%) | 28 (24.8%) |
| 3 or more Vehicles | 24 (13.8%) | 2 (1.8%) |
| Total | 174 (100.0%) | 113 (100.0%) |
Real Estate & Mortgages in Crawfordville
Real Estate and Mortgage Overview in Crawfordville
| Characteristic | Without Mortgage | With Mortgage |
| Housing Units | 150 | 24 |
| Median Property Value | $65,700 | $75,000 |
| Median Household Income | $59,167 | $0 |
| Monthly Housing Costs | $472 | $0 |
| Real Estate Taxes | $1,380 | $6 |
Property Value by Mortgage Status in Crawfordville
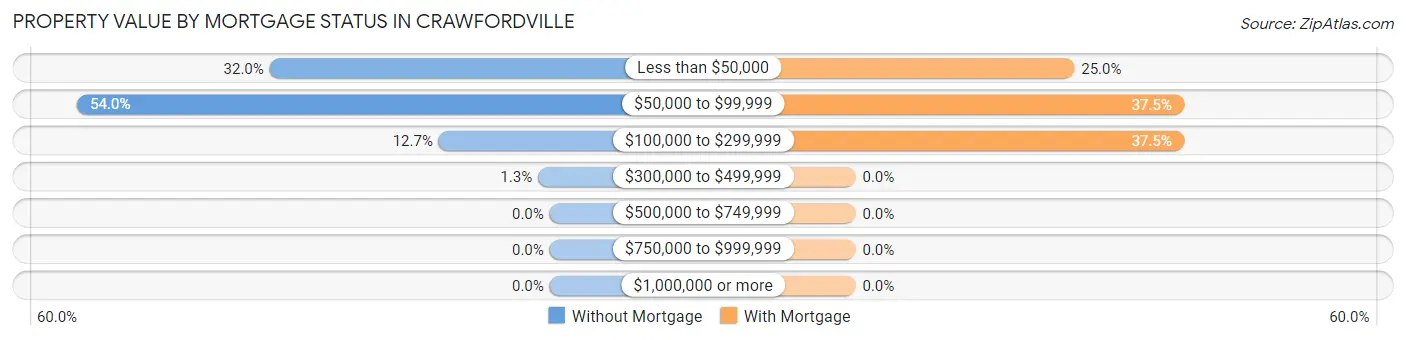
| Property Value | Without Mortgage | With Mortgage |
| Less than $50,000 | 48 (32.0%) | 6 (25.0%) |
| $50,000 to $99,999 | 81 (54.0%) | 9 (37.5%) |
| $100,000 to $299,999 | 19 (12.7%) | 9 (37.5%) |
| $300,000 to $499,999 | 2 (1.3%) | 0 (0.0%) |
| $500,000 to $749,999 | 0 (0.0%) | 0 (0.0%) |
| $750,000 to $999,999 | 0 (0.0%) | 0 (0.0%) |
| $1,000,000 or more | 0 (0.0%) | 0 (0.0%) |
| Total | 150 (100.0%) | 24 (100.0%) |
Household Income by Mortgage Status in Crawfordville
| Household Income | Without Mortgage | With Mortgage |
| Less than $10,000 | 6 (4.0%) | 0 (0.0%) |
| $10,000 to $24,999 | 13 (8.7%) | 0 (0.0%) |
| $25,000 to $34,999 | 18 (12.0%) | 6 (25.0%) |
| $35,000 to $49,999 | 10 (6.7%) | 6 (25.0%) |
| $50,000 to $74,999 | 78 (52.0%) | 3 (12.5%) |
| $75,000 to $99,999 | 5 (3.3%) | 9 (37.5%) |
| $100,000 to $149,999 | 18 (12.0%) | 0 (0.0%) |
| $150,000 or more | 2 (1.3%) | 0 (0.0%) |
| Total | 150 (100.0%) | 24 (100.0%) |
Property Value to Household Income Ratio in Crawfordville
| Value-to-Income Ratio | Without Mortgage | With Mortgage |
| Less than 2.0x | 105 (70.0%) | 0 (0.0%) |
| 2.0x to 2.9x | 20 (13.3%) | 12 (50.0%) |
| 3.0x to 3.9x | 3 (2.0%) | 6 (25.0%) |
| 4.0x or more | 22 (14.7%) | 3 (12.5%) |
| Total | 150 (100.0%) | 24 (100.0%) |
Real Estate Taxes by Mortgage Status in Crawfordville
| Property Taxes | Without Mortgage | With Mortgage |
| Less than $800 | 47 (31.3%) | 0 (0.0%) |
| $800 to $1,499 | 25 (16.7%) | 9 (37.5%) |
| $800 to $1,499 | 61 (40.7%) | 0 (0.0%) |
| Total | 150 (100.0%) | 24 (100.0%) |
Health & Disability in Crawfordville
Health Insurance Coverage by Age in Crawfordville
| Age Bracket | With Coverage | Without Coverage |
| Under 6 Years | 67 (100.0%) | 0 (0.0%) |
| 6 to 18 Years | 19 (100.0%) | 0 (0.0%) |
| 19 to 25 Years | 89 (100.0%) | 0 (0.0%) |
| 26 to 34 Years | 47 (100.0%) | 0 (0.0%) |
| 35 to 44 Years | 59 (100.0%) | 0 (0.0%) |
| 45 to 54 Years | 97 (100.0%) | 0 (0.0%) |
| 55 to 64 Years | 60 (77.9%) | 17 (22.1%) |
| 65 to 74 Years | 38 (100.0%) | 0 (0.0%) |
| 75 Years and older | 94 (100.0%) | 0 (0.0%) |
| Total | 570 (97.1%) | 17 (2.9%) |
Health Insurance Coverage by Citizenship Status in Crawfordville
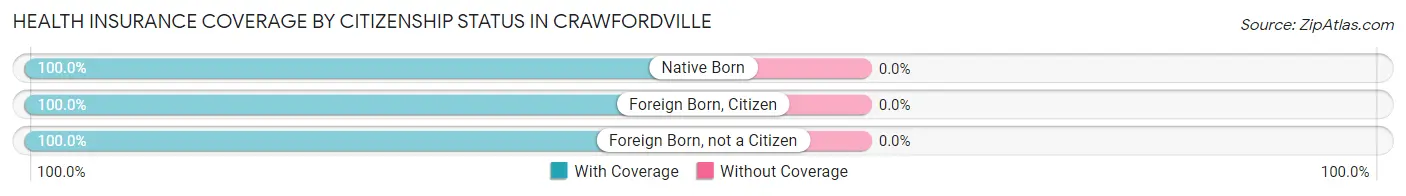
| Citizenship Status | With Coverage | Without Coverage |
| Native Born | 67 (100.0%) | 0 (0.0%) |
| Foreign Born, Citizen | 19 (100.0%) | 0 (0.0%) |
| Foreign Born, not a Citizen | 89 (100.0%) | 0 (0.0%) |
Health Insurance Coverage by Household Income in Crawfordville
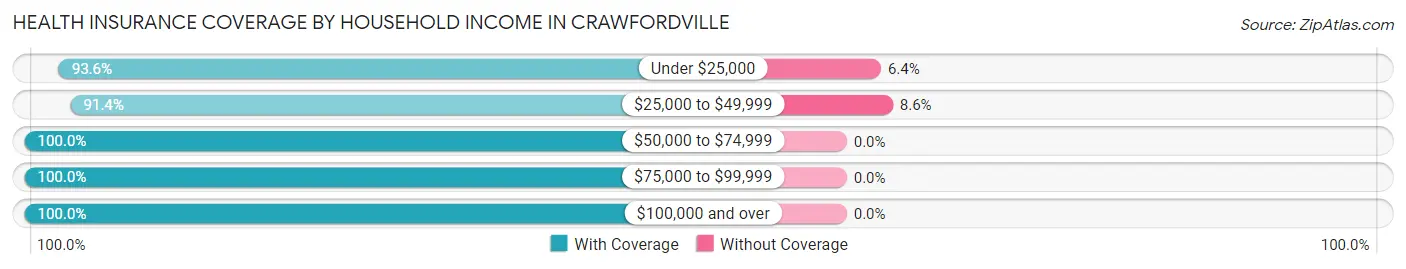
| Household Income | With Coverage | Without Coverage |
| Under $25,000 | 73 (93.6%) | 5 (6.4%) |
| $25,000 to $49,999 | 127 (91.4%) | 12 (8.6%) |
| $50,000 to $74,999 | 226 (100.0%) | 0 (0.0%) |
| $75,000 to $99,999 | 33 (100.0%) | 0 (0.0%) |
| $100,000 and over | 111 (100.0%) | 0 (0.0%) |
Public vs Private Health Insurance Coverage by Age in Crawfordville
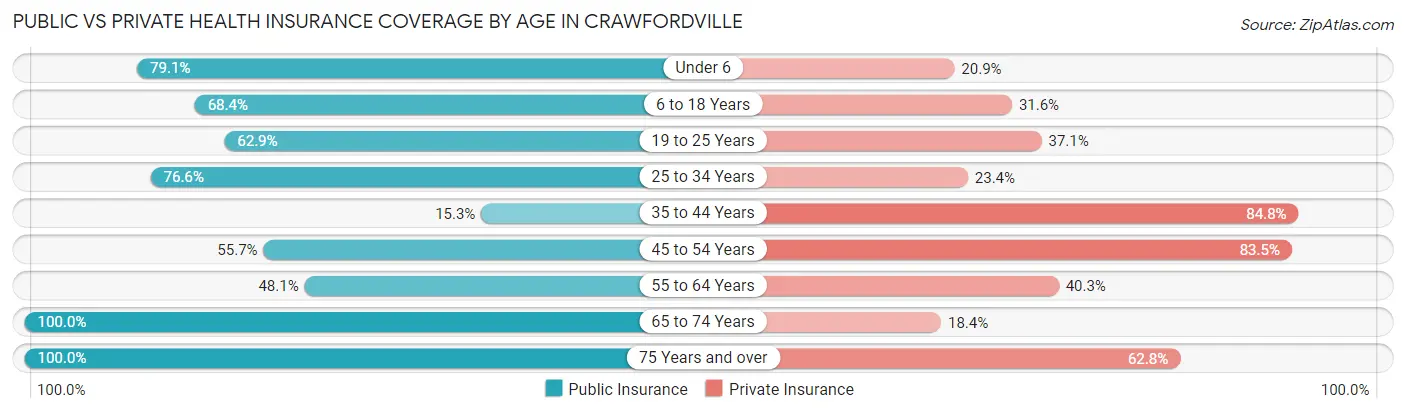
| Age Bracket | Public Insurance | Private Insurance |
| Under 6 | 53 (79.1%) | 14 (20.9%) |
| 6 to 18 Years | 13 (68.4%) | 6 (31.6%) |
| 19 to 25 Years | 56 (62.9%) | 33 (37.1%) |
| 25 to 34 Years | 36 (76.6%) | 11 (23.4%) |
| 35 to 44 Years | 9 (15.2%) | 50 (84.8%) |
| 45 to 54 Years | 54 (55.7%) | 81 (83.5%) |
| 55 to 64 Years | 37 (48.0%) | 31 (40.3%) |
| 65 to 74 Years | 38 (100.0%) | 7 (18.4%) |
| 75 Years and over | 94 (100.0%) | 59 (62.8%) |
| Total | 390 (66.4%) | 292 (49.7%) |
Disability Status by Sex by Age in Crawfordville
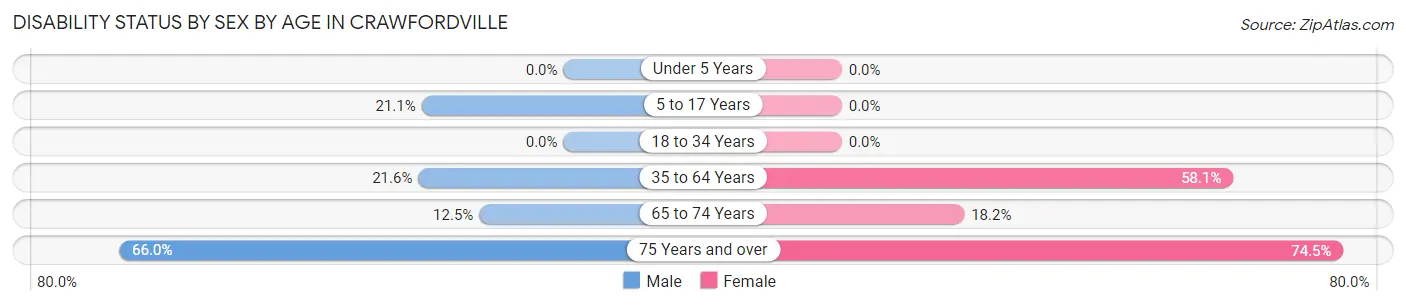
| Age Bracket | Male | Female |
| Under 5 Years | 0 (0.0%) | 0 (0.0%) |
| 5 to 17 Years | 4 (21.0%) | 0 (0.0%) |
| 18 to 34 Years | 0 (0.0%) | 0 (0.0%) |
| 35 to 64 Years | 25 (21.5%) | 68 (58.1%) |
| 65 to 74 Years | 2 (12.5%) | 4 (18.2%) |
| 75 Years and over | 31 (66.0%) | 35 (74.5%) |
Disability Class by Sex by Age in Crawfordville
Disability Class: Hearing Difficulty
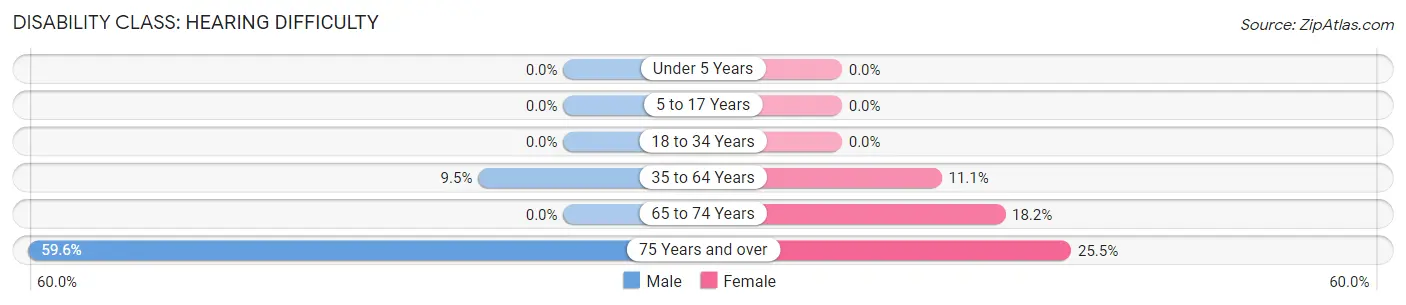
| Age Bracket | Male | Female |
| Under 5 Years | 0 (0.0%) | 0 (0.0%) |
| 5 to 17 Years | 0 (0.0%) | 0 (0.0%) |
| 18 to 34 Years | 0 (0.0%) | 0 (0.0%) |
| 35 to 64 Years | 11 (9.5%) | 13 (11.1%) |
| 65 to 74 Years | 0 (0.0%) | 4 (18.2%) |
| 75 Years and over | 28 (59.6%) | 12 (25.5%) |
Disability Class: Vision Difficulty
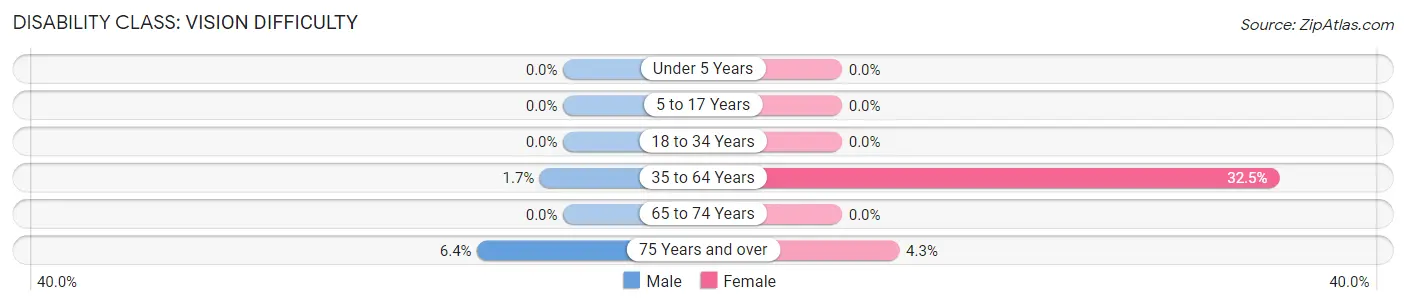
| Age Bracket | Male | Female |
| Under 5 Years | 0 (0.0%) | 0 (0.0%) |
| 5 to 17 Years | 0 (0.0%) | 0 (0.0%) |
| 18 to 34 Years | 0 (0.0%) | 0 (0.0%) |
| 35 to 64 Years | 2 (1.7%) | 38 (32.5%) |
| 65 to 74 Years | 0 (0.0%) | 0 (0.0%) |
| 75 Years and over | 3 (6.4%) | 2 (4.3%) |
Disability Class: Cognitive Difficulty
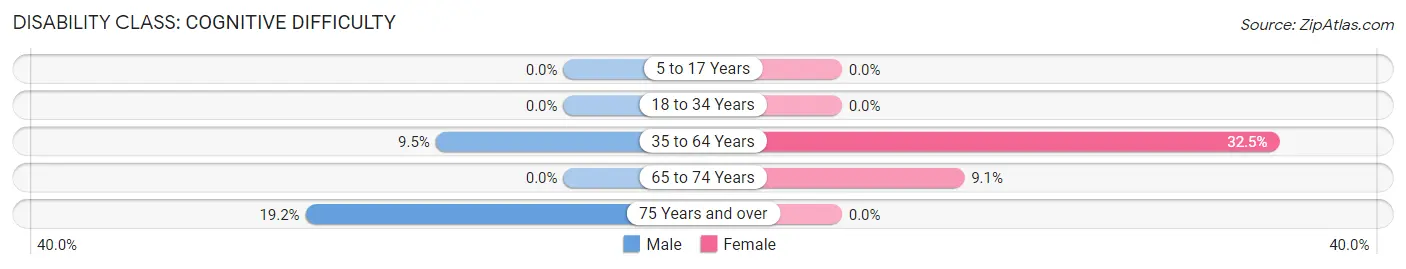
| Age Bracket | Male | Female |
| 5 to 17 Years | 0 (0.0%) | 0 (0.0%) |
| 18 to 34 Years | 0 (0.0%) | 0 (0.0%) |
| 35 to 64 Years | 11 (9.5%) | 38 (32.5%) |
| 65 to 74 Years | 0 (0.0%) | 2 (9.1%) |
| 75 Years and over | 9 (19.2%) | 0 (0.0%) |
Disability Class: Ambulatory Difficulty
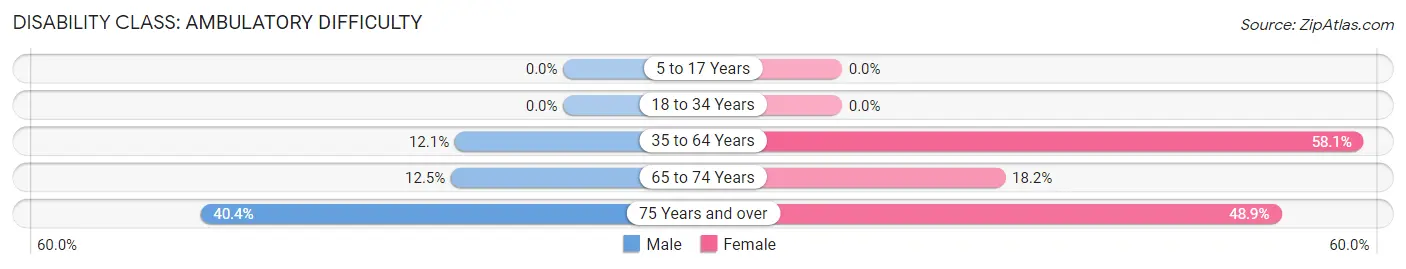
| Age Bracket | Male | Female |
| 5 to 17 Years | 0 (0.0%) | 0 (0.0%) |
| 18 to 34 Years | 0 (0.0%) | 0 (0.0%) |
| 35 to 64 Years | 14 (12.1%) | 68 (58.1%) |
| 65 to 74 Years | 2 (12.5%) | 4 (18.2%) |
| 75 Years and over | 19 (40.4%) | 23 (48.9%) |
Disability Class: Self-Care Difficulty
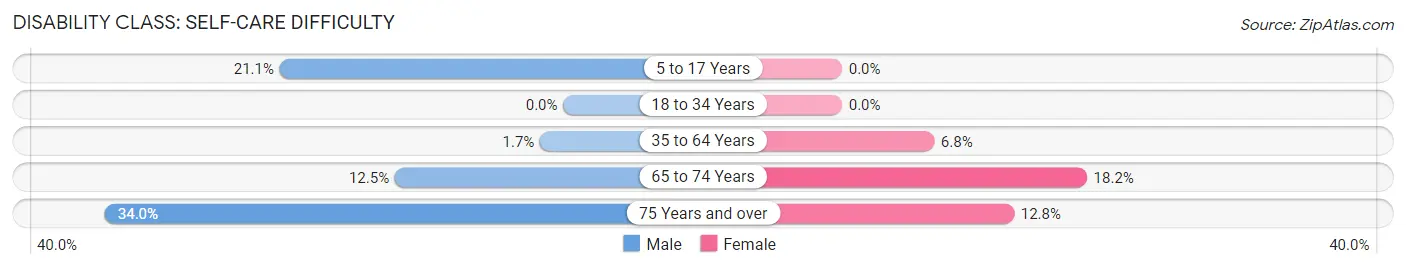
| Age Bracket | Male | Female |
| 5 to 17 Years | 4 (21.0%) | 0 (0.0%) |
| 18 to 34 Years | 0 (0.0%) | 0 (0.0%) |
| 35 to 64 Years | 2 (1.7%) | 8 (6.8%) |
| 65 to 74 Years | 2 (12.5%) | 4 (18.2%) |
| 75 Years and over | 16 (34.0%) | 6 (12.8%) |
Technology Access in Crawfordville
Computing Device Access in Crawfordville
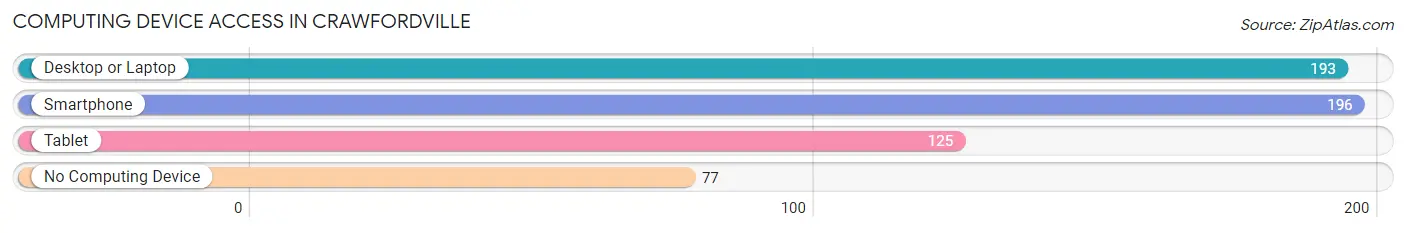
| Device Type | # Households | % Households |
| Desktop or Laptop | 193 | 67.2% |
| Smartphone | 196 | 68.3% |
| Tablet | 125 | 43.5% |
| No Computing Device | 77 | 26.8% |
| Total | 287 | 100.0% |
Internet Access in Crawfordville
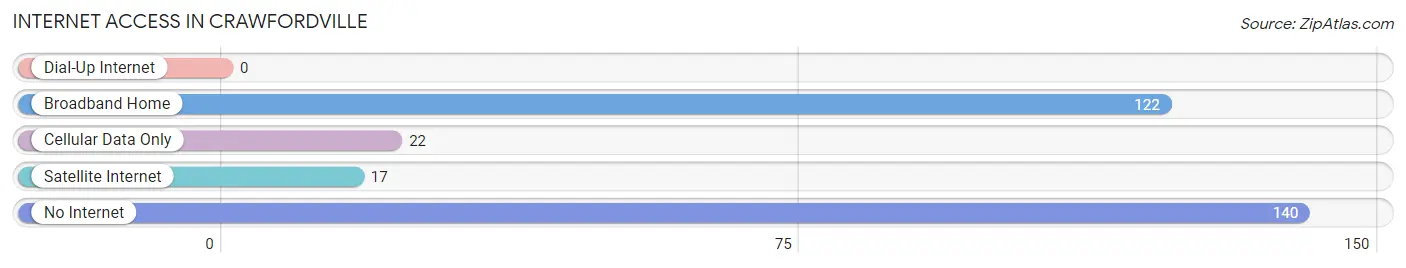
| Internet Type | # Households | % Households |
| Dial-Up Internet | 0 | 0.0% |
| Broadband Home | 122 | 42.5% |
| Cellular Data Only | 22 | 7.7% |
| Satellite Internet | 17 | 5.9% |
| No Internet | 140 | 48.8% |
| Total | 287 | 100.0% |
Crawfordville Summary
Crawfordville is a small town located in Taliaferro County, Georgia, United States. It is the county seat of Taliaferro County and is located about 50 miles east of Atlanta. The population of Crawfordville was 1,093 at the 2010 census.
History
Crawfordville was founded in 1820 and named after William H. Crawford, who was the United States Secretary of War at the time. The town was incorporated in 1821 and was the county seat of Taliaferro County.
In the early 19th century, Crawfordville was a center of cotton production and was home to several large plantations. During the Civil War, the town was occupied by Union forces and was the site of several skirmishes. After the war, the town experienced a period of economic decline, but began to recover in the late 19th century.
Geography
Crawfordville is located at 33°25'25" North, 82°51'45" West (33.423, -82.862). The town is situated in the Piedmont region of Georgia, and is located about 50 miles east of Atlanta. The town is located in the Oconee River watershed.
The town has a total area of 1 2 square miles all of which is land
Economy
Crawfordville's economy is largely based on agriculture and tourism. The town is home to several farms, which produce a variety of crops, including cotton, corn, soybeans, and peanuts. The town is also home to several small businesses, including restaurants, antique stores, and gift shops.
Tourism is an important part of the local economy, as the town is home to several historic sites, including the Crawfordville Historic District, which is listed on the National Register of Historic Places. The town also hosts several annual festivals, including the Taliaferro County Fair and the Crawfordville Music Festival.
Demographics
As of the 2010 census, there were 1,093 people, 441 households, and 287 families residing in the town. The population density was 908.3 people per square mile. The racial makeup of the town was 79.2% White, 17.7% African American, 0.2% Native American, 0.2% Asian, 0.1% Pacific Islander, 1.2% from other races, and 1.6% from two or more races. Hispanic or Latino of any race were 2.2% of the population.
The median income for a household in the town was $30,000, and the median income for a family was $37,500. The per capita income for the town was $15,845. About 17.2% of families and 20.2% of the population were below the poverty line, including 28.3% of those under age 18 and 15.2% of those age 65 or over.
Common Questions
What is Per Capita Income in Crawfordville?
Per Capita income in Crawfordville is $26,178.
What is the Median Family Income in Crawfordville?
Median Family Income in Crawfordville is $47,016.
What is the Median Household income in Crawfordville?
Median Household Income in Crawfordville is $42,341.
What is Income or Wage Gap in Crawfordville?
Income or Wage Gap in Crawfordville is 31.0%.
Women in Crawfordville earn 69.0 cents for every dollar earned by a man.
What is Inequality or Gini Index in Crawfordville?
Inequality or Gini Index in Crawfordville is 0.34.
What is the Total Population of Crawfordville?
Total Population of Crawfordville is 589.
What is the Total Male Population of Crawfordville?
Total Male Population of Crawfordville is 279.
What is the Total Female Population of Crawfordville?
Total Female Population of Crawfordville is 310.
What is the Ratio of Males per 100 Females in Crawfordville?
There are 90.00 Males per 100 Females in Crawfordville.
What is the Ratio of Females per 100 Males in Crawfordville?
There are 111.11 Females per 100 Males in Crawfordville.
What is the Median Population Age in Crawfordville?
Median Population Age in Crawfordville is 47.3 Years.
What is the Average Family Size in Crawfordville
Average Family Size in Crawfordville is 3.3 People.
What is the Average Household Size in Crawfordville
Average Household Size in Crawfordville is 2.0 People.
How Large is the Labor Force in Crawfordville?
There are 232 People in the Labor Forcein in Crawfordville.
What is the Percentage of People in the Labor Force in Crawfordville?
45.6% of People are in the Labor Force in Crawfordville.