Bloomington, TX Map & Demographics
Bloomington Map
Bloomington Overview
$19,554
PER CAPITA INCOME
$36,731
AVG FAMILY INCOME
$24,302
AVG HOUSEHOLD INCOME
$20,021
FAMILY INCOME DEFICIT
0.55
INEQUALITY / GINI INDEX
1,189
TOTAL POPULATION
434
MALE POPULATION
755
FEMALE POPULATION
57.48
MALES / 100 FEMALES
173.96
FEMALES / 100 MALES
35.8
MEDIAN AGE
3.3
AVG FAMILY SIZE
2.5
AVG HOUSEHOLD SIZE
301
LABOR FORCE [ PEOPLE ]
36.7%
PERCENT IN LABOR FORCE
12.6%
UNEMPLOYMENT RATE
Bloomington Zip Codes
Income in Bloomington
Income Overview in Bloomington
Per Capita Income in Bloomington is $19,554, while median incomes of families and households are $36,731 and $24,302 respectively.
| Characteristic | Number | Measure |
| Per Capita Income | 1,189 | $19,554 |
| Median Family Income | 296 | $36,731 |
| Mean Family Income | 296 | $53,549 |
| Median Household Income | 486 | $24,302 |
| Mean Household Income | 486 | $40,711 |
| Income Deficit | 296 | $20,021 |
| Wage / Income Gap (%) | 1,189 | 0.00% |
| Wage / Income Gap ($) | 1,189 | 100.00¢ per $1 |
| Gini / Inequality Index | 1,189 | 0.55 |
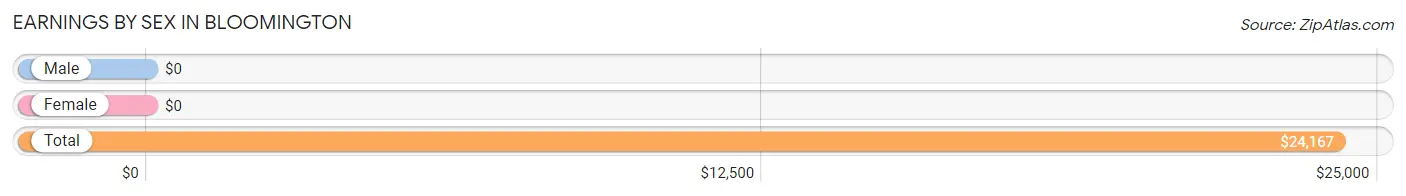
Earnings by Sex in Bloomington
| Sex | Number | Average Earnings |
| Male | 147 (45.1%) | $0 |
| Female | 179 (54.9%) | $0 |
| Total | 326 (100.0%) | $24,167 |
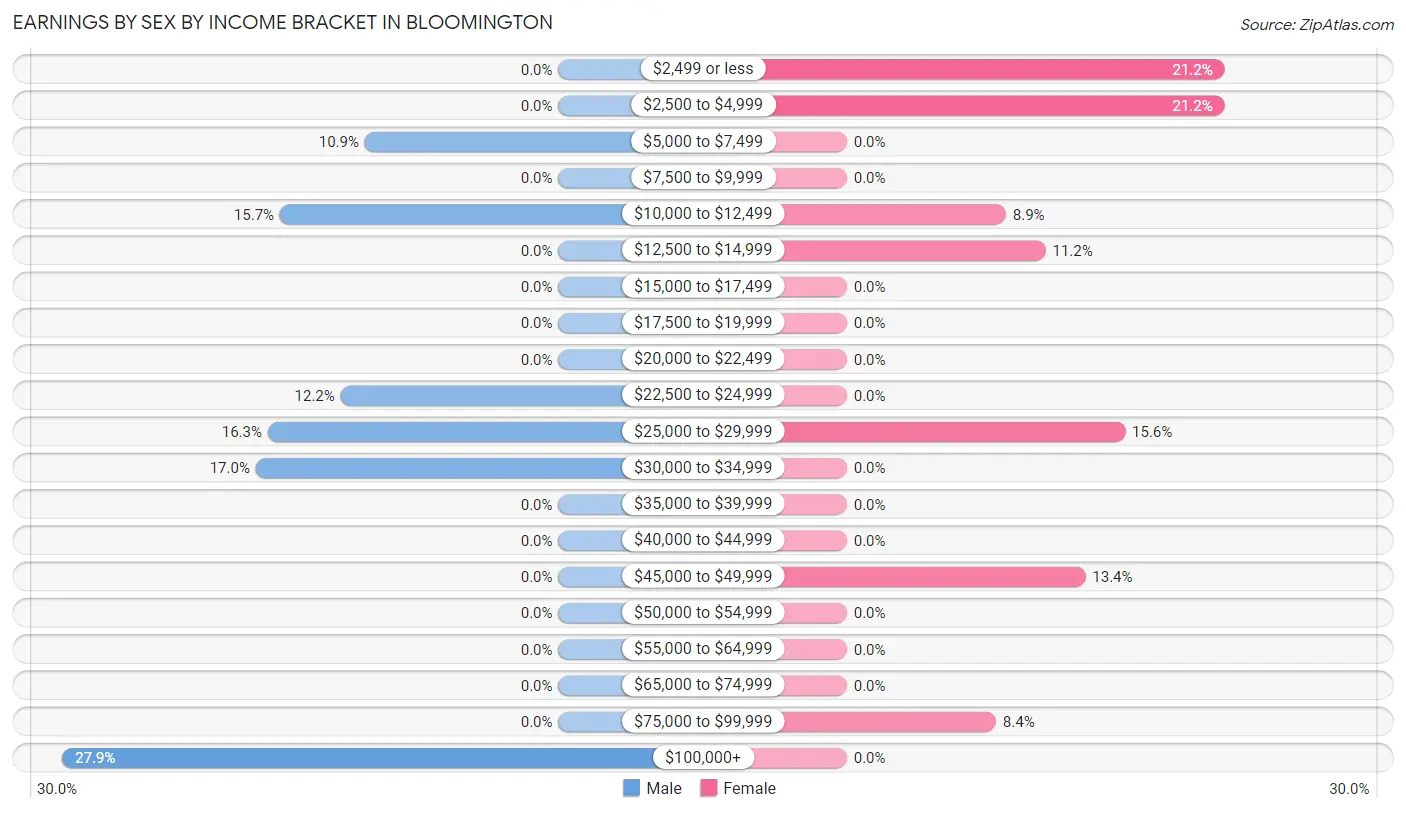
Earnings by Sex by Income Bracket in Bloomington
The most common earnings brackets in Bloomington are $100,000+ for men (41 | 27.9%) and $2,499 or less for women (38 | 21.2%).
| Income | Male | Female |
| $2,499 or less | 0 (0.0%) | 38 (21.2%) |
| $2,500 to $4,999 | 0 (0.0%) | 38 (21.2%) |
| $5,000 to $7,499 | 16 (10.9%) | 0 (0.0%) |
| $7,500 to $9,999 | 0 (0.0%) | 0 (0.0%) |
| $10,000 to $12,499 | 23 (15.7%) | 16 (8.9%) |
| $12,500 to $14,999 | 0 (0.0%) | 20 (11.2%) |
| $15,000 to $17,499 | 0 (0.0%) | 0 (0.0%) |
| $17,500 to $19,999 | 0 (0.0%) | 0 (0.0%) |
| $20,000 to $22,499 | 0 (0.0%) | 0 (0.0%) |
| $22,500 to $24,999 | 18 (12.2%) | 0 (0.0%) |
| $25,000 to $29,999 | 24 (16.3%) | 28 (15.6%) |
| $30,000 to $34,999 | 25 (17.0%) | 0 (0.0%) |
| $35,000 to $39,999 | 0 (0.0%) | 0 (0.0%) |
| $40,000 to $44,999 | 0 (0.0%) | 0 (0.0%) |
| $45,000 to $49,999 | 0 (0.0%) | 24 (13.4%) |
| $50,000 to $54,999 | 0 (0.0%) | 0 (0.0%) |
| $55,000 to $64,999 | 0 (0.0%) | 0 (0.0%) |
| $65,000 to $74,999 | 0 (0.0%) | 0 (0.0%) |
| $75,000 to $99,999 | 0 (0.0%) | 15 (8.4%) |
| $100,000+ | 41 (27.9%) | 0 (0.0%) |
| Total | 147 (100.0%) | 179 (100.0%) |
Earnings by Sex by Educational Attainment in Bloomington
| Educational Attainment | Male Income | Female Income |
| Less than High School | - | - |
| High School Diploma | - | - |
| College or Associate's Degree | - | - |
| Bachelor's Degree | - | - |
| Graduate Degree | - | - |
| Total | - | - |
Family Income in Bloomington
Family Income Brackets in Bloomington
According to the Bloomington family income data, there are 58 families falling into the $10,000 to $14,999 income range, which is the most common income bracket and makes up 19.6% of all families.
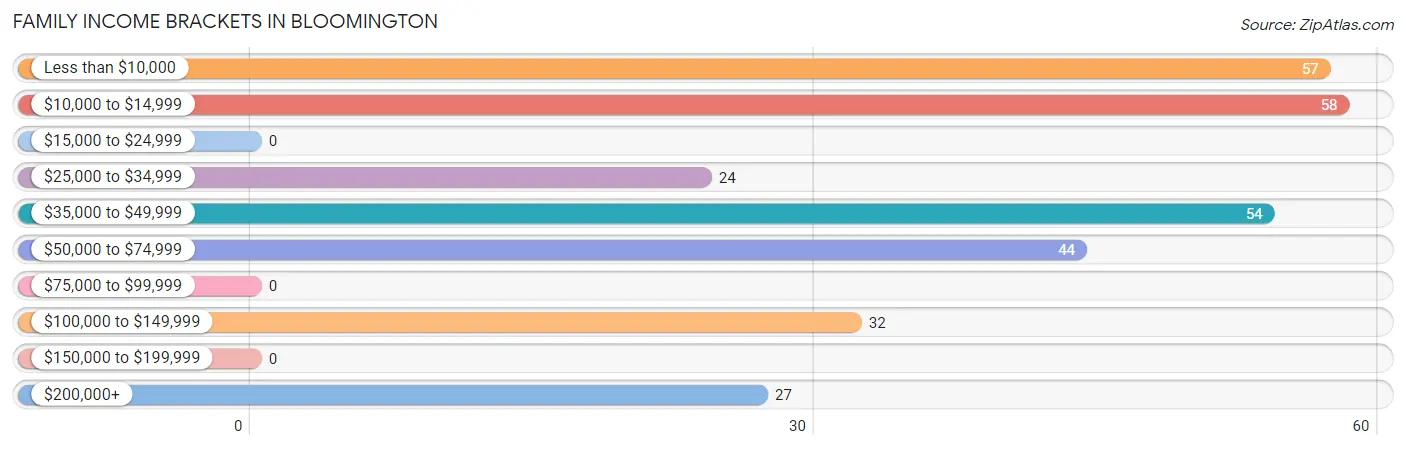
| Income Bracket | # Families | % Families |
| Less than $10,000 | 57 | 19.3% |
| $10,000 to $14,999 | 58 | 19.6% |
| $15,000 to $24,999 | 0 | 0.0% |
| $25,000 to $34,999 | 24 | 8.1% |
| $35,000 to $49,999 | 54 | 18.2% |
| $50,000 to $74,999 | 44 | 14.9% |
| $75,000 to $99,999 | 0 | 0.0% |
| $100,000 to $149,999 | 32 | 10.8% |
| $150,000 to $199,999 | 0 | 0.0% |
| $200,000+ | 27 | 9.1% |
Family Income by Famaliy Size in Bloomington
2-person families (121 | 40.9%) account for the highest median family income in Bloomington with $39,150 per family, while 2-person families (121 | 40.9%) have the highest median income of $19,575 per family member.
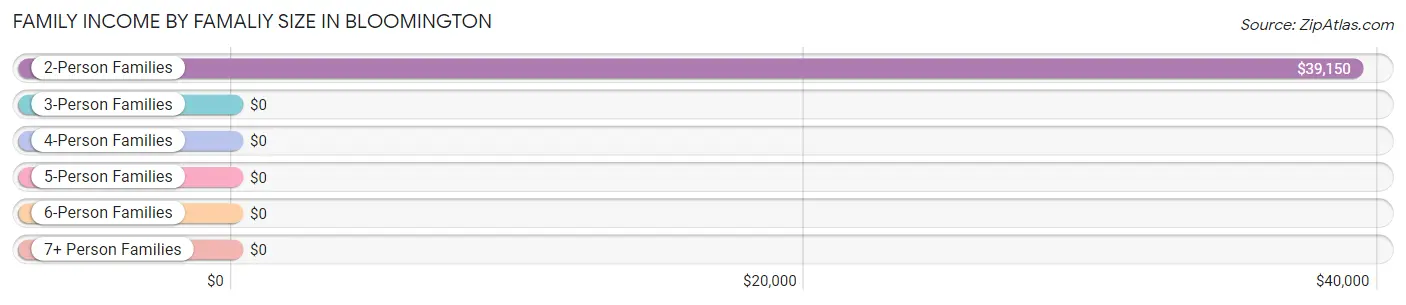
| Income Bracket | # Families | Median Income |
| 2-Person Families | 121 (40.9%) | $39,150 |
| 3-Person Families | 88 (29.7%) | $0 |
| 4-Person Families | 24 (8.1%) | $0 |
| 5-Person Families | 63 (21.3%) | $0 |
| 6-Person Families | 0 (0.0%) | $0 |
| 7+ Person Families | 0 (0.0%) | $0 |
| Total | 296 (100.0%) | $36,731 |
Family Income by Number of Earners in Bloomington
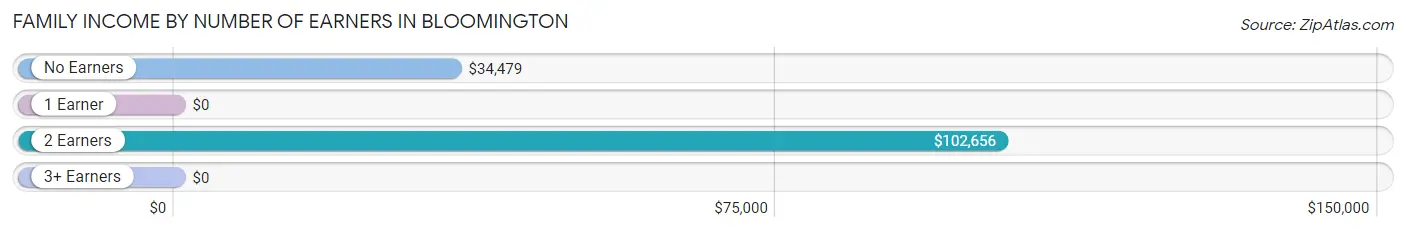
| Number of Earners | # Families | Median Income |
| No Earners | 134 (45.3%) | $34,479 |
| 1 Earner | 87 (29.4%) | $0 |
| 2 Earners | 75 (25.3%) | $102,656 |
| 3+ Earners | 0 (0.0%) | $0 |
| Total | 296 (100.0%) | $36,731 |
Household Income in Bloomington
Household Income Brackets in Bloomington
With 128 households falling in the category, the $10,000 to $14,999 income range is the most frequent in Bloomington, accounting for 26.3% of all households.
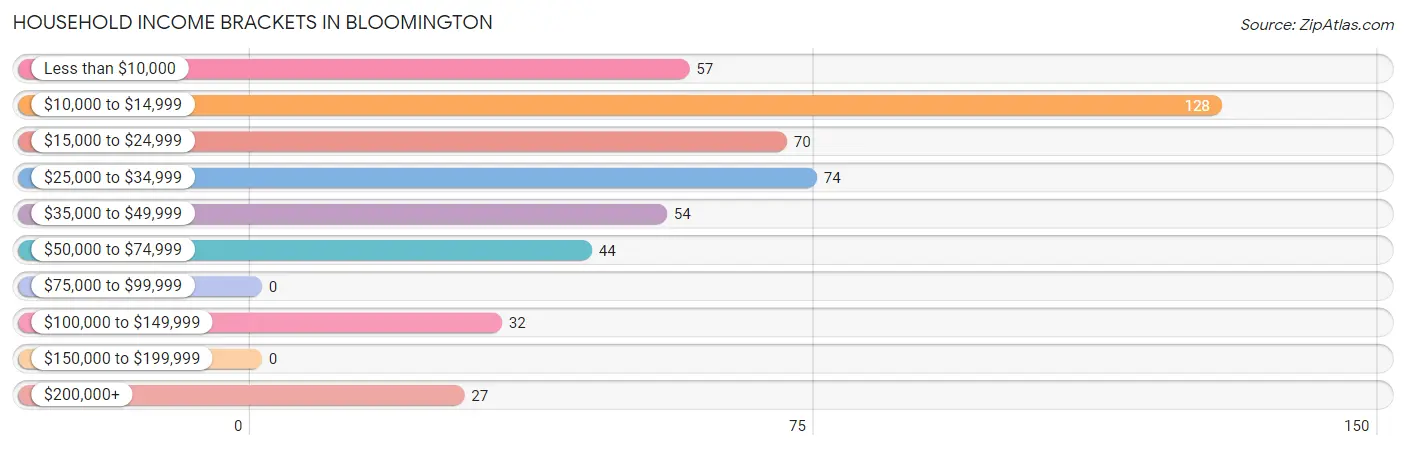
| Income Bracket | # Households | % Households |
| Less than $10,000 | 57 | 11.7% |
| $10,000 to $14,999 | 128 | 26.3% |
| $15,000 to $24,999 | 70 | 14.4% |
| $25,000 to $34,999 | 74 | 15.2% |
| $35,000 to $49,999 | 54 | 11.1% |
| $50,000 to $74,999 | 44 | 9.1% |
| $75,000 to $99,999 | 0 | 0.0% |
| $100,000 to $149,999 | 32 | 6.6% |
| $150,000 to $199,999 | 0 | 0.0% |
| $200,000+ | 27 | 5.6% |
Household Income by Householder Age in Bloomington
The median household income in Bloomington is $24,302, with the highest median household income of $58,313 found in the 45 to 64 years age bracket for the primary householder. A total of 99 households (20.4%) fall into this category.
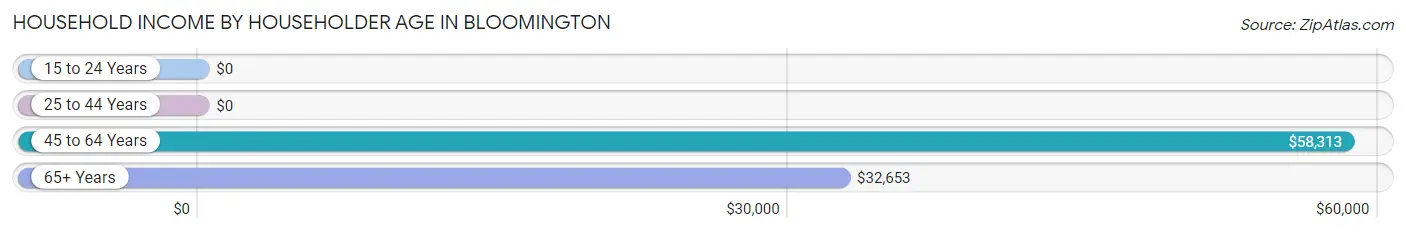
| Income Bracket | # Households | Median Income |
| 15 to 24 Years | 0 (0.0%) | $0 |
| 25 to 44 Years | 155 (31.9%) | $0 |
| 45 to 64 Years | 99 (20.4%) | $58,313 |
| 65+ Years | 232 (47.7%) | $32,653 |
| Total | 486 (100.0%) | $24,302 |
Poverty in Bloomington
Income Below Poverty by Sex and Age in Bloomington
With 18.0% poverty level for males and 57.0% for females among the residents of Bloomington, 6 to 11 year old males and 6 to 11 year old females are the most vulnerable to poverty, with 55 males (100.0%) and 94 females (100.0%) in their respective age groups living below the poverty level.
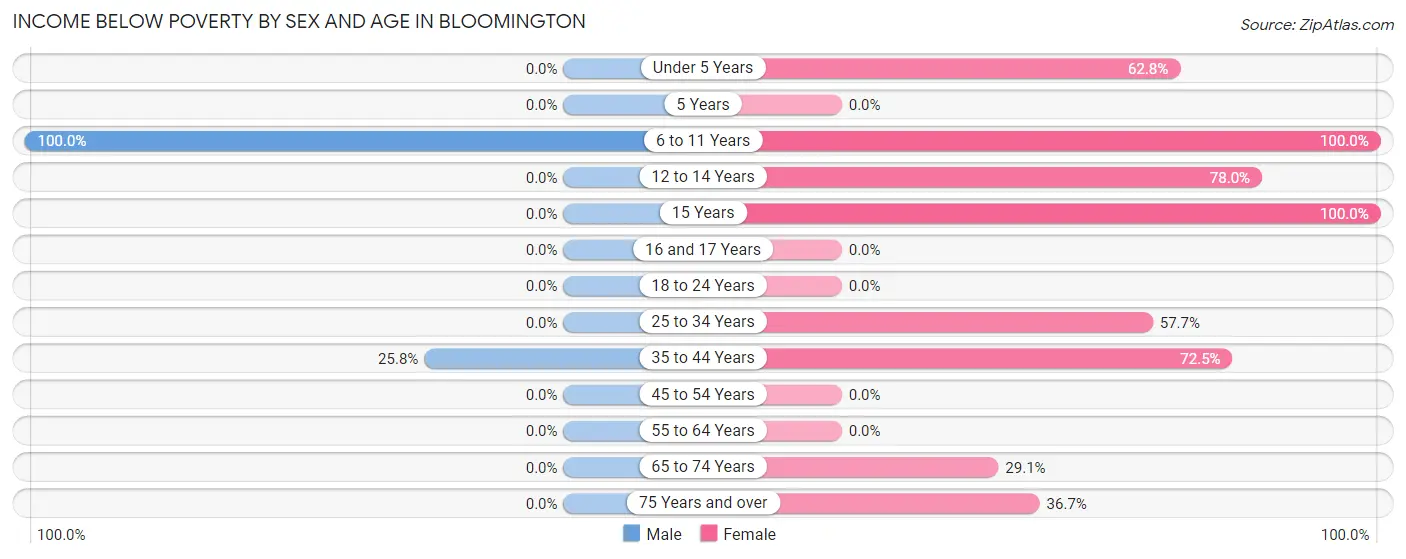
| Age Bracket | Male | Female |
| Under 5 Years | 0 (0.0%) | 54 (62.8%) |
| 5 Years | 0 (0.0%) | 0 (0.0%) |
| 6 to 11 Years | 55 (100.0%) | 94 (100.0%) |
| 12 to 14 Years | 0 (0.0%) | 46 (78.0%) |
| 15 Years | 0 (0.0%) | 60 (100.0%) |
| 16 and 17 Years | 0 (0.0%) | 0 (0.0%) |
| 18 to 24 Years | 0 (0.0%) | 0 (0.0%) |
| 25 to 34 Years | 0 (0.0%) | 86 (57.7%) |
| 35 to 44 Years | 23 (25.8%) | 29 (72.5%) |
| 45 to 54 Years | 0 (0.0%) | 0 (0.0%) |
| 55 to 64 Years | 0 (0.0%) | 0 (0.0%) |
| 65 to 74 Years | 0 (0.0%) | 25 (29.1%) |
| 75 Years and over | 0 (0.0%) | 36 (36.7%) |
| Total | 78 (18.0%) | 430 (57.0%) |
Income Above Poverty by Sex and Age in Bloomington
According to the poverty statistics in Bloomington, males aged 12 to 14 years and females aged 45 to 54 years are the age groups that are most secure financially, with 100.0% of males and 100.0% of females in these age groups living above the poverty line.
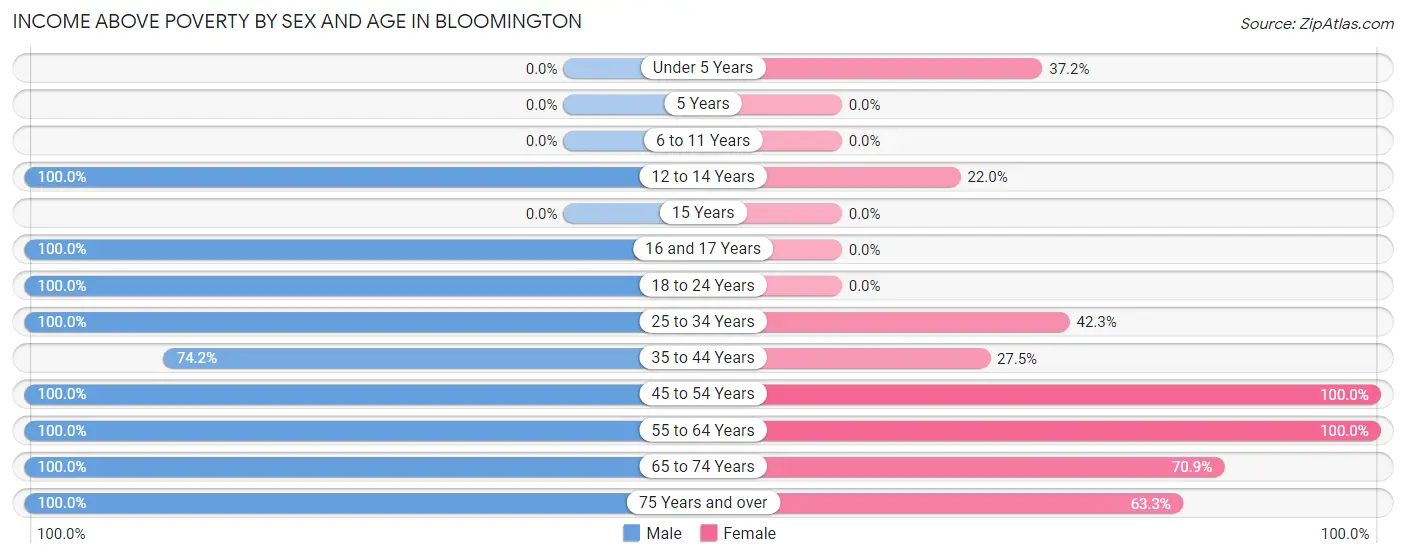
| Age Bracket | Male | Female |
| Under 5 Years | 0 (0.0%) | 32 (37.2%) |
| 5 Years | 0 (0.0%) | 0 (0.0%) |
| 6 to 11 Years | 0 (0.0%) | 0 (0.0%) |
| 12 to 14 Years | 15 (100.0%) | 13 (22.0%) |
| 15 Years | 0 (0.0%) | 0 (0.0%) |
| 16 and 17 Years | 13 (100.0%) | 0 (0.0%) |
| 18 to 24 Years | 33 (100.0%) | 0 (0.0%) |
| 25 to 34 Years | 16 (100.0%) | 63 (42.3%) |
| 35 to 44 Years | 66 (74.2%) | 11 (27.5%) |
| 45 to 54 Years | 27 (100.0%) | 36 (100.0%) |
| 55 to 64 Years | 76 (100.0%) | 47 (100.0%) |
| 65 to 74 Years | 31 (100.0%) | 61 (70.9%) |
| 75 Years and over | 79 (100.0%) | 62 (63.3%) |
| Total | 356 (82.0%) | 325 (43.0%) |
Income Below Poverty Among Married-Couple Families in Bloomington
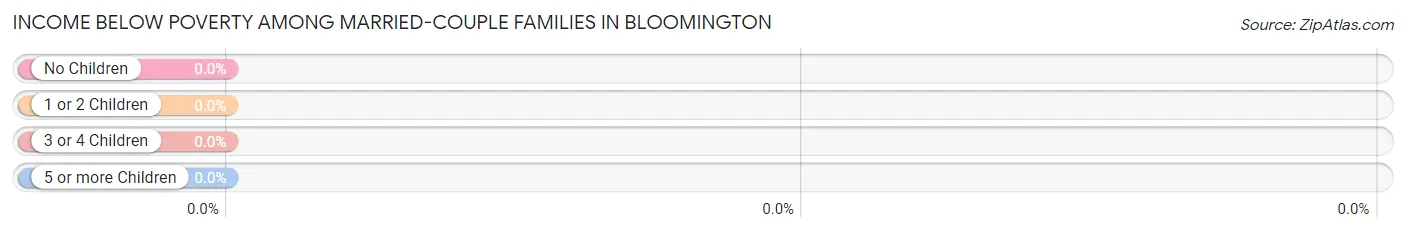
| Children | Above Poverty | Below Poverty |
| No Children | 113 (100.0%) | 0 (0.0%) |
| 1 or 2 Children | 15 (100.0%) | 0 (0.0%) |
| 3 or 4 Children | 0 (0.0%) | 0 (0.0%) |
| 5 or more Children | 0 (0.0%) | 0 (0.0%) |
| Total | 128 (100.0%) | 0 (0.0%) |
Income Below Poverty Among Single-Parent Households in Bloomington
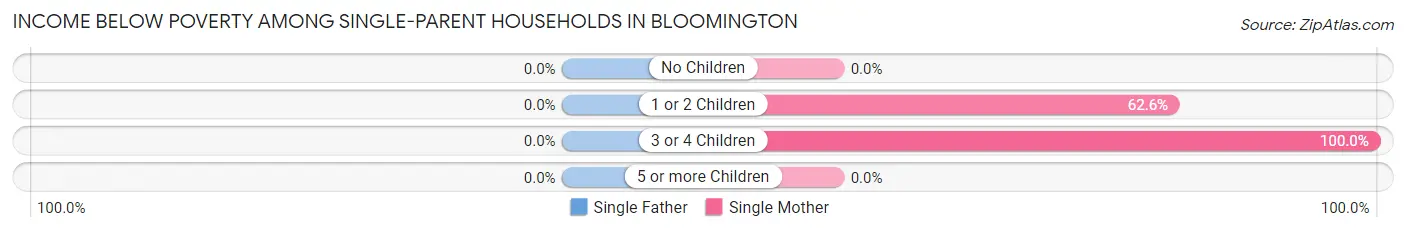
| Children | Single Father | Single Mother |
| No Children | 0 (0.0%) | 0 (0.0%) |
| 1 or 2 Children | 0 (0.0%) | 67 (62.6%) |
| 3 or 4 Children | 0 (0.0%) | 48 (100.0%) |
| 5 or more Children | 0 (0.0%) | 0 (0.0%) |
| Total | 0 (0.0%) | 115 (68.4%) |
Income Below Poverty Among Married-Couple vs Single-Parent Households in Bloomington
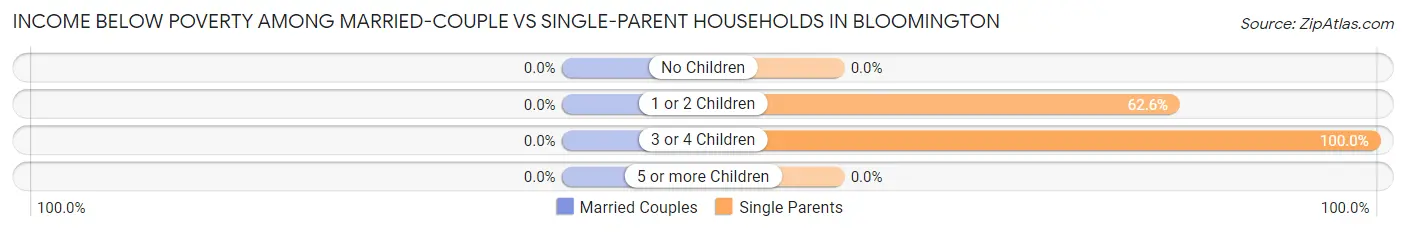
| Children | Married-Couple Families | Single-Parent Households |
| No Children | 0 (0.0%) | 0 (0.0%) |
| 1 or 2 Children | 0 (0.0%) | 67 (62.6%) |
| 3 or 4 Children | 0 (0.0%) | 48 (100.0%) |
| 5 or more Children | 0 (0.0%) | 0 (0.0%) |
| Total | 0 (0.0%) | 115 (68.4%) |
Race in Bloomington
The most populous races in Bloomington are White / Caucasian (1,024 | 86.1%), Hispanic or Latino (838 | 70.5%), and Two or more Races (90 | 7.6%).
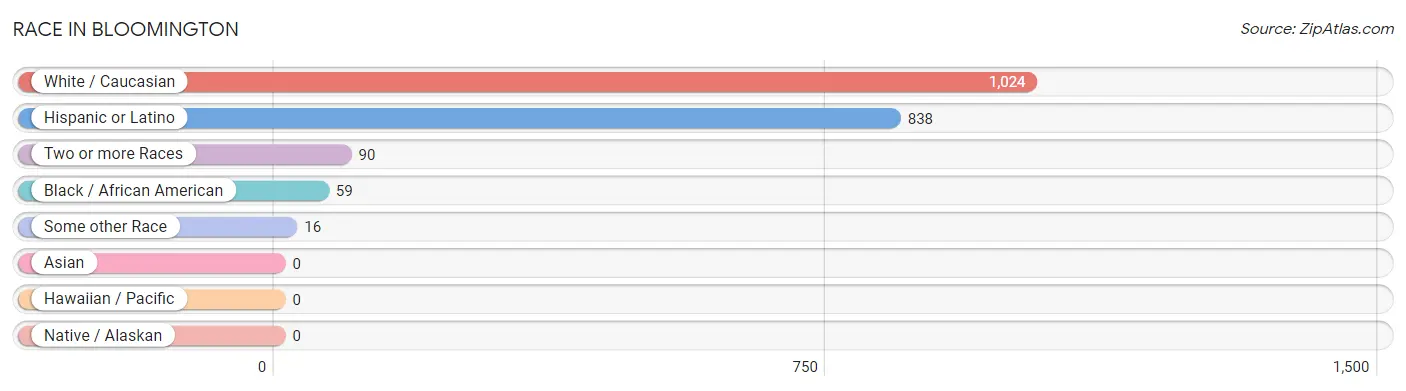
| Race | # Population | % Population |
| Asian | 0 | 0.0% |
| Black / African American | 59 | 5.0% |
| Hawaiian / Pacific | 0 | 0.0% |
| Hispanic or Latino | 838 | 70.5% |
| Native / Alaskan | 0 | 0.0% |
| White / Caucasian | 1,024 | 86.1% |
| Two or more Races | 90 | 7.6% |
| Some other Race | 16 | 1.3% |
| Total | 1,189 | 100.0% |
Ancestry in Bloomington
The most populous ancestries reported in Bloomington are Mexican (838 | 70.5%), Irish (102 | 8.6%), German (98 | 8.2%), English (81 | 6.8%), and Dutch (25 | 2.1%), together accounting for 96.2% of all Bloomington residents.
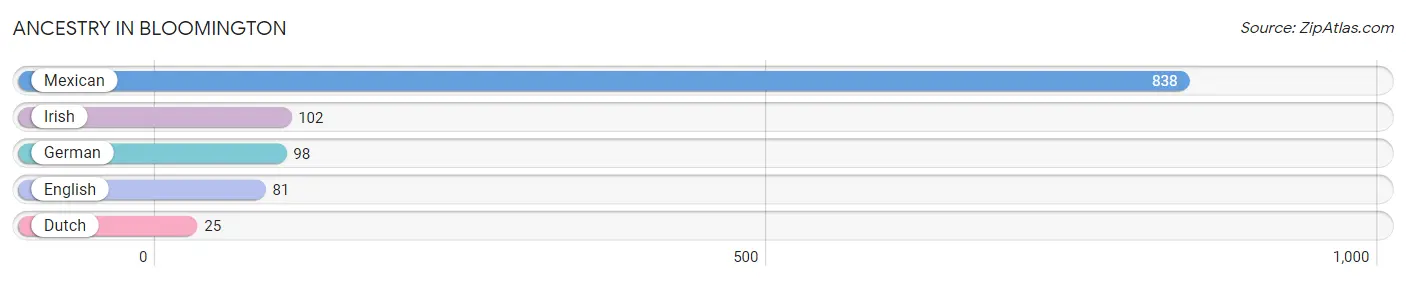
| Ancestry | # Population | % Population |
| Dutch | 25 | 2.1% |
| English | 81 | 6.8% |
| German | 98 | 8.2% |
| Irish | 102 | 8.6% |
| Mexican | 838 | 70.5% | View All 5 Rows |
Immigrants in Bloomington
The most numerous immigrant groups reported in Bloomington came from Central America (67 | 5.6%), Latin America (67 | 5.6%), and Mexico (67 | 5.6%), together accounting for 16.9% of all Bloomington residents.
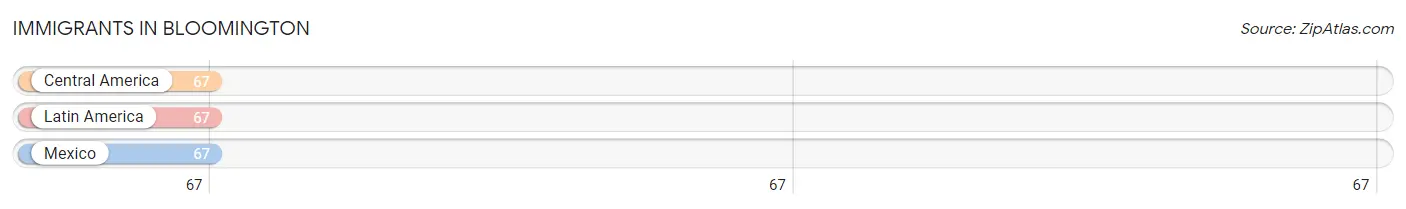
| Immigration Origin | # Population | % Population |
| Central America | 67 | 5.6% |
| Latin America | 67 | 5.6% |
| Mexico | 67 | 5.6% | View All 3 Rows |
Sex and Age in Bloomington
Sex and Age in Bloomington
The most populous age groups in Bloomington are 40 to 44 Years (79 | 18.2%) for men and 10 to 14 Years (107 | 14.2%) for women.
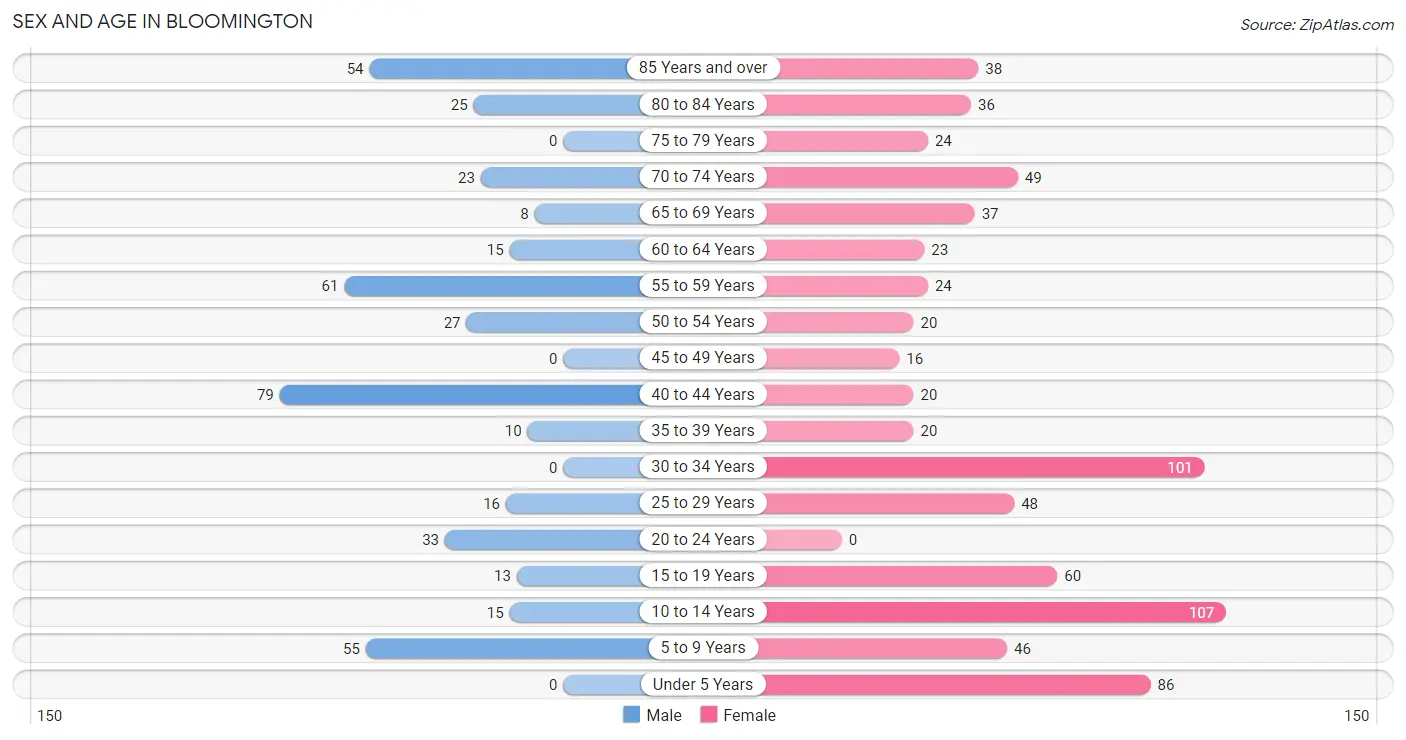
| Age Bracket | Male | Female |
| Under 5 Years | 0 (0.0%) | 86 (11.4%) |
| 5 to 9 Years | 55 (12.7%) | 46 (6.1%) |
| 10 to 14 Years | 15 (3.5%) | 107 (14.2%) |
| 15 to 19 Years | 13 (3.0%) | 60 (8.0%) |
| 20 to 24 Years | 33 (7.6%) | 0 (0.0%) |
| 25 to 29 Years | 16 (3.7%) | 48 (6.4%) |
| 30 to 34 Years | 0 (0.0%) | 101 (13.4%) |
| 35 to 39 Years | 10 (2.3%) | 20 (2.6%) |
| 40 to 44 Years | 79 (18.2%) | 20 (2.6%) |
| 45 to 49 Years | 0 (0.0%) | 16 (2.1%) |
| 50 to 54 Years | 27 (6.2%) | 20 (2.6%) |
| 55 to 59 Years | 61 (14.1%) | 24 (3.2%) |
| 60 to 64 Years | 15 (3.5%) | 23 (3.0%) |
| 65 to 69 Years | 8 (1.8%) | 37 (4.9%) |
| 70 to 74 Years | 23 (5.3%) | 49 (6.5%) |
| 75 to 79 Years | 0 (0.0%) | 24 (3.2%) |
| 80 to 84 Years | 25 (5.8%) | 36 (4.8%) |
| 85 Years and over | 54 (12.4%) | 38 (5.0%) |
| Total | 434 (100.0%) | 755 (100.0%) |
Families and Households in Bloomington
Median Family Size in Bloomington
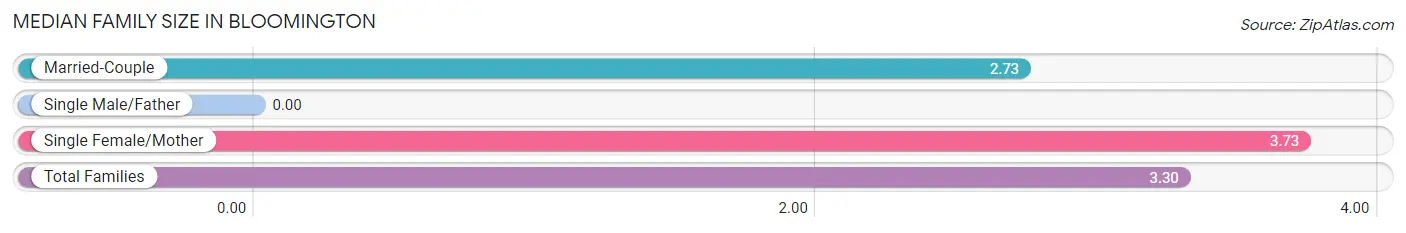
| Family Type | # Families | Family Size |
| Married-Couple | 128 (43.2%) | 2.73 |
| Single Male/Father | 0 (0.0%) | - |
| Single Female/Mother | 168 (56.8%) | 3.73 |
| Total Families | 296 (100.0%) | 3.30 |
Median Household Size in Bloomington
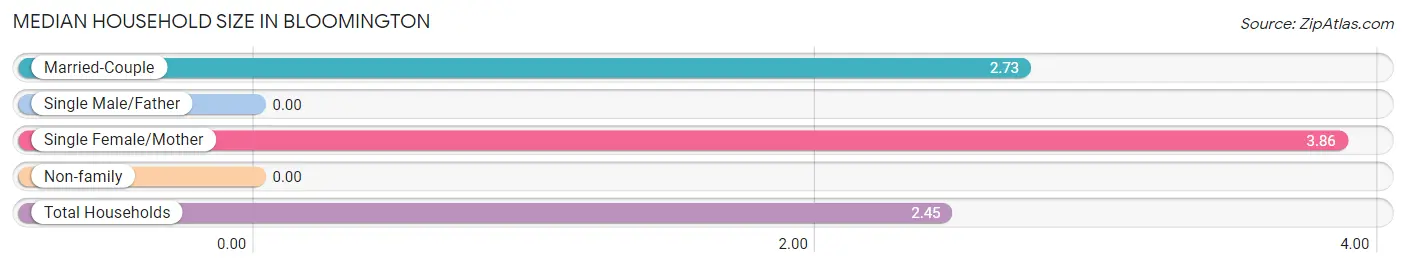
| Household Type | # Households | Household Size |
| Married-Couple | 128 (26.3%) | 2.73 |
| Single Male/Father | 0 (0.0%) | - |
| Single Female/Mother | 168 (34.6%) | 3.86 |
| Non-family | 190 (39.1%) | - |
| Total Households | 486 (100.0%) | 2.45 |
Household Size by Marriage Status in Bloomington
Out of a total of 486 households in Bloomington, 296 (60.9%) are family households, while 190 (39.1%) are nonfamily households. The most numerous type of family households are 3-person households, comprising 108, and the most common type of nonfamily households are 1-person households, comprising 190.
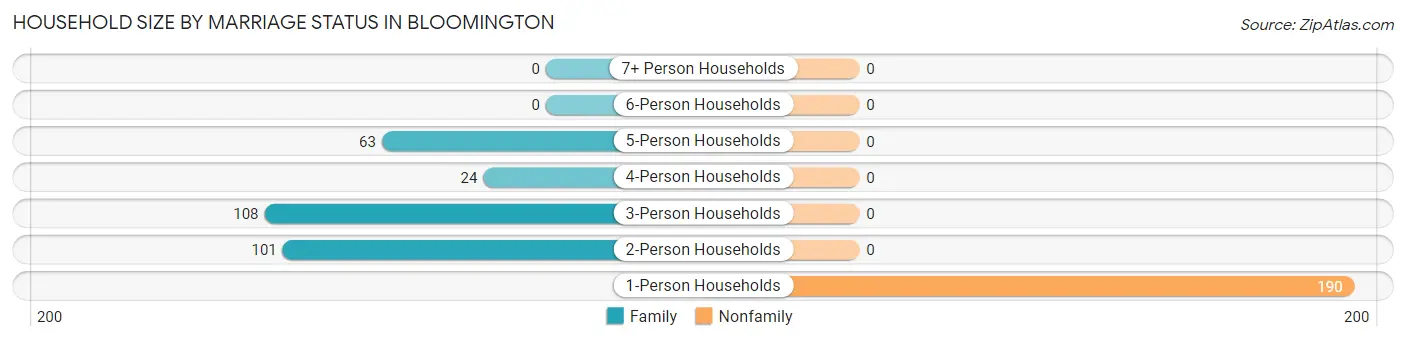
| Household Size | Family Households | Nonfamily Households |
| 1-Person Households | - | 190 (39.1%) |
| 2-Person Households | 101 (20.8%) | 0 (0.0%) |
| 3-Person Households | 108 (22.2%) | 0 (0.0%) |
| 4-Person Households | 24 (4.9%) | 0 (0.0%) |
| 5-Person Households | 63 (13.0%) | 0 (0.0%) |
| 6-Person Households | 0 (0.0%) | 0 (0.0%) |
| 7+ Person Households | 0 (0.0%) | 0 (0.0%) |
| Total | 296 (60.9%) | 190 (39.1%) |
Female Fertility in Bloomington
Fertility by Age in Bloomington
| Age Bracket | Women with Births | Births / 1,000 Women |
| 15 to 19 years | 0 (0.0%) | 0.0 |
| 20 to 34 years | 0 (0.0%) | 0.0 |
| 35 to 50 years | 0 (0.0%) | 0.0 |
| Total | 0 (0.0%) | 0.0 |
Fertility by Age by Marriage Status in Bloomington
| Age Bracket | Married | Unmarried |
| 15 to 19 years | 0 (0.0%) | 0 (0.0%) |
| 20 to 34 years | 0 (0.0%) | 0 (0.0%) |
| 35 to 50 years | 0 (0.0%) | 0 (0.0%) |
| Total | 0 (0.0%) | 0 (0.0%) |
Fertility by Education in Bloomington
| Educational Attainment | Women with Births | Births / 1,000 Women |
| Less than High School | 0 (0.0%) | 0.0 |
| High School Diploma | 0 (0.0%) | 0.0 |
| College or Associate's Degree | 0 (0.0%) | 0.0 |
| Bachelor's Degree | 0 (0.0%) | 0.0 |
| Graduate Degree | 0 (0.0%) | 0.0 |
| Total | 0 (0.0%) | 0.0 |
Fertility by Education by Marriage Status in Bloomington
| Educational Attainment | Married | Unmarried |
| Less than High School | 0 (0.0%) | 0 (0.0%) |
| High School Diploma | 0 (0.0%) | 0 (0.0%) |
| College or Associate's Degree | 0 (0.0%) | 0 (0.0%) |
| Bachelor's Degree | 0 (0.0%) | 0 (0.0%) |
| Graduate Degree | 0 (0.0%) | 0 (0.0%) |
| Total | 0 (0.0%) | 0 (0.0%) |
Employment Characteristics in Bloomington
Employment by Class of Employer in Bloomington
Among the 263 employed individuals in Bloomington, private company employees (142 | 54.0%), self-employed (not incorporated) (68 | 25.9%), and local government employees (28 | 10.6%) make up the most common classes of employment.
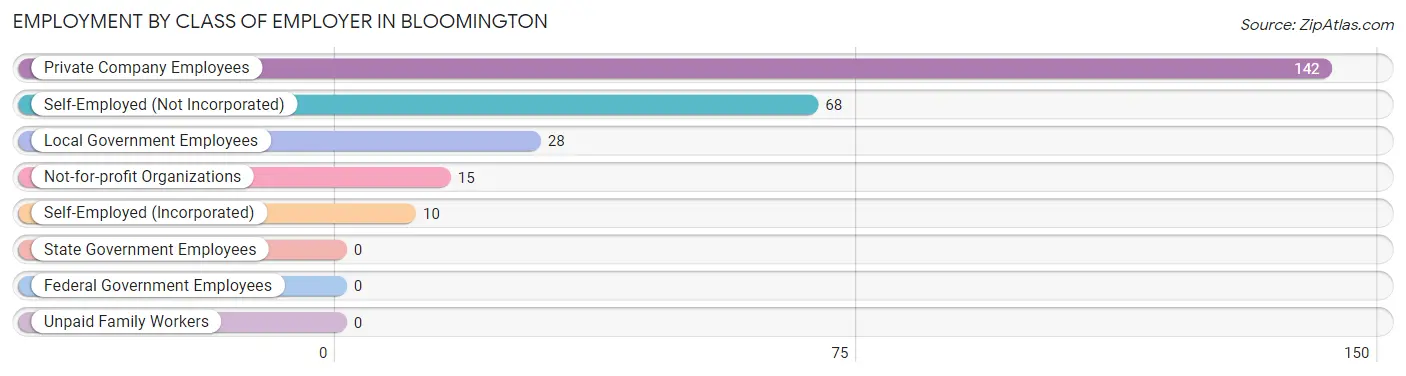
| Employer Class | # Employees | % Employees |
| Private Company Employees | 142 | 54.0% |
| Self-Employed (Incorporated) | 10 | 3.8% |
| Self-Employed (Not Incorporated) | 68 | 25.9% |
| Not-for-profit Organizations | 15 | 5.7% |
| Local Government Employees | 28 | 10.6% |
| State Government Employees | 0 | 0.0% |
| Federal Government Employees | 0 | 0.0% |
| Unpaid Family Workers | 0 | 0.0% |
| Total | 263 | 100.0% |
Employment Status by Age in Bloomington
According to the labor force statistics for Bloomington, out of the total population over 16 years of age (820), 36.7% or 301 individuals are in the labor force, with 12.6% or 38 of them unemployed. The age group with the highest labor force participation rate is 35 to 44 years, with 84.5% or 109 individuals in the labor force. Within the labor force, the 30 to 34 years age range has the highest percentage of unemployed individuals, with 71.7% or 38 of them being unemployed.
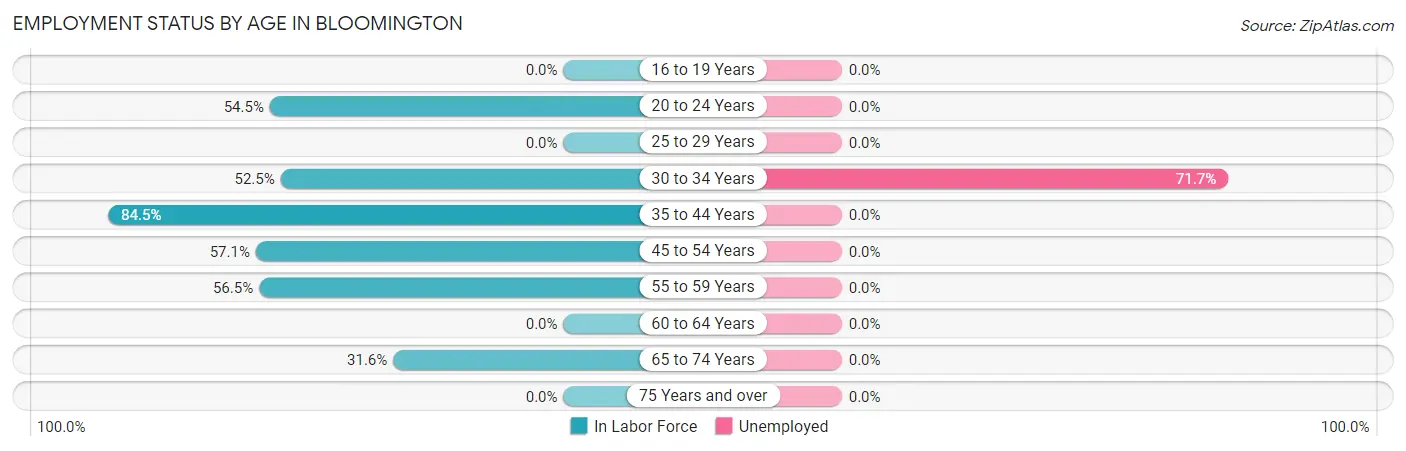
| Age Bracket | In Labor Force | Unemployed |
| 16 to 19 Years | 0 (0.0%) | 0 (0.0%) |
| 20 to 24 Years | 18 (54.5%) | 0 (0.0%) |
| 25 to 29 Years | 0 (0.0%) | 0 (0.0%) |
| 30 to 34 Years | 53 (52.5%) | 38 (71.7%) |
| 35 to 44 Years | 109 (84.5%) | 0 (0.0%) |
| 45 to 54 Years | 36 (57.1%) | 0 (0.0%) |
| 55 to 59 Years | 48 (56.5%) | 0 (0.0%) |
| 60 to 64 Years | 0 (0.0%) | 0 (0.0%) |
| 65 to 74 Years | 37 (31.6%) | 0 (0.0%) |
| 75 Years and over | 0 (0.0%) | 0 (0.0%) |
| Total | 301 (36.7%) | 38 (12.6%) |
Employment Status by Educational Attainment in Bloomington
According to labor force statistics for Bloomington, 51.3% of individuals (246) out of the total population between 25 and 64 years of age (480) are in the labor force, with 15.4% or 38 of them being unemployed. The group with the highest labor force participation rate are those with the educational attainment of college / associate degree, with 100.0% or 54 individuals in the labor force. Within the labor force, individuals with high school diploma education have the highest percentage of unemployment, with 37.3% or 38 of them being unemployed.
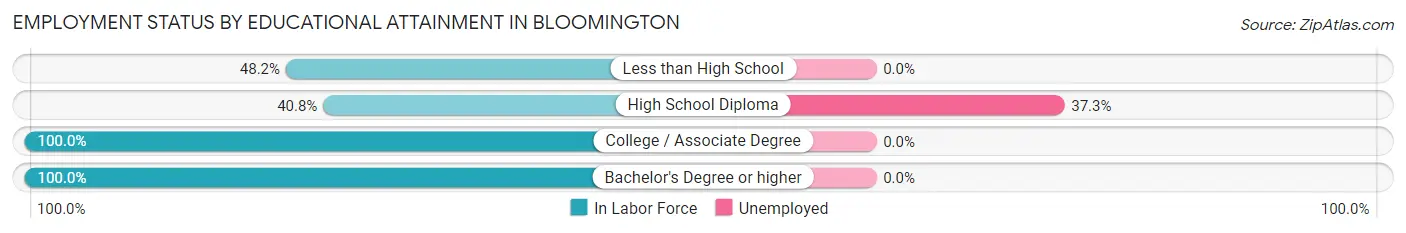
| Educational Attainment | In Labor Force | Unemployed |
| Less than High School | 80 (48.2%) | 0 (0.0%) |
| High School Diploma | 102 (40.8%) | 93 (37.3%) |
| College / Associate Degree | 54 (100.0%) | 0 (0.0%) |
| Bachelor's Degree or higher | 10 (100.0%) | 0 (0.0%) |
| Total | 246 (51.3%) | 74 (15.4%) |
Employment Occupations by Sex in Bloomington
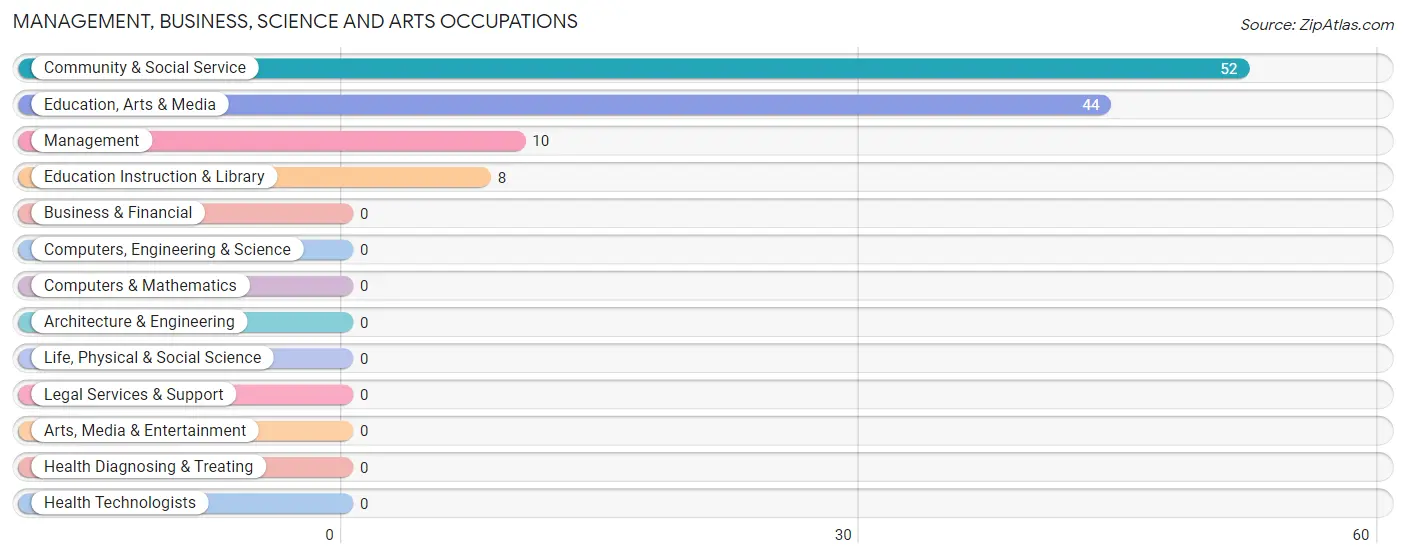
Management, Business, Science and Arts Occupations
The most common Management, Business, Science and Arts occupations in Bloomington are Community & Social Service (52 | 19.8%), Education, Arts & Media (44 | 16.7%), Management (10 | 3.8%), and Education Instruction & Library (8 | 3.0%).
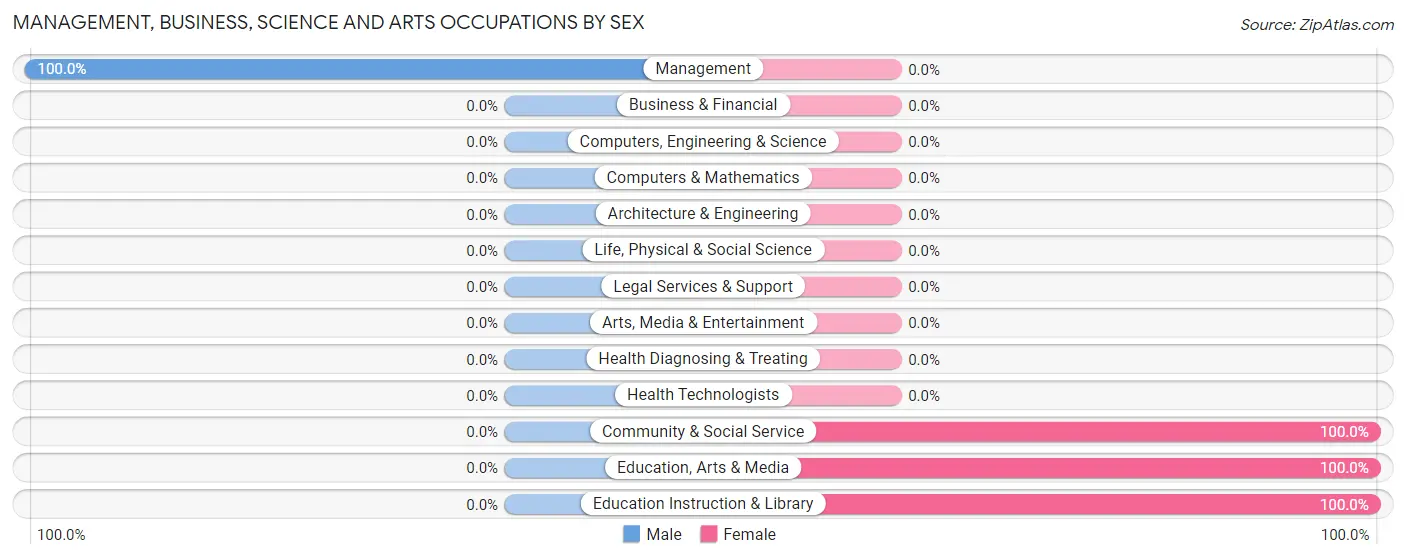
Management, Business, Science and Arts Occupations by Sex
| Occupation | Male | Female |
| Management | 10 (100.0%) | 0 (0.0%) |
| Business & Financial | 0 (0.0%) | 0 (0.0%) |
| Computers, Engineering & Science | 0 (0.0%) | 0 (0.0%) |
| Computers & Mathematics | 0 (0.0%) | 0 (0.0%) |
| Architecture & Engineering | 0 (0.0%) | 0 (0.0%) |
| Life, Physical & Social Science | 0 (0.0%) | 0 (0.0%) |
| Community & Social Service | 0 (0.0%) | 52 (100.0%) |
| Education, Arts & Media | 0 (0.0%) | 44 (100.0%) |
| Legal Services & Support | 0 (0.0%) | 0 (0.0%) |
| Education Instruction & Library | 0 (0.0%) | 8 (100.0%) |
| Arts, Media & Entertainment | 0 (0.0%) | 0 (0.0%) |
| Health Diagnosing & Treating | 0 (0.0%) | 0 (0.0%) |
| Health Technologists | 0 (0.0%) | 0 (0.0%) |
| Total (Category) | 10 (16.1%) | 52 (83.9%) |
| Total (Overall) | 131 (49.8%) | 132 (50.2%) |
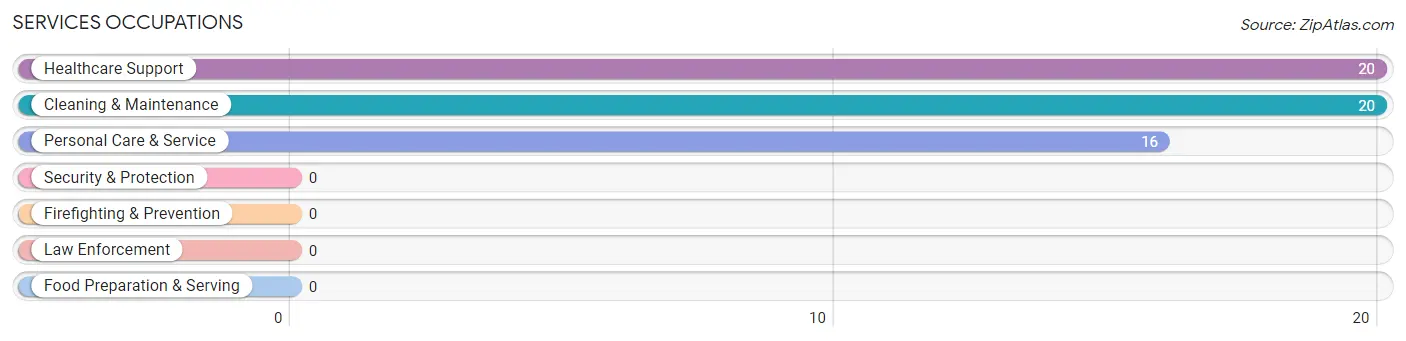
Services Occupations
The most common Services occupations in Bloomington are Healthcare Support (20 | 7.6%), Cleaning & Maintenance (20 | 7.6%), and Personal Care & Service (16 | 6.1%).
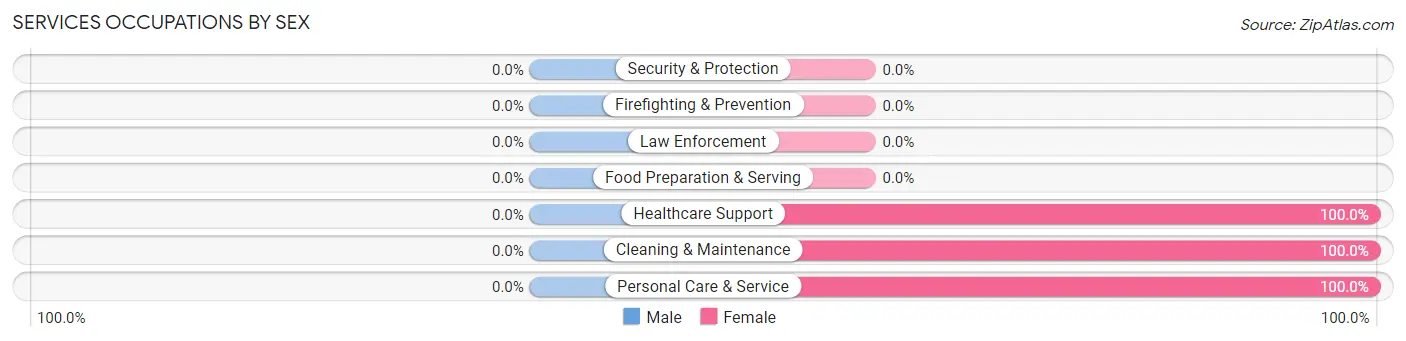
Services Occupations by Sex
| Occupation | Male | Female |
| Healthcare Support | 0 (0.0%) | 20 (100.0%) |
| Security & Protection | 0 (0.0%) | 0 (0.0%) |
| Firefighting & Prevention | 0 (0.0%) | 0 (0.0%) |
| Law Enforcement | 0 (0.0%) | 0 (0.0%) |
| Food Preparation & Serving | 0 (0.0%) | 0 (0.0%) |
| Cleaning & Maintenance | 0 (0.0%) | 20 (100.0%) |
| Personal Care & Service | 0 (0.0%) | 16 (100.0%) |
| Total (Category) | 0 (0.0%) | 56 (100.0%) |
| Total (Overall) | 131 (49.8%) | 132 (50.2%) |
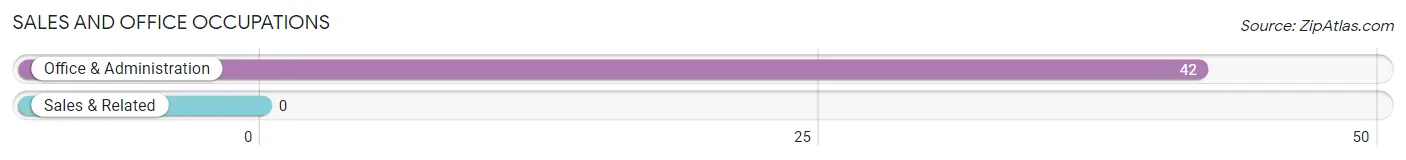
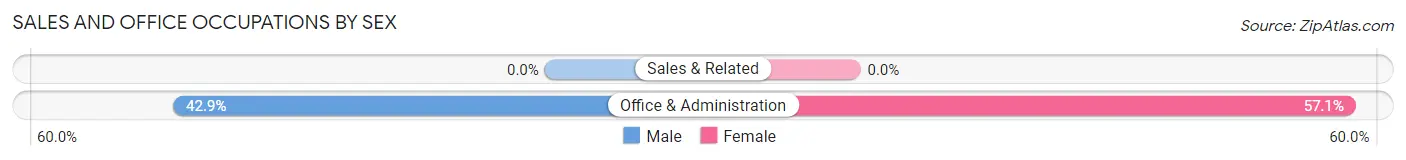
Sales and Office Occupations
The most common Sales and Office occupations in Bloomington are , and Office & Administration (42 | 16.0%).
Sales and Office Occupations by Sex
| Occupation | Male | Female |
| Sales & Related | 0 (0.0%) | 0 (0.0%) |
| Office & Administration | 18 (42.9%) | 24 (57.1%) |
| Total (Category) | 18 (42.9%) | 24 (57.1%) |
| Total (Overall) | 131 (49.8%) | 132 (50.2%) |
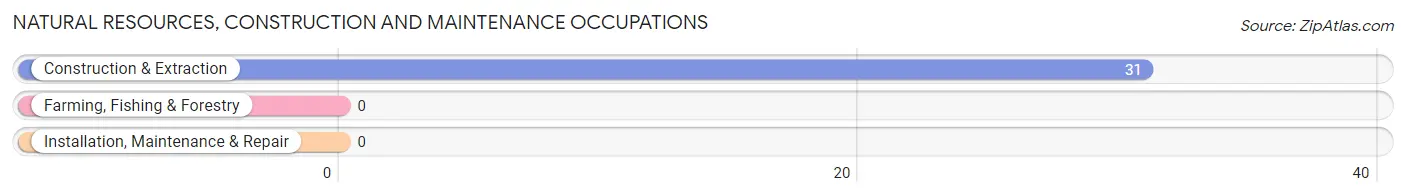
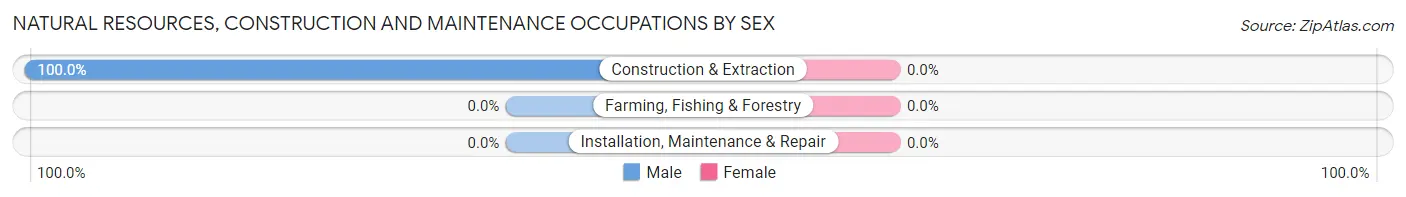
Natural Resources, Construction and Maintenance Occupations
The most common Natural Resources, Construction and Maintenance occupations in Bloomington are , and Construction & Extraction (31 | 11.8%).
Natural Resources, Construction and Maintenance Occupations by Sex
| Occupation | Male | Female |
| Farming, Fishing & Forestry | 0 (0.0%) | 0 (0.0%) |
| Construction & Extraction | 31 (100.0%) | 0 (0.0%) |
| Installation, Maintenance & Repair | 0 (0.0%) | 0 (0.0%) |
| Total (Category) | 31 (100.0%) | 0 (0.0%) |
| Total (Overall) | 131 (49.8%) | 132 (50.2%) |
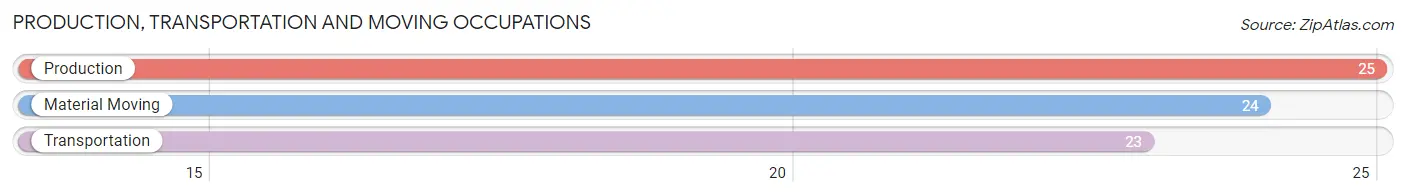
Production, Transportation and Moving Occupations
The most common Production, Transportation and Moving occupations in Bloomington are Production (25 | 9.5%), Material Moving (24 | 9.1%), and Transportation (23 | 8.7%).
Production, Transportation and Moving Occupations by Sex
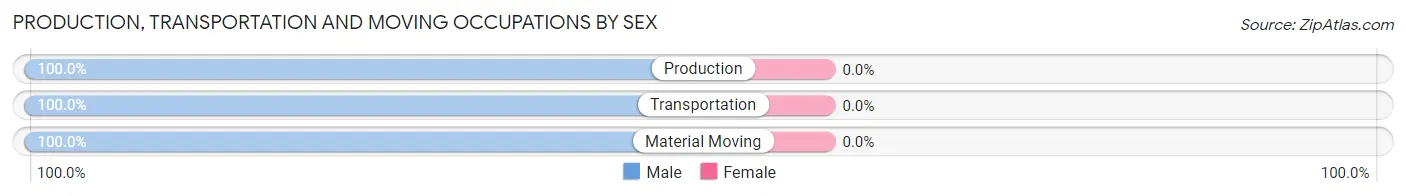
| Occupation | Male | Female |
| Production | 25 (100.0%) | 0 (0.0%) |
| Transportation | 23 (100.0%) | 0 (0.0%) |
| Material Moving | 24 (100.0%) | 0 (0.0%) |
| Total (Category) | 72 (100.0%) | 0 (0.0%) |
| Total (Overall) | 131 (49.8%) | 132 (50.2%) |
Employment Industries by Sex in Bloomington
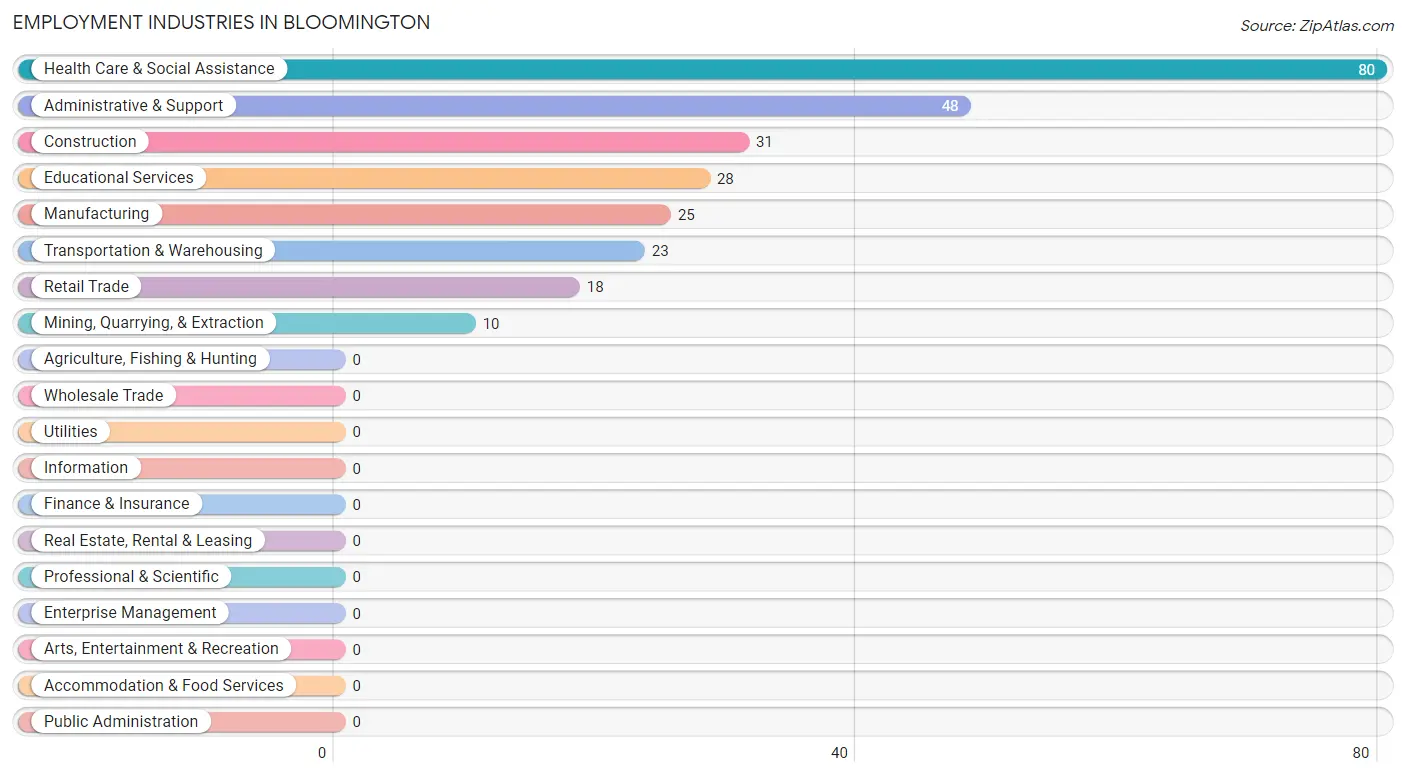
Employment Industries in Bloomington
The major employment industries in Bloomington include Health Care & Social Assistance (80 | 30.4%), Administrative & Support (48 | 18.2%), Construction (31 | 11.8%), Educational Services (28 | 10.6%), and Manufacturing (25 | 9.5%).
Employment Industries by Sex in Bloomington
The Bloomington industries that see more men than women are Mining, Quarrying, & Extraction (100.0%), Construction (100.0%), and Manufacturing (100.0%), whereas the industries that tend to have a higher number of women are Educational Services (100.0%), Health Care & Social Assistance (100.0%), and Administrative & Support (50.0%).
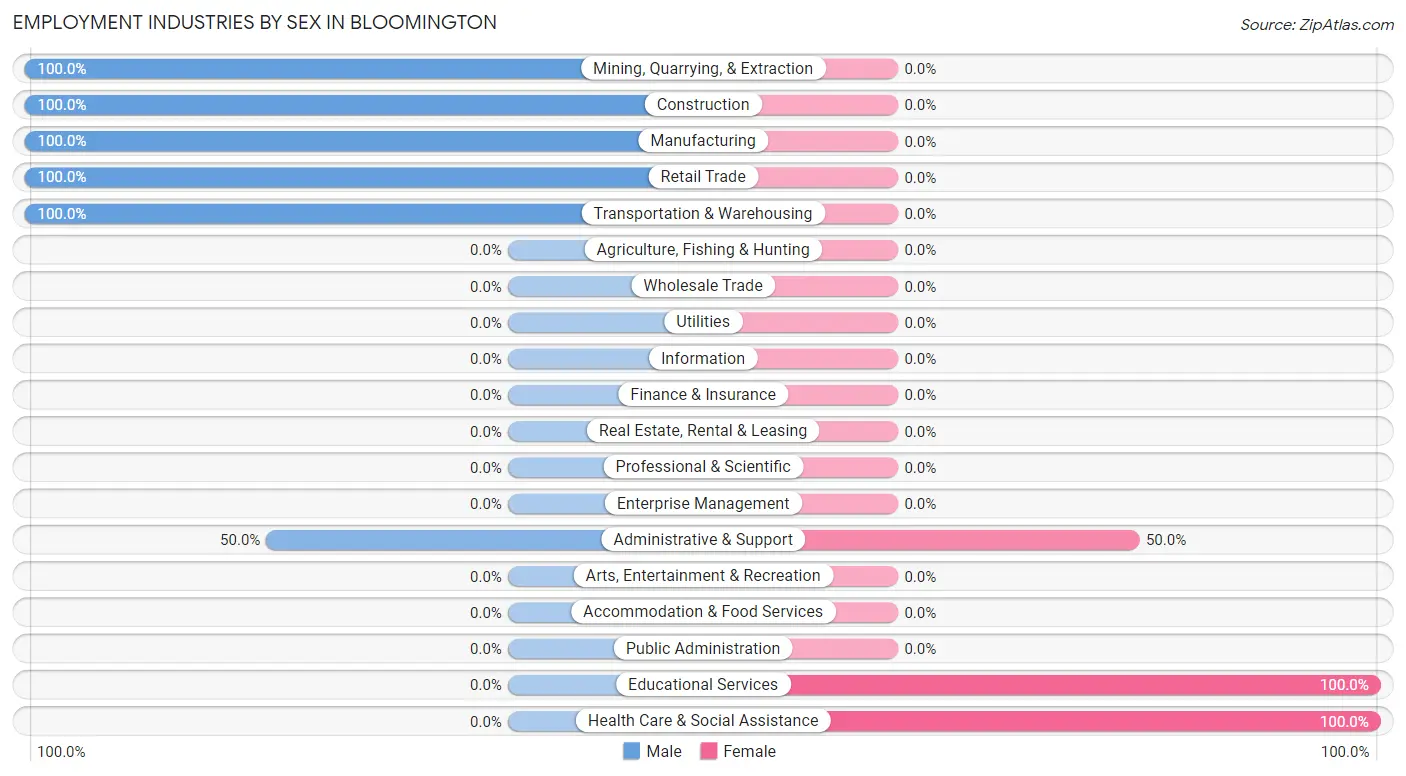
| Industry | Male | Female |
| Agriculture, Fishing & Hunting | 0 (0.0%) | 0 (0.0%) |
| Mining, Quarrying, & Extraction | 10 (100.0%) | 0 (0.0%) |
| Construction | 31 (100.0%) | 0 (0.0%) |
| Manufacturing | 25 (100.0%) | 0 (0.0%) |
| Wholesale Trade | 0 (0.0%) | 0 (0.0%) |
| Retail Trade | 18 (100.0%) | 0 (0.0%) |
| Transportation & Warehousing | 23 (100.0%) | 0 (0.0%) |
| Utilities | 0 (0.0%) | 0 (0.0%) |
| Information | 0 (0.0%) | 0 (0.0%) |
| Finance & Insurance | 0 (0.0%) | 0 (0.0%) |
| Real Estate, Rental & Leasing | 0 (0.0%) | 0 (0.0%) |
| Professional & Scientific | 0 (0.0%) | 0 (0.0%) |
| Enterprise Management | 0 (0.0%) | 0 (0.0%) |
| Administrative & Support | 24 (50.0%) | 24 (50.0%) |
| Educational Services | 0 (0.0%) | 28 (100.0%) |
| Health Care & Social Assistance | 0 (0.0%) | 80 (100.0%) |
| Arts, Entertainment & Recreation | 0 (0.0%) | 0 (0.0%) |
| Accommodation & Food Services | 0 (0.0%) | 0 (0.0%) |
| Public Administration | 0 (0.0%) | 0 (0.0%) |
| Total | 131 (49.8%) | 132 (50.2%) |
Education in Bloomington
School Enrollment in Bloomington
The most common levels of schooling among the 370 students in Bloomington are middle school (107 | 28.9%), elementary school (101 | 27.3%), and high school (88 | 23.8%).
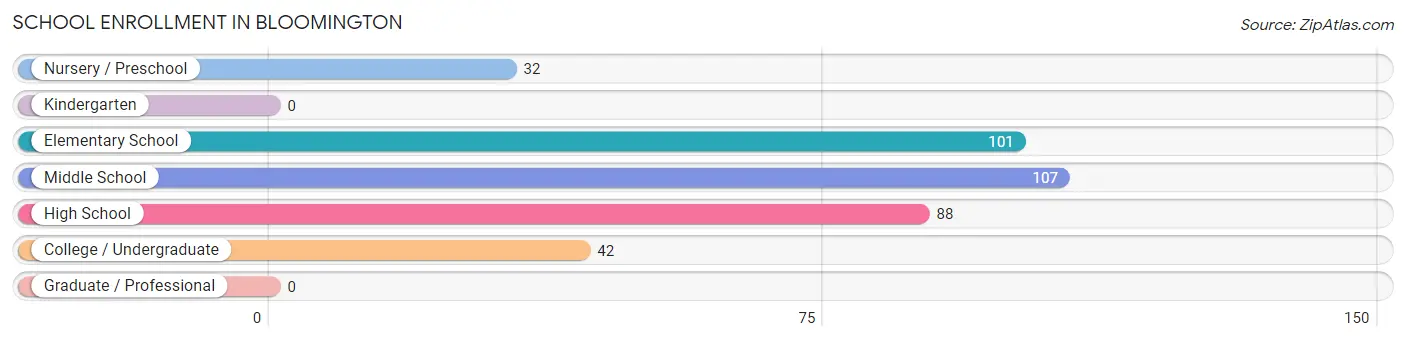
| School Level | # Students | % Students |
| Nursery / Preschool | 32 | 8.6% |
| Kindergarten | 0 | 0.0% |
| Elementary School | 101 | 27.3% |
| Middle School | 107 | 28.9% |
| High School | 88 | 23.8% |
| College / Undergraduate | 42 | 11.4% |
| Graduate / Professional | 0 | 0.0% |
| Total | 370 | 100.0% |
School Enrollment by Age by Funding Source in Bloomington
Out of a total of 370 students who are enrolled in schools in Bloomington, 15 (4.1%) attend a private institution, while the remaining 355 (95.9%) are enrolled in public schools. The age group of 10 to 14 year olds has the highest likelihood of being enrolled in private schools, with 15 (12.3% in the age bracket) enrolled. Conversely, the age group of 3 to 4 year olds has the lowest likelihood of being enrolled in a private school, with 32 (100.0% in the age bracket) attending a public institution.
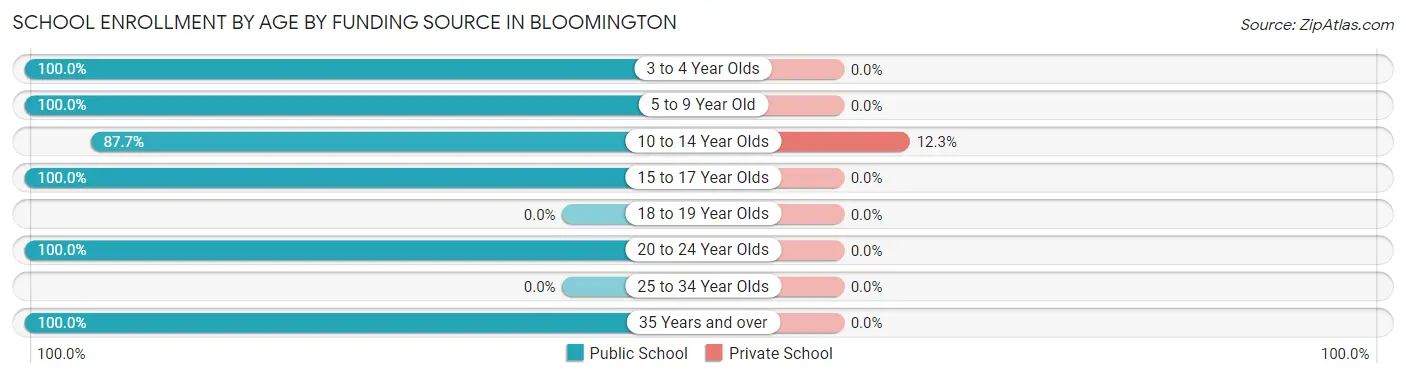
| Age Bracket | Public School | Private School |
| 3 to 4 Year Olds | 32 (100.0%) | 0 (0.0%) |
| 5 to 9 Year Old | 101 (100.0%) | 0 (0.0%) |
| 10 to 14 Year Olds | 107 (87.7%) | 15 (12.3%) |
| 15 to 17 Year Olds | 73 (100.0%) | 0 (0.0%) |
| 18 to 19 Year Olds | 0 (0.0%) | 0 (0.0%) |
| 20 to 24 Year Olds | 33 (100.0%) | 0 (0.0%) |
| 25 to 34 Year Olds | 0 (0.0%) | 0 (0.0%) |
| 35 Years and over | 9 (100.0%) | 0 (0.0%) |
| Total | 355 (95.9%) | 15 (4.1%) |
Educational Attainment by Field of Study in Bloomington
Physical & health sciences (29 | 74.4%), and engineering (10 | 25.6%) are the most common fields of study among 39 individuals in Bloomington who have obtained a bachelor's degree or higher.
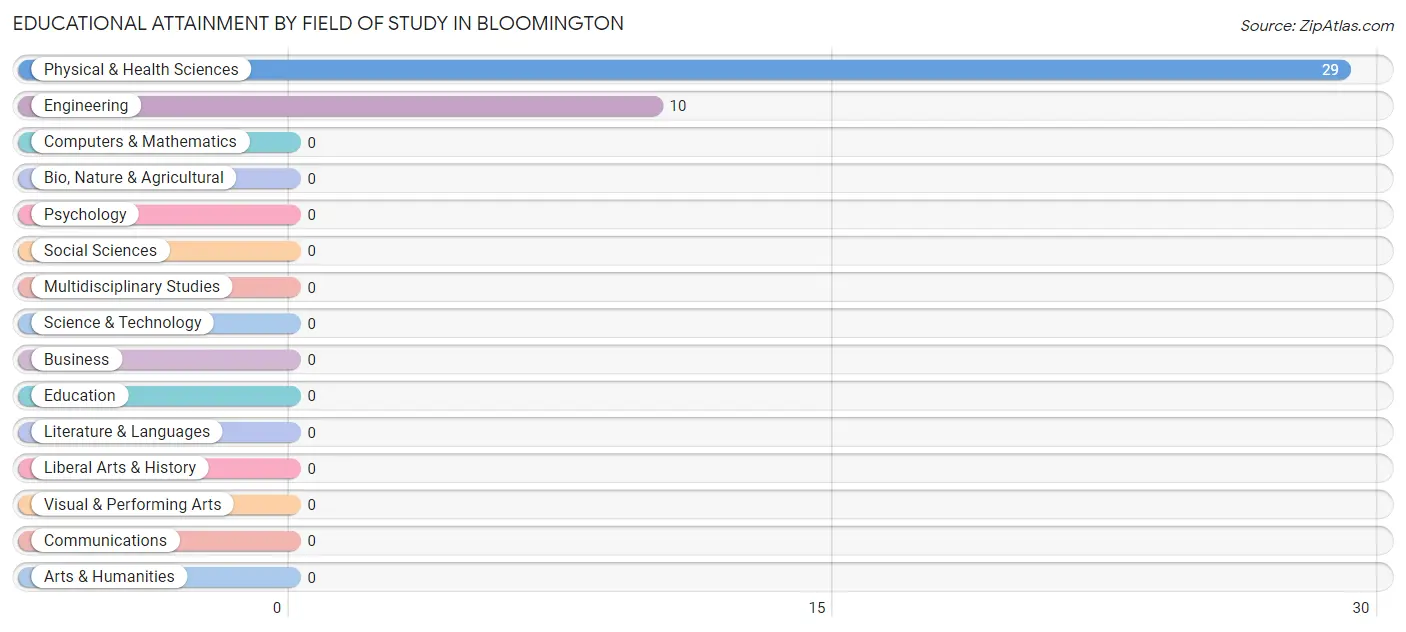
| Field of Study | # Graduates | % Graduates |
| Computers & Mathematics | 0 | 0.0% |
| Bio, Nature & Agricultural | 0 | 0.0% |
| Physical & Health Sciences | 29 | 74.4% |
| Psychology | 0 | 0.0% |
| Social Sciences | 0 | 0.0% |
| Engineering | 10 | 25.6% |
| Multidisciplinary Studies | 0 | 0.0% |
| Science & Technology | 0 | 0.0% |
| Business | 0 | 0.0% |
| Education | 0 | 0.0% |
| Literature & Languages | 0 | 0.0% |
| Liberal Arts & History | 0 | 0.0% |
| Visual & Performing Arts | 0 | 0.0% |
| Communications | 0 | 0.0% |
| Arts & Humanities | 0 | 0.0% |
| Total | 39 | 100.0% |
Transportation & Commute in Bloomington
Vehicle Availability by Sex in Bloomington
The most prevalent vehicle ownership categories in Bloomington are males with 2 vehicles (90, accounting for 68.7%) and females with 2 vehicles (80, making up 68.2%).
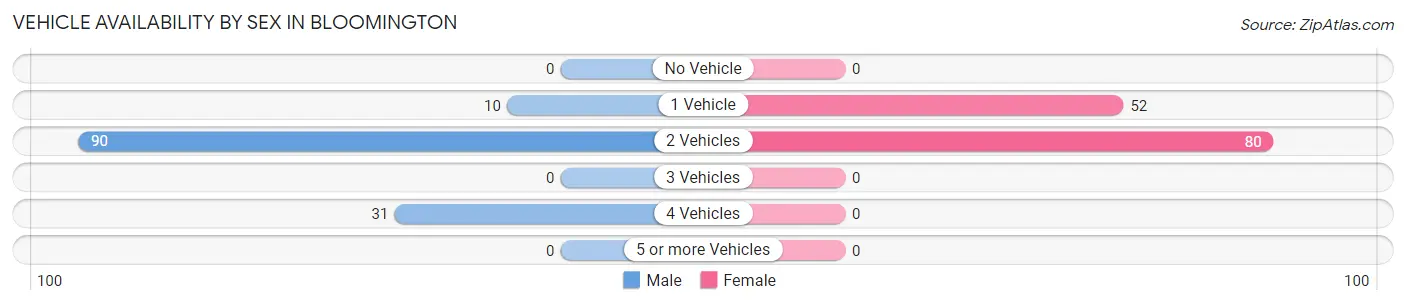
| Vehicles Available | Male | Female |
| No Vehicle | 0 (0.0%) | 0 (0.0%) |
| 1 Vehicle | 10 (7.6%) | 52 (39.4%) |
| 2 Vehicles | 90 (68.7%) | 80 (60.6%) |
| 3 Vehicles | 0 (0.0%) | 0 (0.0%) |
| 4 Vehicles | 31 (23.7%) | 0 (0.0%) |
| 5 or more Vehicles | 0 (0.0%) | 0 (0.0%) |
| Total | 131 (100.0%) | 132 (100.0%) |
Commute Time in Bloomington
The most frequently occuring commute durations in Bloomington are 20 to 24 minutes (97 commuters, 46.0%), 10 to 14 minutes (74 commuters, 35.1%), and 25 to 29 minutes (24 commuters, 11.4%).
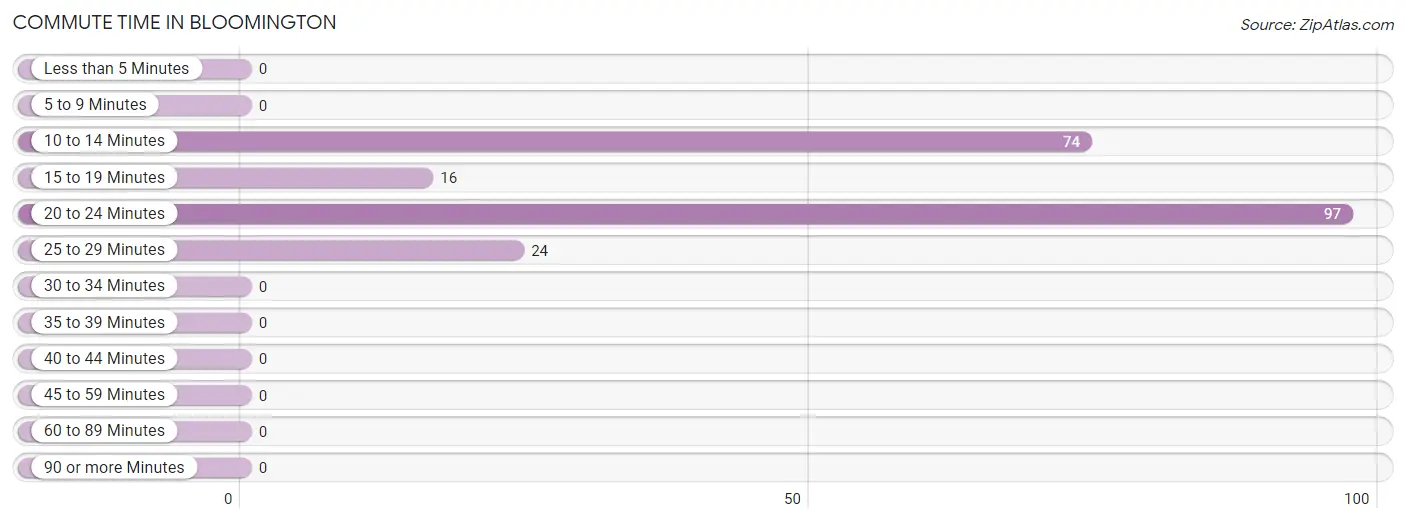
| Commute Time | # Commuters | % Commuters |
| Less than 5 Minutes | 0 | 0.0% |
| 5 to 9 Minutes | 0 | 0.0% |
| 10 to 14 Minutes | 74 | 35.1% |
| 15 to 19 Minutes | 16 | 7.6% |
| 20 to 24 Minutes | 97 | 46.0% |
| 25 to 29 Minutes | 24 | 11.4% |
| 30 to 34 Minutes | 0 | 0.0% |
| 35 to 39 Minutes | 0 | 0.0% |
| 40 to 44 Minutes | 0 | 0.0% |
| 45 to 59 Minutes | 0 | 0.0% |
| 60 to 89 Minutes | 0 | 0.0% |
| 90 or more Minutes | 0 | 0.0% |
Commute Time by Sex in Bloomington
The most common commute times in Bloomington are 20 to 24 minutes (53 commuters, 49.1%) for males and 20 to 24 minutes (44 commuters, 42.7%) for females.
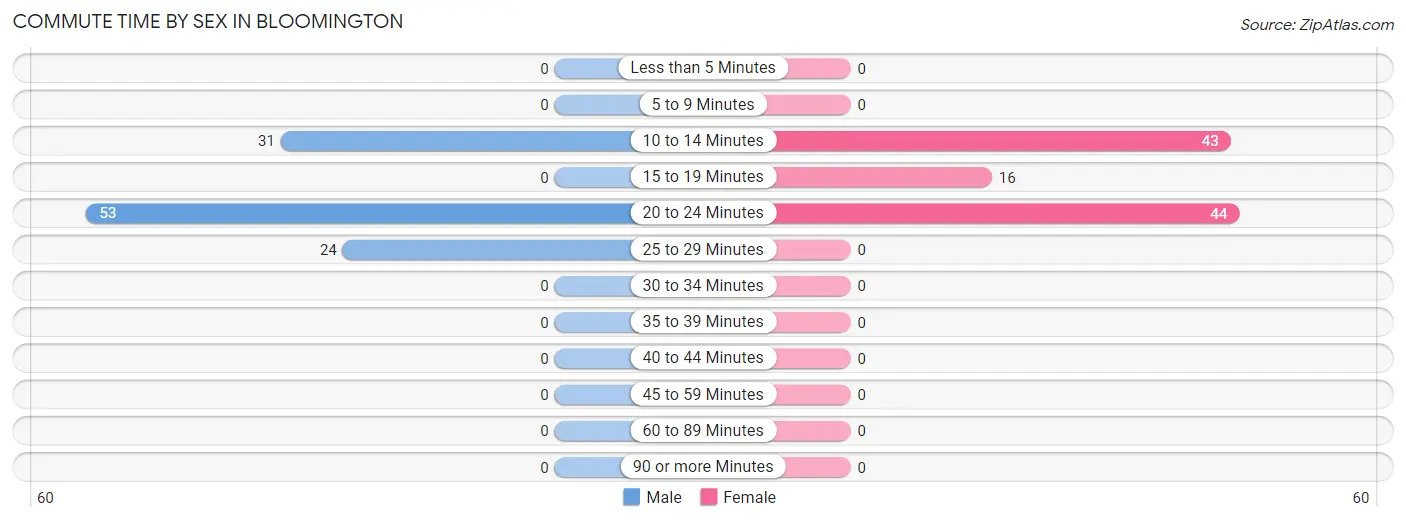
| Commute Time | Male | Female |
| Less than 5 Minutes | 0 (0.0%) | 0 (0.0%) |
| 5 to 9 Minutes | 0 (0.0%) | 0 (0.0%) |
| 10 to 14 Minutes | 31 (28.7%) | 43 (41.7%) |
| 15 to 19 Minutes | 0 (0.0%) | 16 (15.5%) |
| 20 to 24 Minutes | 53 (49.1%) | 44 (42.7%) |
| 25 to 29 Minutes | 24 (22.2%) | 0 (0.0%) |
| 30 to 34 Minutes | 0 (0.0%) | 0 (0.0%) |
| 35 to 39 Minutes | 0 (0.0%) | 0 (0.0%) |
| 40 to 44 Minutes | 0 (0.0%) | 0 (0.0%) |
| 45 to 59 Minutes | 0 (0.0%) | 0 (0.0%) |
| 60 to 89 Minutes | 0 (0.0%) | 0 (0.0%) |
| 90 or more Minutes | 0 (0.0%) | 0 (0.0%) |
Time of Departure to Work by Sex in Bloomington
The most frequent times of departure to work in Bloomington are 5:00 AM to 5:29 AM (31, 28.7%) for males and 12:00 AM to 4:59 AM (24, 23.3%) for females.
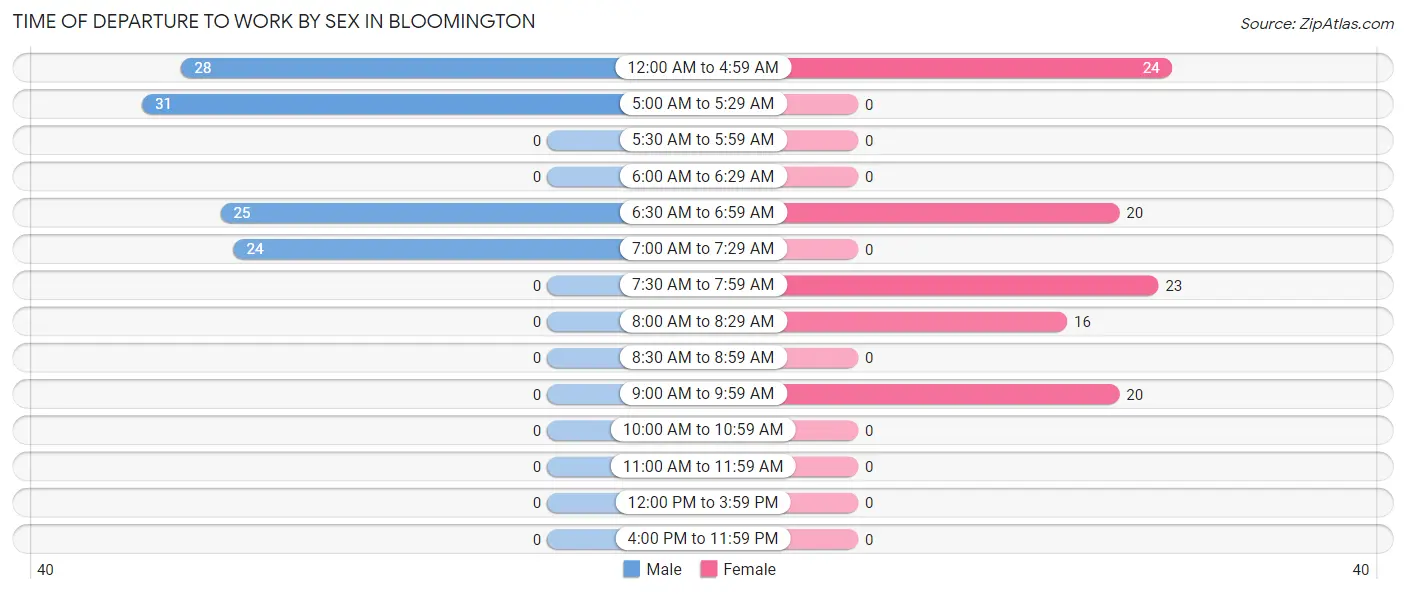
| Time of Departure | Male | Female |
| 12:00 AM to 4:59 AM | 28 (25.9%) | 24 (23.3%) |
| 5:00 AM to 5:29 AM | 31 (28.7%) | 0 (0.0%) |
| 5:30 AM to 5:59 AM | 0 (0.0%) | 0 (0.0%) |
| 6:00 AM to 6:29 AM | 0 (0.0%) | 0 (0.0%) |
| 6:30 AM to 6:59 AM | 25 (23.2%) | 20 (19.4%) |
| 7:00 AM to 7:29 AM | 24 (22.2%) | 0 (0.0%) |
| 7:30 AM to 7:59 AM | 0 (0.0%) | 23 (22.3%) |
| 8:00 AM to 8:29 AM | 0 (0.0%) | 16 (15.5%) |
| 8:30 AM to 8:59 AM | 0 (0.0%) | 0 (0.0%) |
| 9:00 AM to 9:59 AM | 0 (0.0%) | 20 (19.4%) |
| 10:00 AM to 10:59 AM | 0 (0.0%) | 0 (0.0%) |
| 11:00 AM to 11:59 AM | 0 (0.0%) | 0 (0.0%) |
| 12:00 PM to 3:59 PM | 0 (0.0%) | 0 (0.0%) |
| 4:00 PM to 11:59 PM | 0 (0.0%) | 0 (0.0%) |
| Total | 108 (100.0%) | 103 (100.0%) |
Housing Occupancy in Bloomington
Occupancy by Ownership in Bloomington
Of the total 486 dwellings in Bloomington, owner-occupied units account for 310 (63.8%), while renter-occupied units make up 176 (36.2%).
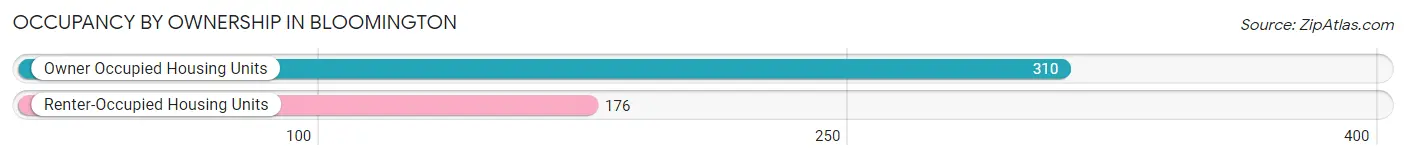
| Occupancy | # Housing Units | % Housing Units |
| Owner Occupied Housing Units | 310 | 63.8% |
| Renter-Occupied Housing Units | 176 | 36.2% |
| Total Occupied Housing Units | 486 | 100.0% |
Occupancy by Household Size in Bloomington
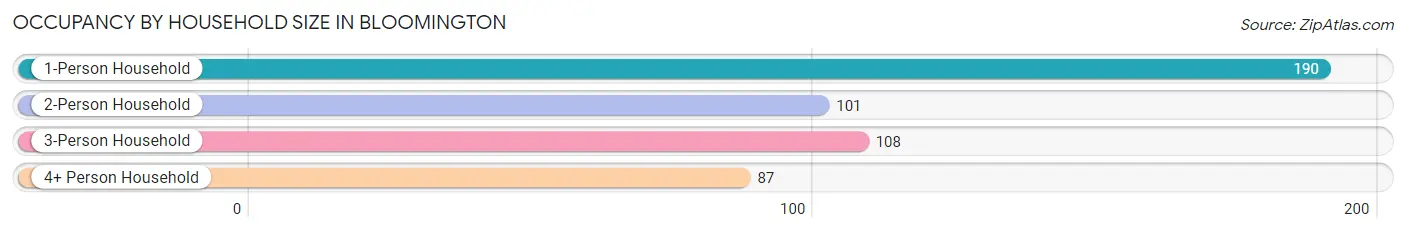
| Household Size | # Housing Units | % Housing Units |
| 1-Person Household | 190 | 39.1% |
| 2-Person Household | 101 | 20.8% |
| 3-Person Household | 108 | 22.2% |
| 4+ Person Household | 87 | 17.9% |
| Total Housing Units | 486 | 100.0% |
Occupancy by Ownership by Household Size in Bloomington
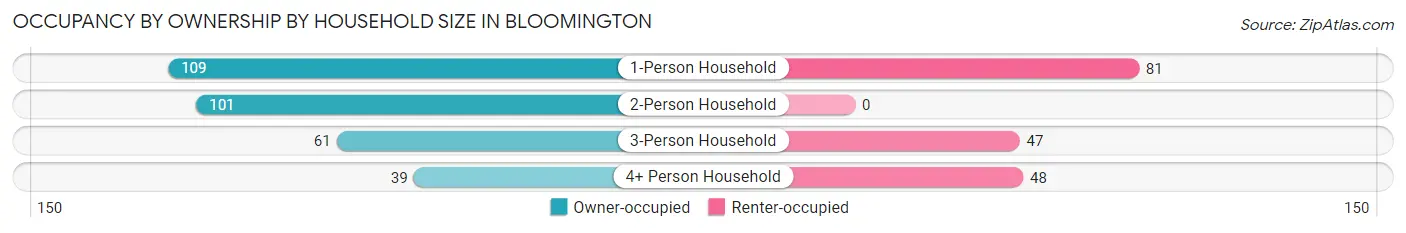
| Household Size | Owner-occupied | Renter-occupied |
| 1-Person Household | 109 (57.4%) | 81 (42.6%) |
| 2-Person Household | 101 (100.0%) | 0 (0.0%) |
| 3-Person Household | 61 (56.5%) | 47 (43.5%) |
| 4+ Person Household | 39 (44.8%) | 48 (55.2%) |
| Total Housing Units | 310 (63.8%) | 176 (36.2%) |
Occupancy by Educational Attainment in Bloomington
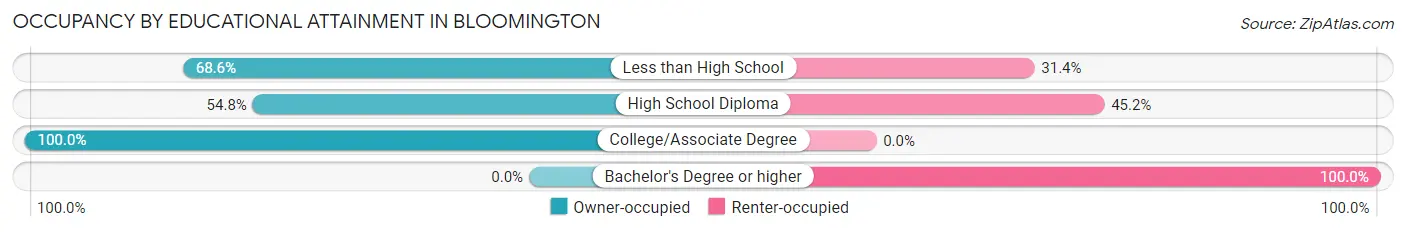
| Household Size | Owner-occupied | Renter-occupied |
| Less than High School | 105 (68.6%) | 48 (31.4%) |
| High School Diploma | 120 (54.8%) | 99 (45.2%) |
| College/Associate Degree | 85 (100.0%) | 0 (0.0%) |
| Bachelor's Degree or higher | 0 (0.0%) | 29 (100.0%) |
Occupancy by Age of Householder in Bloomington
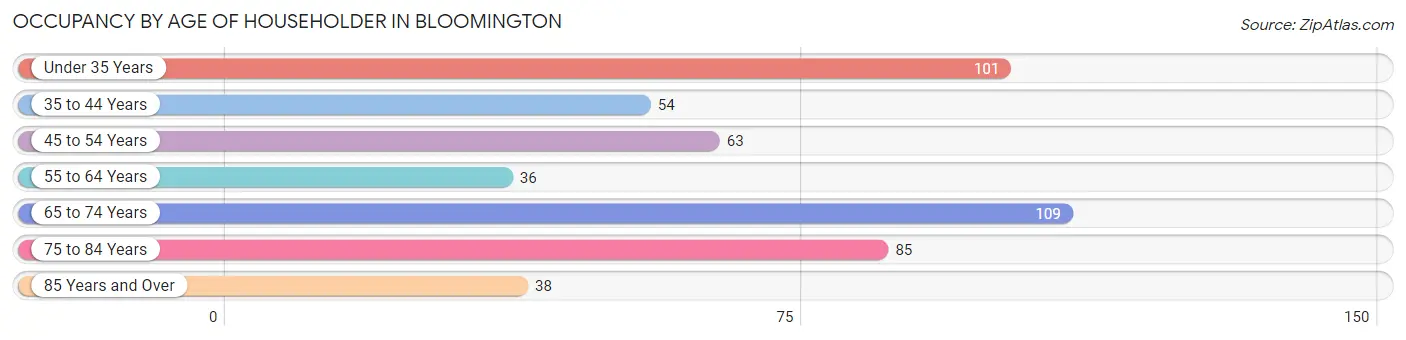
| Age Bracket | # Households | % Households |
| Under 35 Years | 101 | 20.8% |
| 35 to 44 Years | 54 | 11.1% |
| 45 to 54 Years | 63 | 13.0% |
| 55 to 64 Years | 36 | 7.4% |
| 65 to 74 Years | 109 | 22.4% |
| 75 to 84 Years | 85 | 17.5% |
| 85 Years and Over | 38 | 7.8% |
| Total | 486 | 100.0% |
Housing Finances in Bloomington
Median Income by Occupancy in Bloomington
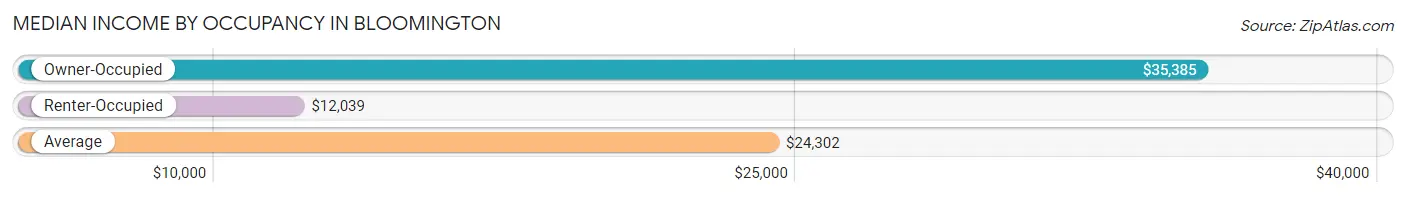
| Occupancy Type | # Households | Median Income |
| Owner-Occupied | 310 (63.8%) | $35,385 |
| Renter-Occupied | 176 (36.2%) | $12,039 |
| Average | 486 (100.0%) | $24,302 |
Occupancy by Householder Income Bracket in Bloomington
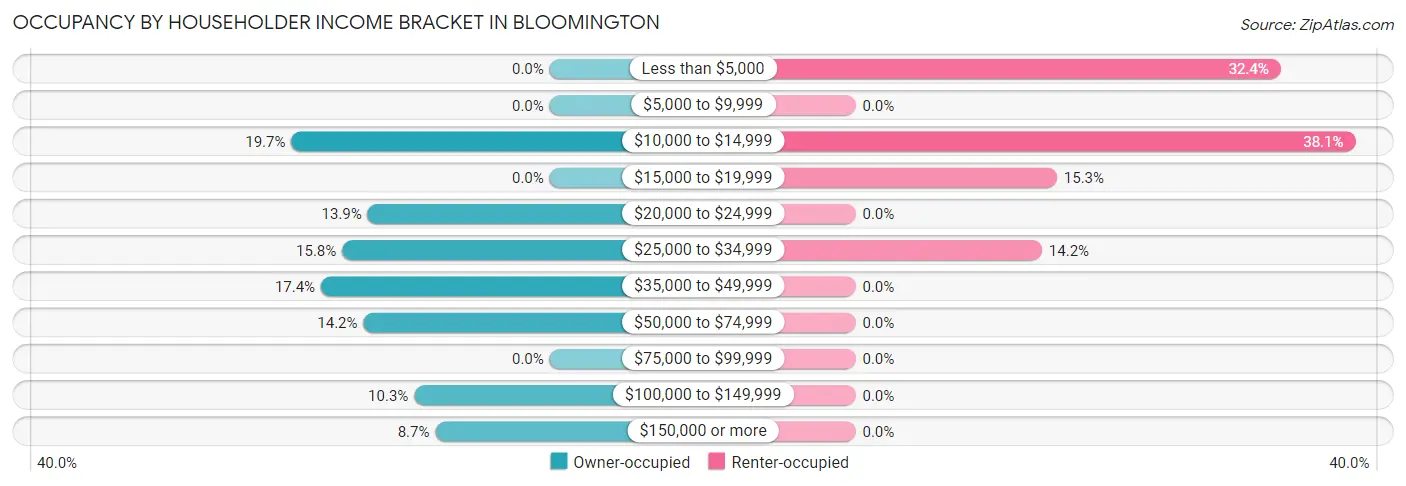
| Income Bracket | Owner-occupied | Renter-occupied |
| Less than $5,000 | 0 (0.0%) | 57 (32.4%) |
| $5,000 to $9,999 | 0 (0.0%) | 0 (0.0%) |
| $10,000 to $14,999 | 61 (19.7%) | 67 (38.1%) |
| $15,000 to $19,999 | 0 (0.0%) | 27 (15.3%) |
| $20,000 to $24,999 | 43 (13.9%) | 0 (0.0%) |
| $25,000 to $34,999 | 49 (15.8%) | 25 (14.2%) |
| $35,000 to $49,999 | 54 (17.4%) | 0 (0.0%) |
| $50,000 to $74,999 | 44 (14.2%) | 0 (0.0%) |
| $75,000 to $99,999 | 0 (0.0%) | 0 (0.0%) |
| $100,000 to $149,999 | 32 (10.3%) | 0 (0.0%) |
| $150,000 or more | 27 (8.7%) | 0 (0.0%) |
| Total | 310 (100.0%) | 176 (100.0%) |
Monthly Housing Cost Tiers in Bloomington
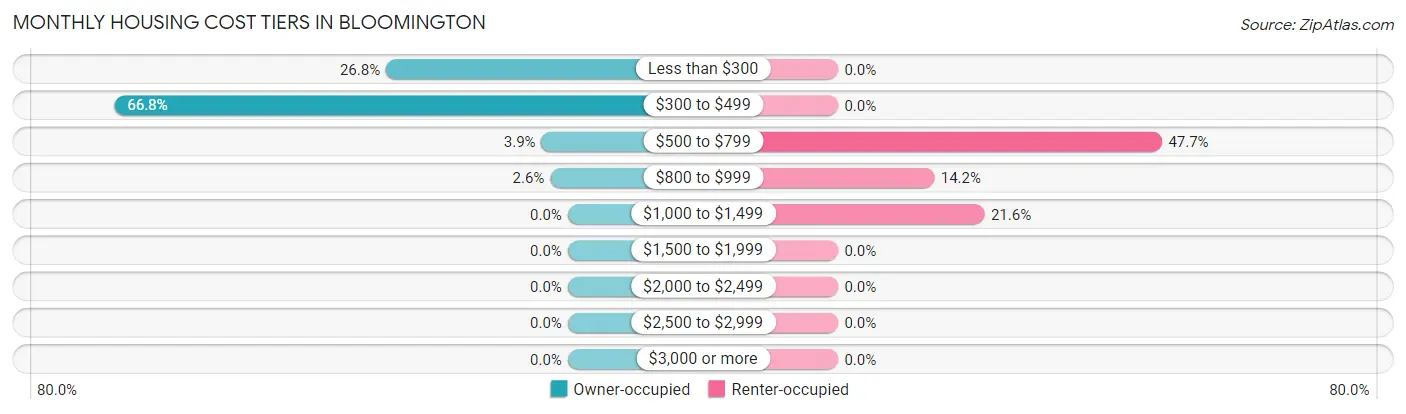
| Monthly Cost | Owner-occupied | Renter-occupied |
| Less than $300 | 83 (26.8%) | 0 (0.0%) |
| $300 to $499 | 207 (66.8%) | 0 (0.0%) |
| $500 to $799 | 12 (3.9%) | 84 (47.7%) |
| $800 to $999 | 8 (2.6%) | 25 (14.2%) |
| $1,000 to $1,499 | 0 (0.0%) | 38 (21.6%) |
| $1,500 to $1,999 | 0 (0.0%) | 0 (0.0%) |
| $2,000 to $2,499 | 0 (0.0%) | 0 (0.0%) |
| $2,500 to $2,999 | 0 (0.0%) | 0 (0.0%) |
| $3,000 or more | 0 (0.0%) | 0 (0.0%) |
| Total | 310 (100.0%) | 176 (100.0%) |
Physical Housing Characteristics in Bloomington
Housing Structures in Bloomington
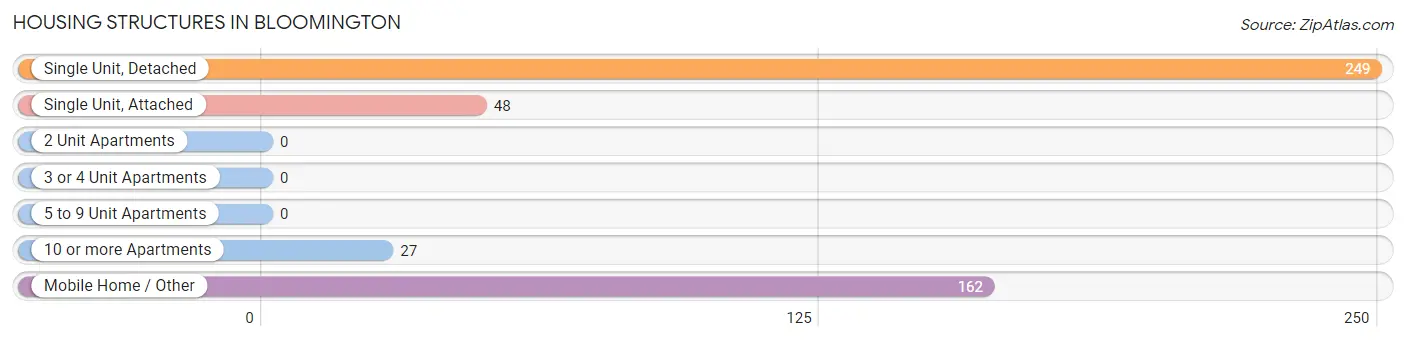
| Structure Type | # Housing Units | % Housing Units |
| Single Unit, Detached | 249 | 51.2% |
| Single Unit, Attached | 48 | 9.9% |
| 2 Unit Apartments | 0 | 0.0% |
| 3 or 4 Unit Apartments | 0 | 0.0% |
| 5 to 9 Unit Apartments | 0 | 0.0% |
| 10 or more Apartments | 27 | 5.6% |
| Mobile Home / Other | 162 | 33.3% |
| Total | 486 | 100.0% |
Housing Structures by Occupancy in Bloomington
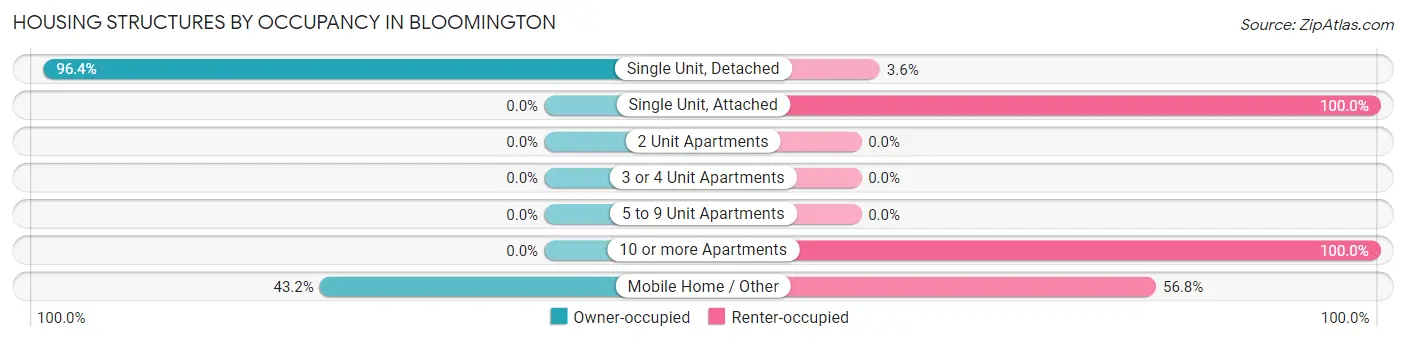
| Structure Type | Owner-occupied | Renter-occupied |
| Single Unit, Detached | 240 (96.4%) | 9 (3.6%) |
| Single Unit, Attached | 0 (0.0%) | 48 (100.0%) |
| 2 Unit Apartments | 0 (0.0%) | 0 (0.0%) |
| 3 or 4 Unit Apartments | 0 (0.0%) | 0 (0.0%) |
| 5 to 9 Unit Apartments | 0 (0.0%) | 0 (0.0%) |
| 10 or more Apartments | 0 (0.0%) | 27 (100.0%) |
| Mobile Home / Other | 70 (43.2%) | 92 (56.8%) |
| Total | 310 (63.8%) | 176 (36.2%) |
Housing Structures by Number of Rooms in Bloomington
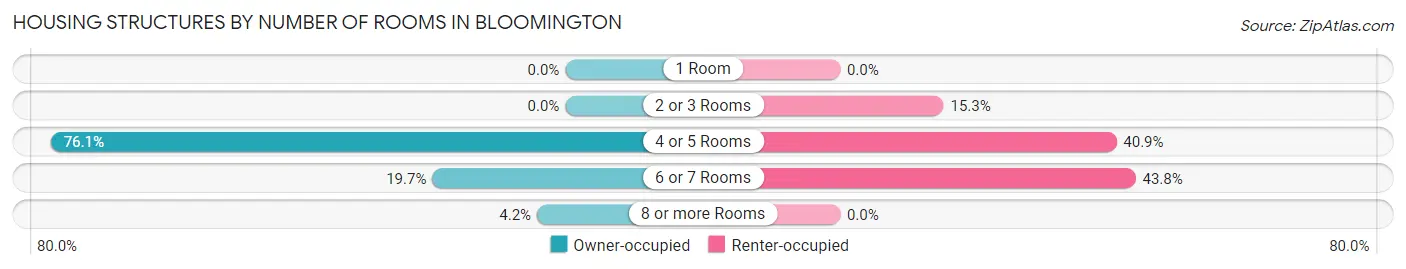
| Number of Rooms | Owner-occupied | Renter-occupied |
| 1 Room | 0 (0.0%) | 0 (0.0%) |
| 2 or 3 Rooms | 0 (0.0%) | 27 (15.3%) |
| 4 or 5 Rooms | 236 (76.1%) | 72 (40.9%) |
| 6 or 7 Rooms | 61 (19.7%) | 77 (43.8%) |
| 8 or more Rooms | 13 (4.2%) | 0 (0.0%) |
| Total | 310 (100.0%) | 176 (100.0%) |
Housing Structure by Heating Type in Bloomington
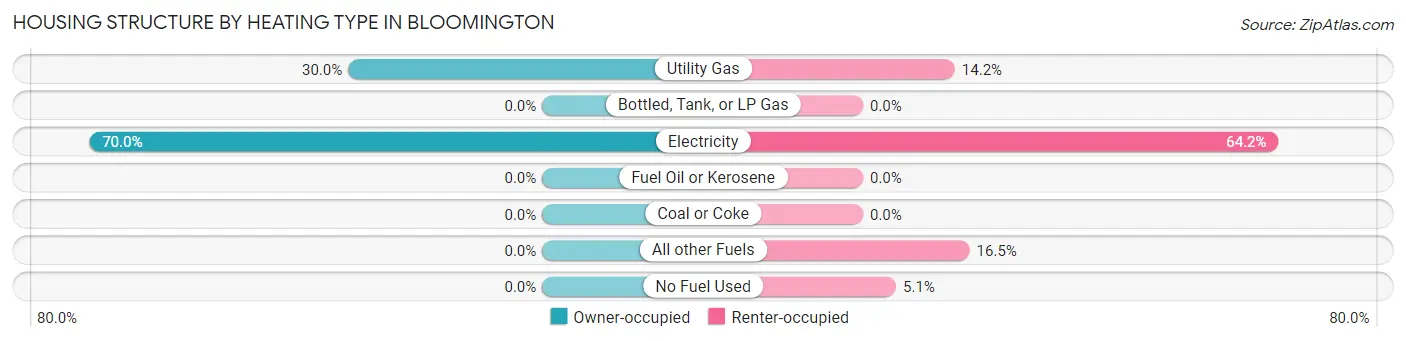
| Heating Type | Owner-occupied | Renter-occupied |
| Utility Gas | 93 (30.0%) | 25 (14.2%) |
| Bottled, Tank, or LP Gas | 0 (0.0%) | 0 (0.0%) |
| Electricity | 217 (70.0%) | 113 (64.2%) |
| Fuel Oil or Kerosene | 0 (0.0%) | 0 (0.0%) |
| Coal or Coke | 0 (0.0%) | 0 (0.0%) |
| All other Fuels | 0 (0.0%) | 29 (16.5%) |
| No Fuel Used | 0 (0.0%) | 9 (5.1%) |
| Total | 310 (100.0%) | 176 (100.0%) |
Household Vehicle Usage in Bloomington
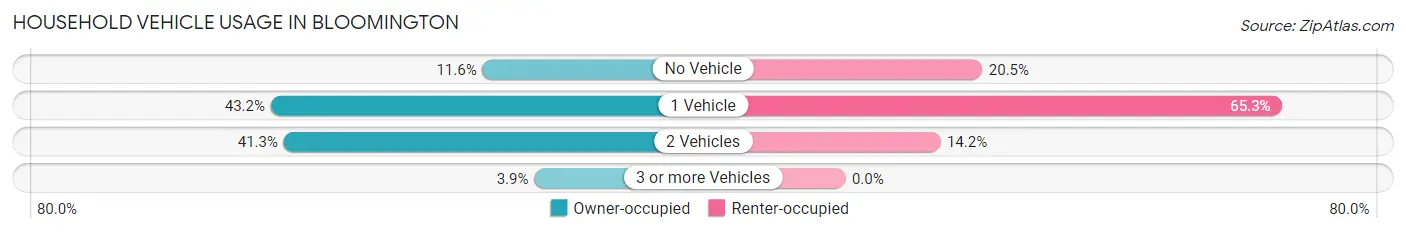
| Vehicles per Household | Owner-occupied | Renter-occupied |
| No Vehicle | 36 (11.6%) | 36 (20.4%) |
| 1 Vehicle | 134 (43.2%) | 115 (65.3%) |
| 2 Vehicles | 128 (41.3%) | 25 (14.2%) |
| 3 or more Vehicles | 12 (3.9%) | 0 (0.0%) |
| Total | 310 (100.0%) | 176 (100.0%) |
Real Estate & Mortgages in Bloomington
Real Estate and Mortgage Overview in Bloomington
| Characteristic | Without Mortgage | With Mortgage |
| Housing Units | 302 | 8 |
| Median Property Value | $55,300 | $0 |
| Median Household Income | $34,898 | $0 |
| Monthly Housing Costs | $358 | $0 |
| Real Estate Taxes | $869 | $0 |
Property Value by Mortgage Status in Bloomington
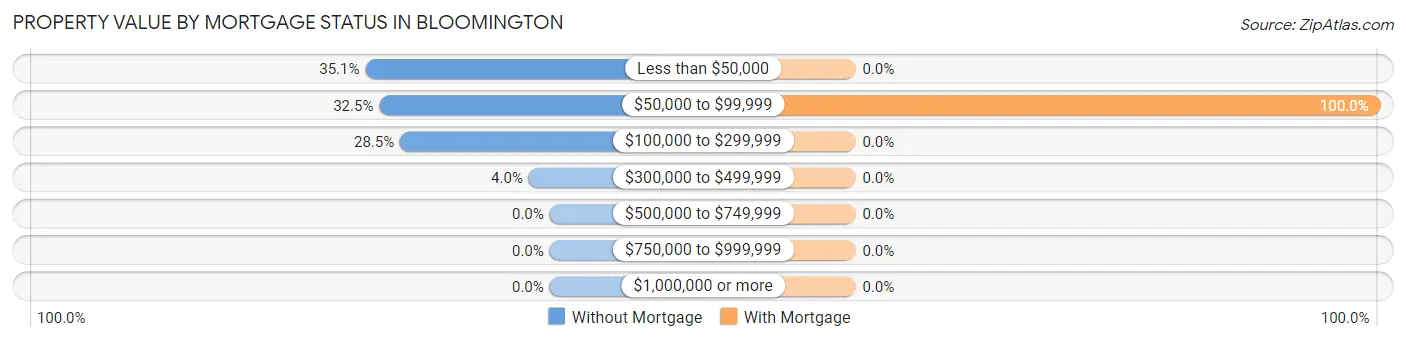
| Property Value | Without Mortgage | With Mortgage |
| Less than $50,000 | 106 (35.1%) | 0 (0.0%) |
| $50,000 to $99,999 | 98 (32.5%) | 8 (100.0%) |
| $100,000 to $299,999 | 86 (28.5%) | 0 (0.0%) |
| $300,000 to $499,999 | 12 (4.0%) | 0 (0.0%) |
| $500,000 to $749,999 | 0 (0.0%) | 0 (0.0%) |
| $750,000 to $999,999 | 0 (0.0%) | 0 (0.0%) |
| $1,000,000 or more | 0 (0.0%) | 0 (0.0%) |
| Total | 302 (100.0%) | 8 (100.0%) |
Household Income by Mortgage Status in Bloomington
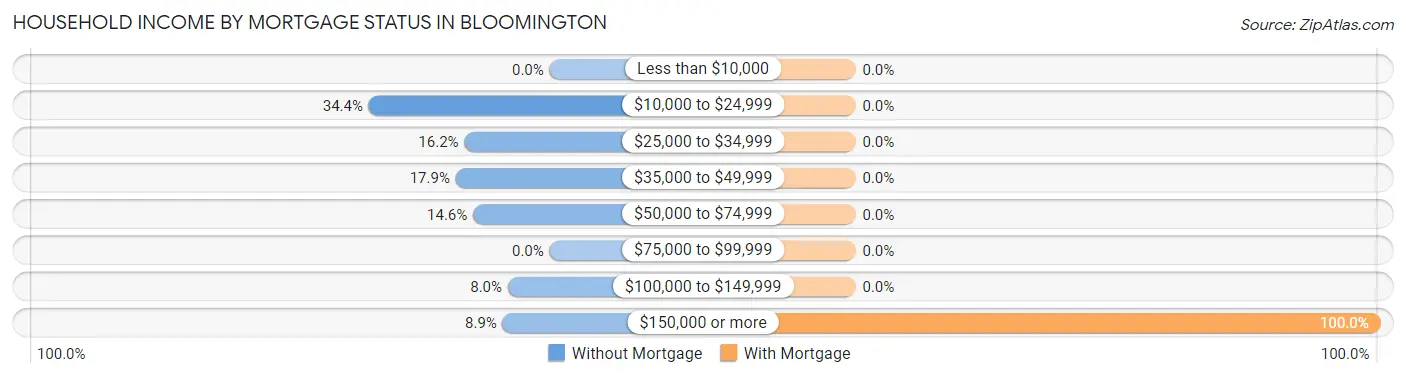
| Household Income | Without Mortgage | With Mortgage |
| Less than $10,000 | 0 (0.0%) | 0 (0.0%) |
| $10,000 to $24,999 | 104 (34.4%) | 0 (0.0%) |
| $25,000 to $34,999 | 49 (16.2%) | 0 (0.0%) |
| $35,000 to $49,999 | 54 (17.9%) | 0 (0.0%) |
| $50,000 to $74,999 | 44 (14.6%) | 0 (0.0%) |
| $75,000 to $99,999 | 0 (0.0%) | 0 (0.0%) |
| $100,000 to $149,999 | 24 (8.0%) | 0 (0.0%) |
| $150,000 or more | 27 (8.9%) | 8 (100.0%) |
| Total | 302 (100.0%) | 8 (100.0%) |
Property Value to Household Income Ratio in Bloomington
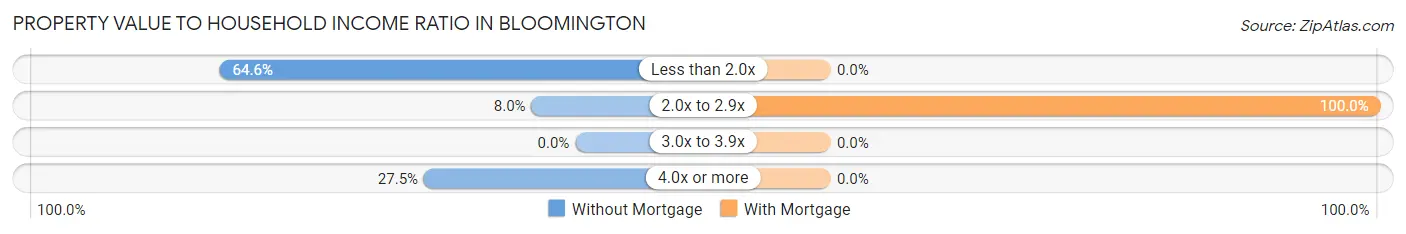
| Value-to-Income Ratio | Without Mortgage | With Mortgage |
| Less than 2.0x | 195 (64.6%) | 0 (0.0%) |
| 2.0x to 2.9x | 24 (8.0%) | 8 (100.0%) |
| 3.0x to 3.9x | 0 (0.0%) | 0 (0.0%) |
| 4.0x or more | 83 (27.5%) | 0 (0.0%) |
| Total | 302 (100.0%) | 8 (100.0%) |
Real Estate Taxes by Mortgage Status in Bloomington
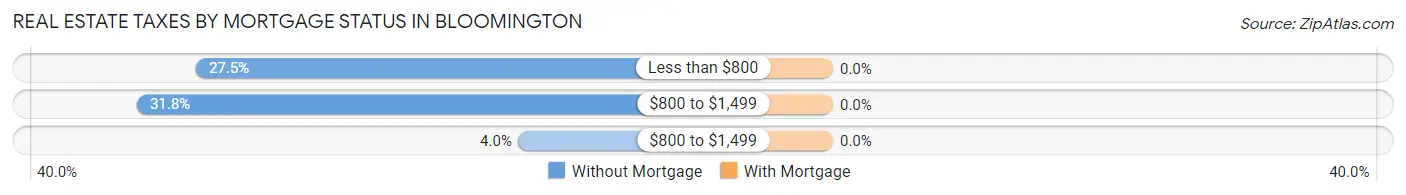
| Property Taxes | Without Mortgage | With Mortgage |
| Less than $800 | 83 (27.5%) | 0 (0.0%) |
| $800 to $1,499 | 96 (31.8%) | 0 (0.0%) |
| $800 to $1,499 | 12 (4.0%) | 0 (0.0%) |
| Total | 302 (100.0%) | 8 (100.0%) |
Health & Disability in Bloomington
Health Insurance Coverage by Age in Bloomington
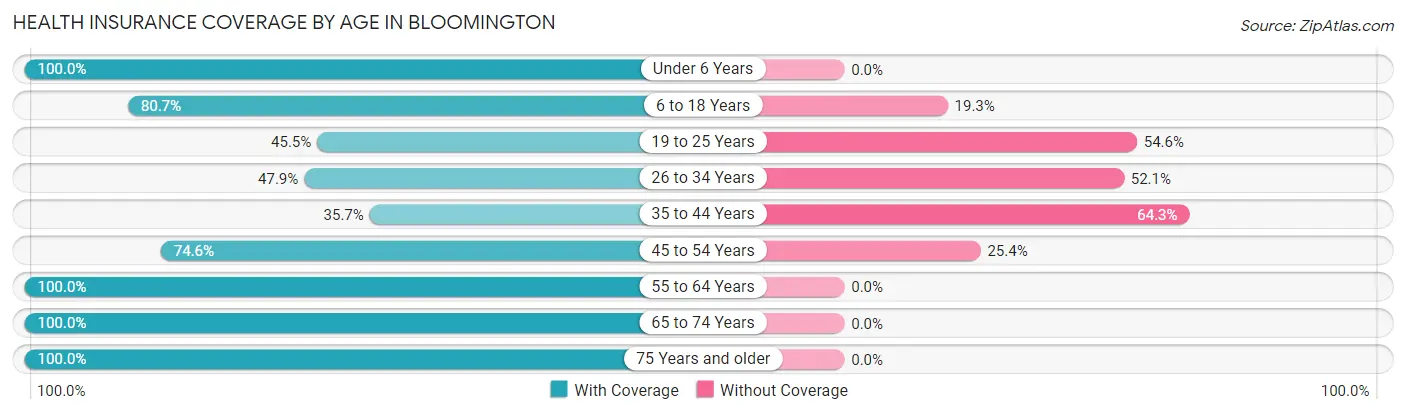
| Age Bracket | With Coverage | Without Coverage |
| Under 6 Years | 86 (100.0%) | 0 (0.0%) |
| 6 to 18 Years | 239 (80.7%) | 57 (19.3%) |
| 19 to 25 Years | 15 (45.5%) | 18 (54.5%) |
| 26 to 34 Years | 79 (47.9%) | 86 (52.1%) |
| 35 to 44 Years | 46 (35.7%) | 83 (64.3%) |
| 45 to 54 Years | 47 (74.6%) | 16 (25.4%) |
| 55 to 64 Years | 123 (100.0%) | 0 (0.0%) |
| 65 to 74 Years | 117 (100.0%) | 0 (0.0%) |
| 75 Years and older | 177 (100.0%) | 0 (0.0%) |
| Total | 929 (78.1%) | 260 (21.9%) |
Health Insurance Coverage by Citizenship Status in Bloomington
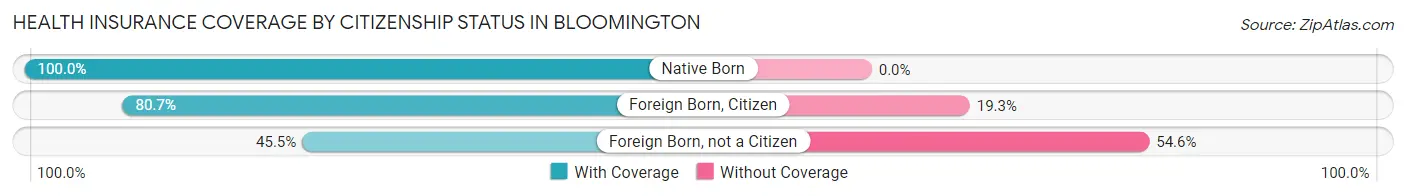
| Citizenship Status | With Coverage | Without Coverage |
| Native Born | 86 (100.0%) | 0 (0.0%) |
| Foreign Born, Citizen | 239 (80.7%) | 57 (19.3%) |
| Foreign Born, not a Citizen | 15 (45.5%) | 18 (54.5%) |
Health Insurance Coverage by Household Income in Bloomington
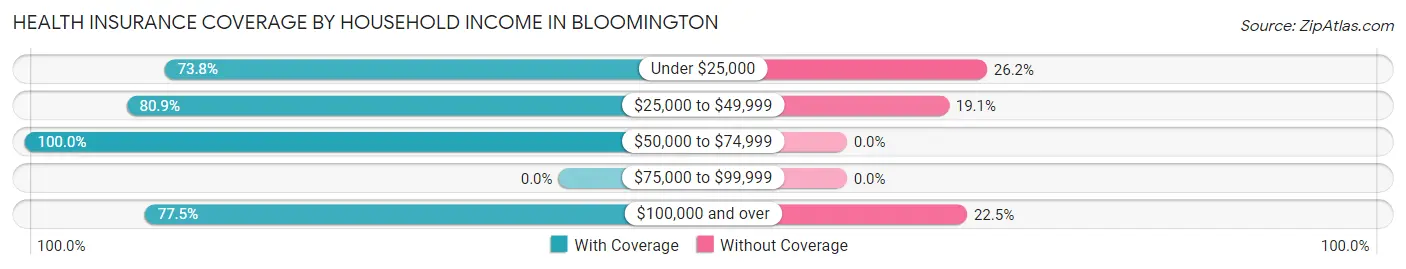
| Household Income | With Coverage | Without Coverage |
| Under $25,000 | 433 (73.8%) | 154 (26.2%) |
| $25,000 to $49,999 | 199 (80.9%) | 47 (19.1%) |
| $50,000 to $74,999 | 94 (100.0%) | 0 (0.0%) |
| $75,000 to $99,999 | 0 (0.0%) | 0 (0.0%) |
| $100,000 and over | 203 (77.5%) | 59 (22.5%) |
Public vs Private Health Insurance Coverage by Age in Bloomington
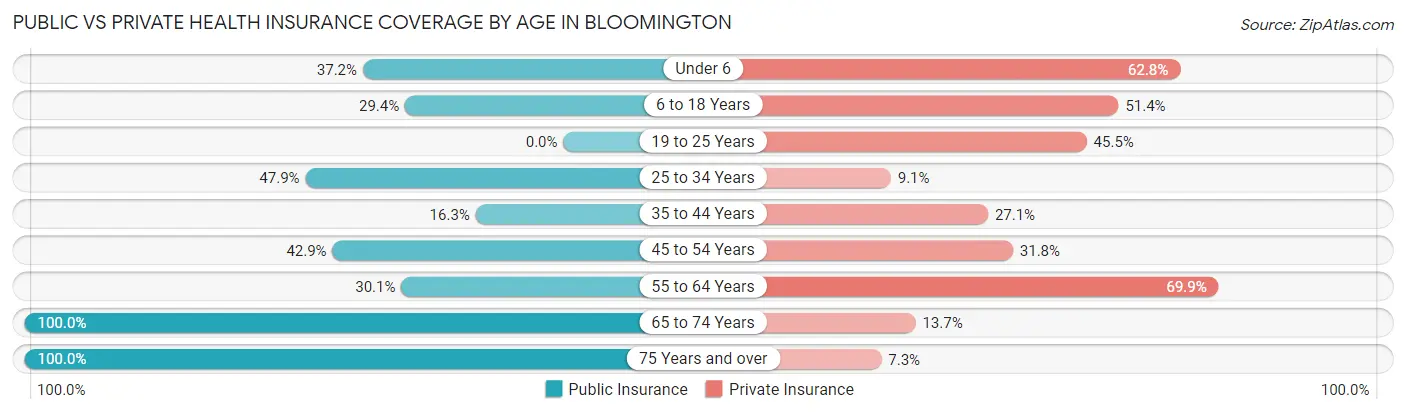
| Age Bracket | Public Insurance | Private Insurance |
| Under 6 | 32 (37.2%) | 54 (62.8%) |
| 6 to 18 Years | 87 (29.4%) | 152 (51.3%) |
| 19 to 25 Years | 0 (0.0%) | 15 (45.5%) |
| 25 to 34 Years | 79 (47.9%) | 15 (9.1%) |
| 35 to 44 Years | 21 (16.3%) | 35 (27.1%) |
| 45 to 54 Years | 27 (42.9%) | 20 (31.8%) |
| 55 to 64 Years | 37 (30.1%) | 86 (69.9%) |
| 65 to 74 Years | 117 (100.0%) | 16 (13.7%) |
| 75 Years and over | 177 (100.0%) | 13 (7.3%) |
| Total | 577 (48.5%) | 406 (34.2%) |
Disability Status by Sex by Age in Bloomington
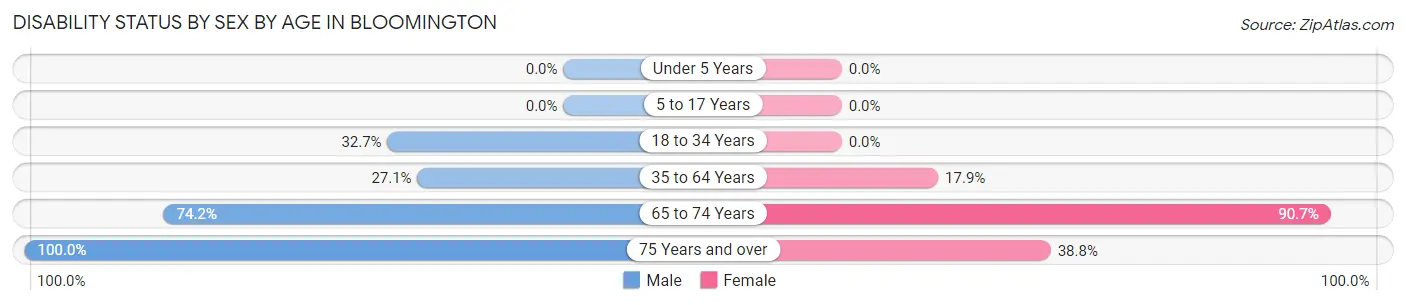
| Age Bracket | Male | Female |
| Under 5 Years | 0 (0.0%) | 0 (0.0%) |
| 5 to 17 Years | 0 (0.0%) | 0 (0.0%) |
| 18 to 34 Years | 16 (32.7%) | 0 (0.0%) |
| 35 to 64 Years | 52 (27.1%) | 22 (17.9%) |
| 65 to 74 Years | 23 (74.2%) | 78 (90.7%) |
| 75 Years and over | 79 (100.0%) | 38 (38.8%) |
Disability Class by Sex by Age in Bloomington
Disability Class: Hearing Difficulty
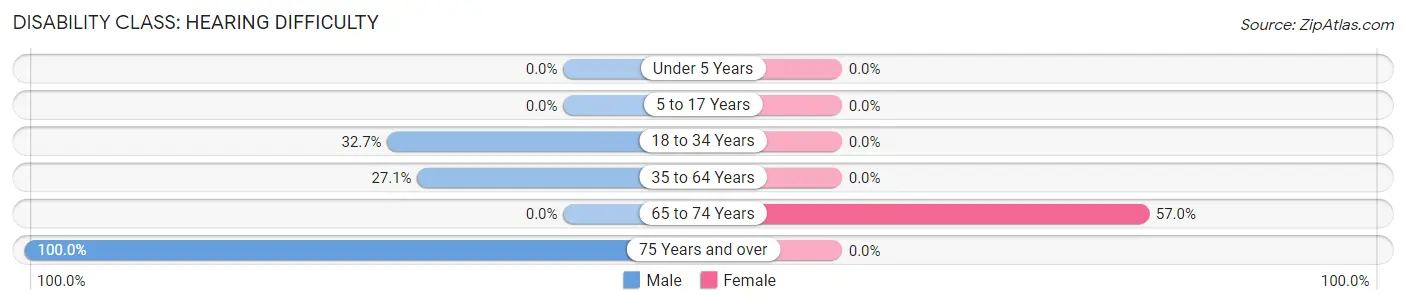
| Age Bracket | Male | Female |
| Under 5 Years | 0 (0.0%) | 0 (0.0%) |
| 5 to 17 Years | 0 (0.0%) | 0 (0.0%) |
| 18 to 34 Years | 16 (32.7%) | 0 (0.0%) |
| 35 to 64 Years | 52 (27.1%) | 0 (0.0%) |
| 65 to 74 Years | 0 (0.0%) | 49 (57.0%) |
| 75 Years and over | 79 (100.0%) | 0 (0.0%) |
Disability Class: Vision Difficulty
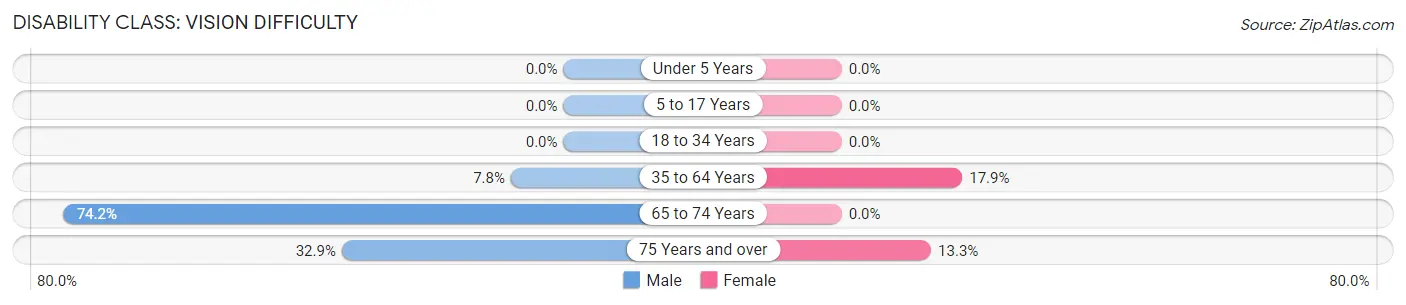
| Age Bracket | Male | Female |
| Under 5 Years | 0 (0.0%) | 0 (0.0%) |
| 5 to 17 Years | 0 (0.0%) | 0 (0.0%) |
| 18 to 34 Years | 0 (0.0%) | 0 (0.0%) |
| 35 to 64 Years | 15 (7.8%) | 22 (17.9%) |
| 65 to 74 Years | 23 (74.2%) | 0 (0.0%) |
| 75 Years and over | 26 (32.9%) | 13 (13.3%) |
Disability Class: Cognitive Difficulty
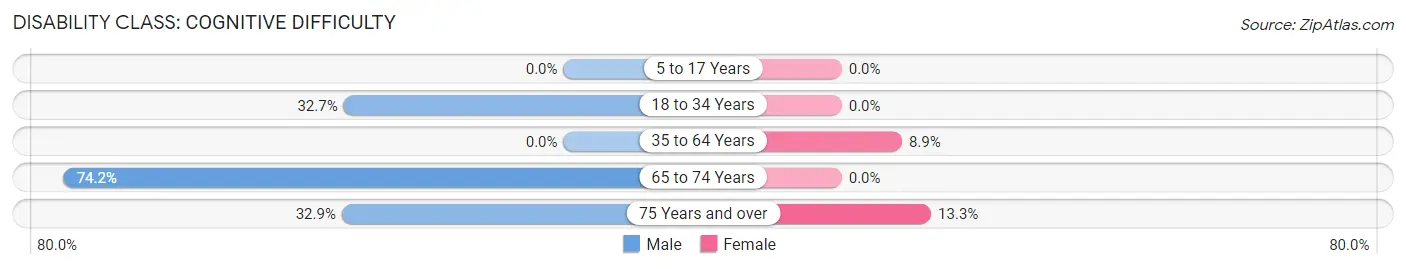
| Age Bracket | Male | Female |
| 5 to 17 Years | 0 (0.0%) | 0 (0.0%) |
| 18 to 34 Years | 16 (32.7%) | 0 (0.0%) |
| 35 to 64 Years | 0 (0.0%) | 11 (8.9%) |
| 65 to 74 Years | 23 (74.2%) | 0 (0.0%) |
| 75 Years and over | 26 (32.9%) | 13 (13.3%) |
Disability Class: Ambulatory Difficulty
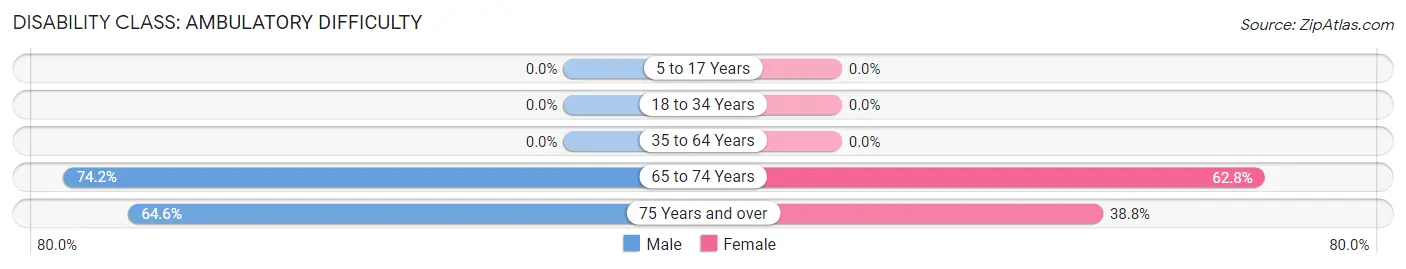
| Age Bracket | Male | Female |
| 5 to 17 Years | 0 (0.0%) | 0 (0.0%) |
| 18 to 34 Years | 0 (0.0%) | 0 (0.0%) |
| 35 to 64 Years | 0 (0.0%) | 0 (0.0%) |
| 65 to 74 Years | 23 (74.2%) | 54 (62.8%) |
| 75 Years and over | 51 (64.6%) | 38 (38.8%) |
Disability Class: Self-Care Difficulty
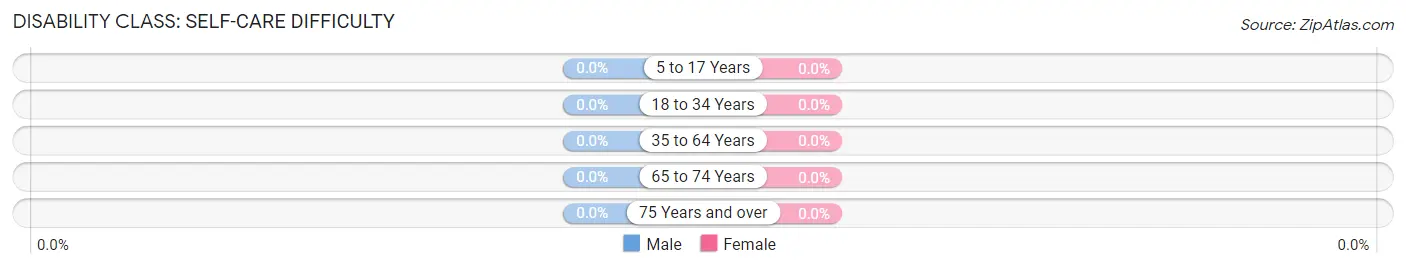
| Age Bracket | Male | Female |
| 5 to 17 Years | 0 (0.0%) | 0 (0.0%) |
| 18 to 34 Years | 0 (0.0%) | 0 (0.0%) |
| 35 to 64 Years | 0 (0.0%) | 0 (0.0%) |
| 65 to 74 Years | 0 (0.0%) | 0 (0.0%) |
| 75 Years and over | 0 (0.0%) | 0 (0.0%) |
Technology Access in Bloomington
Computing Device Access in Bloomington
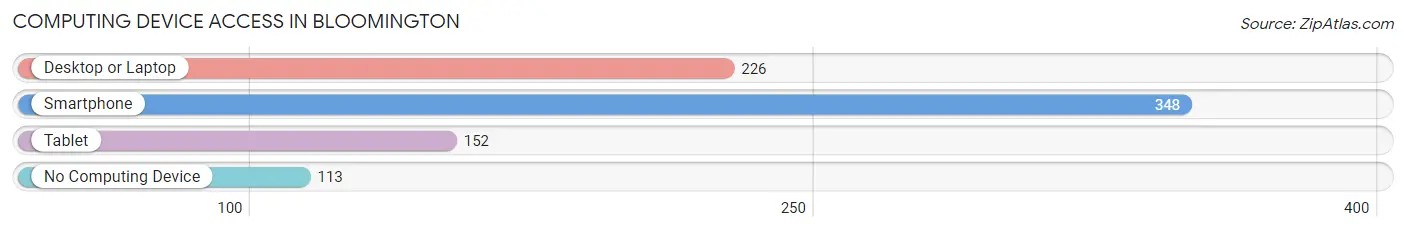
| Device Type | # Households | % Households |
| Desktop or Laptop | 226 | 46.5% |
| Smartphone | 348 | 71.6% |
| Tablet | 152 | 31.3% |
| No Computing Device | 113 | 23.3% |
| Total | 486 | 100.0% |
Internet Access in Bloomington
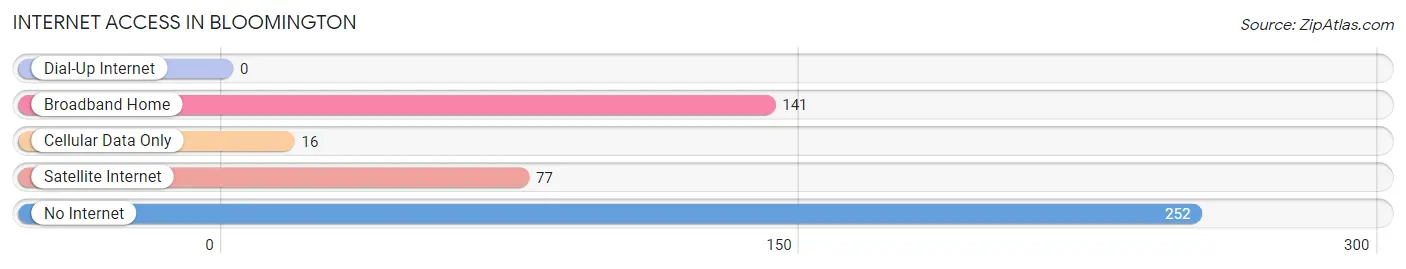
| Internet Type | # Households | % Households |
| Dial-Up Internet | 0 | 0.0% |
| Broadband Home | 141 | 29.0% |
| Cellular Data Only | 16 | 3.3% |
| Satellite Internet | 77 | 15.8% |
| No Internet | 252 | 51.8% |
| Total | 486 | 100.0% |
Bloomington Summary
Bloomington is a small town located in the state of Texas, in the United States. It is situated in the county of Victoria, and is part of the Victoria Metropolitan Statistical Area. The town has a population of approximately 1,500 people, and is located about 30 miles south of Victoria, the county seat.
History
The area that is now Bloomington was first settled in the late 1800s by German immigrants. The town was originally known as “Germantown”, and was later renamed Bloomington in 1891. The town was officially incorporated in 1892, and was named after the blooming wildflowers that grew in the area.
The town was a thriving agricultural center in the early 1900s, and was home to several cotton gins, a cottonseed oil mill, and a cottonseed cake mill. The town also had a number of stores, churches, and a school.
In the 1920s, the town began to decline as the cotton industry began to decline. The town’s population decreased, and many of the businesses closed. The town was revitalized in the 1950s when oil was discovered in the area. The town’s population began to grow again, and the economy began to improve.
Geography
Bloomington is located in the southeastern part of Victoria County, in the state of Texas. The town is situated on the banks of the Guadalupe River, and is surrounded by rolling hills and farmland. The town is located about 30 miles south of Victoria, the county seat.
The climate in Bloomington is generally mild, with hot summers and mild winters. The average annual temperature is around 70 degrees Fahrenheit, and the average annual precipitation is around 35 inches.
Economy
The economy of Bloomington is largely based on agriculture and oil production. The town is home to several cotton gins, and is also home to a number of oil wells. The town also has a number of stores, restaurants, and other businesses.
The town is also home to a number of manufacturing companies, including a plastics manufacturer and a metal fabrication company. The town is also home to a number of service-based businesses, such as auto repair shops and medical offices.
Demographics
As of the 2010 census, the population of Bloomington was 1,521. The racial makeup of the town was 79.3% White, 16.2% Hispanic or Latino, 1.2% African American, 0.7% Native American, 0.2% Asian, and 2.6% from other races.
The median household income in Bloomington was $37,917, and the median family income was $45,938. The per capita income in the town was $18,945. The town’s poverty rate was 17.2%.
Conclusion
Bloomington is a small town located in the state of Texas, in the United States. It is situated in the county of Victoria, and is part of the Victoria Metropolitan Statistical Area. The town has a population of approximately 1,500 people, and is located about 30 miles south of Victoria, the county seat. The town was originally settled in the late 1800s by German immigrants, and was officially incorporated in 1892. The town’s economy is largely based on agriculture and oil production, and the town is also home to a number of manufacturing companies and service-based businesses. The population of Bloomington is largely White, with a significant Hispanic or Latino population. The median household income in Bloomington is $37,917, and the poverty rate is 17.2%.
Common Questions
What is Per Capita Income in Bloomington?
Per Capita income in Bloomington is $19,554.
What is the Median Family Income in Bloomington?
Median Family Income in Bloomington is $36,731.
What is the Median Household income in Bloomington?
Median Household Income in Bloomington is $24,302.
What is Family Income Deficit in Bloomington?
Family Income Deficit in Bloomington is $20,021.
Families that are below poverty line in Bloomington earn $20,021 less on average than the poverty threshold level.
What is Inequality or Gini Index in Bloomington?
Inequality or Gini Index in Bloomington is 0.55.
What is the Total Population of Bloomington?
Total Population of Bloomington is 1,189.
What is the Total Male Population of Bloomington?
Total Male Population of Bloomington is 434.
What is the Total Female Population of Bloomington?
Total Female Population of Bloomington is 755.
What is the Ratio of Males per 100 Females in Bloomington?
There are 57.48 Males per 100 Females in Bloomington.
What is the Ratio of Females per 100 Males in Bloomington?
There are 173.96 Females per 100 Males in Bloomington.
What is the Median Population Age in Bloomington?
Median Population Age in Bloomington is 35.8 Years.
What is the Average Family Size in Bloomington
Average Family Size in Bloomington is 3.3 People.
What is the Average Household Size in Bloomington
Average Household Size in Bloomington is 2.5 People.
How Large is the Labor Force in Bloomington?
There are 301 People in the Labor Forcein in Bloomington.
What is the Percentage of People in the Labor Force in Bloomington?
36.7% of People are in the Labor Force in Bloomington.
What is the Unemployment Rate in Bloomington?
Unemployment Rate in Bloomington is 12.6%.