Cities with the Highest Percentage of Population with a Degree in Physical and Health Sciences in Pennsylvania
RELATED REPORTS & OPTIONS
Physical and Health Sciences
Pennsylvania
Compare Cities
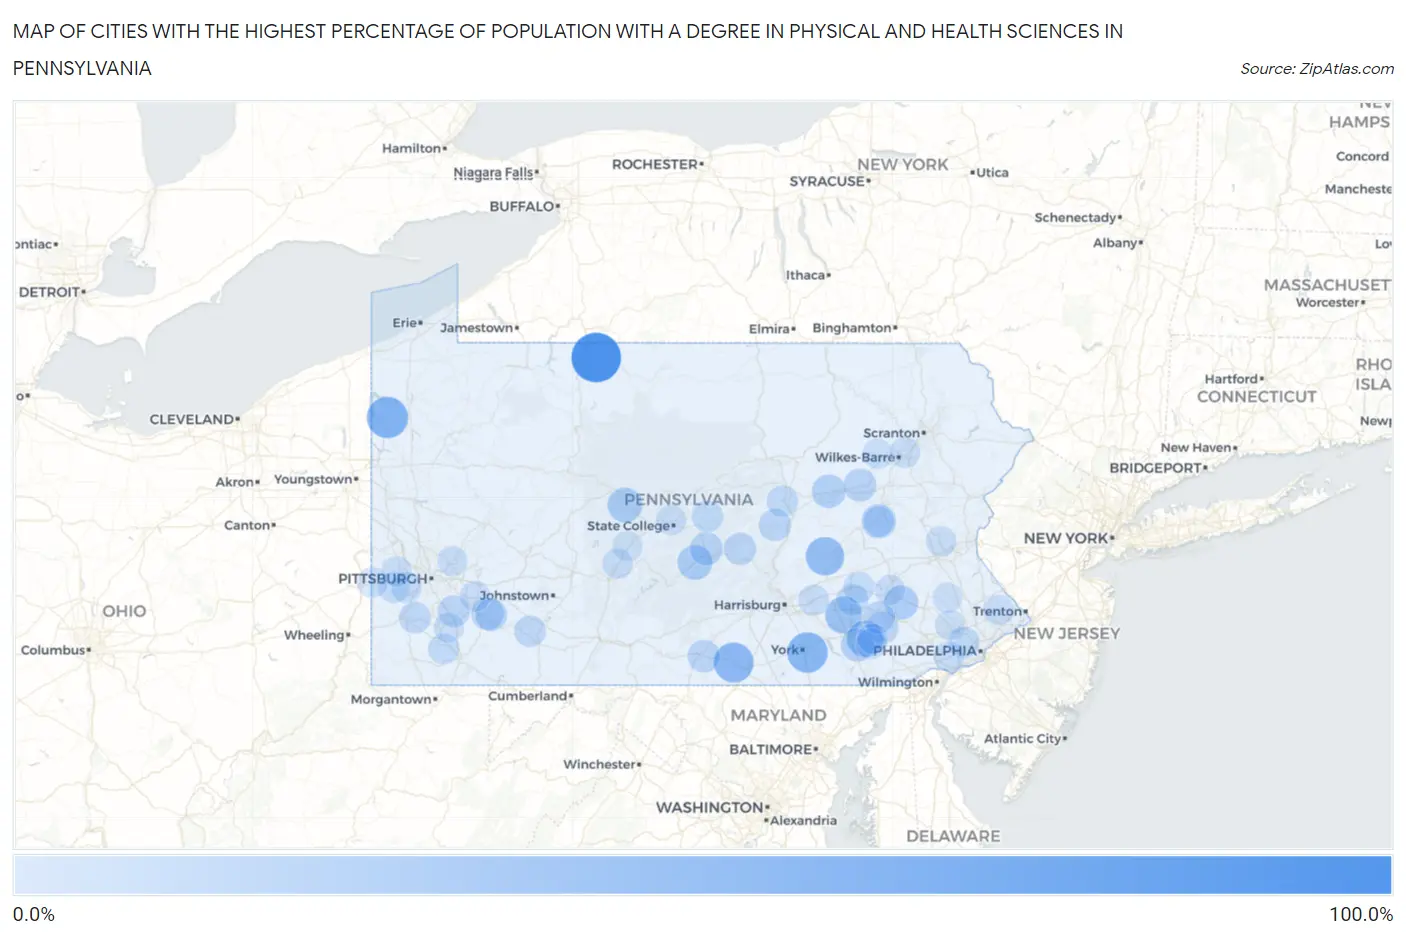
Map of Cities with the Highest Percentage of Population with a Degree in Physical and Health Sciences in Pennsylvania
0.0%
100.0%
Cities with the Highest Percentage of Population with a Degree in Physical and Health Sciences in Pennsylvania
| City | % Graduates | vs State | vs National | |
| 1. | Rew | 100.0% | 3.3%(+96.7)#1 | 3.1%(+96.9)#17 |
| 2. | Adamsville | 60.0% | 3.3%(+56.7)#2 | 3.1%(+56.9)#50 |
| 3. | Queens Gate | 56.1% | 3.3%(+52.8)#3 | 3.1%(+53.0)#61 |
| 4. | Mcknightstown | 53.1% | 3.3%(+49.8)#4 | 3.1%(+50.0)#71 |
| 5. | Orwin | 47.1% | 3.3%(+43.8)#5 | 3.1%(+44.0)#109 |
| 6. | Penryn | 40.7% | 3.3%(+37.5)#6 | 3.1%(+37.6)#132 |
| 7. | Bird In Hand | 37.5% | 3.3%(+34.2)#7 | 3.1%(+34.4)#168 |
| 8. | Newton Hamilton Borough | 33.3% | 3.3%(+30.1)#8 | 3.1%(+30.2)#204 |
| 9. | Elco Borough | 32.6% | 3.3%(+29.3)#9 | 3.1%(+29.5)#225 |
| 10. | Strodes Mills | 30.2% | 3.3%(+27.0)#10 | 3.1%(+27.1)#254 |
| 11. | West Decatur | 30.0% | 3.3%(+26.7)#11 | 3.1%(+26.9)#257 |
| 12. | Grier City | 27.5% | 3.3%(+24.2)#12 | 3.1%(+24.4)#309 |
| 13. | Gibraltar | 27.3% | 3.3%(+24.0)#13 | 3.1%(+24.2)#311 |
| 14. | Clifton Heights Borough | 26.8% | 3.3%(+23.5)#14 | 3.1%(+23.7)#323 |
| 15. | Buckhorn | 25.0% | 3.3%(+21.7)#15 | 3.1%(+21.9)#363 |
| 16. | Callimont Borough | 25.0% | 3.3%(+21.7)#16 | 3.1%(+21.9)#389 |
| 17. | Laporte Borough | 24.6% | 3.3%(+21.3)#17 | 3.1%(+21.5)#401 |
| 18. | Lampeter | 23.6% | 3.3%(+20.4)#18 | 3.1%(+20.5)#422 |
| 19. | East Berwick | 21.4% | 3.3%(+18.1)#19 | 3.1%(+18.3)#492 |
| 20. | Yeagertown | 21.3% | 3.3%(+18.0)#20 | 3.1%(+18.2)#493 |
| 21. | South Connellsville Borough | 20.2% | 3.3%(+16.9)#21 | 3.1%(+17.1)#526 |
| 22. | Norvelt | 20.1% | 3.3%(+16.8)#22 | 3.1%(+17.0)#528 |
| 23. | Tylersville | 20.0% | 3.3%(+16.7)#23 | 3.1%(+16.9)#545 |
| 24. | Guilford | 19.9% | 3.3%(+16.7)#24 | 3.1%(+16.8)#558 |
| 25. | Morgan Hill | 19.8% | 3.3%(+16.5)#25 | 3.1%(+16.7)#562 |
| 26. | Mcalisterville | 18.9% | 3.3%(+15.6)#26 | 3.1%(+15.8)#596 |
| 27. | Port Royal Borough | 18.8% | 3.3%(+15.5)#27 | 3.1%(+15.7)#600 |
| 28. | Kreamer | 18.4% | 3.3%(+15.1)#28 | 3.1%(+15.3)#621 |
| 29. | Collinsburg | 18.0% | 3.3%(+14.7)#29 | 3.1%(+14.9)#640 |
| 30. | East Earl | 17.6% | 3.3%(+14.3)#30 | 3.1%(+14.5)#665 |
| 31. | Mammoth | 17.5% | 3.3%(+14.2)#31 | 3.1%(+14.4)#671 |
| 32. | Fivepointville | 17.4% | 3.3%(+14.1)#32 | 3.1%(+14.3)#676 |
| 33. | Fredericksburg Cdp Crawford County | 16.9% | 3.3%(+13.7)#33 | 3.1%(+13.8)#698 |
| 34. | Eighty Four | 16.7% | 3.3%(+13.4)#34 | 3.1%(+13.6)#717 |
| 35. | Wattsburg Borough | 16.7% | 3.3%(+13.4)#35 | 3.1%(+13.6)#721 |
| 36. | Benton Borough | 16.3% | 3.3%(+13.0)#36 | 3.1%(+13.2)#761 |
| 37. | Edie | 16.1% | 3.3%(+12.9)#37 | 3.1%(+13.0)#780 |
| 38. | Schaefferstown | 15.7% | 3.3%(+12.4)#38 | 3.1%(+12.6)#804 |
| 39. | Spring Mills | 15.5% | 3.3%(+12.2)#39 | 3.1%(+12.4)#819 |
| 40. | Linntown | 15.3% | 3.3%(+12.0)#40 | 3.1%(+12.2)#845 |
| 41. | Mcdonald Borough | 15.1% | 3.3%(+11.9)#41 | 3.1%(+12.0)#856 |
| 42. | Haverford College | 14.9% | 3.3%(+11.6)#42 | 3.1%(+11.8)#881 |
| 43. | Eldred Borough | 14.6% | 3.3%(+11.3)#43 | 3.1%(+11.5)#919 |
| 44. | Snydertown Borough | 13.9% | 3.3%(+10.6)#44 | 3.1%(+10.8)#998 |
| 45. | Modena Borough | 13.6% | 3.3%(+10.3)#45 | 3.1%(+10.5)#1,028 |
| 46. | Shanksville Borough | 13.3% | 3.3%(+10.1)#46 | 3.1%(+10.2)#1,059 |
| 47. | West Brownsville Borough | 13.3% | 3.3%(+10.0)#47 | 3.1%(+10.2)#1,065 |
| 48. | West Hazleton Borough | 13.2% | 3.3%(+9.91)#48 | 3.1%(+10.1)#1,078 |
| 49. | West Elizabeth Borough | 13.0% | 3.3%(+9.77)#49 | 3.1%(+9.94)#1,092 |
| 50. | Chapman Borough | 13.0% | 3.3%(+9.77)#50 | 3.1%(+9.94)#1,096 |
| 51. | Republic | 13.0% | 3.3%(+9.74)#51 | 3.1%(+9.91)#1,102 |
| 52. | Stouchsburg | 12.9% | 3.3%(+9.63)#52 | 3.1%(+9.80)#1,113 |
| 53. | Bulger | 12.9% | 3.3%(+9.63)#53 | 3.1%(+9.80)#1,114 |
| 54. | Edwardsville Borough | 12.6% | 3.3%(+9.34)#54 | 3.1%(+9.52)#1,142 |
| 55. | Lewis Run Borough | 12.6% | 3.3%(+9.34)#55 | 3.1%(+9.51)#1,143 |
| 56. | Sturgeon | 12.6% | 3.3%(+9.31)#56 | 3.1%(+9.49)#1,146 |
| 57. | Glen Rock Borough | 12.5% | 3.3%(+9.25)#57 | 3.1%(+9.43)#1,150 |
| 58. | Clymer Borough | 12.2% | 3.3%(+8.90)#58 | 3.1%(+9.08)#1,198 |
| 59. | Wellsville Borough | 12.1% | 3.3%(+8.84)#59 | 3.1%(+9.02)#1,206 |
| 60. | Ellsworth Borough | 11.9% | 3.3%(+8.63)#60 | 3.1%(+8.81)#1,233 |
| 61. | Palmdale | 11.8% | 3.3%(+8.57)#61 | 3.1%(+8.75)#1,238 |
| 62. | Donora Borough | 11.5% | 3.3%(+8.27)#62 | 3.1%(+8.45)#1,285 |
| 63. | Grapeville | 11.2% | 3.3%(+7.96)#63 | 3.1%(+8.14)#1,336 |
| 64. | Hudson | 11.2% | 3.3%(+7.95)#64 | 3.1%(+8.13)#1,337 |
| 65. | Bolivar Borough | 11.1% | 3.3%(+7.83)#65 | 3.1%(+8.01)#1,353 |
| 66. | Laceyville Borough | 11.1% | 3.3%(+7.83)#66 | 3.1%(+8.01)#1,354 |
| 67. | Atwood Borough | 11.1% | 3.3%(+7.83)#67 | 3.1%(+8.01)#1,360 |
| 68. | Mars Borough | 11.1% | 3.3%(+7.79)#68 | 3.1%(+7.96)#1,369 |
| 69. | Sugar Grove Borough | 11.0% | 3.3%(+7.70)#69 | 3.1%(+7.88)#1,379 |
| 70. | Paradise | 10.9% | 3.3%(+7.62)#70 | 3.1%(+7.80)#1,391 |
| 71. | Toftrees | 10.9% | 3.3%(+7.59)#71 | 3.1%(+7.77)#1,398 |
| 72. | Richboro | 10.7% | 3.3%(+7.42)#72 | 3.1%(+7.60)#1,427 |
| 73. | Lima | 10.6% | 3.3%(+7.37)#73 | 3.1%(+7.54)#1,435 |
| 74. | New Berlin Borough | 10.6% | 3.3%(+7.36)#74 | 3.1%(+7.54)#1,437 |
| 75. | Bessemer Borough | 10.6% | 3.3%(+7.31)#75 | 3.1%(+7.49)#1,447 |
| 76. | Paris | 10.5% | 3.3%(+7.25)#76 | 3.1%(+7.43)#1,464 |
| 77. | Intercourse | 10.4% | 3.3%(+7.17)#77 | 3.1%(+7.35)#1,487 |
| 78. | Marklesburg Borough | 10.4% | 3.3%(+7.14)#78 | 3.1%(+7.32)#1,493 |
| 79. | Nescopeck Borough | 10.4% | 3.3%(+7.12)#79 | 3.1%(+7.30)#1,500 |
| 80. | Greenwood | 10.3% | 3.3%(+7.05)#80 | 3.1%(+7.23)#1,517 |
| 81. | Greenfields | 10.3% | 3.3%(+7.03)#81 | 3.1%(+7.21)#1,526 |
| 82. | Cementon | 10.2% | 3.3%(+6.94)#82 | 3.1%(+7.12)#1,557 |
| 83. | Clinton | 10.2% | 3.3%(+6.91)#83 | 3.1%(+7.09)#1,563 |
| 84. | Park Crest | 10.2% | 3.3%(+6.89)#84 | 3.1%(+7.07)#1,566 |
| 85. | Walnutport Borough | 10.1% | 3.3%(+6.83)#85 | 3.1%(+7.01)#1,576 |
| 86. | Harwick | 10.1% | 3.3%(+6.83)#86 | 3.1%(+7.01)#1,579 |
| 87. | Silkworth | 10.1% | 3.3%(+6.79)#87 | 3.1%(+6.96)#1,586 |
| 88. | Bridgeport Borough | 10.0% | 3.3%(+6.75)#88 | 3.1%(+6.93)#1,591 |
| 89. | Troutville Borough | 10.0% | 3.3%(+6.72)#89 | 3.1%(+6.90)#1,611 |
| 90. | Woodcock Borough | 10.0% | 3.3%(+6.72)#90 | 3.1%(+6.90)#1,617 |
| 91. | Dauphin Borough | 10.0% | 3.3%(+6.70)#91 | 3.1%(+6.88)#1,625 |
| 92. | Cheltenham | 9.8% | 3.3%(+6.51)#92 | 3.1%(+6.68)#1,654 |
| 93. | Fairhope | 9.7% | 3.3%(+6.40)#93 | 3.1%(+6.58)#1,676 |
| 94. | Grazierville | 9.5% | 3.3%(+6.25)#94 | 3.1%(+6.42)#1,719 |
| 95. | Larksville Borough | 9.5% | 3.3%(+6.18)#95 | 3.1%(+6.36)#1,738 |
| 96. | Woxall | 9.4% | 3.3%(+6.08)#96 | 3.1%(+6.26)#1,767 |
| 97. | Springdale Borough | 9.3% | 3.3%(+6.03)#97 | 3.1%(+6.21)#1,779 |
| 98. | Fredonia Borough | 9.3% | 3.3%(+6.02)#98 | 3.1%(+6.20)#1,781 |
| 99. | State College Borough | 9.1% | 3.3%(+5.85)#99 | 3.1%(+6.03)#1,824 |
| 100. | Audubon | 9.1% | 3.3%(+5.77)#100 | 3.1%(+5.95)#1,871 |
Common Questions
What are the Top 10 Cities with the Highest Percentage of Population with a Degree in Physical and Health Sciences in Pennsylvania?
Top 10 Cities with the Highest Percentage of Population with a Degree in Physical and Health Sciences in Pennsylvania are:
#1
100.0%
#2
60.0%
#3
56.1%
#4
53.1%
#5
47.1%
#6
40.7%
#7
37.5%
#8
30.2%
#9
30.0%
#10
27.5%
What city has the Highest Percentage of Population with a Degree in Physical and Health Sciences in Pennsylvania?
Rew has the Highest Percentage of Population with a Degree in Physical and Health Sciences in Pennsylvania with 100.0%.
What is the Percentage of Population with a Degree in Physical and Health Sciences in the State of Pennsylvania?
Percentage of Population with a Degree in Physical and Health Sciences in Pennsylvania is 3.3%.
What is the Percentage of Population with a Degree in Physical and Health Sciences in the United States?
Percentage of Population with a Degree in Physical and Health Sciences in the United States is 3.1%.