Max, NE Map & Demographics
Max Map
Max Overview
$29,129
PER CAPITA INCOME
$141,111
AVG FAMILY INCOME
93.4%
WAGE / INCOME GAP [ % ]
6.6¢/ $1
WAGE / INCOME GAP [ $ ]
0.31
INEQUALITY / GINI INDEX
149
TOTAL POPULATION
84
MALE POPULATION
65
FEMALE POPULATION
129.23
MALES / 100 FEMALES
77.38
FEMALES / 100 MALES
20.9
MEDIAN AGE
4.9
AVG FAMILY SIZE
3.6
AVG HOUSEHOLD SIZE
83
LABOR FORCE [ PEOPLE ]
72.2%
PERCENT IN LABOR FORCE
Max Zip Codes
Max Area Codes
Income in Max
Income Overview in Max
| Characteristic | Number | Measure |
| Per Capita Income | 149 | $29,129 |
| Median Family Income | 28 | $141,111 |
| Mean Family Income | 28 | $118,432 |
| Median Household Income | 41 | $0 |
| Mean Household Income | 41 | $98,900 |
| Income Deficit | 28 | $0 |
| Wage / Income Gap (%) | 149 | 93.41% |
| Wage / Income Gap ($) | 149 | 6.59¢ per $1 |
| Gini / Inequality Index | 149 | 0.31 |
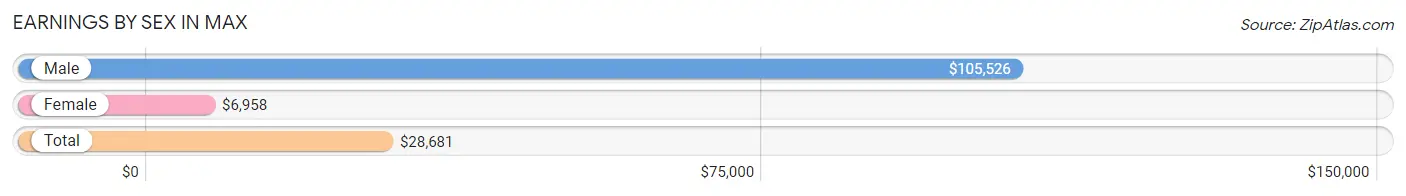
Earnings by Sex in Max
Average Earnings in Max are $28,681, $105,526 for men and $6,958 for women, a difference of 93.4%.
| Sex | Number | Average Earnings |
| Male | 30 (33.7%) | $105,526 |
| Female | 59 (66.3%) | $6,958 |
| Total | 89 (100.0%) | $28,681 |
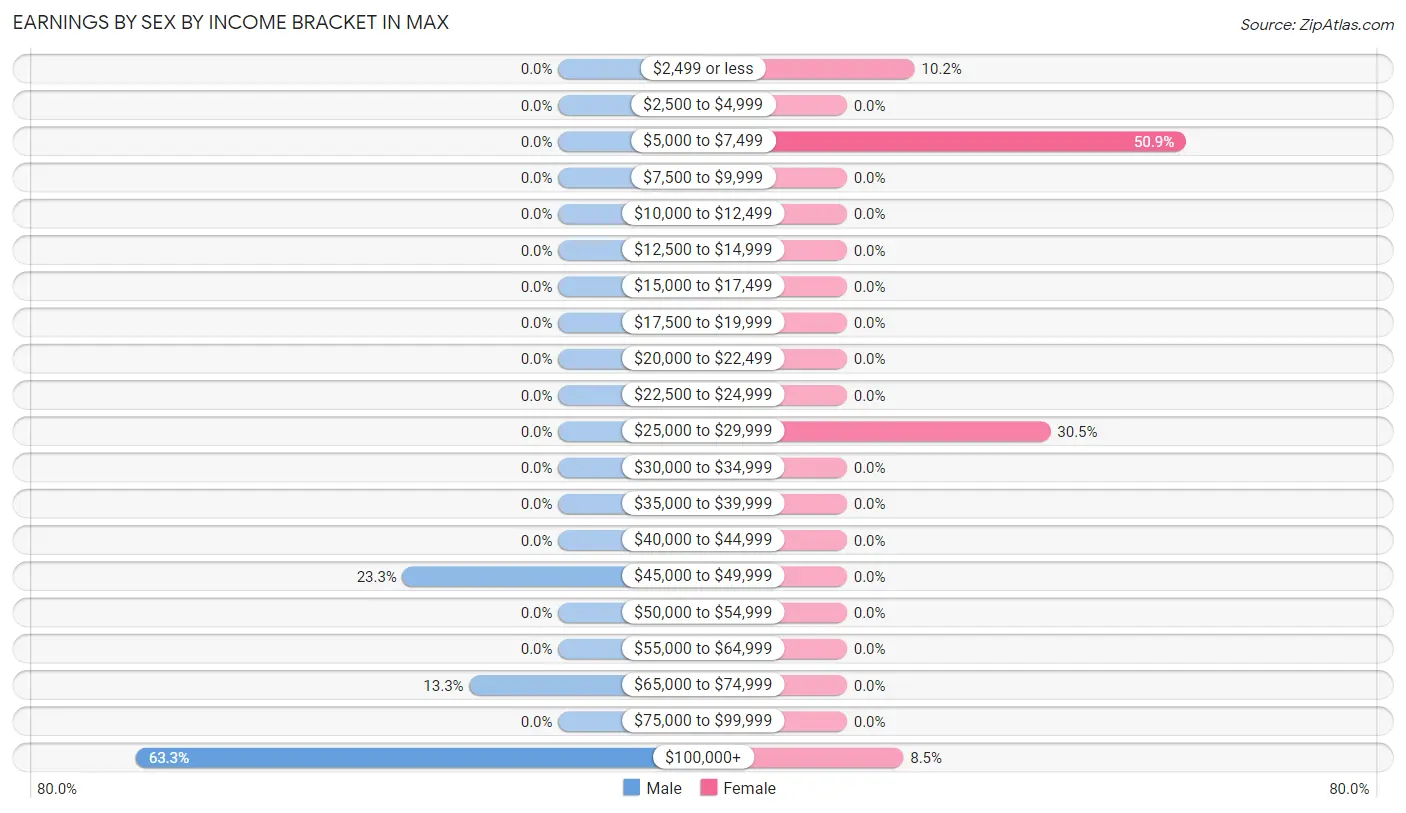
Earnings by Sex by Income Bracket in Max
The most common earnings brackets in Max are $100,000+ for men (19 | 63.3%) and $5,000 to $7,499 for women (30 | 50.8%).
| Income | Male | Female |
| $2,499 or less | 0 (0.0%) | 6 (10.2%) |
| $2,500 to $4,999 | 0 (0.0%) | 0 (0.0%) |
| $5,000 to $7,499 | 0 (0.0%) | 30 (50.8%) |
| $7,500 to $9,999 | 0 (0.0%) | 0 (0.0%) |
| $10,000 to $12,499 | 0 (0.0%) | 0 (0.0%) |
| $12,500 to $14,999 | 0 (0.0%) | 0 (0.0%) |
| $15,000 to $17,499 | 0 (0.0%) | 0 (0.0%) |
| $17,500 to $19,999 | 0 (0.0%) | 0 (0.0%) |
| $20,000 to $22,499 | 0 (0.0%) | 0 (0.0%) |
| $22,500 to $24,999 | 0 (0.0%) | 0 (0.0%) |
| $25,000 to $29,999 | 0 (0.0%) | 18 (30.5%) |
| $30,000 to $34,999 | 0 (0.0%) | 0 (0.0%) |
| $35,000 to $39,999 | 0 (0.0%) | 0 (0.0%) |
| $40,000 to $44,999 | 0 (0.0%) | 0 (0.0%) |
| $45,000 to $49,999 | 7 (23.3%) | 0 (0.0%) |
| $50,000 to $54,999 | 0 (0.0%) | 0 (0.0%) |
| $55,000 to $64,999 | 0 (0.0%) | 0 (0.0%) |
| $65,000 to $74,999 | 4 (13.3%) | 0 (0.0%) |
| $75,000 to $99,999 | 0 (0.0%) | 0 (0.0%) |
| $100,000+ | 19 (63.3%) | 5 (8.5%) |
| Total | 30 (100.0%) | 59 (100.0%) |
Earnings by Sex by Educational Attainment in Max
| Educational Attainment | Male Income | Female Income |
| Less than High School | - | - |
| High School Diploma | - | - |
| College or Associate's Degree | - | - |
| Bachelor's Degree | - | - |
| Graduate Degree | - | - |
| Total | $105,526 | $28,681 |
Family Income in Max
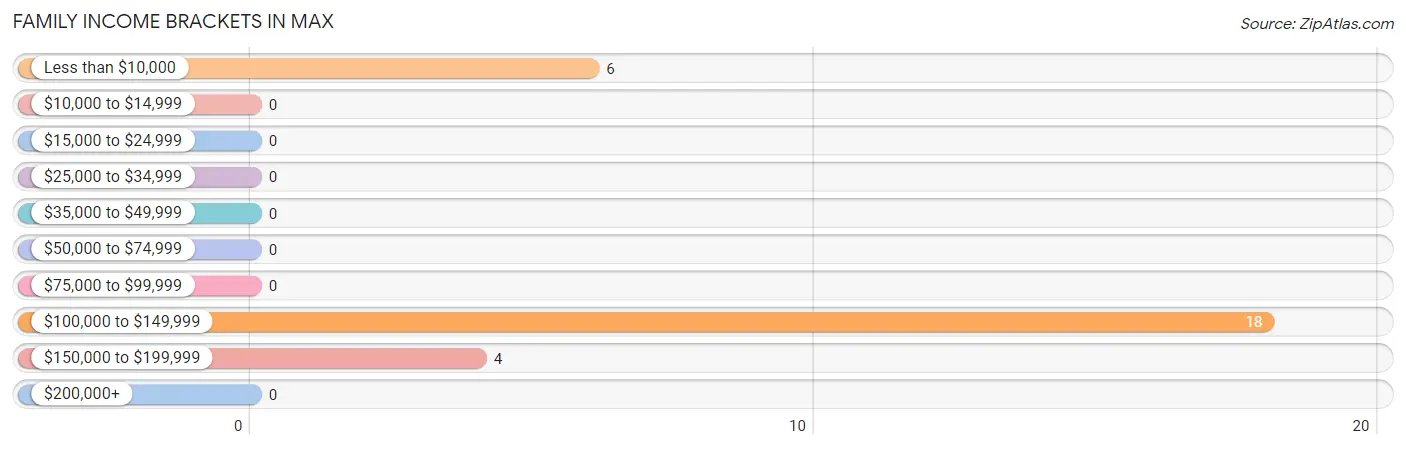
Family Income Brackets in Max
According to the Max family income data, there are 18 families falling into the $100,000 to $149,999 income range, which is the most common income bracket and makes up 64.3% of all families.
| Income Bracket | # Families | % Families |
| Less than $10,000 | 6 | 21.4% |
| $10,000 to $14,999 | 0 | 0.0% |
| $15,000 to $24,999 | 0 | 0.0% |
| $25,000 to $34,999 | 0 | 0.0% |
| $35,000 to $49,999 | 0 | 0.0% |
| $50,000 to $74,999 | 0 | 0.0% |
| $75,000 to $99,999 | 0 | 0.0% |
| $100,000 to $149,999 | 18 | 64.3% |
| $150,000 to $199,999 | 4 | 14.3% |
| $200,000+ | 0 | 0.0% |
Family Income by Famaliy Size in Max
| Income Bracket | # Families | Median Income |
| 2-Person Families | 4 (14.3%) | $0 |
| 3-Person Families | 6 (21.4%) | $0 |
| 4-Person Families | 0 (0.0%) | $0 |
| 5-Person Families | 18 (64.3%) | $0 |
| 6-Person Families | 0 (0.0%) | $0 |
| 7+ Person Families | 0 (0.0%) | $0 |
| Total | 28 (100.0%) | $141,111 |
Family Income by Number of Earners in Max
| Number of Earners | # Families | Median Income |
| No Earners | 0 (0.0%) | $0 |
| 1 Earner | 6 (21.4%) | $0 |
| 2 Earners | 4 (14.3%) | $0 |
| 3+ Earners | 18 (64.3%) | $0 |
| Total | 28 (100.0%) | $141,111 |
Household Income in Max
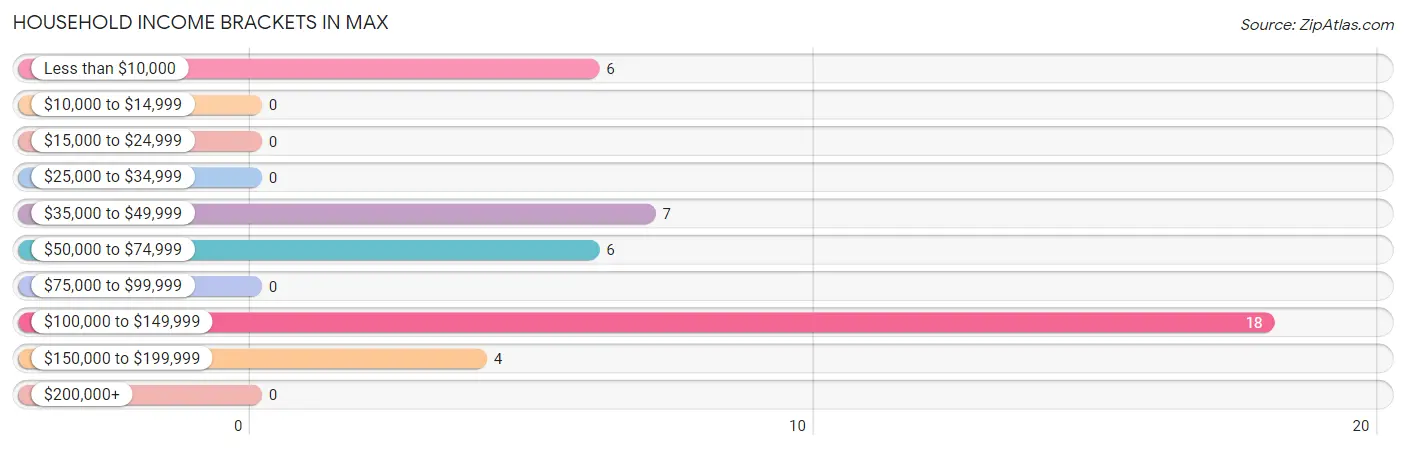
Household Income Brackets in Max
With 18 households falling in the category, the $100,000 to $149,999 income range is the most frequent in Max, accounting for 43.9% of all households.
| Income Bracket | # Households | % Households |
| Less than $10,000 | 6 | 14.6% |
| $10,000 to $14,999 | 0 | 0.0% |
| $15,000 to $24,999 | 0 | 0.0% |
| $25,000 to $34,999 | 0 | 0.0% |
| $35,000 to $49,999 | 7 | 17.1% |
| $50,000 to $74,999 | 6 | 14.6% |
| $75,000 to $99,999 | 0 | 0.0% |
| $100,000 to $149,999 | 18 | 43.9% |
| $150,000 to $199,999 | 4 | 9.8% |
| $200,000+ | 0 | 0.0% |
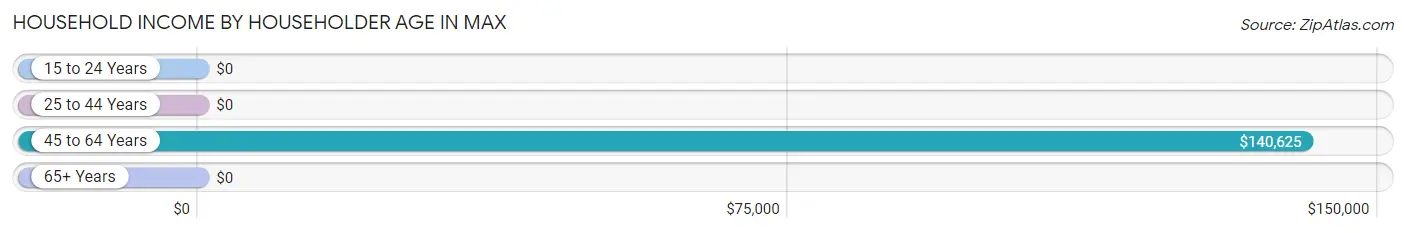
Household Income by Householder Age in Max
The median household income in Max is $0, with the highest median household income of $140,625 found in the 45 to 64 years age bracket for the primary householder. A total of 35 households (85.4%) fall into this category.
| Income Bracket | # Households | Median Income |
| 15 to 24 Years | 0 (0.0%) | $0 |
| 25 to 44 Years | 0 (0.0%) | $0 |
| 45 to 64 Years | 35 (85.4%) | $140,625 |
| 65+ Years | 6 (14.6%) | $0 |
| Total | 41 (100.0%) | $0 |
Poverty in Max
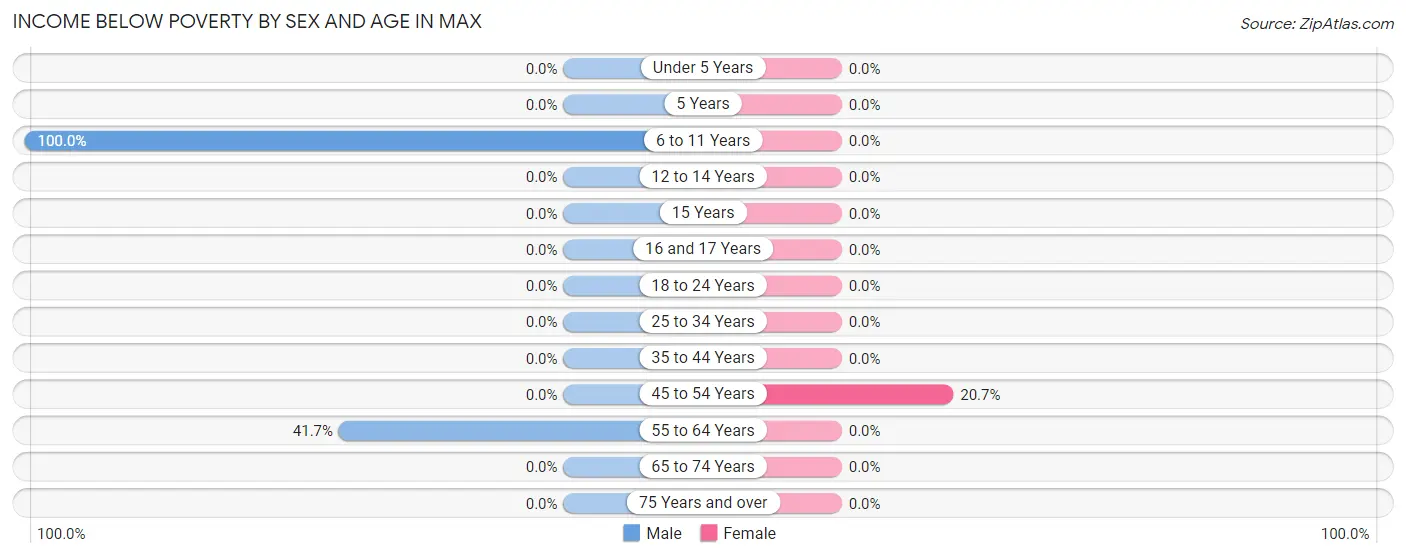
Income Below Poverty by Sex and Age in Max
With 16.7% poverty level for males and 9.2% for females among the residents of Max, 6 to 11 year old males and 45 to 54 year old females are the most vulnerable to poverty, with 9 males (100.0%) and 6 females (20.7%) in their respective age groups living below the poverty level.
| Age Bracket | Male | Female |
| Under 5 Years | 0 (0.0%) | 0 (0.0%) |
| 5 Years | 0 (0.0%) | 0 (0.0%) |
| 6 to 11 Years | 9 (100.0%) | 0 (0.0%) |
| 12 to 14 Years | 0 (0.0%) | 0 (0.0%) |
| 15 Years | 0 (0.0%) | 0 (0.0%) |
| 16 and 17 Years | 0 (0.0%) | 0 (0.0%) |
| 18 to 24 Years | 0 (0.0%) | 0 (0.0%) |
| 25 to 34 Years | 0 (0.0%) | 0 (0.0%) |
| 35 to 44 Years | 0 (0.0%) | 0 (0.0%) |
| 45 to 54 Years | 0 (0.0%) | 6 (20.7%) |
| 55 to 64 Years | 5 (41.7%) | 0 (0.0%) |
| 65 to 74 Years | 0 (0.0%) | 0 (0.0%) |
| 75 Years and over | 0 (0.0%) | 0 (0.0%) |
| Total | 14 (16.7%) | 6 (9.2%) |
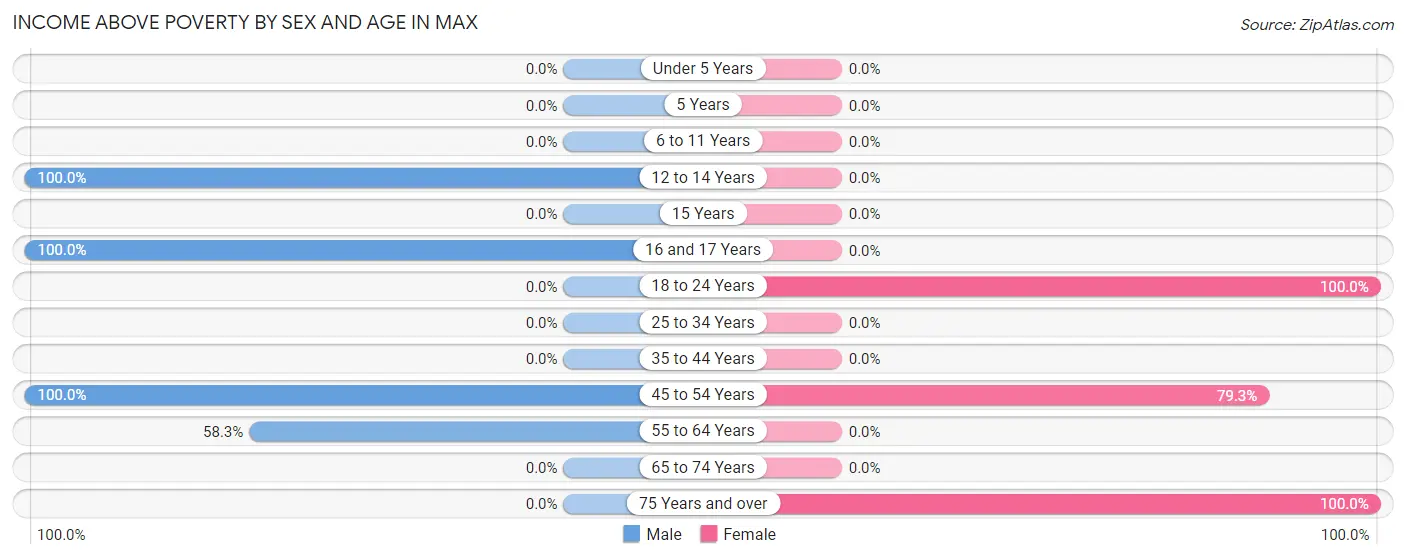
Income Above Poverty by Sex and Age in Max
According to the poverty statistics in Max, males aged 12 to 14 years and females aged 18 to 24 years are the age groups that are most secure financially, with 100.0% of males and 100.0% of females in these age groups living above the poverty line.
| Age Bracket | Male | Female |
| Under 5 Years | 0 (0.0%) | 0 (0.0%) |
| 5 Years | 0 (0.0%) | 0 (0.0%) |
| 6 to 11 Years | 0 (0.0%) | 0 (0.0%) |
| 12 to 14 Years | 25 (100.0%) | 0 (0.0%) |
| 15 Years | 0 (0.0%) | 0 (0.0%) |
| 16 and 17 Years | 15 (100.0%) | 0 (0.0%) |
| 18 to 24 Years | 0 (0.0%) | 30 (100.0%) |
| 25 to 34 Years | 0 (0.0%) | 0 (0.0%) |
| 35 to 44 Years | 0 (0.0%) | 0 (0.0%) |
| 45 to 54 Years | 23 (100.0%) | 23 (79.3%) |
| 55 to 64 Years | 7 (58.3%) | 0 (0.0%) |
| 65 to 74 Years | 0 (0.0%) | 0 (0.0%) |
| 75 Years and over | 0 (0.0%) | 6 (100.0%) |
| Total | 70 (83.3%) | 59 (90.8%) |
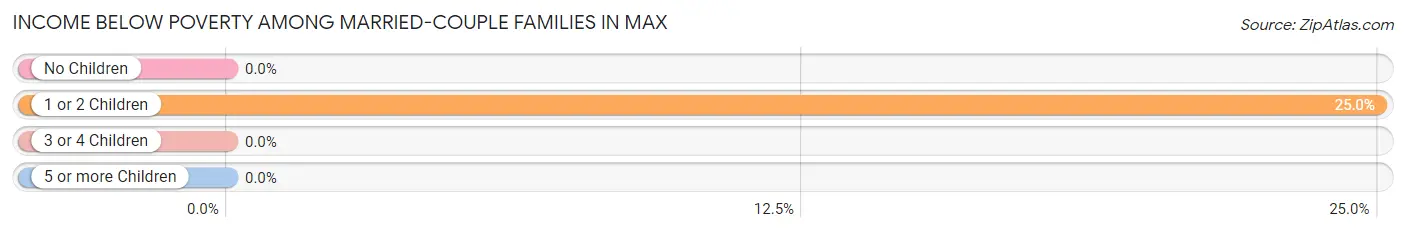
Income Below Poverty Among Married-Couple Families in Max
The poverty statistics for married-couple families in Max show that 21.4% or 6 of the total 28 families live below the poverty line. Families with 1 or 2 children have the highest poverty rate of 25.0%, comprising of 6 families. On the other hand, families with no children have the lowest poverty rate of 0.0%, which includes 0 families.
| Children | Above Poverty | Below Poverty |
| No Children | 4 (100.0%) | 0 (0.0%) |
| 1 or 2 Children | 18 (75.0%) | 6 (25.0%) |
| 3 or 4 Children | 0 (0.0%) | 0 (0.0%) |
| 5 or more Children | 0 (0.0%) | 0 (0.0%) |
| Total | 22 (78.6%) | 6 (21.4%) |
Income Below Poverty Among Single-Parent Households in Max
| Children | Single Father | Single Mother |
| No Children | 0 (0.0%) | 0 (0.0%) |
| 1 or 2 Children | 0 (0.0%) | 0 (0.0%) |
| 3 or 4 Children | 0 (0.0%) | 0 (0.0%) |
| 5 or more Children | 0 (0.0%) | 0 (0.0%) |
| Total | 0 (0.0%) | 0 (0.0%) |
Income Below Poverty Among Married-Couple vs Single-Parent Households in Max
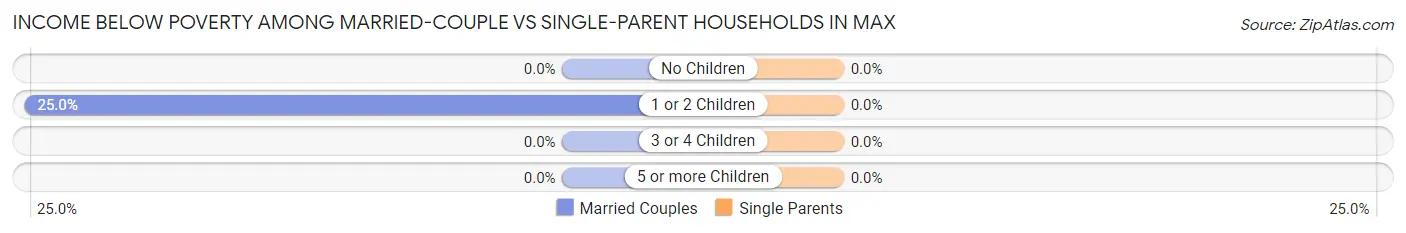
| Children | Married-Couple Families | Single-Parent Households |
| No Children | 0 (0.0%) | 0 (0.0%) |
| 1 or 2 Children | 6 (25.0%) | 0 (0.0%) |
| 3 or 4 Children | 0 (0.0%) | 0 (0.0%) |
| 5 or more Children | 0 (0.0%) | 0 (0.0%) |
| Total | 6 (21.4%) | 0 (0.0%) |
Race in Max
The most populous races in Max are , and White / Caucasian (149 | 100.0%).
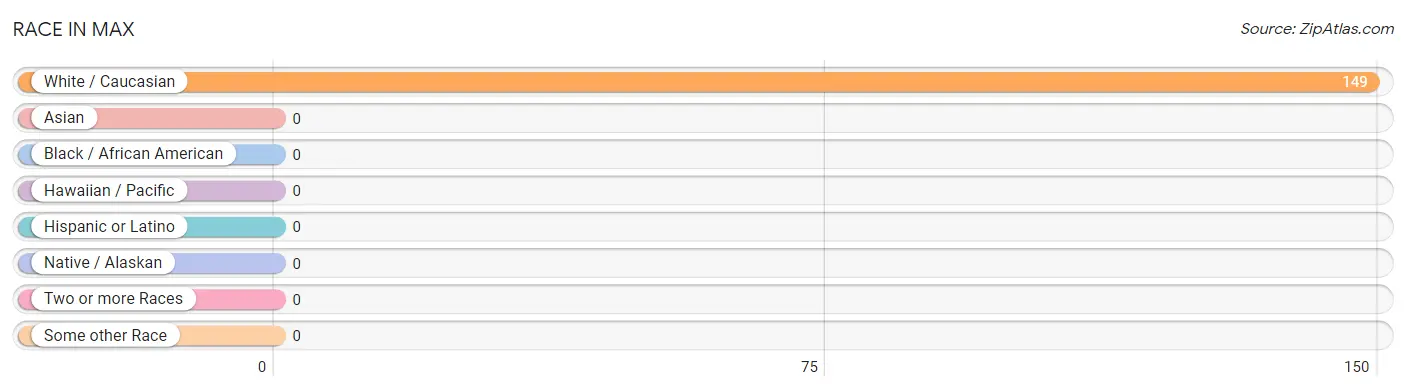
| Race | # Population | % Population |
| Asian | 0 | 0.0% |
| Black / African American | 0 | 0.0% |
| Hawaiian / Pacific | 0 | 0.0% |
| Hispanic or Latino | 0 | 0.0% |
| Native / Alaskan | 0 | 0.0% |
| White / Caucasian | 149 | 100.0% |
| Two or more Races | 0 | 0.0% |
| Some other Race | 0 | 0.0% |
| Total | 149 | 100.0% |
Ancestry in Max
The most populous ancestries reported in Max are American (29 | 19.5%), and German (7 | 4.7%), together accounting for 24.2% of all Max residents.
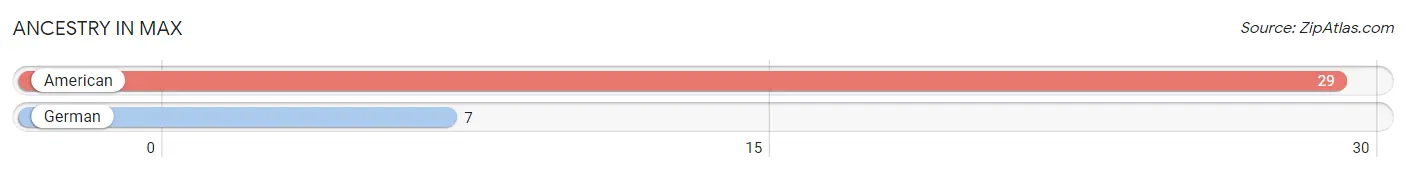
| Ancestry | # Population | % Population |
| American | 29 | 19.5% |
| German | 7 | 4.7% | View All 2 Rows |
Immigrants in Max

| Immigration Origin | # Population | % Population | View All 0 Rows |
Sex and Age in Max
Sex and Age in Max
The most populous age groups in Max are 10 to 14 Years (25 | 29.8%) for men and 20 to 24 Years (30 | 46.2%) for women.
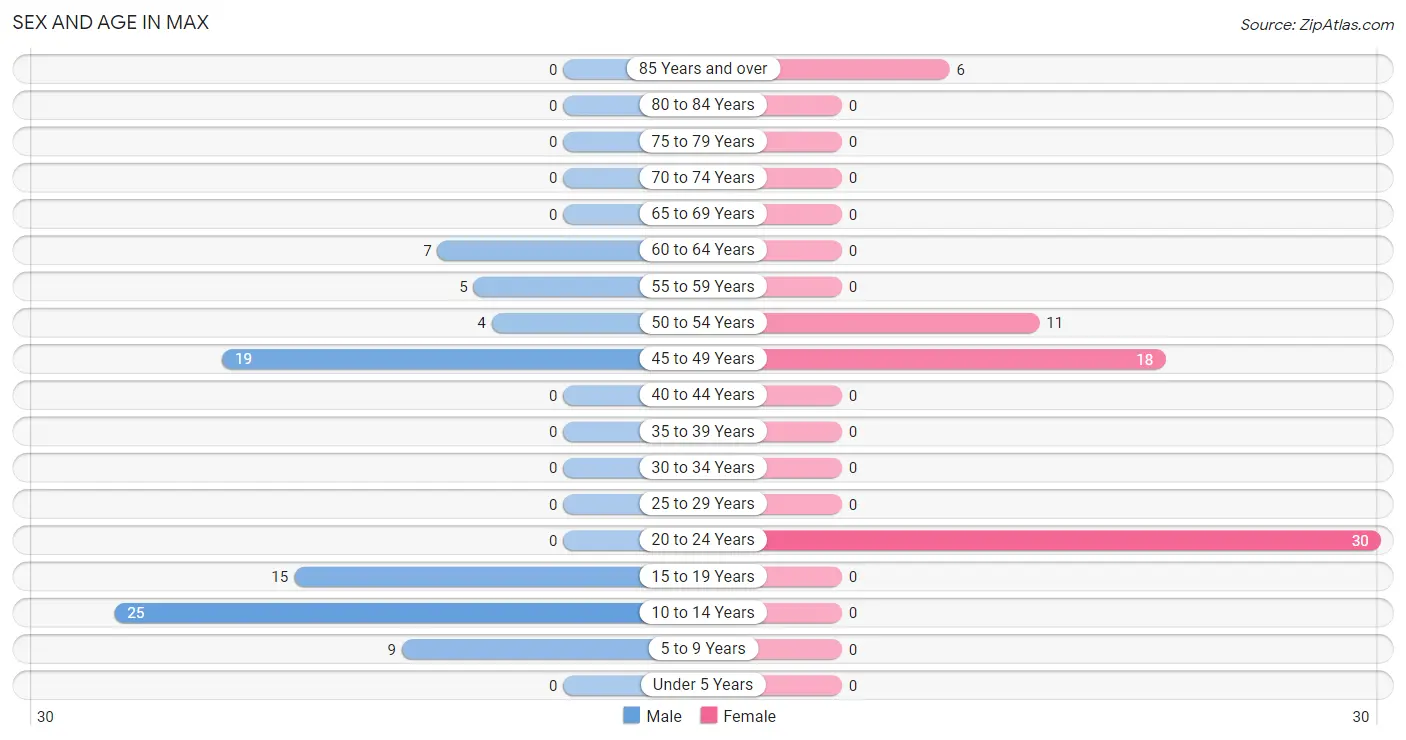
| Age Bracket | Male | Female |
| Under 5 Years | 0 (0.0%) | 0 (0.0%) |
| 5 to 9 Years | 9 (10.7%) | 0 (0.0%) |
| 10 to 14 Years | 25 (29.8%) | 0 (0.0%) |
| 15 to 19 Years | 15 (17.9%) | 0 (0.0%) |
| 20 to 24 Years | 0 (0.0%) | 30 (46.2%) |
| 25 to 29 Years | 0 (0.0%) | 0 (0.0%) |
| 30 to 34 Years | 0 (0.0%) | 0 (0.0%) |
| 35 to 39 Years | 0 (0.0%) | 0 (0.0%) |
| 40 to 44 Years | 0 (0.0%) | 0 (0.0%) |
| 45 to 49 Years | 19 (22.6%) | 18 (27.7%) |
| 50 to 54 Years | 4 (4.8%) | 11 (16.9%) |
| 55 to 59 Years | 5 (5.9%) | 0 (0.0%) |
| 60 to 64 Years | 7 (8.3%) | 0 (0.0%) |
| 65 to 69 Years | 0 (0.0%) | 0 (0.0%) |
| 70 to 74 Years | 0 (0.0%) | 0 (0.0%) |
| 75 to 79 Years | 0 (0.0%) | 0 (0.0%) |
| 80 to 84 Years | 0 (0.0%) | 0 (0.0%) |
| 85 Years and over | 0 (0.0%) | 6 (9.2%) |
| Total | 84 (100.0%) | 65 (100.0%) |
Families and Households in Max
Median Family Size in Max
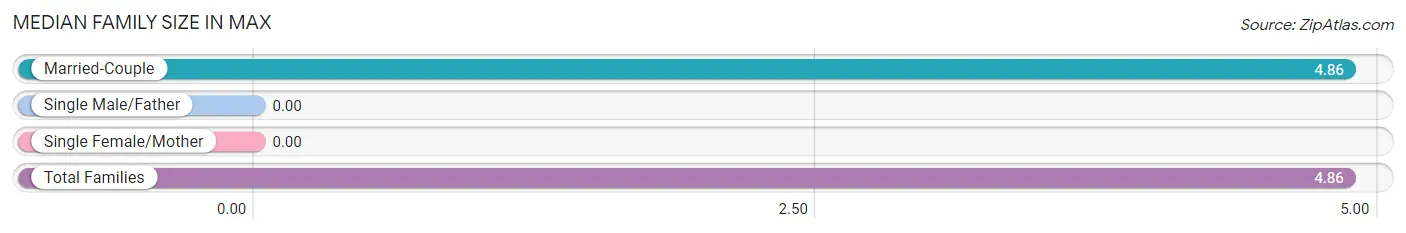
| Family Type | # Families | Family Size |
| Married-Couple | 28 (100.0%) | 4.86 |
| Single Male/Father | 0 (0.0%) | - |
| Single Female/Mother | 0 (0.0%) | - |
| Total Families | 28 (100.0%) | 4.86 |
Median Household Size in Max
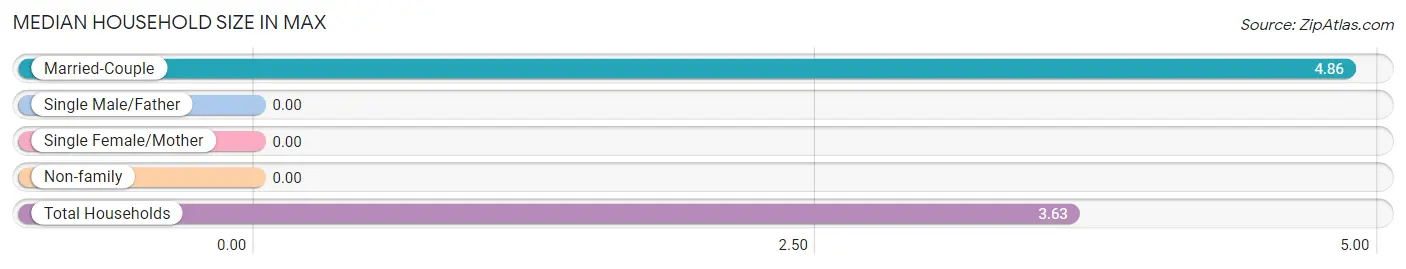
| Household Type | # Households | Household Size |
| Married-Couple | 28 (68.3%) | 4.86 |
| Single Male/Father | 0 (0.0%) | - |
| Single Female/Mother | 0 (0.0%) | - |
| Non-family | 13 (31.7%) | - |
| Total Households | 41 (100.0%) | 3.63 |
Household Size by Marriage Status in Max
Out of a total of 41 households in Max, 28 (68.3%) are family households, while 13 (31.7%) are nonfamily households. The most numerous type of family households are 5-person households, comprising 18, and the most common type of nonfamily households are 1-person households, comprising 13.
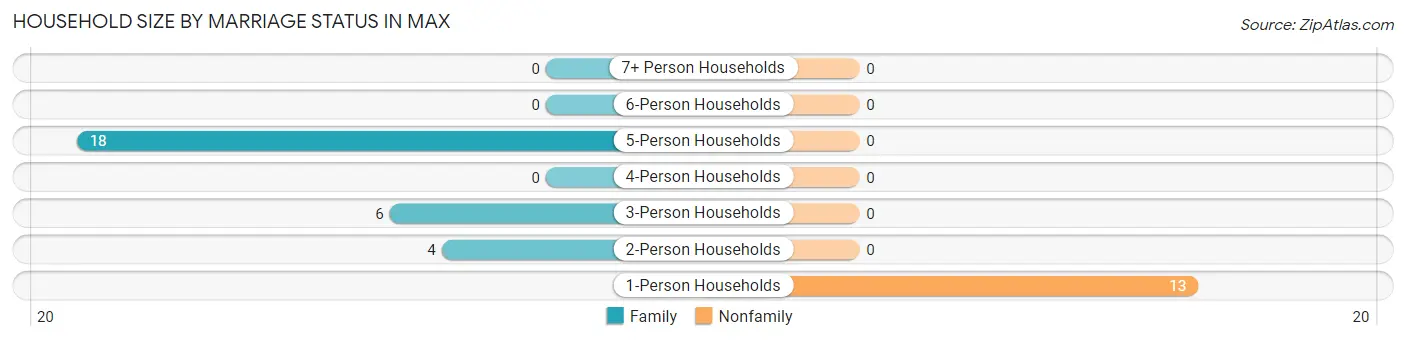
| Household Size | Family Households | Nonfamily Households |
| 1-Person Households | - | 13 (31.7%) |
| 2-Person Households | 4 (9.8%) | 0 (0.0%) |
| 3-Person Households | 6 (14.6%) | 0 (0.0%) |
| 4-Person Households | 0 (0.0%) | 0 (0.0%) |
| 5-Person Households | 18 (43.9%) | 0 (0.0%) |
| 6-Person Households | 0 (0.0%) | 0 (0.0%) |
| 7+ Person Households | 0 (0.0%) | 0 (0.0%) |
| Total | 28 (68.3%) | 13 (31.7%) |
Female Fertility in Max
Fertility by Age in Max
| Age Bracket | Women with Births | Births / 1,000 Women |
| 15 to 19 years | 0 (0.0%) | 0.0 |
| 20 to 34 years | 0 (0.0%) | 0.0 |
| 35 to 50 years | 0 (0.0%) | 0.0 |
| Total | 0 (0.0%) | 0.0 |
Fertility by Age by Marriage Status in Max
| Age Bracket | Married | Unmarried |
| 15 to 19 years | 0 (0.0%) | 0 (0.0%) |
| 20 to 34 years | 0 (0.0%) | 0 (0.0%) |
| 35 to 50 years | 0 (0.0%) | 0 (0.0%) |
| Total | 0 (0.0%) | 0 (0.0%) |
Fertility by Education in Max
| Educational Attainment | Women with Births | Births / 1,000 Women |
| Less than High School | 0 (0.0%) | 0.0 |
| High School Diploma | 0 (0.0%) | 0.0 |
| College or Associate's Degree | 0 (0.0%) | 0.0 |
| Bachelor's Degree | 0 (0.0%) | 0.0 |
| Graduate Degree | 0 (0.0%) | 0.0 |
| Total | 0 (0.0%) | 0.0 |
Fertility by Education by Marriage Status in Max
| Educational Attainment | Married | Unmarried |
| Less than High School | 0 (0.0%) | 0 (0.0%) |
| High School Diploma | 0 (0.0%) | 0 (0.0%) |
| College or Associate's Degree | 0 (0.0%) | 0 (0.0%) |
| Bachelor's Degree | 0 (0.0%) | 0 (0.0%) |
| Graduate Degree | 0 (0.0%) | 0 (0.0%) |
| Total | 0 (0.0%) | 0 (0.0%) |
Employment Characteristics in Max
Employment by Class of Employer in Max
Among the 83 employed individuals in Max, state government employees (30 | 36.1%), private company employees (25 | 30.1%), and self-employed (incorporated) (19 | 22.9%) make up the most common classes of employment.
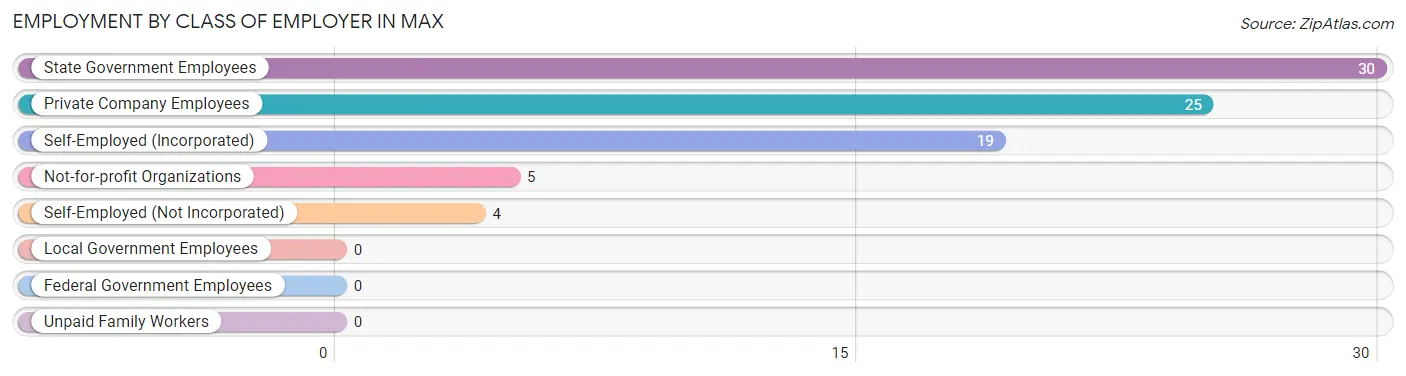
| Employer Class | # Employees | % Employees |
| Private Company Employees | 25 | 30.1% |
| Self-Employed (Incorporated) | 19 | 22.9% |
| Self-Employed (Not Incorporated) | 4 | 4.8% |
| Not-for-profit Organizations | 5 | 6.0% |
| Local Government Employees | 0 | 0.0% |
| State Government Employees | 30 | 36.1% |
| Federal Government Employees | 0 | 0.0% |
| Unpaid Family Workers | 0 | 0.0% |
| Total | 83 | 100.0% |
Employment Status by Age in Max
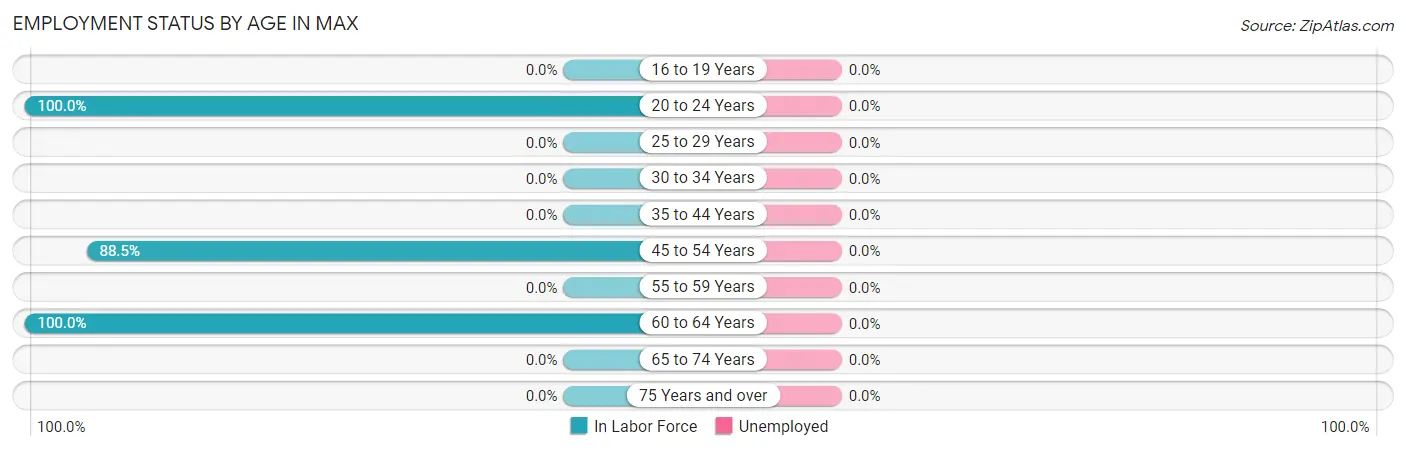
| Age Bracket | In Labor Force | Unemployed |
| 16 to 19 Years | 0 (0.0%) | 0 (0.0%) |
| 20 to 24 Years | 30 (100.0%) | 0 (0.0%) |
| 25 to 29 Years | 0 (0.0%) | 0 (0.0%) |
| 30 to 34 Years | 0 (0.0%) | 0 (0.0%) |
| 35 to 44 Years | 0 (0.0%) | 0 (0.0%) |
| 45 to 54 Years | 46 (88.5%) | 0 (0.0%) |
| 55 to 59 Years | 0 (0.0%) | 0 (0.0%) |
| 60 to 64 Years | 7 (100.0%) | 0 (0.0%) |
| 65 to 74 Years | 0 (0.0%) | 0 (0.0%) |
| 75 Years and over | 0 (0.0%) | 0 (0.0%) |
| Total | 83 (72.2%) | 0 (0.0%) |
Employment Status by Educational Attainment in Max
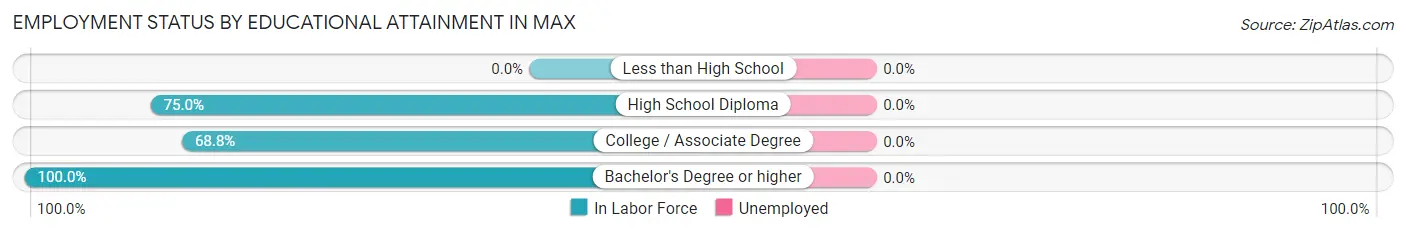
| Educational Attainment | In Labor Force | Unemployed |
| Less than High School | 0 (0.0%) | 0 (0.0%) |
| High School Diploma | 18 (75.0%) | 0 (0.0%) |
| College / Associate Degree | 11 (68.8%) | 0 (0.0%) |
| Bachelor's Degree or higher | 24 (100.0%) | 0 (0.0%) |
| Total | 53 (82.8%) | 0 (0.0%) |
Employment Occupations by Sex in Max
Management, Business, Science and Arts Occupations
The most common Management, Business, Science and Arts occupations in Max are Health Diagnosing & Treating (19 | 22.9%), Health Technologists (19 | 22.9%), and Management (5 | 6.0%).
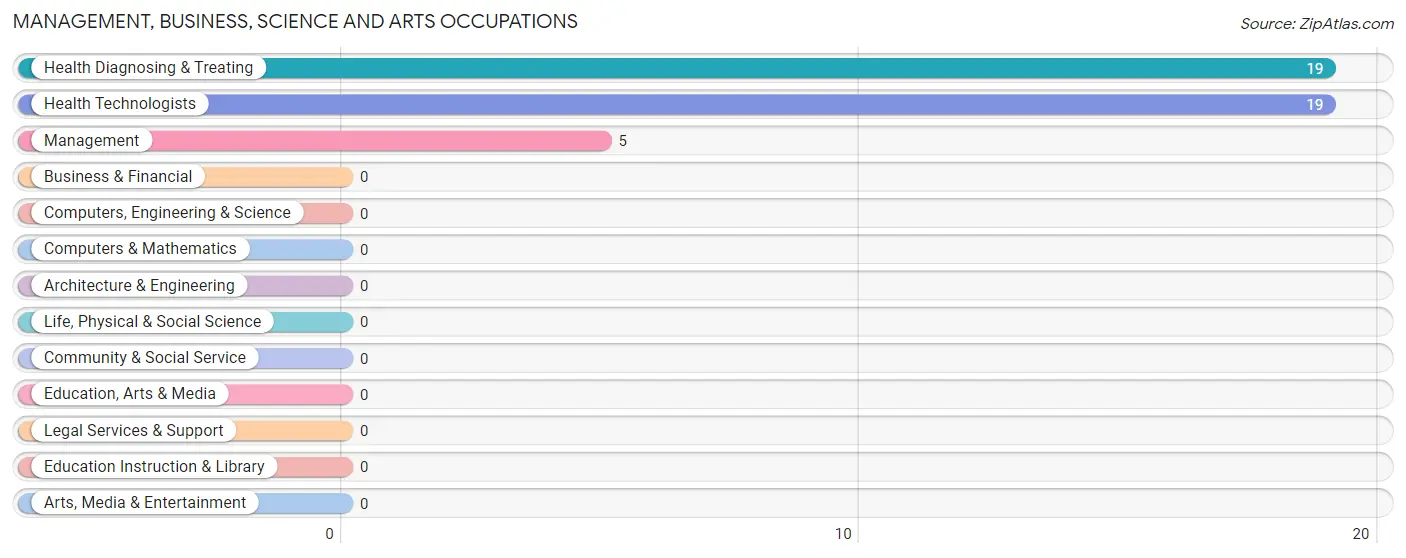
Management, Business, Science and Arts Occupations by Sex
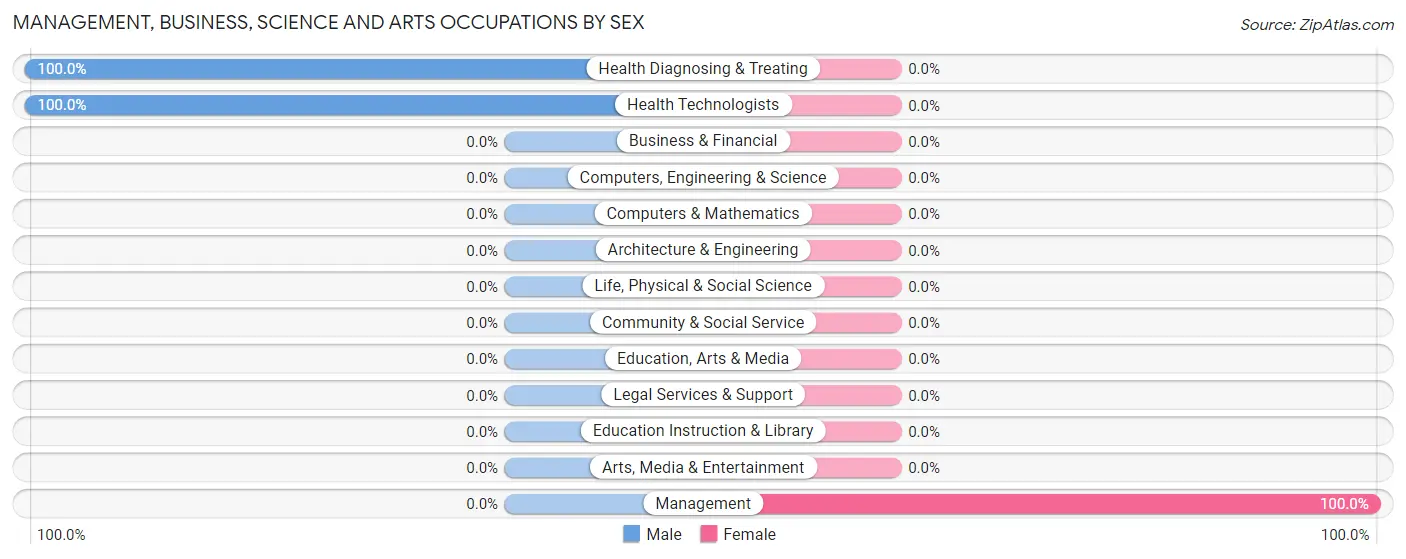
| Occupation | Male | Female |
| Management | 0 (0.0%) | 5 (100.0%) |
| Business & Financial | 0 (0.0%) | 0 (0.0%) |
| Computers, Engineering & Science | 0 (0.0%) | 0 (0.0%) |
| Computers & Mathematics | 0 (0.0%) | 0 (0.0%) |
| Architecture & Engineering | 0 (0.0%) | 0 (0.0%) |
| Life, Physical & Social Science | 0 (0.0%) | 0 (0.0%) |
| Community & Social Service | 0 (0.0%) | 0 (0.0%) |
| Education, Arts & Media | 0 (0.0%) | 0 (0.0%) |
| Legal Services & Support | 0 (0.0%) | 0 (0.0%) |
| Education Instruction & Library | 0 (0.0%) | 0 (0.0%) |
| Arts, Media & Entertainment | 0 (0.0%) | 0 (0.0%) |
| Health Diagnosing & Treating | 19 (100.0%) | 0 (0.0%) |
| Health Technologists | 19 (100.0%) | 0 (0.0%) |
| Total (Category) | 19 (79.2%) | 5 (20.8%) |
| Total (Overall) | 30 (36.1%) | 53 (63.9%) |
Services Occupations
Services Occupations by Sex
| Occupation | Male | Female |
| Healthcare Support | 0 (0.0%) | 0 (0.0%) |
| Security & Protection | 0 (0.0%) | 0 (0.0%) |
| Firefighting & Prevention | 0 (0.0%) | 0 (0.0%) |
| Law Enforcement | 0 (0.0%) | 0 (0.0%) |
| Food Preparation & Serving | 0 (0.0%) | 0 (0.0%) |
| Cleaning & Maintenance | 0 (0.0%) | 0 (0.0%) |
| Personal Care & Service | 0 (0.0%) | 0 (0.0%) |
| Total (Category) | 0 (0.0%) | 0 (0.0%) |
| Total (Overall) | 30 (36.1%) | 53 (63.9%) |
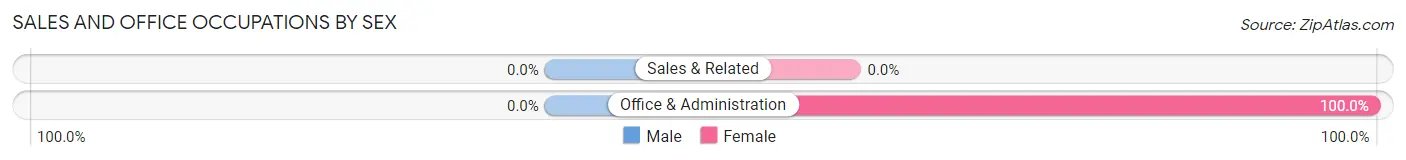
Sales and Office Occupations
The most common Sales and Office occupations in Max are , and Office & Administration (48 | 57.8%).
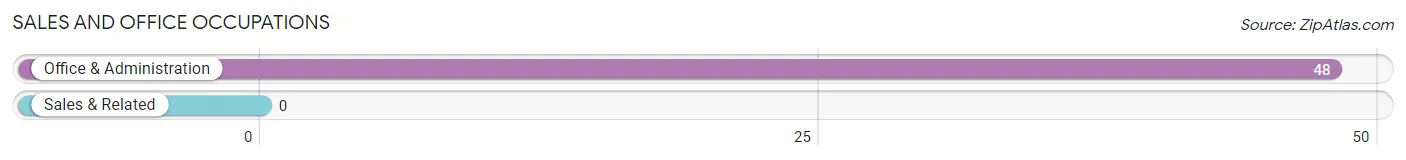
Sales and Office Occupations by Sex
| Occupation | Male | Female |
| Sales & Related | 0 (0.0%) | 0 (0.0%) |
| Office & Administration | 0 (0.0%) | 48 (100.0%) |
| Total (Category) | 0 (0.0%) | 48 (100.0%) |
| Total (Overall) | 30 (36.1%) | 53 (63.9%) |
Natural Resources, Construction and Maintenance Occupations
The most common Natural Resources, Construction and Maintenance occupations in Max are , and Construction & Extraction (4 | 4.8%).
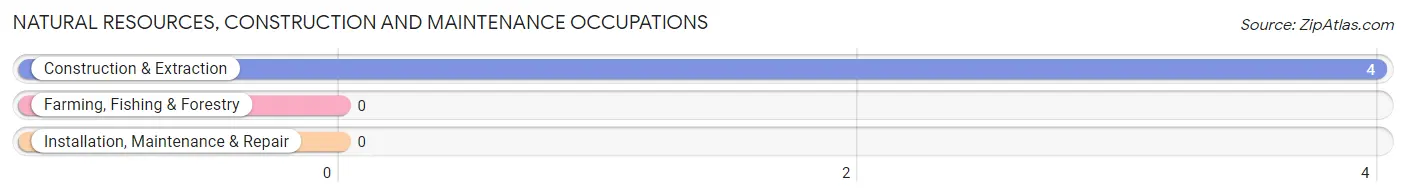
Natural Resources, Construction and Maintenance Occupations by Sex
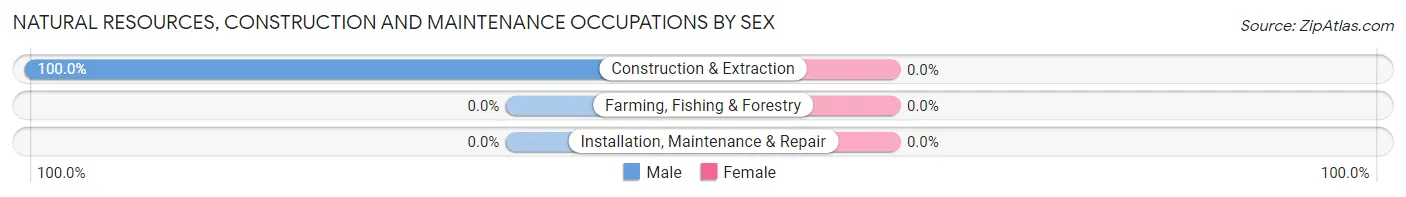
| Occupation | Male | Female |
| Farming, Fishing & Forestry | 0 (0.0%) | 0 (0.0%) |
| Construction & Extraction | 4 (100.0%) | 0 (0.0%) |
| Installation, Maintenance & Repair | 0 (0.0%) | 0 (0.0%) |
| Total (Category) | 4 (100.0%) | 0 (0.0%) |
| Total (Overall) | 30 (36.1%) | 53 (63.9%) |
Production, Transportation and Moving Occupations
The most common Production, Transportation and Moving occupations in Max are , and Production (7 | 8.4%).
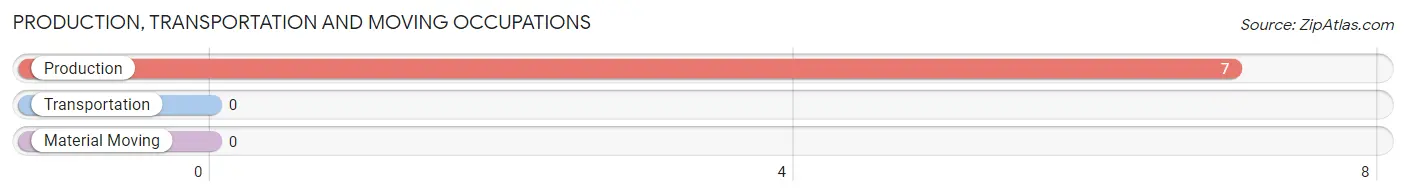
Production, Transportation and Moving Occupations by Sex
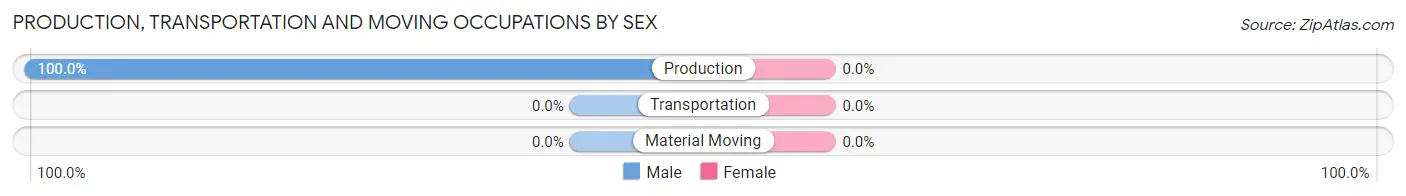
| Occupation | Male | Female |
| Production | 7 (100.0%) | 0 (0.0%) |
| Transportation | 0 (0.0%) | 0 (0.0%) |
| Material Moving | 0 (0.0%) | 0 (0.0%) |
| Total (Category) | 7 (100.0%) | 0 (0.0%) |
| Total (Overall) | 30 (36.1%) | 53 (63.9%) |
Employment Industries by Sex in Max
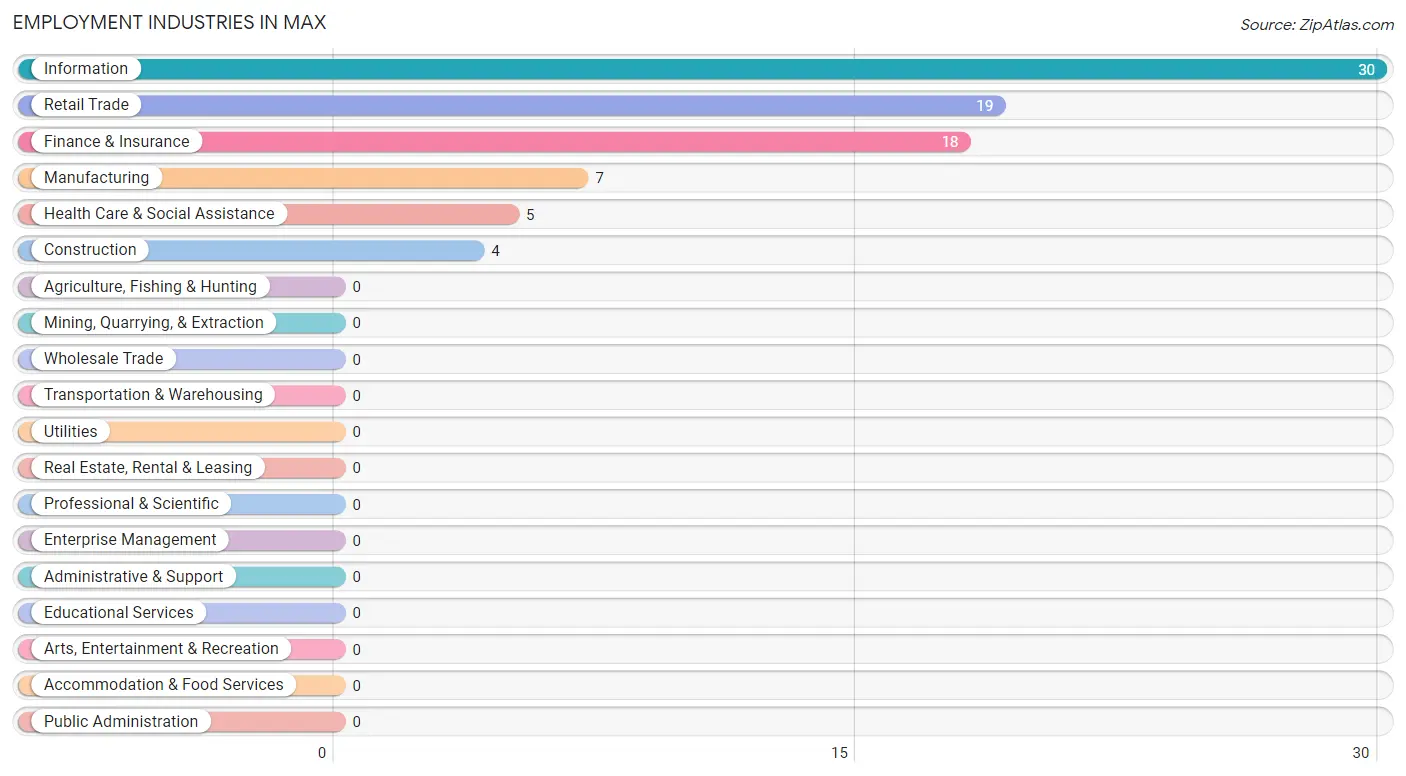
Employment Industries in Max
The major employment industries in Max include Information (30 | 36.1%), Retail Trade (19 | 22.9%), Finance & Insurance (18 | 21.7%), Manufacturing (7 | 8.4%), and Health Care & Social Assistance (5 | 6.0%).
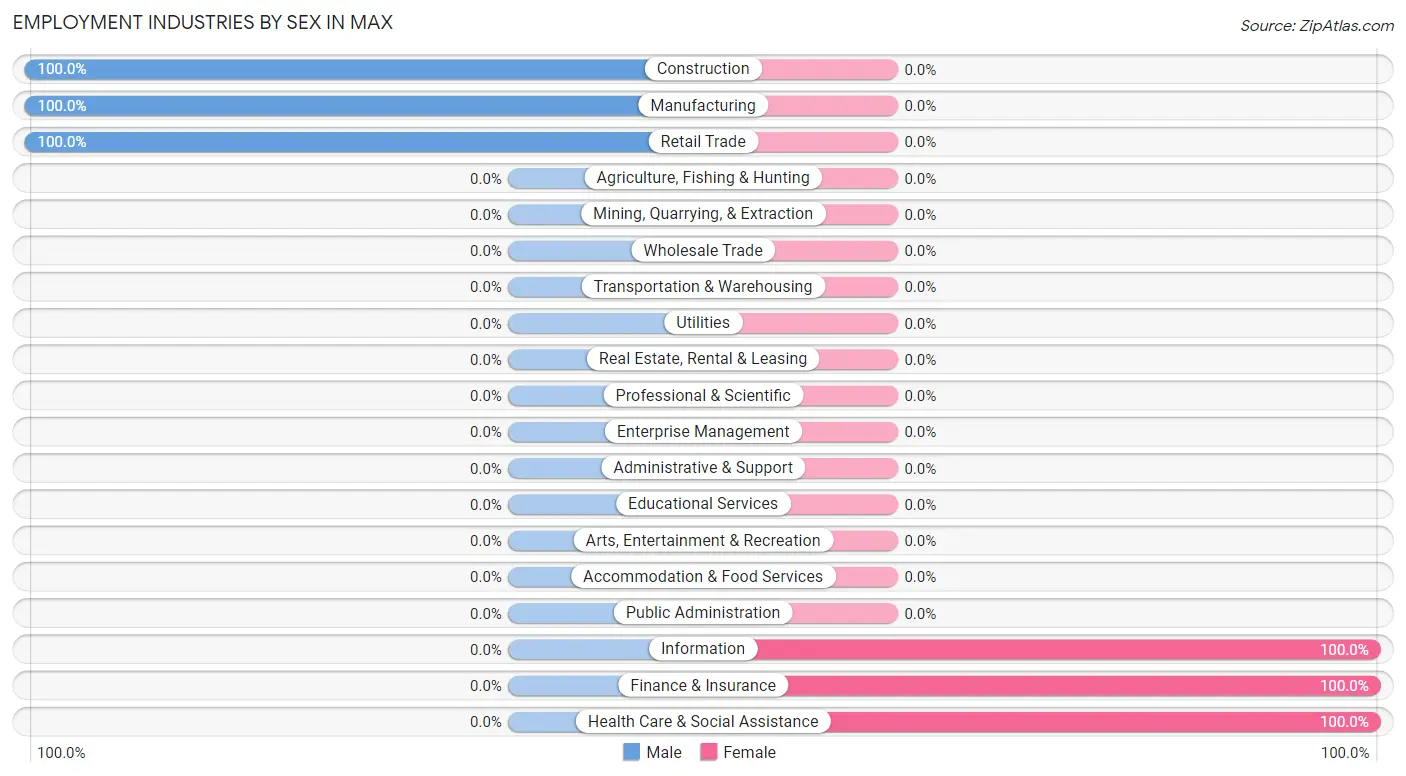
Employment Industries by Sex in Max
The Max industries that see more men than women are Construction (100.0%), Manufacturing (100.0%), and Retail Trade (100.0%), whereas the industries that tend to have a higher number of women are Information (100.0%), Finance & Insurance (100.0%), and Health Care & Social Assistance (100.0%).
| Industry | Male | Female |
| Agriculture, Fishing & Hunting | 0 (0.0%) | 0 (0.0%) |
| Mining, Quarrying, & Extraction | 0 (0.0%) | 0 (0.0%) |
| Construction | 4 (100.0%) | 0 (0.0%) |
| Manufacturing | 7 (100.0%) | 0 (0.0%) |
| Wholesale Trade | 0 (0.0%) | 0 (0.0%) |
| Retail Trade | 19 (100.0%) | 0 (0.0%) |
| Transportation & Warehousing | 0 (0.0%) | 0 (0.0%) |
| Utilities | 0 (0.0%) | 0 (0.0%) |
| Information | 0 (0.0%) | 30 (100.0%) |
| Finance & Insurance | 0 (0.0%) | 18 (100.0%) |
| Real Estate, Rental & Leasing | 0 (0.0%) | 0 (0.0%) |
| Professional & Scientific | 0 (0.0%) | 0 (0.0%) |
| Enterprise Management | 0 (0.0%) | 0 (0.0%) |
| Administrative & Support | 0 (0.0%) | 0 (0.0%) |
| Educational Services | 0 (0.0%) | 0 (0.0%) |
| Health Care & Social Assistance | 0 (0.0%) | 5 (100.0%) |
| Arts, Entertainment & Recreation | 0 (0.0%) | 0 (0.0%) |
| Accommodation & Food Services | 0 (0.0%) | 0 (0.0%) |
| Public Administration | 0 (0.0%) | 0 (0.0%) |
| Total | 30 (36.1%) | 53 (63.9%) |
Education in Max
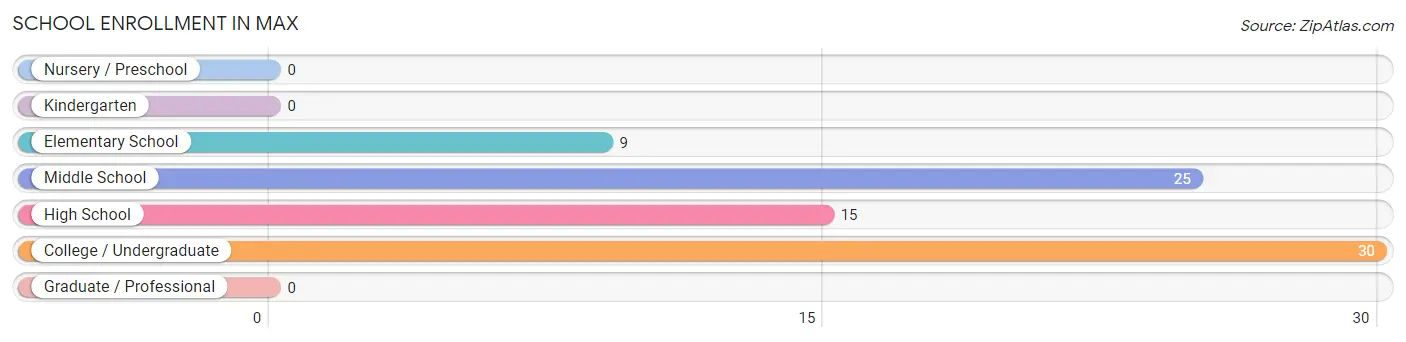
School Enrollment in Max
The most common levels of schooling among the 79 students in Max are college / undergraduate (30 | 38.0%), middle school (25 | 31.7%), and high school (15 | 19.0%).
| School Level | # Students | % Students |
| Nursery / Preschool | 0 | 0.0% |
| Kindergarten | 0 | 0.0% |
| Elementary School | 9 | 11.4% |
| Middle School | 25 | 31.7% |
| High School | 15 | 19.0% |
| College / Undergraduate | 30 | 38.0% |
| Graduate / Professional | 0 | 0.0% |
| Total | 79 | 100.0% |
School Enrollment by Age by Funding Source in Max
Out of a total of 79 students who are enrolled in schools in Max, 24 (30.4%) attend a private institution, while the remaining 55 (69.6%) are enrolled in public schools. The age group of 5 to 9 year old has the highest likelihood of being enrolled in private schools, with 9 (100.0% in the age bracket) enrolled. Conversely, the age group of 10 to 14 year olds has the lowest likelihood of being enrolled in a private school, with 25 (100.0% in the age bracket) attending a public institution.
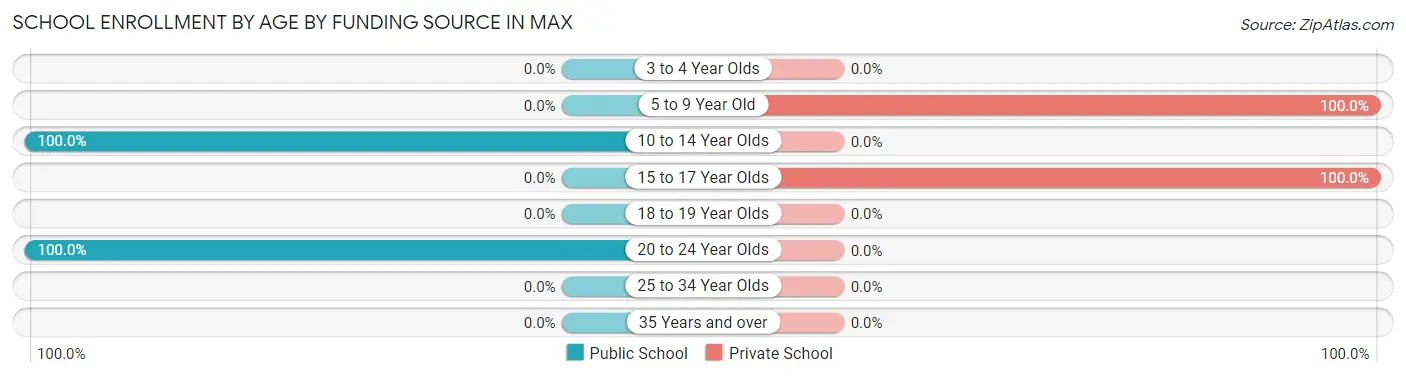
| Age Bracket | Public School | Private School |
| 3 to 4 Year Olds | 0 (0.0%) | 0 (0.0%) |
| 5 to 9 Year Old | 0 (0.0%) | 9 (100.0%) |
| 10 to 14 Year Olds | 25 (100.0%) | 0 (0.0%) |
| 15 to 17 Year Olds | 0 (0.0%) | 15 (100.0%) |
| 18 to 19 Year Olds | 0 (0.0%) | 0 (0.0%) |
| 20 to 24 Year Olds | 30 (100.0%) | 0 (0.0%) |
| 25 to 34 Year Olds | 0 (0.0%) | 0 (0.0%) |
| 35 Years and over | 0 (0.0%) | 0 (0.0%) |
| Total | 55 (69.6%) | 24 (30.4%) |
Educational Attainment by Field of Study in Max
Physical & health sciences (19 | 79.2%), and communications (5 | 20.8%) are the most common fields of study among 24 individuals in Max who have obtained a bachelor's degree or higher.
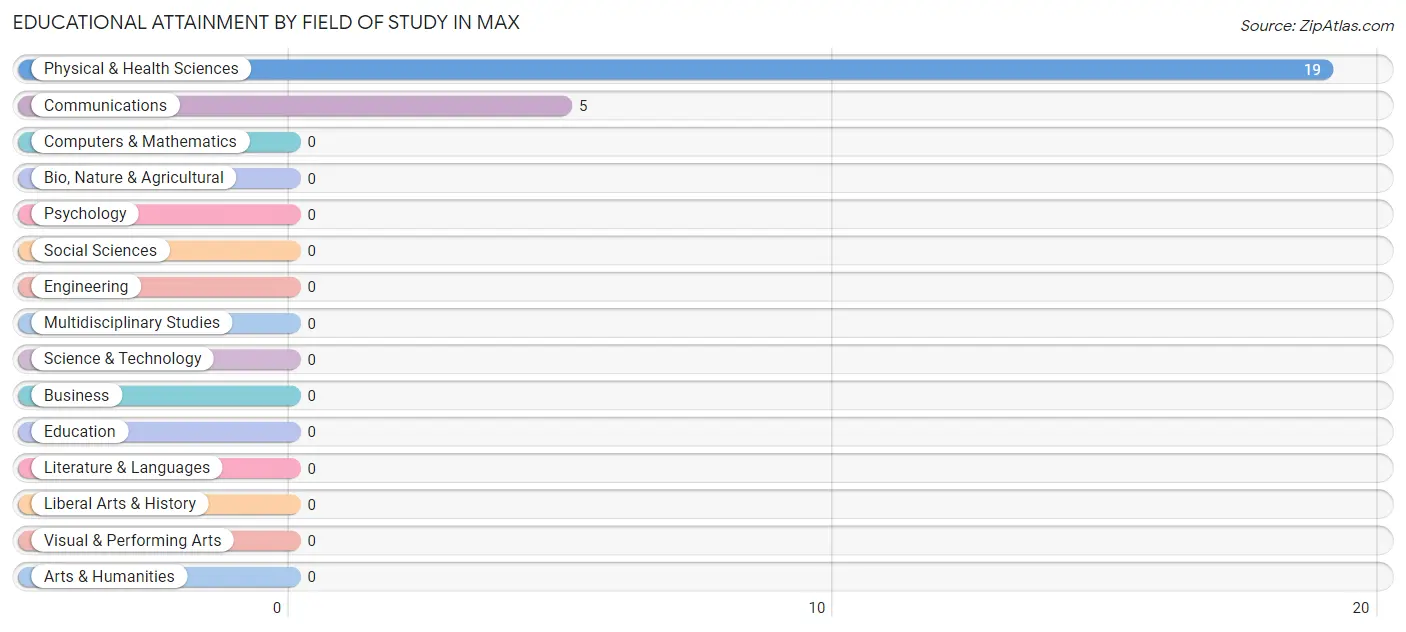
| Field of Study | # Graduates | % Graduates |
| Computers & Mathematics | 0 | 0.0% |
| Bio, Nature & Agricultural | 0 | 0.0% |
| Physical & Health Sciences | 19 | 79.2% |
| Psychology | 0 | 0.0% |
| Social Sciences | 0 | 0.0% |
| Engineering | 0 | 0.0% |
| Multidisciplinary Studies | 0 | 0.0% |
| Science & Technology | 0 | 0.0% |
| Business | 0 | 0.0% |
| Education | 0 | 0.0% |
| Literature & Languages | 0 | 0.0% |
| Liberal Arts & History | 0 | 0.0% |
| Visual & Performing Arts | 0 | 0.0% |
| Communications | 5 | 20.8% |
| Arts & Humanities | 0 | 0.0% |
| Total | 24 | 100.0% |
Transportation & Commute in Max
Vehicle Availability by Sex in Max
The most prevalent vehicle ownership categories in Max are males with 1 vehicle (26, accounting for 86.7%) and females with 1 vehicle (48, making up 49.1%).
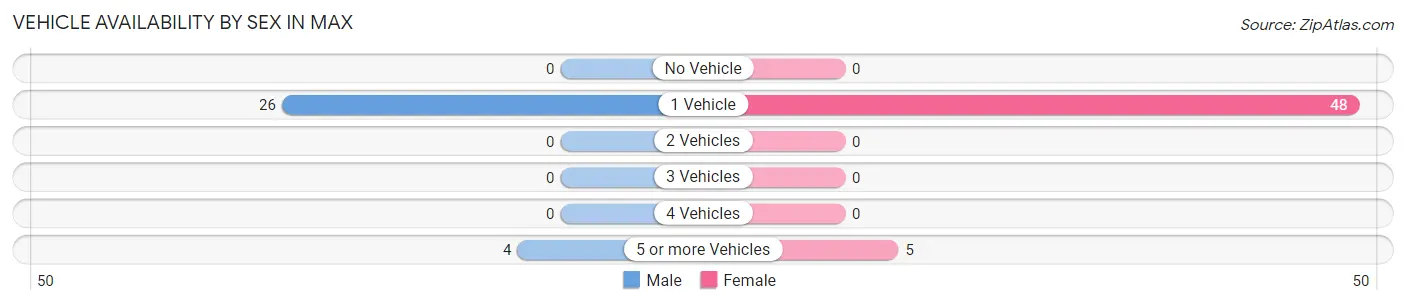
| Vehicles Available | Male | Female |
| No Vehicle | 0 (0.0%) | 0 (0.0%) |
| 1 Vehicle | 26 (86.7%) | 48 (90.6%) |
| 2 Vehicles | 0 (0.0%) | 0 (0.0%) |
| 3 Vehicles | 0 (0.0%) | 0 (0.0%) |
| 4 Vehicles | 0 (0.0%) | 0 (0.0%) |
| 5 or more Vehicles | 4 (13.3%) | 5 (9.4%) |
| Total | 30 (100.0%) | 53 (100.0%) |
Commute Time in Max
The most frequently occuring commute durations in Max are less than 5 minutes (30 commuters, 36.1%), 35 to 39 minutes (26 commuters, 31.3%), and 15 to 19 minutes (18 commuters, 21.7%).
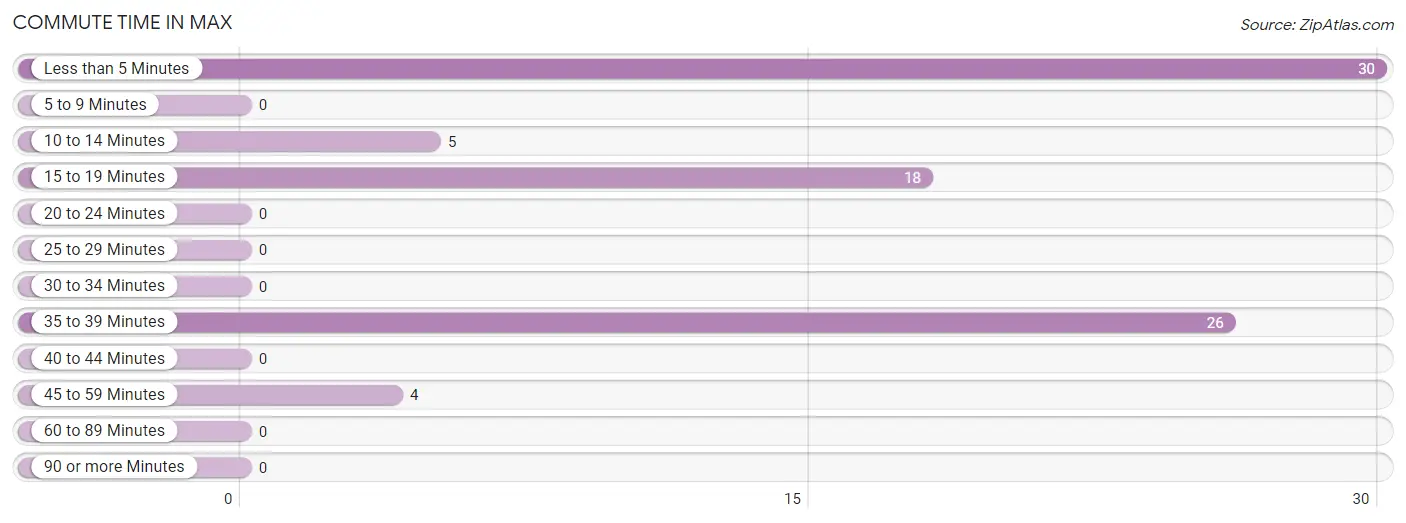
| Commute Time | # Commuters | % Commuters |
| Less than 5 Minutes | 30 | 36.1% |
| 5 to 9 Minutes | 0 | 0.0% |
| 10 to 14 Minutes | 5 | 6.0% |
| 15 to 19 Minutes | 18 | 21.7% |
| 20 to 24 Minutes | 0 | 0.0% |
| 25 to 29 Minutes | 0 | 0.0% |
| 30 to 34 Minutes | 0 | 0.0% |
| 35 to 39 Minutes | 26 | 31.3% |
| 40 to 44 Minutes | 0 | 0.0% |
| 45 to 59 Minutes | 4 | 4.8% |
| 60 to 89 Minutes | 0 | 0.0% |
| 90 or more Minutes | 0 | 0.0% |
Commute Time by Sex in Max
The most common commute times in Max are 35 to 39 minutes (26 commuters, 86.7%) for males and less than 5 minutes (30 commuters, 56.6%) for females.
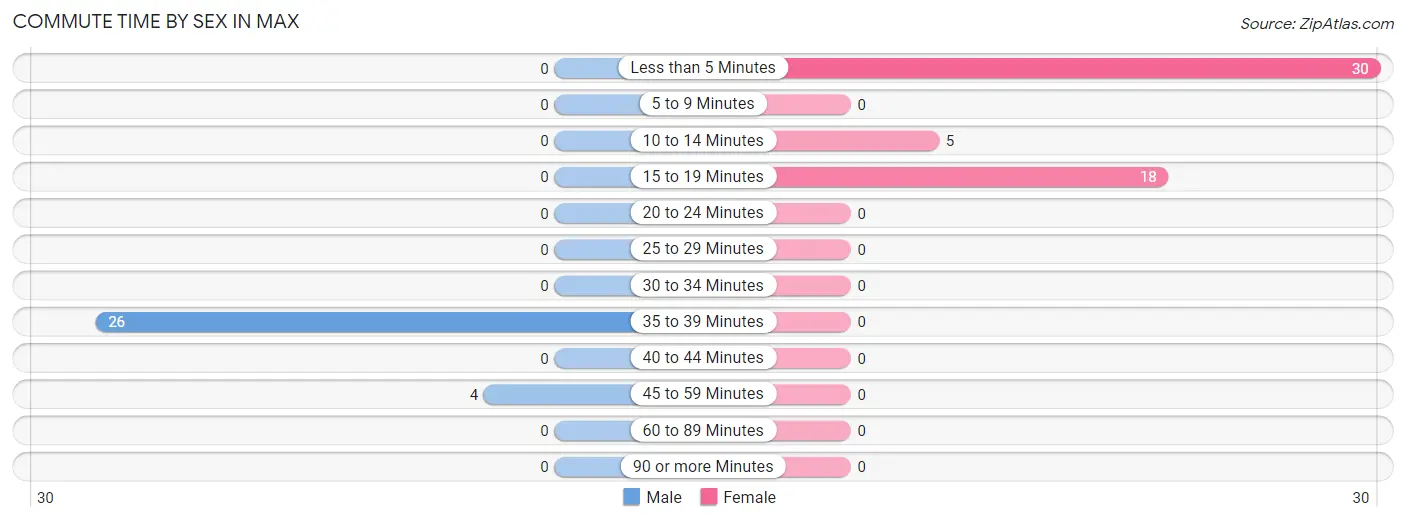
| Commute Time | Male | Female |
| Less than 5 Minutes | 0 (0.0%) | 30 (56.6%) |
| 5 to 9 Minutes | 0 (0.0%) | 0 (0.0%) |
| 10 to 14 Minutes | 0 (0.0%) | 5 (9.4%) |
| 15 to 19 Minutes | 0 (0.0%) | 18 (34.0%) |
| 20 to 24 Minutes | 0 (0.0%) | 0 (0.0%) |
| 25 to 29 Minutes | 0 (0.0%) | 0 (0.0%) |
| 30 to 34 Minutes | 0 (0.0%) | 0 (0.0%) |
| 35 to 39 Minutes | 26 (86.7%) | 0 (0.0%) |
| 40 to 44 Minutes | 0 (0.0%) | 0 (0.0%) |
| 45 to 59 Minutes | 4 (13.3%) | 0 (0.0%) |
| 60 to 89 Minutes | 0 (0.0%) | 0 (0.0%) |
| 90 or more Minutes | 0 (0.0%) | 0 (0.0%) |
Time of Departure to Work by Sex in Max
The most frequent times of departure to work in Max are 4:00 PM to 11:59 PM (26, 86.7%) for males and 7:00 AM to 7:29 AM (30, 56.6%) for females.
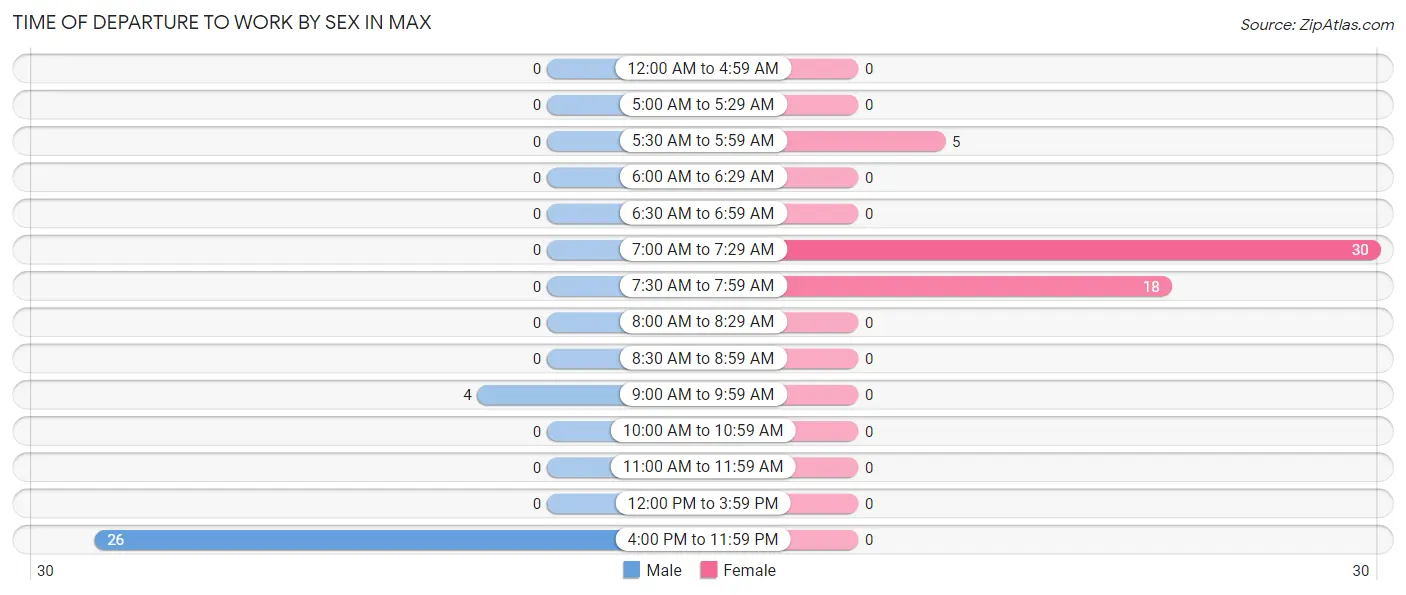
| Time of Departure | Male | Female |
| 12:00 AM to 4:59 AM | 0 (0.0%) | 0 (0.0%) |
| 5:00 AM to 5:29 AM | 0 (0.0%) | 0 (0.0%) |
| 5:30 AM to 5:59 AM | 0 (0.0%) | 5 (9.4%) |
| 6:00 AM to 6:29 AM | 0 (0.0%) | 0 (0.0%) |
| 6:30 AM to 6:59 AM | 0 (0.0%) | 0 (0.0%) |
| 7:00 AM to 7:29 AM | 0 (0.0%) | 30 (56.6%) |
| 7:30 AM to 7:59 AM | 0 (0.0%) | 18 (34.0%) |
| 8:00 AM to 8:29 AM | 0 (0.0%) | 0 (0.0%) |
| 8:30 AM to 8:59 AM | 0 (0.0%) | 0 (0.0%) |
| 9:00 AM to 9:59 AM | 4 (13.3%) | 0 (0.0%) |
| 10:00 AM to 10:59 AM | 0 (0.0%) | 0 (0.0%) |
| 11:00 AM to 11:59 AM | 0 (0.0%) | 0 (0.0%) |
| 12:00 PM to 3:59 PM | 0 (0.0%) | 0 (0.0%) |
| 4:00 PM to 11:59 PM | 26 (86.7%) | 0 (0.0%) |
| Total | 30 (100.0%) | 53 (100.0%) |
Housing Occupancy in Max
Occupancy by Ownership in Max
Of the total 41 dwellings in Max, owner-occupied units account for 41 (100.0%), while renter-occupied units make up 0 (0.0%).
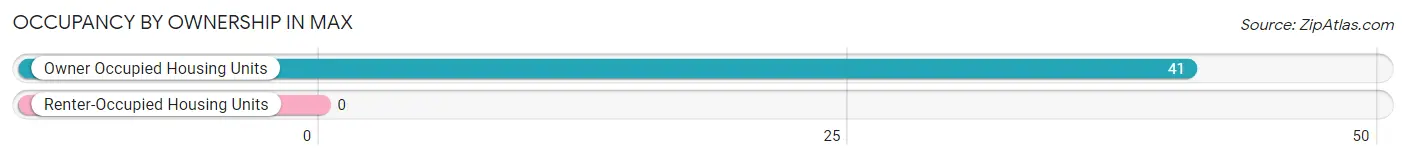
| Occupancy | # Housing Units | % Housing Units |
| Owner Occupied Housing Units | 41 | 100.0% |
| Renter-Occupied Housing Units | 0 | 0.0% |
| Total Occupied Housing Units | 41 | 100.0% |
Occupancy by Household Size in Max
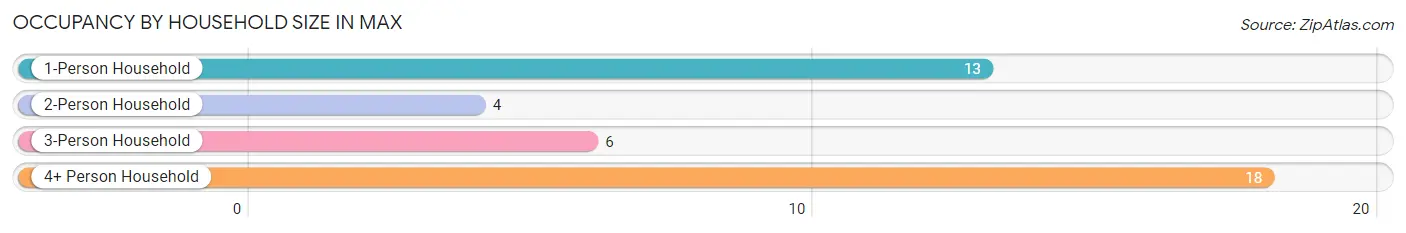
| Household Size | # Housing Units | % Housing Units |
| 1-Person Household | 13 | 31.7% |
| 2-Person Household | 4 | 9.8% |
| 3-Person Household | 6 | 14.6% |
| 4+ Person Household | 18 | 43.9% |
| Total Housing Units | 41 | 100.0% |
Occupancy by Ownership by Household Size in Max
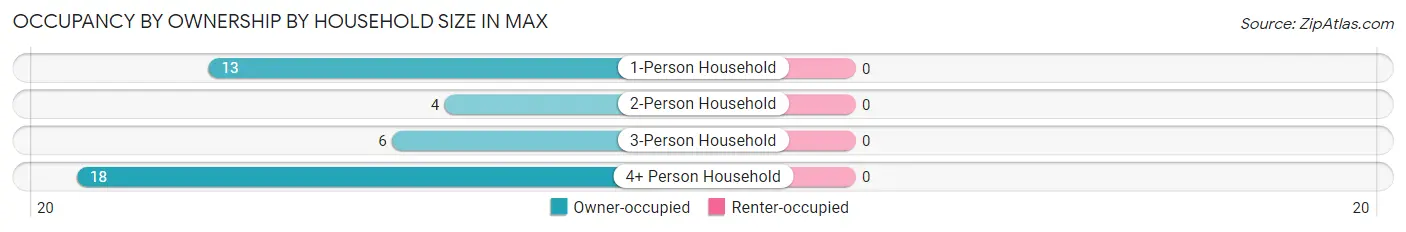
| Household Size | Owner-occupied | Renter-occupied |
| 1-Person Household | 13 (100.0%) | 0 (0.0%) |
| 2-Person Household | 4 (100.0%) | 0 (0.0%) |
| 3-Person Household | 6 (100.0%) | 0 (0.0%) |
| 4+ Person Household | 18 (100.0%) | 0 (0.0%) |
| Total Housing Units | 41 (100.0%) | 0 (0.0%) |
Occupancy by Educational Attainment in Max
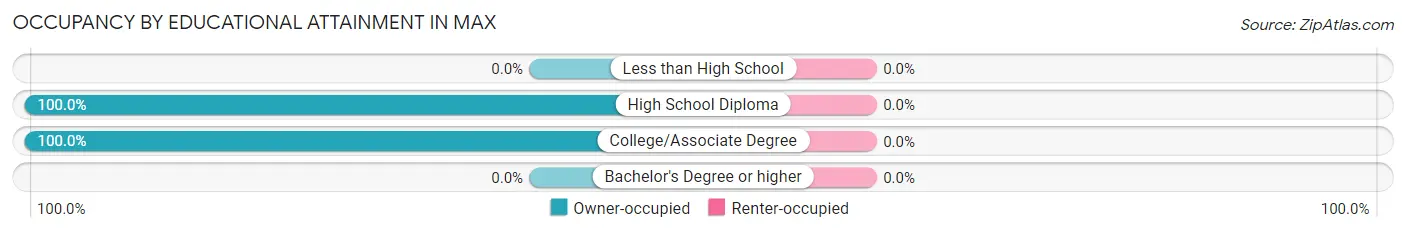
| Household Size | Owner-occupied | Renter-occupied |
| Less than High School | 0 (0.0%) | 0 (0.0%) |
| High School Diploma | 24 (100.0%) | 0 (0.0%) |
| College/Associate Degree | 17 (100.0%) | 0 (0.0%) |
| Bachelor's Degree or higher | 0 (0.0%) | 0 (0.0%) |
Occupancy by Age of Householder in Max
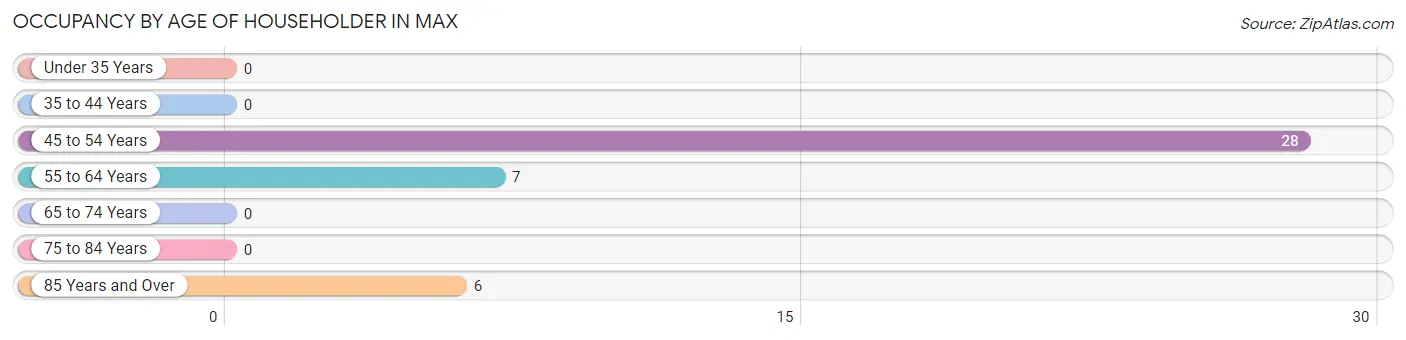
| Age Bracket | # Households | % Households |
| Under 35 Years | 0 | 0.0% |
| 35 to 44 Years | 0 | 0.0% |
| 45 to 54 Years | 28 | 68.3% |
| 55 to 64 Years | 7 | 17.1% |
| 65 to 74 Years | 0 | 0.0% |
| 75 to 84 Years | 0 | 0.0% |
| 85 Years and Over | 6 | 14.6% |
| Total | 41 | 100.0% |
Housing Finances in Max
Median Income by Occupancy in Max
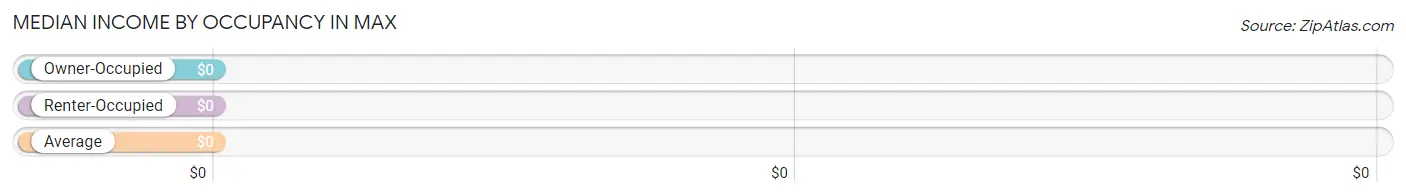
| Occupancy Type | # Households | Median Income |
| Owner-Occupied | 41 (100.0%) | $0 |
| Renter-Occupied | 0 (0.0%) | $0 |
| Average | 41 (100.0%) | $0 |
Occupancy by Householder Income Bracket in Max
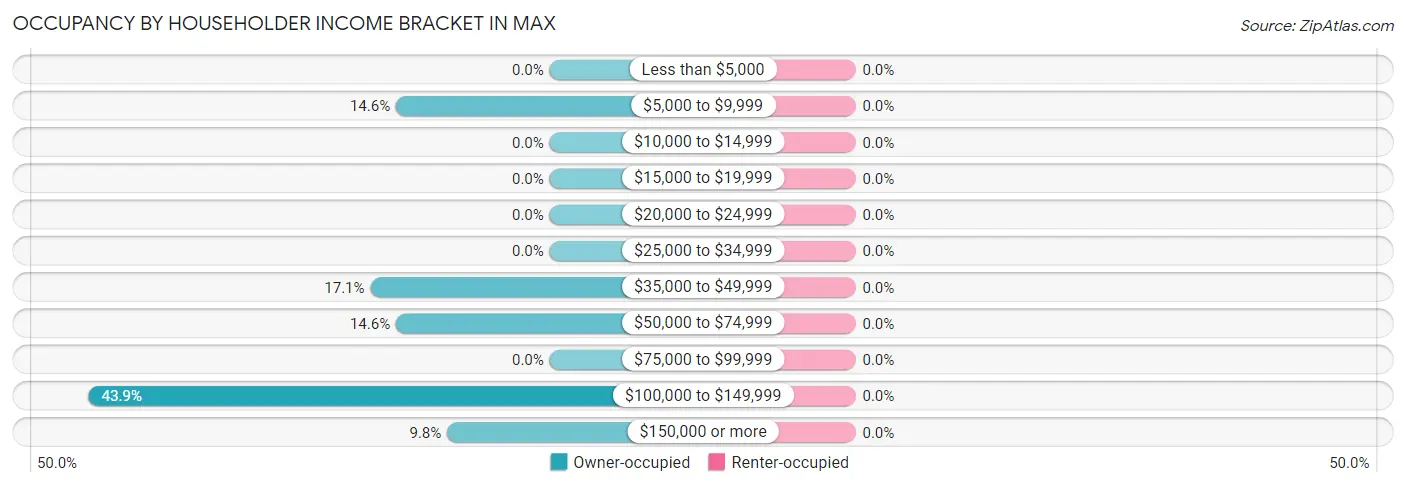
| Income Bracket | Owner-occupied | Renter-occupied |
| Less than $5,000 | 0 (0.0%) | 0 (0.0%) |
| $5,000 to $9,999 | 6 (14.6%) | 0 (0.0%) |
| $10,000 to $14,999 | 0 (0.0%) | 0 (0.0%) |
| $15,000 to $19,999 | 0 (0.0%) | 0 (0.0%) |
| $20,000 to $24,999 | 0 (0.0%) | 0 (0.0%) |
| $25,000 to $34,999 | 0 (0.0%) | 0 (0.0%) |
| $35,000 to $49,999 | 7 (17.1%) | 0 (0.0%) |
| $50,000 to $74,999 | 6 (14.6%) | 0 (0.0%) |
| $75,000 to $99,999 | 0 (0.0%) | 0 (0.0%) |
| $100,000 to $149,999 | 18 (43.9%) | 0 (0.0%) |
| $150,000 or more | 4 (9.8%) | 0 (0.0%) |
| Total | 41 (100.0%) | 0 (0.0%) |
Monthly Housing Cost Tiers in Max
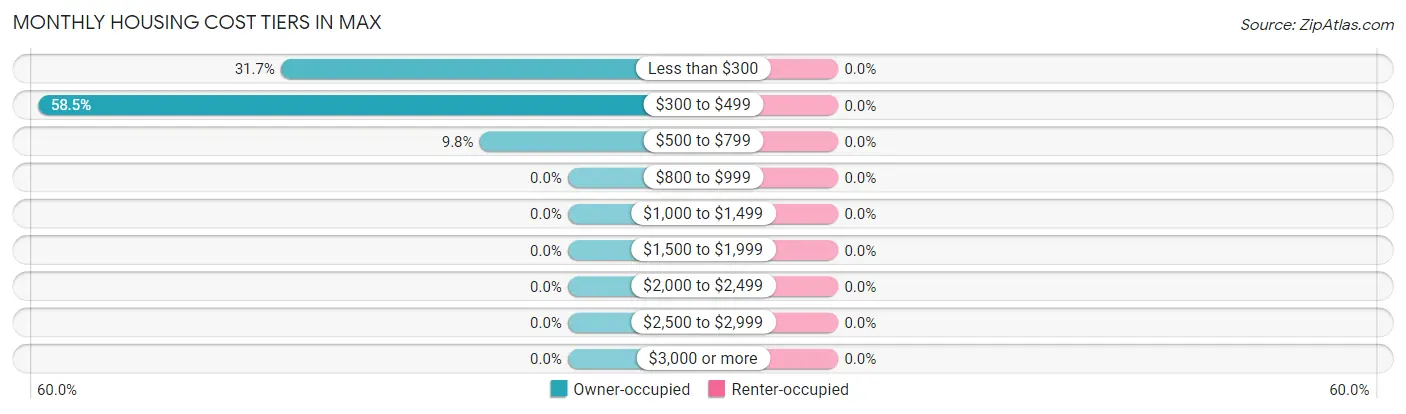
| Monthly Cost | Owner-occupied | Renter-occupied |
| Less than $300 | 13 (31.7%) | 0 (0.0%) |
| $300 to $499 | 24 (58.5%) | 0 (0.0%) |
| $500 to $799 | 4 (9.8%) | 0 (0.0%) |
| $800 to $999 | 0 (0.0%) | 0 (0.0%) |
| $1,000 to $1,499 | 0 (0.0%) | 0 (0.0%) |
| $1,500 to $1,999 | 0 (0.0%) | 0 (0.0%) |
| $2,000 to $2,499 | 0 (0.0%) | 0 (0.0%) |
| $2,500 to $2,999 | 0 (0.0%) | 0 (0.0%) |
| $3,000 or more | 0 (0.0%) | 0 (0.0%) |
| Total | 41 (100.0%) | 0 (0.0%) |
Physical Housing Characteristics in Max
Housing Structures in Max
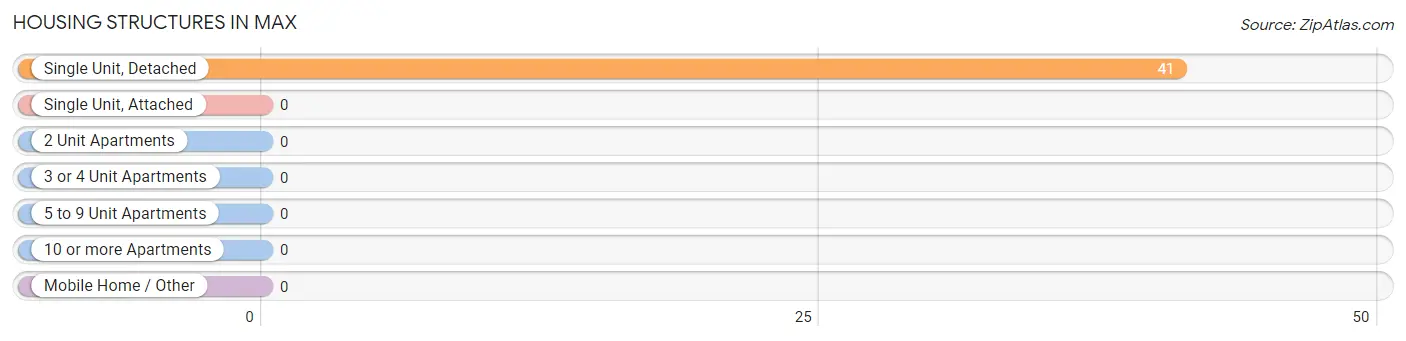
| Structure Type | # Housing Units | % Housing Units |
| Single Unit, Detached | 41 | 100.0% |
| Single Unit, Attached | 0 | 0.0% |
| 2 Unit Apartments | 0 | 0.0% |
| 3 or 4 Unit Apartments | 0 | 0.0% |
| 5 to 9 Unit Apartments | 0 | 0.0% |
| 10 or more Apartments | 0 | 0.0% |
| Mobile Home / Other | 0 | 0.0% |
| Total | 41 | 100.0% |
Housing Structures by Occupancy in Max
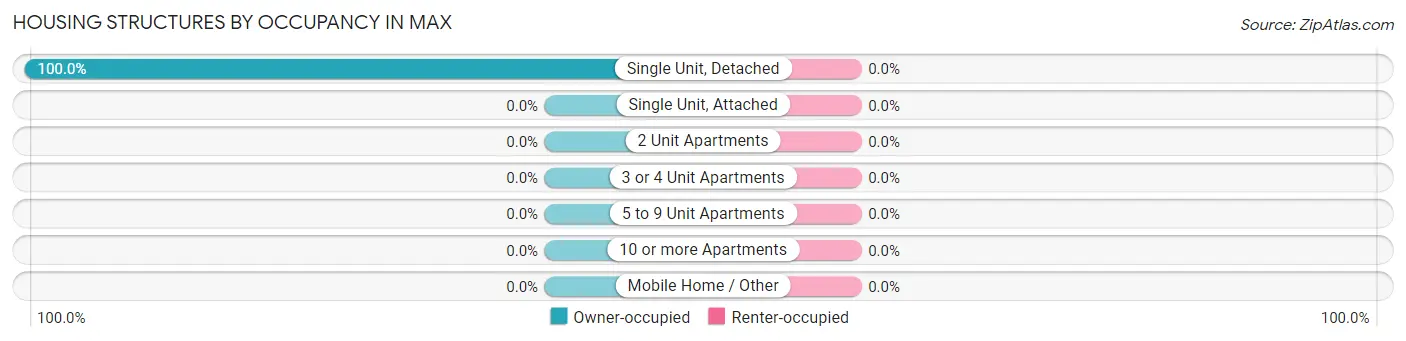
| Structure Type | Owner-occupied | Renter-occupied |
| Single Unit, Detached | 41 (100.0%) | 0 (0.0%) |
| Single Unit, Attached | 0 (0.0%) | 0 (0.0%) |
| 2 Unit Apartments | 0 (0.0%) | 0 (0.0%) |
| 3 or 4 Unit Apartments | 0 (0.0%) | 0 (0.0%) |
| 5 to 9 Unit Apartments | 0 (0.0%) | 0 (0.0%) |
| 10 or more Apartments | 0 (0.0%) | 0 (0.0%) |
| Mobile Home / Other | 0 (0.0%) | 0 (0.0%) |
| Total | 41 (100.0%) | 0 (0.0%) |
Housing Structures by Number of Rooms in Max
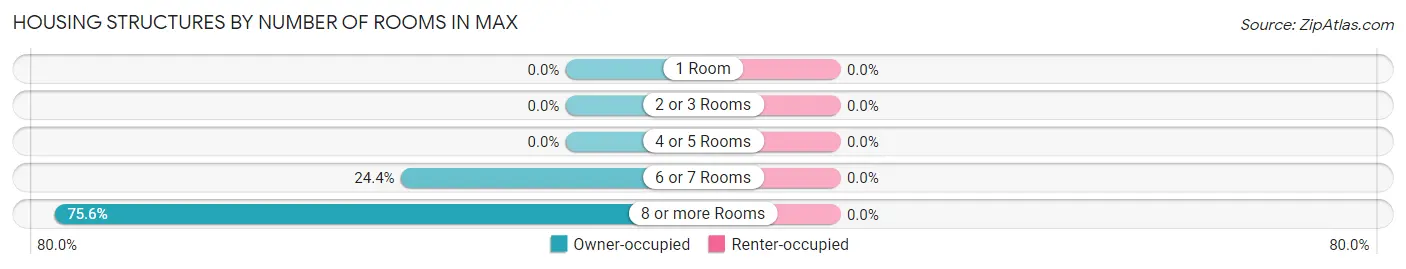
| Number of Rooms | Owner-occupied | Renter-occupied |
| 1 Room | 0 (0.0%) | 0 (0.0%) |
| 2 or 3 Rooms | 0 (0.0%) | 0 (0.0%) |
| 4 or 5 Rooms | 0 (0.0%) | 0 (0.0%) |
| 6 or 7 Rooms | 10 (24.4%) | 0 (0.0%) |
| 8 or more Rooms | 31 (75.6%) | 0 (0.0%) |
| Total | 41 (100.0%) | 0 (0.0%) |
Housing Structure by Heating Type in Max
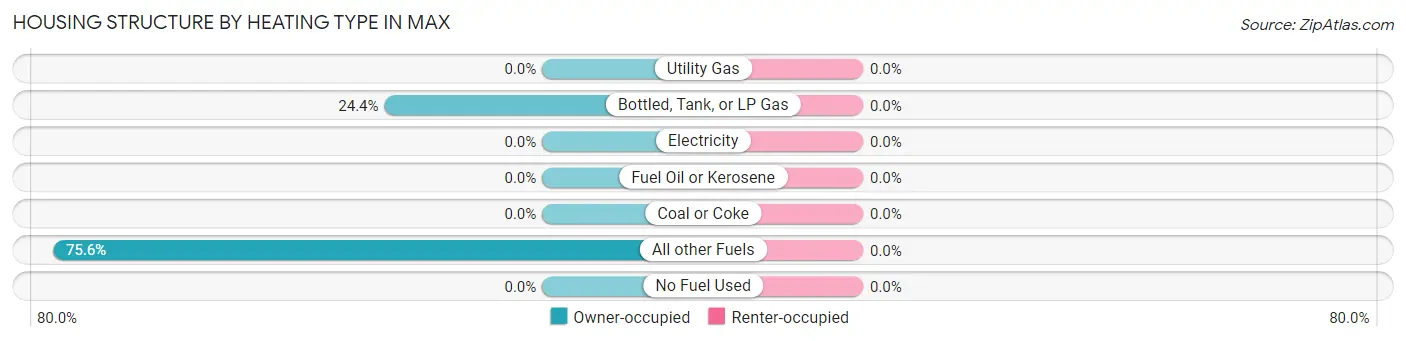
| Heating Type | Owner-occupied | Renter-occupied |
| Utility Gas | 0 (0.0%) | 0 (0.0%) |
| Bottled, Tank, or LP Gas | 10 (24.4%) | 0 (0.0%) |
| Electricity | 0 (0.0%) | 0 (0.0%) |
| Fuel Oil or Kerosene | 0 (0.0%) | 0 (0.0%) |
| Coal or Coke | 0 (0.0%) | 0 (0.0%) |
| All other Fuels | 31 (75.6%) | 0 (0.0%) |
| No Fuel Used | 0 (0.0%) | 0 (0.0%) |
| Total | 41 (100.0%) | 0 (0.0%) |
Household Vehicle Usage in Max
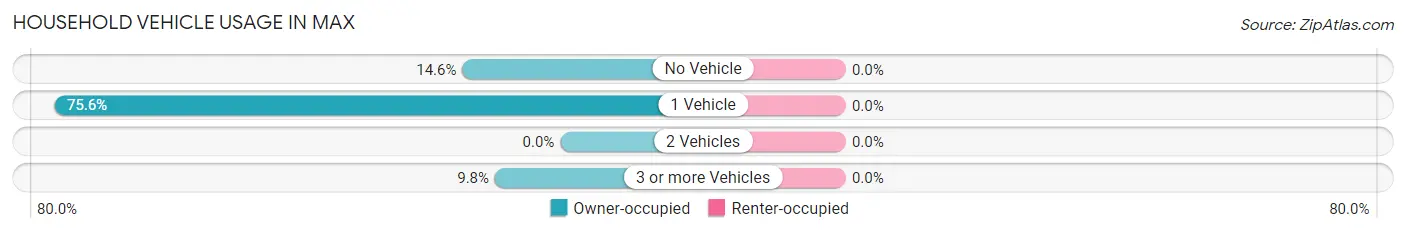
| Vehicles per Household | Owner-occupied | Renter-occupied |
| No Vehicle | 6 (14.6%) | 0 (0.0%) |
| 1 Vehicle | 31 (75.6%) | 0 (0.0%) |
| 2 Vehicles | 0 (0.0%) | 0 (0.0%) |
| 3 or more Vehicles | 4 (9.8%) | 0 (0.0%) |
| Total | 41 (100.0%) | 0 (0.0%) |
Real Estate & Mortgages in Max
Real Estate and Mortgage Overview in Max
| Characteristic | Without Mortgage | With Mortgage |
| Housing Units | 37 | 4 |
| Median Property Value | $31,100 | $0 |
| Median Household Income | - | - |
| Monthly Housing Costs | $423 | $0 |
| Real Estate Taxes | $223 | $0 |
Property Value by Mortgage Status in Max
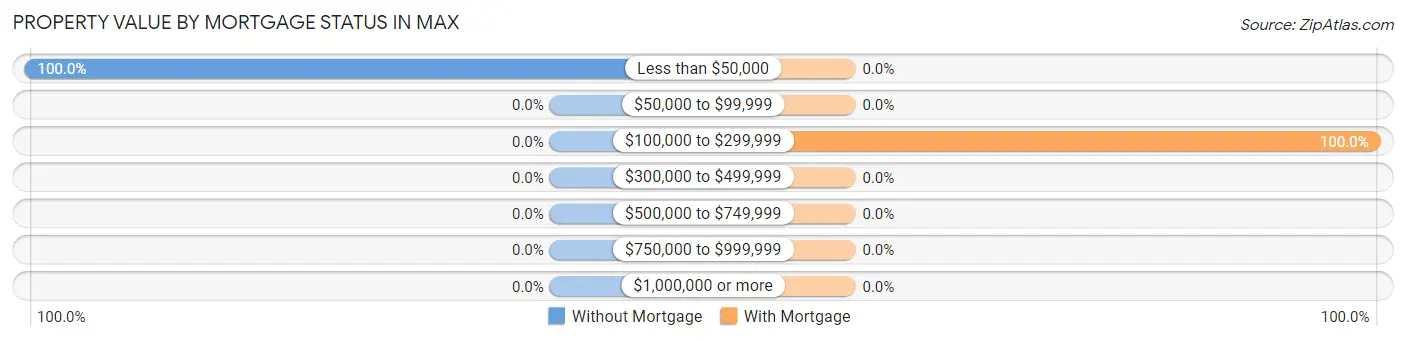
| Property Value | Without Mortgage | With Mortgage |
| Less than $50,000 | 37 (100.0%) | 0 (0.0%) |
| $50,000 to $99,999 | 0 (0.0%) | 0 (0.0%) |
| $100,000 to $299,999 | 0 (0.0%) | 4 (100.0%) |
| $300,000 to $499,999 | 0 (0.0%) | 0 (0.0%) |
| $500,000 to $749,999 | 0 (0.0%) | 0 (0.0%) |
| $750,000 to $999,999 | 0 (0.0%) | 0 (0.0%) |
| $1,000,000 or more | 0 (0.0%) | 0 (0.0%) |
| Total | 37 (100.0%) | 4 (100.0%) |
Household Income by Mortgage Status in Max
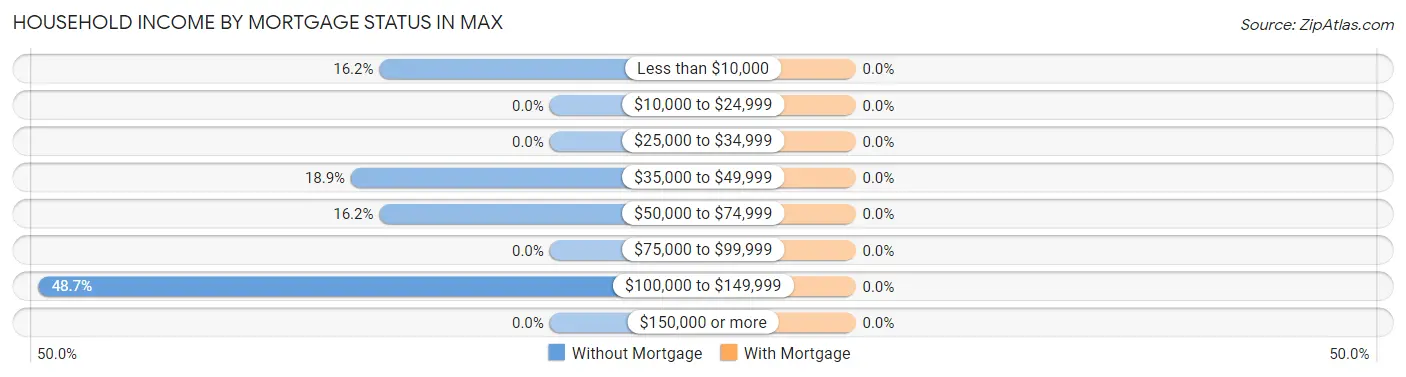
| Household Income | Without Mortgage | With Mortgage |
| Less than $10,000 | 6 (16.2%) | 0 (0.0%) |
| $10,000 to $24,999 | 0 (0.0%) | 0 (0.0%) |
| $25,000 to $34,999 | 0 (0.0%) | 0 (0.0%) |
| $35,000 to $49,999 | 7 (18.9%) | 0 (0.0%) |
| $50,000 to $74,999 | 6 (16.2%) | 0 (0.0%) |
| $75,000 to $99,999 | 0 (0.0%) | 0 (0.0%) |
| $100,000 to $149,999 | 18 (48.6%) | 0 (0.0%) |
| $150,000 or more | 0 (0.0%) | 0 (0.0%) |
| Total | 37 (100.0%) | 4 (100.0%) |
Property Value to Household Income Ratio in Max
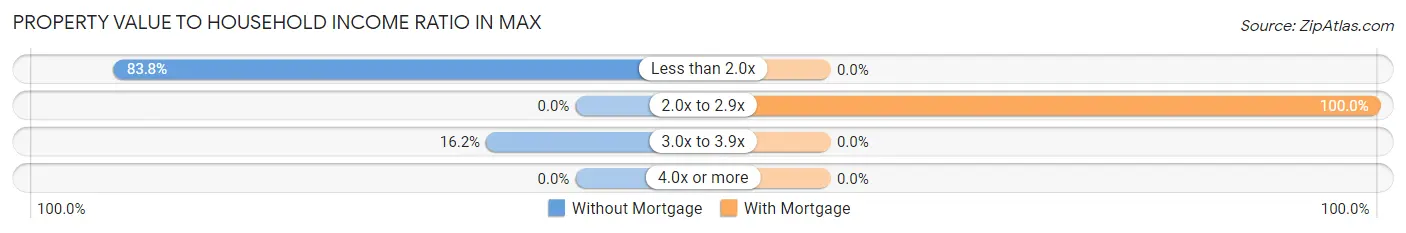
| Value-to-Income Ratio | Without Mortgage | With Mortgage |
| Less than 2.0x | 31 (83.8%) | 0 (0.0%) |
| 2.0x to 2.9x | 0 (0.0%) | 4 (100.0%) |
| 3.0x to 3.9x | 6 (16.2%) | 0 (0.0%) |
| 4.0x or more | 0 (0.0%) | 0 (0.0%) |
| Total | 37 (100.0%) | 4 (100.0%) |
Real Estate Taxes by Mortgage Status in Max
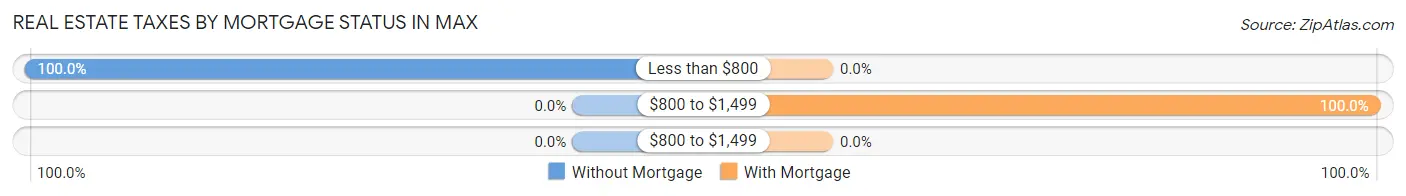
| Property Taxes | Without Mortgage | With Mortgage |
| Less than $800 | 37 (100.0%) | 0 (0.0%) |
| $800 to $1,499 | 0 (0.0%) | 4 (100.0%) |
| $800 to $1,499 | 0 (0.0%) | 0 (0.0%) |
| Total | 37 (100.0%) | 4 (100.0%) |
Health & Disability in Max
Health Insurance Coverage by Age in Max
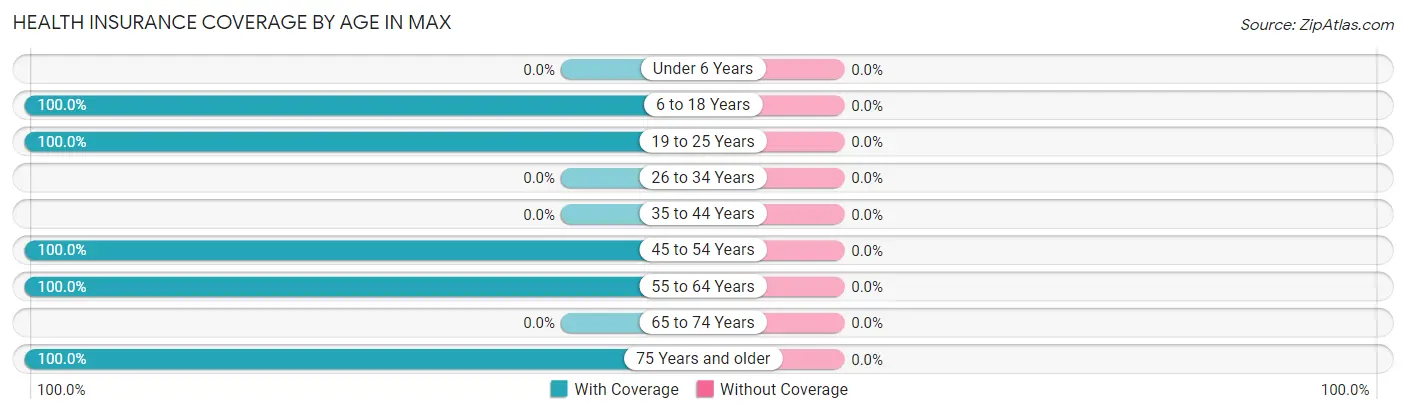
| Age Bracket | With Coverage | Without Coverage |
| Under 6 Years | 0 (0.0%) | 0 (0.0%) |
| 6 to 18 Years | 49 (100.0%) | 0 (0.0%) |
| 19 to 25 Years | 30 (100.0%) | 0 (0.0%) |
| 26 to 34 Years | 0 (0.0%) | 0 (0.0%) |
| 35 to 44 Years | 0 (0.0%) | 0 (0.0%) |
| 45 to 54 Years | 52 (100.0%) | 0 (0.0%) |
| 55 to 64 Years | 12 (100.0%) | 0 (0.0%) |
| 65 to 74 Years | 0 (0.0%) | 0 (0.0%) |
| 75 Years and older | 6 (100.0%) | 0 (0.0%) |
| Total | 149 (100.0%) | 0 (0.0%) |
Health Insurance Coverage by Citizenship Status in Max
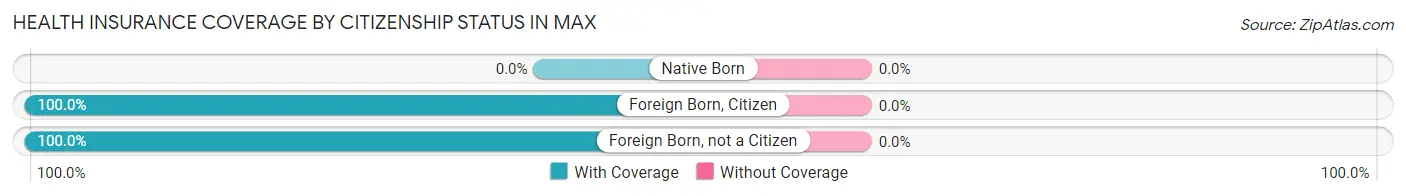
| Citizenship Status | With Coverage | Without Coverage |
| Native Born | 0 (0.0%) | 0 (0.0%) |
| Foreign Born, Citizen | 49 (100.0%) | 0 (0.0%) |
| Foreign Born, not a Citizen | 30 (100.0%) | 0 (0.0%) |
Health Insurance Coverage by Household Income in Max
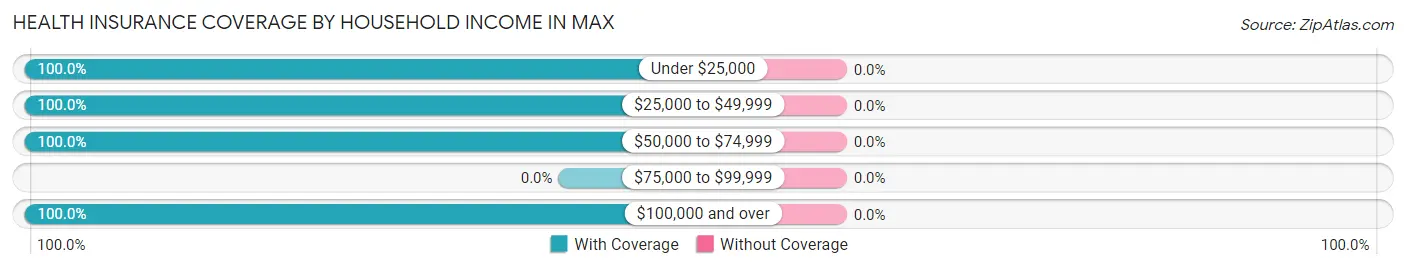
| Household Income | With Coverage | Without Coverage |
| Under $25,000 | 20 (100.0%) | 0 (0.0%) |
| $25,000 to $49,999 | 7 (100.0%) | 0 (0.0%) |
| $50,000 to $74,999 | 6 (100.0%) | 0 (0.0%) |
| $75,000 to $99,999 | 0 (0.0%) | 0 (0.0%) |
| $100,000 and over | 116 (100.0%) | 0 (0.0%) |
Public vs Private Health Insurance Coverage by Age in Max
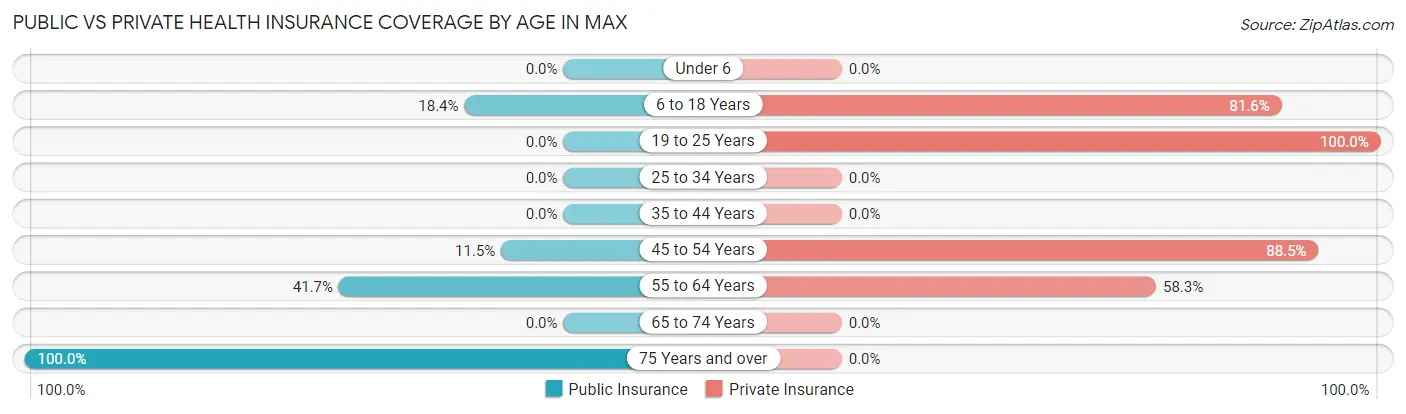
| Age Bracket | Public Insurance | Private Insurance |
| Under 6 | 0 (0.0%) | 0 (0.0%) |
| 6 to 18 Years | 9 (18.4%) | 40 (81.6%) |
| 19 to 25 Years | 0 (0.0%) | 30 (100.0%) |
| 25 to 34 Years | 0 (0.0%) | 0 (0.0%) |
| 35 to 44 Years | 0 (0.0%) | 0 (0.0%) |
| 45 to 54 Years | 6 (11.5%) | 46 (88.5%) |
| 55 to 64 Years | 5 (41.7%) | 7 (58.3%) |
| 65 to 74 Years | 0 (0.0%) | 0 (0.0%) |
| 75 Years and over | 6 (100.0%) | 0 (0.0%) |
| Total | 26 (17.4%) | 123 (82.6%) |
Disability Status by Sex by Age in Max
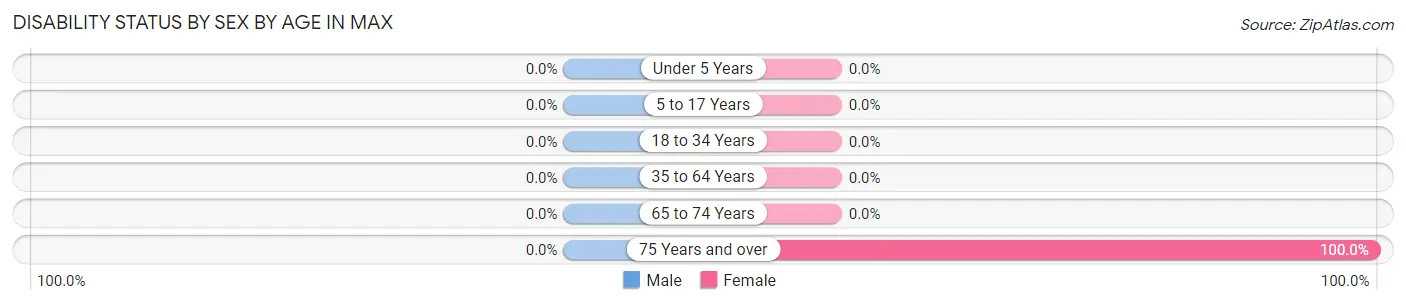
| Age Bracket | Male | Female |
| Under 5 Years | 0 (0.0%) | 0 (0.0%) |
| 5 to 17 Years | 0 (0.0%) | 0 (0.0%) |
| 18 to 34 Years | 0 (0.0%) | 0 (0.0%) |
| 35 to 64 Years | 0 (0.0%) | 0 (0.0%) |
| 65 to 74 Years | 0 (0.0%) | 0 (0.0%) |
| 75 Years and over | 0 (0.0%) | 6 (100.0%) |
Disability Class by Sex by Age in Max
Disability Class: Hearing Difficulty
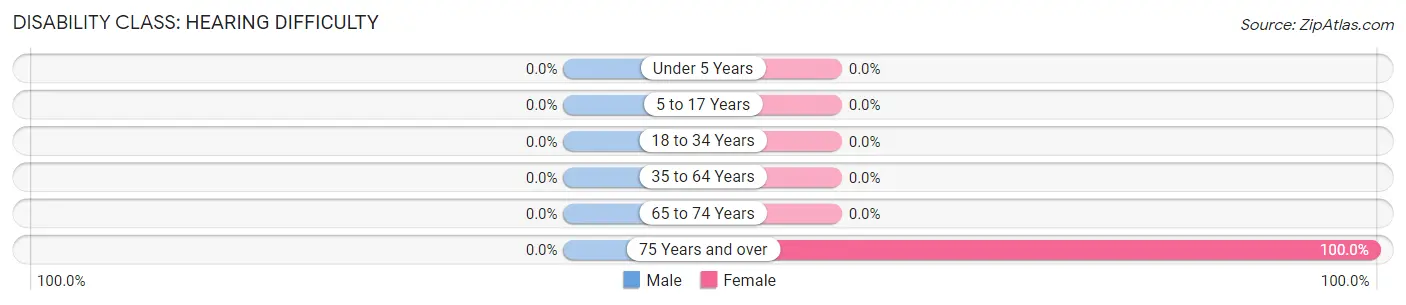
| Age Bracket | Male | Female |
| Under 5 Years | 0 (0.0%) | 0 (0.0%) |
| 5 to 17 Years | 0 (0.0%) | 0 (0.0%) |
| 18 to 34 Years | 0 (0.0%) | 0 (0.0%) |
| 35 to 64 Years | 0 (0.0%) | 0 (0.0%) |
| 65 to 74 Years | 0 (0.0%) | 0 (0.0%) |
| 75 Years and over | 0 (0.0%) | 6 (100.0%) |
Disability Class: Vision Difficulty
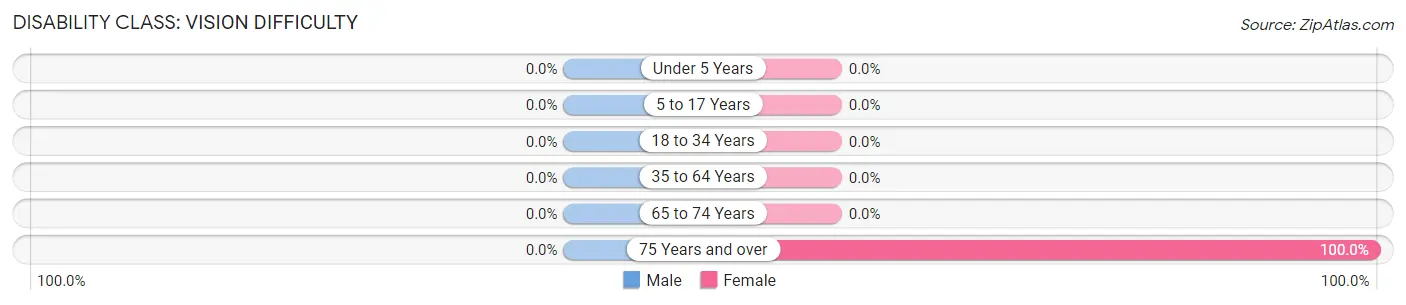
| Age Bracket | Male | Female |
| Under 5 Years | 0 (0.0%) | 0 (0.0%) |
| 5 to 17 Years | 0 (0.0%) | 0 (0.0%) |
| 18 to 34 Years | 0 (0.0%) | 0 (0.0%) |
| 35 to 64 Years | 0 (0.0%) | 0 (0.0%) |
| 65 to 74 Years | 0 (0.0%) | 0 (0.0%) |
| 75 Years and over | 0 (0.0%) | 6 (100.0%) |
Disability Class: Cognitive Difficulty
| Age Bracket | Male | Female |
| 5 to 17 Years | 0 (0.0%) | 0 (0.0%) |
| 18 to 34 Years | 0 (0.0%) | 0 (0.0%) |
| 35 to 64 Years | 0 (0.0%) | 0 (0.0%) |
| 65 to 74 Years | 0 (0.0%) | 0 (0.0%) |
| 75 Years and over | 0 (0.0%) | 0 (0.0%) |
Disability Class: Ambulatory Difficulty
| Age Bracket | Male | Female |
| 5 to 17 Years | 0 (0.0%) | 0 (0.0%) |
| 18 to 34 Years | 0 (0.0%) | 0 (0.0%) |
| 35 to 64 Years | 0 (0.0%) | 0 (0.0%) |
| 65 to 74 Years | 0 (0.0%) | 0 (0.0%) |
| 75 Years and over | 0 (0.0%) | 0 (0.0%) |
Disability Class: Self-Care Difficulty
| Age Bracket | Male | Female |
| 5 to 17 Years | 0 (0.0%) | 0 (0.0%) |
| 18 to 34 Years | 0 (0.0%) | 0 (0.0%) |
| 35 to 64 Years | 0 (0.0%) | 0 (0.0%) |
| 65 to 74 Years | 0 (0.0%) | 0 (0.0%) |
| 75 Years and over | 0 (0.0%) | 0 (0.0%) |
Technology Access in Max
Computing Device Access in Max
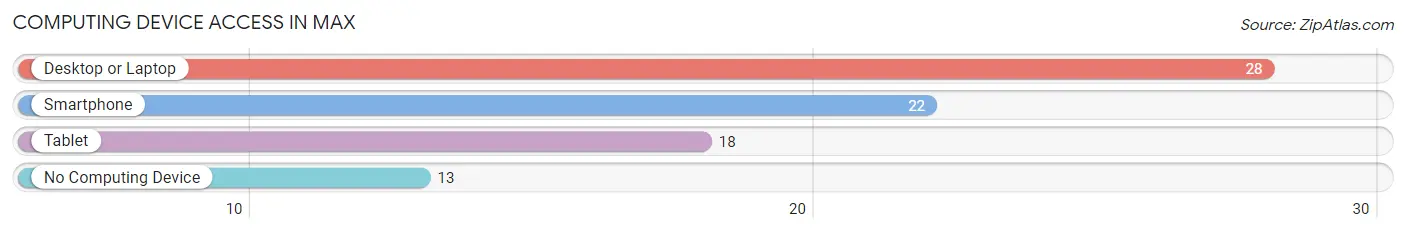
| Device Type | # Households | % Households |
| Desktop or Laptop | 28 | 68.3% |
| Smartphone | 22 | 53.7% |
| Tablet | 18 | 43.9% |
| No Computing Device | 13 | 31.7% |
| Total | 41 | 100.0% |
Internet Access in Max
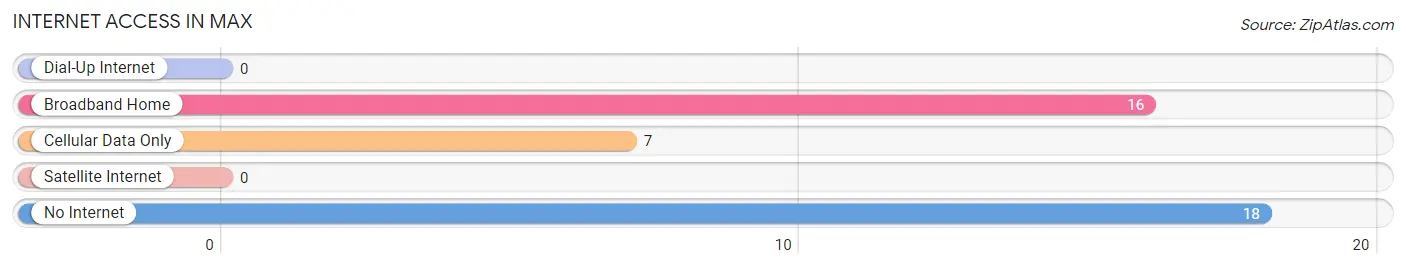
| Internet Type | # Households | % Households |
| Dial-Up Internet | 0 | 0.0% |
| Broadband Home | 16 | 39.0% |
| Cellular Data Only | 7 | 17.1% |
| Satellite Internet | 0 | 0.0% |
| No Internet | 18 | 43.9% |
| Total | 41 | 100.0% |
Max Summary
NE (Northeast) India is a region of India comprising of eight states: Arunachal Pradesh, Assam, Manipur, Meghalaya, Mizoram, Nagaland, Tripura and Sikkim. It is the easternmost region of India and is bordered by Bhutan, China, Bangladesh and Myanmar. The region is known for its rich cultural heritage, diverse geography and unique flora and fauna.
History
The history of Northeast India dates back to the ancient times when it was inhabited by various tribal groups. The region was ruled by various dynasties such as the Ahoms, the Kacharis, the Manipuris and the Nagas. During the British rule, the region was divided into several princely states. After India's independence in 1947, the region was integrated into the Indian Union.
Geography
Northeast India is a region of great geographical diversity. It is home to the Eastern Himalayas, the Brahmaputra Valley, the Barak Valley, the Meghalaya Plateau, the Mizo Hills and the Manipur Valley. The region is also home to several rivers such as the Brahmaputra, the Barak, the Lohit, the Manas and the Teesta. The region is also known for its rich biodiversity and is home to several national parks and wildlife sanctuaries.
Economy
Northeast India is one of the least developed regions of India. The region has a predominantly agrarian economy with a large number of small and marginal farmers. The region is also rich in natural resources such as oil, coal, limestone, uranium and natural gas. The region is also home to several industries such as tea, timber, rubber and jute. The region is also home to several hydroelectric power projects.
Demographics
Northeast India is home to a diverse population of over 45 million people. The region is home to several ethnic groups such as the Assamese, the Bodo, the Garo, the Khasi, the Mizo, the Nagas and the Manipuris. The region is also home to several religions such as Hinduism, Christianity, Islam, Buddhism and Jainism. The region is also home to several languages such as Assamese, Bengali, Bodo, Garo, Khasi, Mizo, Manipuri and Nagamese.
Conclusion
Northeast India is a region of great geographical, cultural and economic diversity. The region is home to several ethnic groups, religions and languages. The region is also home to several industries and natural resources. The region is also home to a diverse population of over 45 million people. The region is an important part of India and is an integral part of the country's economy.
Common Questions
What is Per Capita Income in Max?
Per Capita income in Max is $29,129.
What is the Median Family Income in Max?
Median Family Income in Max is $141,111.
What is Income or Wage Gap in Max?
Income or Wage Gap in Max is 93.4%.
Women in Max earn 6.6 cents for every dollar earned by a man.
What is Inequality or Gini Index in Max?
Inequality or Gini Index in Max is 0.31.
What is the Total Population of Max?
Total Population of Max is 149.
What is the Total Male Population of Max?
Total Male Population of Max is 84.
What is the Total Female Population of Max?
Total Female Population of Max is 65.
What is the Ratio of Males per 100 Females in Max?
There are 129.23 Males per 100 Females in Max.
What is the Ratio of Females per 100 Males in Max?
There are 77.38 Females per 100 Males in Max.
What is the Median Population Age in Max?
Median Population Age in Max is 20.9 Years.
What is the Average Family Size in Max
Average Family Size in Max is 4.9 People.
What is the Average Household Size in Max
Average Household Size in Max is 3.6 People.
How Large is the Labor Force in Max?
There are 83 People in the Labor Forcein in Max.
What is the Percentage of People in the Labor Force in Max?
72.2% of People are in the Labor Force in Max.