Wasilla, AK Map & Demographics
Wasilla Map
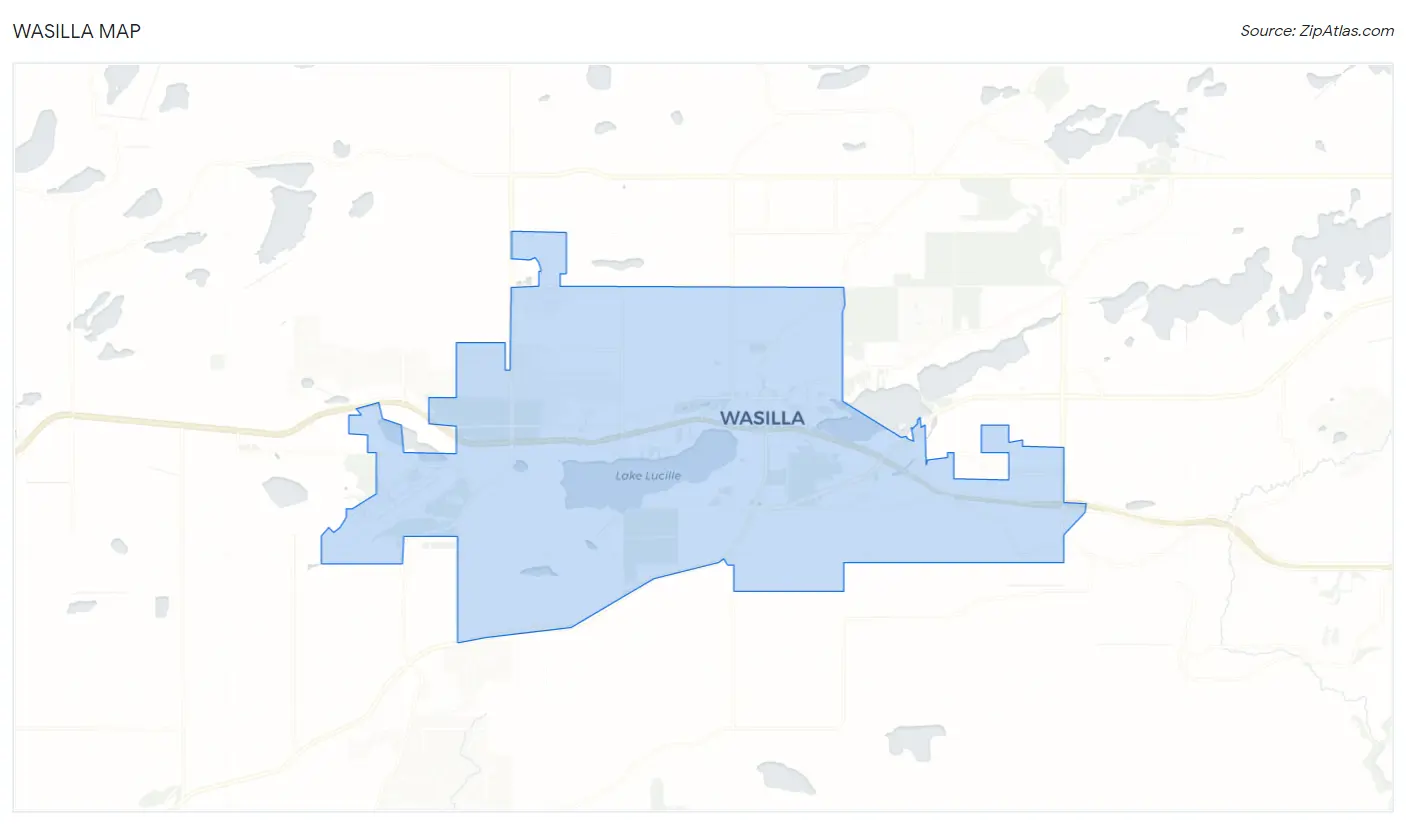
Wasilla Overview
$38,415
PER CAPITA INCOME
$95,753
AVG FAMILY INCOME
$69,534
AVG HOUSEHOLD INCOME
32.1%
WAGE / INCOME GAP [ % ]
67.9¢/ $1
WAGE / INCOME GAP [ $ ]
$9,962
FAMILY INCOME DEFICIT
0.46
INEQUALITY / GINI INDEX
9,267
TOTAL POPULATION
4,701
MALE POPULATION
4,566
FEMALE POPULATION
102.96
MALES / 100 FEMALES
97.13
FEMALES / 100 MALES
35.9
MEDIAN AGE
3.0
AVG FAMILY SIZE
2.3
AVG HOUSEHOLD SIZE
4,219
LABOR FORCE [ PEOPLE ]
58.2%
PERCENT IN LABOR FORCE
9.7%
UNEMPLOYMENT RATE
Wasilla Area Codes
Income in Wasilla
Income Overview in Wasilla
Per Capita Income in Wasilla is $38,415, while median incomes of families and households are $95,753 and $69,534 respectively.
| Characteristic | Number | Measure |
| Per Capita Income | 9,267 | $38,415 |
| Median Family Income | 2,296 | $95,753 |
| Mean Family Income | 2,296 | $110,719 |
| Median Household Income | 4,066 | $69,534 |
| Mean Household Income | 4,066 | $88,130 |
| Income Deficit | 2,296 | $9,962 |
| Wage / Income Gap (%) | 9,267 | 32.14% |
| Wage / Income Gap ($) | 9,267 | 67.86¢ per $1 |
| Gini / Inequality Index | 9,267 | 0.46 |
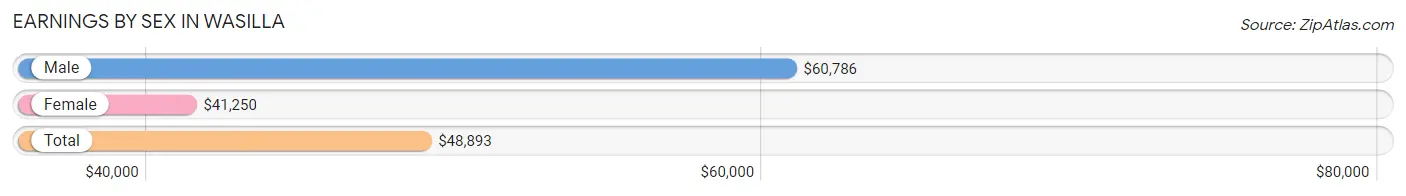
Earnings by Sex in Wasilla
Average Earnings in Wasilla are $48,893, $60,786 for men and $41,250 for women, a difference of 32.1%.
| Sex | Number | Average Earnings |
| Male | 2,570 (57.8%) | $60,786 |
| Female | 1,874 (42.2%) | $41,250 |
| Total | 4,444 (100.0%) | $48,893 |
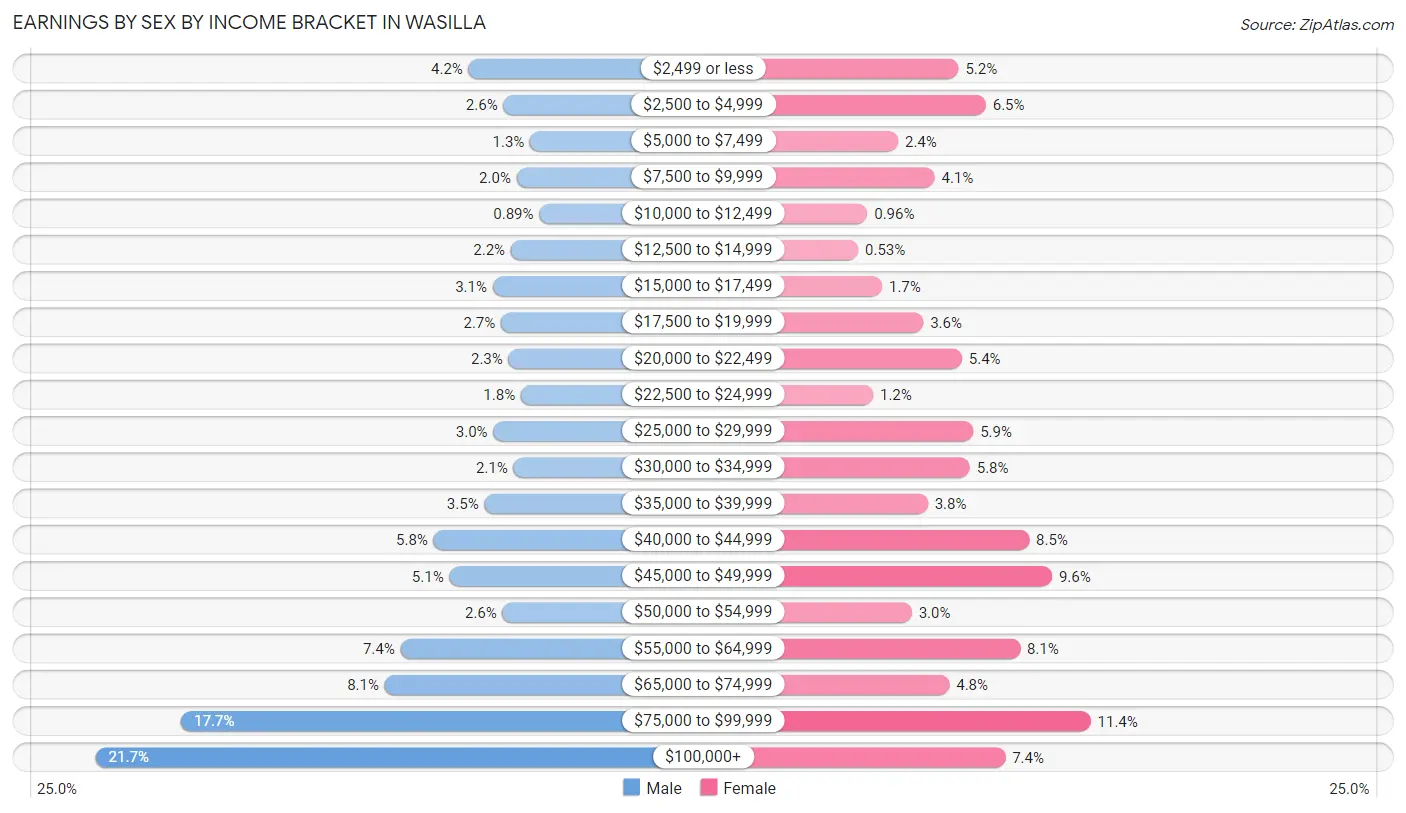
Earnings by Sex by Income Bracket in Wasilla
The most common earnings brackets in Wasilla are $100,000+ for men (557 | 21.7%) and $75,000 to $99,999 for women (214 | 11.4%).
| Income | Male | Female |
| $2,499 or less | 108 (4.2%) | 98 (5.2%) |
| $2,500 to $4,999 | 66 (2.6%) | 122 (6.5%) |
| $5,000 to $7,499 | 34 (1.3%) | 45 (2.4%) |
| $7,500 to $9,999 | 50 (1.9%) | 77 (4.1%) |
| $10,000 to $12,499 | 23 (0.9%) | 18 (1.0%) |
| $12,500 to $14,999 | 57 (2.2%) | 10 (0.5%) |
| $15,000 to $17,499 | 79 (3.1%) | 31 (1.7%) |
| $17,500 to $19,999 | 69 (2.7%) | 67 (3.6%) |
| $20,000 to $22,499 | 60 (2.3%) | 101 (5.4%) |
| $22,500 to $24,999 | 45 (1.8%) | 23 (1.2%) |
| $25,000 to $29,999 | 78 (3.0%) | 111 (5.9%) |
| $30,000 to $34,999 | 54 (2.1%) | 108 (5.8%) |
| $35,000 to $39,999 | 89 (3.5%) | 71 (3.8%) |
| $40,000 to $44,999 | 150 (5.8%) | 160 (8.5%) |
| $45,000 to $49,999 | 131 (5.1%) | 180 (9.6%) |
| $50,000 to $54,999 | 67 (2.6%) | 57 (3.0%) |
| $55,000 to $64,999 | 190 (7.4%) | 152 (8.1%) |
| $65,000 to $74,999 | 209 (8.1%) | 90 (4.8%) |
| $75,000 to $99,999 | 454 (17.7%) | 214 (11.4%) |
| $100,000+ | 557 (21.7%) | 139 (7.4%) |
| Total | 2,570 (100.0%) | 1,874 (100.0%) |
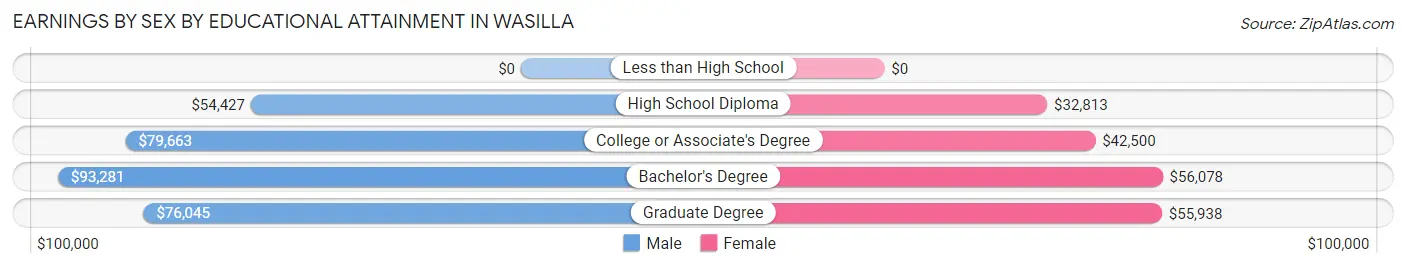
Earnings by Sex by Educational Attainment in Wasilla
Average earnings in Wasilla are $67,261 for men and $43,475 for women, a difference of 35.4%. Men with an educational attainment of bachelor's degree enjoy the highest average annual earnings of $93,281, while those with high school diploma education earn the least with $54,427. Women with an educational attainment of bachelor's degree earn the most with the average annual earnings of $56,078, while those with high school diploma education have the smallest earnings of $32,813.
| Educational Attainment | Male Income | Female Income |
| Less than High School | - | - |
| High School Diploma | $54,427 | $32,813 |
| College or Associate's Degree | $79,663 | $42,500 |
| Bachelor's Degree | $93,281 | $56,078 |
| Graduate Degree | $76,045 | $55,938 |
| Total | $67,261 | $43,475 |
Family Income in Wasilla
Family Income Brackets in Wasilla
According to the Wasilla family income data, there are 443 families falling into the $100,000 to $149,999 income range, which is the most common income bracket and makes up 19.3% of all families. Conversely, the $10,000 to $14,999 income bracket is the least frequent group with only 34 families (1.5%) belonging to this category.
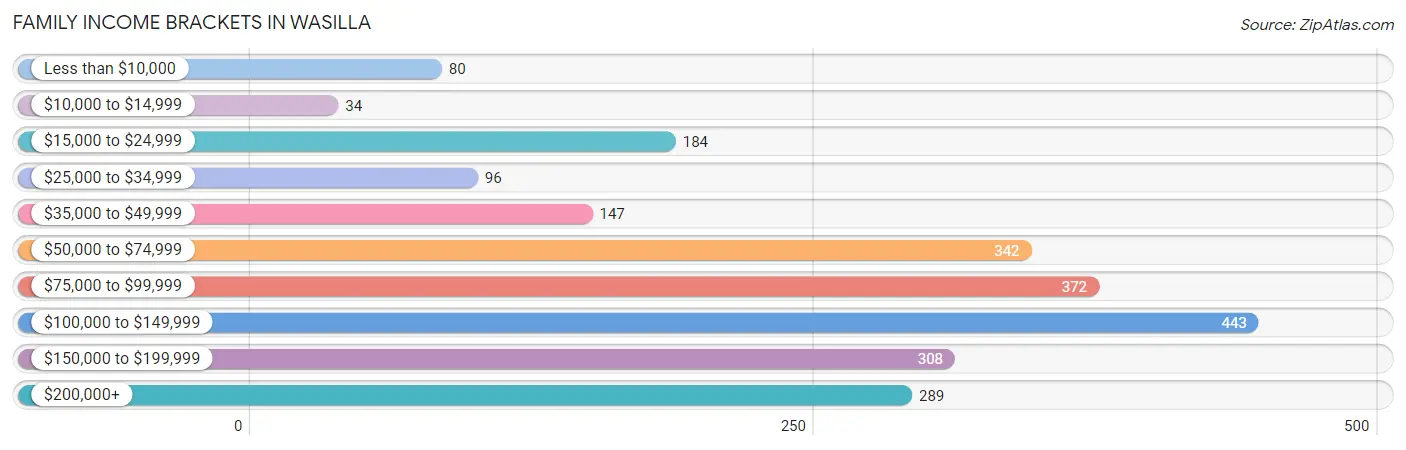
| Income Bracket | # Families | % Families |
| Less than $10,000 | 80 | 3.5% |
| $10,000 to $14,999 | 34 | 1.5% |
| $15,000 to $24,999 | 184 | 8.0% |
| $25,000 to $34,999 | 96 | 4.2% |
| $35,000 to $49,999 | 147 | 6.4% |
| $50,000 to $74,999 | 342 | 14.9% |
| $75,000 to $99,999 | 372 | 16.2% |
| $100,000 to $149,999 | 443 | 19.3% |
| $150,000 to $199,999 | 308 | 13.4% |
| $200,000+ | 289 | 12.6% |
Family Income by Famaliy Size in Wasilla
7+ person families (66 | 2.9%) account for the highest median family income in Wasilla with $185,417 per family, while 3-person families (444 | 19.3%) have the highest median income of $42,527 per family member.
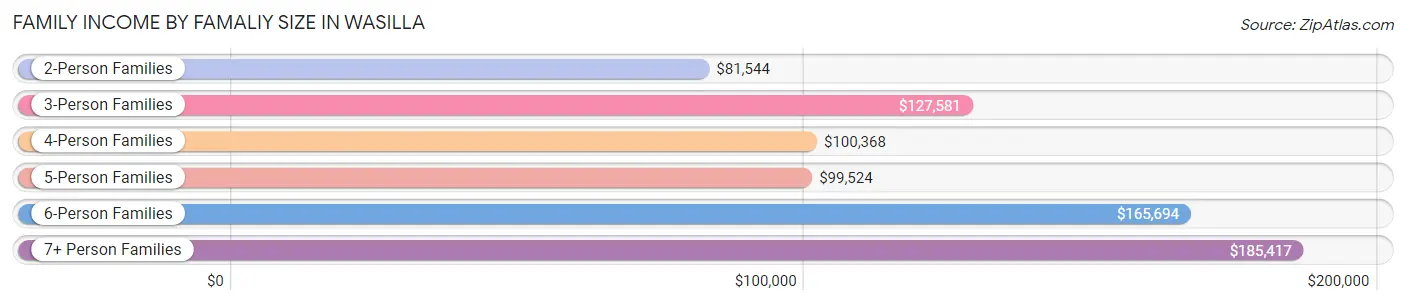
| Income Bracket | # Families | Median Income |
| 2-Person Families | 1,126 (49.0%) | $81,544 |
| 3-Person Families | 444 (19.3%) | $127,581 |
| 4-Person Families | 385 (16.8%) | $100,368 |
| 5-Person Families | 234 (10.2%) | $99,524 |
| 6-Person Families | 41 (1.8%) | $165,694 |
| 7+ Person Families | 66 (2.9%) | $185,417 |
| Total | 2,296 (100.0%) | $95,753 |
Family Income by Number of Earners in Wasilla
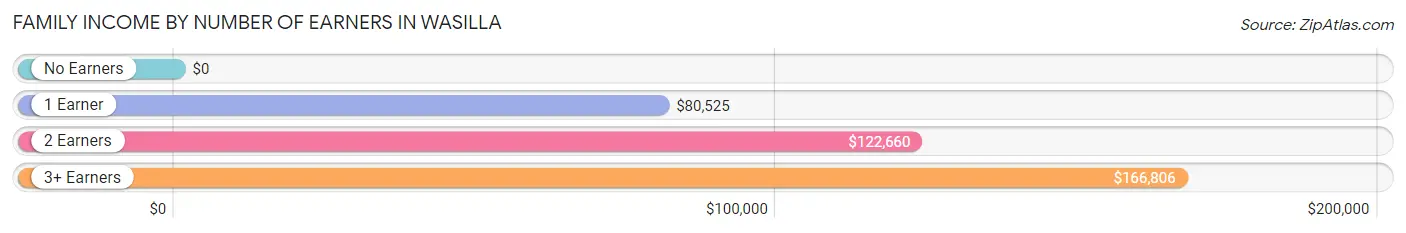
| Number of Earners | # Families | Median Income |
| No Earners | 342 (14.9%) | $0 |
| 1 Earner | 917 (39.9%) | $80,525 |
| 2 Earners | 878 (38.2%) | $122,660 |
| 3+ Earners | 159 (6.9%) | $166,806 |
| Total | 2,296 (100.0%) | $95,753 |
Household Income in Wasilla
Household Income Brackets in Wasilla
With 642 households falling in the category, the $100,000 to $149,999 income range is the most frequent in Wasilla, accounting for 15.8% of all households. In contrast, only 183 households (4.5%) fall into the $25,000 to $34,999 income bracket, making it the least populous group.
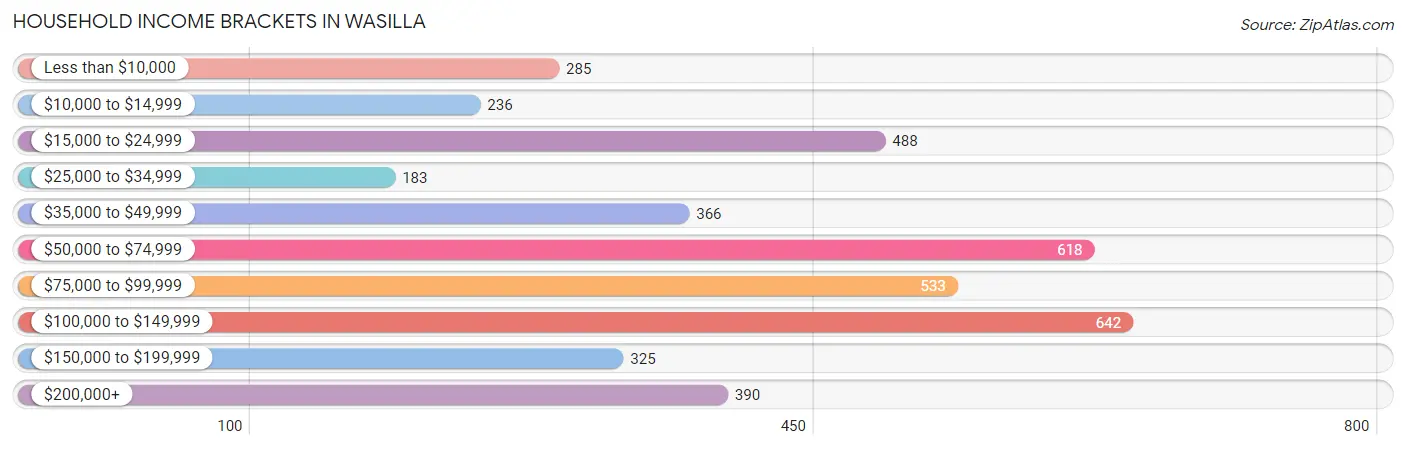
| Income Bracket | # Households | % Households |
| Less than $10,000 | 285 | 7.0% |
| $10,000 to $14,999 | 236 | 5.8% |
| $15,000 to $24,999 | 488 | 12.0% |
| $25,000 to $34,999 | 183 | 4.5% |
| $35,000 to $49,999 | 366 | 9.0% |
| $50,000 to $74,999 | 618 | 15.2% |
| $75,000 to $99,999 | 533 | 13.1% |
| $100,000 to $149,999 | 642 | 15.8% |
| $150,000 to $199,999 | 325 | 8.0% |
| $200,000+ | 390 | 9.6% |
Household Income by Householder Age in Wasilla
The median household income in Wasilla is $69,534, with the highest median household income of $90,956 found in the 45 to 64 years age bracket for the primary householder. A total of 1,263 households (31.1%) fall into this category. Meanwhile, the 15 to 24 years age bracket for the primary householder has the lowest median household income of $42,202, with 255 households (6.3%) in this group.
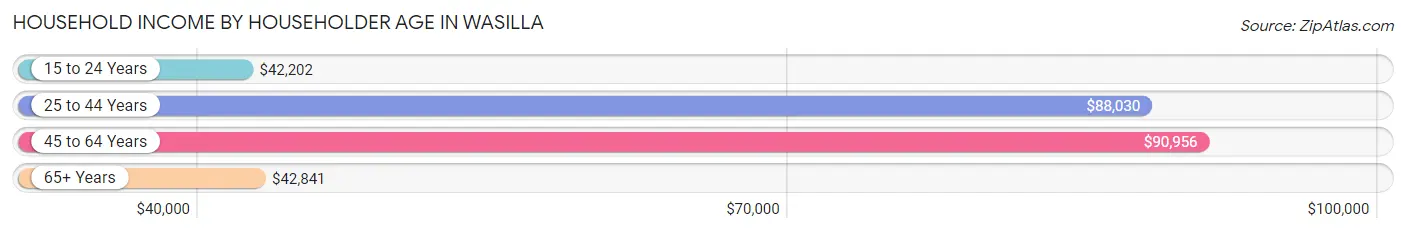
| Income Bracket | # Households | Median Income |
| 15 to 24 Years | 255 (6.3%) | $42,202 |
| 25 to 44 Years | 1,560 (38.4%) | $88,030 |
| 45 to 64 Years | 1,263 (31.1%) | $90,956 |
| 65+ Years | 988 (24.3%) | $42,841 |
| Total | 4,066 (100.0%) | $69,534 |
Poverty in Wasilla
Income Below Poverty by Sex and Age in Wasilla
With 10.8% poverty level for males and 15.1% for females among the residents of Wasilla, 5 year old males and 18 to 24 year old females are the most vulnerable to poverty, with 12 males (24.0%) and 116 females (40.3%) in their respective age groups living below the poverty level.
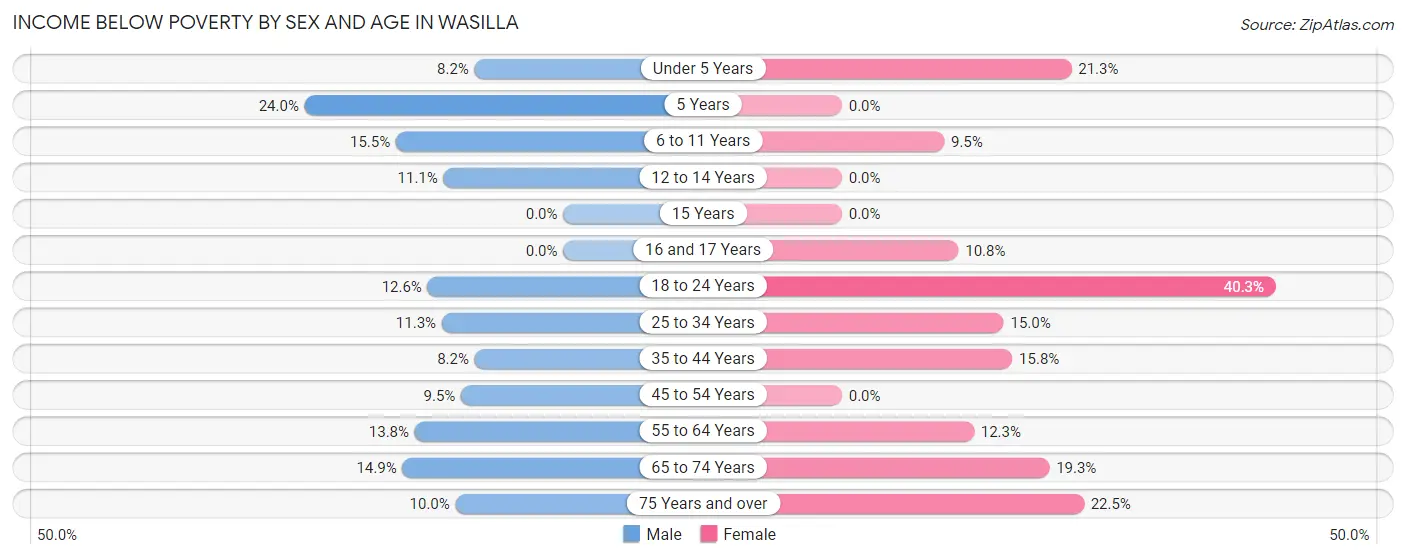
| Age Bracket | Male | Female |
| Under 5 Years | 26 (8.2%) | 49 (21.3%) |
| 5 Years | 12 (24.0%) | 0 (0.0%) |
| 6 to 11 Years | 68 (15.5%) | 43 (9.5%) |
| 12 to 14 Years | 19 (11.1%) | 0 (0.0%) |
| 15 Years | 0 (0.0%) | 0 (0.0%) |
| 16 and 17 Years | 0 (0.0%) | 8 (10.8%) |
| 18 to 24 Years | 37 (12.6%) | 116 (40.3%) |
| 25 to 34 Years | 95 (11.3%) | 116 (15.0%) |
| 35 to 44 Years | 54 (8.2%) | 92 (15.8%) |
| 45 to 54 Years | 55 (9.5%) | 0 (0.0%) |
| 55 to 64 Years | 51 (13.8%) | 80 (12.2%) |
| 65 to 74 Years | 63 (14.9%) | 92 (19.3%) |
| 75 Years and over | 19 (10.0%) | 88 (22.5%) |
| Total | 499 (10.8%) | 684 (15.1%) |
Income Above Poverty by Sex and Age in Wasilla
According to the poverty statistics in Wasilla, males aged 15 years and females aged 5 years are the age groups that are most secure financially, with 100.0% of males and 100.0% of females in these age groups living above the poverty line.
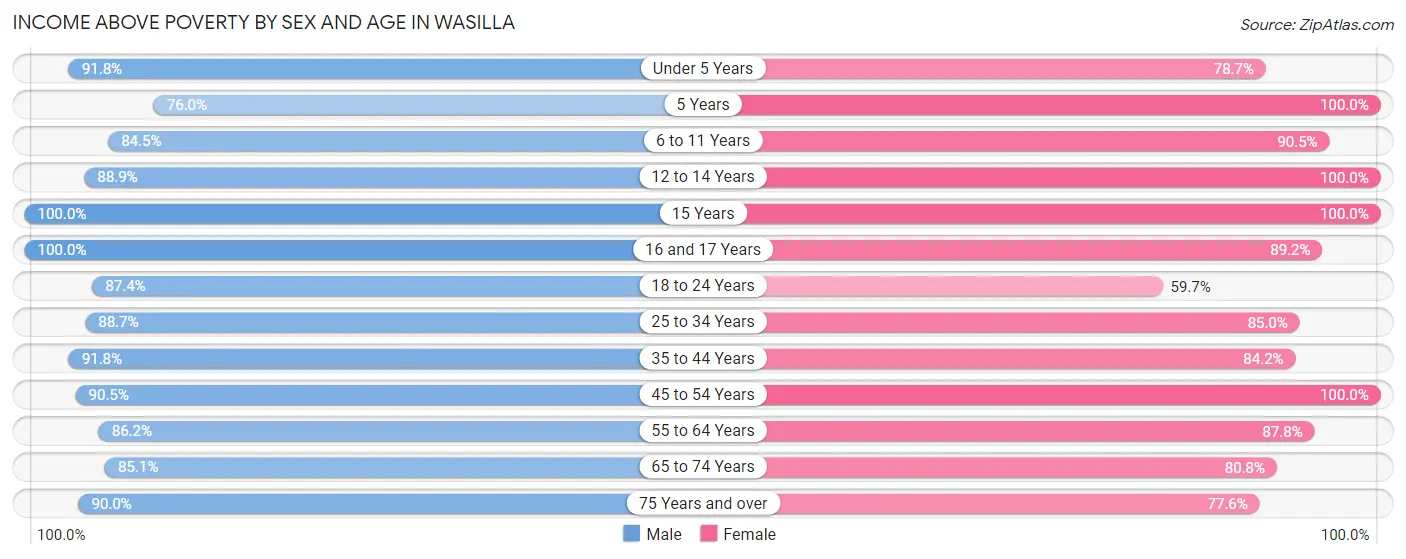
| Age Bracket | Male | Female |
| Under 5 Years | 290 (91.8%) | 181 (78.7%) |
| 5 Years | 38 (76.0%) | 15 (100.0%) |
| 6 to 11 Years | 370 (84.5%) | 410 (90.5%) |
| 12 to 14 Years | 152 (88.9%) | 163 (100.0%) |
| 15 Years | 82 (100.0%) | 40 (100.0%) |
| 16 and 17 Years | 202 (100.0%) | 66 (89.2%) |
| 18 to 24 Years | 257 (87.4%) | 172 (59.7%) |
| 25 to 34 Years | 748 (88.7%) | 657 (85.0%) |
| 35 to 44 Years | 603 (91.8%) | 490 (84.2%) |
| 45 to 54 Years | 525 (90.5%) | 391 (100.0%) |
| 55 to 64 Years | 319 (86.2%) | 573 (87.7%) |
| 65 to 74 Years | 359 (85.1%) | 386 (80.7%) |
| 75 Years and over | 171 (90.0%) | 304 (77.5%) |
| Total | 4,116 (89.2%) | 3,848 (84.9%) |
Income Below Poverty Among Married-Couple Families in Wasilla
The poverty statistics for married-couple families in Wasilla show that 5.8% or 96 of the total 1,650 families live below the poverty line. Families with 1 or 2 children have the highest poverty rate of 10.3%, comprising of 51 families. On the other hand, families with 3 or 4 children have the lowest poverty rate of 0.0%, which includes 0 families.
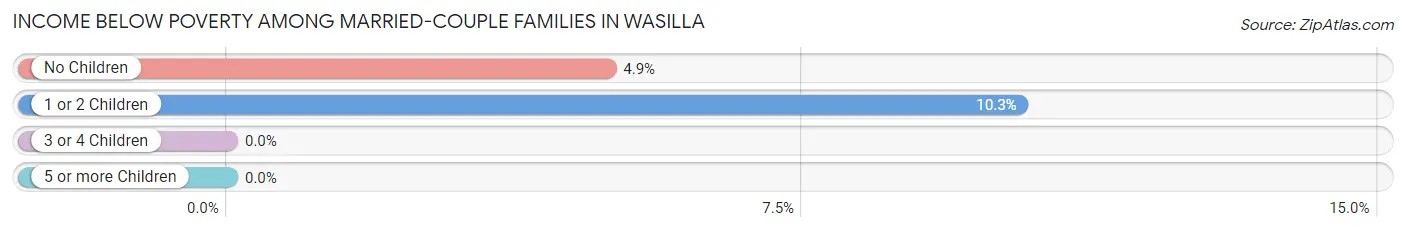
| Children | Above Poverty | Below Poverty |
| No Children | 866 (95.1%) | 45 (4.9%) |
| 1 or 2 Children | 443 (89.7%) | 51 (10.3%) |
| 3 or 4 Children | 186 (100.0%) | 0 (0.0%) |
| 5 or more Children | 59 (100.0%) | 0 (0.0%) |
| Total | 1,554 (94.2%) | 96 (5.8%) |
Income Below Poverty Among Single-Parent Households in Wasilla
According to the poverty data in Wasilla, 24.0% or 65 single-father households and 19.2% or 72 single-mother households are living below the poverty line. Among single-father households, those with 3 or 4 children have the highest poverty rate, with 16 households (100.0%) experiencing poverty. Likewise, among single-mother households, those with no children have the highest poverty rate, with 34 households (39.1%) falling below the poverty line.
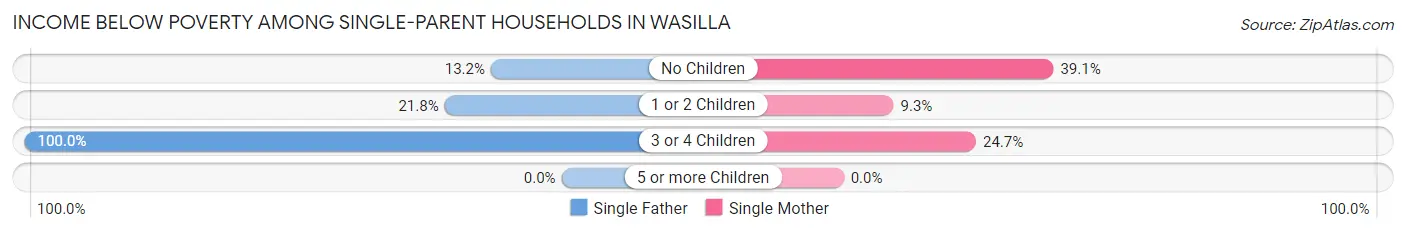
| Children | Single Father | Single Mother |
| No Children | 10 (13.2%) | 34 (39.1%) |
| 1 or 2 Children | 39 (21.8%) | 20 (9.3%) |
| 3 or 4 Children | 16 (100.0%) | 18 (24.7%) |
| 5 or more Children | 0 (0.0%) | 0 (0.0%) |
| Total | 65 (24.0%) | 72 (19.2%) |
Income Below Poverty Among Married-Couple vs Single-Parent Households in Wasilla
The poverty data for Wasilla shows that 96 of the married-couple family households (5.8%) and 137 of the single-parent households (21.2%) are living below the poverty level. Within the married-couple family households, those with 1 or 2 children have the highest poverty rate, with 51 households (10.3%) falling below the poverty line. Among the single-parent households, those with 3 or 4 children have the highest poverty rate, with 34 household (38.2%) living below poverty.
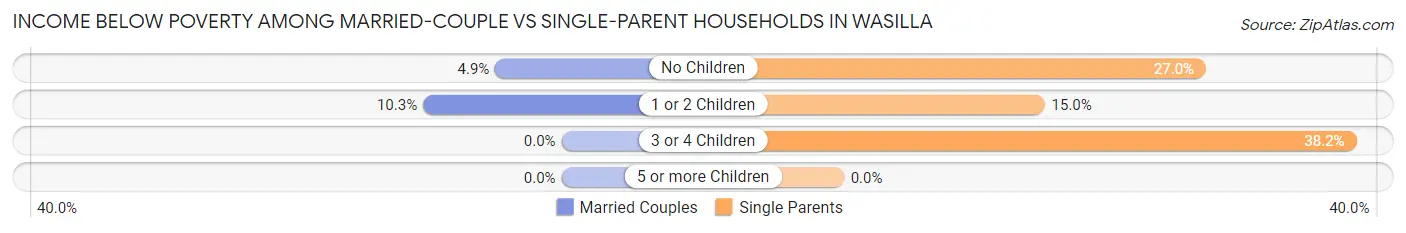
| Children | Married-Couple Families | Single-Parent Households |
| No Children | 45 (4.9%) | 44 (27.0%) |
| 1 or 2 Children | 51 (10.3%) | 59 (15.0%) |
| 3 or 4 Children | 0 (0.0%) | 34 (38.2%) |
| 5 or more Children | 0 (0.0%) | 0 (0.0%) |
| Total | 96 (5.8%) | 137 (21.2%) |
Race in Wasilla
The most populous races in Wasilla are White / Caucasian (7,187 | 77.5%), Two or more Races (842 | 9.1%), and Native / Alaskan (643 | 6.9%).
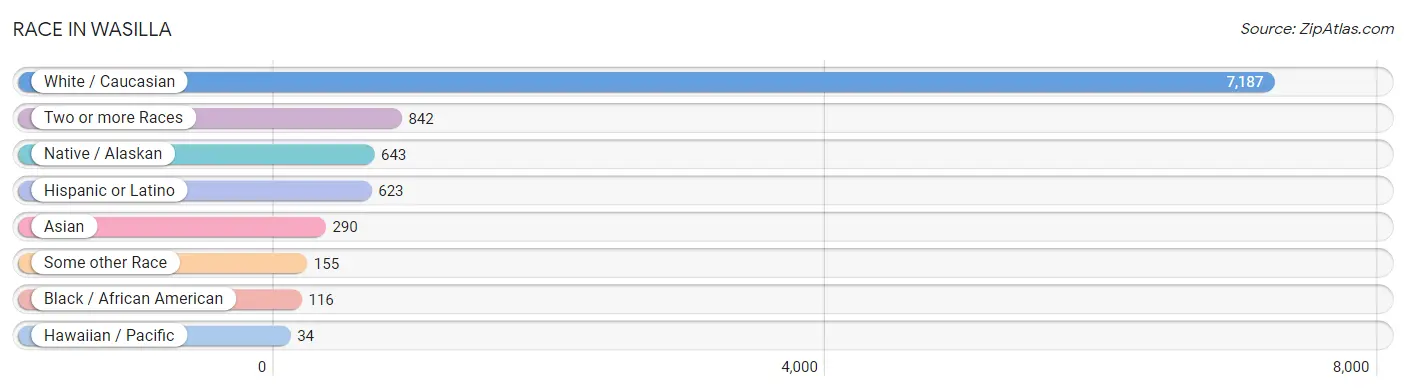
| Race | # Population | % Population |
| Asian | 290 | 3.1% |
| Black / African American | 116 | 1.3% |
| Hawaiian / Pacific | 34 | 0.4% |
| Hispanic or Latino | 623 | 6.7% |
| Native / Alaskan | 643 | 6.9% |
| White / Caucasian | 7,187 | 77.5% |
| Two or more Races | 842 | 9.1% |
| Some other Race | 155 | 1.7% |
| Total | 9,267 | 100.0% |
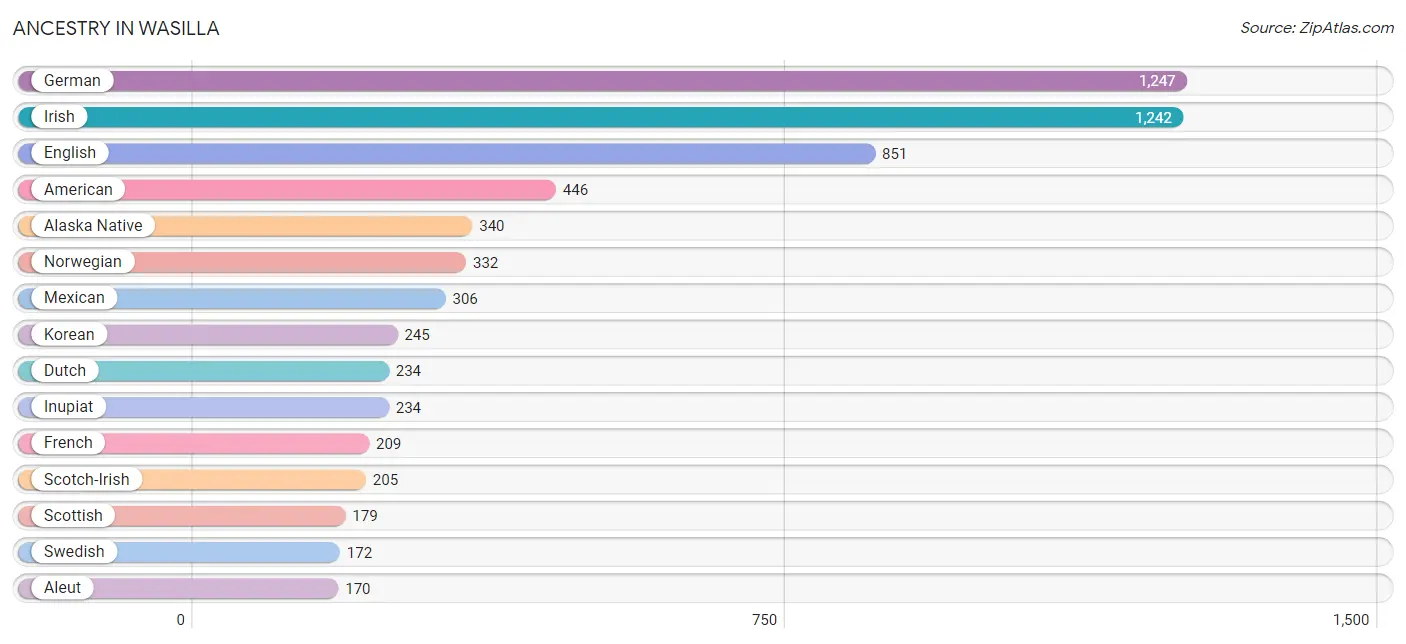
Ancestry in Wasilla
The most populous ancestries reported in Wasilla are German (1,247 | 13.5%), Irish (1,242 | 13.4%), English (851 | 9.2%), American (446 | 4.8%), and Alaska Native (340 | 3.7%), together accounting for 44.5% of all Wasilla residents.
| Ancestry | # Population | % Population |
| Alaska Native | 340 | 3.7% |
| Alaskan Athabascan | 114 | 1.2% |
| Aleut | 170 | 1.8% |
| American | 446 | 4.8% |
| Apache | 41 | 0.4% |
| Arab | 42 | 0.4% |
| Bhutanese | 38 | 0.4% |
| British | 51 | 0.5% |
| Bulgarian | 18 | 0.2% |
| Burmese | 57 | 0.6% |
| Canadian | 24 | 0.3% |
| Central American | 19 | 0.2% |
| Central American Indian | 5 | 0.1% |
| Cherokee | 111 | 1.2% |
| Cheyenne | 2 | 0.0% |
| Chippewa | 24 | 0.3% |
| Choctaw | 34 | 0.4% |
| Cuban | 146 | 1.6% |
| Czech | 84 | 0.9% |
| Czechoslovakian | 21 | 0.2% |
| Danish | 117 | 1.3% |
| Dutch | 234 | 2.5% |
| English | 851 | 9.2% |
| European | 165 | 1.8% |
| Finnish | 11 | 0.1% |
| French | 209 | 2.3% |
| French Canadian | 66 | 0.7% |
| German | 1,247 | 13.5% |
| Greek | 26 | 0.3% |
| Hopi | 72 | 0.8% |
| Indian (Asian) | 45 | 0.5% |
| Inupiat | 234 | 2.5% |
| Irish | 1,242 | 13.4% |
| Italian | 66 | 0.7% |
| Kiowa | 9 | 0.1% |
| Korean | 245 | 2.6% |
| Lebanese | 42 | 0.4% |
| Mexican | 306 | 3.3% |
| Mexican American Indian | 5 | 0.1% |
| Northern European | 46 | 0.5% |
| Norwegian | 332 | 3.6% |
| Pakistani | 32 | 0.4% |
| Panamanian | 19 | 0.2% |
| Polish | 86 | 0.9% |
| Portuguese | 17 | 0.2% |
| Puerto Rican | 97 | 1.1% |
| Russian | 99 | 1.1% |
| Samoan | 35 | 0.4% |
| Scandinavian | 64 | 0.7% |
| Scotch-Irish | 205 | 2.2% |
| Scottish | 179 | 1.9% |
| Slovene | 11 | 0.1% |
| Spaniard | 42 | 0.4% |
| Sri Lankan | 29 | 0.3% |
| Subsaharan African | 3 | 0.0% |
| Swedish | 172 | 1.9% |
| Swiss | 77 | 0.8% |
| Thai | 39 | 0.4% |
| Tlingit-Haida | 33 | 0.4% |
| Tsimshian | 21 | 0.2% |
| Ukrainian | 70 | 0.8% |
| Welsh | 153 | 1.7% |
| Yup'ik | 83 | 0.9% | View All 63 Rows |
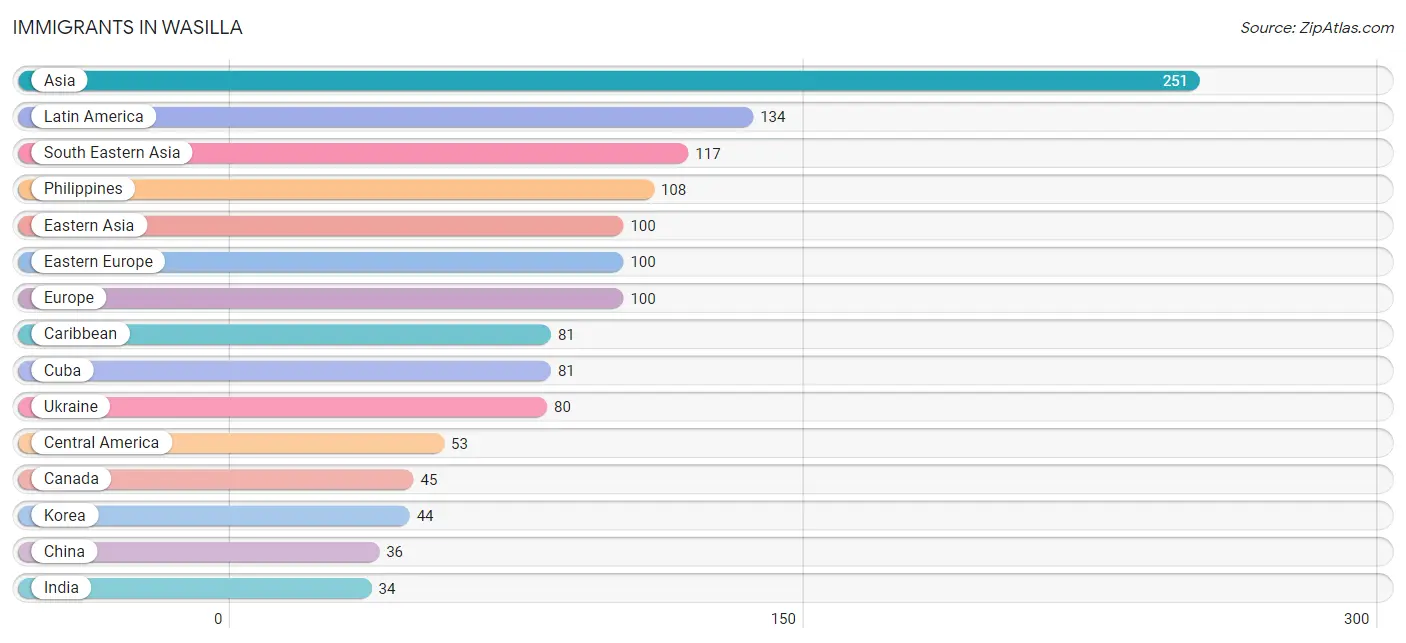
Immigrants in Wasilla
The most numerous immigrant groups reported in Wasilla came from Asia (251 | 2.7%), Latin America (134 | 1.5%), South Eastern Asia (117 | 1.3%), Philippines (108 | 1.2%), and Eastern Asia (100 | 1.1%), together accounting for 7.7% of all Wasilla residents.
| Immigration Origin | # Population | % Population |
| Africa | 3 | 0.0% |
| Asia | 251 | 2.7% |
| Canada | 45 | 0.5% |
| Caribbean | 81 | 0.9% |
| Central America | 53 | 0.6% |
| China | 36 | 0.4% |
| Cuba | 81 | 0.9% |
| Eastern Asia | 100 | 1.1% |
| Eastern Europe | 100 | 1.1% |
| Europe | 100 | 1.1% |
| India | 34 | 0.4% |
| Japan | 20 | 0.2% |
| Korea | 44 | 0.5% |
| Laos | 9 | 0.1% |
| Latin America | 134 | 1.5% |
| Mexico | 34 | 0.4% |
| Middle Africa | 3 | 0.0% |
| Moldova | 20 | 0.2% |
| Panama | 19 | 0.2% |
| Philippines | 108 | 1.2% |
| South Central Asia | 34 | 0.4% |
| South Eastern Asia | 117 | 1.3% |
| Ukraine | 80 | 0.9% | View All 23 Rows |
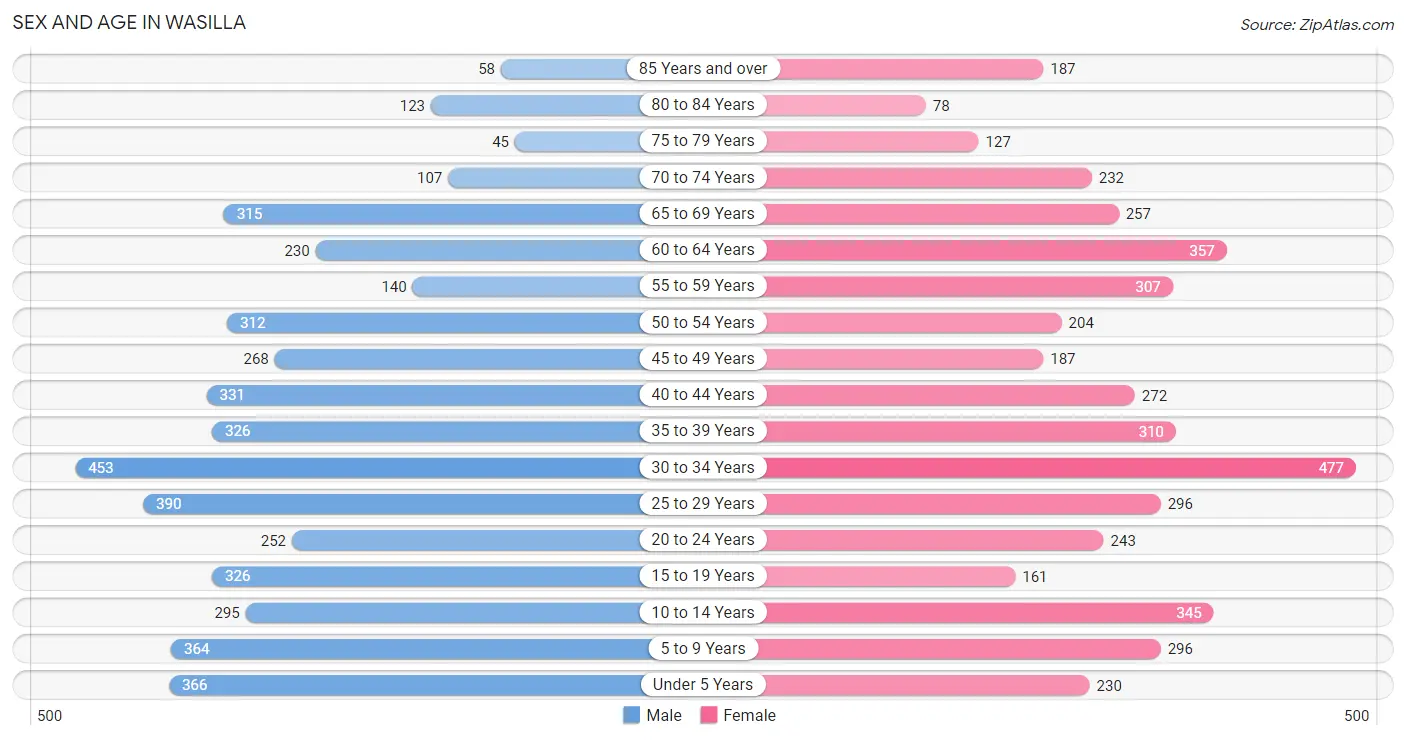
Sex and Age in Wasilla
Sex and Age in Wasilla
The most populous age groups in Wasilla are 30 to 34 Years (453 | 9.6%) for men and 30 to 34 Years (477 | 10.4%) for women.
| Age Bracket | Male | Female |
| Under 5 Years | 366 (7.8%) | 230 (5.0%) |
| 5 to 9 Years | 364 (7.7%) | 296 (6.5%) |
| 10 to 14 Years | 295 (6.3%) | 345 (7.6%) |
| 15 to 19 Years | 326 (6.9%) | 161 (3.5%) |
| 20 to 24 Years | 252 (5.4%) | 243 (5.3%) |
| 25 to 29 Years | 390 (8.3%) | 296 (6.5%) |
| 30 to 34 Years | 453 (9.6%) | 477 (10.4%) |
| 35 to 39 Years | 326 (6.9%) | 310 (6.8%) |
| 40 to 44 Years | 331 (7.0%) | 272 (6.0%) |
| 45 to 49 Years | 268 (5.7%) | 187 (4.1%) |
| 50 to 54 Years | 312 (6.6%) | 204 (4.5%) |
| 55 to 59 Years | 140 (3.0%) | 307 (6.7%) |
| 60 to 64 Years | 230 (4.9%) | 357 (7.8%) |
| 65 to 69 Years | 315 (6.7%) | 257 (5.6%) |
| 70 to 74 Years | 107 (2.3%) | 232 (5.1%) |
| 75 to 79 Years | 45 (1.0%) | 127 (2.8%) |
| 80 to 84 Years | 123 (2.6%) | 78 (1.7%) |
| 85 Years and over | 58 (1.2%) | 187 (4.1%) |
| Total | 4,701 (100.0%) | 4,566 (100.0%) |
Families and Households in Wasilla
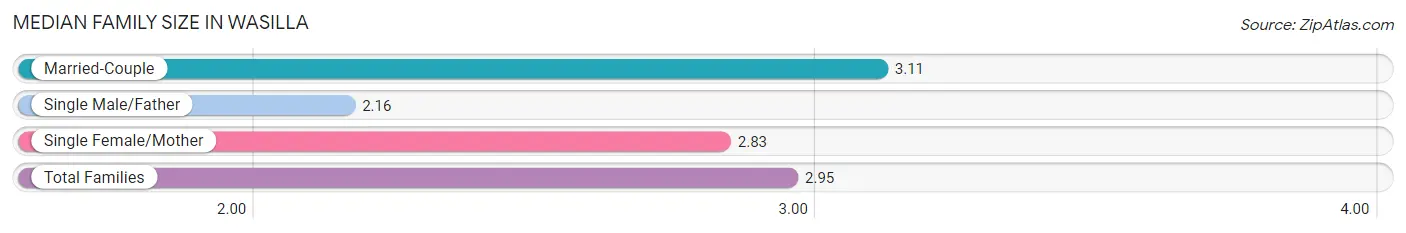
Median Family Size in Wasilla
The median family size in Wasilla is 2.95 persons per family, with married-couple families (1,650 | 71.9%) accounting for the largest median family size of 3.11 persons per family. On the other hand, single male/father families (271 | 11.8%) represent the smallest median family size with 2.16 persons per family.
| Family Type | # Families | Family Size |
| Married-Couple | 1,650 (71.9%) | 3.11 |
| Single Male/Father | 271 (11.8%) | 2.16 |
| Single Female/Mother | 375 (16.3%) | 2.83 |
| Total Families | 2,296 (100.0%) | 2.95 |
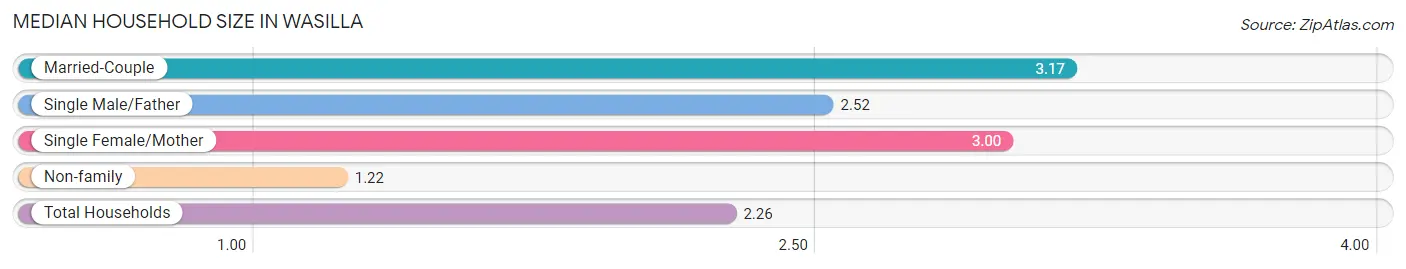
Median Household Size in Wasilla
The median household size in Wasilla is 2.26 persons per household, with married-couple households (1,650 | 40.6%) accounting for the largest median household size of 3.17 persons per household. non-family households (1,770 | 43.5%) represent the smallest median household size with 1.22 persons per household.
| Household Type | # Households | Household Size |
| Married-Couple | 1,650 (40.6%) | 3.17 |
| Single Male/Father | 271 (6.7%) | 2.52 |
| Single Female/Mother | 375 (9.2%) | 3.00 |
| Non-family | 1,770 (43.5%) | 1.22 |
| Total Households | 4,066 (100.0%) | 2.26 |
Household Size by Marriage Status in Wasilla
Out of a total of 4,066 households in Wasilla, 2,296 (56.5%) are family households, while 1,770 (43.5%) are nonfamily households. The most numerous type of family households are 2-person households, comprising 1,014, and the most common type of nonfamily households are 1-person households, comprising 1,473.
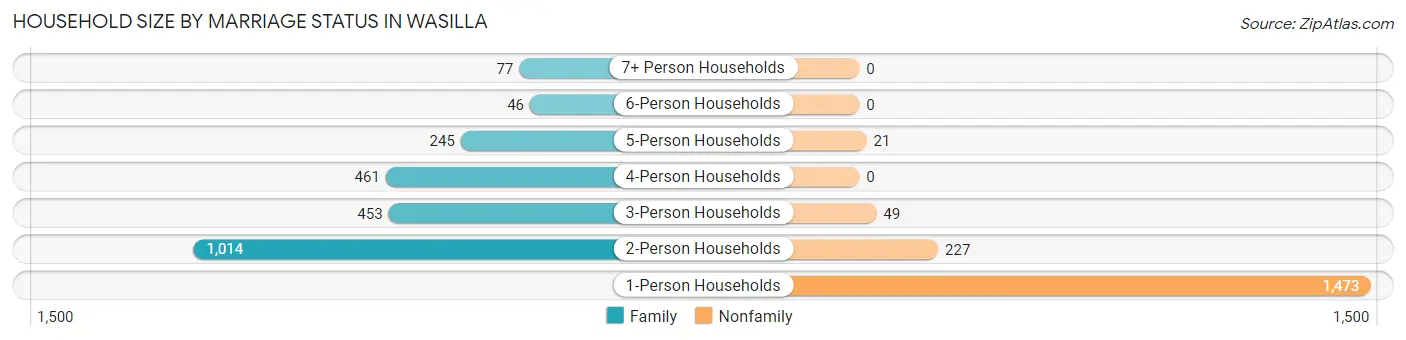
| Household Size | Family Households | Nonfamily Households |
| 1-Person Households | - | 1,473 (36.2%) |
| 2-Person Households | 1,014 (24.9%) | 227 (5.6%) |
| 3-Person Households | 453 (11.1%) | 49 (1.2%) |
| 4-Person Households | 461 (11.3%) | 0 (0.0%) |
| 5-Person Households | 245 (6.0%) | 21 (0.5%) |
| 6-Person Households | 46 (1.1%) | 0 (0.0%) |
| 7+ Person Households | 77 (1.9%) | 0 (0.0%) |
| Total | 2,296 (56.5%) | 1,770 (43.5%) |
Female Fertility in Wasilla
Fertility by Age in Wasilla
Average fertility rate in Wasilla is 64.0 births per 1,000 women. Women in the age bracket of 20 to 34 years have the highest fertility rate with 112.0 births per 1,000 women. Women in the age bracket of 20 to 34 years acount for 88.4% of all women with births.
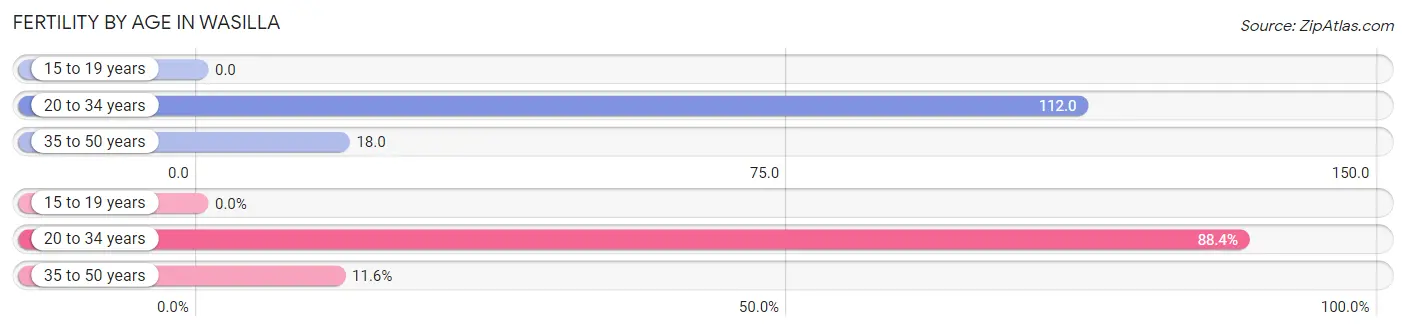
| Age Bracket | Women with Births | Births / 1,000 Women |
| 15 to 19 years | 0 (0.0%) | 0.0 |
| 20 to 34 years | 114 (88.4%) | 112.0 |
| 35 to 50 years | 15 (11.6%) | 18.0 |
| Total | 129 (100.0%) | 64.0 |
Fertility by Age by Marriage Status in Wasilla
67.4% of women with births (129) in Wasilla are married. The highest percentage of unmarried women with births falls into 35 to 50 years age bracket with 100.0% of them unmarried at the time of birth, while the lowest percentage of unmarried women with births belong to 20 to 34 years age bracket with 23.7% of them unmarried.
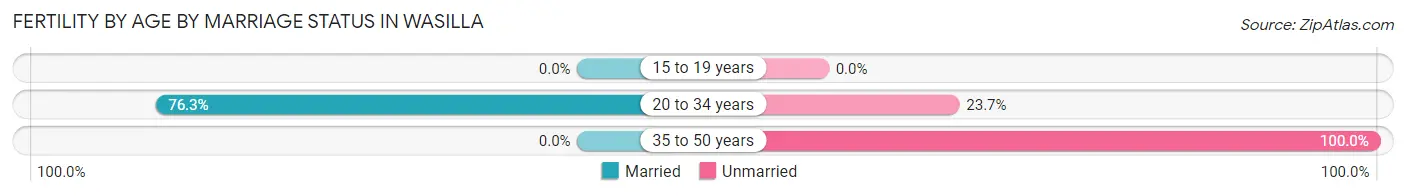
| Age Bracket | Married | Unmarried |
| 15 to 19 years | 0 (0.0%) | 0 (0.0%) |
| 20 to 34 years | 87 (76.3%) | 27 (23.7%) |
| 35 to 50 years | 0 (0.0%) | 15 (100.0%) |
| Total | 87 (67.4%) | 42 (32.6%) |
Fertility by Education in Wasilla
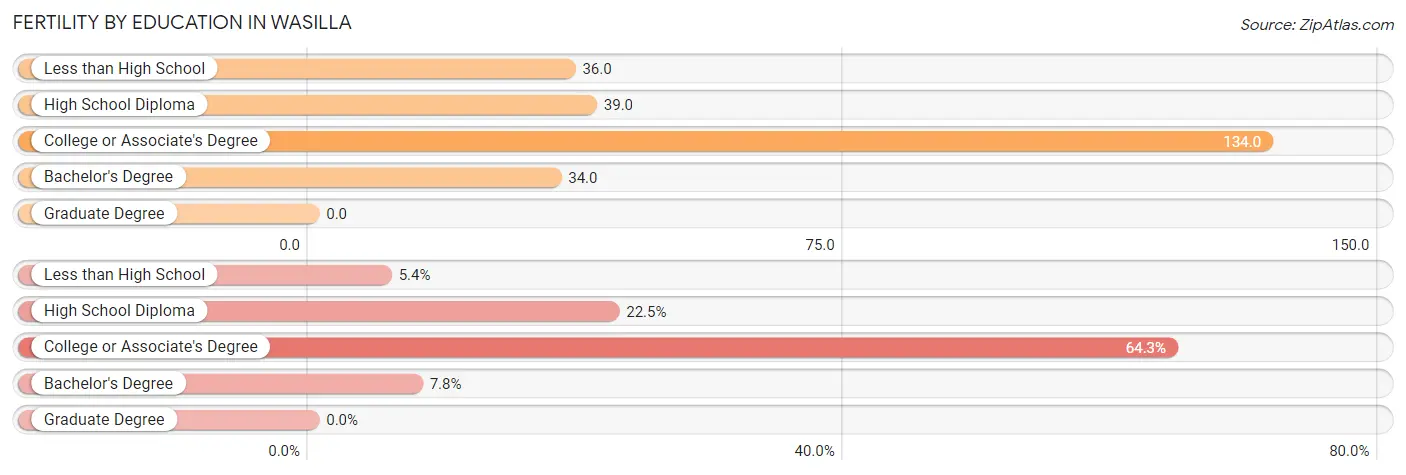
| Educational Attainment | Women with Births | Births / 1,000 Women |
| Less than High School | 7 (5.4%) | 36.0 |
| High School Diploma | 29 (22.5%) | 39.0 |
| College or Associate's Degree | 83 (64.3%) | 134.0 |
| Bachelor's Degree | 10 (7.7%) | 34.0 |
| Graduate Degree | 0 (0.0%) | 0.0 |
| Total | 129 (100.0%) | 64.0 |
Fertility by Education by Marriage Status in Wasilla
32.6% of women with births in Wasilla are unmarried. Women with the educational attainment of college or associate's degree are most likely to be married with 89.2% of them married at childbirth, while women with the educational attainment of less than high school are least likely to be married with 100.0% of them unmarried at childbirth.
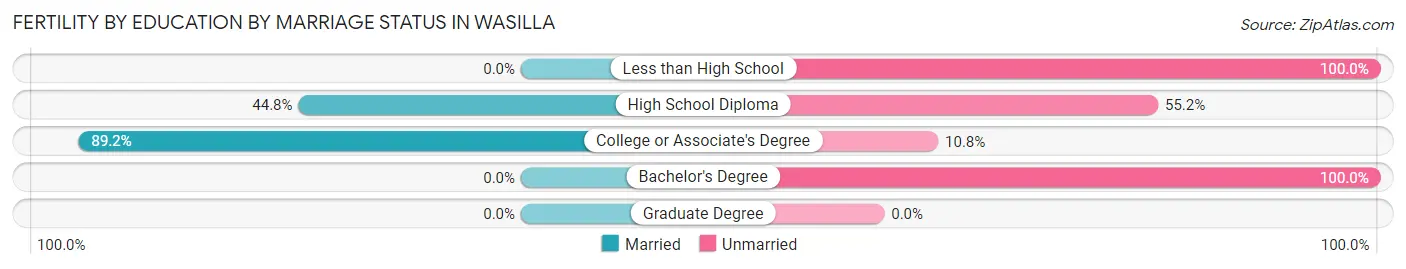
| Educational Attainment | Married | Unmarried |
| Less than High School | 0 (0.0%) | 7 (100.0%) |
| High School Diploma | 13 (44.8%) | 16 (55.2%) |
| College or Associate's Degree | 74 (89.2%) | 9 (10.8%) |
| Bachelor's Degree | 0 (0.0%) | 10 (100.0%) |
| Graduate Degree | 0 (0.0%) | 0 (0.0%) |
| Total | 87 (67.4%) | 42 (32.6%) |
Employment Characteristics in Wasilla
Employment by Class of Employer in Wasilla
Among the 3,704 employed individuals in Wasilla, private company employees (2,027 | 54.7%), not-for-profit organizations (442 | 11.9%), and federal government employees (304 | 8.2%) make up the most common classes of employment.
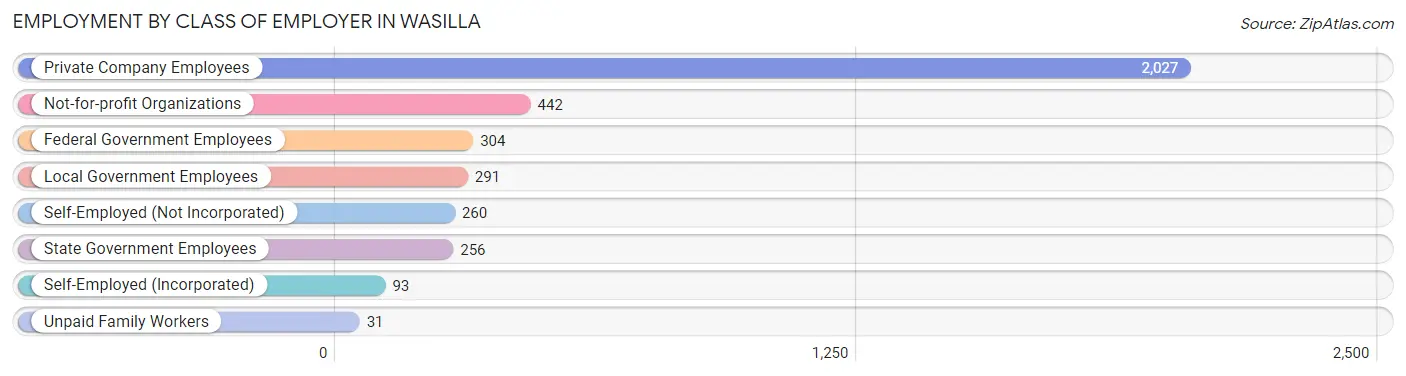
| Employer Class | # Employees | % Employees |
| Private Company Employees | 2,027 | 54.7% |
| Self-Employed (Incorporated) | 93 | 2.5% |
| Self-Employed (Not Incorporated) | 260 | 7.0% |
| Not-for-profit Organizations | 442 | 11.9% |
| Local Government Employees | 291 | 7.9% |
| State Government Employees | 256 | 6.9% |
| Federal Government Employees | 304 | 8.2% |
| Unpaid Family Workers | 31 | 0.8% |
| Total | 3,704 | 100.0% |
Employment Status by Age in Wasilla
According to the labor force statistics for Wasilla, out of the total population over 16 years of age (7,249), 58.2% or 4,219 individuals are in the labor force, with 9.7% or 409 of them unemployed. The age group with the highest labor force participation rate is 25 to 29 years, with 79.6% or 546 individuals in the labor force. Within the labor force, the 60 to 64 years age range has the highest percentage of unemployed individuals, with 26.1% or 74 of them being unemployed.
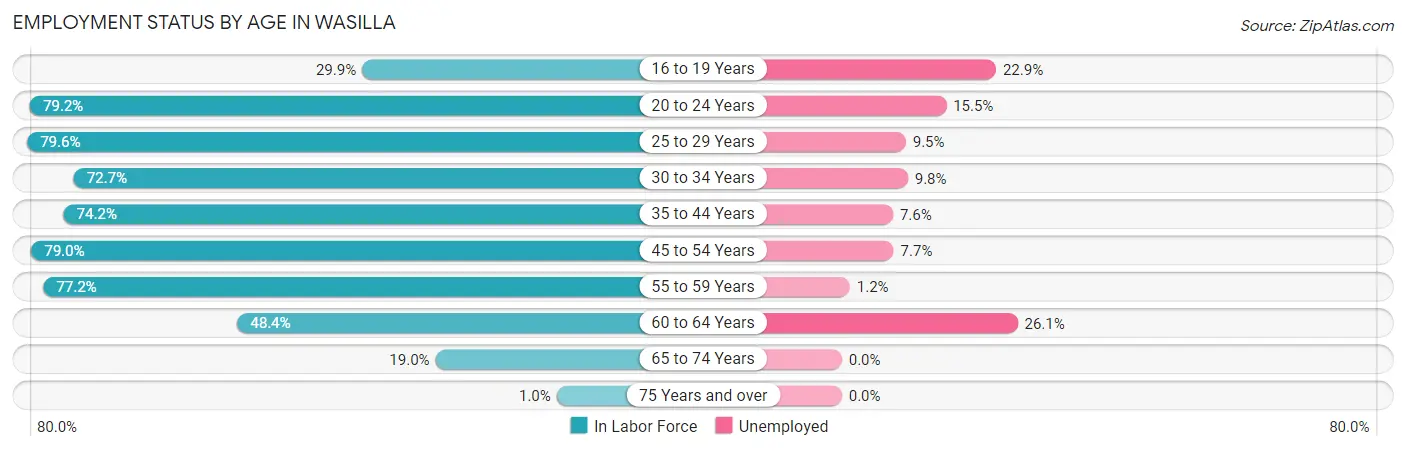
| Age Bracket | In Labor Force | Unemployed |
| 16 to 19 Years | 109 (29.9%) | 25 (22.9%) |
| 20 to 24 Years | 392 (79.2%) | 61 (15.5%) |
| 25 to 29 Years | 546 (79.6%) | 52 (9.5%) |
| 30 to 34 Years | 676 (72.7%) | 66 (9.8%) |
| 35 to 44 Years | 919 (74.2%) | 70 (7.6%) |
| 45 to 54 Years | 767 (79.0%) | 59 (7.7%) |
| 55 to 59 Years | 345 (77.2%) | 4 (1.2%) |
| 60 to 64 Years | 284 (48.4%) | 74 (26.1%) |
| 65 to 74 Years | 173 (19.0%) | 0 (0.0%) |
| 75 Years and over | 6 (1.0%) | 0 (0.0%) |
| Total | 4,219 (58.2%) | 409 (9.7%) |
Employment Status by Educational Attainment in Wasilla
According to labor force statistics for Wasilla, 72.8% of individuals (3,538) out of the total population between 25 and 64 years of age (4,860) are in the labor force, with 9.2% or 325 of them being unemployed. The group with the highest labor force participation rate are those with the educational attainment of bachelor's degree or higher, with 90.6% or 919 individuals in the labor force. Within the labor force, individuals with high school diploma education have the highest percentage of unemployment, with 16.0% or 189 of them being unemployed.
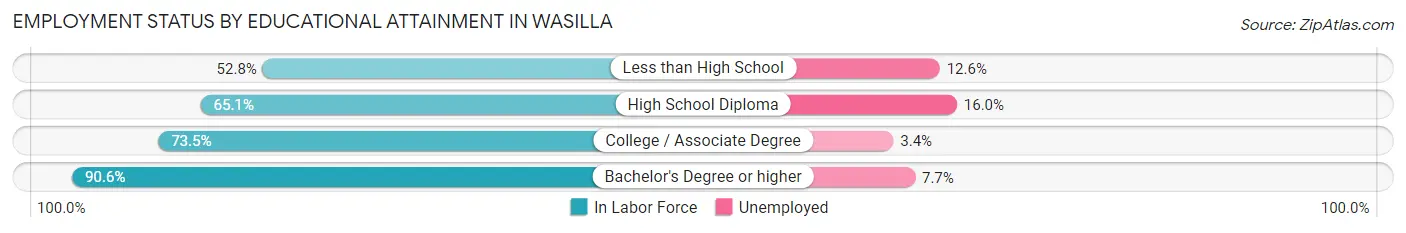
| Educational Attainment | In Labor Force | Unemployed |
| Less than High School | 143 (52.8%) | 34 (12.6%) |
| High School Diploma | 1,184 (65.1%) | 291 (16.0%) |
| College / Associate Degree | 1,291 (73.5%) | 60 (3.4%) |
| Bachelor's Degree or higher | 919 (90.6%) | 78 (7.7%) |
| Total | 3,538 (72.8%) | 447 (9.2%) |
Employment Occupations by Sex in Wasilla
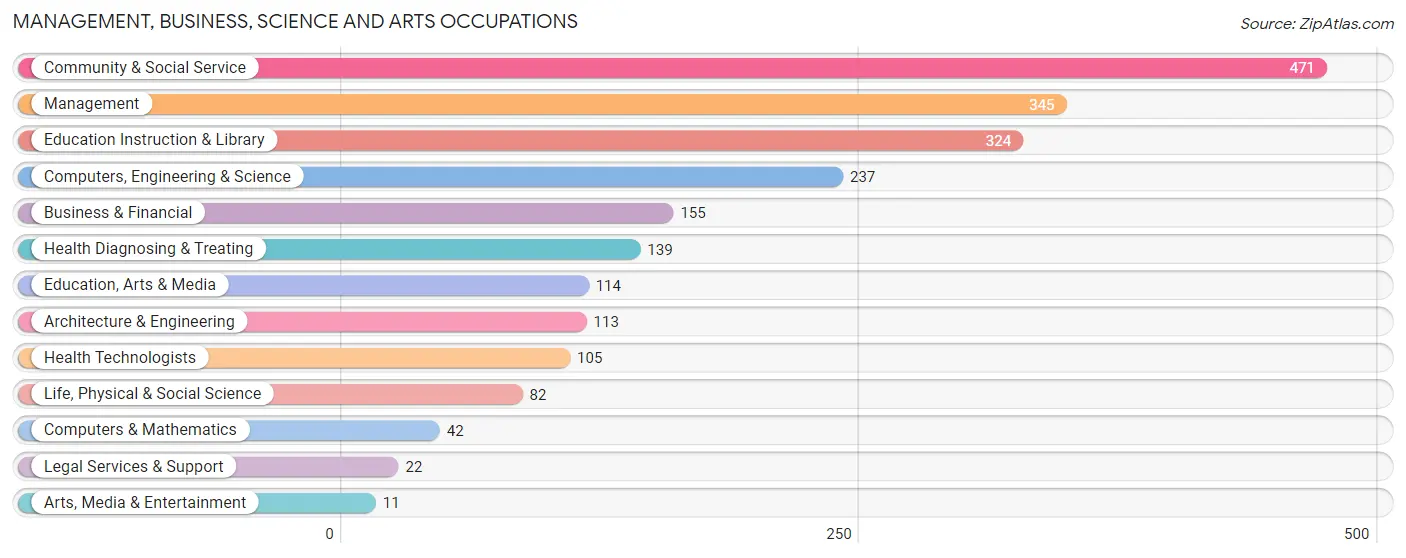
Management, Business, Science and Arts Occupations
The most common Management, Business, Science and Arts occupations in Wasilla are Community & Social Service (471 | 12.8%), Management (345 | 9.3%), Education Instruction & Library (324 | 8.8%), Computers, Engineering & Science (237 | 6.4%), and Business & Financial (155 | 4.2%).
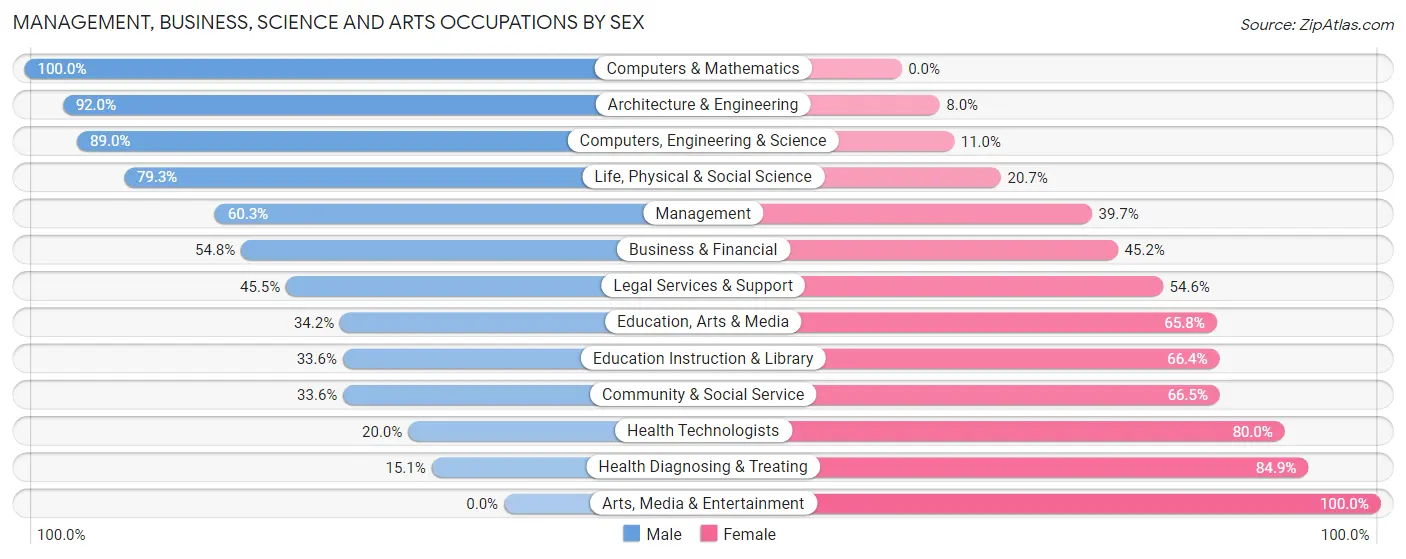
Management, Business, Science and Arts Occupations by Sex
Within the Management, Business, Science and Arts occupations in Wasilla, the most male-oriented occupations are Computers & Mathematics (100.0%), Architecture & Engineering (92.0%), and Computers, Engineering & Science (89.0%), while the most female-oriented occupations are Arts, Media & Entertainment (100.0%), Health Diagnosing & Treating (84.9%), and Health Technologists (80.0%).
| Occupation | Male | Female |
| Management | 208 (60.3%) | 137 (39.7%) |
| Business & Financial | 85 (54.8%) | 70 (45.2%) |
| Computers, Engineering & Science | 211 (89.0%) | 26 (11.0%) |
| Computers & Mathematics | 42 (100.0%) | 0 (0.0%) |
| Architecture & Engineering | 104 (92.0%) | 9 (8.0%) |
| Life, Physical & Social Science | 65 (79.3%) | 17 (20.7%) |
| Community & Social Service | 158 (33.6%) | 313 (66.4%) |
| Education, Arts & Media | 39 (34.2%) | 75 (65.8%) |
| Legal Services & Support | 10 (45.5%) | 12 (54.5%) |
| Education Instruction & Library | 109 (33.6%) | 215 (66.4%) |
| Arts, Media & Entertainment | 0 (0.0%) | 11 (100.0%) |
| Health Diagnosing & Treating | 21 (15.1%) | 118 (84.9%) |
| Health Technologists | 21 (20.0%) | 84 (80.0%) |
| Total (Category) | 683 (50.7%) | 664 (49.3%) |
| Total (Overall) | 2,063 (55.9%) | 1,627 (44.1%) |
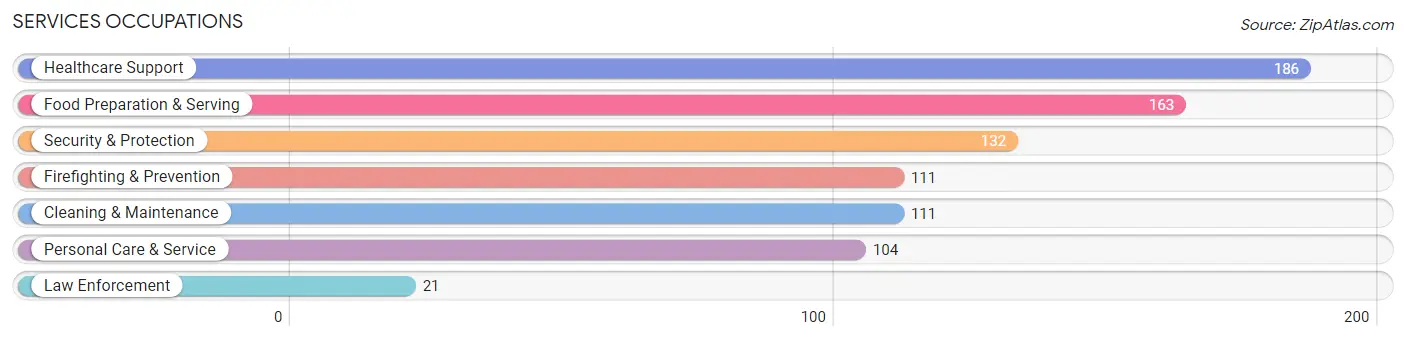
Services Occupations
The most common Services occupations in Wasilla are Healthcare Support (186 | 5.0%), Food Preparation & Serving (163 | 4.4%), Security & Protection (132 | 3.6%), Firefighting & Prevention (111 | 3.0%), and Cleaning & Maintenance (111 | 3.0%).
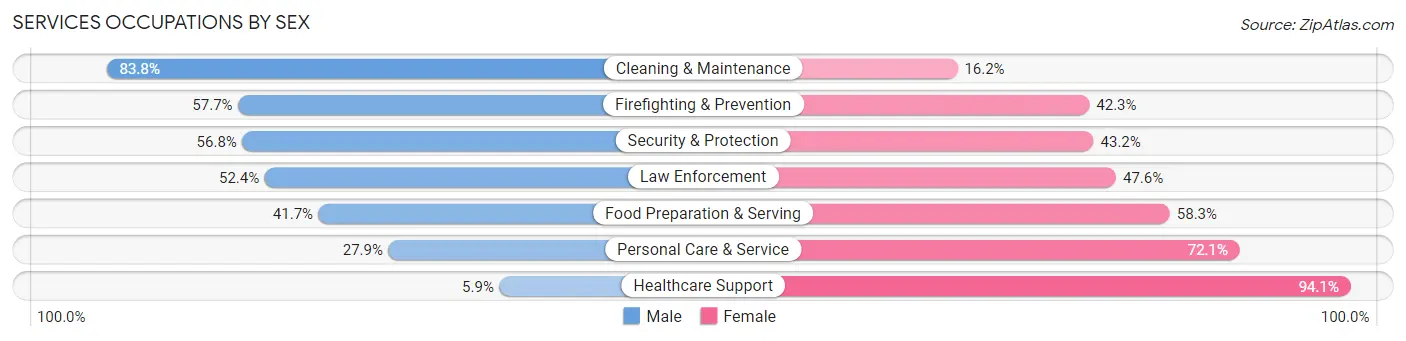
Services Occupations by Sex
Within the Services occupations in Wasilla, the most male-oriented occupations are Cleaning & Maintenance (83.8%), Firefighting & Prevention (57.7%), and Security & Protection (56.8%), while the most female-oriented occupations are Healthcare Support (94.1%), Personal Care & Service (72.1%), and Food Preparation & Serving (58.3%).
| Occupation | Male | Female |
| Healthcare Support | 11 (5.9%) | 175 (94.1%) |
| Security & Protection | 75 (56.8%) | 57 (43.2%) |
| Firefighting & Prevention | 64 (57.7%) | 47 (42.3%) |
| Law Enforcement | 11 (52.4%) | 10 (47.6%) |
| Food Preparation & Serving | 68 (41.7%) | 95 (58.3%) |
| Cleaning & Maintenance | 93 (83.8%) | 18 (16.2%) |
| Personal Care & Service | 29 (27.9%) | 75 (72.1%) |
| Total (Category) | 276 (39.7%) | 420 (60.3%) |
| Total (Overall) | 2,063 (55.9%) | 1,627 (44.1%) |
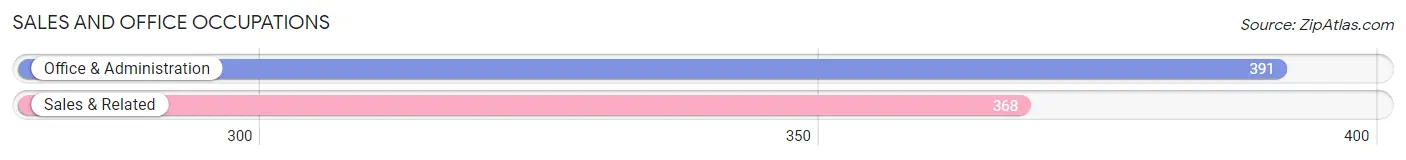
Sales and Office Occupations
The most common Sales and Office occupations in Wasilla are Office & Administration (391 | 10.6%), and Sales & Related (368 | 10.0%).
Sales and Office Occupations by Sex

| Occupation | Male | Female |
| Sales & Related | 197 (53.5%) | 171 (46.5%) |
| Office & Administration | 69 (17.6%) | 322 (82.4%) |
| Total (Category) | 266 (35.0%) | 493 (64.9%) |
| Total (Overall) | 2,063 (55.9%) | 1,627 (44.1%) |
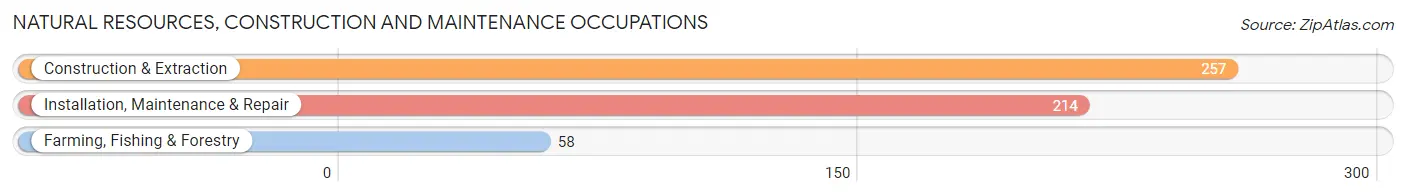
Natural Resources, Construction and Maintenance Occupations
The most common Natural Resources, Construction and Maintenance occupations in Wasilla are Construction & Extraction (257 | 7.0%), Installation, Maintenance & Repair (214 | 5.8%), and Farming, Fishing & Forestry (58 | 1.6%).
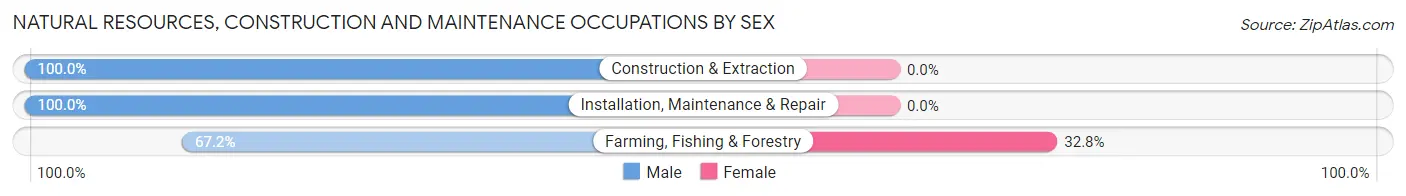
Natural Resources, Construction and Maintenance Occupations by Sex
| Occupation | Male | Female |
| Farming, Fishing & Forestry | 39 (67.2%) | 19 (32.8%) |
| Construction & Extraction | 257 (100.0%) | 0 (0.0%) |
| Installation, Maintenance & Repair | 214 (100.0%) | 0 (0.0%) |
| Total (Category) | 510 (96.4%) | 19 (3.6%) |
| Total (Overall) | 2,063 (55.9%) | 1,627 (44.1%) |
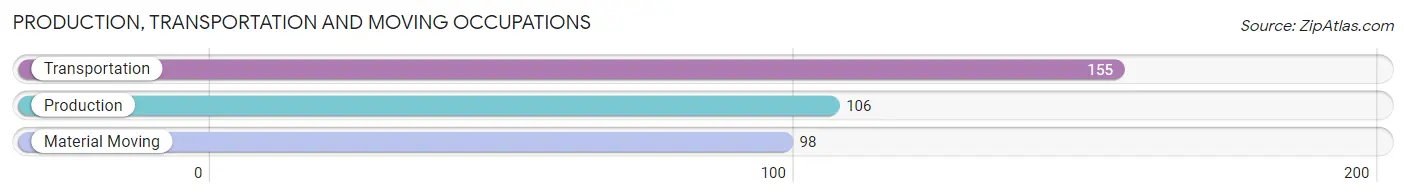
Production, Transportation and Moving Occupations
The most common Production, Transportation and Moving occupations in Wasilla are Transportation (155 | 4.2%), Production (106 | 2.9%), and Material Moving (98 | 2.7%).
Production, Transportation and Moving Occupations by Sex
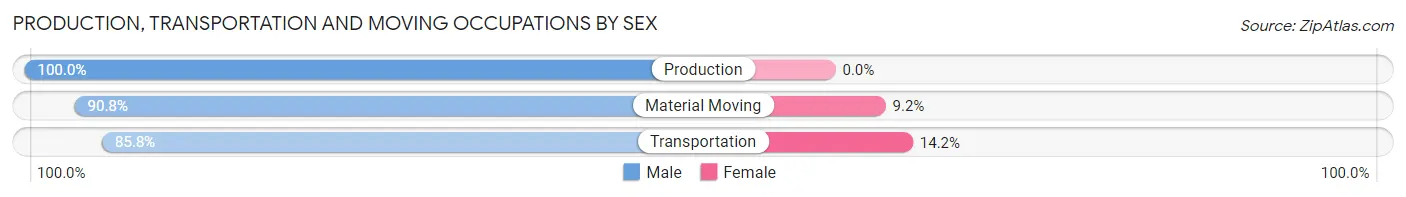
| Occupation | Male | Female |
| Production | 106 (100.0%) | 0 (0.0%) |
| Transportation | 133 (85.8%) | 22 (14.2%) |
| Material Moving | 89 (90.8%) | 9 (9.2%) |
| Total (Category) | 328 (91.4%) | 31 (8.6%) |
| Total (Overall) | 2,063 (55.9%) | 1,627 (44.1%) |
Employment Industries by Sex in Wasilla
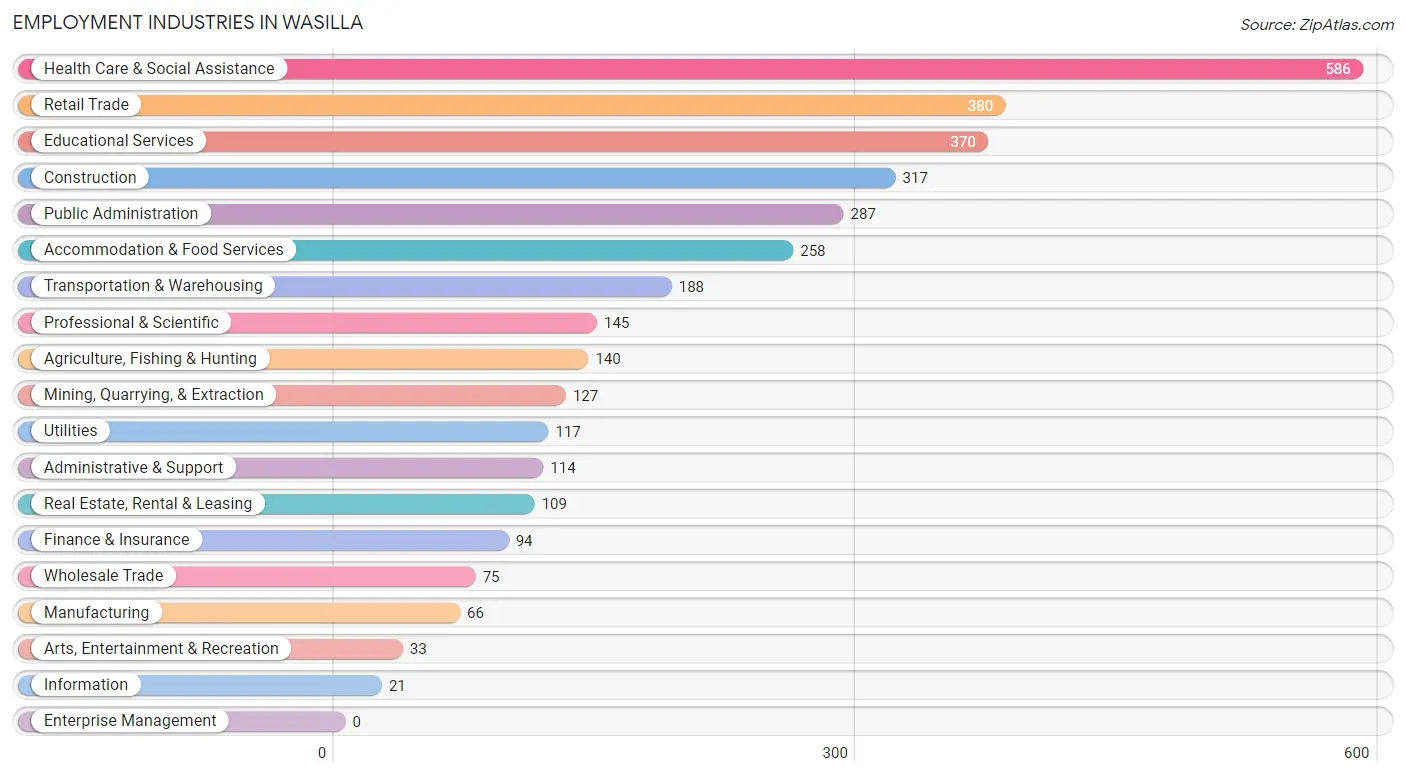
Employment Industries in Wasilla
The major employment industries in Wasilla include Health Care & Social Assistance (586 | 15.9%), Retail Trade (380 | 10.3%), Educational Services (370 | 10.0%), Construction (317 | 8.6%), and Public Administration (287 | 7.8%).
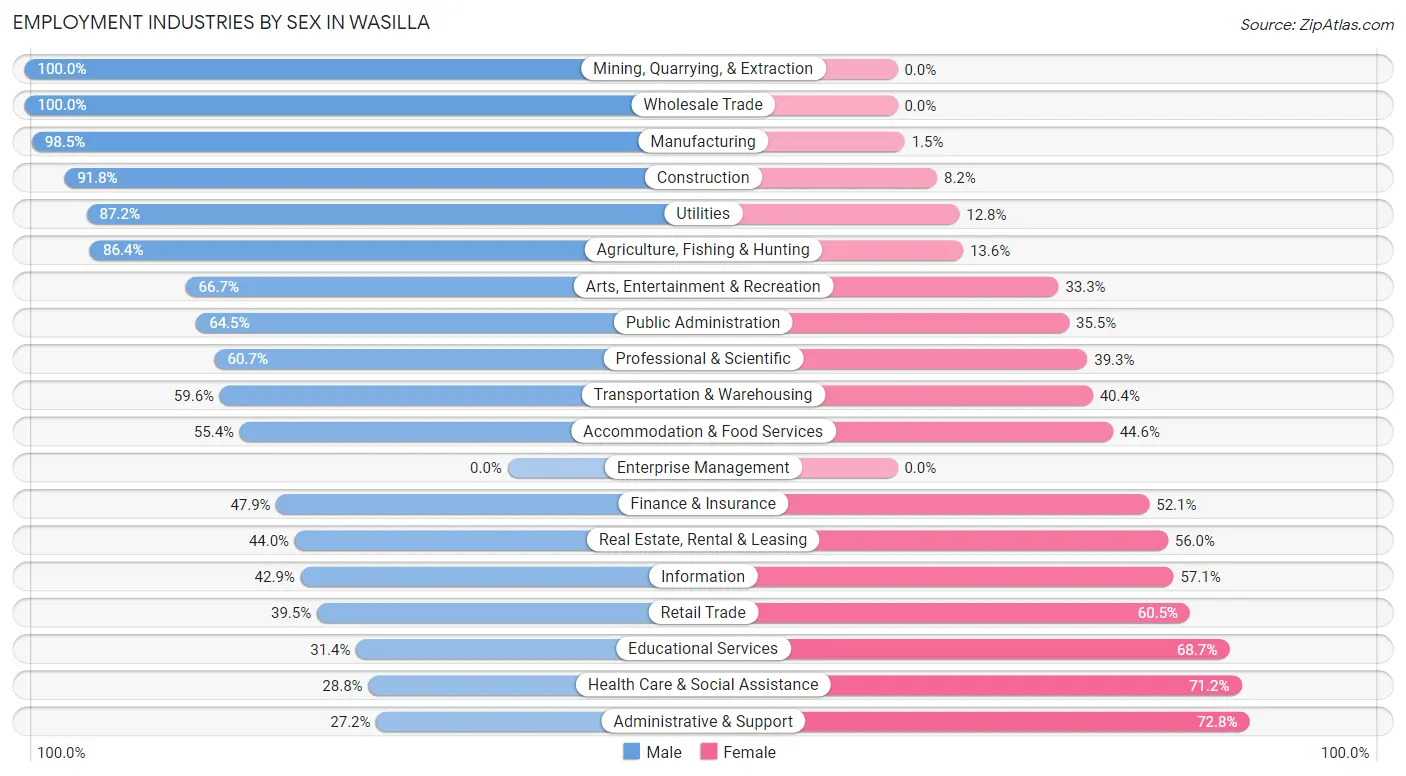
Employment Industries by Sex in Wasilla
The Wasilla industries that see more men than women are Mining, Quarrying, & Extraction (100.0%), Wholesale Trade (100.0%), and Manufacturing (98.5%), whereas the industries that tend to have a higher number of women are Administrative & Support (72.8%), Health Care & Social Assistance (71.2%), and Educational Services (68.6%).
| Industry | Male | Female |
| Agriculture, Fishing & Hunting | 121 (86.4%) | 19 (13.6%) |
| Mining, Quarrying, & Extraction | 127 (100.0%) | 0 (0.0%) |
| Construction | 291 (91.8%) | 26 (8.2%) |
| Manufacturing | 65 (98.5%) | 1 (1.5%) |
| Wholesale Trade | 75 (100.0%) | 0 (0.0%) |
| Retail Trade | 150 (39.5%) | 230 (60.5%) |
| Transportation & Warehousing | 112 (59.6%) | 76 (40.4%) |
| Utilities | 102 (87.2%) | 15 (12.8%) |
| Information | 9 (42.9%) | 12 (57.1%) |
| Finance & Insurance | 45 (47.9%) | 49 (52.1%) |
| Real Estate, Rental & Leasing | 48 (44.0%) | 61 (56.0%) |
| Professional & Scientific | 88 (60.7%) | 57 (39.3%) |
| Enterprise Management | 0 (0.0%) | 0 (0.0%) |
| Administrative & Support | 31 (27.2%) | 83 (72.8%) |
| Educational Services | 116 (31.4%) | 254 (68.6%) |
| Health Care & Social Assistance | 169 (28.8%) | 417 (71.2%) |
| Arts, Entertainment & Recreation | 22 (66.7%) | 11 (33.3%) |
| Accommodation & Food Services | 143 (55.4%) | 115 (44.6%) |
| Public Administration | 185 (64.5%) | 102 (35.5%) |
| Total | 2,063 (55.9%) | 1,627 (44.1%) |
Education in Wasilla
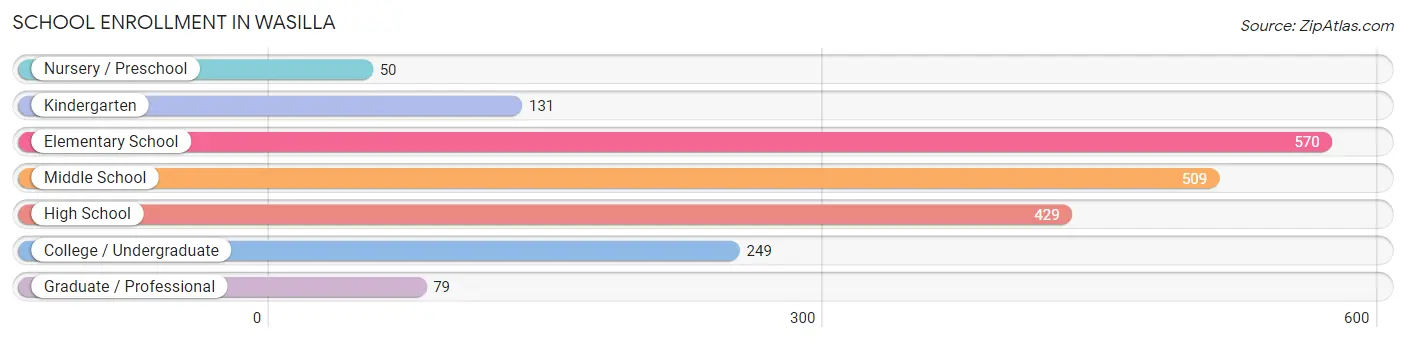
School Enrollment in Wasilla
The most common levels of schooling among the 2,017 students in Wasilla are elementary school (570 | 28.3%), middle school (509 | 25.2%), and high school (429 | 21.3%).
| School Level | # Students | % Students |
| Nursery / Preschool | 50 | 2.5% |
| Kindergarten | 131 | 6.5% |
| Elementary School | 570 | 28.3% |
| Middle School | 509 | 25.2% |
| High School | 429 | 21.3% |
| College / Undergraduate | 249 | 12.3% |
| Graduate / Professional | 79 | 3.9% |
| Total | 2,017 | 100.0% |
School Enrollment by Age by Funding Source in Wasilla
Out of a total of 2,017 students who are enrolled in schools in Wasilla, 335 (16.6%) attend a private institution, while the remaining 1,682 (83.4%) are enrolled in public schools. The age group of 3 to 4 year olds has the highest likelihood of being enrolled in private schools, with 21 (61.8% in the age bracket) enrolled. Conversely, the age group of 18 to 19 year olds has the lowest likelihood of being enrolled in a private school, with 41 (100.0% in the age bracket) attending a public institution.
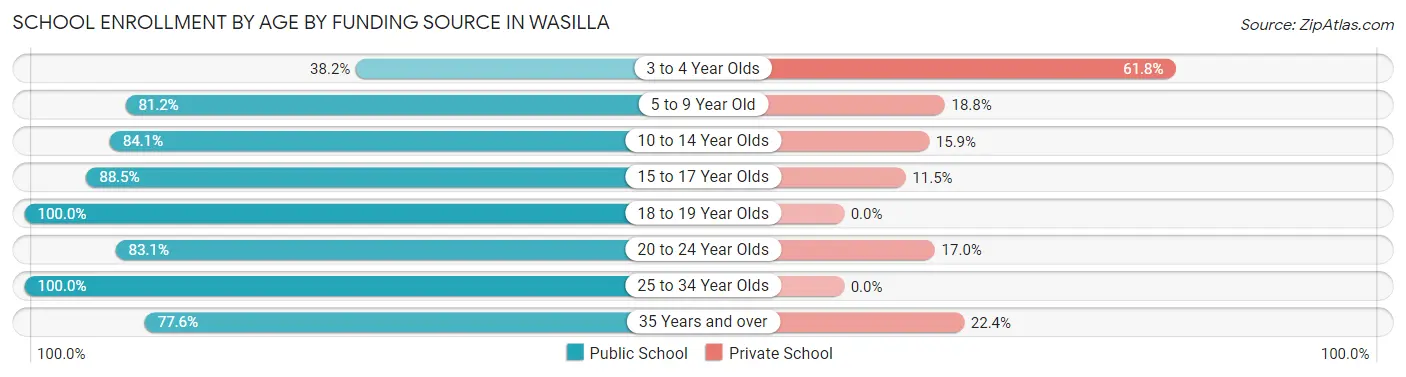
| Age Bracket | Public School | Private School |
| 3 to 4 Year Olds | 13 (38.2%) | 21 (61.8%) |
| 5 to 9 Year Old | 510 (81.2%) | 118 (18.8%) |
| 10 to 14 Year Olds | 530 (84.1%) | 100 (15.9%) |
| 15 to 17 Year Olds | 354 (88.5%) | 46 (11.5%) |
| 18 to 19 Year Olds | 41 (100.0%) | 0 (0.0%) |
| 20 to 24 Year Olds | 98 (83.1%) | 20 (17.0%) |
| 25 to 34 Year Olds | 32 (100.0%) | 0 (0.0%) |
| 35 Years and over | 104 (77.6%) | 30 (22.4%) |
| Total | 1,682 (83.4%) | 335 (16.6%) |
Educational Attainment by Field of Study in Wasilla
Education (300 | 21.9%), science & technology (210 | 15.3%), social sciences (157 | 11.4%), arts & humanities (155 | 11.3%), and business (135 | 9.8%) are the most common fields of study among 1,372 individuals in Wasilla who have obtained a bachelor's degree or higher.
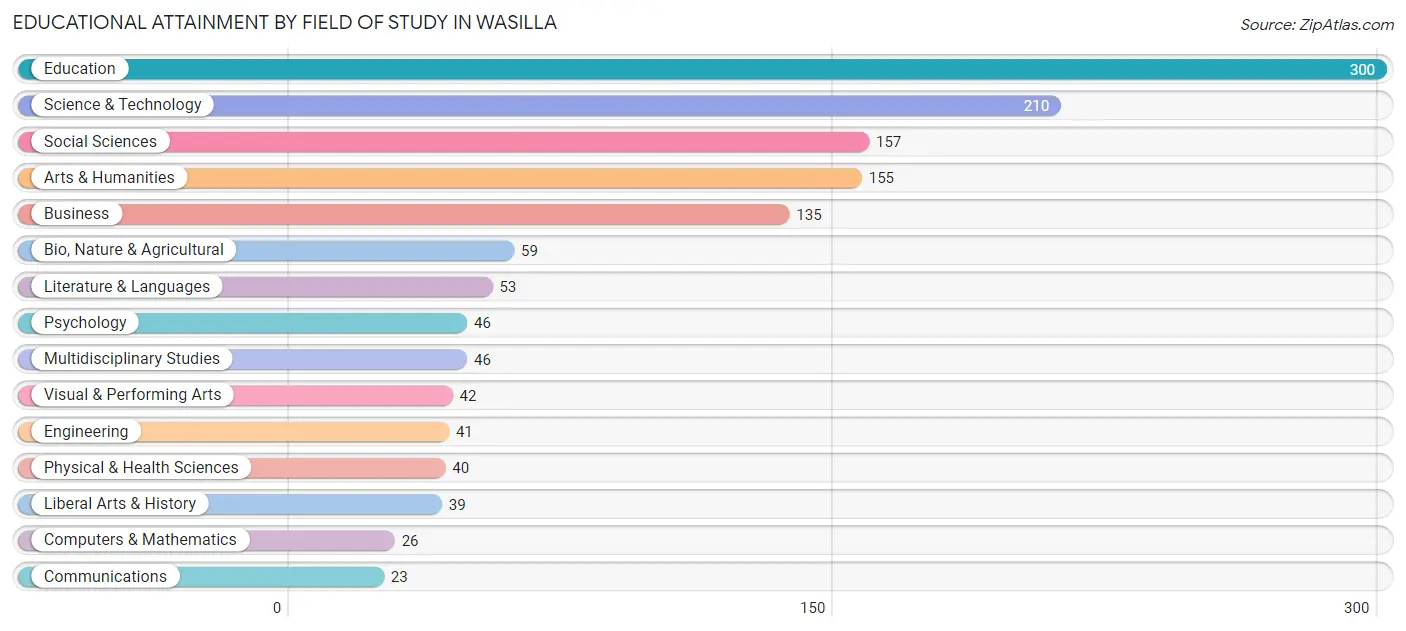
| Field of Study | # Graduates | % Graduates |
| Computers & Mathematics | 26 | 1.9% |
| Bio, Nature & Agricultural | 59 | 4.3% |
| Physical & Health Sciences | 40 | 2.9% |
| Psychology | 46 | 3.4% |
| Social Sciences | 157 | 11.4% |
| Engineering | 41 | 3.0% |
| Multidisciplinary Studies | 46 | 3.4% |
| Science & Technology | 210 | 15.3% |
| Business | 135 | 9.8% |
| Education | 300 | 21.9% |
| Literature & Languages | 53 | 3.9% |
| Liberal Arts & History | 39 | 2.8% |
| Visual & Performing Arts | 42 | 3.1% |
| Communications | 23 | 1.7% |
| Arts & Humanities | 155 | 11.3% |
| Total | 1,372 | 100.0% |
Transportation & Commute in Wasilla
Vehicle Availability by Sex in Wasilla
The most prevalent vehicle ownership categories in Wasilla are males with 2 vehicles (793, accounting for 37.4%) and females with 2 vehicles (642, making up 50.2%).
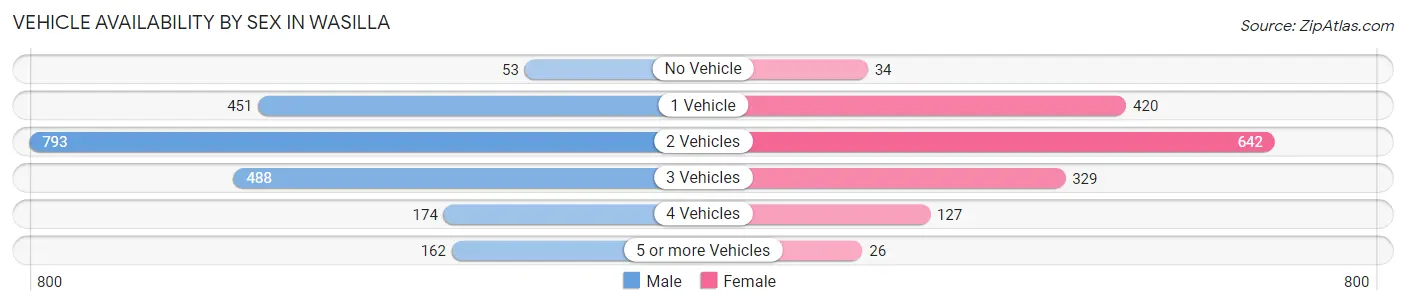
| Vehicles Available | Male | Female |
| No Vehicle | 53 (2.5%) | 34 (2.1%) |
| 1 Vehicle | 451 (21.3%) | 420 (26.6%) |
| 2 Vehicles | 793 (37.4%) | 642 (40.7%) |
| 3 Vehicles | 488 (23.0%) | 329 (20.8%) |
| 4 Vehicles | 174 (8.2%) | 127 (8.1%) |
| 5 or more Vehicles | 162 (7.6%) | 26 (1.7%) |
| Total | 2,121 (100.0%) | 1,578 (100.0%) |
Commute Time in Wasilla
The most frequently occuring commute durations in Wasilla are 5 to 9 minutes (448 commuters, 12.8%), 20 to 24 minutes (443 commuters, 12.7%), and 10 to 14 minutes (436 commuters, 12.5%).
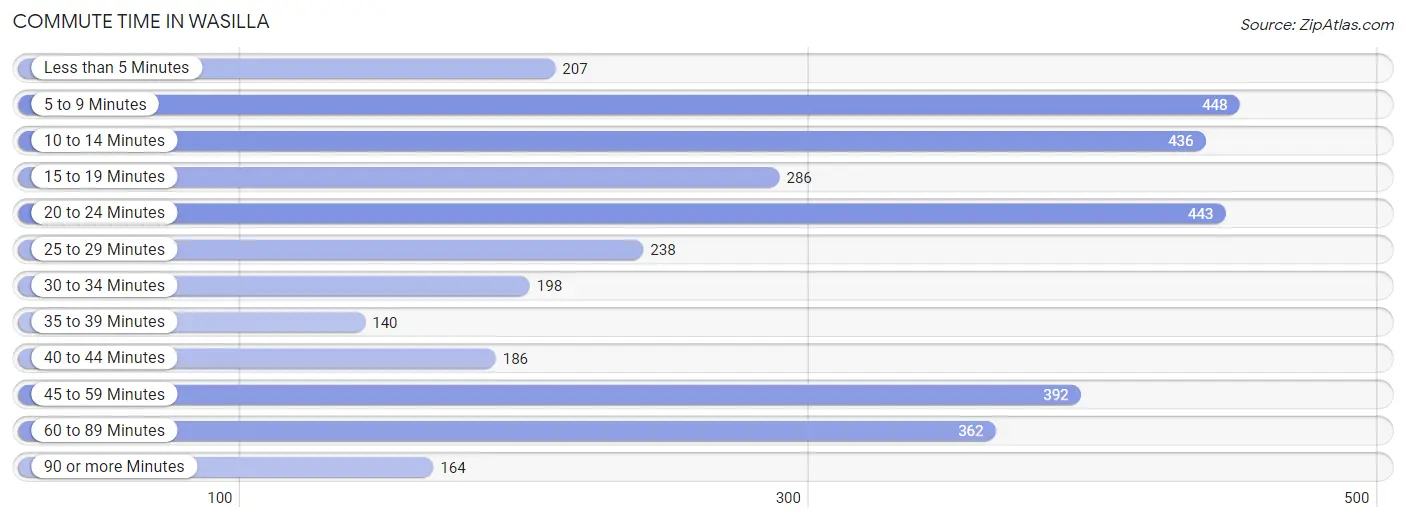
| Commute Time | # Commuters | % Commuters |
| Less than 5 Minutes | 207 | 5.9% |
| 5 to 9 Minutes | 448 | 12.8% |
| 10 to 14 Minutes | 436 | 12.5% |
| 15 to 19 Minutes | 286 | 8.2% |
| 20 to 24 Minutes | 443 | 12.7% |
| 25 to 29 Minutes | 238 | 6.8% |
| 30 to 34 Minutes | 198 | 5.7% |
| 35 to 39 Minutes | 140 | 4.0% |
| 40 to 44 Minutes | 186 | 5.3% |
| 45 to 59 Minutes | 392 | 11.2% |
| 60 to 89 Minutes | 362 | 10.3% |
| 90 or more Minutes | 164 | 4.7% |
Commute Time by Sex in Wasilla
The most common commute times in Wasilla are 60 to 89 minutes (288 commuters, 13.8%) for males and 5 to 9 minutes (300 commuters, 21.3%) for females.
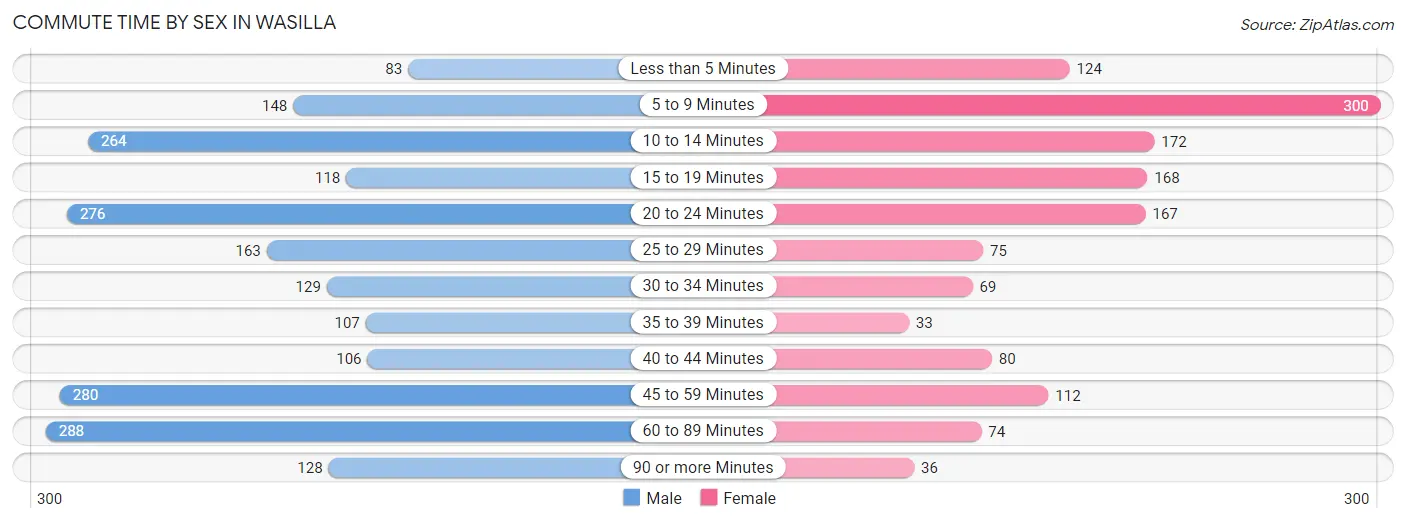
| Commute Time | Male | Female |
| Less than 5 Minutes | 83 (4.0%) | 124 (8.8%) |
| 5 to 9 Minutes | 148 (7.1%) | 300 (21.3%) |
| 10 to 14 Minutes | 264 (12.6%) | 172 (12.2%) |
| 15 to 19 Minutes | 118 (5.7%) | 168 (11.9%) |
| 20 to 24 Minutes | 276 (13.2%) | 167 (11.8%) |
| 25 to 29 Minutes | 163 (7.8%) | 75 (5.3%) |
| 30 to 34 Minutes | 129 (6.2%) | 69 (4.9%) |
| 35 to 39 Minutes | 107 (5.1%) | 33 (2.3%) |
| 40 to 44 Minutes | 106 (5.1%) | 80 (5.7%) |
| 45 to 59 Minutes | 280 (13.4%) | 112 (7.9%) |
| 60 to 89 Minutes | 288 (13.8%) | 74 (5.2%) |
| 90 or more Minutes | 128 (6.1%) | 36 (2.5%) |
Time of Departure to Work by Sex in Wasilla
The most frequent times of departure to work in Wasilla are 7:00 AM to 7:29 AM (279, 13.4%) for males and 7:00 AM to 7:29 AM (330, 23.4%) for females.
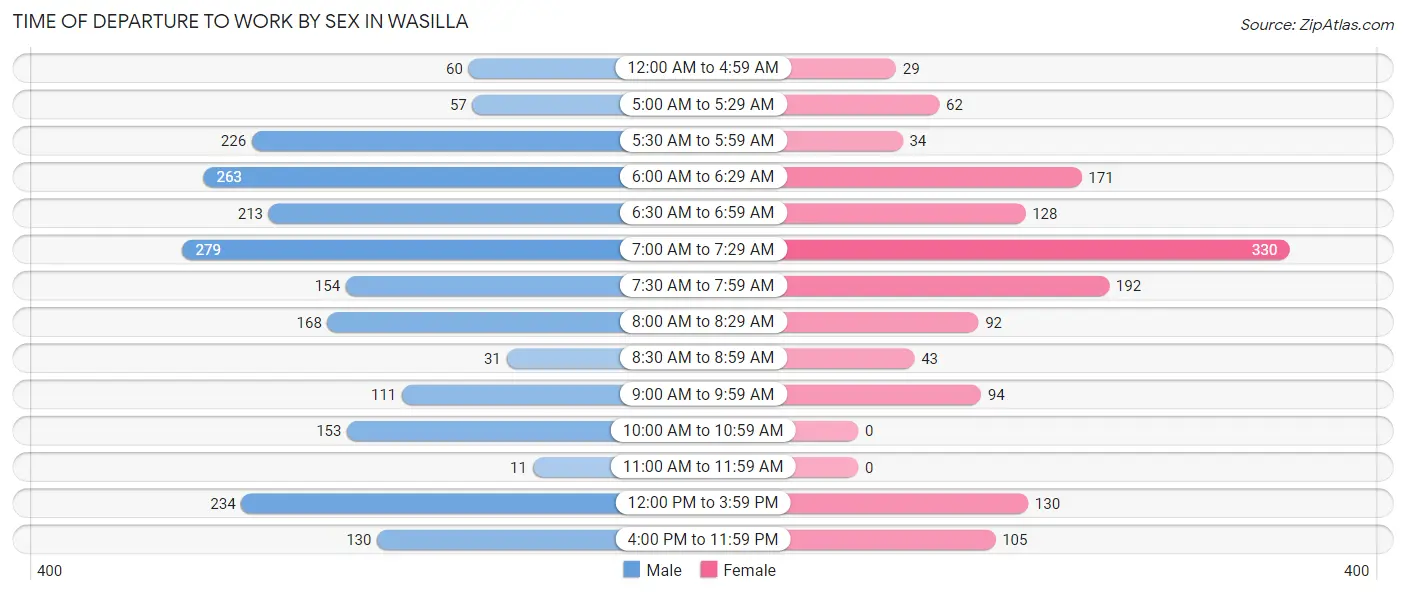
| Time of Departure | Male | Female |
| 12:00 AM to 4:59 AM | 60 (2.9%) | 29 (2.1%) |
| 5:00 AM to 5:29 AM | 57 (2.7%) | 62 (4.4%) |
| 5:30 AM to 5:59 AM | 226 (10.8%) | 34 (2.4%) |
| 6:00 AM to 6:29 AM | 263 (12.6%) | 171 (12.1%) |
| 6:30 AM to 6:59 AM | 213 (10.2%) | 128 (9.1%) |
| 7:00 AM to 7:29 AM | 279 (13.4%) | 330 (23.4%) |
| 7:30 AM to 7:59 AM | 154 (7.4%) | 192 (13.6%) |
| 8:00 AM to 8:29 AM | 168 (8.0%) | 92 (6.5%) |
| 8:30 AM to 8:59 AM | 31 (1.5%) | 43 (3.0%) |
| 9:00 AM to 9:59 AM | 111 (5.3%) | 94 (6.7%) |
| 10:00 AM to 10:59 AM | 153 (7.3%) | 0 (0.0%) |
| 11:00 AM to 11:59 AM | 11 (0.5%) | 0 (0.0%) |
| 12:00 PM to 3:59 PM | 234 (11.2%) | 130 (9.2%) |
| 4:00 PM to 11:59 PM | 130 (6.2%) | 105 (7.4%) |
| Total | 2,090 (100.0%) | 1,410 (100.0%) |
Housing Occupancy in Wasilla
Occupancy by Ownership in Wasilla
Of the total 4,066 dwellings in Wasilla, owner-occupied units account for 2,184 (53.7%), while renter-occupied units make up 1,882 (46.3%).
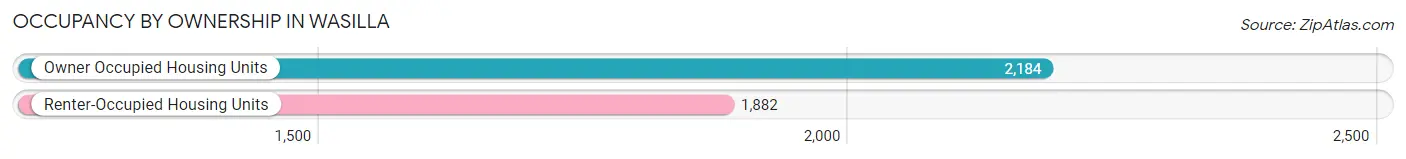
| Occupancy | # Housing Units | % Housing Units |
| Owner Occupied Housing Units | 2,184 | 53.7% |
| Renter-Occupied Housing Units | 1,882 | 46.3% |
| Total Occupied Housing Units | 4,066 | 100.0% |
Occupancy by Household Size in Wasilla
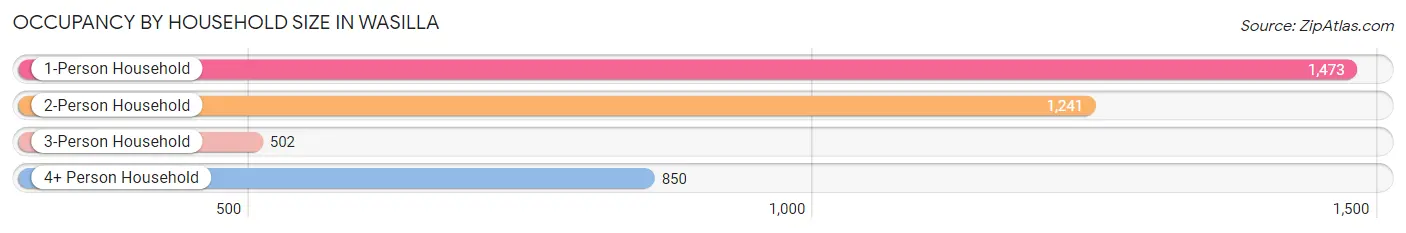
| Household Size | # Housing Units | % Housing Units |
| 1-Person Household | 1,473 | 36.2% |
| 2-Person Household | 1,241 | 30.5% |
| 3-Person Household | 502 | 12.3% |
| 4+ Person Household | 850 | 20.9% |
| Total Housing Units | 4,066 | 100.0% |
Occupancy by Ownership by Household Size in Wasilla
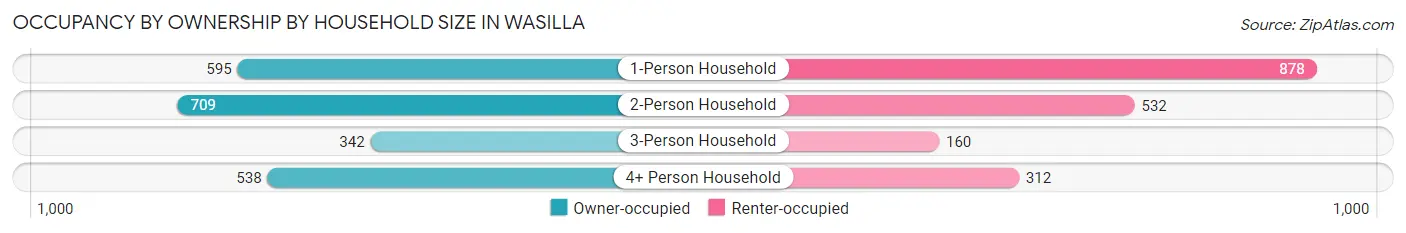
| Household Size | Owner-occupied | Renter-occupied |
| 1-Person Household | 595 (40.4%) | 878 (59.6%) |
| 2-Person Household | 709 (57.1%) | 532 (42.9%) |
| 3-Person Household | 342 (68.1%) | 160 (31.9%) |
| 4+ Person Household | 538 (63.3%) | 312 (36.7%) |
| Total Housing Units | 2,184 (53.7%) | 1,882 (46.3%) |
Occupancy by Educational Attainment in Wasilla
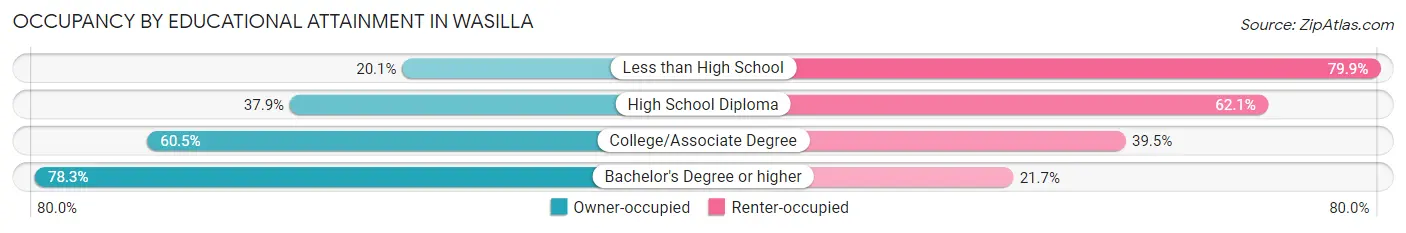
| Household Size | Owner-occupied | Renter-occupied |
| Less than High School | 45 (20.1%) | 179 (79.9%) |
| High School Diploma | 579 (37.9%) | 948 (62.1%) |
| College/Associate Degree | 862 (60.5%) | 562 (39.5%) |
| Bachelor's Degree or higher | 698 (78.3%) | 193 (21.7%) |
Occupancy by Age of Householder in Wasilla
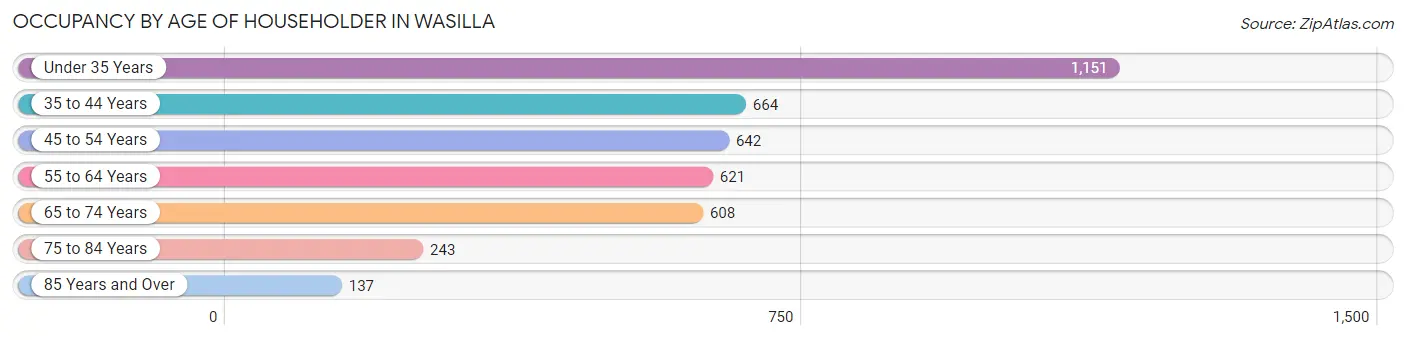
| Age Bracket | # Households | % Households |
| Under 35 Years | 1,151 | 28.3% |
| 35 to 44 Years | 664 | 16.3% |
| 45 to 54 Years | 642 | 15.8% |
| 55 to 64 Years | 621 | 15.3% |
| 65 to 74 Years | 608 | 14.9% |
| 75 to 84 Years | 243 | 6.0% |
| 85 Years and Over | 137 | 3.4% |
| Total | 4,066 | 100.0% |
Housing Finances in Wasilla
Median Income by Occupancy in Wasilla
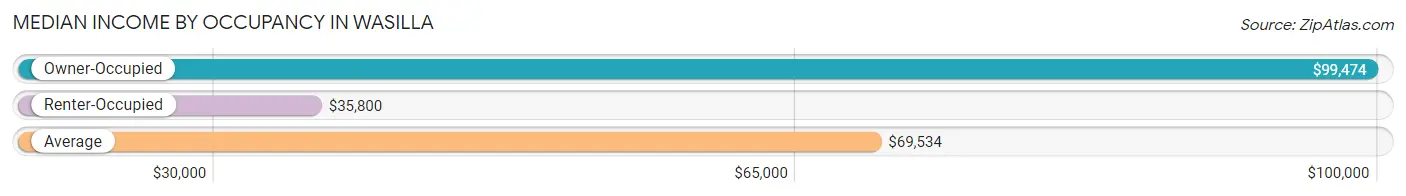
| Occupancy Type | # Households | Median Income |
| Owner-Occupied | 2,184 (53.7%) | $99,474 |
| Renter-Occupied | 1,882 (46.3%) | $35,800 |
| Average | 4,066 (100.0%) | $69,534 |
Occupancy by Householder Income Bracket in Wasilla
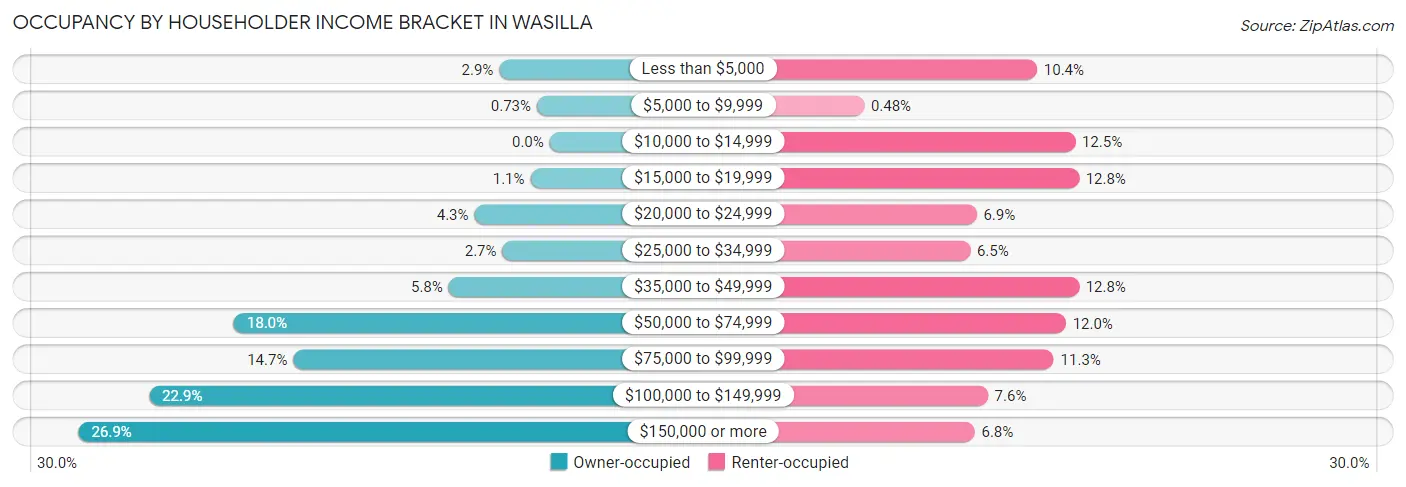
| Income Bracket | Owner-occupied | Renter-occupied |
| Less than $5,000 | 63 (2.9%) | 195 (10.4%) |
| $5,000 to $9,999 | 16 (0.7%) | 9 (0.5%) |
| $10,000 to $14,999 | 0 (0.0%) | 236 (12.5%) |
| $15,000 to $19,999 | 24 (1.1%) | 240 (12.8%) |
| $20,000 to $24,999 | 94 (4.3%) | 130 (6.9%) |
| $25,000 to $34,999 | 59 (2.7%) | 123 (6.5%) |
| $35,000 to $49,999 | 126 (5.8%) | 240 (12.8%) |
| $50,000 to $74,999 | 394 (18.0%) | 226 (12.0%) |
| $75,000 to $99,999 | 320 (14.6%) | 213 (11.3%) |
| $100,000 to $149,999 | 500 (22.9%) | 142 (7.5%) |
| $150,000 or more | 588 (26.9%) | 128 (6.8%) |
| Total | 2,184 (100.0%) | 1,882 (100.0%) |
Monthly Housing Cost Tiers in Wasilla
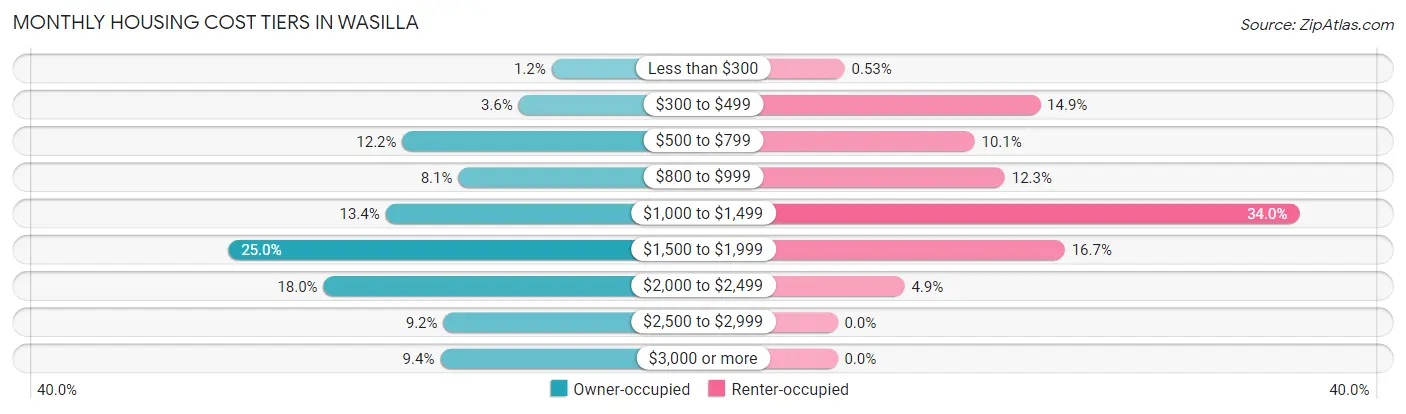
| Monthly Cost | Owner-occupied | Renter-occupied |
| Less than $300 | 26 (1.2%) | 10 (0.5%) |
| $300 to $499 | 79 (3.6%) | 281 (14.9%) |
| $500 to $799 | 266 (12.2%) | 190 (10.1%) |
| $800 to $999 | 176 (8.1%) | 232 (12.3%) |
| $1,000 to $1,499 | 293 (13.4%) | 640 (34.0%) |
| $1,500 to $1,999 | 546 (25.0%) | 315 (16.7%) |
| $2,000 to $2,499 | 393 (18.0%) | 93 (4.9%) |
| $2,500 to $2,999 | 200 (9.2%) | 0 (0.0%) |
| $3,000 or more | 205 (9.4%) | 0 (0.0%) |
| Total | 2,184 (100.0%) | 1,882 (100.0%) |
Physical Housing Characteristics in Wasilla
Housing Structures in Wasilla
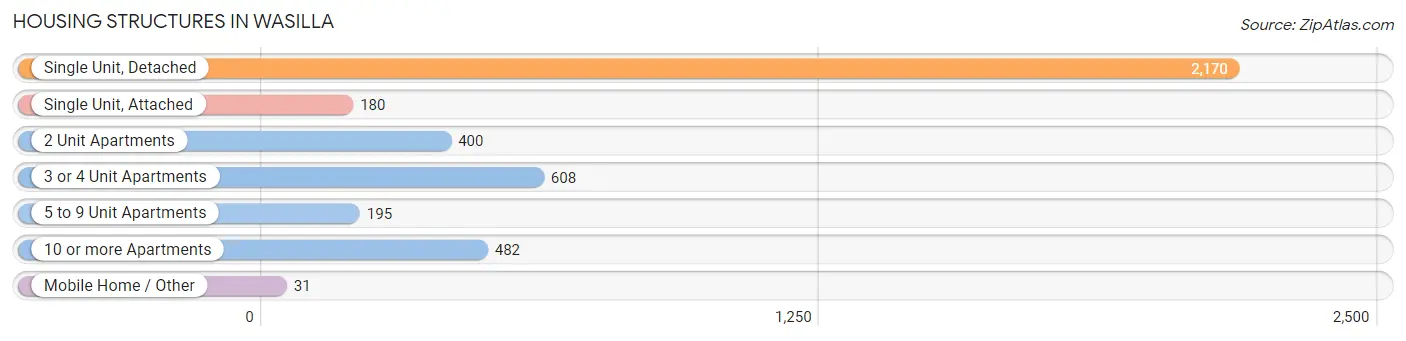
| Structure Type | # Housing Units | % Housing Units |
| Single Unit, Detached | 2,170 | 53.4% |
| Single Unit, Attached | 180 | 4.4% |
| 2 Unit Apartments | 400 | 9.8% |
| 3 or 4 Unit Apartments | 608 | 14.9% |
| 5 to 9 Unit Apartments | 195 | 4.8% |
| 10 or more Apartments | 482 | 11.8% |
| Mobile Home / Other | 31 | 0.8% |
| Total | 4,066 | 100.0% |
Housing Structures by Occupancy in Wasilla
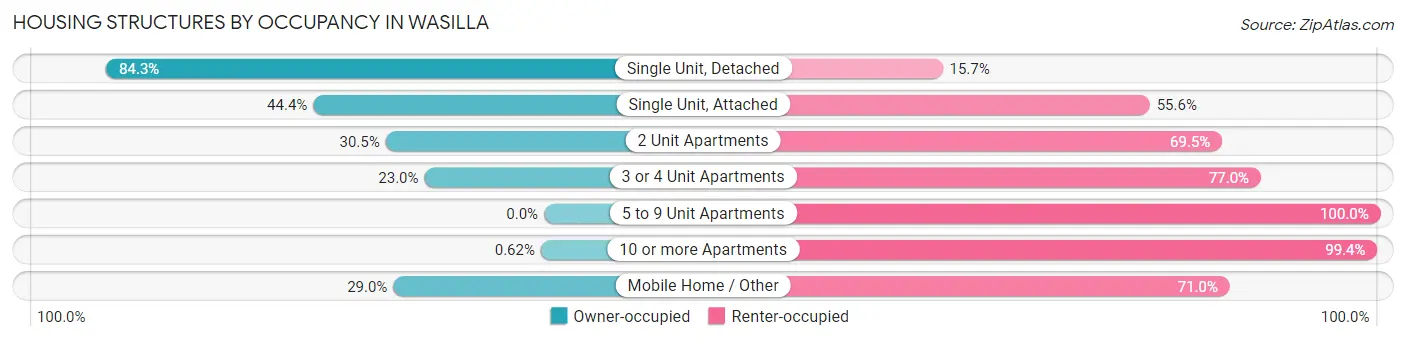
| Structure Type | Owner-occupied | Renter-occupied |
| Single Unit, Detached | 1,830 (84.3%) | 340 (15.7%) |
| Single Unit, Attached | 80 (44.4%) | 100 (55.6%) |
| 2 Unit Apartments | 122 (30.5%) | 278 (69.5%) |
| 3 or 4 Unit Apartments | 140 (23.0%) | 468 (77.0%) |
| 5 to 9 Unit Apartments | 0 (0.0%) | 195 (100.0%) |
| 10 or more Apartments | 3 (0.6%) | 479 (99.4%) |
| Mobile Home / Other | 9 (29.0%) | 22 (71.0%) |
| Total | 2,184 (53.7%) | 1,882 (46.3%) |
Housing Structures by Number of Rooms in Wasilla
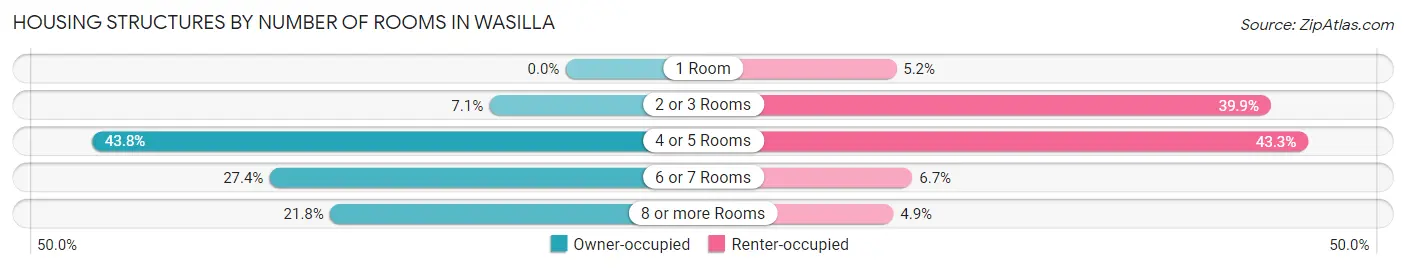
| Number of Rooms | Owner-occupied | Renter-occupied |
| 1 Room | 0 (0.0%) | 98 (5.2%) |
| 2 or 3 Rooms | 154 (7.0%) | 750 (39.9%) |
| 4 or 5 Rooms | 956 (43.8%) | 815 (43.3%) |
| 6 or 7 Rooms | 598 (27.4%) | 126 (6.7%) |
| 8 or more Rooms | 476 (21.8%) | 93 (4.9%) |
| Total | 2,184 (100.0%) | 1,882 (100.0%) |
Housing Structure by Heating Type in Wasilla
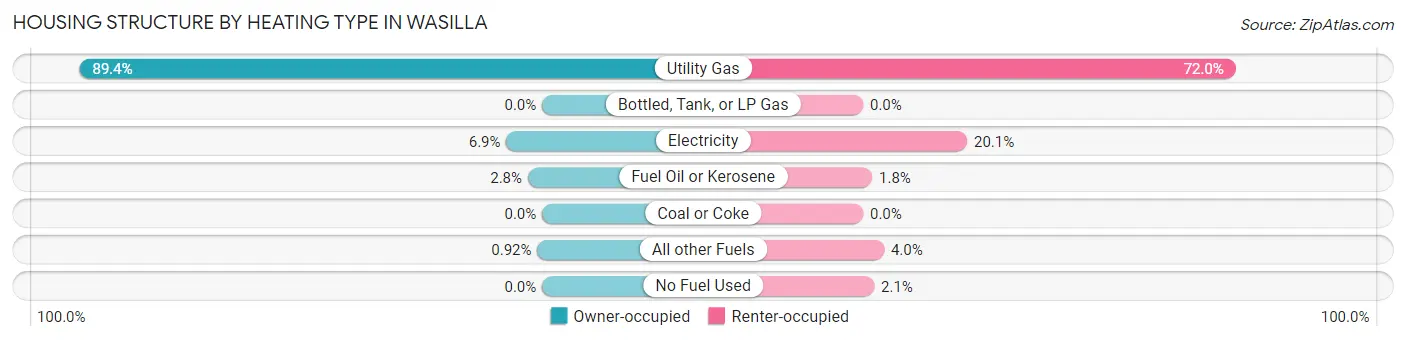
| Heating Type | Owner-occupied | Renter-occupied |
| Utility Gas | 1,953 (89.4%) | 1,355 (72.0%) |
| Bottled, Tank, or LP Gas | 0 (0.0%) | 0 (0.0%) |
| Electricity | 151 (6.9%) | 378 (20.1%) |
| Fuel Oil or Kerosene | 60 (2.8%) | 33 (1.8%) |
| Coal or Coke | 0 (0.0%) | 0 (0.0%) |
| All other Fuels | 20 (0.9%) | 76 (4.0%) |
| No Fuel Used | 0 (0.0%) | 40 (2.1%) |
| Total | 2,184 (100.0%) | 1,882 (100.0%) |
Household Vehicle Usage in Wasilla
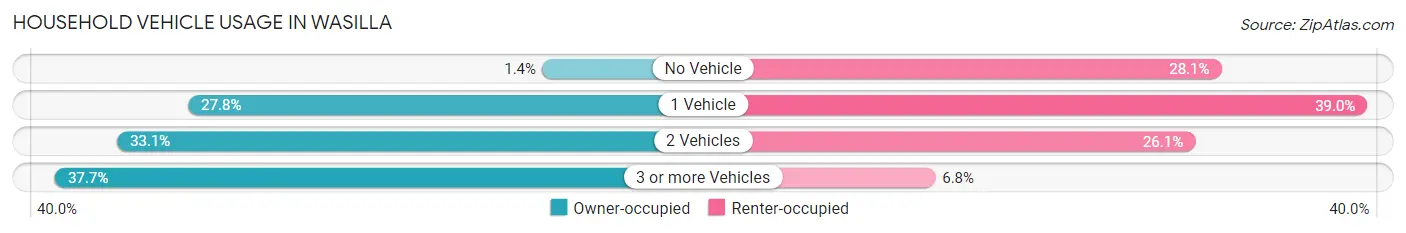
| Vehicles per Household | Owner-occupied | Renter-occupied |
| No Vehicle | 30 (1.4%) | 529 (28.1%) |
| 1 Vehicle | 607 (27.8%) | 734 (39.0%) |
| 2 Vehicles | 723 (33.1%) | 492 (26.1%) |
| 3 or more Vehicles | 824 (37.7%) | 127 (6.8%) |
| Total | 2,184 (100.0%) | 1,882 (100.0%) |
Real Estate & Mortgages in Wasilla
Real Estate and Mortgage Overview in Wasilla
| Characteristic | Without Mortgage | With Mortgage |
| Housing Units | 552 | 1,632 |
| Median Property Value | $279,500 | $313,900 |
| Median Household Income | $78,661 | $440 |
| Monthly Housing Costs | $669 | $205 |
| Real Estate Taxes | $3,093 | $239 |
Property Value by Mortgage Status in Wasilla
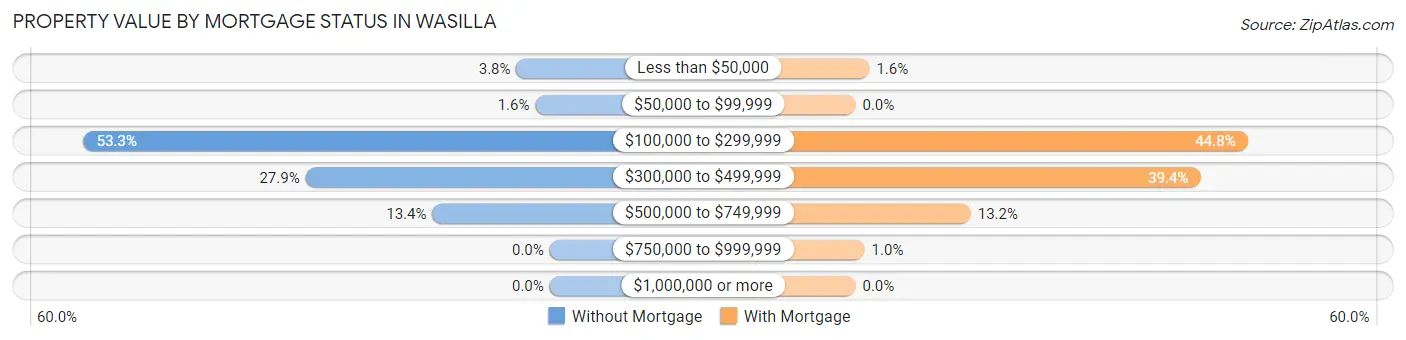
| Property Value | Without Mortgage | With Mortgage |
| Less than $50,000 | 21 (3.8%) | 26 (1.6%) |
| $50,000 to $99,999 | 9 (1.6%) | 0 (0.0%) |
| $100,000 to $299,999 | 294 (53.3%) | 731 (44.8%) |
| $300,000 to $499,999 | 154 (27.9%) | 643 (39.4%) |
| $500,000 to $749,999 | 74 (13.4%) | 215 (13.2%) |
| $750,000 to $999,999 | 0 (0.0%) | 17 (1.0%) |
| $1,000,000 or more | 0 (0.0%) | 0 (0.0%) |
| Total | 552 (100.0%) | 1,632 (100.0%) |
Household Income by Mortgage Status in Wasilla
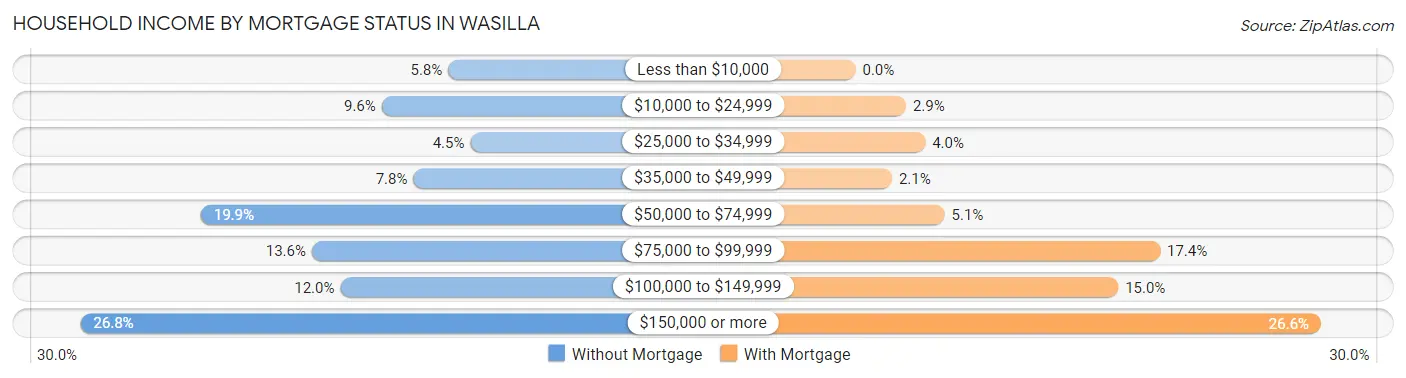
| Household Income | Without Mortgage | With Mortgage |
| Less than $10,000 | 32 (5.8%) | 0 (0.0%) |
| $10,000 to $24,999 | 53 (9.6%) | 47 (2.9%) |
| $25,000 to $34,999 | 25 (4.5%) | 65 (4.0%) |
| $35,000 to $49,999 | 43 (7.8%) | 34 (2.1%) |
| $50,000 to $74,999 | 110 (19.9%) | 83 (5.1%) |
| $75,000 to $99,999 | 75 (13.6%) | 284 (17.4%) |
| $100,000 to $149,999 | 66 (12.0%) | 245 (15.0%) |
| $150,000 or more | 148 (26.8%) | 434 (26.6%) |
| Total | 552 (100.0%) | 1,632 (100.0%) |
Property Value to Household Income Ratio in Wasilla
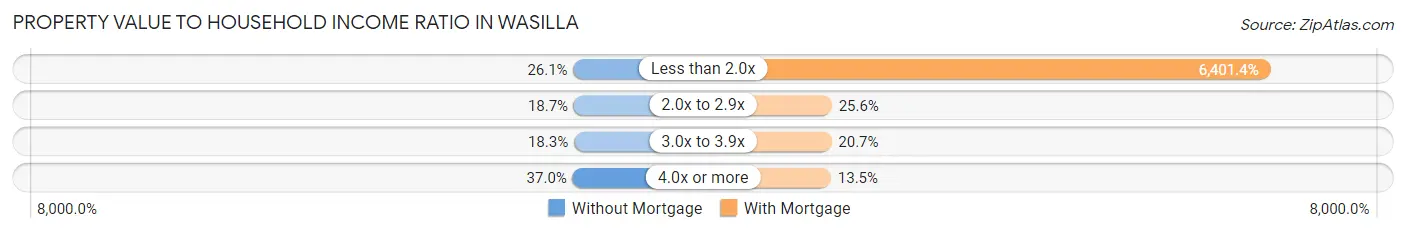
| Value-to-Income Ratio | Without Mortgage | With Mortgage |
| Less than 2.0x | 144 (26.1%) | 104,471 (6,401.4%) |
| 2.0x to 2.9x | 103 (18.7%) | 418 (25.6%) |
| 3.0x to 3.9x | 101 (18.3%) | 337 (20.6%) |
| 4.0x or more | 204 (37.0%) | 221 (13.5%) |
| Total | 552 (100.0%) | 1,632 (100.0%) |
Real Estate Taxes by Mortgage Status in Wasilla
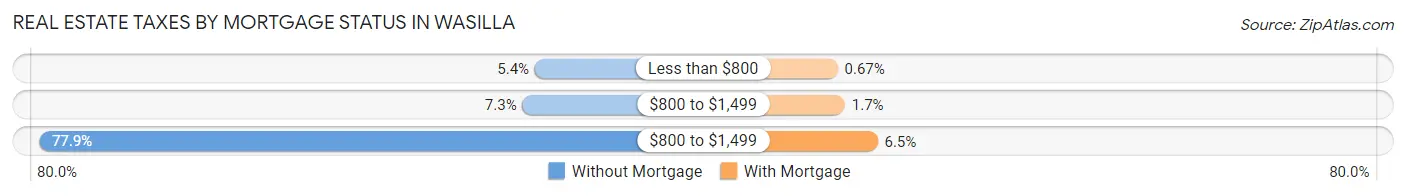
| Property Taxes | Without Mortgage | With Mortgage |
| Less than $800 | 30 (5.4%) | 11 (0.7%) |
| $800 to $1,499 | 40 (7.2%) | 28 (1.7%) |
| $800 to $1,499 | 430 (77.9%) | 106 (6.5%) |
| Total | 552 (100.0%) | 1,632 (100.0%) |
Health & Disability in Wasilla
Health Insurance Coverage by Age in Wasilla
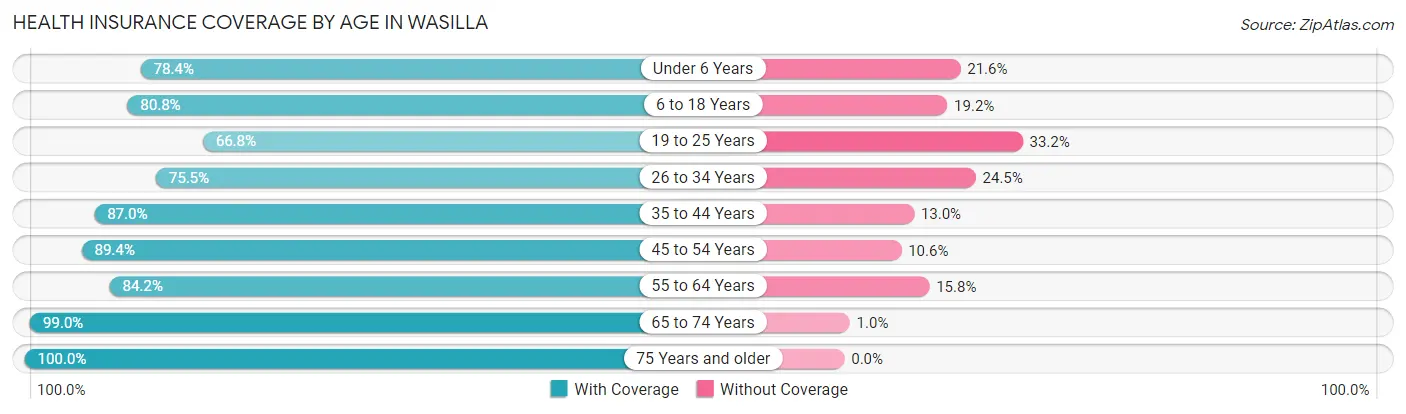
| Age Bracket | With Coverage | Without Coverage |
| Under 6 Years | 518 (78.4%) | 143 (21.6%) |
| 6 to 18 Years | 1,340 (80.8%) | 318 (19.2%) |
| 19 to 25 Years | 460 (66.8%) | 229 (33.2%) |
| 26 to 34 Years | 1,064 (75.5%) | 345 (24.5%) |
| 35 to 44 Years | 1,038 (87.0%) | 155 (13.0%) |
| 45 to 54 Years | 858 (89.4%) | 102 (10.6%) |
| 55 to 64 Years | 861 (84.2%) | 162 (15.8%) |
| 65 to 74 Years | 891 (99.0%) | 9 (1.0%) |
| 75 Years and older | 582 (100.0%) | 0 (0.0%) |
| Total | 7,612 (83.9%) | 1,463 (16.1%) |
Health Insurance Coverage by Citizenship Status in Wasilla
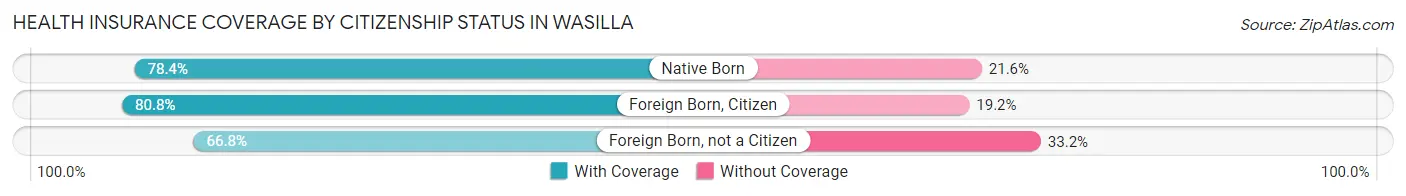
| Citizenship Status | With Coverage | Without Coverage |
| Native Born | 518 (78.4%) | 143 (21.6%) |
| Foreign Born, Citizen | 1,340 (80.8%) | 318 (19.2%) |
| Foreign Born, not a Citizen | 460 (66.8%) | 229 (33.2%) |
Health Insurance Coverage by Household Income in Wasilla
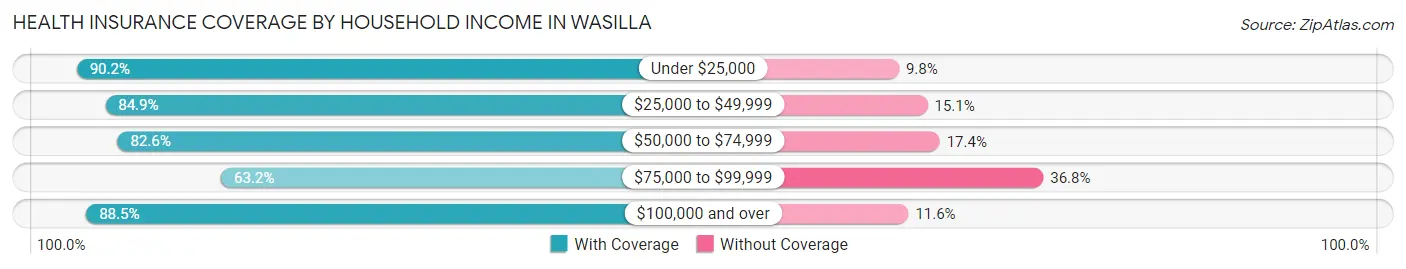
| Household Income | With Coverage | Without Coverage |
| Under $25,000 | 1,413 (90.2%) | 153 (9.8%) |
| $25,000 to $49,999 | 746 (84.9%) | 133 (15.1%) |
| $50,000 to $74,999 | 1,110 (82.6%) | 234 (17.4%) |
| $75,000 to $99,999 | 831 (63.2%) | 484 (36.8%) |
| $100,000 and over | 3,491 (88.4%) | 456 (11.6%) |
Public vs Private Health Insurance Coverage by Age in Wasilla
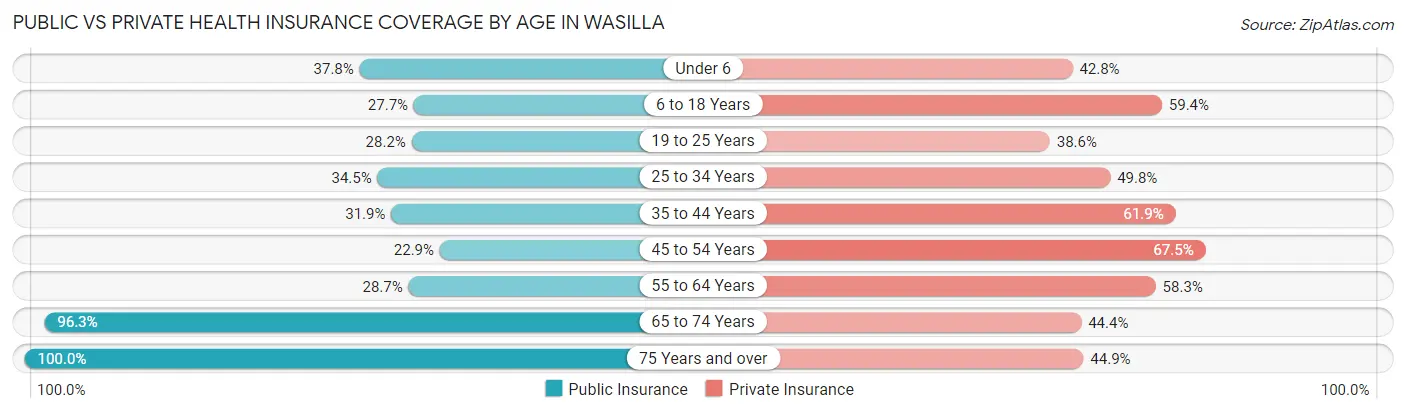
| Age Bracket | Public Insurance | Private Insurance |
| Under 6 | 250 (37.8%) | 283 (42.8%) |
| 6 to 18 Years | 460 (27.7%) | 985 (59.4%) |
| 19 to 25 Years | 194 (28.2%) | 266 (38.6%) |
| 25 to 34 Years | 486 (34.5%) | 702 (49.8%) |
| 35 to 44 Years | 381 (31.9%) | 739 (61.9%) |
| 45 to 54 Years | 220 (22.9%) | 648 (67.5%) |
| 55 to 64 Years | 294 (28.7%) | 596 (58.3%) |
| 65 to 74 Years | 867 (96.3%) | 400 (44.4%) |
| 75 Years and over | 582 (100.0%) | 261 (44.9%) |
| Total | 3,734 (41.1%) | 4,880 (53.8%) |
Disability Status by Sex by Age in Wasilla
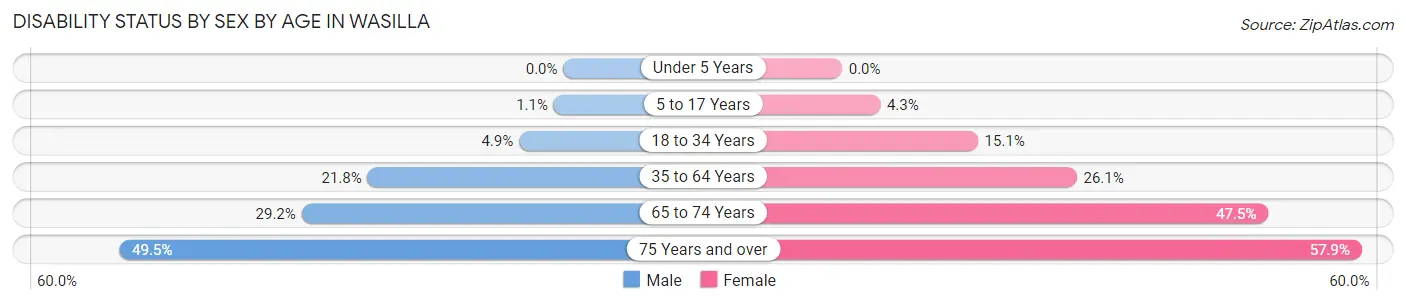
| Age Bracket | Male | Female |
| Under 5 Years | 0 (0.0%) | 0 (0.0%) |
| 5 to 17 Years | 10 (1.1%) | 32 (4.3%) |
| 18 to 34 Years | 53 (4.9%) | 159 (15.1%) |
| 35 to 64 Years | 338 (21.8%) | 425 (26.1%) |
| 65 to 74 Years | 123 (29.1%) | 227 (47.5%) |
| 75 Years and over | 94 (49.5%) | 227 (57.9%) |
Disability Class by Sex by Age in Wasilla
Disability Class: Hearing Difficulty
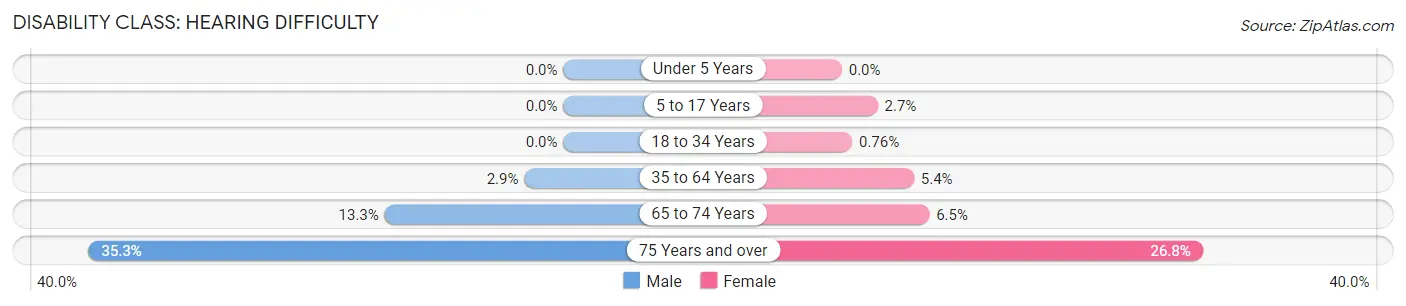
| Age Bracket | Male | Female |
| Under 5 Years | 0 (0.0%) | 0 (0.0%) |
| 5 to 17 Years | 0 (0.0%) | 20 (2.7%) |
| 18 to 34 Years | 0 (0.0%) | 8 (0.8%) |
| 35 to 64 Years | 45 (2.9%) | 87 (5.3%) |
| 65 to 74 Years | 56 (13.3%) | 31 (6.5%) |
| 75 Years and over | 67 (35.3%) | 105 (26.8%) |
Disability Class: Vision Difficulty
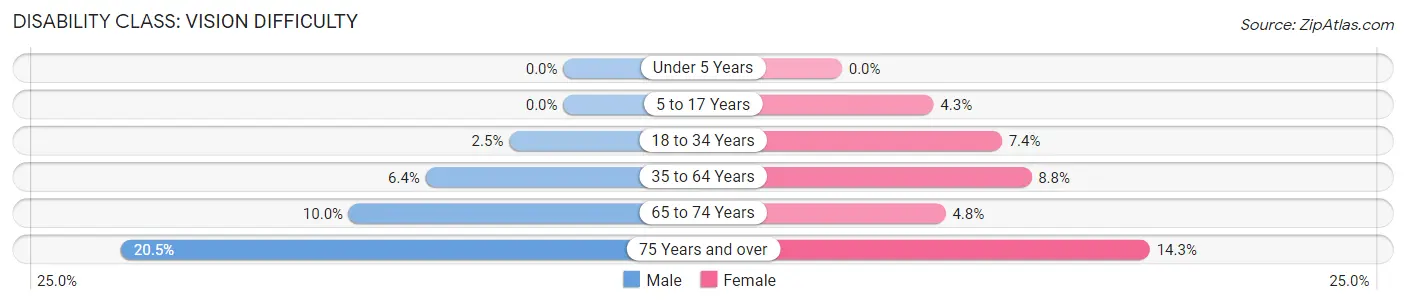
| Age Bracket | Male | Female |
| Under 5 Years | 0 (0.0%) | 0 (0.0%) |
| 5 to 17 Years | 0 (0.0%) | 32 (4.3%) |
| 18 to 34 Years | 27 (2.5%) | 78 (7.4%) |
| 35 to 64 Years | 99 (6.4%) | 143 (8.8%) |
| 65 to 74 Years | 42 (10.0%) | 23 (4.8%) |
| 75 Years and over | 39 (20.5%) | 56 (14.3%) |
Disability Class: Cognitive Difficulty
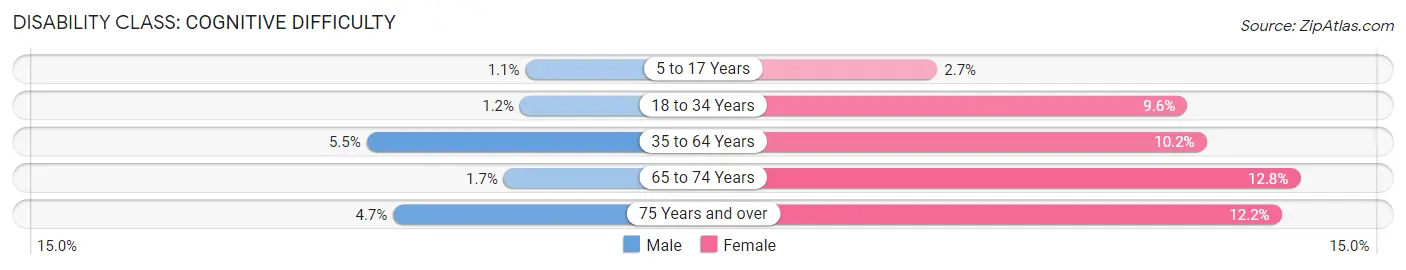
| Age Bracket | Male | Female |
| 5 to 17 Years | 10 (1.1%) | 20 (2.7%) |
| 18 to 34 Years | 13 (1.2%) | 101 (9.6%) |
| 35 to 64 Years | 85 (5.5%) | 165 (10.2%) |
| 65 to 74 Years | 7 (1.7%) | 61 (12.8%) |
| 75 Years and over | 9 (4.7%) | 48 (12.2%) |
Disability Class: Ambulatory Difficulty
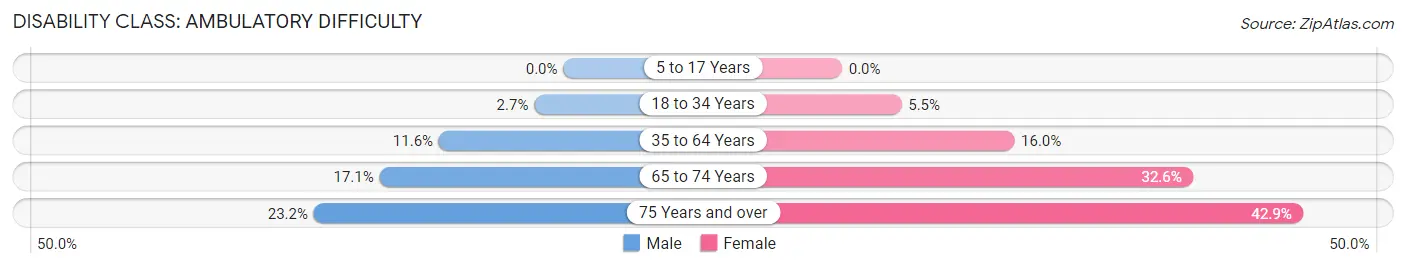
| Age Bracket | Male | Female |
| 5 to 17 Years | 0 (0.0%) | 0 (0.0%) |
| 18 to 34 Years | 29 (2.7%) | 58 (5.5%) |
| 35 to 64 Years | 179 (11.6%) | 260 (16.0%) |
| 65 to 74 Years | 72 (17.1%) | 156 (32.6%) |
| 75 Years and over | 44 (23.2%) | 168 (42.9%) |
Disability Class: Self-Care Difficulty
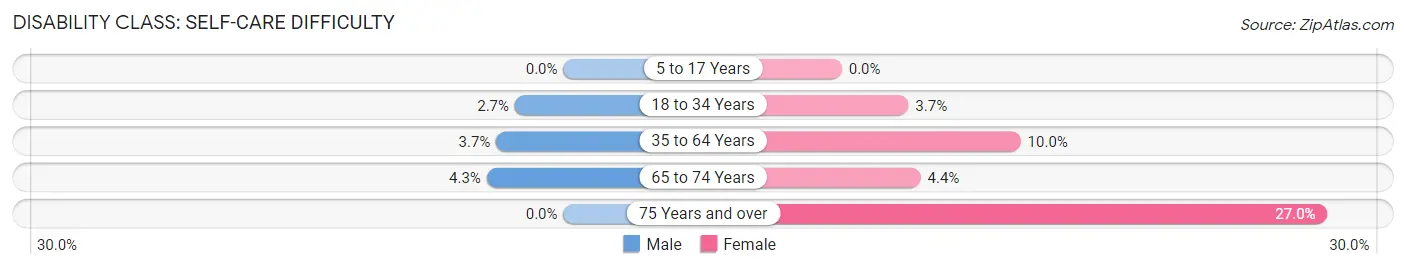
| Age Bracket | Male | Female |
| 5 to 17 Years | 0 (0.0%) | 0 (0.0%) |
| 18 to 34 Years | 29 (2.7%) | 39 (3.7%) |
| 35 to 64 Years | 58 (3.7%) | 162 (10.0%) |
| 65 to 74 Years | 18 (4.3%) | 21 (4.4%) |
| 75 Years and over | 0 (0.0%) | 106 (27.0%) |
Technology Access in Wasilla
Computing Device Access in Wasilla
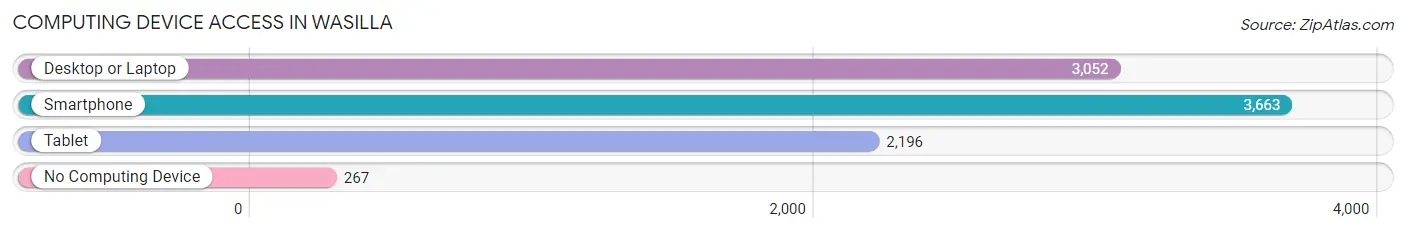
| Device Type | # Households | % Households |
| Desktop or Laptop | 3,052 | 75.1% |
| Smartphone | 3,663 | 90.1% |
| Tablet | 2,196 | 54.0% |
| No Computing Device | 267 | 6.6% |
| Total | 4,066 | 100.0% |
Internet Access in Wasilla
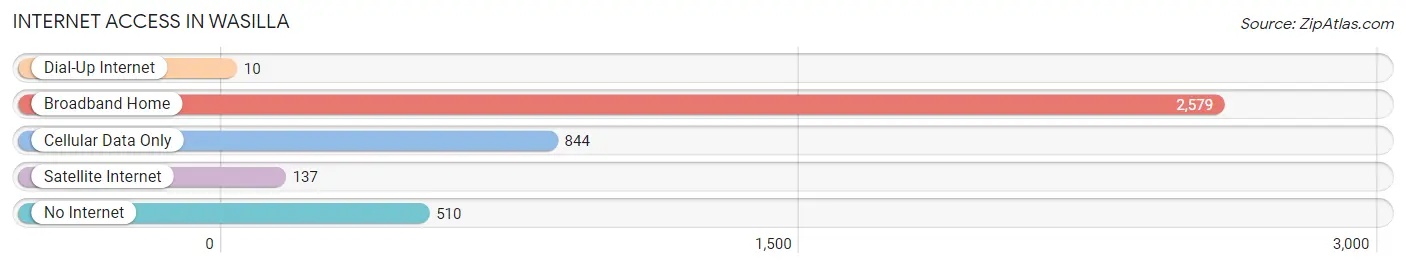
| Internet Type | # Households | % Households |
| Dial-Up Internet | 10 | 0.3% |
| Broadband Home | 2,579 | 63.4% |
| Cellular Data Only | 844 | 20.8% |
| Satellite Internet | 137 | 3.4% |
| No Internet | 510 | 12.5% |
| Total | 4,066 | 100.0% |
Wasilla Summary
Wasilla, Alaska is a city located in the Matanuska-Susitna Borough in the southcentral region of the state. It is the largest city in the borough and the sixth-largest city in the state. Wasilla is located approximately 45 miles northeast of Anchorage and is considered part of the Anchorage Metropolitan Statistical Area. The city was incorporated in 1974 and has a population of approximately 10,000 people.
History
The area that is now Wasilla was originally inhabited by the Dena’ina Athabascan people. The first European settlers arrived in the area in the early 1900s, and the town was officially founded in 1917. The town was named after Chief Wasilla, a Dena’ina Athabascan leader.
The town grew slowly until the 1950s, when the construction of the Alaska Railroad and the building of the Glenn Highway made it easier for people to travel to and from Wasilla. This led to an influx of new residents and businesses, and the town began to grow rapidly.
In 1974, Wasilla was officially incorporated as a city. Since then, the city has continued to grow and develop. In the 1980s, Wasilla became a popular destination for tourists, and the city has continued to attract visitors from all over the world.
Geography
Wasilla is located in the Matanuska-Susitna Borough in the southcentral region of Alaska. It is situated at the base of the Chugach Mountains and is surrounded by lakes, rivers, and forests. The city is located approximately 45 miles northeast of Anchorage and is considered part of the Anchorage Metropolitan Statistical Area.
The climate in Wasilla is generally mild, with temperatures ranging from the mid-30s in the winter to the mid-60s in the summer. The city receives an average of 20 inches of precipitation per year, with most of it falling in the form of snow.
Economy
Wasilla’s economy is largely based on tourism, retail, and services. The city is home to several large retail stores, including Walmart, Target, and Home Depot. The city also has a thriving tourism industry, with visitors coming from all over the world to experience the city’s natural beauty and outdoor activities.
The city is also home to several manufacturing and industrial businesses, including a large paper mill and a fish processing plant. Wasilla is also home to several government agencies, including the Alaska Department of Transportation and the Alaska State Troopers.
Demographics
As of the 2010 census, Wasilla had a population of 10,171 people. The racial makeup of the city was 87.3% White, 4.2% Native American, 1.7% Asian, 0.7% African American, and 0.2% Pacific Islander. The median household income in Wasilla was $60,945, and the median age was 33.7 years.
Wasilla is a diverse city, with a variety of cultures and backgrounds represented. The city is home to a large number of Native Americans, as well as a growing population of immigrants from all over the world. The city is also home to a large number of military personnel, as it is located near several military bases.
Common Questions
What is Per Capita Income in Wasilla?
Per Capita income in Wasilla is $38,415.
What is the Median Family Income in Wasilla?
Median Family Income in Wasilla is $95,753.
What is the Median Household income in Wasilla?
Median Household Income in Wasilla is $69,534.
What is Income or Wage Gap in Wasilla?
Income or Wage Gap in Wasilla is 32.1%.
Women in Wasilla earn 67.9 cents for every dollar earned by a man.
What is Family Income Deficit in Wasilla?
Family Income Deficit in Wasilla is $9,962.
Families that are below poverty line in Wasilla earn $9,962 less on average than the poverty threshold level.
What is Inequality or Gini Index in Wasilla?
Inequality or Gini Index in Wasilla is 0.46.
What is the Total Population of Wasilla?
Total Population of Wasilla is 9,267.
What is the Total Male Population of Wasilla?
Total Male Population of Wasilla is 4,701.
What is the Total Female Population of Wasilla?
Total Female Population of Wasilla is 4,566.
What is the Ratio of Males per 100 Females in Wasilla?
There are 102.96 Males per 100 Females in Wasilla.
What is the Ratio of Females per 100 Males in Wasilla?
There are 97.13 Females per 100 Males in Wasilla.
What is the Median Population Age in Wasilla?
Median Population Age in Wasilla is 35.9 Years.
What is the Average Family Size in Wasilla
Average Family Size in Wasilla is 3.0 People.
What is the Average Household Size in Wasilla
Average Household Size in Wasilla is 2.3 People.
How Large is the Labor Force in Wasilla?
There are 4,219 People in the Labor Forcein in Wasilla.
What is the Percentage of People in the Labor Force in Wasilla?
58.2% of People are in the Labor Force in Wasilla.
What is the Unemployment Rate in Wasilla?
Unemployment Rate in Wasilla is 9.7%.