Nikiski, AK Map & Demographics
Nikiski Map
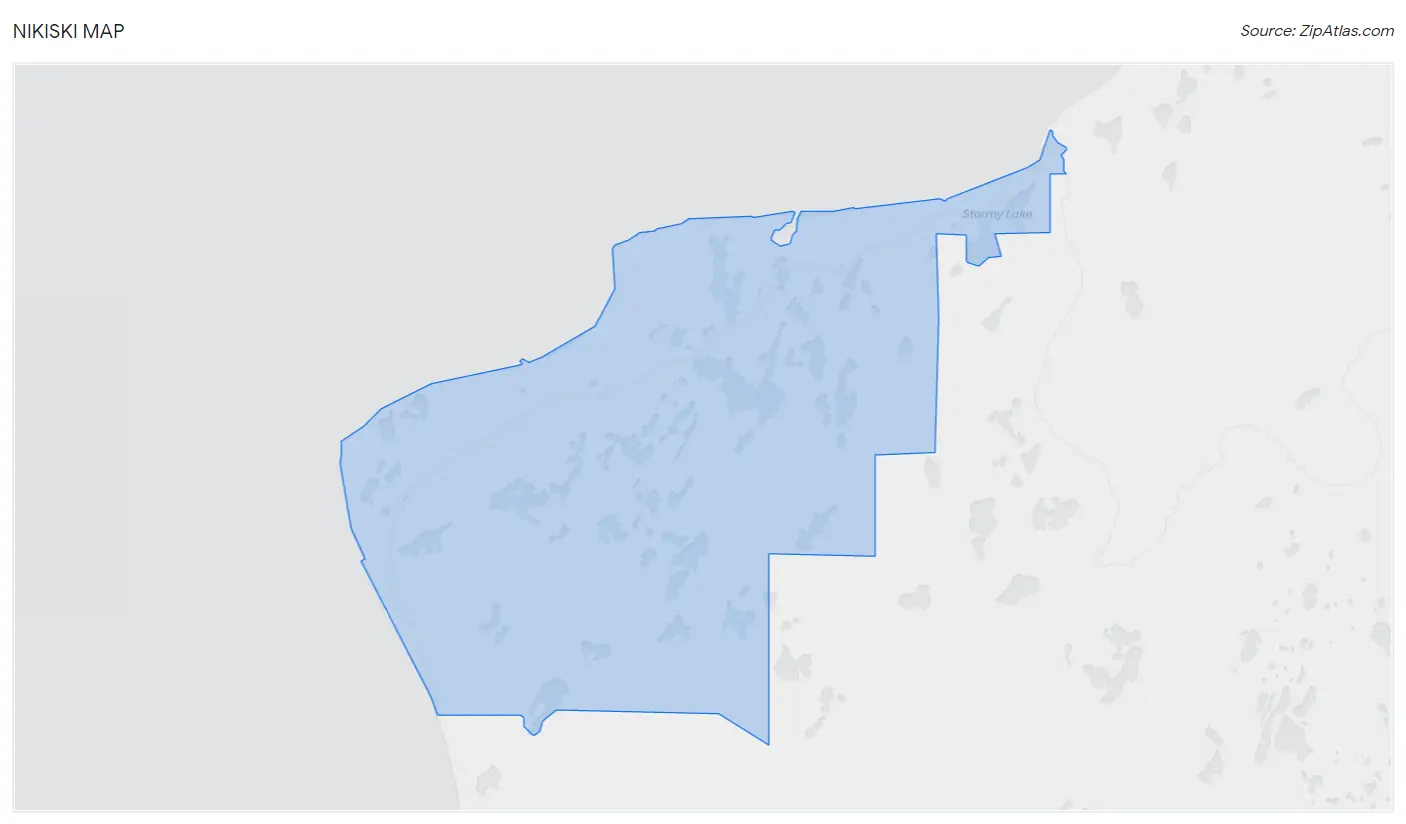
Nikiski Overview
$27,708
PER CAPITA INCOME
$89,539
AVG FAMILY INCOME
$59,809
AVG HOUSEHOLD INCOME
15.8%
WAGE / INCOME GAP [ % ]
84.2¢/ $1
WAGE / INCOME GAP [ $ ]
0.44
INEQUALITY / GINI INDEX
4,405
TOTAL POPULATION
2,355
MALE POPULATION
2,050
FEMALE POPULATION
114.88
MALES / 100 FEMALES
87.05
FEMALES / 100 MALES
35.2
MEDIAN AGE
3.7
AVG FAMILY SIZE
2.9
AVG HOUSEHOLD SIZE
1,534
LABOR FORCE [ PEOPLE ]
46.9%
PERCENT IN LABOR FORCE
4.8%
UNEMPLOYMENT RATE
Nikiski Zip Codes
Nikiski Area Codes
Income in Nikiski
Income Overview in Nikiski
Per Capita Income in Nikiski is $27,708, while median incomes of families and households are $89,539 and $59,809 respectively.
| Characteristic | Number | Measure |
| Per Capita Income | 4,405 | $27,708 |
| Median Family Income | 907 | $89,539 |
| Mean Family Income | 907 | $100,482 |
| Median Household Income | 1,505 | $59,809 |
| Mean Household Income | 1,505 | $78,619 |
| Income Deficit | 907 | $0 |
| Wage / Income Gap (%) | 4,405 | 15.83% |
| Wage / Income Gap ($) | 4,405 | 84.17¢ per $1 |
| Gini / Inequality Index | 4,405 | 0.44 |
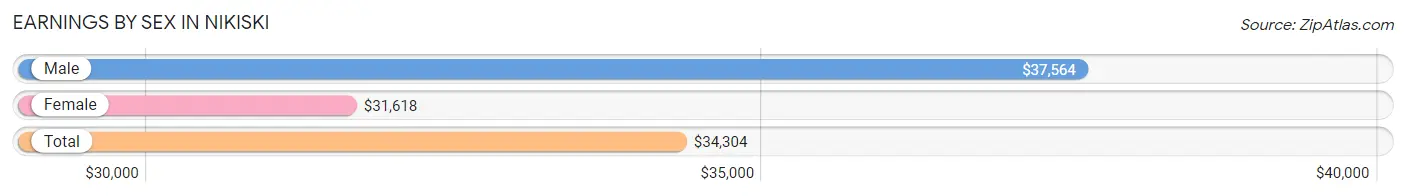
Earnings by Sex in Nikiski
Average Earnings in Nikiski are $34,304, $37,564 for men and $31,618 for women, a difference of 15.8%.
| Sex | Number | Average Earnings |
| Male | 949 (58.8%) | $37,564 |
| Female | 664 (41.2%) | $31,618 |
| Total | 1,613 (100.0%) | $34,304 |
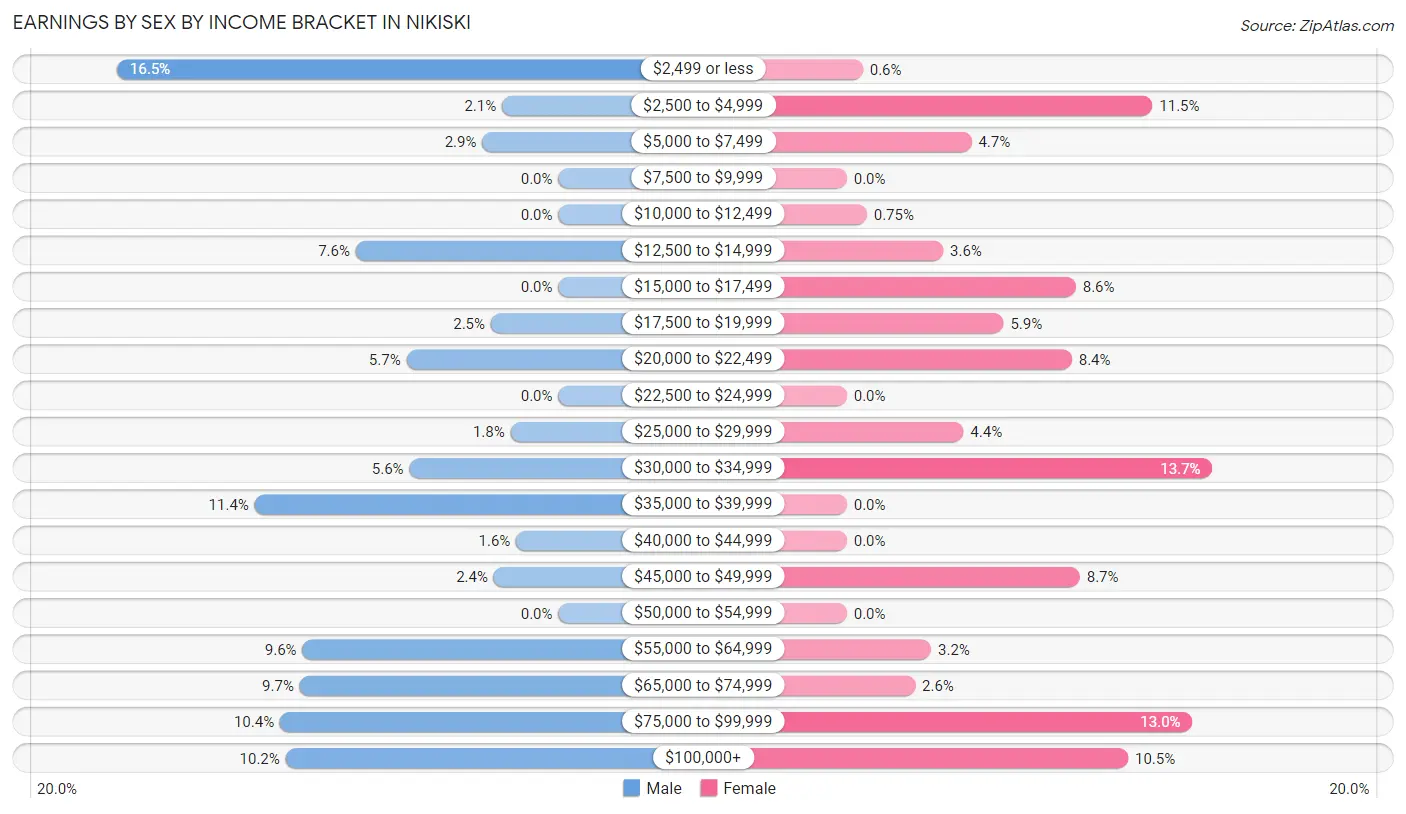
Earnings by Sex by Income Bracket in Nikiski
The most common earnings brackets in Nikiski are $2,499 or less for men (157 | 16.5%) and $30,000 to $34,999 for women (91 | 13.7%).
| Income | Male | Female |
| $2,499 or less | 157 (16.5%) | 4 (0.6%) |
| $2,500 to $4,999 | 20 (2.1%) | 76 (11.5%) |
| $5,000 to $7,499 | 27 (2.9%) | 31 (4.7%) |
| $7,500 to $9,999 | 0 (0.0%) | 0 (0.0%) |
| $10,000 to $12,499 | 0 (0.0%) | 5 (0.7%) |
| $12,500 to $14,999 | 72 (7.6%) | 24 (3.6%) |
| $15,000 to $17,499 | 0 (0.0%) | 57 (8.6%) |
| $17,500 to $19,999 | 24 (2.5%) | 39 (5.9%) |
| $20,000 to $22,499 | 54 (5.7%) | 56 (8.4%) |
| $22,500 to $24,999 | 0 (0.0%) | 0 (0.0%) |
| $25,000 to $29,999 | 17 (1.8%) | 29 (4.4%) |
| $30,000 to $34,999 | 53 (5.6%) | 91 (13.7%) |
| $35,000 to $39,999 | 108 (11.4%) | 0 (0.0%) |
| $40,000 to $44,999 | 15 (1.6%) | 0 (0.0%) |
| $45,000 to $49,999 | 23 (2.4%) | 58 (8.7%) |
| $50,000 to $54,999 | 0 (0.0%) | 0 (0.0%) |
| $55,000 to $64,999 | 91 (9.6%) | 21 (3.2%) |
| $65,000 to $74,999 | 92 (9.7%) | 17 (2.6%) |
| $75,000 to $99,999 | 99 (10.4%) | 86 (13.0%) |
| $100,000+ | 97 (10.2%) | 70 (10.5%) |
| Total | 949 (100.0%) | 664 (100.0%) |
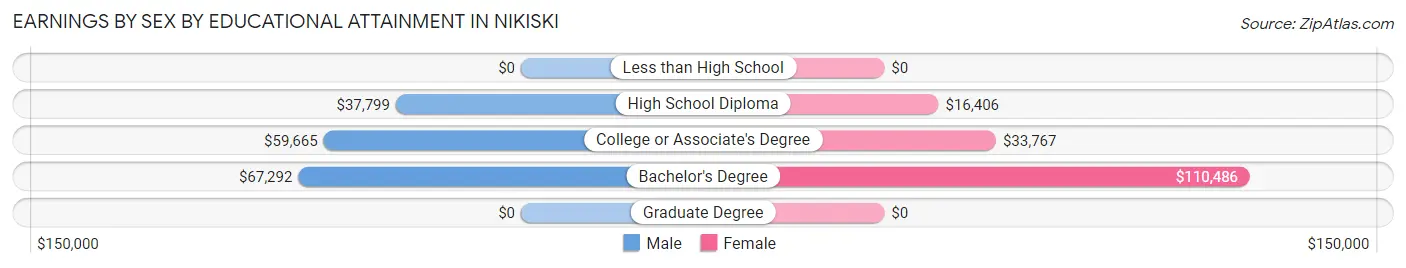
Earnings by Sex by Educational Attainment in Nikiski
Average earnings in Nikiski are $45,380 for men and $33,226 for women, a difference of 26.8%. Men with an educational attainment of bachelor's degree enjoy the highest average annual earnings of $67,292, while those with high school diploma education earn the least with $37,799. Women with an educational attainment of bachelor's degree earn the most with the average annual earnings of $110,486, while those with high school diploma education have the smallest earnings of $16,406.
| Educational Attainment | Male Income | Female Income |
| Less than High School | - | - |
| High School Diploma | $37,799 | $16,406 |
| College or Associate's Degree | $59,665 | $33,767 |
| Bachelor's Degree | $67,292 | $110,486 |
| Graduate Degree | - | - |
| Total | $45,380 | $33,226 |
Family Income in Nikiski
Family Income Brackets in Nikiski
According to the Nikiski family income data, there are 204 families falling into the $100,000 to $149,999 income range, which is the most common income bracket and makes up 22.5% of all families.
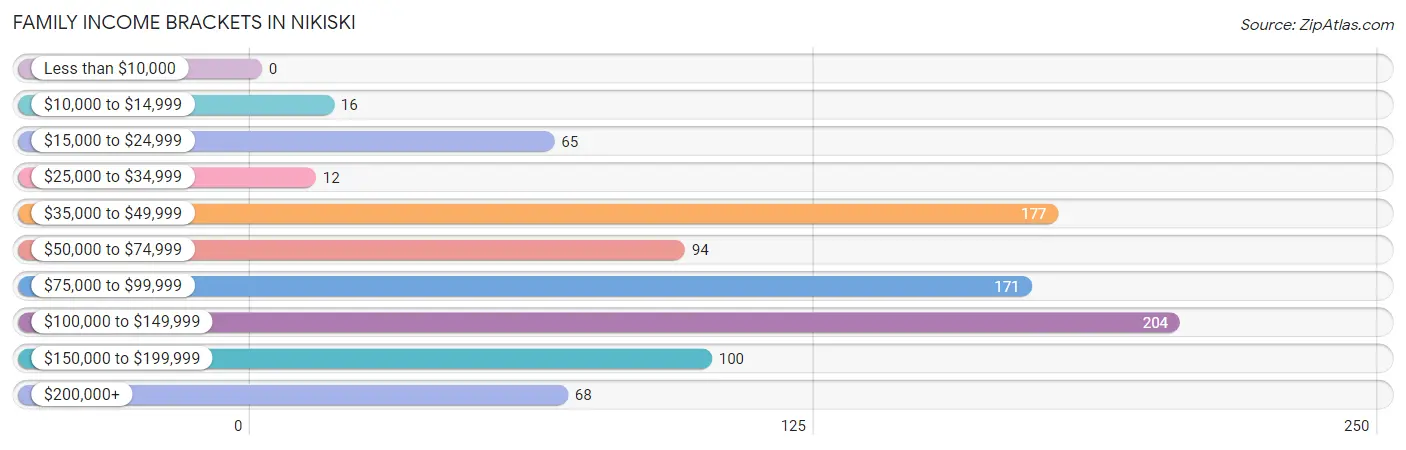
| Income Bracket | # Families | % Families |
| Less than $10,000 | 0 | 0.0% |
| $10,000 to $14,999 | 16 | 1.8% |
| $15,000 to $24,999 | 65 | 7.2% |
| $25,000 to $34,999 | 12 | 1.3% |
| $35,000 to $49,999 | 177 | 19.5% |
| $50,000 to $74,999 | 94 | 10.4% |
| $75,000 to $99,999 | 171 | 18.9% |
| $100,000 to $149,999 | 204 | 22.5% |
| $150,000 to $199,999 | 100 | 11.0% |
| $200,000+ | 68 | 7.5% |
Family Income by Famaliy Size in Nikiski
4-person families (214 | 23.6%) account for the highest median family income in Nikiski with $103,986 per family, while 2-person families (417 | 46.0%) have the highest median income of $39,422 per family member.
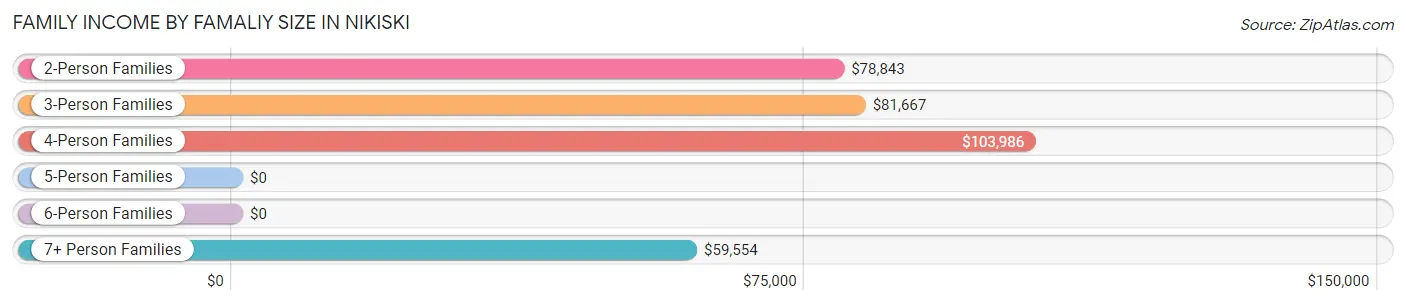
| Income Bracket | # Families | Median Income |
| 2-Person Families | 417 (46.0%) | $78,843 |
| 3-Person Families | 126 (13.9%) | $81,667 |
| 4-Person Families | 214 (23.6%) | $103,986 |
| 5-Person Families | 63 (7.0%) | $0 |
| 6-Person Families | 41 (4.5%) | $0 |
| 7+ Person Families | 46 (5.1%) | $59,554 |
| Total | 907 (100.0%) | $89,539 |
Family Income by Number of Earners in Nikiski
The median family income in Nikiski is $89,539, with families comprising 2 earners (277) having the highest median family income of $123,429, while families with no earners (234) have the lowest median family income of $48,274, accounting for 30.5% and 25.8% of families, respectively.
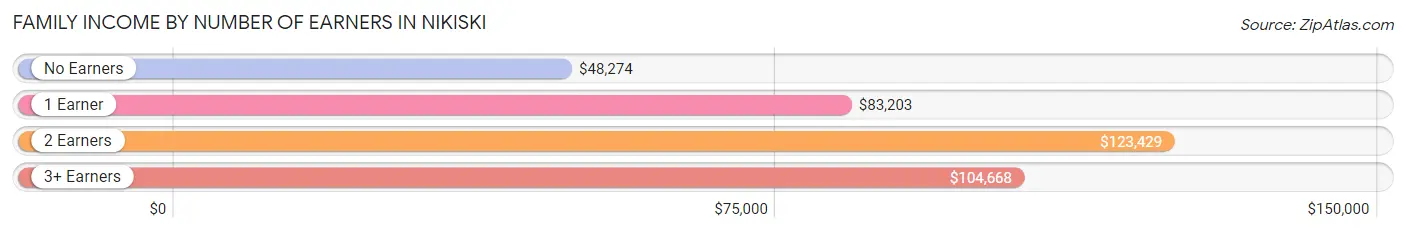
| Number of Earners | # Families | Median Income |
| No Earners | 234 (25.8%) | $48,274 |
| 1 Earner | 311 (34.3%) | $83,203 |
| 2 Earners | 277 (30.5%) | $123,429 |
| 3+ Earners | 85 (9.4%) | $104,668 |
| Total | 907 (100.0%) | $89,539 |
Household Income in Nikiski
Household Income Brackets in Nikiski
With 281 households falling in the category, the $35,000 to $49,999 income range is the most frequent in Nikiski, accounting for 18.7% of all households. In contrast, only 41 households (2.7%) fall into the $10,000 to $14,999 income bracket, making it the least populous group.
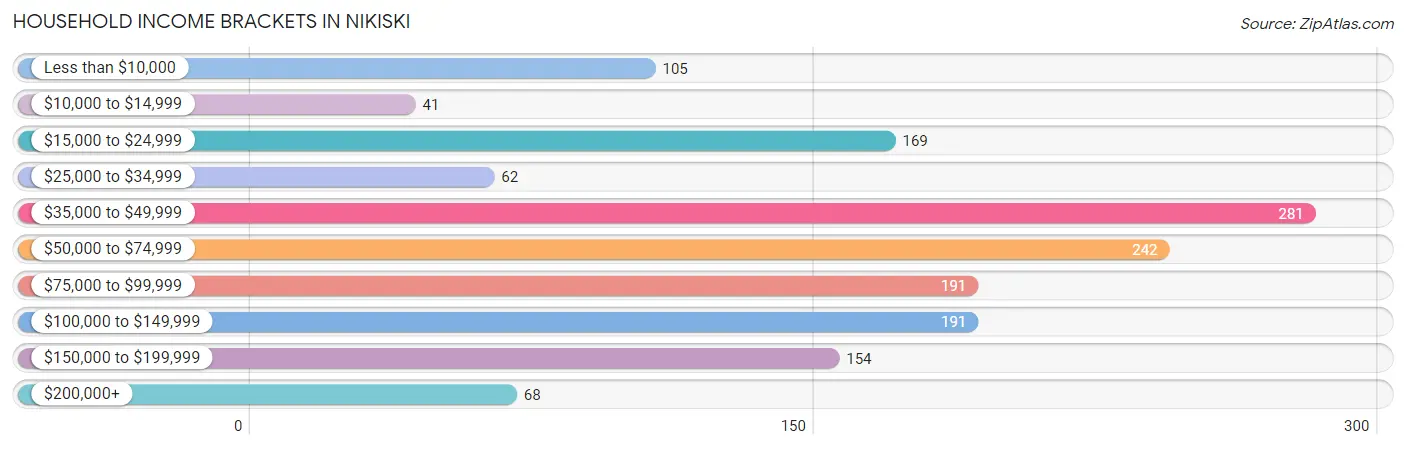
| Income Bracket | # Households | % Households |
| Less than $10,000 | 105 | 7.0% |
| $10,000 to $14,999 | 41 | 2.7% |
| $15,000 to $24,999 | 169 | 11.2% |
| $25,000 to $34,999 | 62 | 4.1% |
| $35,000 to $49,999 | 281 | 18.7% |
| $50,000 to $74,999 | 242 | 16.1% |
| $75,000 to $99,999 | 191 | 12.7% |
| $100,000 to $149,999 | 191 | 12.7% |
| $150,000 to $199,999 | 154 | 10.2% |
| $200,000+ | 68 | 4.5% |
Household Income by Householder Age in Nikiski
The median household income in Nikiski is $59,809, with the highest median household income of $93,221 found in the 25 to 44 years age bracket for the primary householder. A total of 461 households (30.6%) fall into this category. Meanwhile, the 15 to 24 years age bracket for the primary householder has the lowest median household income of $0, with 30 households (2.0%) in this group.
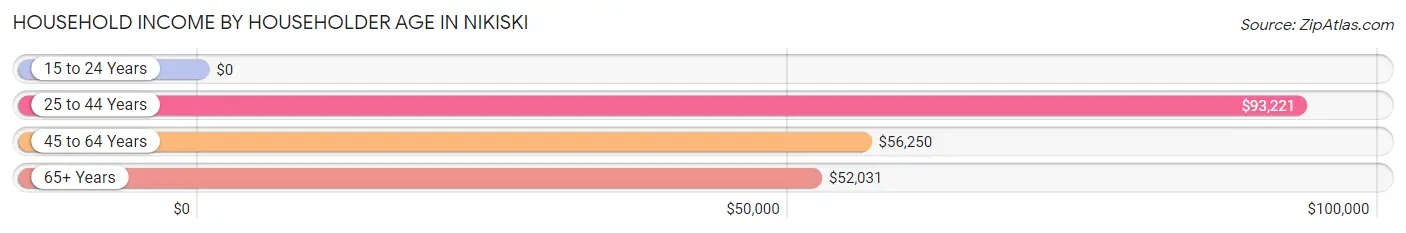
| Income Bracket | # Households | Median Income |
| 15 to 24 Years | 30 (2.0%) | $0 |
| 25 to 44 Years | 461 (30.6%) | $93,221 |
| 45 to 64 Years | 413 (27.4%) | $56,250 |
| 65+ Years | 601 (39.9%) | $52,031 |
| Total | 1,505 (100.0%) | $59,809 |
Poverty in Nikiski
Income Below Poverty by Sex and Age in Nikiski
With 19.5% poverty level for males and 17.5% for females among the residents of Nikiski, 18 to 24 year old males and 12 to 14 year old females are the most vulnerable to poverty, with 159 males (73.6%) and 47 females (52.8%) in their respective age groups living below the poverty level.
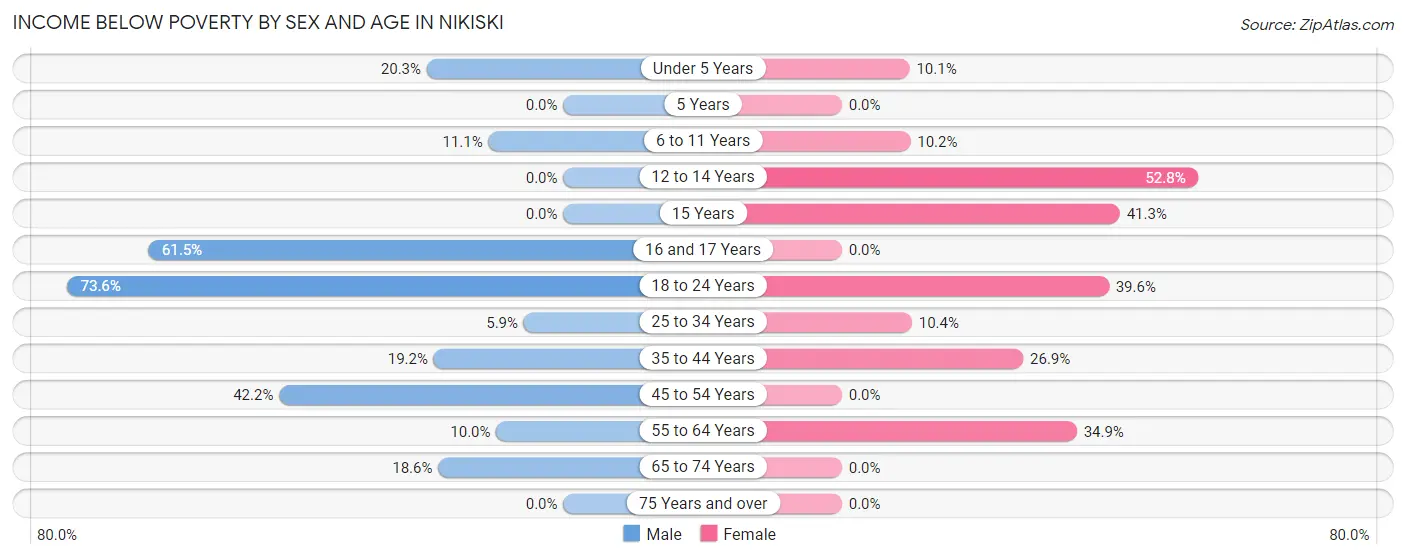
| Age Bracket | Male | Female |
| Under 5 Years | 30 (20.3%) | 22 (10.1%) |
| 5 Years | 0 (0.0%) | 0 (0.0%) |
| 6 to 11 Years | 22 (11.1%) | 18 (10.2%) |
| 12 to 14 Years | 0 (0.0%) | 47 (52.8%) |
| 15 Years | 0 (0.0%) | 26 (41.3%) |
| 16 and 17 Years | 48 (61.5%) | 0 (0.0%) |
| 18 to 24 Years | 159 (73.6%) | 44 (39.6%) |
| 25 to 34 Years | 18 (5.9%) | 31 (10.4%) |
| 35 to 44 Years | 66 (19.2%) | 63 (26.9%) |
| 45 to 54 Years | 27 (42.2%) | 0 (0.0%) |
| 55 to 64 Years | 21 (10.0%) | 105 (34.9%) |
| 65 to 74 Years | 65 (18.6%) | 0 (0.0%) |
| 75 Years and over | 0 (0.0%) | 0 (0.0%) |
| Total | 456 (19.5%) | 356 (17.5%) |
Income Above Poverty by Sex and Age in Nikiski
According to the poverty statistics in Nikiski, males aged 5 years and females aged 5 years are the age groups that are most secure financially, with 100.0% of males and 100.0% of females in these age groups living above the poverty line.
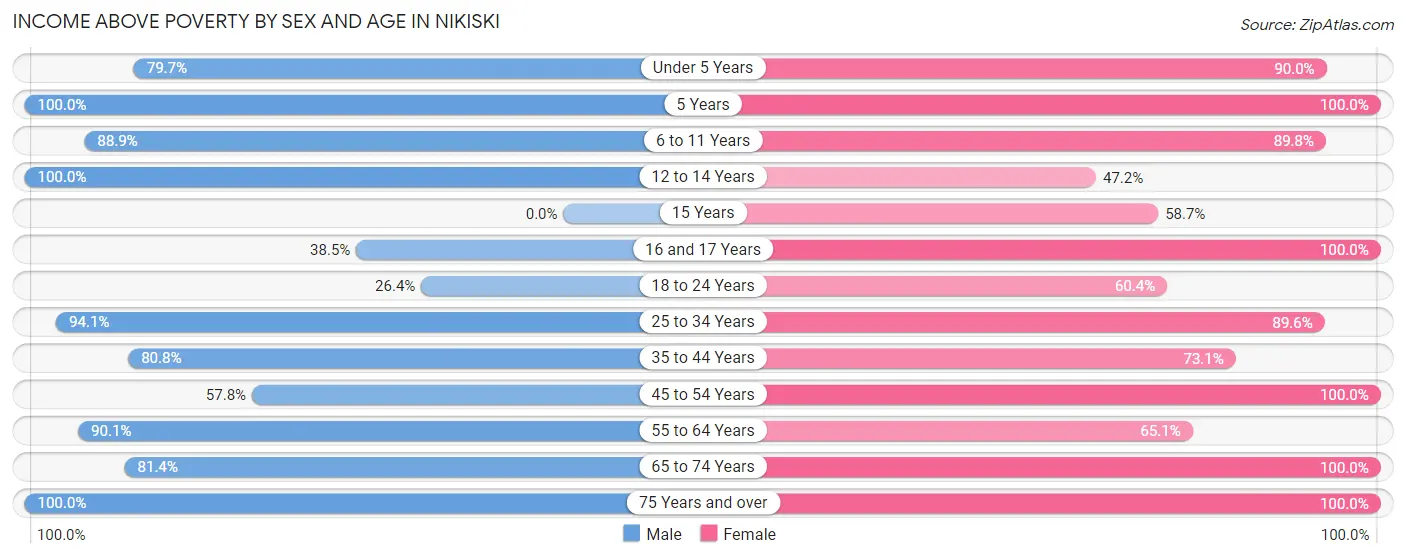
| Age Bracket | Male | Female |
| Under 5 Years | 118 (79.7%) | 197 (89.9%) |
| 5 Years | 67 (100.0%) | 38 (100.0%) |
| 6 to 11 Years | 176 (88.9%) | 159 (89.8%) |
| 12 to 14 Years | 115 (100.0%) | 42 (47.2%) |
| 15 Years | 0 (0.0%) | 37 (58.7%) |
| 16 and 17 Years | 30 (38.5%) | 44 (100.0%) |
| 18 to 24 Years | 57 (26.4%) | 67 (60.4%) |
| 25 to 34 Years | 289 (94.1%) | 267 (89.6%) |
| 35 to 44 Years | 277 (80.8%) | 171 (73.1%) |
| 45 to 54 Years | 37 (57.8%) | 123 (100.0%) |
| 55 to 64 Years | 190 (90.0%) | 196 (65.1%) |
| 65 to 74 Years | 285 (81.4%) | 233 (100.0%) |
| 75 Years and over | 237 (100.0%) | 106 (100.0%) |
| Total | 1,878 (80.5%) | 1,680 (82.5%) |
Income Below Poverty Among Married-Couple Families in Nikiski
The poverty statistics for married-couple families in Nikiski show that 8.6% or 64 of the total 742 families live below the poverty line. Families with 3 or 4 children have the highest poverty rate of 44.3%, comprising of 47 families. On the other hand, families with no children have the lowest poverty rate of 0.0%, which includes 0 families.
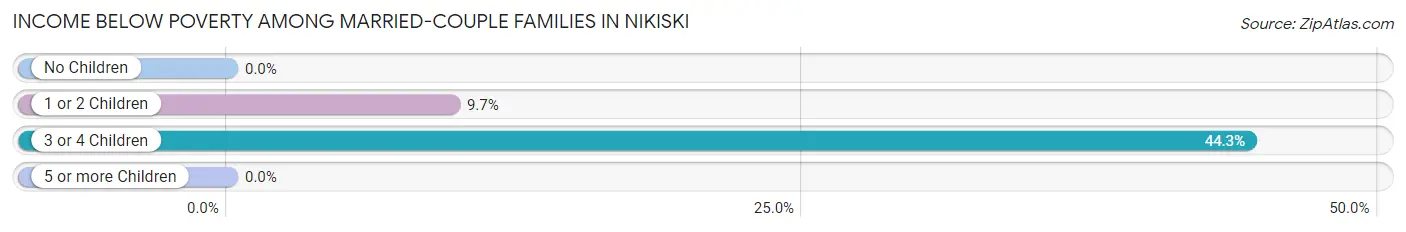
| Children | Above Poverty | Below Poverty |
| No Children | 416 (100.0%) | 0 (0.0%) |
| 1 or 2 Children | 159 (90.3%) | 17 (9.7%) |
| 3 or 4 Children | 59 (55.7%) | 47 (44.3%) |
| 5 or more Children | 44 (100.0%) | 0 (0.0%) |
| Total | 678 (91.4%) | 64 (8.6%) |
Income Below Poverty Among Single-Parent Households in Nikiski
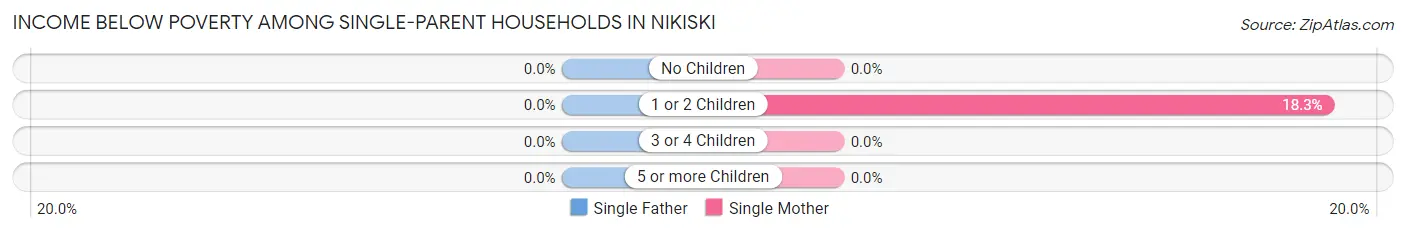
| Children | Single Father | Single Mother |
| No Children | 0 (0.0%) | 0 (0.0%) |
| 1 or 2 Children | 0 (0.0%) | 17 (18.3%) |
| 3 or 4 Children | 0 (0.0%) | 0 (0.0%) |
| 5 or more Children | 0 (0.0%) | 0 (0.0%) |
| Total | 0 (0.0%) | 17 (14.4%) |
Income Below Poverty Among Married-Couple vs Single-Parent Households in Nikiski
The poverty data for Nikiski shows that 64 of the married-couple family households (8.6%) and 17 of the single-parent households (10.3%) are living below the poverty level. Within the married-couple family households, those with 3 or 4 children have the highest poverty rate, with 47 households (44.3%) falling below the poverty line. Among the single-parent households, those with 1 or 2 children have the highest poverty rate, with 17 household (18.3%) living below poverty.
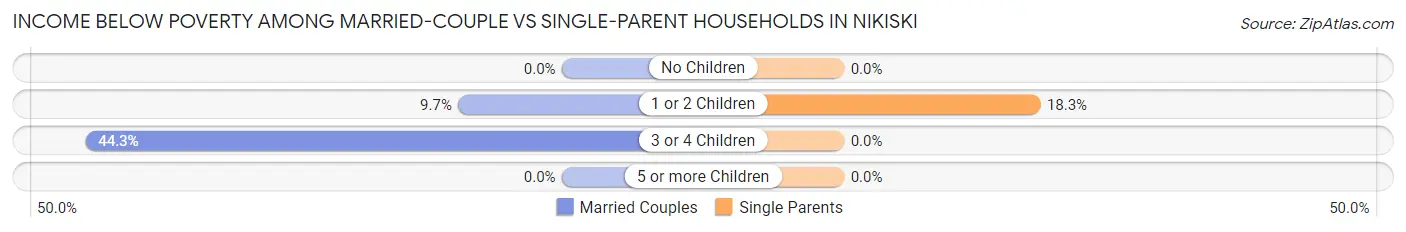
| Children | Married-Couple Families | Single-Parent Households |
| No Children | 0 (0.0%) | 0 (0.0%) |
| 1 or 2 Children | 17 (9.7%) | 17 (18.3%) |
| 3 or 4 Children | 47 (44.3%) | 0 (0.0%) |
| 5 or more Children | 0 (0.0%) | 0 (0.0%) |
| Total | 64 (8.6%) | 17 (10.3%) |
Race in Nikiski
The most populous races in Nikiski are White / Caucasian (3,212 | 72.9%), Two or more Races (525 | 11.9%), and Native / Alaskan (426 | 9.7%).
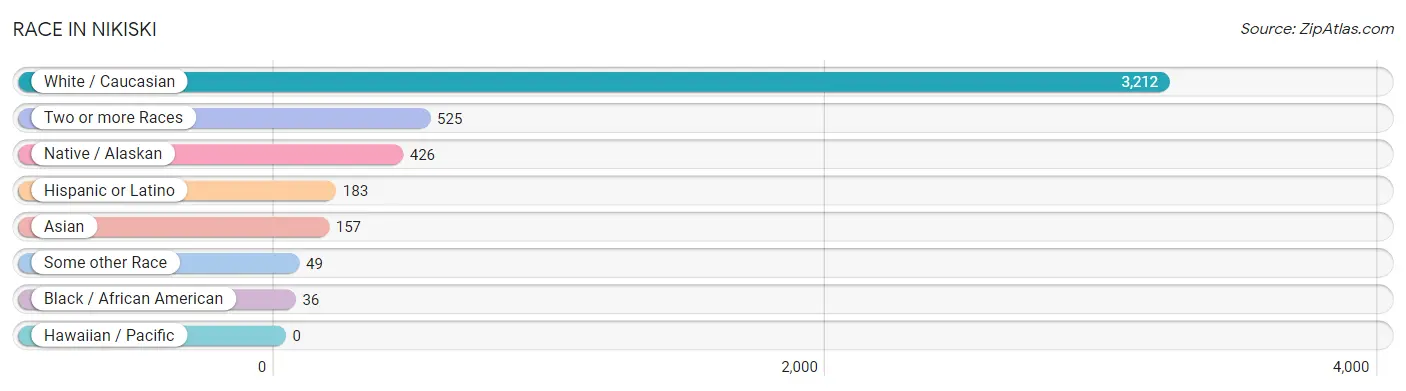
| Race | # Population | % Population |
| Asian | 157 | 3.6% |
| Black / African American | 36 | 0.8% |
| Hawaiian / Pacific | 0 | 0.0% |
| Hispanic or Latino | 183 | 4.2% |
| Native / Alaskan | 426 | 9.7% |
| White / Caucasian | 3,212 | 72.9% |
| Two or more Races | 525 | 11.9% |
| Some other Race | 49 | 1.1% |
| Total | 4,405 | 100.0% |
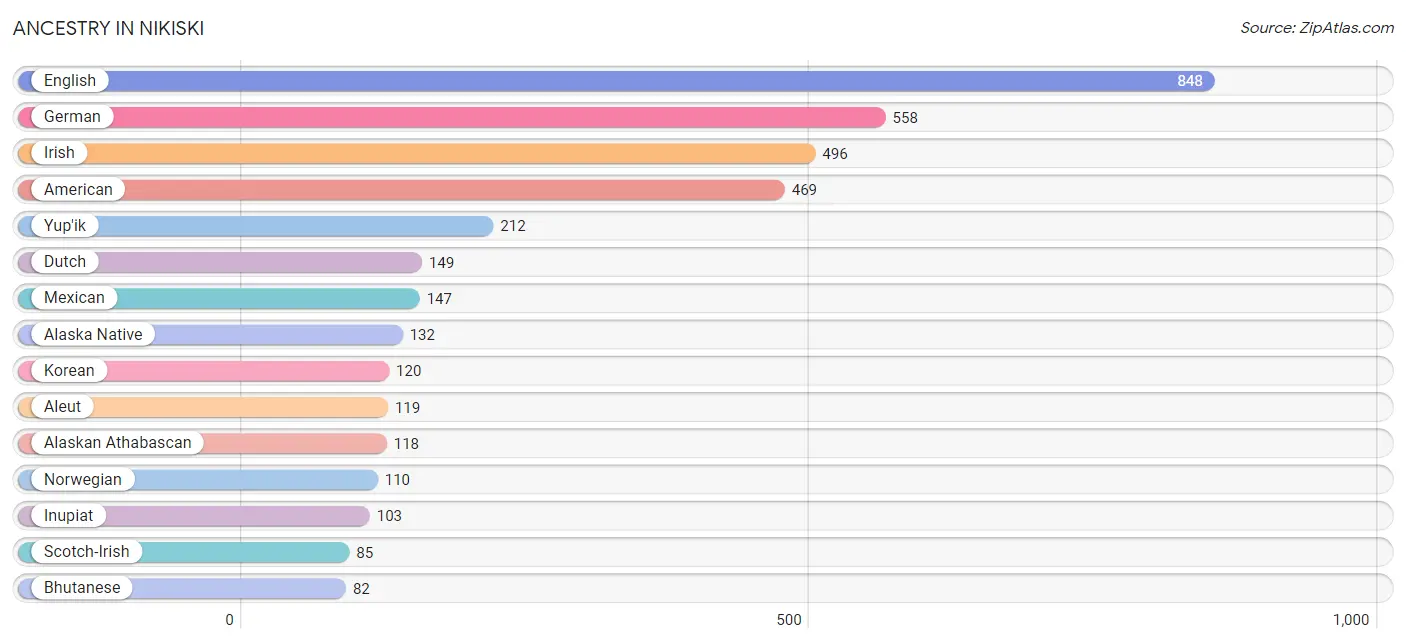
Ancestry in Nikiski
The most populous ancestries reported in Nikiski are English (848 | 19.3%), German (558 | 12.7%), Irish (496 | 11.3%), American (469 | 10.6%), and Yup'ik (212 | 4.8%), together accounting for 58.6% of all Nikiski residents.
| Ancestry | # Population | % Population |
| Alaska Native | 132 | 3.0% |
| Alaskan Athabascan | 118 | 2.7% |
| Aleut | 119 | 2.7% |
| American | 469 | 10.6% |
| Belgian | 24 | 0.5% |
| Bhutanese | 82 | 1.9% |
| Blackfeet | 67 | 1.5% |
| British | 17 | 0.4% |
| Burmese | 27 | 0.6% |
| Choctaw | 68 | 1.5% |
| Cuban | 15 | 0.3% |
| Danish | 23 | 0.5% |
| Dominican | 2 | 0.1% |
| Dutch | 149 | 3.4% |
| English | 848 | 19.3% |
| European | 65 | 1.5% |
| Finnish | 5 | 0.1% |
| French | 38 | 0.9% |
| French Canadian | 42 | 0.9% |
| German | 558 | 12.7% |
| Ghanaian | 5 | 0.1% |
| Indian (Asian) | 25 | 0.6% |
| Inupiat | 103 | 2.3% |
| Irish | 496 | 11.3% |
| Italian | 82 | 1.9% |
| Jamaican | 7 | 0.2% |
| Korean | 120 | 2.7% |
| Mexican | 147 | 3.3% |
| Native Hawaiian | 65 | 1.5% |
| Northern European | 19 | 0.4% |
| Norwegian | 110 | 2.5% |
| Polish | 64 | 1.5% |
| Puerto Rican | 19 | 0.4% |
| Russian | 13 | 0.3% |
| Scandinavian | 20 | 0.4% |
| Scotch-Irish | 85 | 1.9% |
| Scottish | 80 | 1.8% |
| Sioux | 32 | 0.7% |
| Subsaharan African | 5 | 0.1% |
| Swedish | 8 | 0.2% |
| Tlingit-Haida | 56 | 1.3% |
| Yup'ik | 212 | 4.8% | View All 42 Rows |
Immigrants in Nikiski
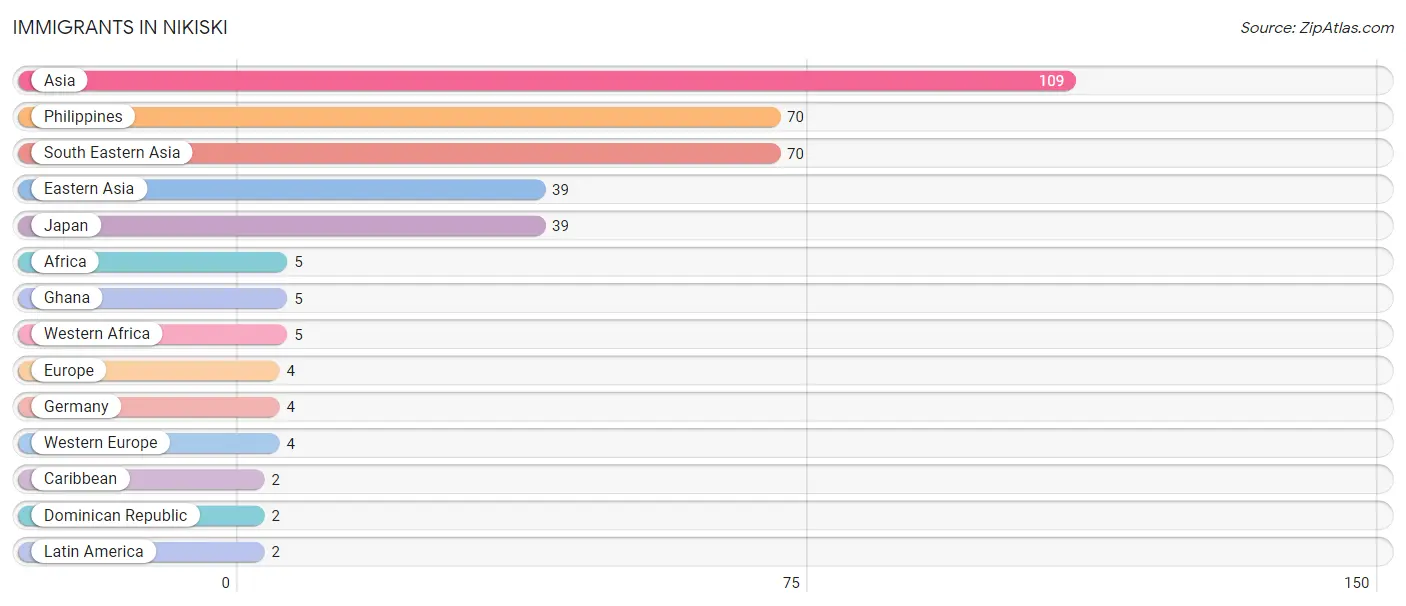
The most numerous immigrant groups reported in Nikiski came from Asia (109 | 2.5%), Philippines (70 | 1.6%), South Eastern Asia (70 | 1.6%), Eastern Asia (39 | 0.9%), and Japan (39 | 0.9%), together accounting for 7.4% of all Nikiski residents.
| Immigration Origin | # Population | % Population |
| Africa | 5 | 0.1% |
| Asia | 109 | 2.5% |
| Caribbean | 2 | 0.1% |
| Dominican Republic | 2 | 0.1% |
| Eastern Asia | 39 | 0.9% |
| Europe | 4 | 0.1% |
| Germany | 4 | 0.1% |
| Ghana | 5 | 0.1% |
| Japan | 39 | 0.9% |
| Latin America | 2 | 0.1% |
| Philippines | 70 | 1.6% |
| South Eastern Asia | 70 | 1.6% |
| Western Africa | 5 | 0.1% |
| Western Europe | 4 | 0.1% | View All 14 Rows |
Sex and Age in Nikiski
Sex and Age in Nikiski
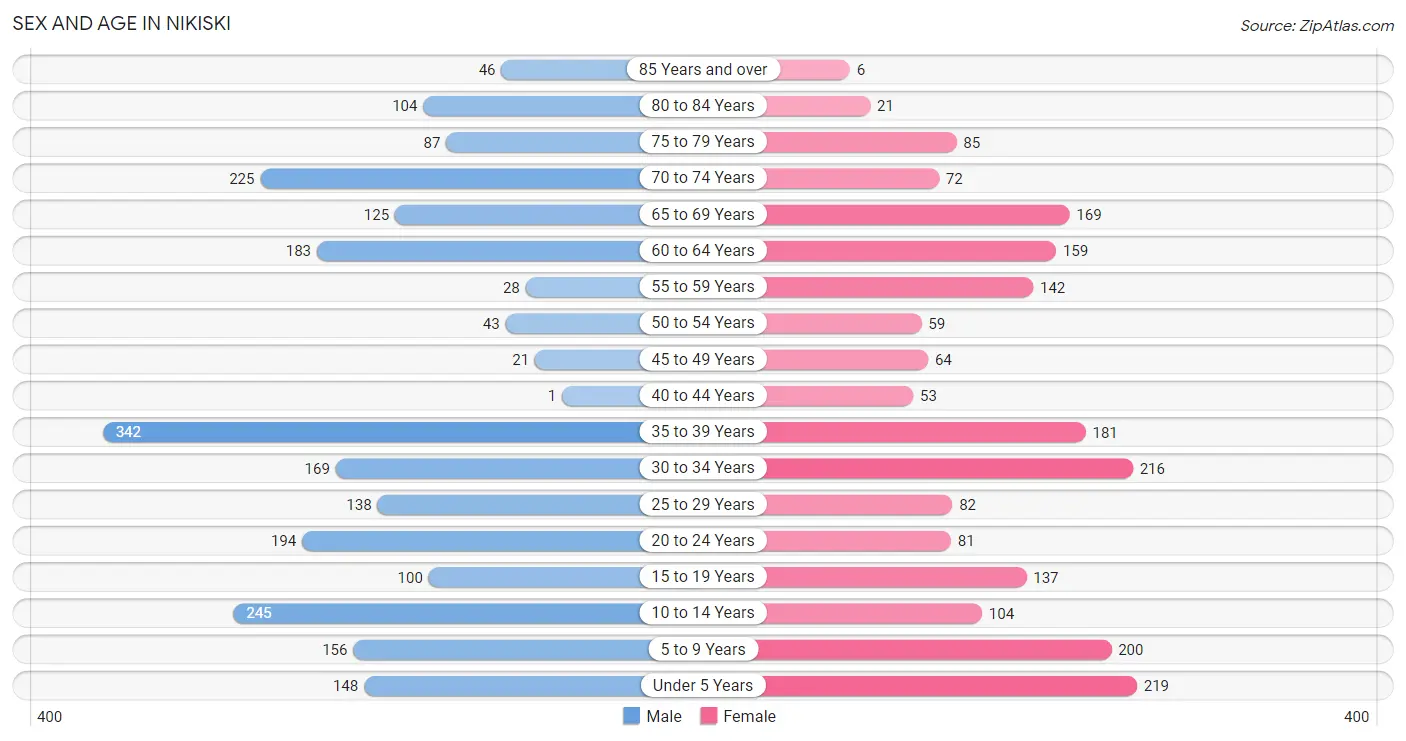
The most populous age groups in Nikiski are 35 to 39 Years (342 | 14.5%) for men and Under 5 Years (219 | 10.7%) for women.
| Age Bracket | Male | Female |
| Under 5 Years | 148 (6.3%) | 219 (10.7%) |
| 5 to 9 Years | 156 (6.6%) | 200 (9.8%) |
| 10 to 14 Years | 245 (10.4%) | 104 (5.1%) |
| 15 to 19 Years | 100 (4.3%) | 137 (6.7%) |
| 20 to 24 Years | 194 (8.2%) | 81 (4.0%) |
| 25 to 29 Years | 138 (5.9%) | 82 (4.0%) |
| 30 to 34 Years | 169 (7.2%) | 216 (10.5%) |
| 35 to 39 Years | 342 (14.5%) | 181 (8.8%) |
| 40 to 44 Years | 1 (0.0%) | 53 (2.6%) |
| 45 to 49 Years | 21 (0.9%) | 64 (3.1%) |
| 50 to 54 Years | 43 (1.8%) | 59 (2.9%) |
| 55 to 59 Years | 28 (1.2%) | 142 (6.9%) |
| 60 to 64 Years | 183 (7.8%) | 159 (7.8%) |
| 65 to 69 Years | 125 (5.3%) | 169 (8.2%) |
| 70 to 74 Years | 225 (9.6%) | 72 (3.5%) |
| 75 to 79 Years | 87 (3.7%) | 85 (4.2%) |
| 80 to 84 Years | 104 (4.4%) | 21 (1.0%) |
| 85 Years and over | 46 (1.9%) | 6 (0.3%) |
| Total | 2,355 (100.0%) | 2,050 (100.0%) |
Families and Households in Nikiski
Median Family Size in Nikiski
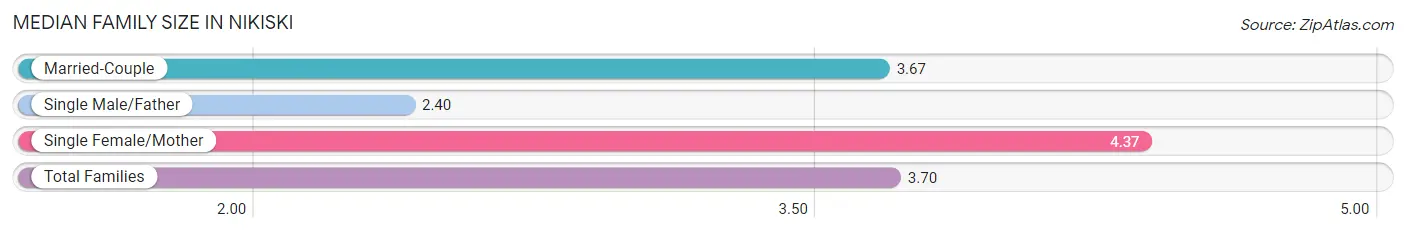
The median family size in Nikiski is 3.70 persons per family, with single female/mother families (118 | 13.0%) accounting for the largest median family size of 4.37 persons per family. On the other hand, single male/father families (47 | 5.2%) represent the smallest median family size with 2.40 persons per family.
| Family Type | # Families | Family Size |
| Married-Couple | 742 (81.8%) | 3.67 |
| Single Male/Father | 47 (5.2%) | 2.40 |
| Single Female/Mother | 118 (13.0%) | 4.37 |
| Total Families | 907 (100.0%) | 3.70 |
Median Household Size in Nikiski
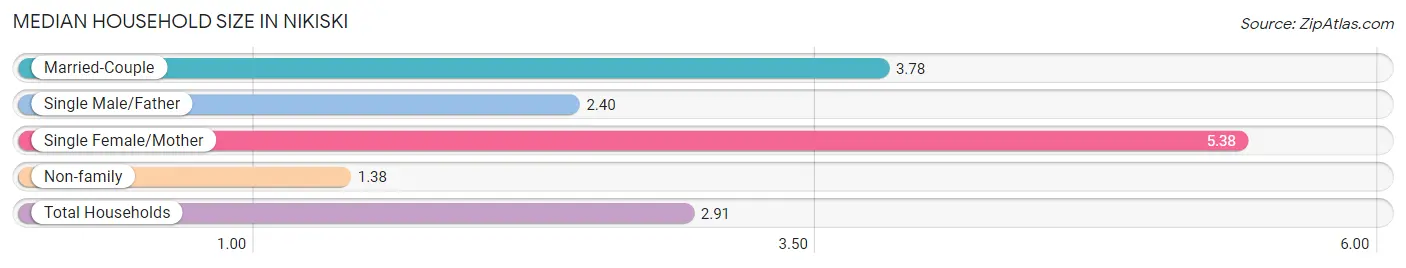
The median household size in Nikiski is 2.91 persons per household, with single female/mother households (118 | 7.8%) accounting for the largest median household size of 5.38 persons per household. non-family households (598 | 39.7%) represent the smallest median household size with 1.38 persons per household.
| Household Type | # Households | Household Size |
| Married-Couple | 742 (49.3%) | 3.78 |
| Single Male/Father | 47 (3.1%) | 2.40 |
| Single Female/Mother | 118 (7.8%) | 5.38 |
| Non-family | 598 (39.7%) | 1.38 |
| Total Households | 1,505 (100.0%) | 2.91 |
Household Size by Marriage Status in Nikiski
Out of a total of 1,505 households in Nikiski, 907 (60.3%) are family households, while 598 (39.7%) are nonfamily households. The most numerous type of family households are 2-person households, comprising 392, and the most common type of nonfamily households are 1-person households, comprising 472.
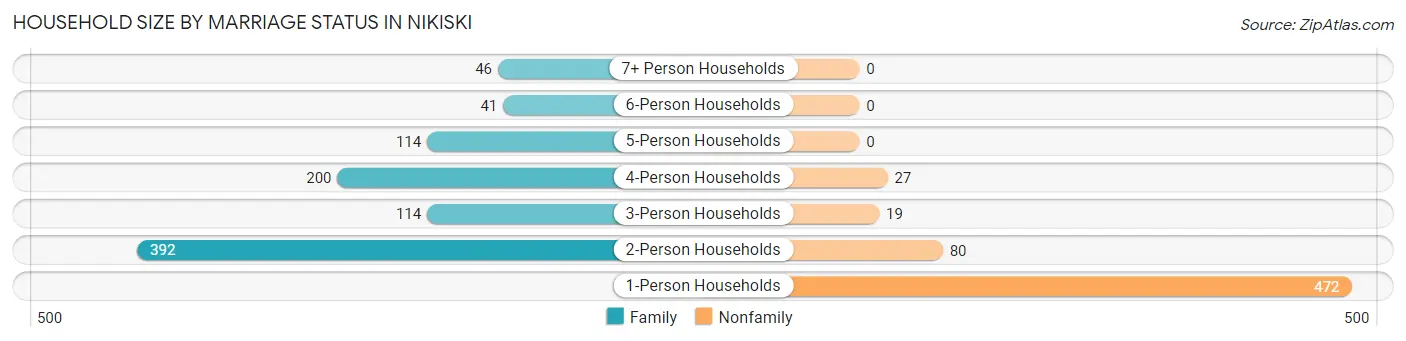
| Household Size | Family Households | Nonfamily Households |
| 1-Person Households | - | 472 (31.4%) |
| 2-Person Households | 392 (26.1%) | 80 (5.3%) |
| 3-Person Households | 114 (7.6%) | 19 (1.3%) |
| 4-Person Households | 200 (13.3%) | 27 (1.8%) |
| 5-Person Households | 114 (7.6%) | 0 (0.0%) |
| 6-Person Households | 41 (2.7%) | 0 (0.0%) |
| 7+ Person Households | 46 (3.1%) | 0 (0.0%) |
| Total | 907 (60.3%) | 598 (39.7%) |
Female Fertility in Nikiski
Fertility by Age in Nikiski
Average fertility rate in Nikiski is 19.0 births per 1,000 women. Women in the age bracket of 20 to 34 years have the highest fertility rate with 42.0 births per 1,000 women. Women in the age bracket of 20 to 34 years acount for 100.0% of all women with births.
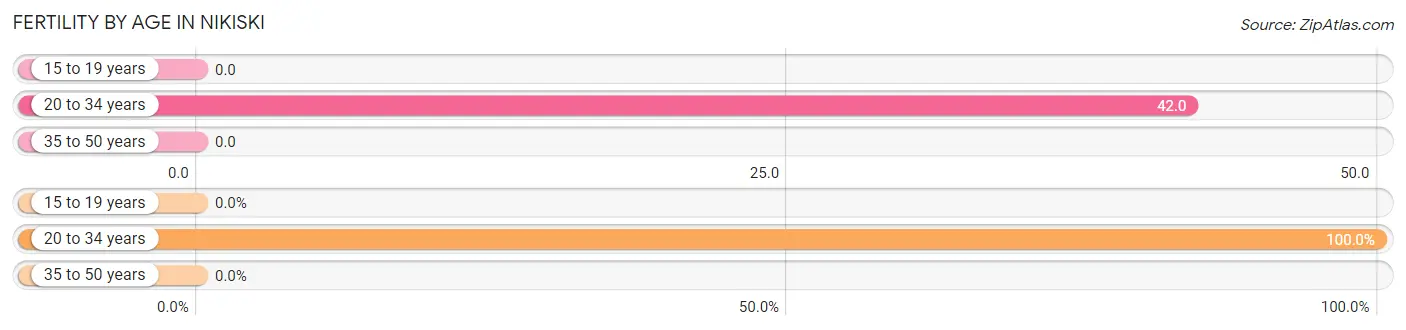
| Age Bracket | Women with Births | Births / 1,000 Women |
| 15 to 19 years | 0 (0.0%) | 0.0 |
| 20 to 34 years | 16 (100.0%) | 42.0 |
| 35 to 50 years | 0 (0.0%) | 0.0 |
| Total | 16 (100.0%) | 19.0 |
Fertility by Age by Marriage Status in Nikiski
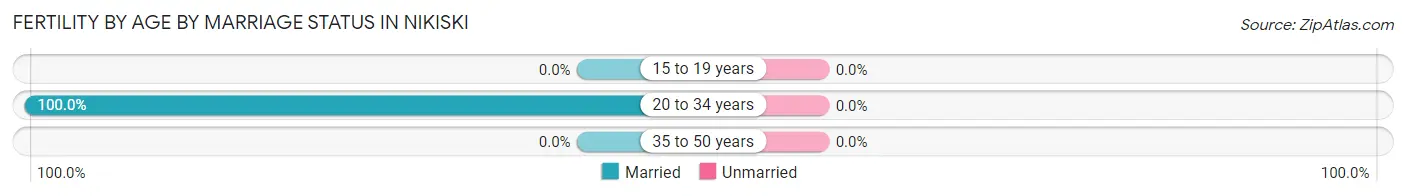
| Age Bracket | Married | Unmarried |
| 15 to 19 years | 0 (0.0%) | 0 (0.0%) |
| 20 to 34 years | 16 (100.0%) | 0 (0.0%) |
| 35 to 50 years | 0 (0.0%) | 0 (0.0%) |
| Total | 16 (100.0%) | 0 (0.0%) |
Fertility by Education in Nikiski
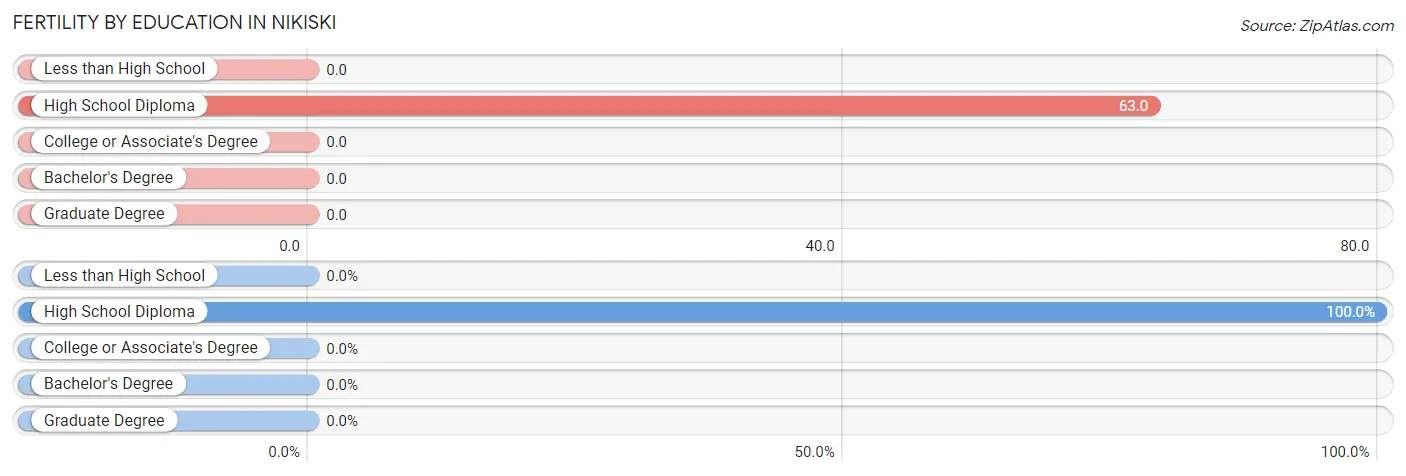
| Educational Attainment | Women with Births | Births / 1,000 Women |
| Less than High School | 0 (0.0%) | 0.0 |
| High School Diploma | 16 (100.0%) | 63.0 |
| College or Associate's Degree | 0 (0.0%) | 0.0 |
| Bachelor's Degree | 0 (0.0%) | 0.0 |
| Graduate Degree | 0 (0.0%) | 0.0 |
| Total | 16 (100.0%) | 19.0 |
Fertility by Education by Marriage Status in Nikiski
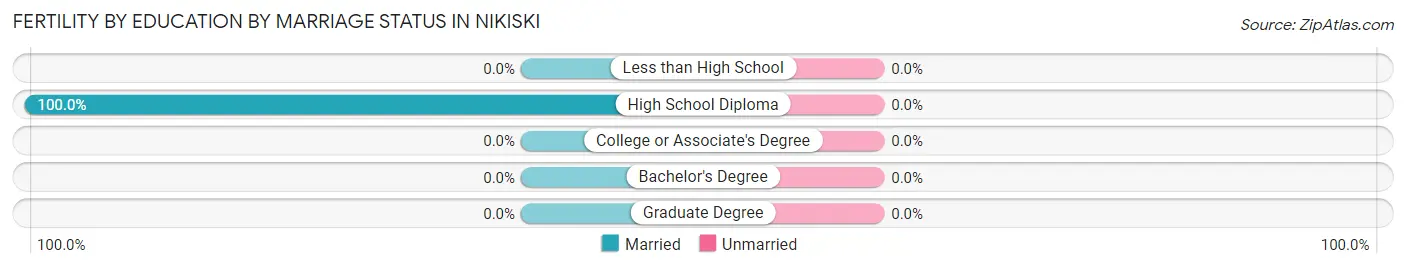
| Educational Attainment | Married | Unmarried |
| Less than High School | 0 (0.0%) | 0 (0.0%) |
| High School Diploma | 16 (100.0%) | 0 (0.0%) |
| College or Associate's Degree | 0 (0.0%) | 0 (0.0%) |
| Bachelor's Degree | 0 (0.0%) | 0 (0.0%) |
| Graduate Degree | 0 (0.0%) | 0 (0.0%) |
| Total | 16 (100.0%) | 0 (0.0%) |
Employment Characteristics in Nikiski
Employment by Class of Employer in Nikiski
Among the 1,418 employed individuals in Nikiski, private company employees (853 | 60.2%), not-for-profit organizations (197 | 13.9%), and local government employees (160 | 11.3%) make up the most common classes of employment.
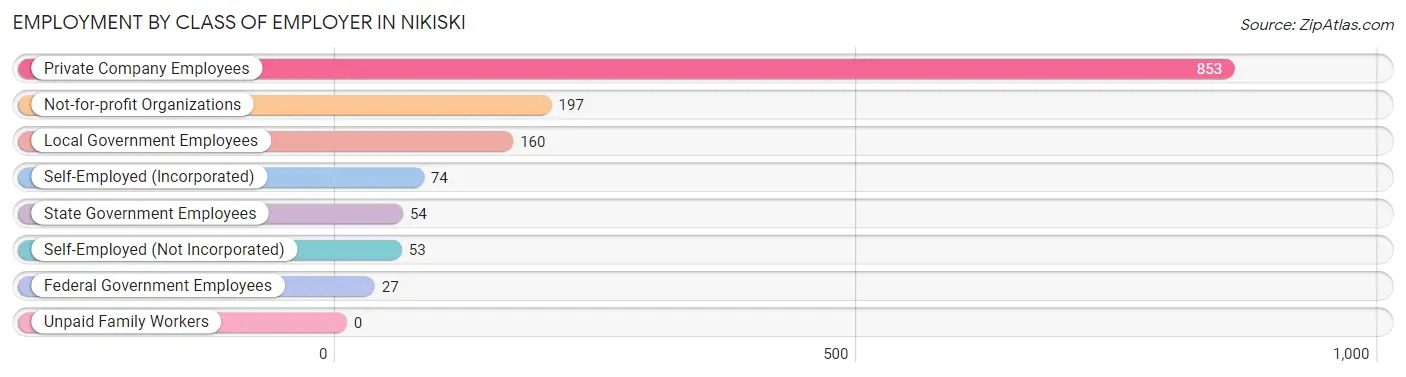
| Employer Class | # Employees | % Employees |
| Private Company Employees | 853 | 60.2% |
| Self-Employed (Incorporated) | 74 | 5.2% |
| Self-Employed (Not Incorporated) | 53 | 3.7% |
| Not-for-profit Organizations | 197 | 13.9% |
| Local Government Employees | 160 | 11.3% |
| State Government Employees | 54 | 3.8% |
| Federal Government Employees | 27 | 1.9% |
| Unpaid Family Workers | 0 | 0.0% |
| Total | 1,418 | 100.0% |
Employment Status by Age in Nikiski
According to the labor force statistics for Nikiski, out of the total population over 16 years of age (3,270), 46.9% or 1,534 individuals are in the labor force, with 4.8% or 74 of them unemployed. The age group with the highest labor force participation rate is 45 to 54 years, with 93.0% or 174 individuals in the labor force. Within the labor force, the 75 years and over age range has the highest percentage of unemployed individuals, with 100.0% or 20 of them being unemployed.
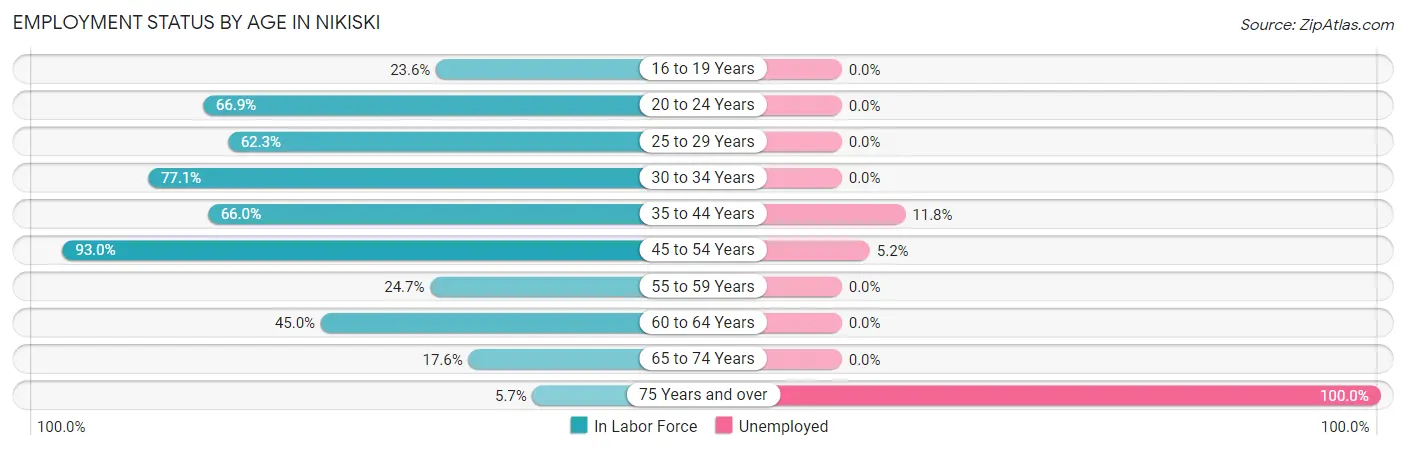
| Age Bracket | In Labor Force | Unemployed |
| 16 to 19 Years | 41 (23.6%) | 0 (0.0%) |
| 20 to 24 Years | 184 (66.9%) | 0 (0.0%) |
| 25 to 29 Years | 137 (62.3%) | 0 (0.0%) |
| 30 to 34 Years | 297 (77.1%) | 0 (0.0%) |
| 35 to 44 Years | 381 (66.0%) | 45 (11.8%) |
| 45 to 54 Years | 174 (93.0%) | 9 (5.2%) |
| 55 to 59 Years | 42 (24.7%) | 0 (0.0%) |
| 60 to 64 Years | 154 (45.0%) | 0 (0.0%) |
| 65 to 74 Years | 104 (17.6%) | 0 (0.0%) |
| 75 Years and over | 20 (5.7%) | 20 (100.0%) |
| Total | 1,534 (46.9%) | 74 (4.8%) |
Employment Status by Educational Attainment in Nikiski
According to labor force statistics for Nikiski, 63.0% of individuals (1,185) out of the total population between 25 and 64 years of age (1,881) are in the labor force, with 4.6% or 55 of them being unemployed. The group with the highest labor force participation rate are those with the educational attainment of bachelor's degree or higher, with 76.0% or 136 individuals in the labor force. Within the labor force, individuals with high school diploma education have the highest percentage of unemployment, with 11.5% or 54 of them being unemployed.
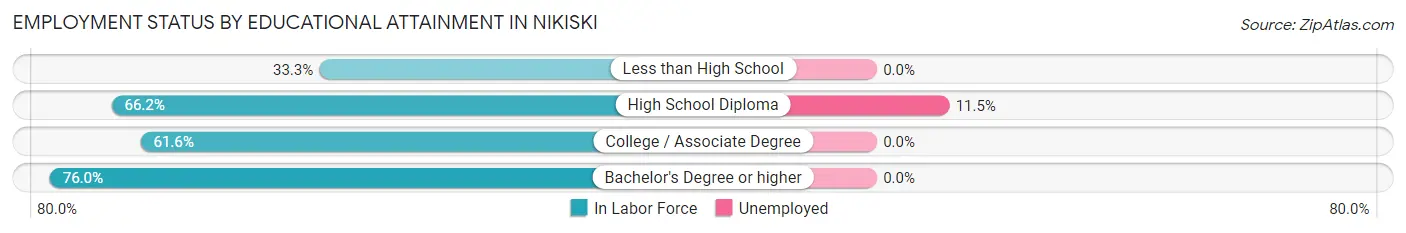
| Educational Attainment | In Labor Force | Unemployed |
| Less than High School | 38 (33.3%) | 0 (0.0%) |
| High School Diploma | 470 (66.2%) | 82 (11.5%) |
| College / Associate Degree | 541 (61.6%) | 0 (0.0%) |
| Bachelor's Degree or higher | 136 (76.0%) | 0 (0.0%) |
| Total | 1,185 (63.0%) | 87 (4.6%) |
Employment Occupations by Sex in Nikiski
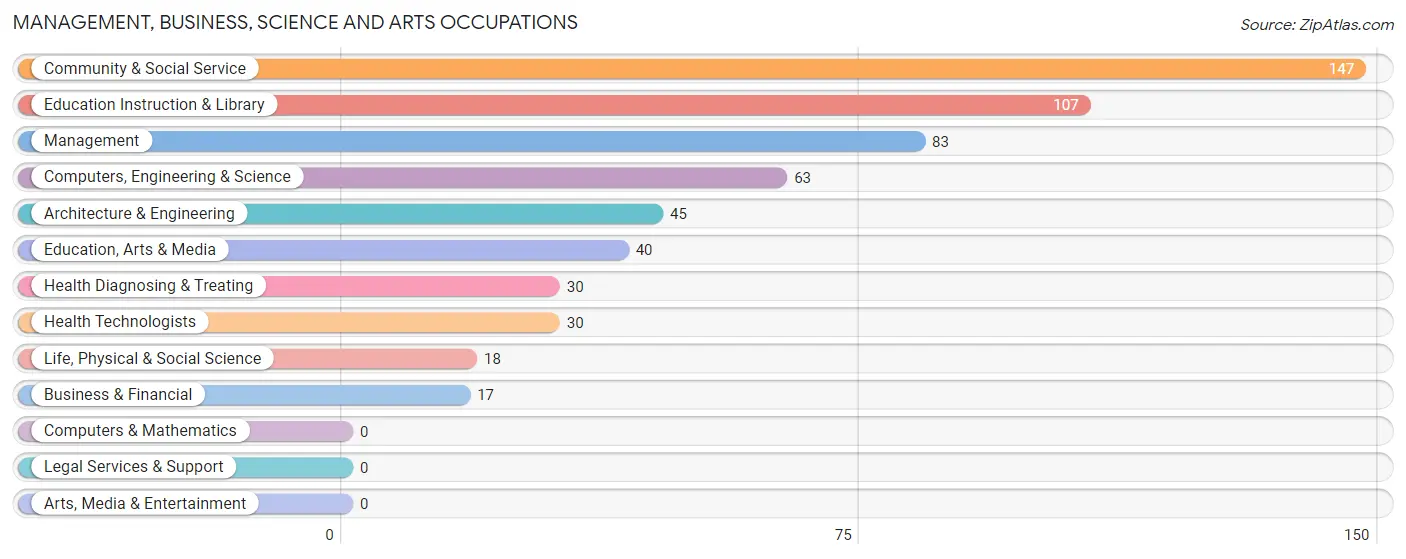
Management, Business, Science and Arts Occupations
The most common Management, Business, Science and Arts occupations in Nikiski are Community & Social Service (147 | 10.1%), Education Instruction & Library (107 | 7.3%), Management (83 | 5.7%), Computers, Engineering & Science (63 | 4.3%), and Architecture & Engineering (45 | 3.1%).
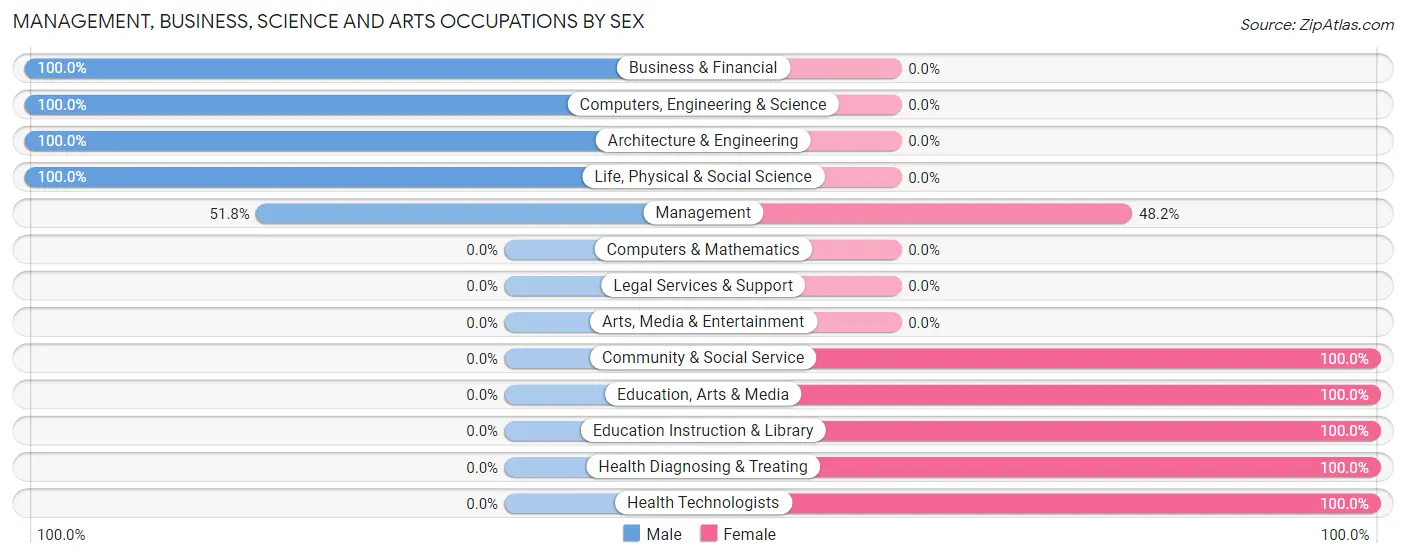
Management, Business, Science and Arts Occupations by Sex
Within the Management, Business, Science and Arts occupations in Nikiski, the most male-oriented occupations are Business & Financial (100.0%), Computers, Engineering & Science (100.0%), and Architecture & Engineering (100.0%), while the most female-oriented occupations are Community & Social Service (100.0%), Education, Arts & Media (100.0%), and Education Instruction & Library (100.0%).
| Occupation | Male | Female |
| Management | 43 (51.8%) | 40 (48.2%) |
| Business & Financial | 17 (100.0%) | 0 (0.0%) |
| Computers, Engineering & Science | 63 (100.0%) | 0 (0.0%) |
| Computers & Mathematics | 0 (0.0%) | 0 (0.0%) |
| Architecture & Engineering | 45 (100.0%) | 0 (0.0%) |
| Life, Physical & Social Science | 18 (100.0%) | 0 (0.0%) |
| Community & Social Service | 0 (0.0%) | 147 (100.0%) |
| Education, Arts & Media | 0 (0.0%) | 40 (100.0%) |
| Legal Services & Support | 0 (0.0%) | 0 (0.0%) |
| Education Instruction & Library | 0 (0.0%) | 107 (100.0%) |
| Arts, Media & Entertainment | 0 (0.0%) | 0 (0.0%) |
| Health Diagnosing & Treating | 0 (0.0%) | 30 (100.0%) |
| Health Technologists | 0 (0.0%) | 30 (100.0%) |
| Total (Category) | 123 (36.2%) | 217 (63.8%) |
| Total (Overall) | 886 (60.7%) | 574 (39.3%) |
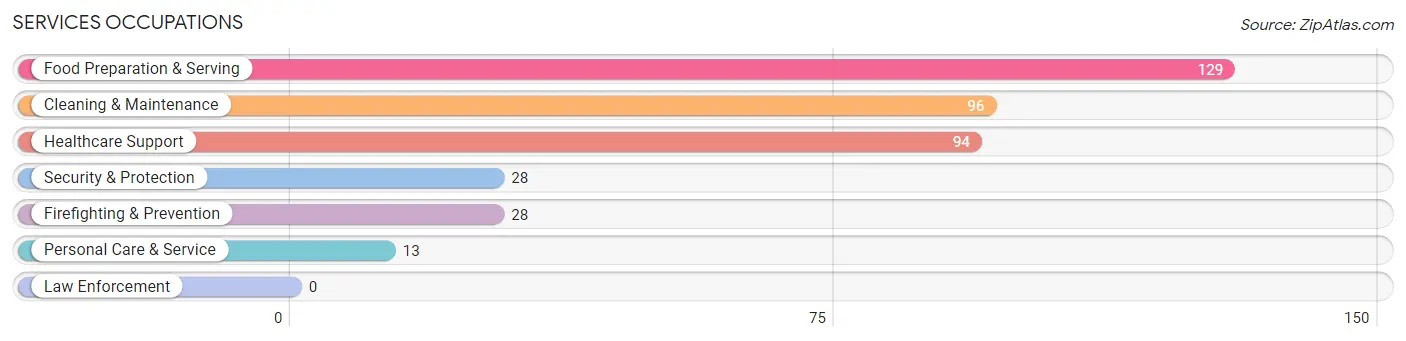
Services Occupations
The most common Services occupations in Nikiski are Food Preparation & Serving (129 | 8.8%), Cleaning & Maintenance (96 | 6.6%), Healthcare Support (94 | 6.4%), Security & Protection (28 | 1.9%), and Firefighting & Prevention (28 | 1.9%).
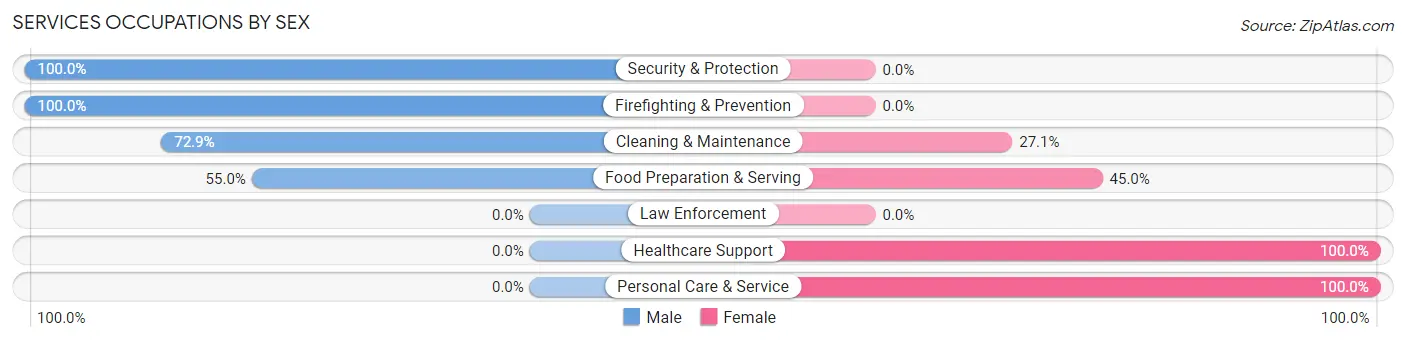
Services Occupations by Sex
Within the Services occupations in Nikiski, the most male-oriented occupations are Security & Protection (100.0%), Firefighting & Prevention (100.0%), and Cleaning & Maintenance (72.9%), while the most female-oriented occupations are Healthcare Support (100.0%), Personal Care & Service (100.0%), and Food Preparation & Serving (45.0%).
| Occupation | Male | Female |
| Healthcare Support | 0 (0.0%) | 94 (100.0%) |
| Security & Protection | 28 (100.0%) | 0 (0.0%) |
| Firefighting & Prevention | 28 (100.0%) | 0 (0.0%) |
| Law Enforcement | 0 (0.0%) | 0 (0.0%) |
| Food Preparation & Serving | 71 (55.0%) | 58 (45.0%) |
| Cleaning & Maintenance | 70 (72.9%) | 26 (27.1%) |
| Personal Care & Service | 0 (0.0%) | 13 (100.0%) |
| Total (Category) | 169 (46.9%) | 191 (53.1%) |
| Total (Overall) | 886 (60.7%) | 574 (39.3%) |
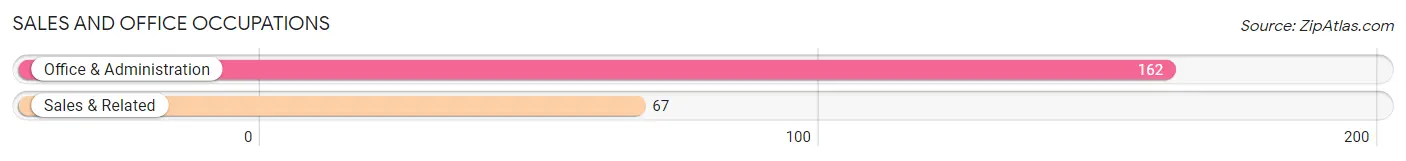
Sales and Office Occupations
The most common Sales and Office occupations in Nikiski are Office & Administration (162 | 11.1%), and Sales & Related (67 | 4.6%).
Sales and Office Occupations by Sex
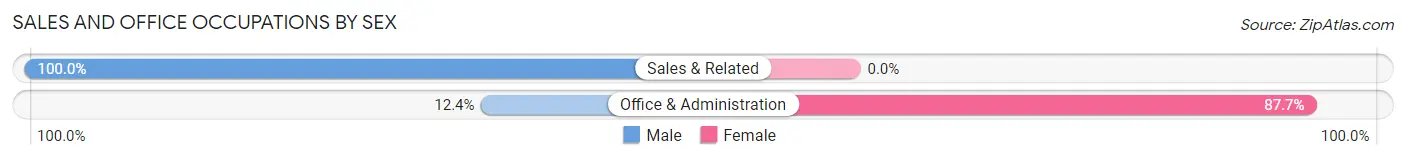
| Occupation | Male | Female |
| Sales & Related | 67 (100.0%) | 0 (0.0%) |
| Office & Administration | 20 (12.3%) | 142 (87.6%) |
| Total (Category) | 87 (38.0%) | 142 (62.0%) |
| Total (Overall) | 886 (60.7%) | 574 (39.3%) |
Natural Resources, Construction and Maintenance Occupations
The most common Natural Resources, Construction and Maintenance occupations in Nikiski are Construction & Extraction (201 | 13.8%), Farming, Fishing & Forestry (48 | 3.3%), and Installation, Maintenance & Repair (46 | 3.2%).
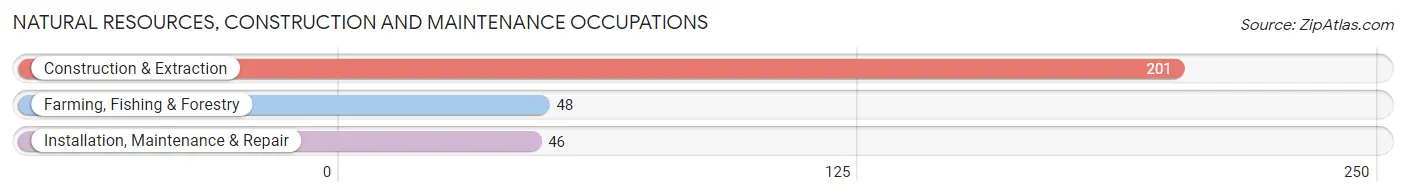
Natural Resources, Construction and Maintenance Occupations by Sex
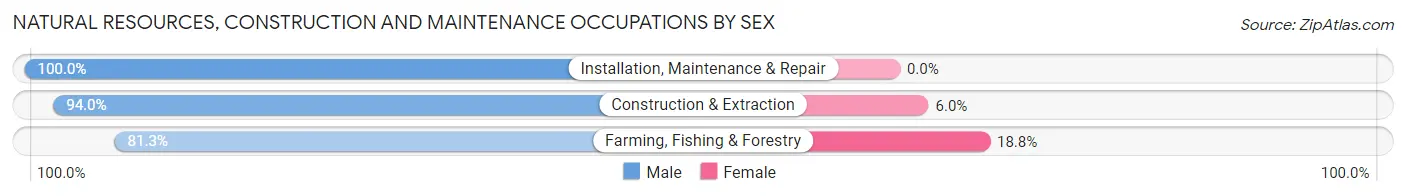
| Occupation | Male | Female |
| Farming, Fishing & Forestry | 39 (81.2%) | 9 (18.8%) |
| Construction & Extraction | 189 (94.0%) | 12 (6.0%) |
| Installation, Maintenance & Repair | 46 (100.0%) | 0 (0.0%) |
| Total (Category) | 274 (92.9%) | 21 (7.1%) |
| Total (Overall) | 886 (60.7%) | 574 (39.3%) |
Production, Transportation and Moving Occupations
The most common Production, Transportation and Moving occupations in Nikiski are Material Moving (154 | 10.5%), Production (57 | 3.9%), and Transportation (25 | 1.7%).
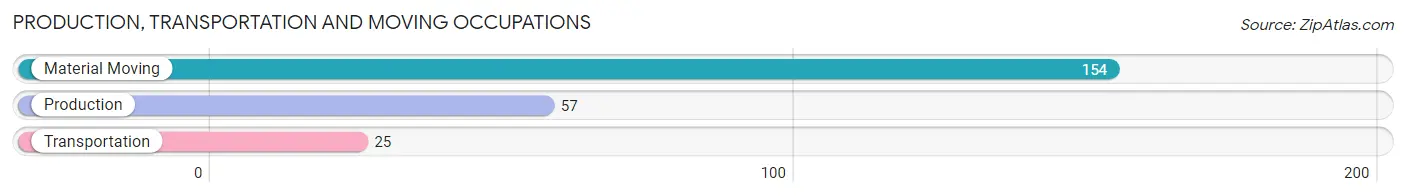
Production, Transportation and Moving Occupations by Sex
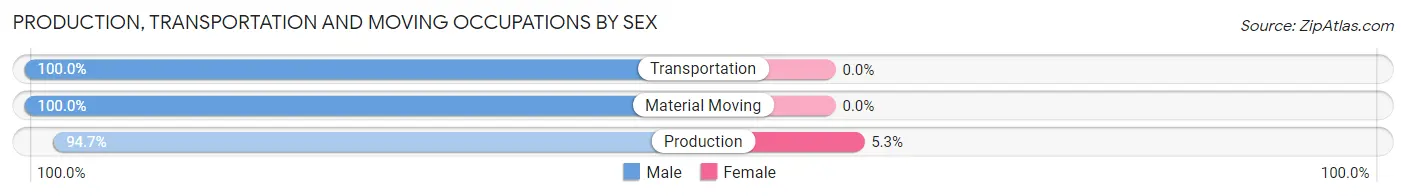
| Occupation | Male | Female |
| Production | 54 (94.7%) | 3 (5.3%) |
| Transportation | 25 (100.0%) | 0 (0.0%) |
| Material Moving | 154 (100.0%) | 0 (0.0%) |
| Total (Category) | 233 (98.7%) | 3 (1.3%) |
| Total (Overall) | 886 (60.7%) | 574 (39.3%) |
Employment Industries by Sex in Nikiski
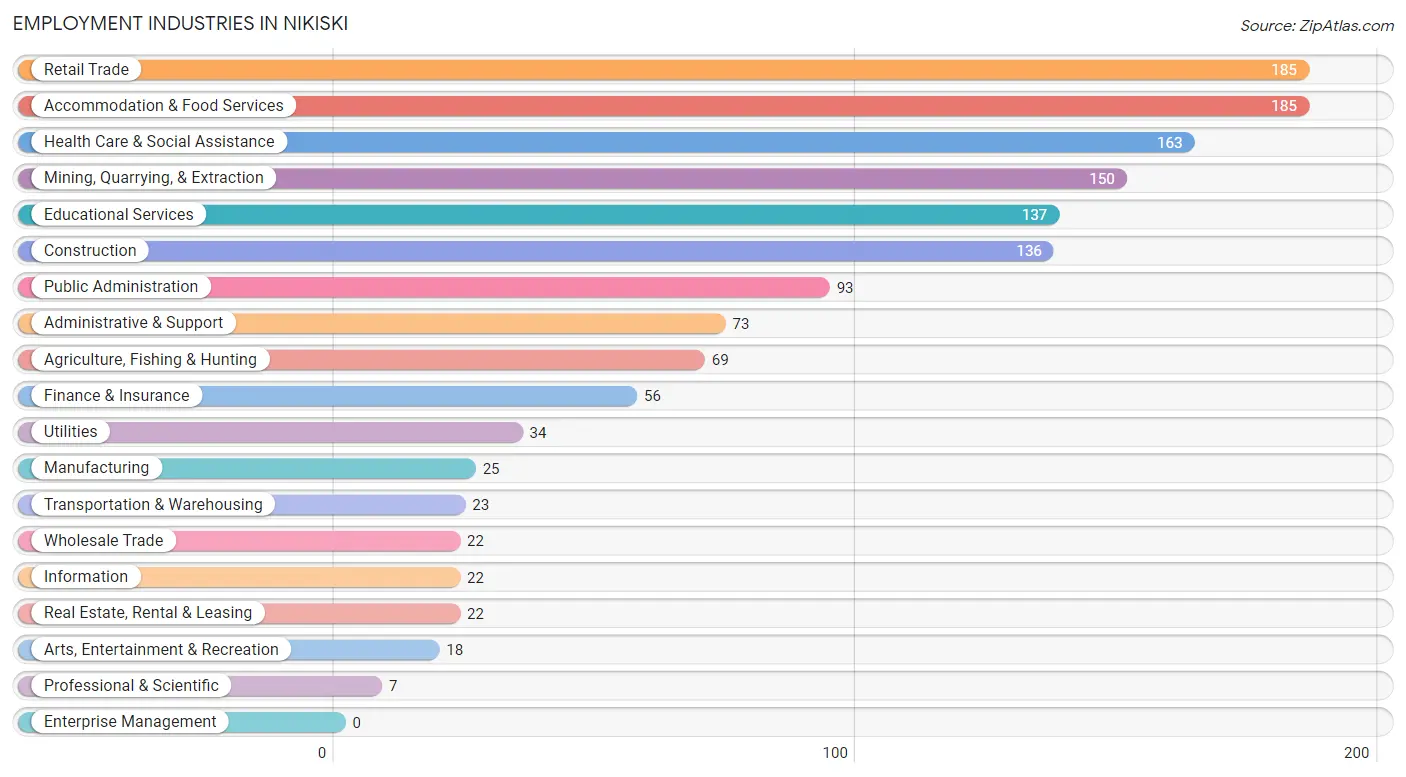
Employment Industries in Nikiski
The major employment industries in Nikiski include Retail Trade (185 | 12.7%), Accommodation & Food Services (185 | 12.7%), Health Care & Social Assistance (163 | 11.2%), Mining, Quarrying, & Extraction (150 | 10.3%), and Educational Services (137 | 9.4%).
Employment Industries by Sex in Nikiski
The Nikiski industries that see more men than women are Construction (100.0%), Wholesale Trade (100.0%), and Transportation & Warehousing (100.0%), whereas the industries that tend to have a higher number of women are Finance & Insurance (100.0%), Real Estate, Rental & Leasing (100.0%), and Educational Services (100.0%).
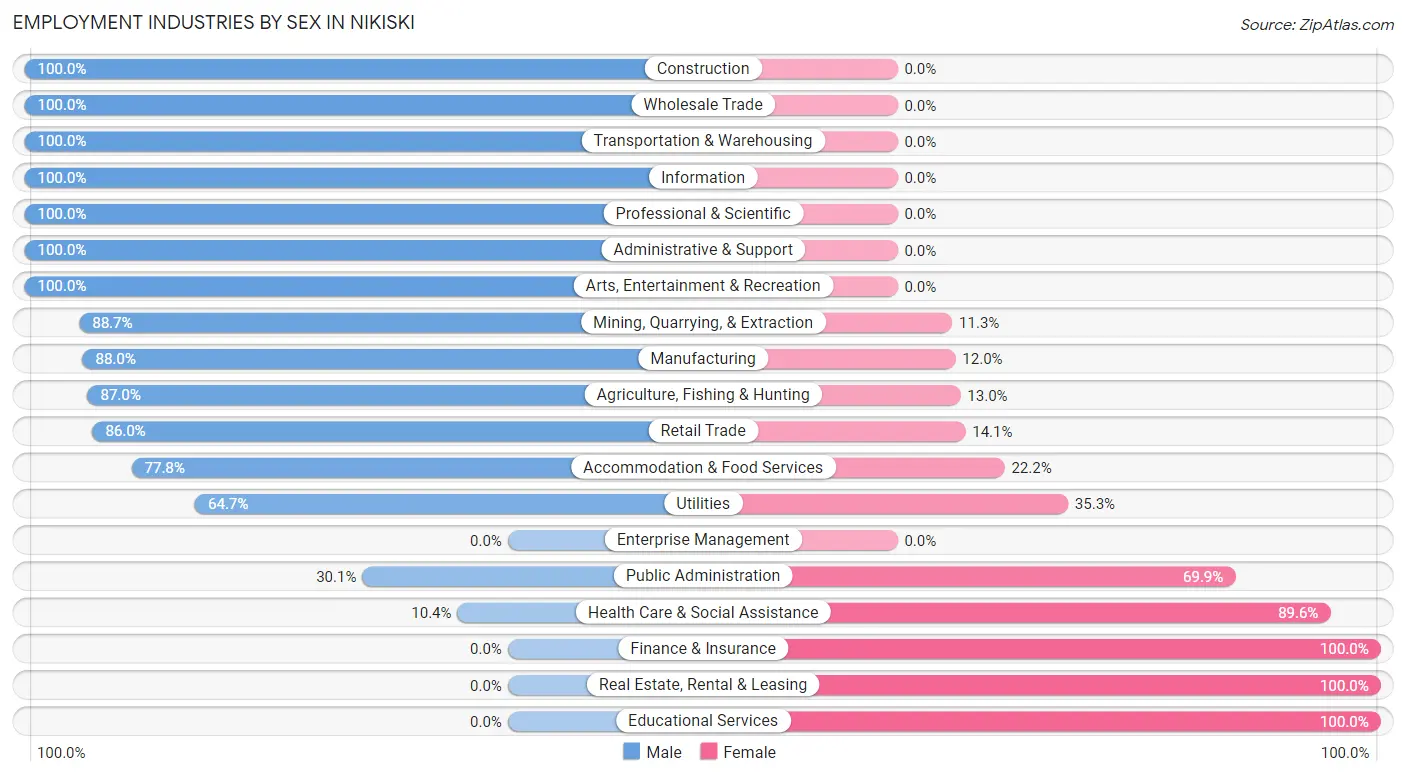
| Industry | Male | Female |
| Agriculture, Fishing & Hunting | 60 (87.0%) | 9 (13.0%) |
| Mining, Quarrying, & Extraction | 133 (88.7%) | 17 (11.3%) |
| Construction | 136 (100.0%) | 0 (0.0%) |
| Manufacturing | 22 (88.0%) | 3 (12.0%) |
| Wholesale Trade | 22 (100.0%) | 0 (0.0%) |
| Retail Trade | 159 (86.0%) | 26 (14.1%) |
| Transportation & Warehousing | 23 (100.0%) | 0 (0.0%) |
| Utilities | 22 (64.7%) | 12 (35.3%) |
| Information | 22 (100.0%) | 0 (0.0%) |
| Finance & Insurance | 0 (0.0%) | 56 (100.0%) |
| Real Estate, Rental & Leasing | 0 (0.0%) | 22 (100.0%) |
| Professional & Scientific | 7 (100.0%) | 0 (0.0%) |
| Enterprise Management | 0 (0.0%) | 0 (0.0%) |
| Administrative & Support | 73 (100.0%) | 0 (0.0%) |
| Educational Services | 0 (0.0%) | 137 (100.0%) |
| Health Care & Social Assistance | 17 (10.4%) | 146 (89.6%) |
| Arts, Entertainment & Recreation | 18 (100.0%) | 0 (0.0%) |
| Accommodation & Food Services | 144 (77.8%) | 41 (22.2%) |
| Public Administration | 28 (30.1%) | 65 (69.9%) |
| Total | 886 (60.7%) | 574 (39.3%) |
Education in Nikiski
School Enrollment in Nikiski
The most common levels of schooling among the 1,050 students in Nikiski are middle school (275 | 26.2%), high school (251 | 23.9%), and elementary school (232 | 22.1%).
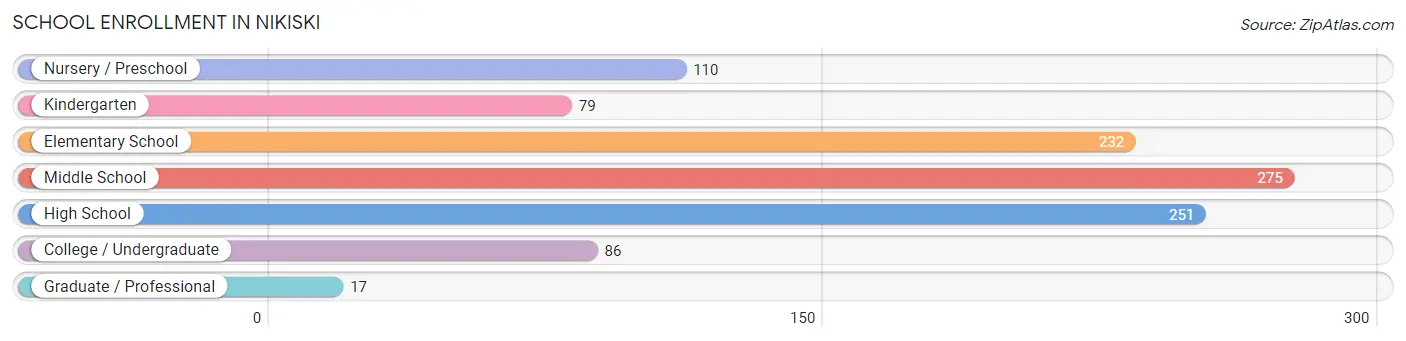
| School Level | # Students | % Students |
| Nursery / Preschool | 110 | 10.5% |
| Kindergarten | 79 | 7.5% |
| Elementary School | 232 | 22.1% |
| Middle School | 275 | 26.2% |
| High School | 251 | 23.9% |
| College / Undergraduate | 86 | 8.2% |
| Graduate / Professional | 17 | 1.6% |
| Total | 1,050 | 100.0% |
School Enrollment by Age by Funding Source in Nikiski
Out of a total of 1,050 students who are enrolled in schools in Nikiski, 284 (27.0%) attend a private institution, while the remaining 766 (73.0%) are enrolled in public schools. The age group of 3 to 4 year olds has the highest likelihood of being enrolled in private schools, with 65 (77.4% in the age bracket) enrolled. Conversely, the age group of 18 to 19 year olds has the lowest likelihood of being enrolled in a private school, with 30 (100.0% in the age bracket) attending a public institution.
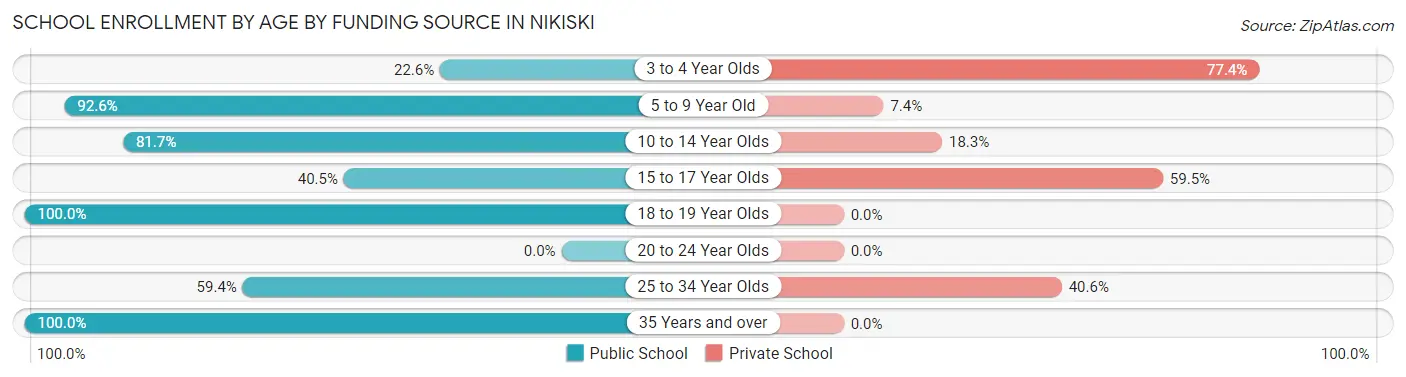
| Age Bracket | Public School | Private School |
| 3 to 4 Year Olds | 19 (22.6%) | 65 (77.4%) |
| 5 to 9 Year Old | 312 (92.6%) | 25 (7.4%) |
| 10 to 14 Year Olds | 254 (81.7%) | 57 (18.3%) |
| 15 to 17 Year Olds | 75 (40.5%) | 110 (59.5%) |
| 18 to 19 Year Olds | 30 (100.0%) | 0 (0.0%) |
| 20 to 24 Year Olds | 0 (0.0%) | 0 (0.0%) |
| 25 to 34 Year Olds | 38 (59.4%) | 26 (40.6%) |
| 35 Years and over | 39 (100.0%) | 0 (0.0%) |
| Total | 766 (73.0%) | 284 (27.0%) |
Educational Attainment by Field of Study in Nikiski
Science & technology (92 | 21.6%), physical & health sciences (71 | 16.7%), education (68 | 16.0%), engineering (61 | 14.3%), and business (41 | 9.6%) are the most common fields of study among 426 individuals in Nikiski who have obtained a bachelor's degree or higher.
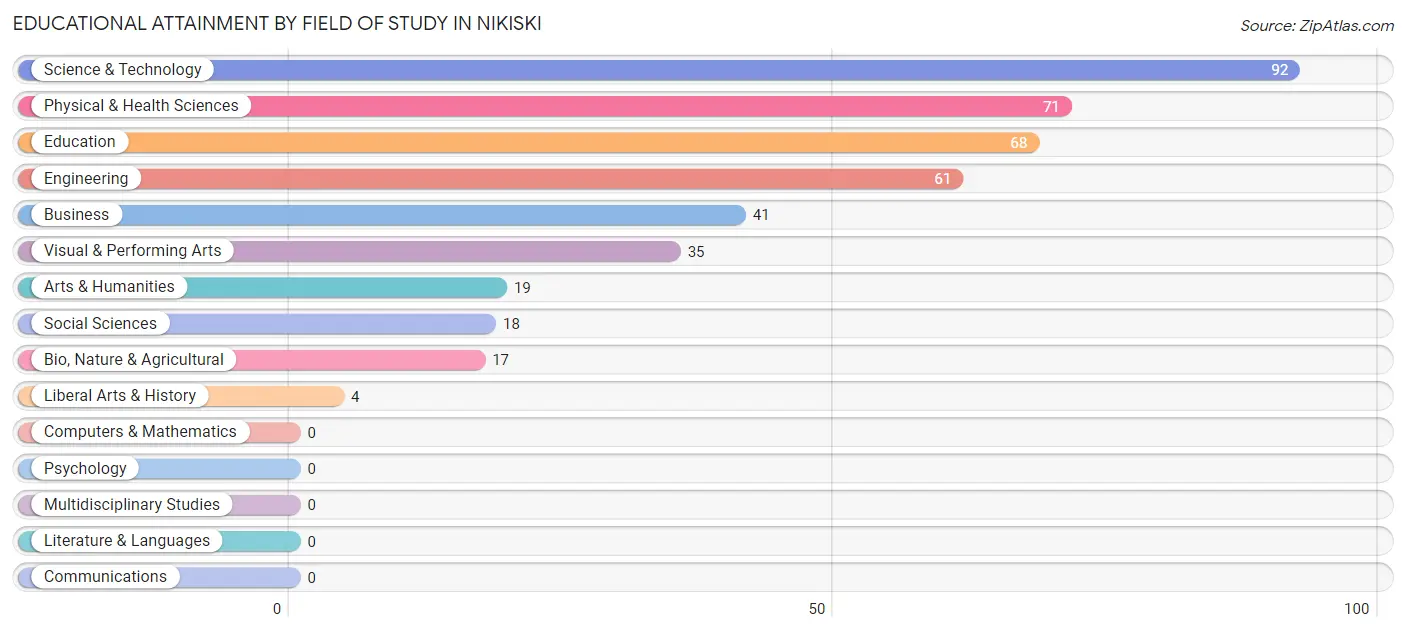
| Field of Study | # Graduates | % Graduates |
| Computers & Mathematics | 0 | 0.0% |
| Bio, Nature & Agricultural | 17 | 4.0% |
| Physical & Health Sciences | 71 | 16.7% |
| Psychology | 0 | 0.0% |
| Social Sciences | 18 | 4.2% |
| Engineering | 61 | 14.3% |
| Multidisciplinary Studies | 0 | 0.0% |
| Science & Technology | 92 | 21.6% |
| Business | 41 | 9.6% |
| Education | 68 | 16.0% |
| Literature & Languages | 0 | 0.0% |
| Liberal Arts & History | 4 | 0.9% |
| Visual & Performing Arts | 35 | 8.2% |
| Communications | 0 | 0.0% |
| Arts & Humanities | 19 | 4.5% |
| Total | 426 | 100.0% |
Transportation & Commute in Nikiski
Vehicle Availability by Sex in Nikiski
The most prevalent vehicle ownership categories in Nikiski are males with 1 vehicle (220, accounting for 26.2%) and females with 1 vehicle (113, making up 38.5%).
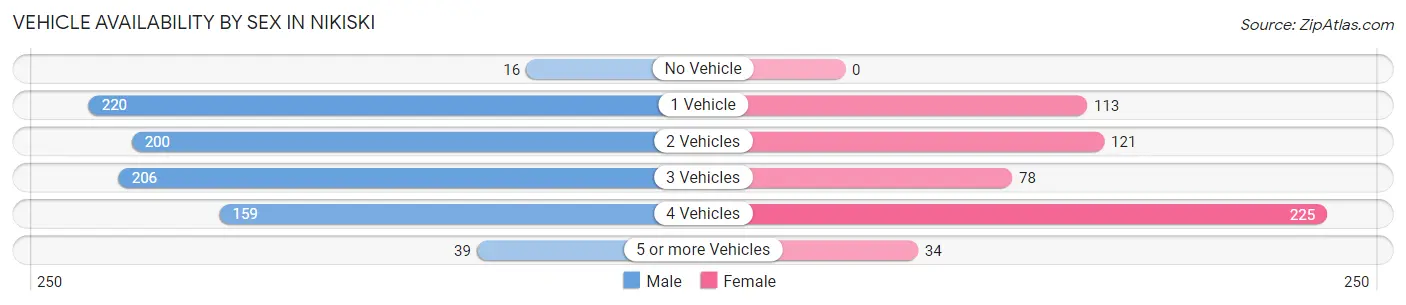
| Vehicles Available | Male | Female |
| No Vehicle | 16 (1.9%) | 0 (0.0%) |
| 1 Vehicle | 220 (26.2%) | 113 (19.8%) |
| 2 Vehicles | 200 (23.8%) | 121 (21.2%) |
| 3 Vehicles | 206 (24.5%) | 78 (13.7%) |
| 4 Vehicles | 159 (18.9%) | 225 (39.4%) |
| 5 or more Vehicles | 39 (4.6%) | 34 (5.9%) |
| Total | 840 (100.0%) | 571 (100.0%) |
Commute Time in Nikiski
The most frequently occuring commute durations in Nikiski are 15 to 19 minutes (290 commuters, 21.1%), 30 to 34 minutes (287 commuters, 20.9%), and 20 to 24 minutes (170 commuters, 12.4%).
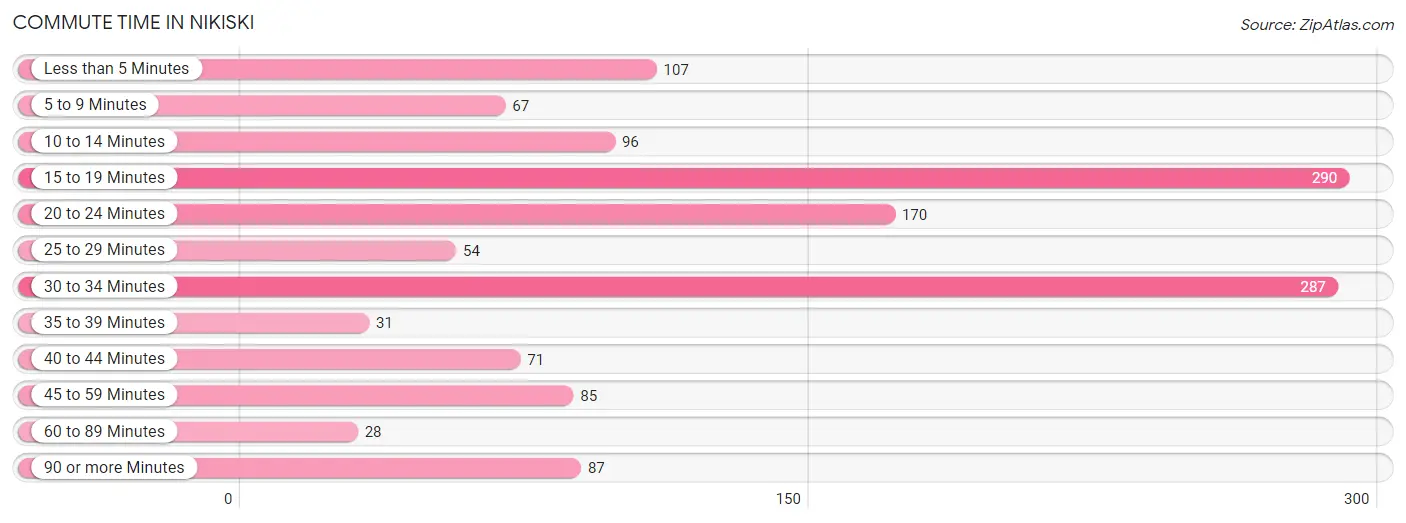
| Commute Time | # Commuters | % Commuters |
| Less than 5 Minutes | 107 | 7.8% |
| 5 to 9 Minutes | 67 | 4.9% |
| 10 to 14 Minutes | 96 | 7.0% |
| 15 to 19 Minutes | 290 | 21.1% |
| 20 to 24 Minutes | 170 | 12.4% |
| 25 to 29 Minutes | 54 | 3.9% |
| 30 to 34 Minutes | 287 | 20.9% |
| 35 to 39 Minutes | 31 | 2.3% |
| 40 to 44 Minutes | 71 | 5.2% |
| 45 to 59 Minutes | 85 | 6.2% |
| 60 to 89 Minutes | 28 | 2.0% |
| 90 or more Minutes | 87 | 6.3% |
Commute Time by Sex in Nikiski
The most common commute times in Nikiski are 15 to 19 minutes (249 commuters, 30.4%) for males and 30 to 34 minutes (114 commuters, 20.6%) for females.
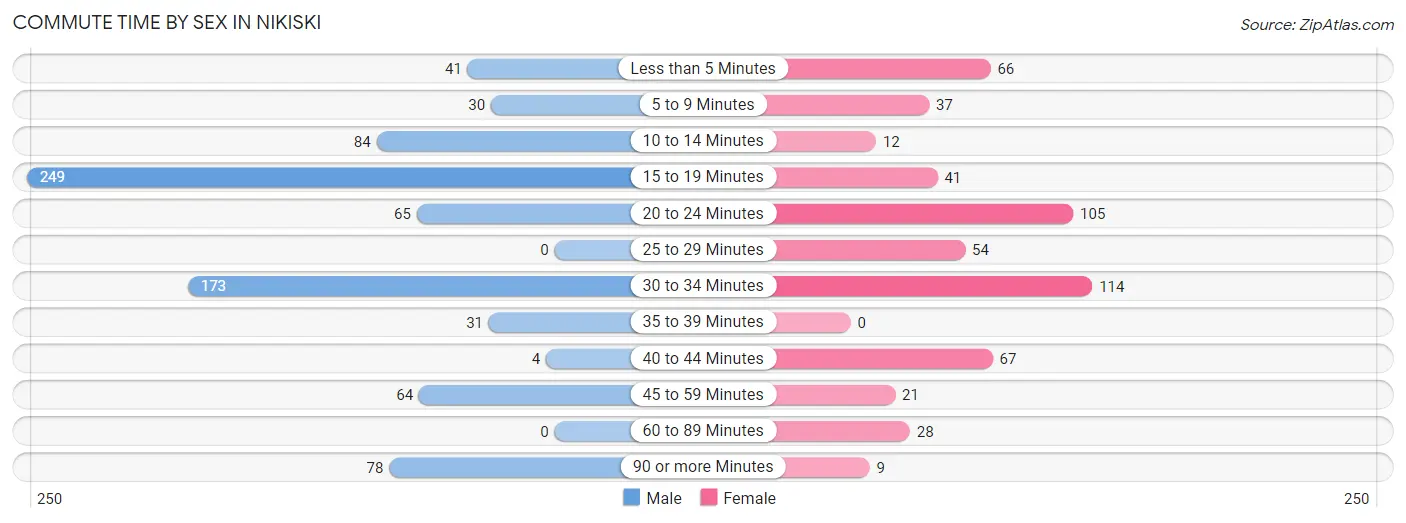
| Commute Time | Male | Female |
| Less than 5 Minutes | 41 (5.0%) | 66 (11.9%) |
| 5 to 9 Minutes | 30 (3.7%) | 37 (6.7%) |
| 10 to 14 Minutes | 84 (10.3%) | 12 (2.2%) |
| 15 to 19 Minutes | 249 (30.4%) | 41 (7.4%) |
| 20 to 24 Minutes | 65 (7.9%) | 105 (19.0%) |
| 25 to 29 Minutes | 0 (0.0%) | 54 (9.8%) |
| 30 to 34 Minutes | 173 (21.1%) | 114 (20.6%) |
| 35 to 39 Minutes | 31 (3.8%) | 0 (0.0%) |
| 40 to 44 Minutes | 4 (0.5%) | 67 (12.1%) |
| 45 to 59 Minutes | 64 (7.8%) | 21 (3.8%) |
| 60 to 89 Minutes | 0 (0.0%) | 28 (5.1%) |
| 90 or more Minutes | 78 (9.5%) | 9 (1.6%) |
Time of Departure to Work by Sex in Nikiski
The most frequent times of departure to work in Nikiski are 10:00 AM to 10:59 AM (152, 18.6%) for males and 7:00 AM to 7:29 AM (165, 29.8%) for females.
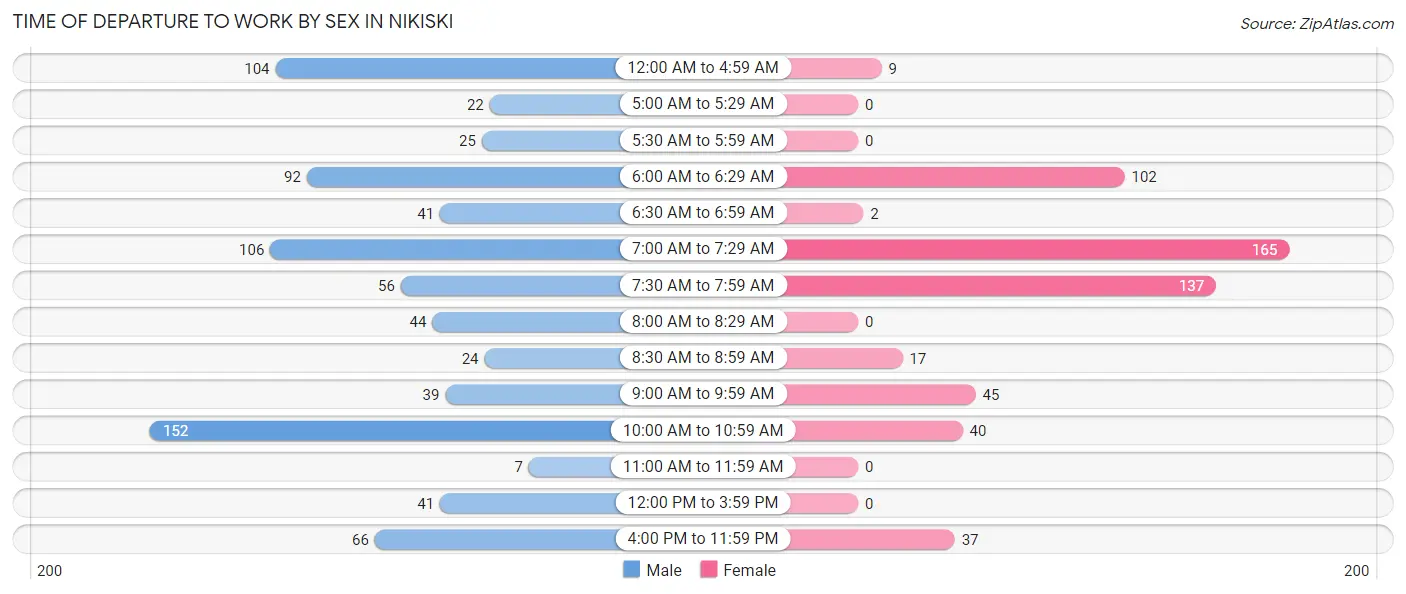
| Time of Departure | Male | Female |
| 12:00 AM to 4:59 AM | 104 (12.7%) | 9 (1.6%) |
| 5:00 AM to 5:29 AM | 22 (2.7%) | 0 (0.0%) |
| 5:30 AM to 5:59 AM | 25 (3.0%) | 0 (0.0%) |
| 6:00 AM to 6:29 AM | 92 (11.2%) | 102 (18.4%) |
| 6:30 AM to 6:59 AM | 41 (5.0%) | 2 (0.4%) |
| 7:00 AM to 7:29 AM | 106 (12.9%) | 165 (29.8%) |
| 7:30 AM to 7:59 AM | 56 (6.8%) | 137 (24.7%) |
| 8:00 AM to 8:29 AM | 44 (5.4%) | 0 (0.0%) |
| 8:30 AM to 8:59 AM | 24 (2.9%) | 17 (3.1%) |
| 9:00 AM to 9:59 AM | 39 (4.8%) | 45 (8.1%) |
| 10:00 AM to 10:59 AM | 152 (18.6%) | 40 (7.2%) |
| 11:00 AM to 11:59 AM | 7 (0.9%) | 0 (0.0%) |
| 12:00 PM to 3:59 PM | 41 (5.0%) | 0 (0.0%) |
| 4:00 PM to 11:59 PM | 66 (8.1%) | 37 (6.7%) |
| Total | 819 (100.0%) | 554 (100.0%) |
Housing Occupancy in Nikiski
Occupancy by Ownership in Nikiski
Of the total 1,505 dwellings in Nikiski, owner-occupied units account for 1,230 (81.7%), while renter-occupied units make up 275 (18.3%).
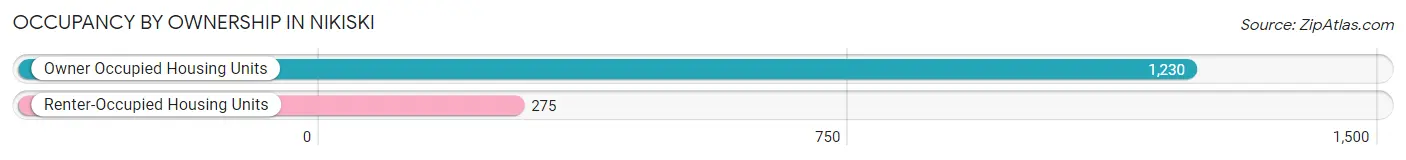
| Occupancy | # Housing Units | % Housing Units |
| Owner Occupied Housing Units | 1,230 | 81.7% |
| Renter-Occupied Housing Units | 275 | 18.3% |
| Total Occupied Housing Units | 1,505 | 100.0% |
Occupancy by Household Size in Nikiski
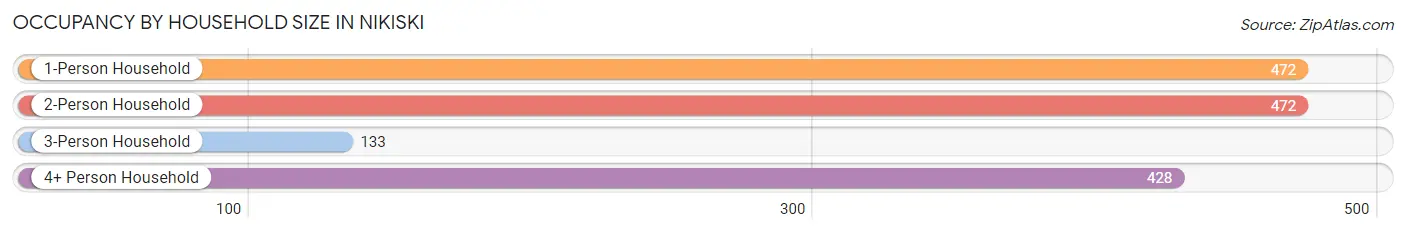
| Household Size | # Housing Units | % Housing Units |
| 1-Person Household | 472 | 31.4% |
| 2-Person Household | 472 | 31.4% |
| 3-Person Household | 133 | 8.8% |
| 4+ Person Household | 428 | 28.4% |
| Total Housing Units | 1,505 | 100.0% |
Occupancy by Ownership by Household Size in Nikiski
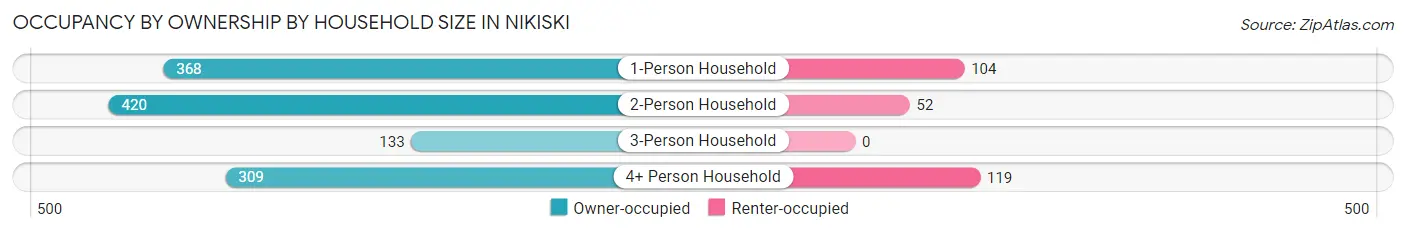
| Household Size | Owner-occupied | Renter-occupied |
| 1-Person Household | 368 (78.0%) | 104 (22.0%) |
| 2-Person Household | 420 (89.0%) | 52 (11.0%) |
| 3-Person Household | 133 (100.0%) | 0 (0.0%) |
| 4+ Person Household | 309 (72.2%) | 119 (27.8%) |
| Total Housing Units | 1,230 (81.7%) | 275 (18.3%) |
Occupancy by Educational Attainment in Nikiski
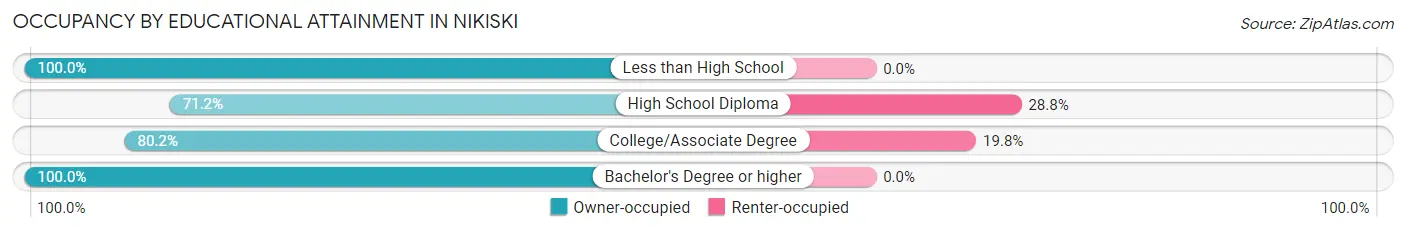
| Household Size | Owner-occupied | Renter-occupied |
| Less than High School | 95 (100.0%) | 0 (0.0%) |
| High School Diploma | 299 (71.2%) | 121 (28.8%) |
| College/Associate Degree | 623 (80.2%) | 154 (19.8%) |
| Bachelor's Degree or higher | 213 (100.0%) | 0 (0.0%) |
Occupancy by Age of Householder in Nikiski
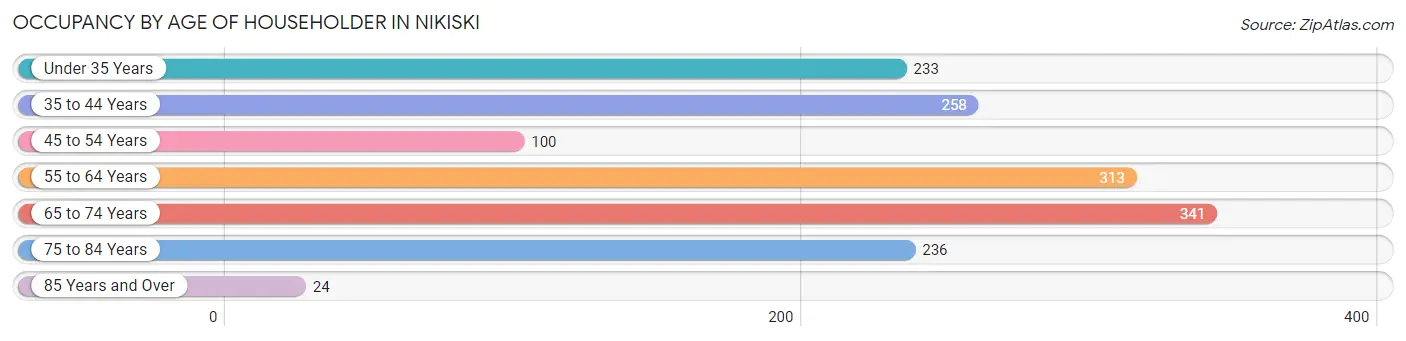
| Age Bracket | # Households | % Households |
| Under 35 Years | 233 | 15.5% |
| 35 to 44 Years | 258 | 17.1% |
| 45 to 54 Years | 100 | 6.6% |
| 55 to 64 Years | 313 | 20.8% |
| 65 to 74 Years | 341 | 22.7% |
| 75 to 84 Years | 236 | 15.7% |
| 85 Years and Over | 24 | 1.6% |
| Total | 1,505 | 100.0% |
Housing Finances in Nikiski
Median Income by Occupancy in Nikiski
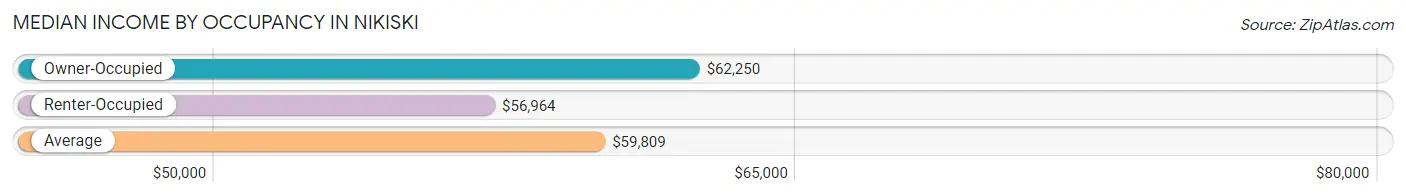
| Occupancy Type | # Households | Median Income |
| Owner-Occupied | 1,230 (81.7%) | $62,250 |
| Renter-Occupied | 275 (18.3%) | $56,964 |
| Average | 1,505 (100.0%) | $59,809 |
Occupancy by Householder Income Bracket in Nikiski
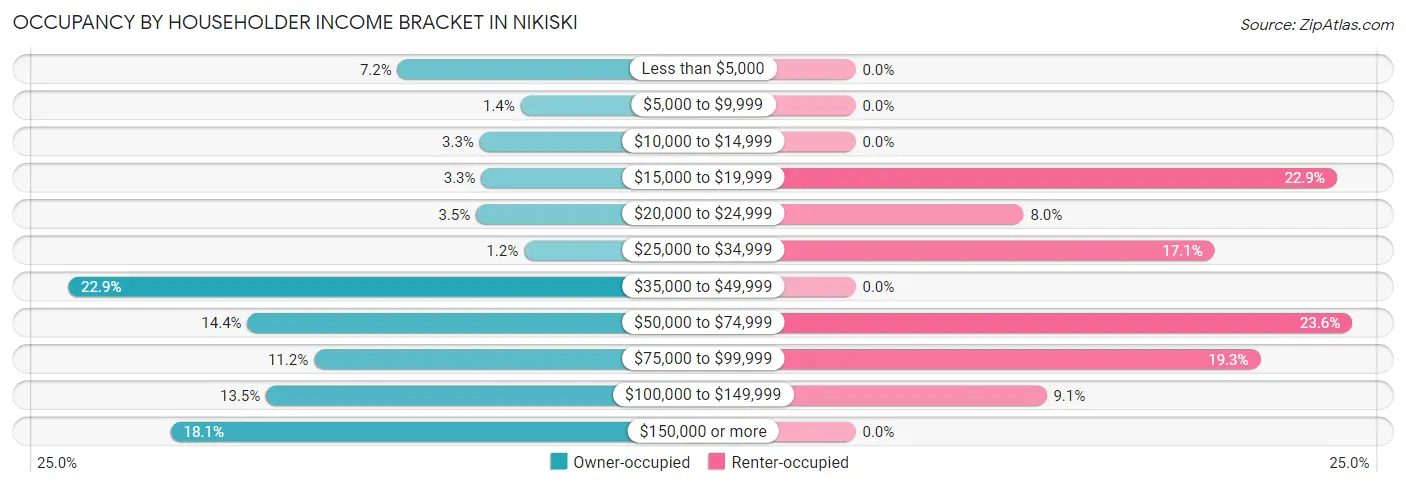
| Income Bracket | Owner-occupied | Renter-occupied |
| Less than $5,000 | 89 (7.2%) | 0 (0.0%) |
| $5,000 to $9,999 | 17 (1.4%) | 0 (0.0%) |
| $10,000 to $14,999 | 41 (3.3%) | 0 (0.0%) |
| $15,000 to $19,999 | 40 (3.3%) | 63 (22.9%) |
| $20,000 to $24,999 | 43 (3.5%) | 22 (8.0%) |
| $25,000 to $34,999 | 15 (1.2%) | 47 (17.1%) |
| $35,000 to $49,999 | 282 (22.9%) | 0 (0.0%) |
| $50,000 to $74,999 | 177 (14.4%) | 65 (23.6%) |
| $75,000 to $99,999 | 138 (11.2%) | 53 (19.3%) |
| $100,000 to $149,999 | 166 (13.5%) | 25 (9.1%) |
| $150,000 or more | 222 (18.0%) | 0 (0.0%) |
| Total | 1,230 (100.0%) | 275 (100.0%) |
Monthly Housing Cost Tiers in Nikiski
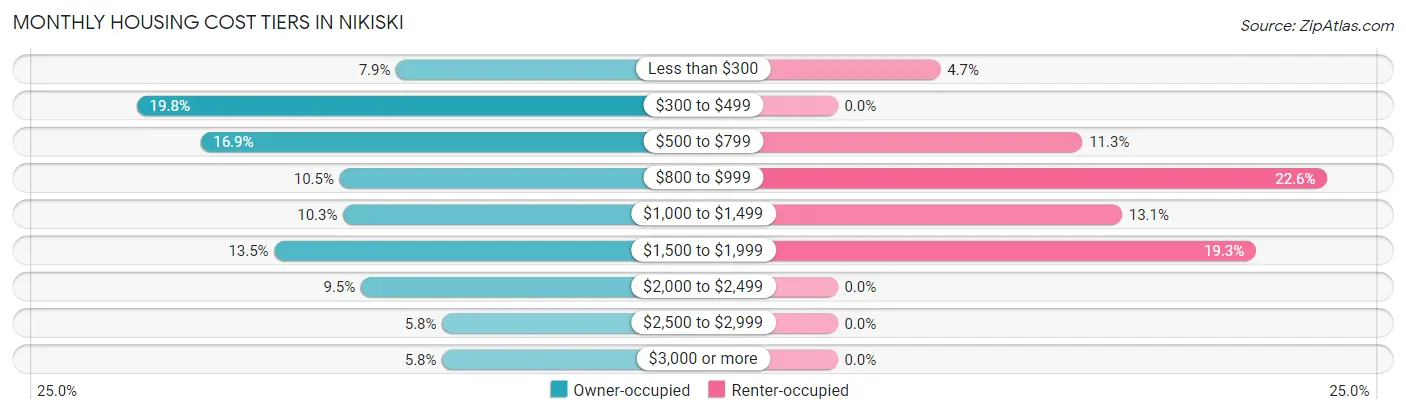
| Monthly Cost | Owner-occupied | Renter-occupied |
| Less than $300 | 97 (7.9%) | 13 (4.7%) |
| $300 to $499 | 244 (19.8%) | 0 (0.0%) |
| $500 to $799 | 208 (16.9%) | 31 (11.3%) |
| $800 to $999 | 129 (10.5%) | 62 (22.6%) |
| $1,000 to $1,499 | 127 (10.3%) | 36 (13.1%) |
| $1,500 to $1,999 | 166 (13.5%) | 53 (19.3%) |
| $2,000 to $2,499 | 117 (9.5%) | 0 (0.0%) |
| $2,500 to $2,999 | 71 (5.8%) | 0 (0.0%) |
| $3,000 or more | 71 (5.8%) | 0 (0.0%) |
| Total | 1,230 (100.0%) | 275 (100.0%) |
Physical Housing Characteristics in Nikiski
Housing Structures in Nikiski
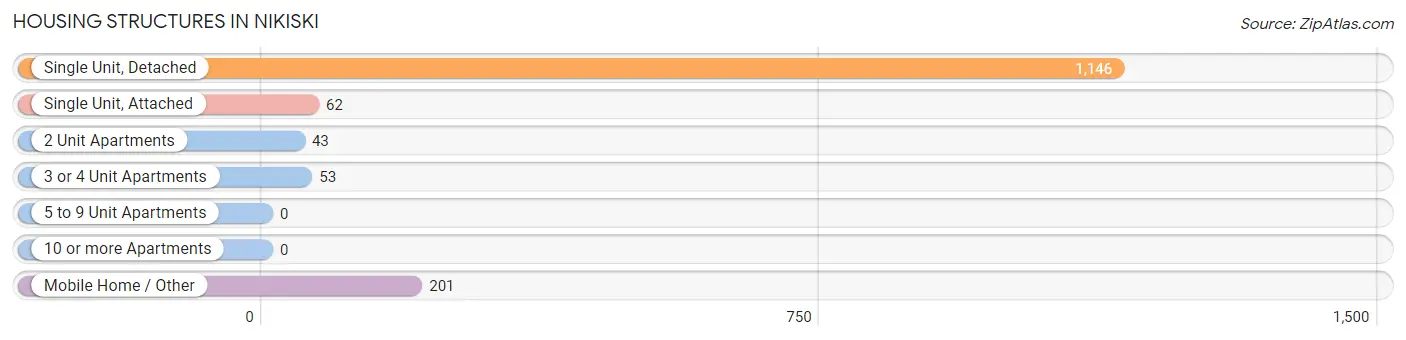
| Structure Type | # Housing Units | % Housing Units |
| Single Unit, Detached | 1,146 | 76.1% |
| Single Unit, Attached | 62 | 4.1% |
| 2 Unit Apartments | 43 | 2.9% |
| 3 or 4 Unit Apartments | 53 | 3.5% |
| 5 to 9 Unit Apartments | 0 | 0.0% |
| 10 or more Apartments | 0 | 0.0% |
| Mobile Home / Other | 201 | 13.4% |
| Total | 1,505 | 100.0% |
Housing Structures by Occupancy in Nikiski
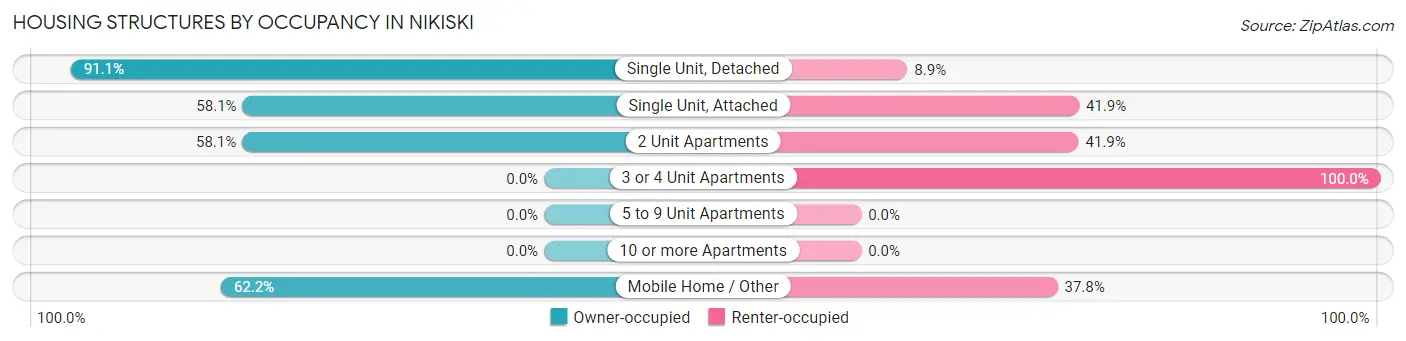
| Structure Type | Owner-occupied | Renter-occupied |
| Single Unit, Detached | 1,044 (91.1%) | 102 (8.9%) |
| Single Unit, Attached | 36 (58.1%) | 26 (41.9%) |
| 2 Unit Apartments | 25 (58.1%) | 18 (41.9%) |
| 3 or 4 Unit Apartments | 0 (0.0%) | 53 (100.0%) |
| 5 to 9 Unit Apartments | 0 (0.0%) | 0 (0.0%) |
| 10 or more Apartments | 0 (0.0%) | 0 (0.0%) |
| Mobile Home / Other | 125 (62.2%) | 76 (37.8%) |
| Total | 1,230 (81.7%) | 275 (18.3%) |
Housing Structures by Number of Rooms in Nikiski
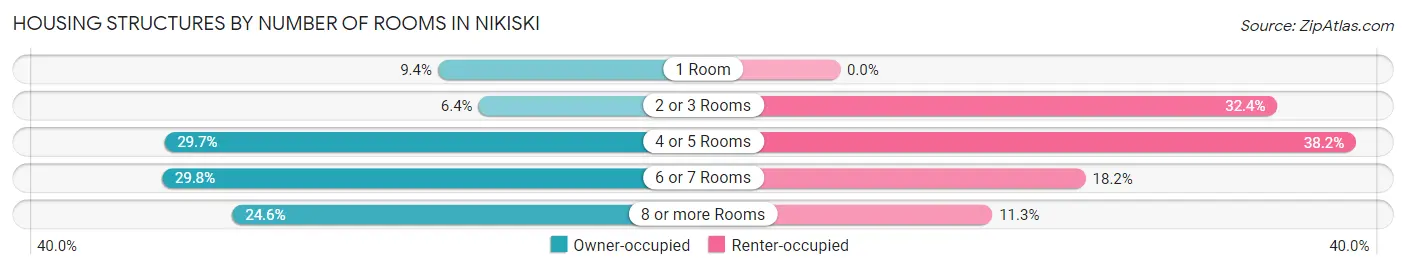
| Number of Rooms | Owner-occupied | Renter-occupied |
| 1 Room | 116 (9.4%) | 0 (0.0%) |
| 2 or 3 Rooms | 79 (6.4%) | 89 (32.4%) |
| 4 or 5 Rooms | 365 (29.7%) | 105 (38.2%) |
| 6 or 7 Rooms | 367 (29.8%) | 50 (18.2%) |
| 8 or more Rooms | 303 (24.6%) | 31 (11.3%) |
| Total | 1,230 (100.0%) | 275 (100.0%) |
Housing Structure by Heating Type in Nikiski
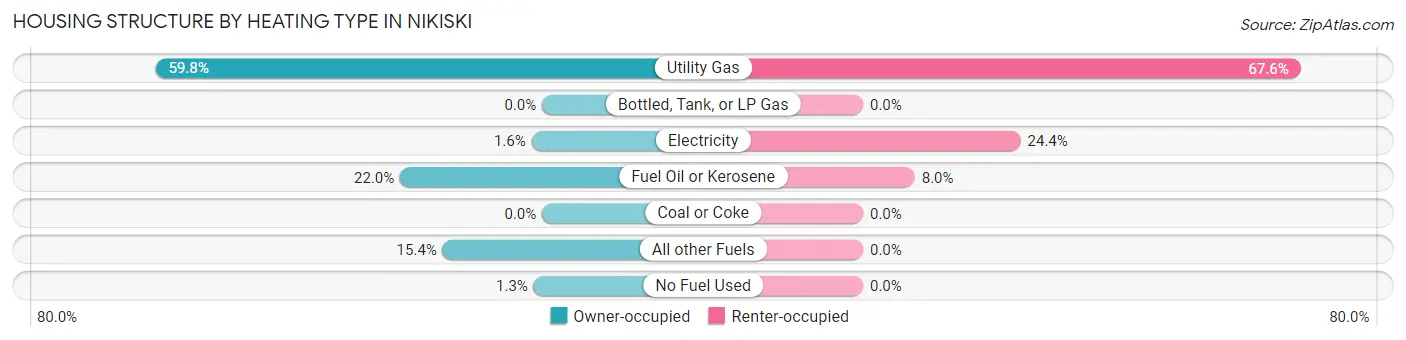
| Heating Type | Owner-occupied | Renter-occupied |
| Utility Gas | 735 (59.8%) | 186 (67.6%) |
| Bottled, Tank, or LP Gas | 0 (0.0%) | 0 (0.0%) |
| Electricity | 20 (1.6%) | 67 (24.4%) |
| Fuel Oil or Kerosene | 270 (22.0%) | 22 (8.0%) |
| Coal or Coke | 0 (0.0%) | 0 (0.0%) |
| All other Fuels | 189 (15.4%) | 0 (0.0%) |
| No Fuel Used | 16 (1.3%) | 0 (0.0%) |
| Total | 1,230 (100.0%) | 275 (100.0%) |
Household Vehicle Usage in Nikiski
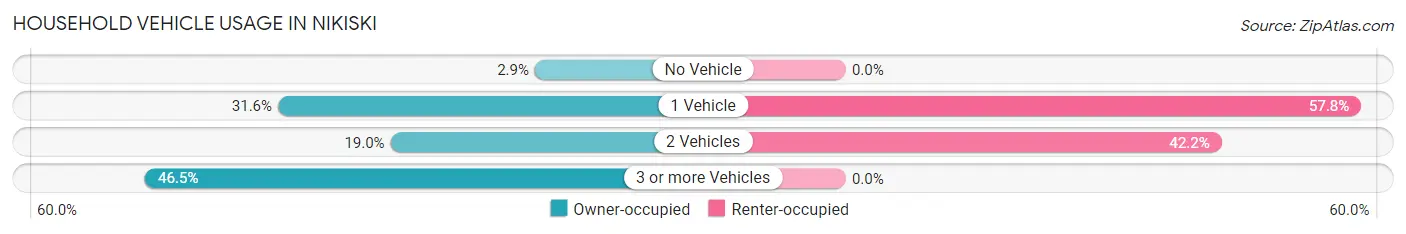
| Vehicles per Household | Owner-occupied | Renter-occupied |
| No Vehicle | 35 (2.9%) | 0 (0.0%) |
| 1 Vehicle | 389 (31.6%) | 159 (57.8%) |
| 2 Vehicles | 234 (19.0%) | 116 (42.2%) |
| 3 or more Vehicles | 572 (46.5%) | 0 (0.0%) |
| Total | 1,230 (100.0%) | 275 (100.0%) |
Real Estate & Mortgages in Nikiski
Real Estate and Mortgage Overview in Nikiski
| Characteristic | Without Mortgage | With Mortgage |
| Housing Units | 654 | 576 |
| Median Property Value | $311,300 | $277,200 |
| Median Household Income | $58,182 | $150 |
| Monthly Housing Costs | $503 | $71 |
| Real Estate Taxes | $1,993 | $118 |
Property Value by Mortgage Status in Nikiski
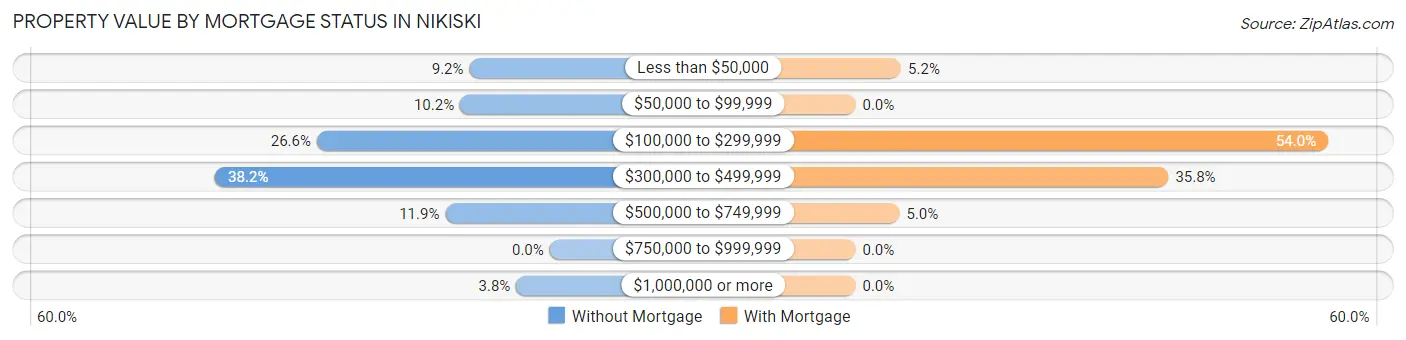
| Property Value | Without Mortgage | With Mortgage |
| Less than $50,000 | 60 (9.2%) | 30 (5.2%) |
| $50,000 to $99,999 | 67 (10.2%) | 0 (0.0%) |
| $100,000 to $299,999 | 174 (26.6%) | 311 (54.0%) |
| $300,000 to $499,999 | 250 (38.2%) | 206 (35.8%) |
| $500,000 to $749,999 | 78 (11.9%) | 29 (5.0%) |
| $750,000 to $999,999 | 0 (0.0%) | 0 (0.0%) |
| $1,000,000 or more | 25 (3.8%) | 0 (0.0%) |
| Total | 654 (100.0%) | 576 (100.0%) |
Household Income by Mortgage Status in Nikiski
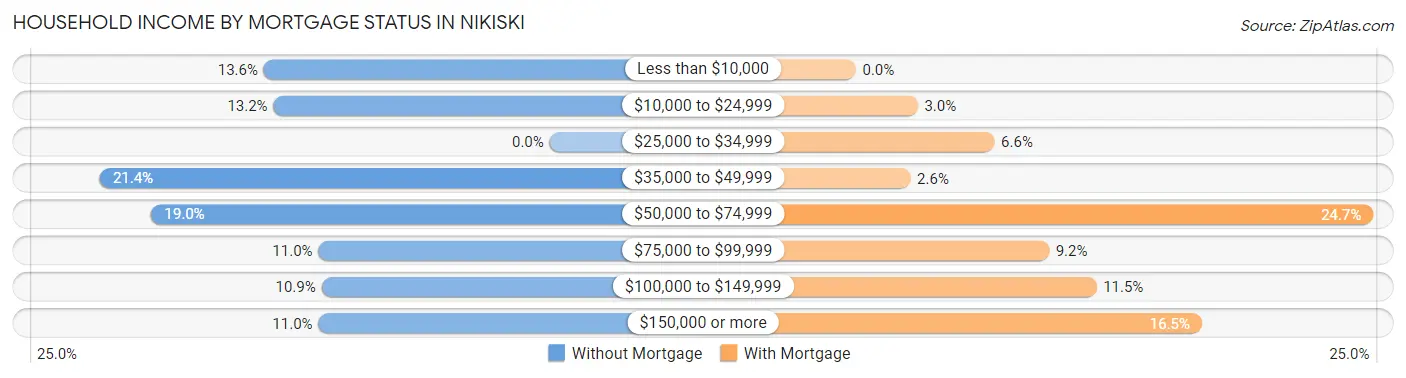
| Household Income | Without Mortgage | With Mortgage |
| Less than $10,000 | 89 (13.6%) | 0 (0.0%) |
| $10,000 to $24,999 | 86 (13.2%) | 17 (2.9%) |
| $25,000 to $34,999 | 0 (0.0%) | 38 (6.6%) |
| $35,000 to $49,999 | 140 (21.4%) | 15 (2.6%) |
| $50,000 to $74,999 | 124 (19.0%) | 142 (24.6%) |
| $75,000 to $99,999 | 72 (11.0%) | 53 (9.2%) |
| $100,000 to $149,999 | 71 (10.9%) | 66 (11.5%) |
| $150,000 or more | 72 (11.0%) | 95 (16.5%) |
| Total | 654 (100.0%) | 576 (100.0%) |
Property Value to Household Income Ratio in Nikiski
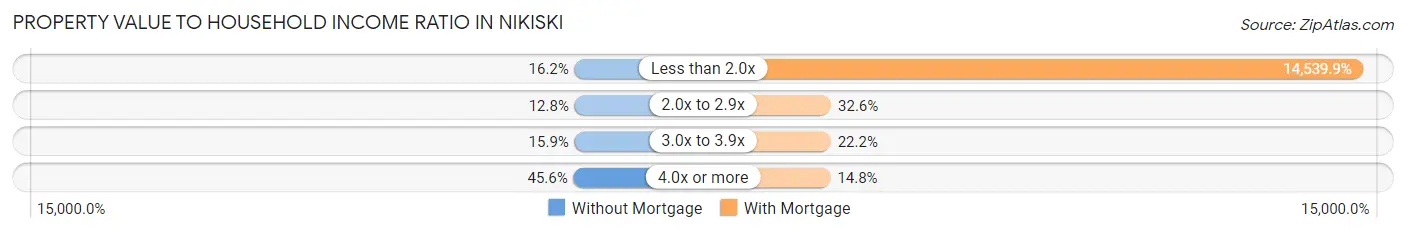
| Value-to-Income Ratio | Without Mortgage | With Mortgage |
| Less than 2.0x | 106 (16.2%) | 83,750 (14,539.9%) |
| 2.0x to 2.9x | 84 (12.8%) | 188 (32.6%) |
| 3.0x to 3.9x | 104 (15.9%) | 128 (22.2%) |
| 4.0x or more | 298 (45.6%) | 85 (14.8%) |
| Total | 654 (100.0%) | 576 (100.0%) |
Real Estate Taxes by Mortgage Status in Nikiski
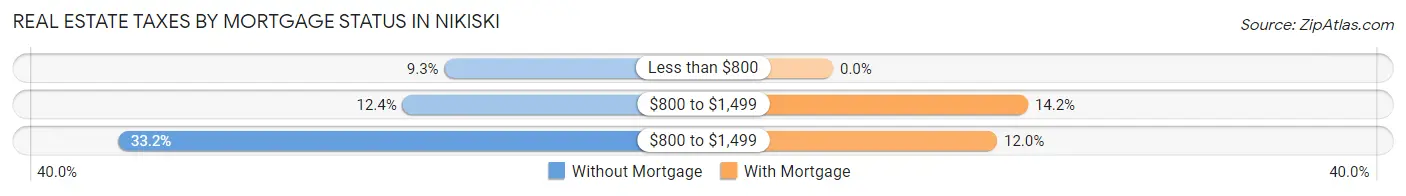
| Property Taxes | Without Mortgage | With Mortgage |
| Less than $800 | 61 (9.3%) | 0 (0.0%) |
| $800 to $1,499 | 81 (12.4%) | 82 (14.2%) |
| $800 to $1,499 | 217 (33.2%) | 69 (12.0%) |
| Total | 654 (100.0%) | 576 (100.0%) |
Health & Disability in Nikiski
Health Insurance Coverage by Age in Nikiski
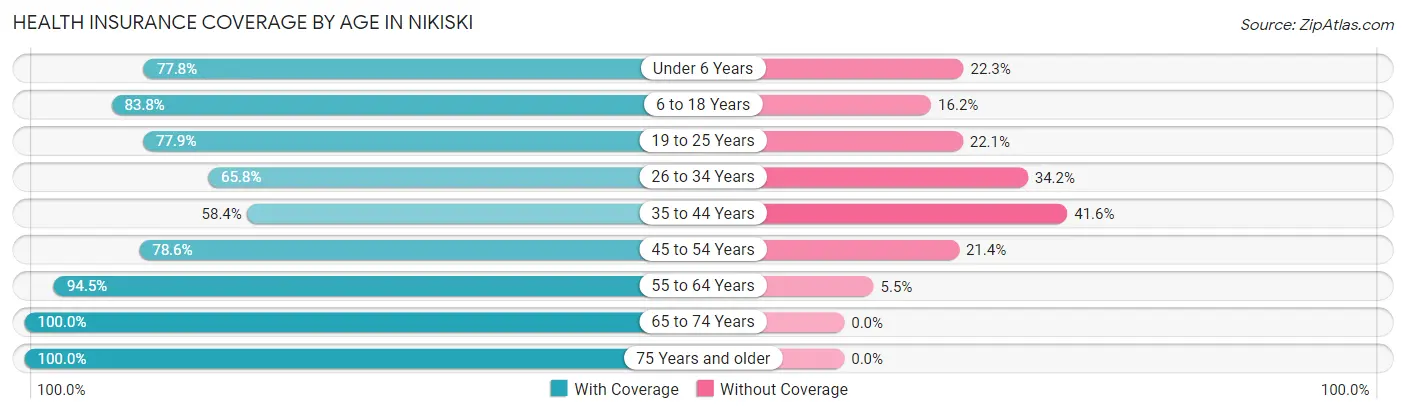
| Age Bracket | With Coverage | Without Coverage |
| Under 6 Years | 367 (77.7%) | 105 (22.3%) |
| 6 to 18 Years | 683 (83.8%) | 132 (16.2%) |
| 19 to 25 Years | 261 (77.9%) | 74 (22.1%) |
| 26 to 34 Years | 373 (65.8%) | 194 (34.2%) |
| 35 to 44 Years | 337 (58.4%) | 240 (41.6%) |
| 45 to 54 Years | 147 (78.6%) | 40 (21.4%) |
| 55 to 64 Years | 484 (94.5%) | 28 (5.5%) |
| 65 to 74 Years | 583 (100.0%) | 0 (0.0%) |
| 75 Years and older | 343 (100.0%) | 0 (0.0%) |
| Total | 3,578 (81.5%) | 813 (18.5%) |
Health Insurance Coverage by Citizenship Status in Nikiski
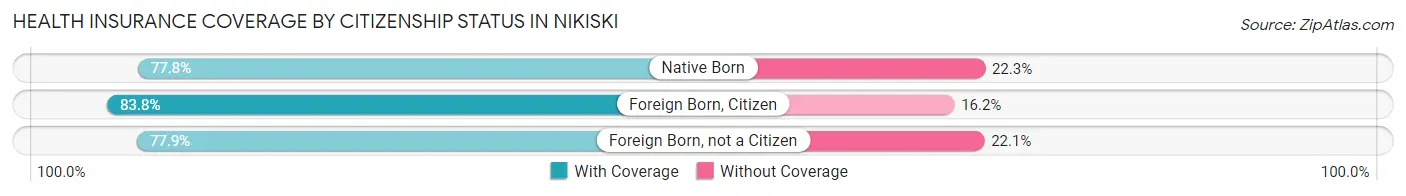
| Citizenship Status | With Coverage | Without Coverage |
| Native Born | 367 (77.7%) | 105 (22.3%) |
| Foreign Born, Citizen | 683 (83.8%) | 132 (16.2%) |
| Foreign Born, not a Citizen | 261 (77.9%) | 74 (22.1%) |
Health Insurance Coverage by Household Income in Nikiski
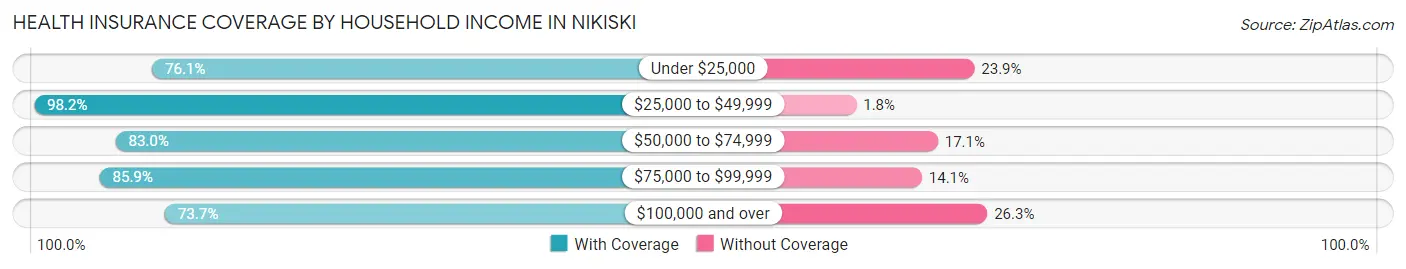
| Household Income | With Coverage | Without Coverage |
| Under $25,000 | 503 (76.1%) | 158 (23.9%) |
| $25,000 to $49,999 | 717 (98.2%) | 13 (1.8%) |
| $50,000 to $74,999 | 540 (83.0%) | 111 (17.1%) |
| $75,000 to $99,999 | 605 (85.9%) | 99 (14.1%) |
| $100,000 and over | 1,207 (73.7%) | 431 (26.3%) |
Public vs Private Health Insurance Coverage by Age in Nikiski
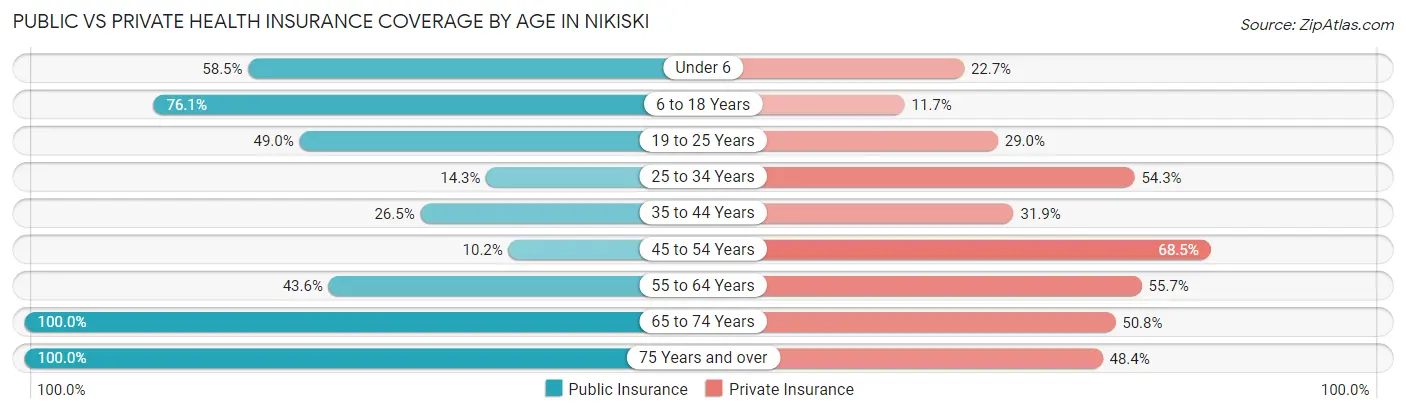
| Age Bracket | Public Insurance | Private Insurance |
| Under 6 | 276 (58.5%) | 107 (22.7%) |
| 6 to 18 Years | 620 (76.1%) | 95 (11.7%) |
| 19 to 25 Years | 164 (49.0%) | 97 (29.0%) |
| 25 to 34 Years | 81 (14.3%) | 308 (54.3%) |
| 35 to 44 Years | 153 (26.5%) | 184 (31.9%) |
| 45 to 54 Years | 19 (10.2%) | 128 (68.4%) |
| 55 to 64 Years | 223 (43.5%) | 285 (55.7%) |
| 65 to 74 Years | 583 (100.0%) | 296 (50.8%) |
| 75 Years and over | 343 (100.0%) | 166 (48.4%) |
| Total | 2,462 (56.1%) | 1,666 (37.9%) |
Disability Status by Sex by Age in Nikiski
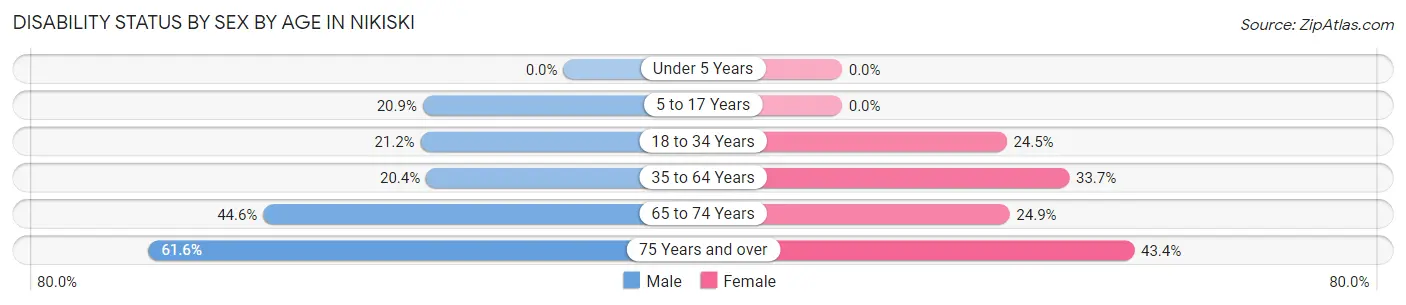
| Age Bracket | Male | Female |
| Under 5 Years | 0 (0.0%) | 0 (0.0%) |
| 5 to 17 Years | 100 (20.9%) | 0 (0.0%) |
| 18 to 34 Years | 111 (21.2%) | 100 (24.4%) |
| 35 to 64 Years | 126 (20.4%) | 222 (33.7%) |
| 65 to 74 Years | 156 (44.6%) | 58 (24.9%) |
| 75 Years and over | 146 (61.6%) | 46 (43.4%) |
Disability Class by Sex by Age in Nikiski
Disability Class: Hearing Difficulty
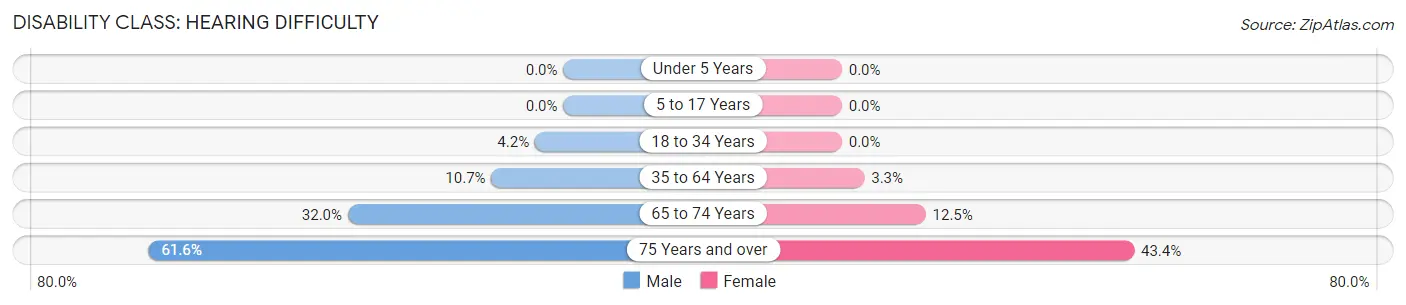
| Age Bracket | Male | Female |
| Under 5 Years | 0 (0.0%) | 0 (0.0%) |
| 5 to 17 Years | 0 (0.0%) | 0 (0.0%) |
| 18 to 34 Years | 22 (4.2%) | 0 (0.0%) |
| 35 to 64 Years | 66 (10.7%) | 22 (3.3%) |
| 65 to 74 Years | 112 (32.0%) | 29 (12.4%) |
| 75 Years and over | 146 (61.6%) | 46 (43.4%) |
Disability Class: Vision Difficulty
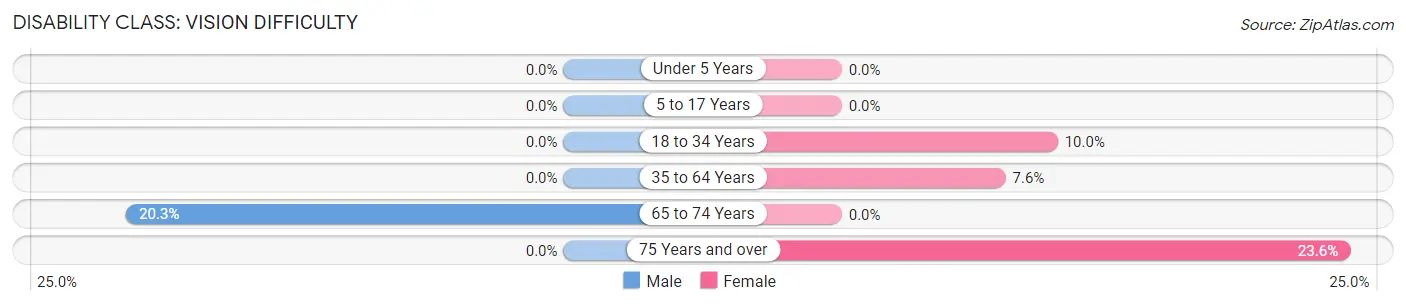
| Age Bracket | Male | Female |
| Under 5 Years | 0 (0.0%) | 0 (0.0%) |
| 5 to 17 Years | 0 (0.0%) | 0 (0.0%) |
| 18 to 34 Years | 0 (0.0%) | 41 (10.0%) |
| 35 to 64 Years | 0 (0.0%) | 50 (7.6%) |
| 65 to 74 Years | 71 (20.3%) | 0 (0.0%) |
| 75 Years and over | 0 (0.0%) | 25 (23.6%) |
Disability Class: Cognitive Difficulty
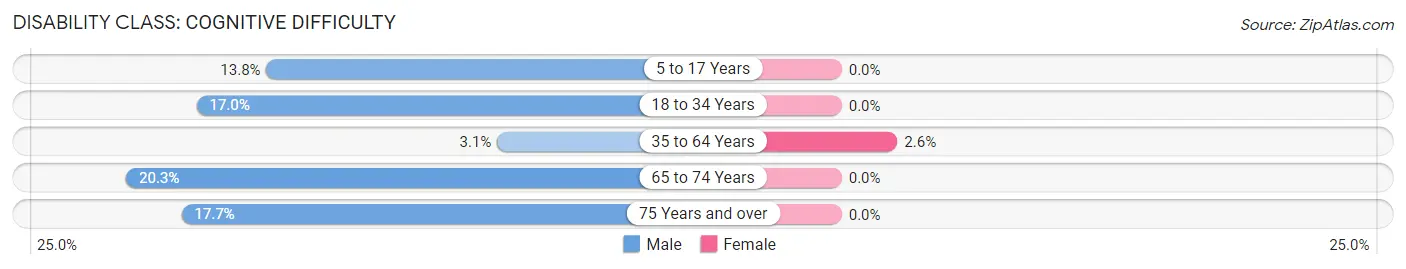
| Age Bracket | Male | Female |
| 5 to 17 Years | 66 (13.8%) | 0 (0.0%) |
| 18 to 34 Years | 89 (17.0%) | 0 (0.0%) |
| 35 to 64 Years | 19 (3.1%) | 17 (2.6%) |
| 65 to 74 Years | 71 (20.3%) | 0 (0.0%) |
| 75 Years and over | 42 (17.7%) | 0 (0.0%) |
Disability Class: Ambulatory Difficulty
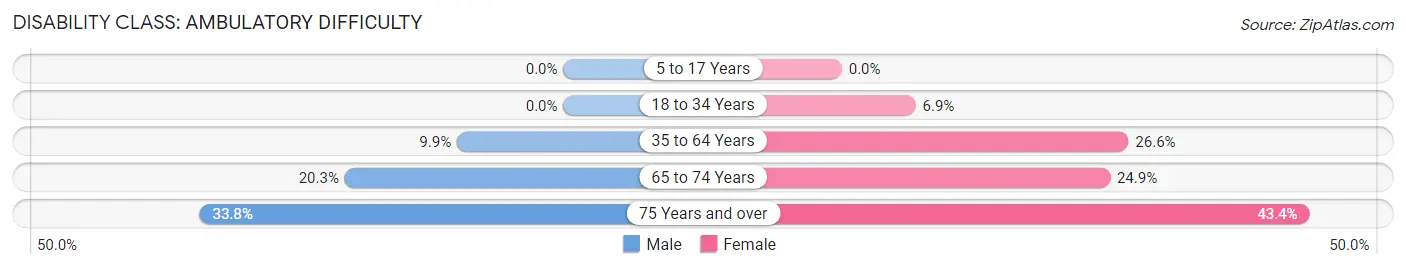
| Age Bracket | Male | Female |
| 5 to 17 Years | 0 (0.0%) | 0 (0.0%) |
| 18 to 34 Years | 0 (0.0%) | 28 (6.9%) |
| 35 to 64 Years | 61 (9.9%) | 175 (26.6%) |
| 65 to 74 Years | 71 (20.3%) | 58 (24.9%) |
| 75 Years and over | 80 (33.8%) | 46 (43.4%) |
Disability Class: Self-Care Difficulty
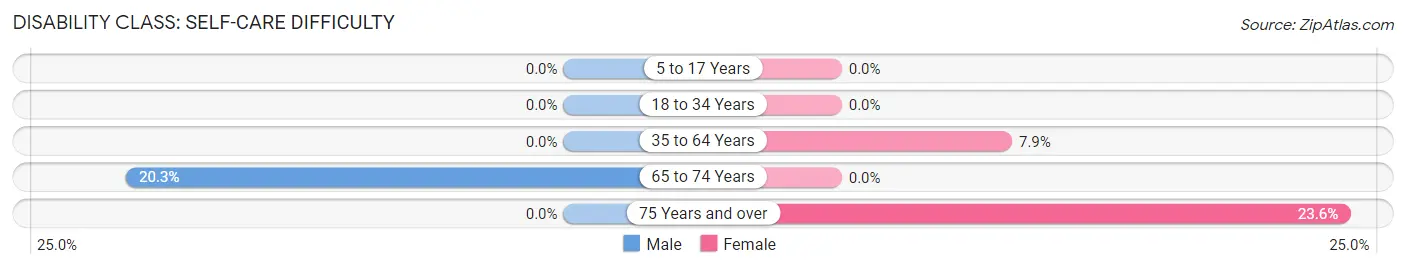
| Age Bracket | Male | Female |
| 5 to 17 Years | 0 (0.0%) | 0 (0.0%) |
| 18 to 34 Years | 0 (0.0%) | 0 (0.0%) |
| 35 to 64 Years | 0 (0.0%) | 52 (7.9%) |
| 65 to 74 Years | 71 (20.3%) | 0 (0.0%) |
| 75 Years and over | 0 (0.0%) | 25 (23.6%) |
Technology Access in Nikiski
Computing Device Access in Nikiski
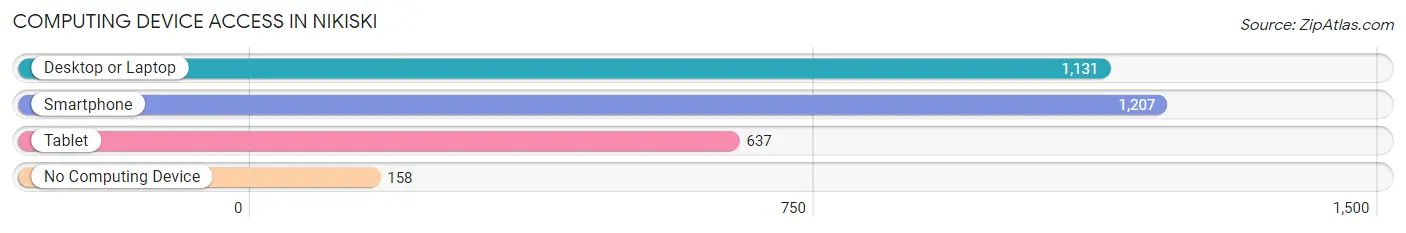
| Device Type | # Households | % Households |
| Desktop or Laptop | 1,131 | 75.1% |
| Smartphone | 1,207 | 80.2% |
| Tablet | 637 | 42.3% |
| No Computing Device | 158 | 10.5% |
| Total | 1,505 | 100.0% |
Internet Access in Nikiski
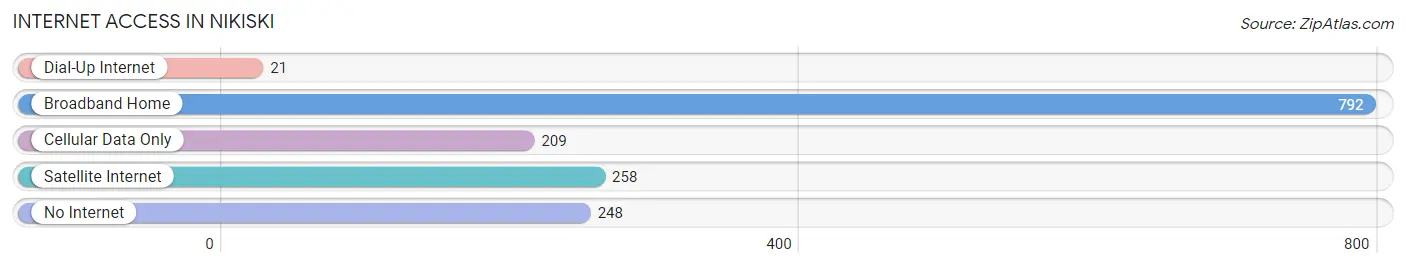
| Internet Type | # Households | % Households |
| Dial-Up Internet | 21 | 1.4% |
| Broadband Home | 792 | 52.6% |
| Cellular Data Only | 209 | 13.9% |
| Satellite Internet | 258 | 17.1% |
| No Internet | 248 | 16.5% |
| Total | 1,505 | 100.0% |
Nikiski Summary
History
Nikiski, Alaska is a small unincorporated community located on the Kenai Peninsula in the southcentral region of the state. It is located about 10 miles north of Kenai and about 20 miles south of Soldotna. The community was established in the early 1950s when the Kenai Pipeline Company built a pipeline from the Kenai oil fields to the port of Nikiski. The pipeline was completed in 1953 and the community was officially incorporated in 1954.
The area was originally inhabited by the Dena’ina Athabascan people, who had lived in the area for thousands of years. The first non-native settlers arrived in the area in the late 1800s, and the community was officially established in the early 1950s.
The community was named after the nearby Nikiski River, which was named after a Dena’ina chief named Nikiski. The name is derived from the Dena’ina word “nikisk”, which means “place of the river”.
Geography
Nikiski is located on the Kenai Peninsula in the southcentral region of Alaska. It is located about 10 miles north of Kenai and about 20 miles south of Soldotna. The community is situated on the western shore of Cook Inlet, and is surrounded by the Kenai Mountains to the east and the Chugach Mountains to the west.
The climate in Nikiski is mild and temperate, with warm summers and cold winters. The average high temperature in the summer is around 70°F, and the average low temperature in the winter is around 10°F. The area receives an average of about 40 inches of precipitation per year, with most of it falling in the form of snow.
Economy
The economy of Nikiski is largely based on the oil and gas industry. The Kenai Pipeline Company operates a pipeline from the Kenai oil fields to the port of Nikiski, and the area is home to several oil and gas production facilities. The community is also home to several seafood processing plants, which process and package fish and other seafood products for export.
In addition to the oil and gas industry, Nikiski is home to several small businesses, including restaurants, retail stores, and other services. The community is also home to several recreational activities, including fishing, hunting, and camping.
Demographics
As of the 2010 census, the population of Nikiski was 2,945. The racial makeup of the community was 95.3% White, 0.7% Native American, 0.3% Asian, 0.2% Pacific Islander, 0.1% Black or African American, and 3.4% from other races. The median household income was $63,750, and the median family income was $71,250.
The population of Nikiski is largely made up of families, with the majority of households consisting of married couples with children. The community is also home to a large number of retirees, as well as a growing number of young professionals. The median age of the population is 37.5 years.
Common Questions
What is Per Capita Income in Nikiski?
Per Capita income in Nikiski is $27,708.
What is the Median Family Income in Nikiski?
Median Family Income in Nikiski is $89,539.
What is the Median Household income in Nikiski?
Median Household Income in Nikiski is $59,809.
What is Income or Wage Gap in Nikiski?
Income or Wage Gap in Nikiski is 15.8%.
Women in Nikiski earn 84.2 cents for every dollar earned by a man.
What is Inequality or Gini Index in Nikiski?
Inequality or Gini Index in Nikiski is 0.44.
What is the Total Population of Nikiski?
Total Population of Nikiski is 4,405.
What is the Total Male Population of Nikiski?
Total Male Population of Nikiski is 2,355.
What is the Total Female Population of Nikiski?
Total Female Population of Nikiski is 2,050.
What is the Ratio of Males per 100 Females in Nikiski?
There are 114.88 Males per 100 Females in Nikiski.
What is the Ratio of Females per 100 Males in Nikiski?
There are 87.05 Females per 100 Males in Nikiski.
What is the Median Population Age in Nikiski?
Median Population Age in Nikiski is 35.2 Years.
What is the Average Family Size in Nikiski
Average Family Size in Nikiski is 3.7 People.
What is the Average Household Size in Nikiski
Average Household Size in Nikiski is 2.9 People.
How Large is the Labor Force in Nikiski?
There are 1,534 People in the Labor Forcein in Nikiski.
What is the Percentage of People in the Labor Force in Nikiski?
46.9% of People are in the Labor Force in Nikiski.
What is the Unemployment Rate in Nikiski?
Unemployment Rate in Nikiski is 4.8%.