Homer, AK Map & Demographics
Homer Map
Homer Overview
$42,604
PER CAPITA INCOME
$96,923
AVG FAMILY INCOME
$69,757
AVG HOUSEHOLD INCOME
34.8%
WAGE / INCOME GAP [ % ]
65.2¢/ $1
WAGE / INCOME GAP [ $ ]
$10,978
FAMILY INCOME DEFICIT
0.45
INEQUALITY / GINI INDEX
5,623
TOTAL POPULATION
2,880
MALE POPULATION
2,743
FEMALE POPULATION
104.99
MALES / 100 FEMALES
95.24
FEMALES / 100 MALES
40.8
MEDIAN AGE
3.0
AVG FAMILY SIZE
2.3
AVG HOUSEHOLD SIZE
2,854
LABOR FORCE [ PEOPLE ]
61.1%
PERCENT IN LABOR FORCE
9.0%
UNEMPLOYMENT RATE
Homer Zip Codes
Homer Area Codes
Income in Homer
Income Overview in Homer
Per Capita Income in Homer is $42,604, while median incomes of families and households are $96,923 and $69,757 respectively.
| Characteristic | Number | Measure |
| Per Capita Income | 5,623 | $42,604 |
| Median Family Income | 1,330 | $96,923 |
| Mean Family Income | 1,330 | $117,229 |
| Median Household Income | 2,352 | $69,757 |
| Mean Household Income | 2,352 | $96,879 |
| Income Deficit | 1,330 | $10,978 |
| Wage / Income Gap (%) | 5,623 | 34.76% |
| Wage / Income Gap ($) | 5,623 | 65.24¢ per $1 |
| Gini / Inequality Index | 5,623 | 0.45 |
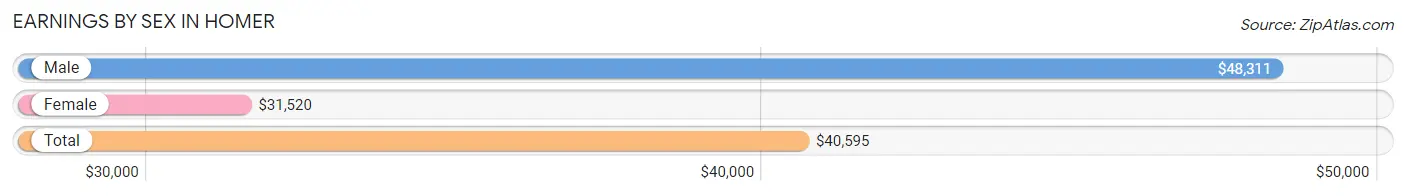
Earnings by Sex in Homer
Average Earnings in Homer are $40,595, $48,311 for men and $31,520 for women, a difference of 34.8%.
| Sex | Number | Average Earnings |
| Male | 1,740 (55.5%) | $48,311 |
| Female | 1,393 (44.5%) | $31,520 |
| Total | 3,133 (100.0%) | $40,595 |
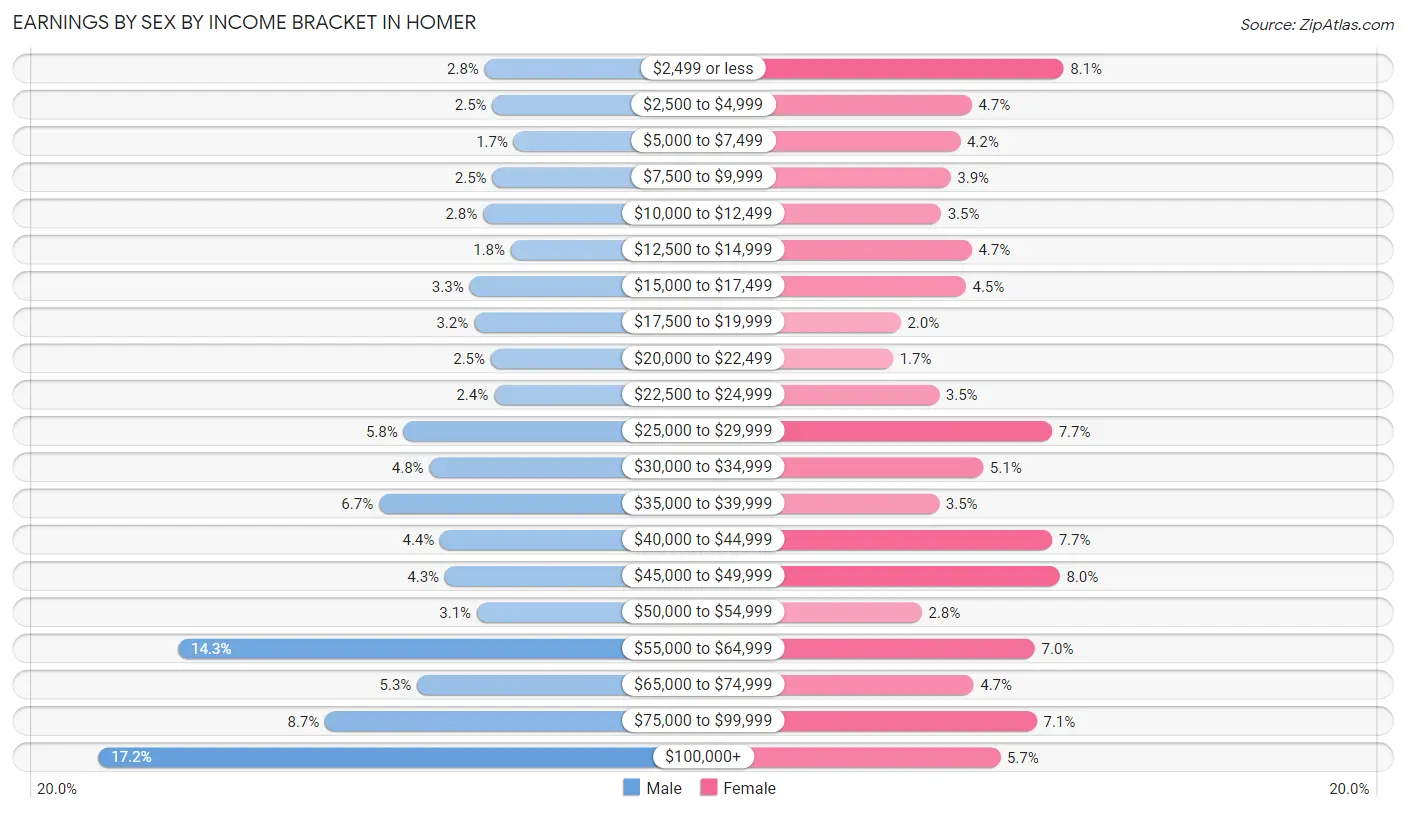
Earnings by Sex by Income Bracket in Homer
The most common earnings brackets in Homer are $100,000+ for men (300 | 17.2%) and $2,499 or less for women (113 | 8.1%).
| Income | Male | Female |
| $2,499 or less | 48 (2.8%) | 113 (8.1%) |
| $2,500 to $4,999 | 43 (2.5%) | 65 (4.7%) |
| $5,000 to $7,499 | 29 (1.7%) | 59 (4.2%) |
| $7,500 to $9,999 | 43 (2.5%) | 54 (3.9%) |
| $10,000 to $12,499 | 49 (2.8%) | 49 (3.5%) |
| $12,500 to $14,999 | 31 (1.8%) | 65 (4.7%) |
| $15,000 to $17,499 | 58 (3.3%) | 62 (4.4%) |
| $17,500 to $19,999 | 55 (3.2%) | 28 (2.0%) |
| $20,000 to $22,499 | 44 (2.5%) | 24 (1.7%) |
| $22,500 to $24,999 | 42 (2.4%) | 48 (3.5%) |
| $25,000 to $29,999 | 101 (5.8%) | 107 (7.7%) |
| $30,000 to $34,999 | 84 (4.8%) | 71 (5.1%) |
| $35,000 to $39,999 | 117 (6.7%) | 48 (3.5%) |
| $40,000 to $44,999 | 77 (4.4%) | 107 (7.7%) |
| $45,000 to $49,999 | 74 (4.3%) | 111 (8.0%) |
| $50,000 to $54,999 | 53 (3.0%) | 39 (2.8%) |
| $55,000 to $64,999 | 248 (14.2%) | 98 (7.0%) |
| $65,000 to $74,999 | 92 (5.3%) | 66 (4.7%) |
| $75,000 to $99,999 | 152 (8.7%) | 99 (7.1%) |
| $100,000+ | 300 (17.2%) | 80 (5.7%) |
| Total | 1,740 (100.0%) | 1,393 (100.0%) |
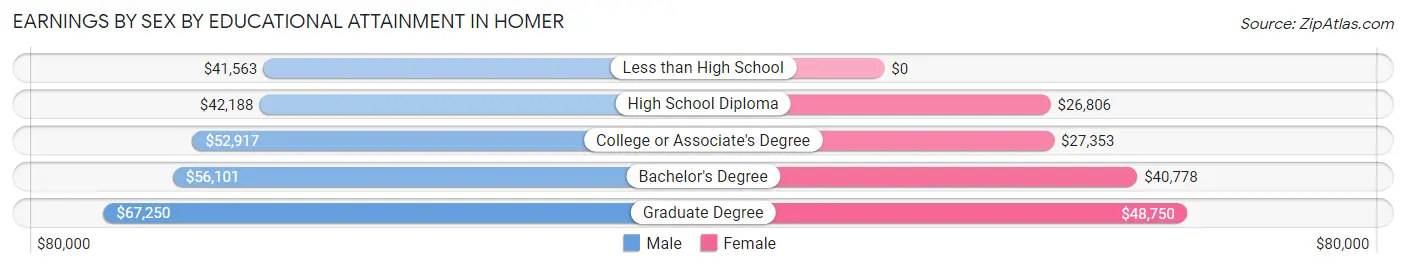
Earnings by Sex by Educational Attainment in Homer
Average earnings in Homer are $55,586 for men and $35,042 for women, a difference of 37.0%. Men with an educational attainment of graduate degree enjoy the highest average annual earnings of $67,250, while those with less than high school education earn the least with $41,563. Women with an educational attainment of graduate degree earn the most with the average annual earnings of $48,750, while those with high school diploma education have the smallest earnings of $26,806.
| Educational Attainment | Male Income | Female Income |
| Less than High School | $41,563 | $0 |
| High School Diploma | $42,188 | $26,806 |
| College or Associate's Degree | $52,917 | $27,353 |
| Bachelor's Degree | $56,101 | $40,778 |
| Graduate Degree | $67,250 | $48,750 |
| Total | $55,586 | $35,042 |
Family Income in Homer
Family Income Brackets in Homer
According to the Homer family income data, there are 340 families falling into the $100,000 to $149,999 income range, which is the most common income bracket and makes up 25.6% of all families. Conversely, the $10,000 to $14,999 income bracket is the least frequent group with only 15 families (1.1%) belonging to this category.
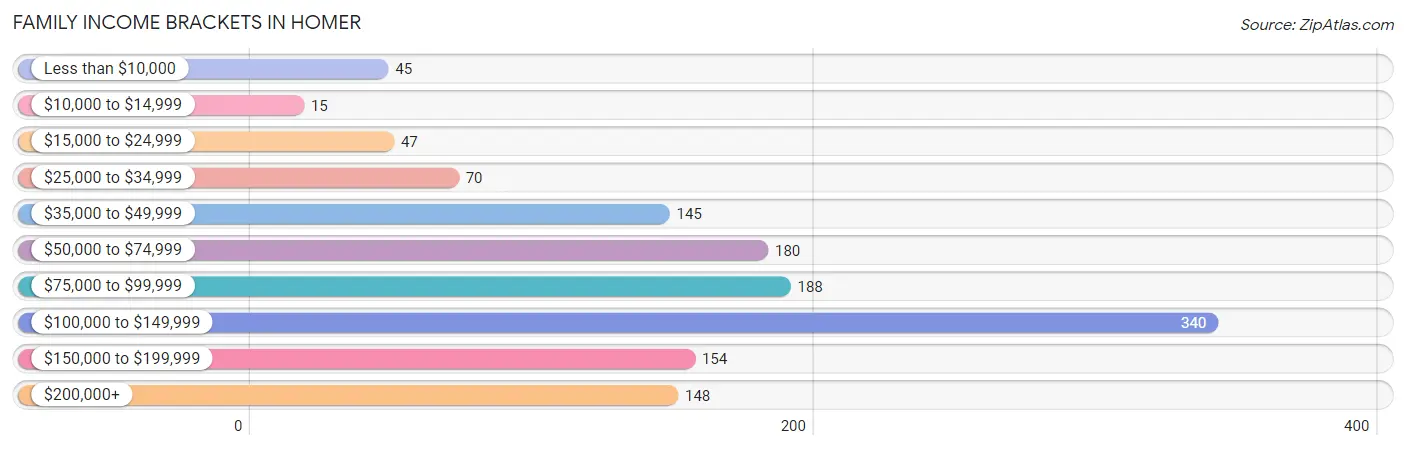
| Income Bracket | # Families | % Families |
| Less than $10,000 | 45 | 3.4% |
| $10,000 to $14,999 | 15 | 1.1% |
| $15,000 to $24,999 | 47 | 3.5% |
| $25,000 to $34,999 | 70 | 5.3% |
| $35,000 to $49,999 | 145 | 10.9% |
| $50,000 to $74,999 | 180 | 13.5% |
| $75,000 to $99,999 | 188 | 14.1% |
| $100,000 to $149,999 | 340 | 25.6% |
| $150,000 to $199,999 | 154 | 11.6% |
| $200,000+ | 148 | 11.1% |
Family Income by Famaliy Size in Homer
4-person families (136 | 10.2%) account for the highest median family income in Homer with $118,750 per family, while 2-person families (853 | 64.1%) have the highest median income of $46,386 per family member.
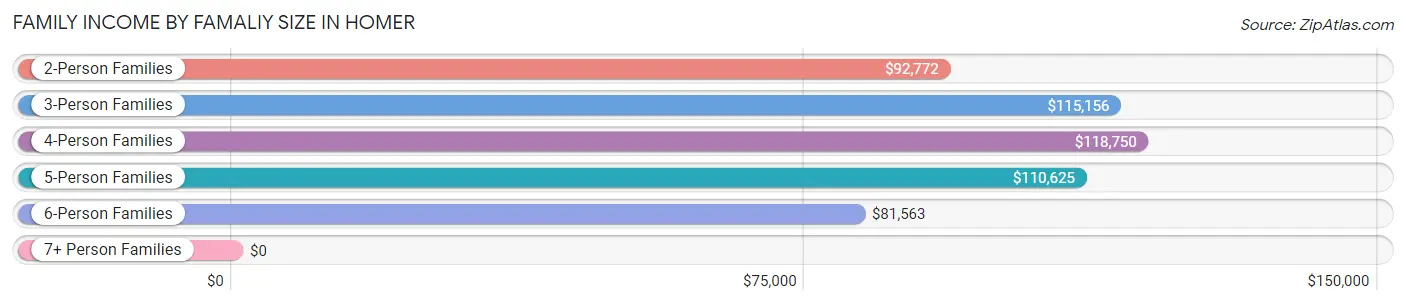
| Income Bracket | # Families | Median Income |
| 2-Person Families | 853 (64.1%) | $92,772 |
| 3-Person Families | 227 (17.1%) | $115,156 |
| 4-Person Families | 136 (10.2%) | $118,750 |
| 5-Person Families | 74 (5.6%) | $110,625 |
| 6-Person Families | 37 (2.8%) | $81,563 |
| 7+ Person Families | 3 (0.2%) | $0 |
| Total | 1,330 (100.0%) | $96,923 |
Family Income by Number of Earners in Homer
The median family income in Homer is $96,923, with families comprising 3+ earners (110) having the highest median family income of $129,500, while families with 1 earner (434) have the lowest median family income of $66,500, accounting for 8.3% and 32.6% of families, respectively.
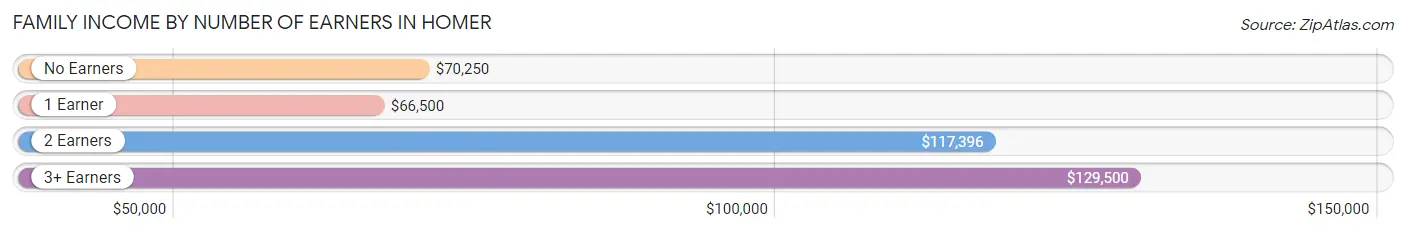
| Number of Earners | # Families | Median Income |
| No Earners | 283 (21.3%) | $70,250 |
| 1 Earner | 434 (32.6%) | $66,500 |
| 2 Earners | 503 (37.8%) | $117,396 |
| 3+ Earners | 110 (8.3%) | $129,500 |
| Total | 1,330 (100.0%) | $96,923 |
Household Income in Homer
Household Income Brackets in Homer
With 546 households falling in the category, the $50,000 to $74,999 income range is the most frequent in Homer, accounting for 23.2% of all households. In contrast, only 73 households (3.1%) fall into the $10,000 to $14,999 income bracket, making it the least populous group.
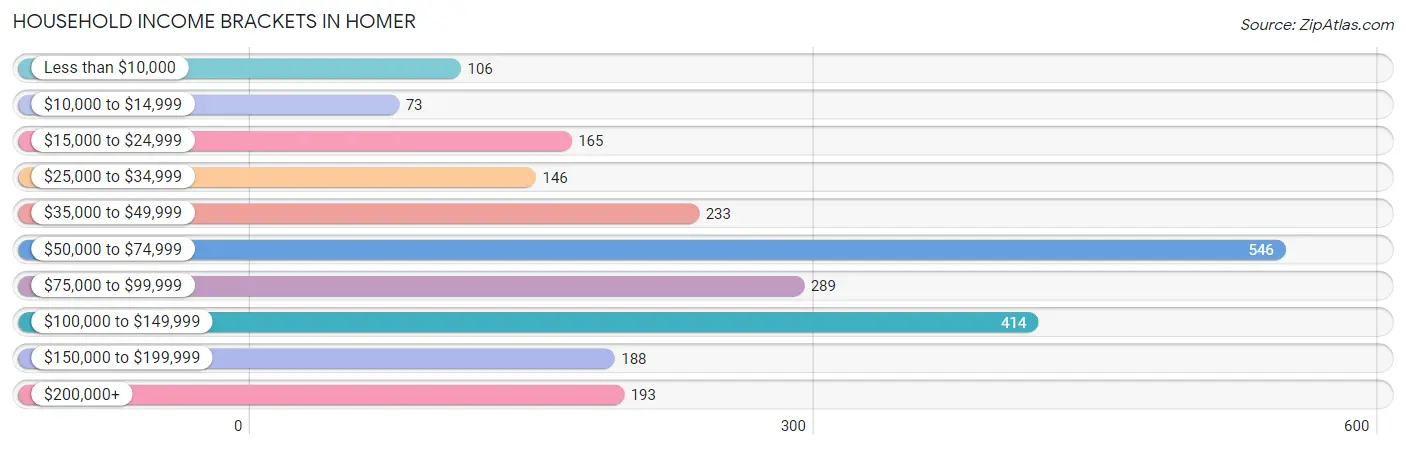
| Income Bracket | # Households | % Households |
| Less than $10,000 | 106 | 4.5% |
| $10,000 to $14,999 | 73 | 3.1% |
| $15,000 to $24,999 | 165 | 7.0% |
| $25,000 to $34,999 | 146 | 6.2% |
| $35,000 to $49,999 | 233 | 9.9% |
| $50,000 to $74,999 | 546 | 23.2% |
| $75,000 to $99,999 | 289 | 12.3% |
| $100,000 to $149,999 | 414 | 17.6% |
| $150,000 to $199,999 | 188 | 8.0% |
| $200,000+ | 193 | 8.2% |
Household Income by Householder Age in Homer
The median household income in Homer is $69,757, with the highest median household income of $80,804 found in the 45 to 64 years age bracket for the primary householder. A total of 801 households (34.1%) fall into this category. Meanwhile, the 15 to 24 years age bracket for the primary householder has the lowest median household income of $56,250, with 84 households (3.6%) in this group.
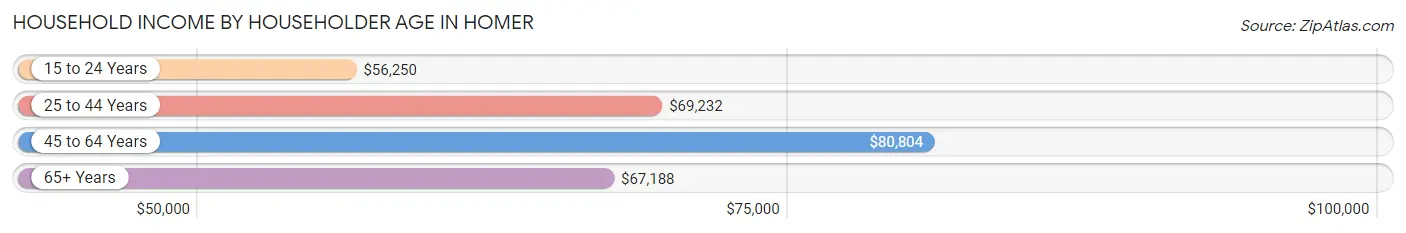
| Income Bracket | # Households | Median Income |
| 15 to 24 Years | 84 (3.6%) | $56,250 |
| 25 to 44 Years | 705 (30.0%) | $69,232 |
| 45 to 64 Years | 801 (34.1%) | $80,804 |
| 65+ Years | 762 (32.4%) | $67,188 |
| Total | 2,352 (100.0%) | $69,757 |
Poverty in Homer
Income Below Poverty by Sex and Age in Homer
With 10.8% poverty level for males and 14.7% for females among the residents of Homer, under 5 year old males and 15 year old females are the most vulnerable to poverty, with 60 males (48.8%) and 18 females (37.5%) in their respective age groups living below the poverty level.
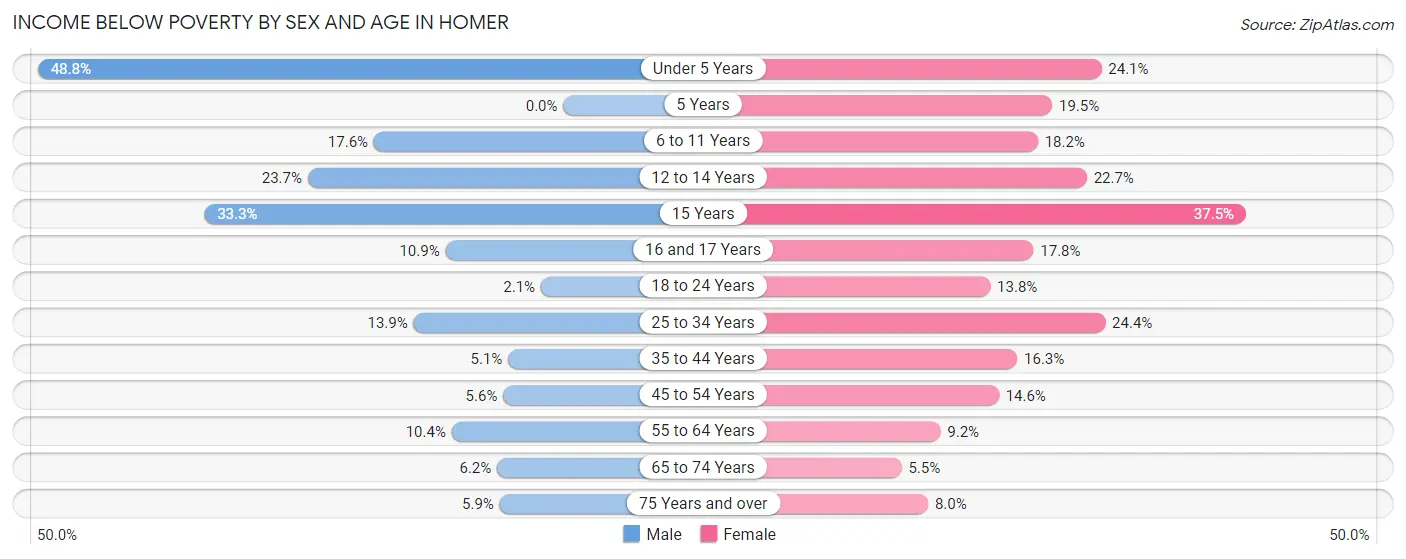
| Age Bracket | Male | Female |
| Under 5 Years | 60 (48.8%) | 33 (24.1%) |
| 5 Years | 0 (0.0%) | 8 (19.5%) |
| 6 to 11 Years | 29 (17.6%) | 32 (18.2%) |
| 12 to 14 Years | 37 (23.7%) | 15 (22.7%) |
| 15 Years | 5 (33.3%) | 18 (37.5%) |
| 16 and 17 Years | 7 (10.9%) | 8 (17.8%) |
| 18 to 24 Years | 6 (2.1%) | 19 (13.8%) |
| 25 to 34 Years | 52 (13.9%) | 87 (24.4%) |
| 35 to 44 Years | 22 (5.1%) | 54 (16.3%) |
| 45 to 54 Years | 14 (5.6%) | 38 (14.6%) |
| 55 to 64 Years | 37 (10.4%) | 41 (9.1%) |
| 65 to 74 Years | 24 (6.1%) | 23 (5.5%) |
| 75 Years and over | 12 (5.9%) | 16 (8.0%) |
| Total | 305 (10.8%) | 392 (14.7%) |
Income Above Poverty by Sex and Age in Homer
According to the poverty statistics in Homer, males aged 5 years and females aged 65 to 74 years are the age groups that are most secure financially, with 100.0% of males and 94.5% of females in these age groups living above the poverty line.
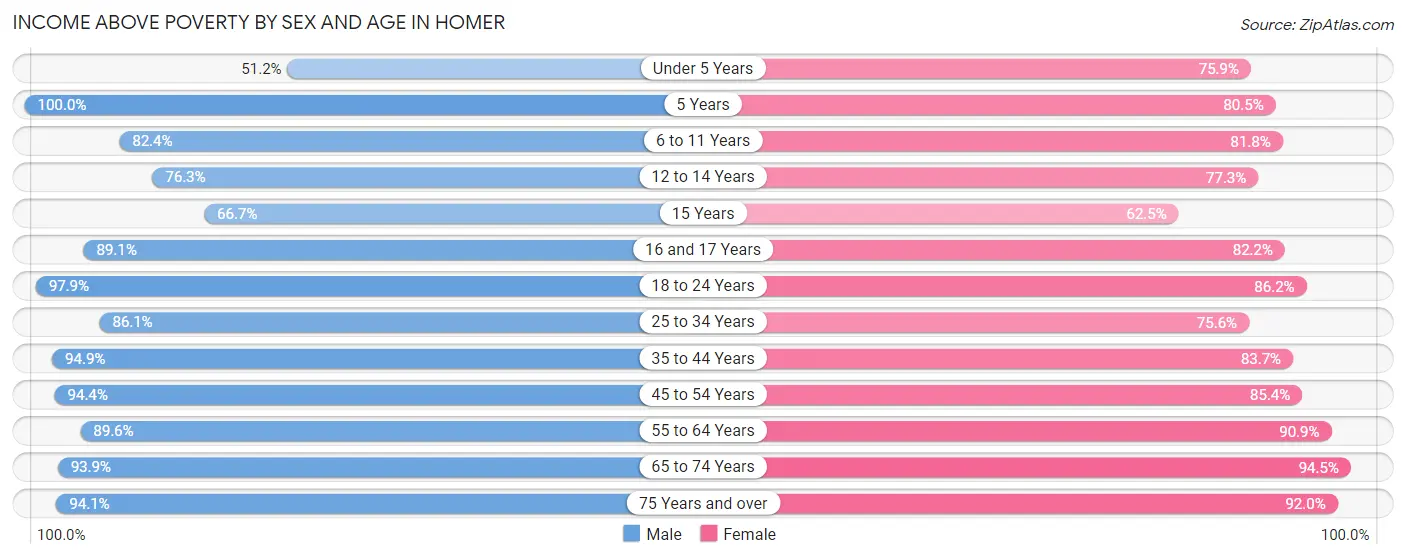
| Age Bracket | Male | Female |
| Under 5 Years | 63 (51.2%) | 104 (75.9%) |
| 5 Years | 15 (100.0%) | 33 (80.5%) |
| 6 to 11 Years | 136 (82.4%) | 144 (81.8%) |
| 12 to 14 Years | 119 (76.3%) | 51 (77.3%) |
| 15 Years | 10 (66.7%) | 30 (62.5%) |
| 16 and 17 Years | 57 (89.1%) | 37 (82.2%) |
| 18 to 24 Years | 282 (97.9%) | 119 (86.2%) |
| 25 to 34 Years | 322 (86.1%) | 269 (75.6%) |
| 35 to 44 Years | 408 (94.9%) | 278 (83.7%) |
| 45 to 54 Years | 237 (94.4%) | 223 (85.4%) |
| 55 to 64 Years | 320 (89.6%) | 407 (90.8%) |
| 65 to 74 Years | 366 (93.9%) | 392 (94.5%) |
| 75 Years and over | 191 (94.1%) | 184 (92.0%) |
| Total | 2,526 (89.2%) | 2,271 (85.3%) |
Income Below Poverty Among Married-Couple Families in Homer
The poverty statistics for married-couple families in Homer show that 3.7% or 37 of the total 1,008 families live below the poverty line. Families with 1 or 2 children have the highest poverty rate of 6.4%, comprising of 11 families. On the other hand, families with no children have the lowest poverty rate of 2.9%, which includes 22 families.
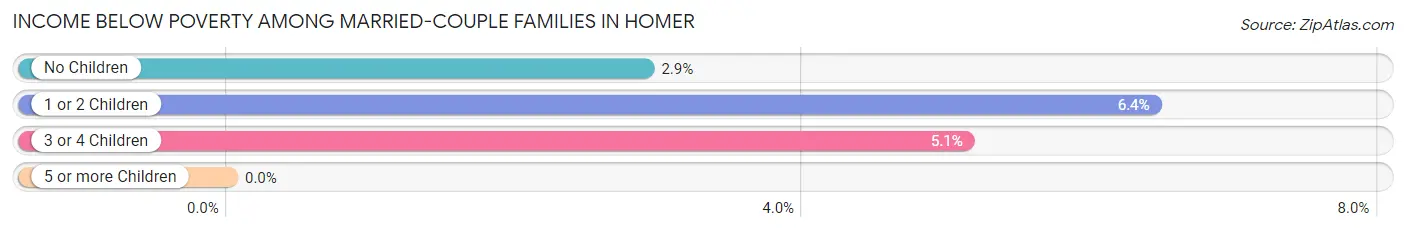
| Children | Above Poverty | Below Poverty |
| No Children | 737 (97.1%) | 22 (2.9%) |
| 1 or 2 Children | 160 (93.6%) | 11 (6.4%) |
| 3 or 4 Children | 74 (94.9%) | 4 (5.1%) |
| 5 or more Children | 0 (0.0%) | 0 (0.0%) |
| Total | 971 (96.3%) | 37 (3.7%) |
Income Below Poverty Among Single-Parent Households in Homer
According to the poverty data in Homer, 14.1% or 13 single-father households and 22.2% or 51 single-mother households are living below the poverty line. Among single-father households, those with 3 or 4 children have the highest poverty rate, with 5 households (62.5%) experiencing poverty. Likewise, among single-mother households, those with 1 or 2 children have the highest poverty rate, with 37 households (27.4%) falling below the poverty line.
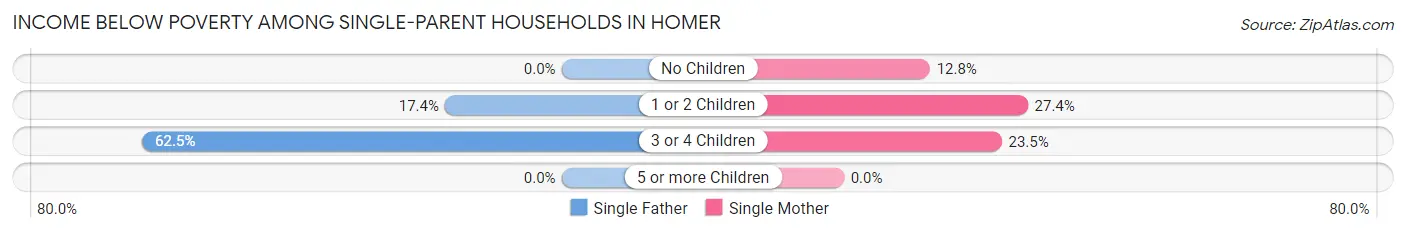
| Children | Single Father | Single Mother |
| No Children | 0 (0.0%) | 10 (12.8%) |
| 1 or 2 Children | 8 (17.4%) | 37 (27.4%) |
| 3 or 4 Children | 5 (62.5%) | 4 (23.5%) |
| 5 or more Children | 0 (0.0%) | 0 (0.0%) |
| Total | 13 (14.1%) | 51 (22.2%) |
Income Below Poverty Among Married-Couple vs Single-Parent Households in Homer
The poverty data for Homer shows that 37 of the married-couple family households (3.7%) and 64 of the single-parent households (19.9%) are living below the poverty level. Within the married-couple family households, those with 1 or 2 children have the highest poverty rate, with 11 households (6.4%) falling below the poverty line. Among the single-parent households, those with 3 or 4 children have the highest poverty rate, with 9 household (36.0%) living below poverty.
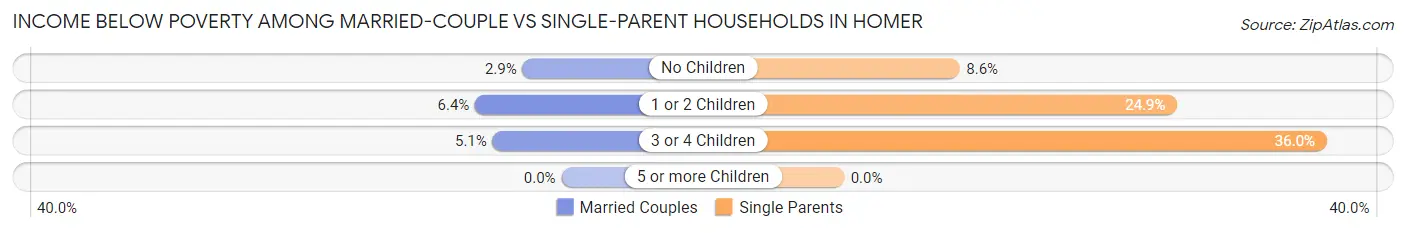
| Children | Married-Couple Families | Single-Parent Households |
| No Children | 22 (2.9%) | 10 (8.6%) |
| 1 or 2 Children | 11 (6.4%) | 45 (24.9%) |
| 3 or 4 Children | 4 (5.1%) | 9 (36.0%) |
| 5 or more Children | 0 (0.0%) | 0 (0.0%) |
| Total | 37 (3.7%) | 64 (19.9%) |
Race in Homer
The most populous races in Homer are White / Caucasian (4,523 | 80.4%), Two or more Races (487 | 8.7%), and Native / Alaskan (431 | 7.7%).
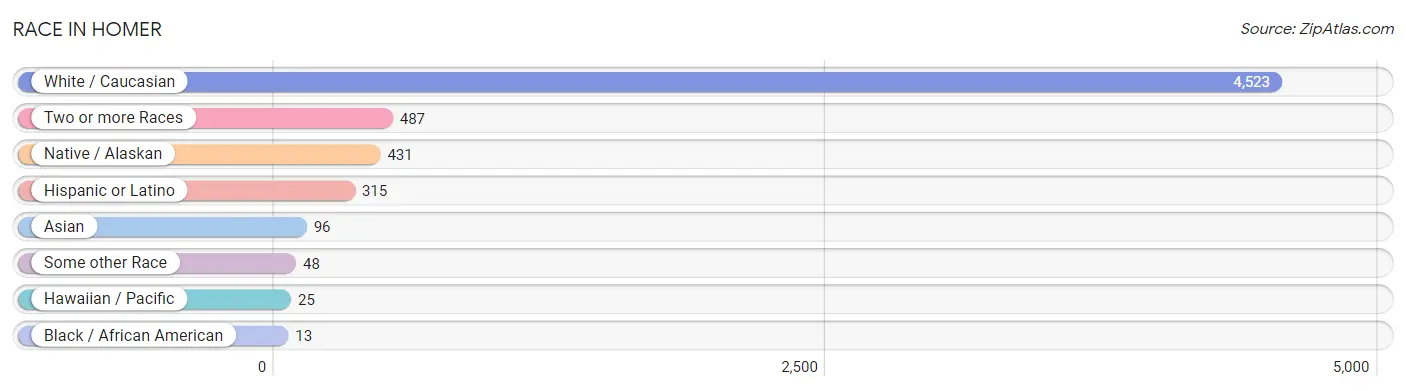
| Race | # Population | % Population |
| Asian | 96 | 1.7% |
| Black / African American | 13 | 0.2% |
| Hawaiian / Pacific | 25 | 0.4% |
| Hispanic or Latino | 315 | 5.6% |
| Native / Alaskan | 431 | 7.7% |
| White / Caucasian | 4,523 | 80.4% |
| Two or more Races | 487 | 8.7% |
| Some other Race | 48 | 0.9% |
| Total | 5,623 | 100.0% |
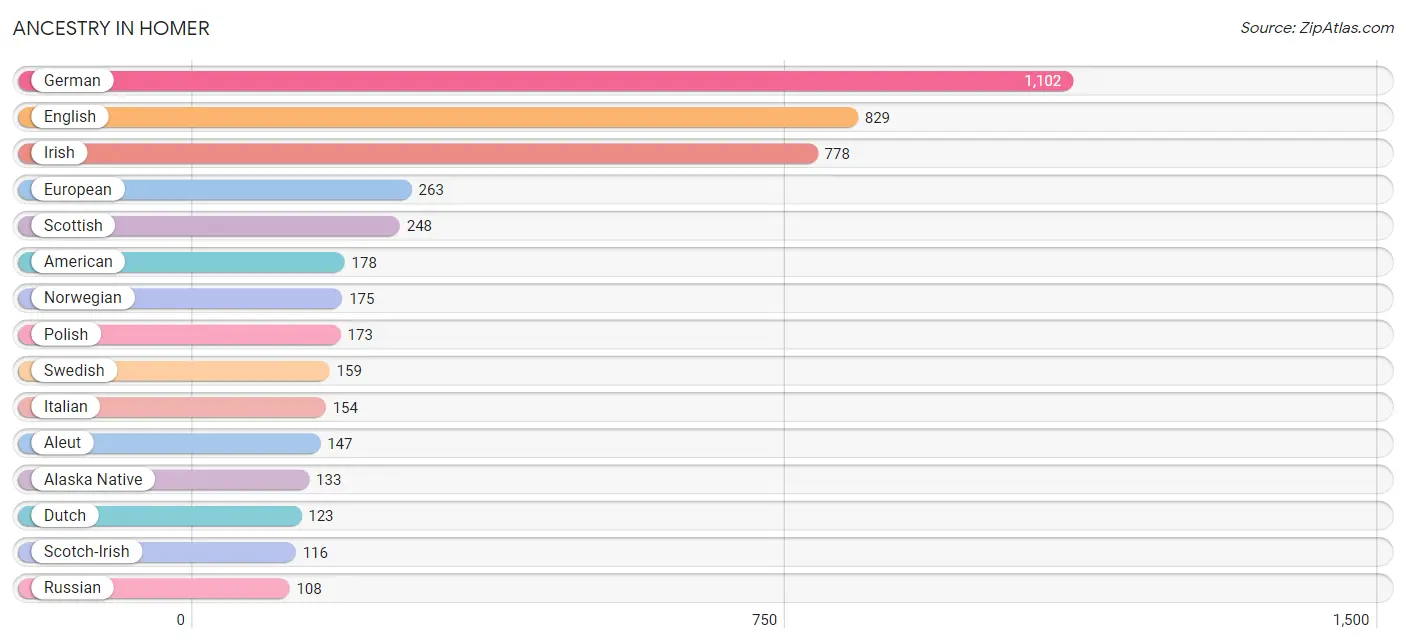
Ancestry in Homer
The most populous ancestries reported in Homer are German (1,102 | 19.6%), English (829 | 14.7%), Irish (778 | 13.8%), European (263 | 4.7%), and Scottish (248 | 4.4%), together accounting for 57.3% of all Homer residents.
| Ancestry | # Population | % Population |
| Afghan | 3 | 0.1% |
| Alaska Native | 133 | 2.4% |
| Alaskan Athabascan | 102 | 1.8% |
| Aleut | 147 | 2.6% |
| American | 178 | 3.2% |
| Apache | 4 | 0.1% |
| Arab | 1 | 0.0% |
| Australian | 11 | 0.2% |
| Austrian | 39 | 0.7% |
| Belgian | 3 | 0.1% |
| Bhutanese | 33 | 0.6% |
| Blackfeet | 6 | 0.1% |
| Bolivian | 3 | 0.1% |
| Brazilian | 3 | 0.1% |
| British | 29 | 0.5% |
| Burmese | 2 | 0.0% |
| Canadian | 3 | 0.1% |
| Central American | 10 | 0.2% |
| Cherokee | 100 | 1.8% |
| Chinese | 11 | 0.2% |
| Chippewa | 4 | 0.1% |
| Choctaw | 8 | 0.1% |
| Comanche | 4 | 0.1% |
| Croatian | 1 | 0.0% |
| Cuban | 16 | 0.3% |
| Czech | 29 | 0.5% |
| Czechoslovakian | 3 | 0.1% |
| Danish | 73 | 1.3% |
| Dutch | 123 | 2.2% |
| Eastern European | 23 | 0.4% |
| English | 829 | 14.7% |
| European | 263 | 4.7% |
| Finnish | 16 | 0.3% |
| French | 107 | 1.9% |
| French Canadian | 93 | 1.7% |
| German | 1,102 | 19.6% |
| Ghanaian | 1 | 0.0% |
| Greek | 26 | 0.5% |
| Honduran | 10 | 0.2% |
| Hungarian | 4 | 0.1% |
| Icelander | 4 | 0.1% |
| Indian (Asian) | 3 | 0.1% |
| Inupiat | 41 | 0.7% |
| Iranian | 4 | 0.1% |
| Irish | 778 | 13.8% |
| Iroquois | 2 | 0.0% |
| Italian | 154 | 2.7% |
| Jamaican | 1 | 0.0% |
| Korean | 71 | 1.3% |
| Latvian | 7 | 0.1% |
| Lebanese | 1 | 0.0% |
| Lithuanian | 21 | 0.4% |
| Luxembourger | 2 | 0.0% |
| Mexican | 90 | 1.6% |
| Native Hawaiian | 4 | 0.1% |
| Northern European | 38 | 0.7% |
| Norwegian | 175 | 3.1% |
| Pakistani | 12 | 0.2% |
| Peruvian | 4 | 0.1% |
| Polish | 173 | 3.1% |
| Portuguese | 10 | 0.2% |
| Pueblo | 1 | 0.0% |
| Puerto Rican | 3 | 0.1% |
| Russian | 108 | 1.9% |
| Samoan | 4 | 0.1% |
| Scandinavian | 83 | 1.5% |
| Scotch-Irish | 116 | 2.1% |
| Scottish | 248 | 4.4% |
| Sioux | 12 | 0.2% |
| Slovak | 5 | 0.1% |
| Slovene | 4 | 0.1% |
| South American | 7 | 0.1% |
| Spaniard | 10 | 0.2% |
| Spanish | 69 | 1.2% |
| Subsaharan African | 3 | 0.1% |
| Swedish | 159 | 2.8% |
| Swiss | 44 | 0.8% |
| Thai | 4 | 0.1% |
| Tlingit-Haida | 10 | 0.2% |
| Tsimshian | 1 | 0.0% |
| Ukrainian | 11 | 0.2% |
| Welsh | 62 | 1.1% |
| Yugoslavian | 9 | 0.2% |
| Yup'ik | 101 | 1.8% | View All 84 Rows |
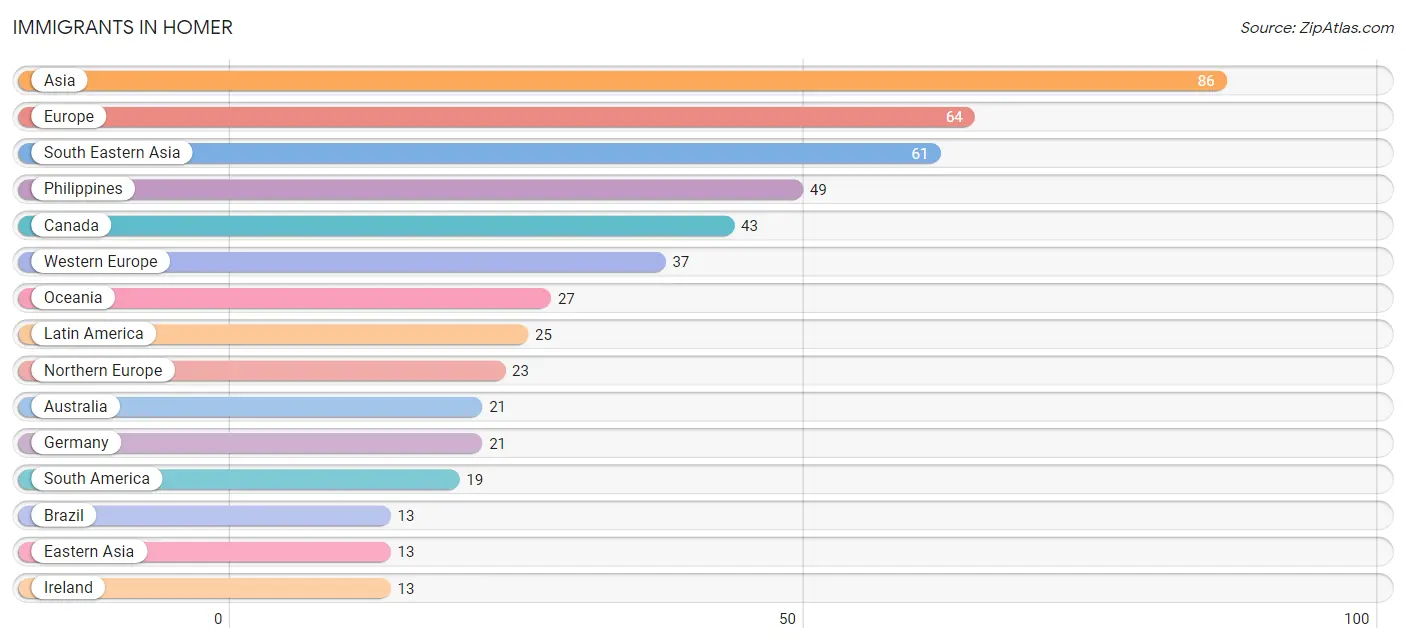
Immigrants in Homer
The most numerous immigrant groups reported in Homer came from Asia (86 | 1.5%), Europe (64 | 1.1%), South Eastern Asia (61 | 1.1%), Philippines (49 | 0.9%), and Canada (43 | 0.8%), together accounting for 5.4% of all Homer residents.
| Immigration Origin | # Population | % Population |
| Afghanistan | 7 | 0.1% |
| Africa | 5 | 0.1% |
| Asia | 86 | 1.5% |
| Australia | 21 | 0.4% |
| Bolivia | 3 | 0.1% |
| Brazil | 13 | 0.2% |
| Canada | 43 | 0.8% |
| Caribbean | 1 | 0.0% |
| Central America | 5 | 0.1% |
| Eastern Africa | 4 | 0.1% |
| Eastern Asia | 13 | 0.2% |
| Eastern Europe | 4 | 0.1% |
| England | 3 | 0.1% |
| Ethiopia | 4 | 0.1% |
| Europe | 64 | 1.1% |
| Germany | 21 | 0.4% |
| Ghana | 1 | 0.0% |
| Honduras | 3 | 0.1% |
| India | 5 | 0.1% |
| Ireland | 13 | 0.2% |
| Jamaica | 1 | 0.0% |
| Japan | 13 | 0.2% |
| Latin America | 25 | 0.4% |
| Latvia | 4 | 0.1% |
| Mexico | 2 | 0.0% |
| Netherlands | 4 | 0.1% |
| Northern Europe | 23 | 0.4% |
| Norway | 3 | 0.1% |
| Oceania | 27 | 0.5% |
| Peru | 3 | 0.1% |
| Philippines | 49 | 0.9% |
| Scotland | 4 | 0.1% |
| South America | 19 | 0.3% |
| South Central Asia | 12 | 0.2% |
| South Eastern Asia | 61 | 1.1% |
| Switzerland | 12 | 0.2% |
| Thailand | 12 | 0.2% |
| Western Africa | 1 | 0.0% |
| Western Europe | 37 | 0.7% | View All 39 Rows |
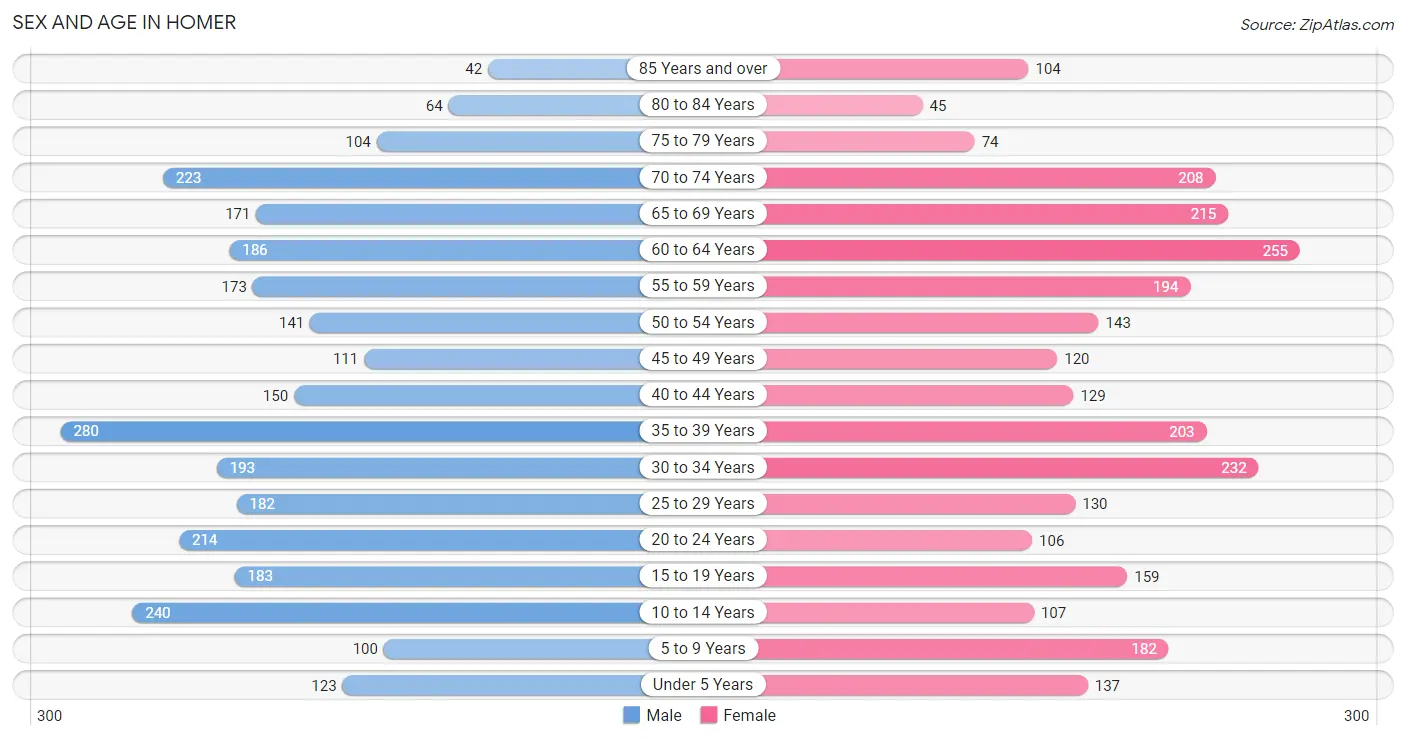
Sex and Age in Homer
Sex and Age in Homer
The most populous age groups in Homer are 35 to 39 Years (280 | 9.7%) for men and 60 to 64 Years (255 | 9.3%) for women.
| Age Bracket | Male | Female |
| Under 5 Years | 123 (4.3%) | 137 (5.0%) |
| 5 to 9 Years | 100 (3.5%) | 182 (6.6%) |
| 10 to 14 Years | 240 (8.3%) | 107 (3.9%) |
| 15 to 19 Years | 183 (6.4%) | 159 (5.8%) |
| 20 to 24 Years | 214 (7.4%) | 106 (3.9%) |
| 25 to 29 Years | 182 (6.3%) | 130 (4.7%) |
| 30 to 34 Years | 193 (6.7%) | 232 (8.5%) |
| 35 to 39 Years | 280 (9.7%) | 203 (7.4%) |
| 40 to 44 Years | 150 (5.2%) | 129 (4.7%) |
| 45 to 49 Years | 111 (3.8%) | 120 (4.4%) |
| 50 to 54 Years | 141 (4.9%) | 143 (5.2%) |
| 55 to 59 Years | 173 (6.0%) | 194 (7.1%) |
| 60 to 64 Years | 186 (6.5%) | 255 (9.3%) |
| 65 to 69 Years | 171 (5.9%) | 215 (7.8%) |
| 70 to 74 Years | 223 (7.7%) | 208 (7.6%) |
| 75 to 79 Years | 104 (3.6%) | 74 (2.7%) |
| 80 to 84 Years | 64 (2.2%) | 45 (1.6%) |
| 85 Years and over | 42 (1.5%) | 104 (3.8%) |
| Total | 2,880 (100.0%) | 2,743 (100.0%) |
Families and Households in Homer
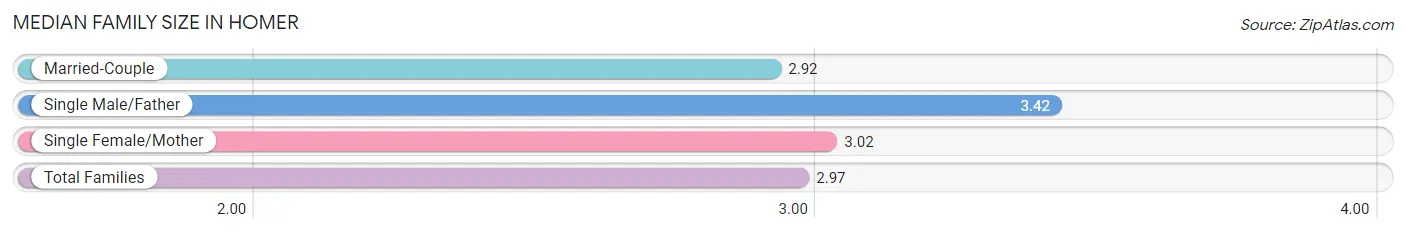
Median Family Size in Homer
The median family size in Homer is 2.97 persons per family, with single male/father families (92 | 6.9%) accounting for the largest median family size of 3.42 persons per family. On the other hand, married-couple families (1,008 | 75.8%) represent the smallest median family size with 2.92 persons per family.
| Family Type | # Families | Family Size |
| Married-Couple | 1,008 (75.8%) | 2.92 |
| Single Male/Father | 92 (6.9%) | 3.42 |
| Single Female/Mother | 230 (17.3%) | 3.02 |
| Total Families | 1,330 (100.0%) | 2.97 |
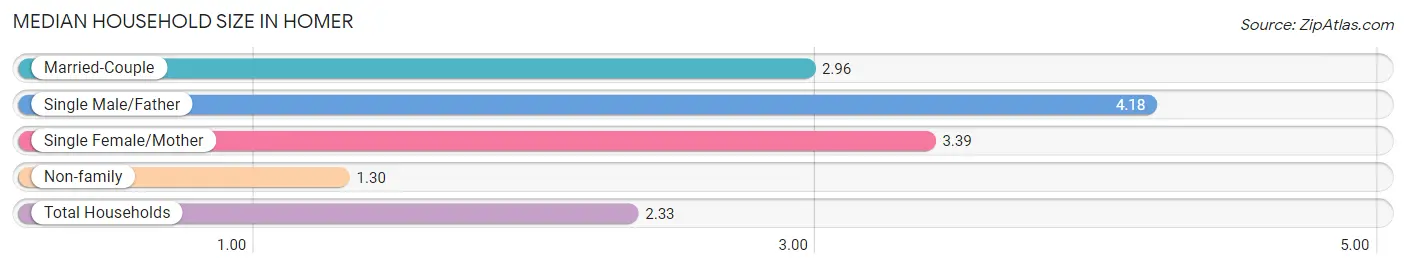
Median Household Size in Homer
The median household size in Homer is 2.33 persons per household, with single male/father households (92 | 3.9%) accounting for the largest median household size of 4.18 persons per household. non-family households (1,022 | 43.4%) represent the smallest median household size with 1.30 persons per household.
| Household Type | # Households | Household Size |
| Married-Couple | 1,008 (42.9%) | 2.96 |
| Single Male/Father | 92 (3.9%) | 4.18 |
| Single Female/Mother | 230 (9.8%) | 3.39 |
| Non-family | 1,022 (43.4%) | 1.30 |
| Total Households | 2,352 (100.0%) | 2.33 |
Household Size by Marriage Status in Homer
Out of a total of 2,352 households in Homer, 1,330 (56.6%) are family households, while 1,022 (43.4%) are nonfamily households. The most numerous type of family households are 2-person households, comprising 757, and the most common type of nonfamily households are 1-person households, comprising 852.
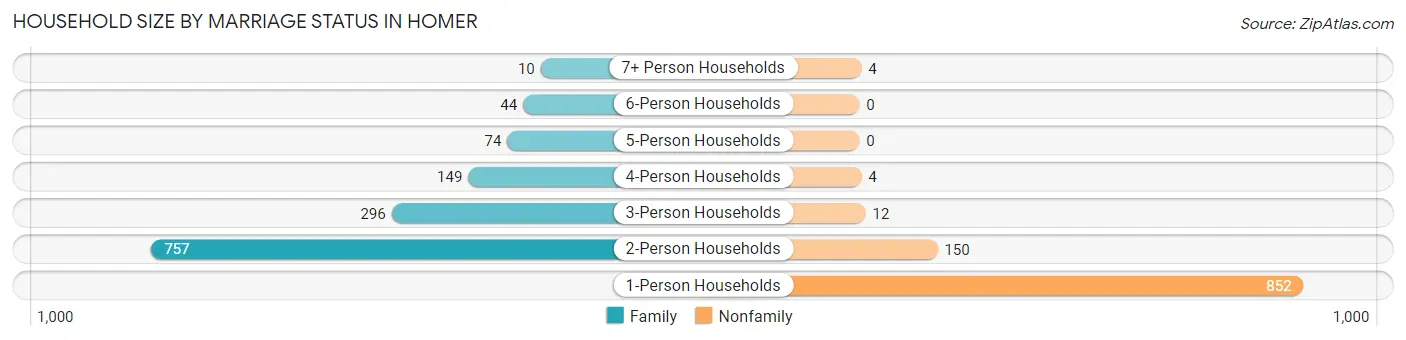
| Household Size | Family Households | Nonfamily Households |
| 1-Person Households | - | 852 (36.2%) |
| 2-Person Households | 757 (32.2%) | 150 (6.4%) |
| 3-Person Households | 296 (12.6%) | 12 (0.5%) |
| 4-Person Households | 149 (6.3%) | 4 (0.2%) |
| 5-Person Households | 74 (3.2%) | 0 (0.0%) |
| 6-Person Households | 44 (1.9%) | 0 (0.0%) |
| 7+ Person Households | 10 (0.4%) | 4 (0.2%) |
| Total | 1,330 (56.6%) | 1,022 (43.4%) |
Female Fertility in Homer
Fertility by Age in Homer
Average fertility rate in Homer is 35.0 births per 1,000 women. Women in the age bracket of 20 to 34 years have the highest fertility rate with 60.0 births per 1,000 women. Women in the age bracket of 20 to 34 years acount for 71.8% of all women with births.
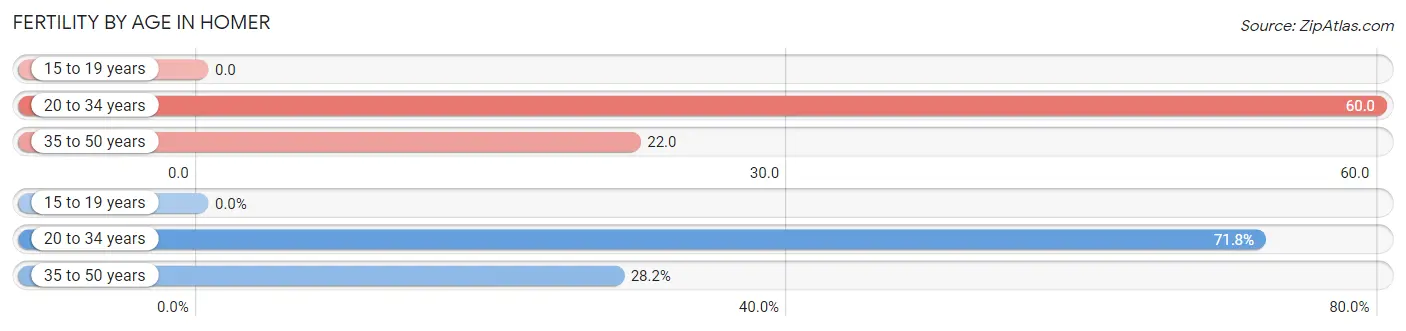
| Age Bracket | Women with Births | Births / 1,000 Women |
| 15 to 19 years | 0 (0.0%) | 0.0 |
| 20 to 34 years | 28 (71.8%) | 60.0 |
| 35 to 50 years | 11 (28.2%) | 22.0 |
| Total | 39 (100.0%) | 35.0 |
Fertility by Age by Marriage Status in Homer
38.5% of women with births (39) in Homer are married. The highest percentage of unmarried women with births falls into 20 to 34 years age bracket with 75.0% of them unmarried at the time of birth, while the lowest percentage of unmarried women with births belong to 35 to 50 years age bracket with 27.3% of them unmarried.
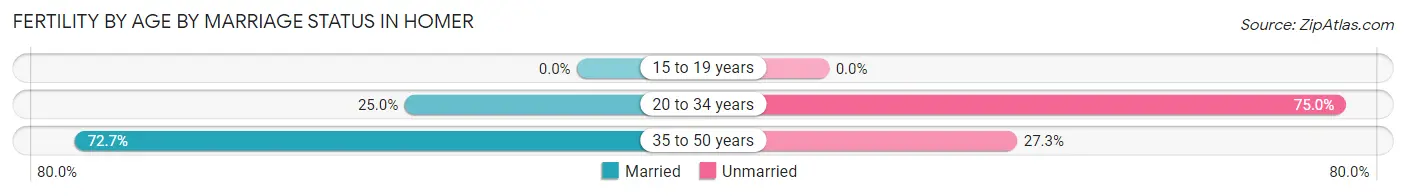
| Age Bracket | Married | Unmarried |
| 15 to 19 years | 0 (0.0%) | 0 (0.0%) |
| 20 to 34 years | 7 (25.0%) | 21 (75.0%) |
| 35 to 50 years | 8 (72.7%) | 3 (27.3%) |
| Total | 15 (38.5%) | 24 (61.5%) |
Fertility by Education in Homer
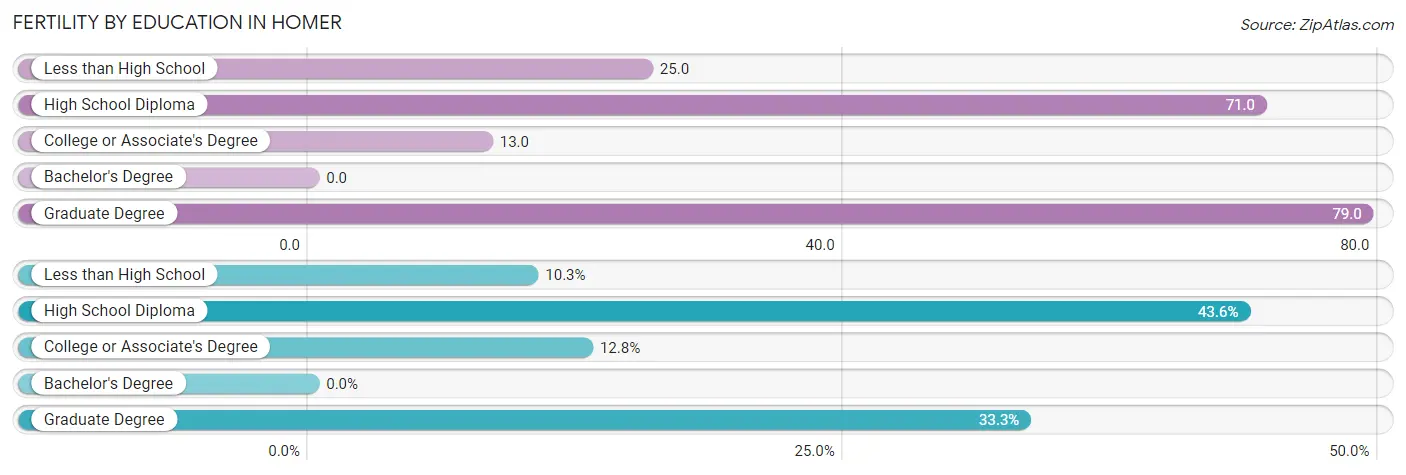
| Educational Attainment | Women with Births | Births / 1,000 Women |
| Less than High School | 4 (10.3%) | 25.0 |
| High School Diploma | 17 (43.6%) | 71.0 |
| College or Associate's Degree | 5 (12.8%) | 13.0 |
| Bachelor's Degree | 0 (0.0%) | 0.0 |
| Graduate Degree | 13 (33.3%) | 79.0 |
| Total | 39 (100.0%) | 35.0 |
Fertility by Education by Marriage Status in Homer
61.5% of women with births in Homer are unmarried. Women with the educational attainment of graduate degree are most likely to be married with 100.0% of them married at childbirth, while women with the educational attainment of less than high school are least likely to be married with 100.0% of them unmarried at childbirth.
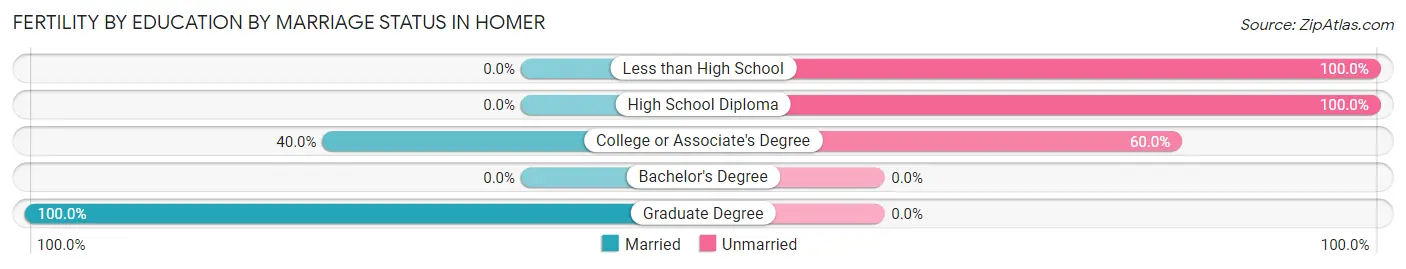
| Educational Attainment | Married | Unmarried |
| Less than High School | 0 (0.0%) | 4 (100.0%) |
| High School Diploma | 0 (0.0%) | 17 (100.0%) |
| College or Associate's Degree | 2 (40.0%) | 3 (60.0%) |
| Bachelor's Degree | 0 (0.0%) | 0 (0.0%) |
| Graduate Degree | 13 (100.0%) | 0 (0.0%) |
| Total | 15 (38.5%) | 24 (61.5%) |
Employment Characteristics in Homer
Employment by Class of Employer in Homer
Among the 2,537 employed individuals in Homer, private company employees (1,250 | 49.3%), self-employed (not incorporated) (355 | 14.0%), and not-for-profit organizations (263 | 10.4%) make up the most common classes of employment.
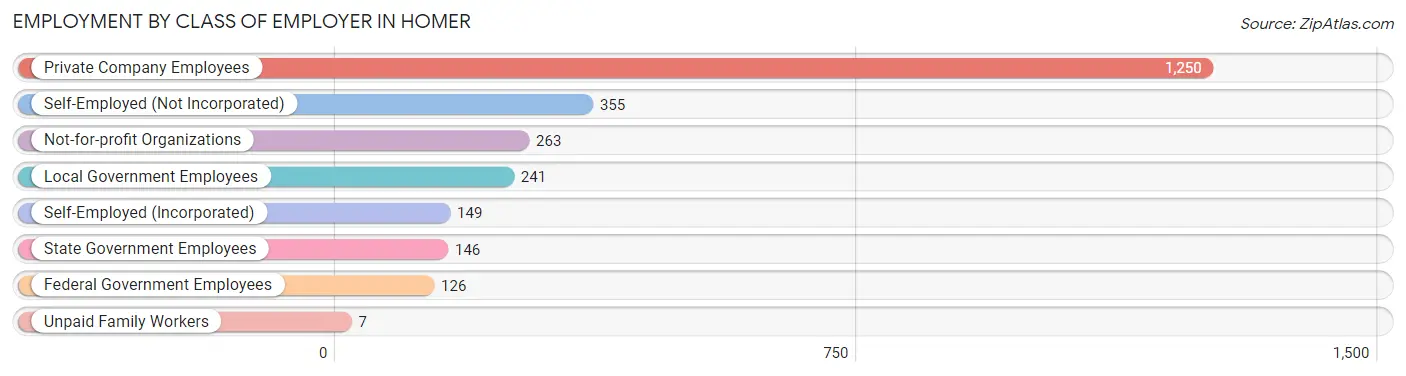
| Employer Class | # Employees | % Employees |
| Private Company Employees | 1,250 | 49.3% |
| Self-Employed (Incorporated) | 149 | 5.9% |
| Self-Employed (Not Incorporated) | 355 | 14.0% |
| Not-for-profit Organizations | 263 | 10.4% |
| Local Government Employees | 241 | 9.5% |
| State Government Employees | 146 | 5.8% |
| Federal Government Employees | 126 | 5.0% |
| Unpaid Family Workers | 7 | 0.3% |
| Total | 2,537 | 100.0% |
Employment Status by Age in Homer
According to the labor force statistics for Homer, out of the total population over 16 years of age (4,671), 61.1% or 2,854 individuals are in the labor force, with 9.0% or 257 of them unemployed. The age group with the highest labor force participation rate is 45 to 54 years, with 85.0% or 438 individuals in the labor force. Within the labor force, the 75 years and over age range has the highest percentage of unemployed individuals, with 25.8% or 8 of them being unemployed.
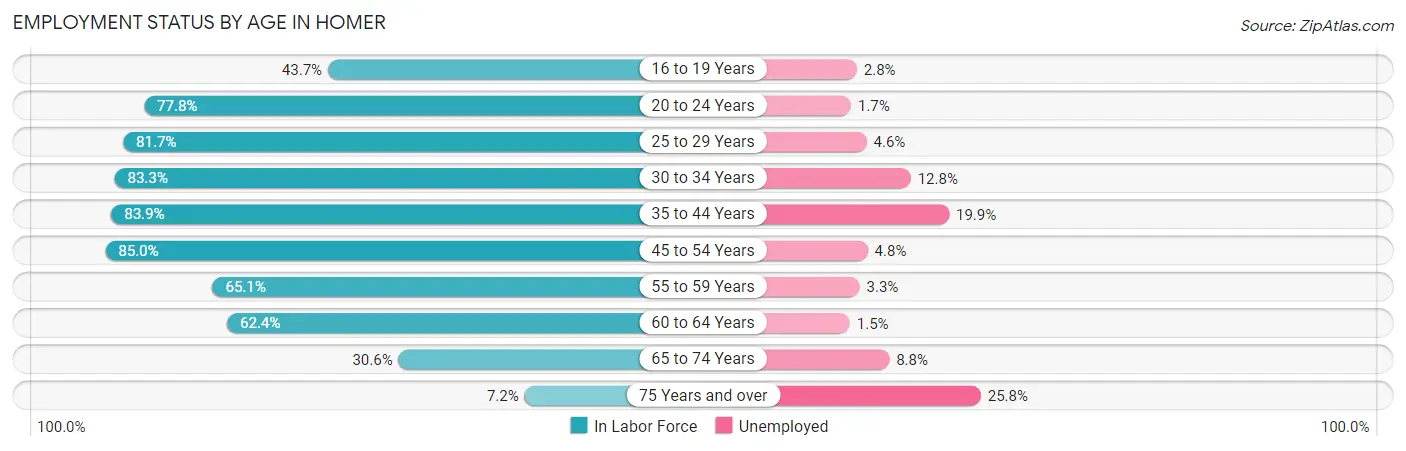
| Age Bracket | In Labor Force | Unemployed |
| 16 to 19 Years | 122 (43.7%) | 3 (2.8%) |
| 20 to 24 Years | 249 (77.8%) | 4 (1.7%) |
| 25 to 29 Years | 255 (81.7%) | 12 (4.6%) |
| 30 to 34 Years | 354 (83.3%) | 45 (12.8%) |
| 35 to 44 Years | 639 (83.9%) | 127 (19.9%) |
| 45 to 54 Years | 438 (85.0%) | 21 (4.8%) |
| 55 to 59 Years | 239 (65.1%) | 8 (3.3%) |
| 60 to 64 Years | 275 (62.4%) | 4 (1.5%) |
| 65 to 74 Years | 250 (30.6%) | 22 (8.8%) |
| 75 Years and over | 31 (7.2%) | 8 (25.8%) |
| Total | 2,854 (61.1%) | 257 (9.0%) |
Employment Status by Educational Attainment in Homer
According to labor force statistics for Homer, 78.0% of individuals (2,201) out of the total population between 25 and 64 years of age (2,822) are in the labor force, with 9.8% or 216 of them being unemployed. The group with the highest labor force participation rate are those with the educational attainment of bachelor's degree or higher, with 86.1% or 918 individuals in the labor force. Within the labor force, individuals with less than high school education have the highest percentage of unemployment, with 13.4% or 9 of them being unemployed.
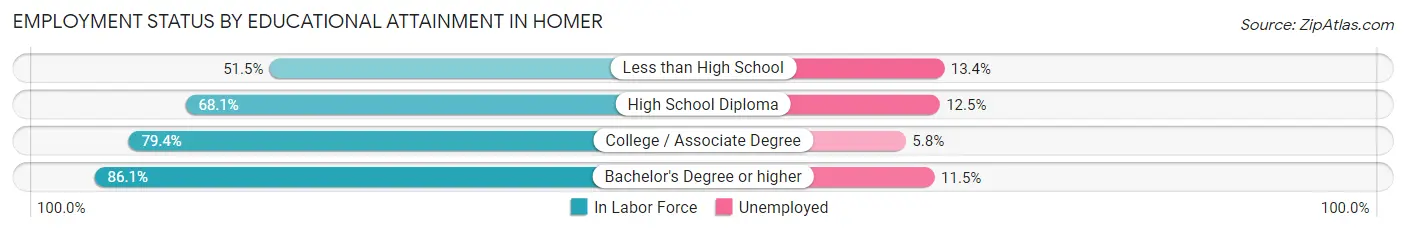
| Educational Attainment | In Labor Force | Unemployed |
| Less than High School | 67 (51.5%) | 17 (13.4%) |
| High School Diploma | 458 (68.1%) | 84 (12.5%) |
| College / Associate Degree | 757 (79.4%) | 55 (5.8%) |
| Bachelor's Degree or higher | 918 (86.1%) | 123 (11.5%) |
| Total | 2,201 (78.0%) | 277 (9.8%) |
Employment Occupations by Sex in Homer
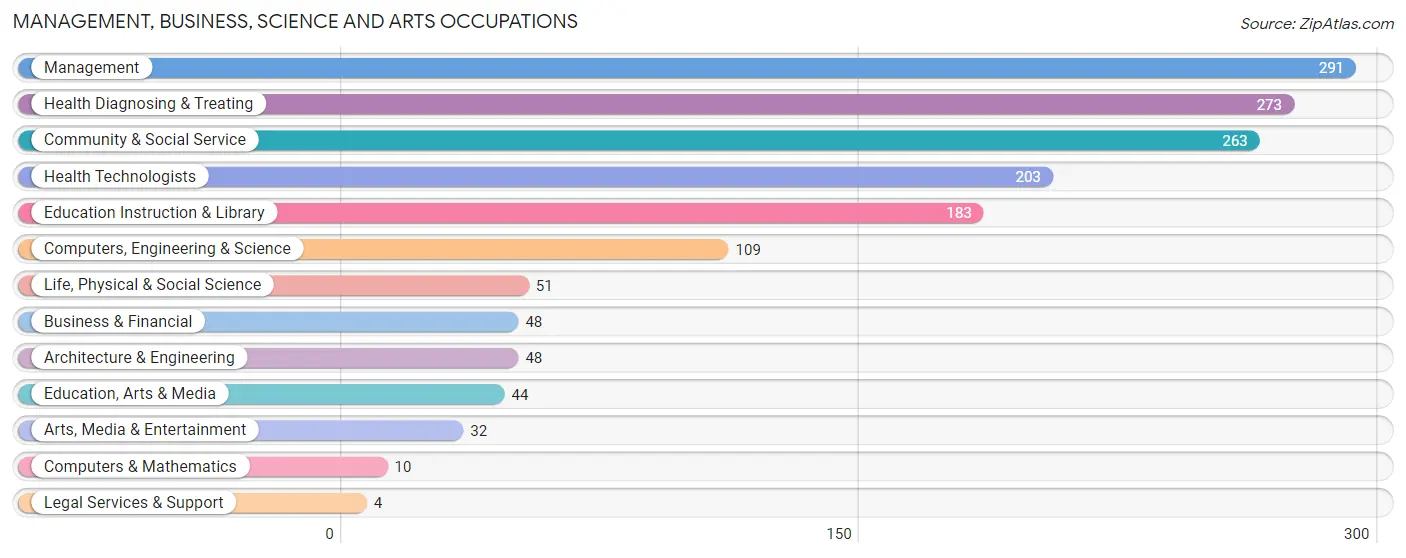
Management, Business, Science and Arts Occupations
The most common Management, Business, Science and Arts occupations in Homer are Management (291 | 11.5%), Health Diagnosing & Treating (273 | 10.8%), Community & Social Service (263 | 10.4%), Health Technologists (203 | 8.0%), and Education Instruction & Library (183 | 7.2%).
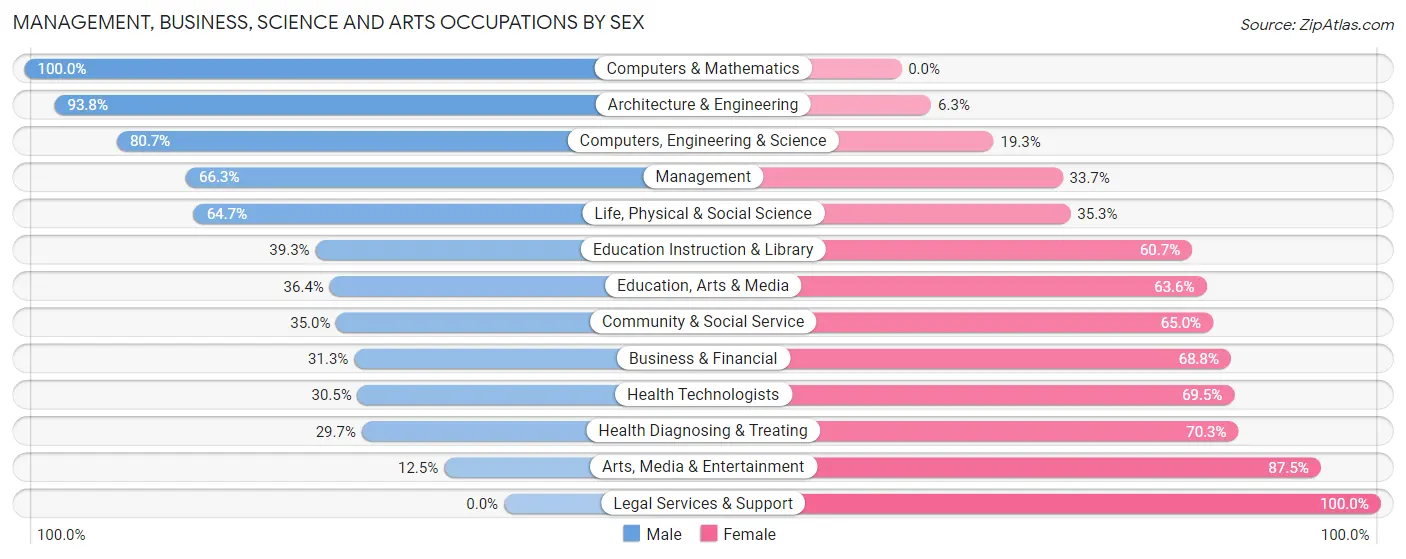
Management, Business, Science and Arts Occupations by Sex
Within the Management, Business, Science and Arts occupations in Homer, the most male-oriented occupations are Computers & Mathematics (100.0%), Architecture & Engineering (93.8%), and Computers, Engineering & Science (80.7%), while the most female-oriented occupations are Legal Services & Support (100.0%), Arts, Media & Entertainment (87.5%), and Health Diagnosing & Treating (70.3%).
| Occupation | Male | Female |
| Management | 193 (66.3%) | 98 (33.7%) |
| Business & Financial | 15 (31.2%) | 33 (68.8%) |
| Computers, Engineering & Science | 88 (80.7%) | 21 (19.3%) |
| Computers & Mathematics | 10 (100.0%) | 0 (0.0%) |
| Architecture & Engineering | 45 (93.8%) | 3 (6.2%) |
| Life, Physical & Social Science | 33 (64.7%) | 18 (35.3%) |
| Community & Social Service | 92 (35.0%) | 171 (65.0%) |
| Education, Arts & Media | 16 (36.4%) | 28 (63.6%) |
| Legal Services & Support | 0 (0.0%) | 4 (100.0%) |
| Education Instruction & Library | 72 (39.3%) | 111 (60.7%) |
| Arts, Media & Entertainment | 4 (12.5%) | 28 (87.5%) |
| Health Diagnosing & Treating | 81 (29.7%) | 192 (70.3%) |
| Health Technologists | 62 (30.5%) | 141 (69.5%) |
| Total (Category) | 469 (47.7%) | 515 (52.3%) |
| Total (Overall) | 1,344 (53.1%) | 1,189 (46.9%) |
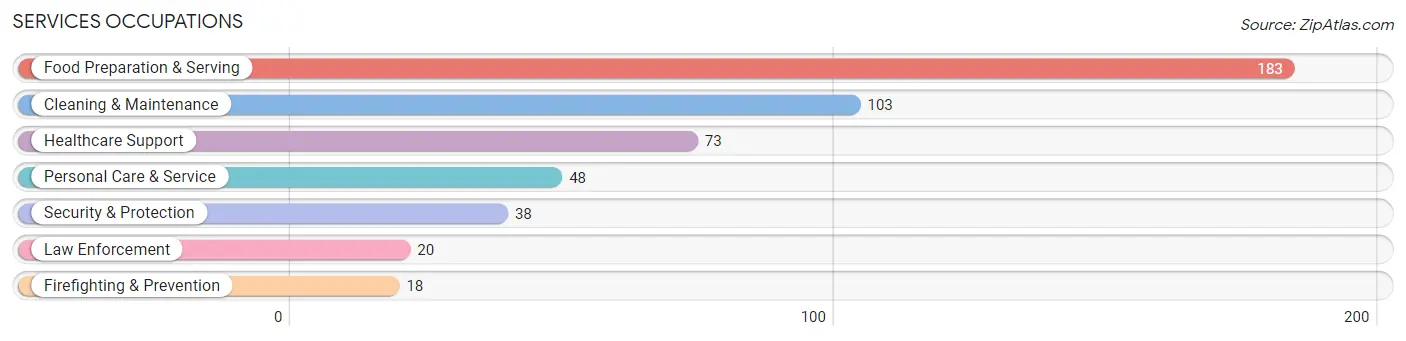
Services Occupations
The most common Services occupations in Homer are Food Preparation & Serving (183 | 7.2%), Cleaning & Maintenance (103 | 4.1%), Healthcare Support (73 | 2.9%), Personal Care & Service (48 | 1.9%), and Security & Protection (38 | 1.5%).
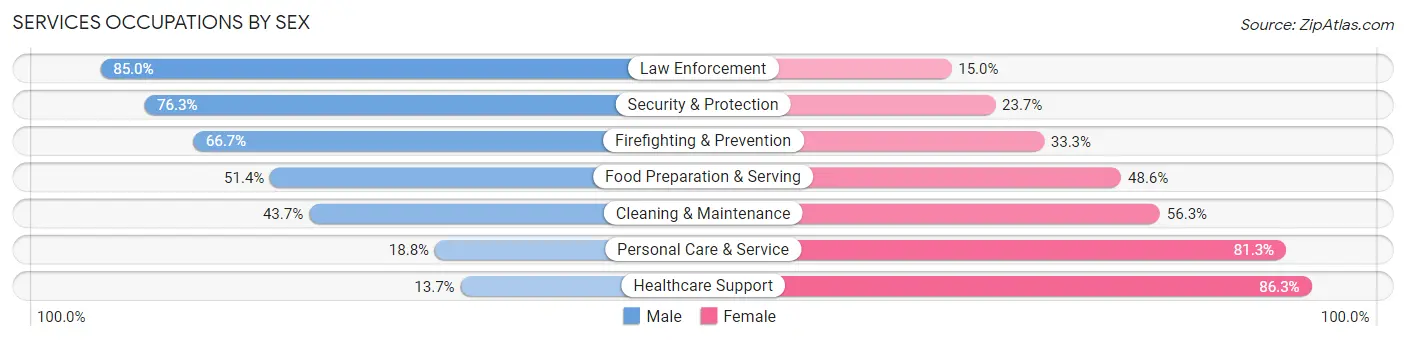
Services Occupations by Sex
Within the Services occupations in Homer, the most male-oriented occupations are Law Enforcement (85.0%), Security & Protection (76.3%), and Firefighting & Prevention (66.7%), while the most female-oriented occupations are Healthcare Support (86.3%), Personal Care & Service (81.2%), and Cleaning & Maintenance (56.3%).
| Occupation | Male | Female |
| Healthcare Support | 10 (13.7%) | 63 (86.3%) |
| Security & Protection | 29 (76.3%) | 9 (23.7%) |
| Firefighting & Prevention | 12 (66.7%) | 6 (33.3%) |
| Law Enforcement | 17 (85.0%) | 3 (15.0%) |
| Food Preparation & Serving | 94 (51.4%) | 89 (48.6%) |
| Cleaning & Maintenance | 45 (43.7%) | 58 (56.3%) |
| Personal Care & Service | 9 (18.8%) | 39 (81.2%) |
| Total (Category) | 187 (42.0%) | 258 (58.0%) |
| Total (Overall) | 1,344 (53.1%) | 1,189 (46.9%) |
Sales and Office Occupations
The most common Sales and Office occupations in Homer are Office & Administration (287 | 11.3%), and Sales & Related (218 | 8.6%).
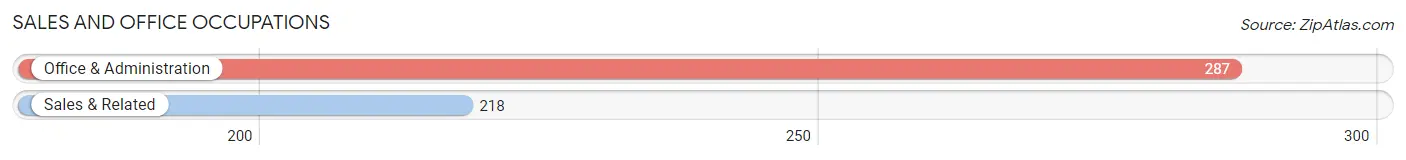
Sales and Office Occupations by Sex
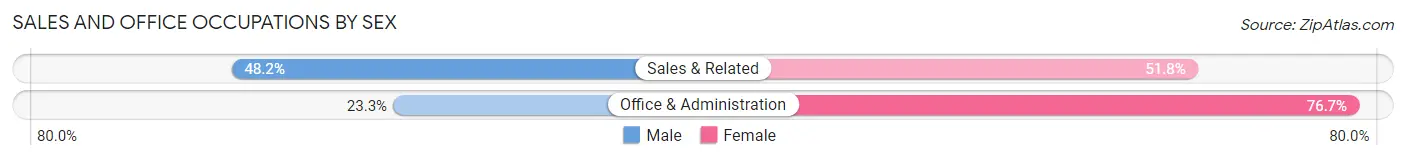
| Occupation | Male | Female |
| Sales & Related | 105 (48.2%) | 113 (51.8%) |
| Office & Administration | 67 (23.3%) | 220 (76.7%) |
| Total (Category) | 172 (34.1%) | 333 (65.9%) |
| Total (Overall) | 1,344 (53.1%) | 1,189 (46.9%) |
Natural Resources, Construction and Maintenance Occupations
The most common Natural Resources, Construction and Maintenance occupations in Homer are Farming, Fishing & Forestry (108 | 4.3%), Construction & Extraction (97 | 3.8%), and Installation, Maintenance & Repair (72 | 2.8%).
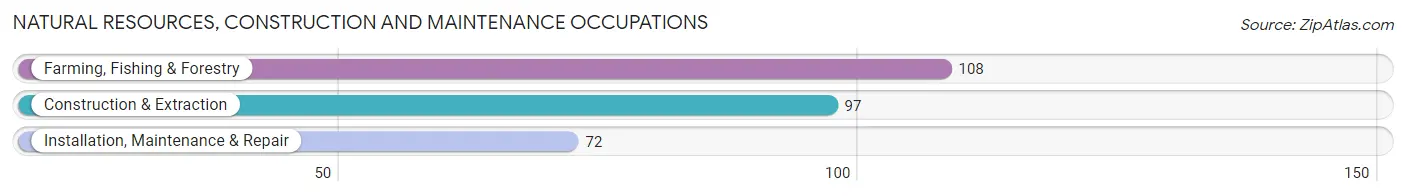
Natural Resources, Construction and Maintenance Occupations by Sex
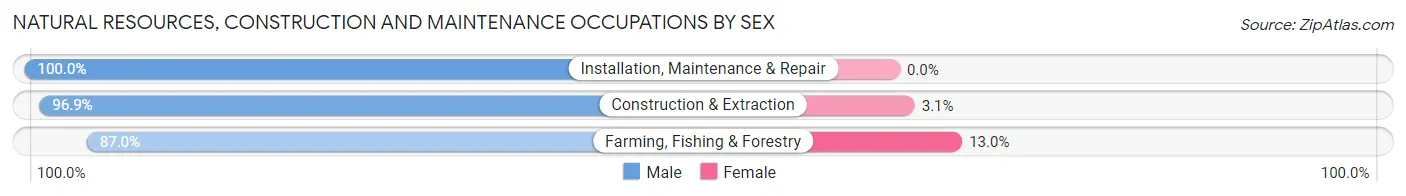
| Occupation | Male | Female |
| Farming, Fishing & Forestry | 94 (87.0%) | 14 (13.0%) |
| Construction & Extraction | 94 (96.9%) | 3 (3.1%) |
| Installation, Maintenance & Repair | 72 (100.0%) | 0 (0.0%) |
| Total (Category) | 260 (93.9%) | 17 (6.1%) |
| Total (Overall) | 1,344 (53.1%) | 1,189 (46.9%) |
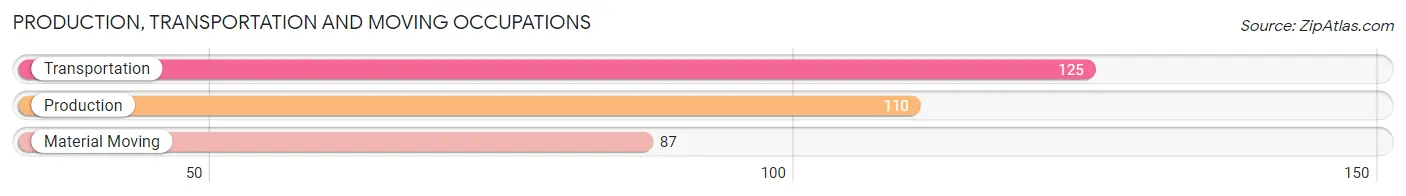
Production, Transportation and Moving Occupations
The most common Production, Transportation and Moving occupations in Homer are Transportation (125 | 4.9%), Production (110 | 4.3%), and Material Moving (87 | 3.4%).
Production, Transportation and Moving Occupations by Sex
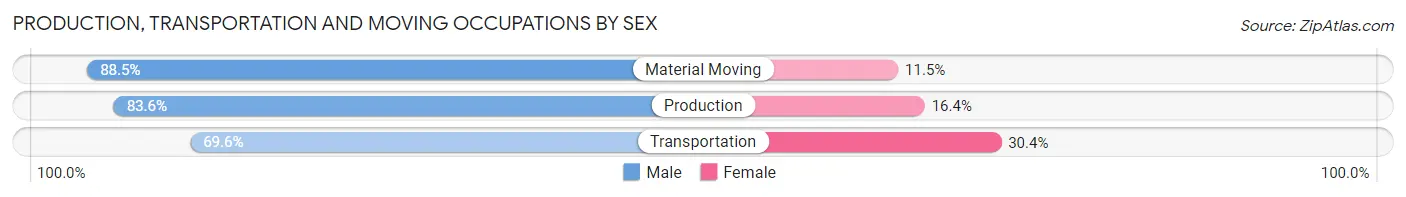
| Occupation | Male | Female |
| Production | 92 (83.6%) | 18 (16.4%) |
| Transportation | 87 (69.6%) | 38 (30.4%) |
| Material Moving | 77 (88.5%) | 10 (11.5%) |
| Total (Category) | 256 (79.5%) | 66 (20.5%) |
| Total (Overall) | 1,344 (53.1%) | 1,189 (46.9%) |
Employment Industries by Sex in Homer
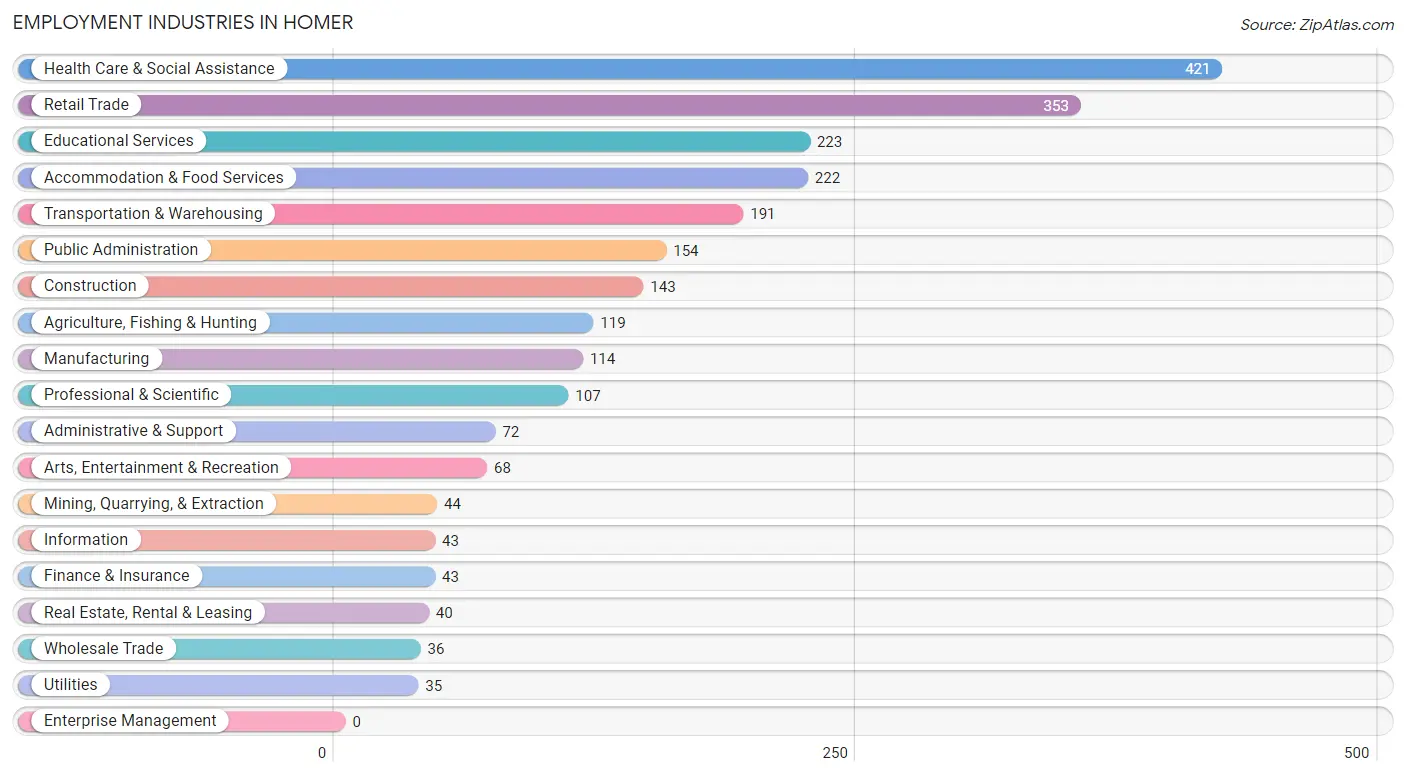
Employment Industries in Homer
The major employment industries in Homer include Health Care & Social Assistance (421 | 16.6%), Retail Trade (353 | 13.9%), Educational Services (223 | 8.8%), Accommodation & Food Services (222 | 8.8%), and Transportation & Warehousing (191 | 7.5%).
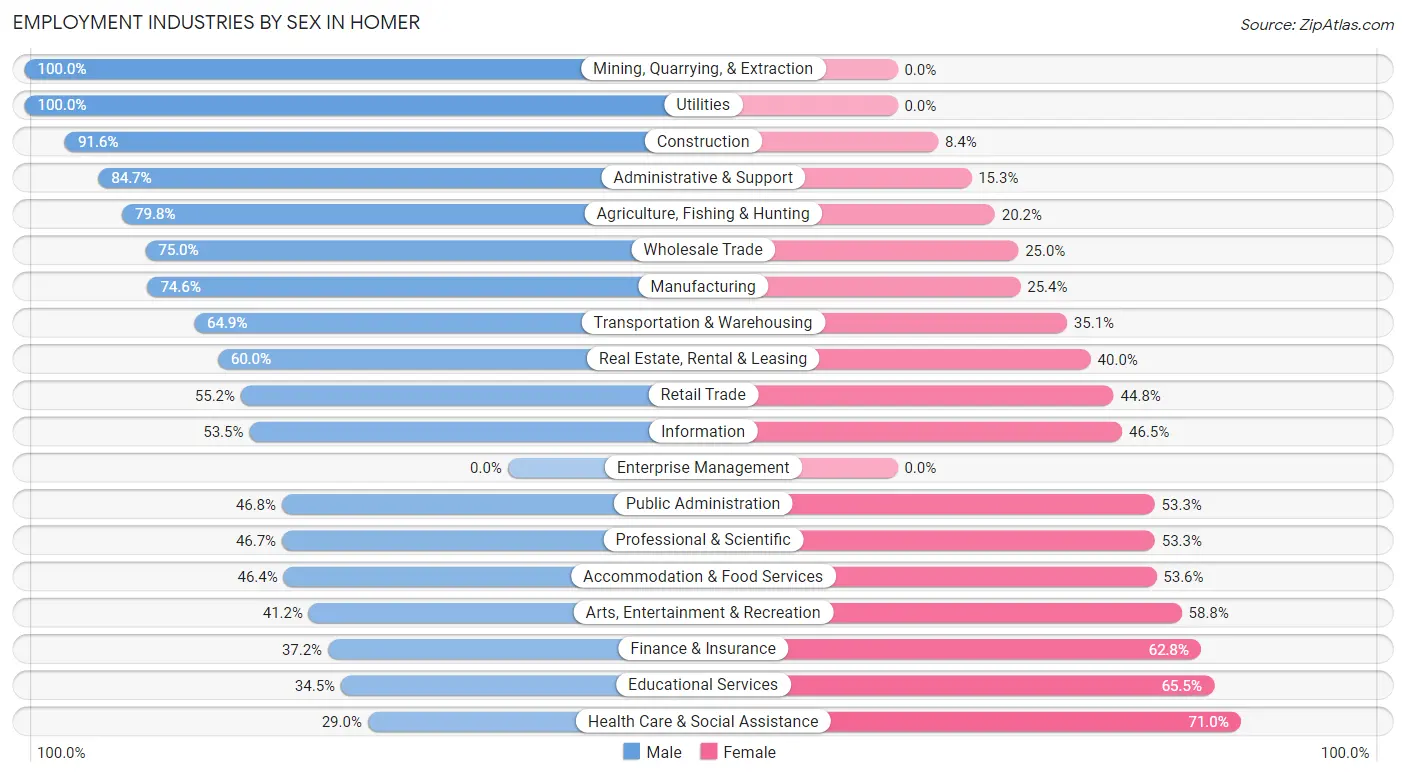
Employment Industries by Sex in Homer
The Homer industries that see more men than women are Mining, Quarrying, & Extraction (100.0%), Utilities (100.0%), and Construction (91.6%), whereas the industries that tend to have a higher number of women are Health Care & Social Assistance (71.0%), Educational Services (65.5%), and Finance & Insurance (62.8%).
| Industry | Male | Female |
| Agriculture, Fishing & Hunting | 95 (79.8%) | 24 (20.2%) |
| Mining, Quarrying, & Extraction | 44 (100.0%) | 0 (0.0%) |
| Construction | 131 (91.6%) | 12 (8.4%) |
| Manufacturing | 85 (74.6%) | 29 (25.4%) |
| Wholesale Trade | 27 (75.0%) | 9 (25.0%) |
| Retail Trade | 195 (55.2%) | 158 (44.8%) |
| Transportation & Warehousing | 124 (64.9%) | 67 (35.1%) |
| Utilities | 35 (100.0%) | 0 (0.0%) |
| Information | 23 (53.5%) | 20 (46.5%) |
| Finance & Insurance | 16 (37.2%) | 27 (62.8%) |
| Real Estate, Rental & Leasing | 24 (60.0%) | 16 (40.0%) |
| Professional & Scientific | 50 (46.7%) | 57 (53.3%) |
| Enterprise Management | 0 (0.0%) | 0 (0.0%) |
| Administrative & Support | 61 (84.7%) | 11 (15.3%) |
| Educational Services | 77 (34.5%) | 146 (65.5%) |
| Health Care & Social Assistance | 122 (29.0%) | 299 (71.0%) |
| Arts, Entertainment & Recreation | 28 (41.2%) | 40 (58.8%) |
| Accommodation & Food Services | 103 (46.4%) | 119 (53.6%) |
| Public Administration | 72 (46.8%) | 82 (53.2%) |
| Total | 1,344 (53.1%) | 1,189 (46.9%) |
Education in Homer
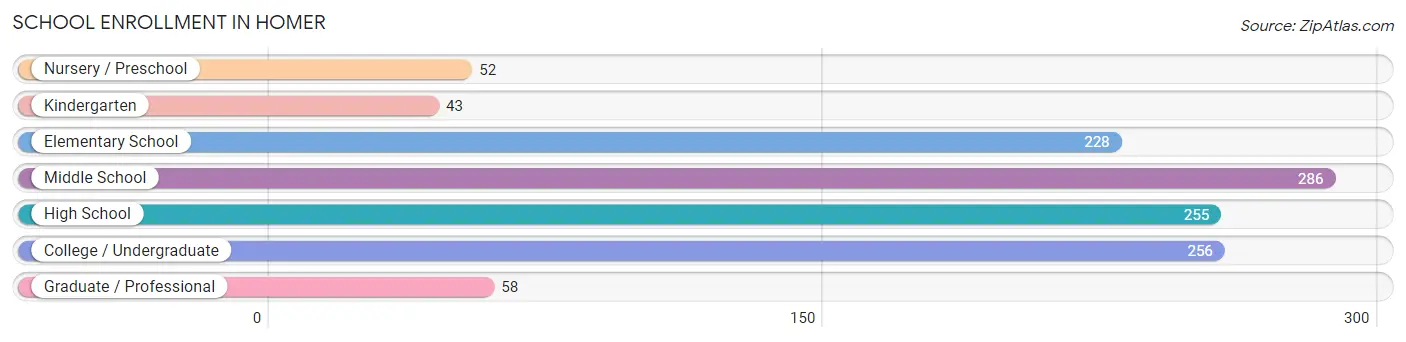
School Enrollment in Homer
The most common levels of schooling among the 1,178 students in Homer are middle school (286 | 24.3%), college / undergraduate (256 | 21.7%), and high school (255 | 21.6%).
| School Level | # Students | % Students |
| Nursery / Preschool | 52 | 4.4% |
| Kindergarten | 43 | 3.6% |
| Elementary School | 228 | 19.4% |
| Middle School | 286 | 24.3% |
| High School | 255 | 21.6% |
| College / Undergraduate | 256 | 21.7% |
| Graduate / Professional | 58 | 4.9% |
| Total | 1,178 | 100.0% |
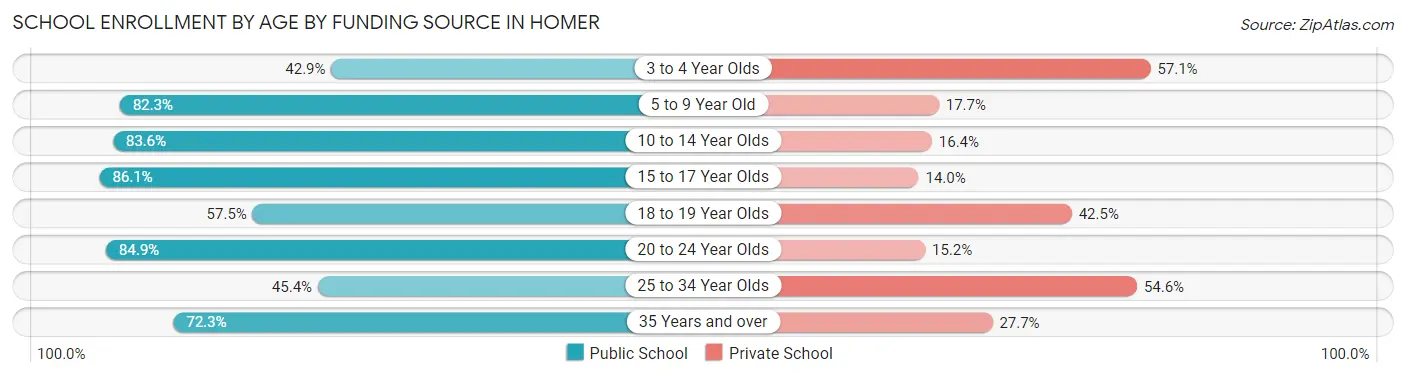
School Enrollment by Age by Funding Source in Homer
Out of a total of 1,178 students who are enrolled in schools in Homer, 286 (24.3%) attend a private institution, while the remaining 892 (75.7%) are enrolled in public schools. The age group of 3 to 4 year olds has the highest likelihood of being enrolled in private schools, with 20 (57.1% in the age bracket) enrolled. Conversely, the age group of 15 to 17 year olds has the lowest likelihood of being enrolled in a private school, with 148 (86.1% in the age bracket) attending a public institution.
| Age Bracket | Public School | Private School |
| 3 to 4 Year Olds | 15 (42.9%) | 20 (57.1%) |
| 5 to 9 Year Old | 209 (82.3%) | 45 (17.7%) |
| 10 to 14 Year Olds | 290 (83.6%) | 57 (16.4%) |
| 15 to 17 Year Olds | 148 (86.1%) | 24 (14.0%) |
| 18 to 19 Year Olds | 65 (57.5%) | 48 (42.5%) |
| 20 to 24 Year Olds | 56 (84.9%) | 10 (15.1%) |
| 25 to 34 Year Olds | 49 (45.4%) | 59 (54.6%) |
| 35 Years and over | 60 (72.3%) | 23 (27.7%) |
| Total | 892 (75.7%) | 286 (24.3%) |
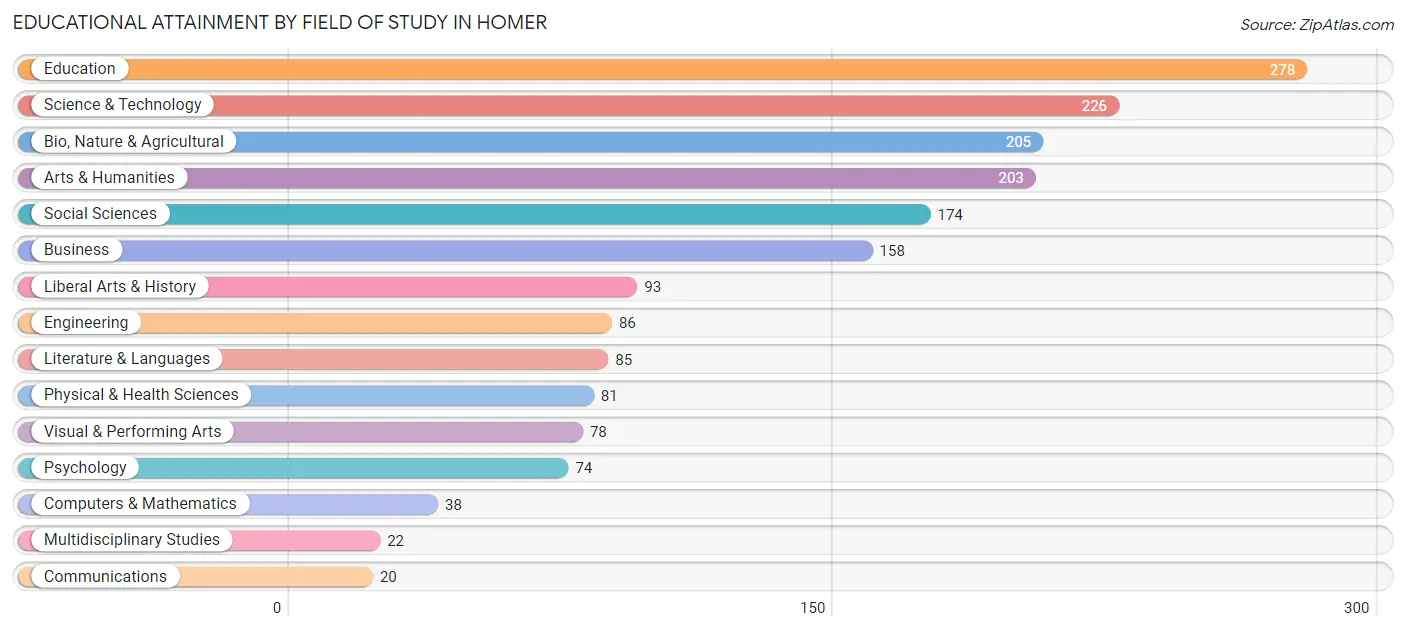
Educational Attainment by Field of Study in Homer
Education (278 | 15.3%), science & technology (226 | 12.4%), bio, nature & agricultural (205 | 11.3%), arts & humanities (203 | 11.2%), and social sciences (174 | 9.6%) are the most common fields of study among 1,821 individuals in Homer who have obtained a bachelor's degree or higher.
| Field of Study | # Graduates | % Graduates |
| Computers & Mathematics | 38 | 2.1% |
| Bio, Nature & Agricultural | 205 | 11.3% |
| Physical & Health Sciences | 81 | 4.4% |
| Psychology | 74 | 4.1% |
| Social Sciences | 174 | 9.6% |
| Engineering | 86 | 4.7% |
| Multidisciplinary Studies | 22 | 1.2% |
| Science & Technology | 226 | 12.4% |
| Business | 158 | 8.7% |
| Education | 278 | 15.3% |
| Literature & Languages | 85 | 4.7% |
| Liberal Arts & History | 93 | 5.1% |
| Visual & Performing Arts | 78 | 4.3% |
| Communications | 20 | 1.1% |
| Arts & Humanities | 203 | 11.2% |
| Total | 1,821 | 100.0% |
Transportation & Commute in Homer
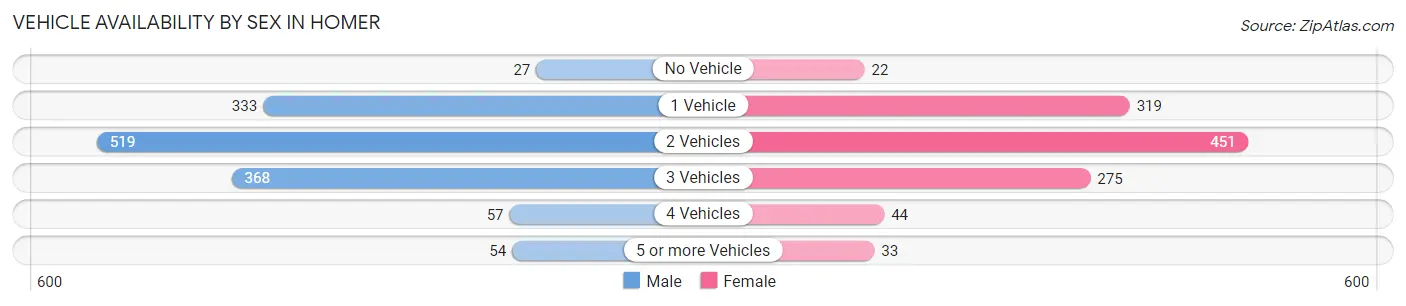
Vehicle Availability by Sex in Homer
The most prevalent vehicle ownership categories in Homer are males with 2 vehicles (519, accounting for 38.2%) and females with 2 vehicles (451, making up 45.4%).
| Vehicles Available | Male | Female |
| No Vehicle | 27 (2.0%) | 22 (1.9%) |
| 1 Vehicle | 333 (24.5%) | 319 (27.9%) |
| 2 Vehicles | 519 (38.2%) | 451 (39.4%) |
| 3 Vehicles | 368 (27.1%) | 275 (24.0%) |
| 4 Vehicles | 57 (4.2%) | 44 (3.8%) |
| 5 or more Vehicles | 54 (4.0%) | 33 (2.9%) |
| Total | 1,358 (100.0%) | 1,144 (100.0%) |
Commute Time in Homer
The most frequently occuring commute durations in Homer are 5 to 9 minutes (764 commuters, 34.1%), 10 to 14 minutes (501 commuters, 22.3%), and 15 to 19 minutes (346 commuters, 15.4%).
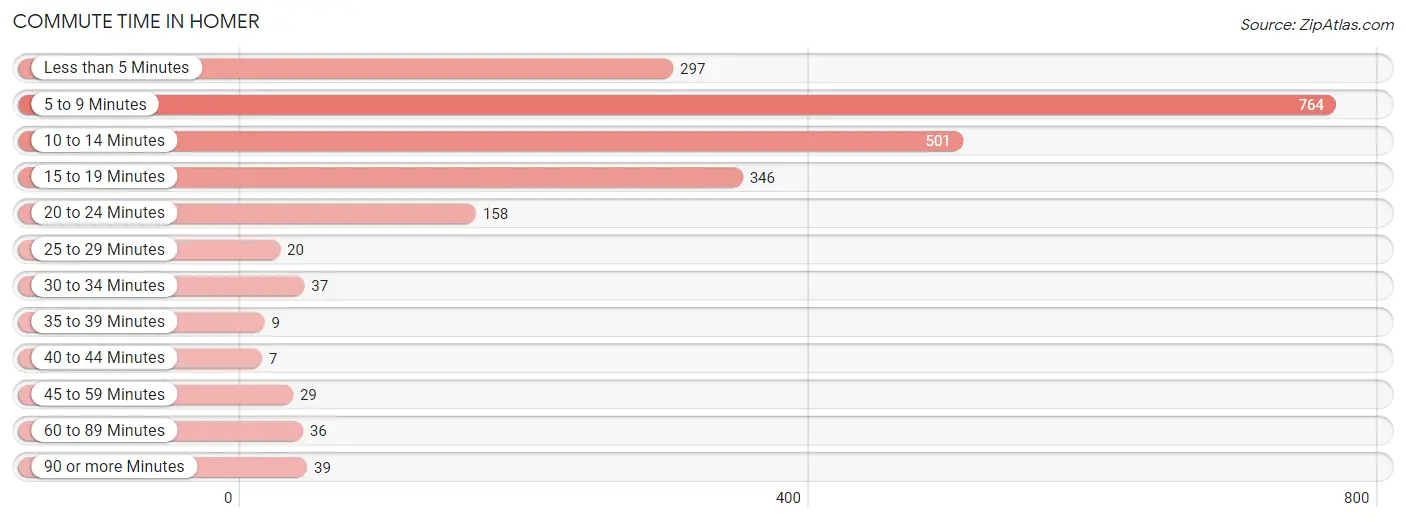
| Commute Time | # Commuters | % Commuters |
| Less than 5 Minutes | 297 | 13.2% |
| 5 to 9 Minutes | 764 | 34.1% |
| 10 to 14 Minutes | 501 | 22.3% |
| 15 to 19 Minutes | 346 | 15.4% |
| 20 to 24 Minutes | 158 | 7.0% |
| 25 to 29 Minutes | 20 | 0.9% |
| 30 to 34 Minutes | 37 | 1.7% |
| 35 to 39 Minutes | 9 | 0.4% |
| 40 to 44 Minutes | 7 | 0.3% |
| 45 to 59 Minutes | 29 | 1.3% |
| 60 to 89 Minutes | 36 | 1.6% |
| 90 or more Minutes | 39 | 1.7% |
Commute Time by Sex in Homer
The most common commute times in Homer are 5 to 9 minutes (384 commuters, 30.9%) for males and 5 to 9 minutes (380 commuters, 37.9%) for females.
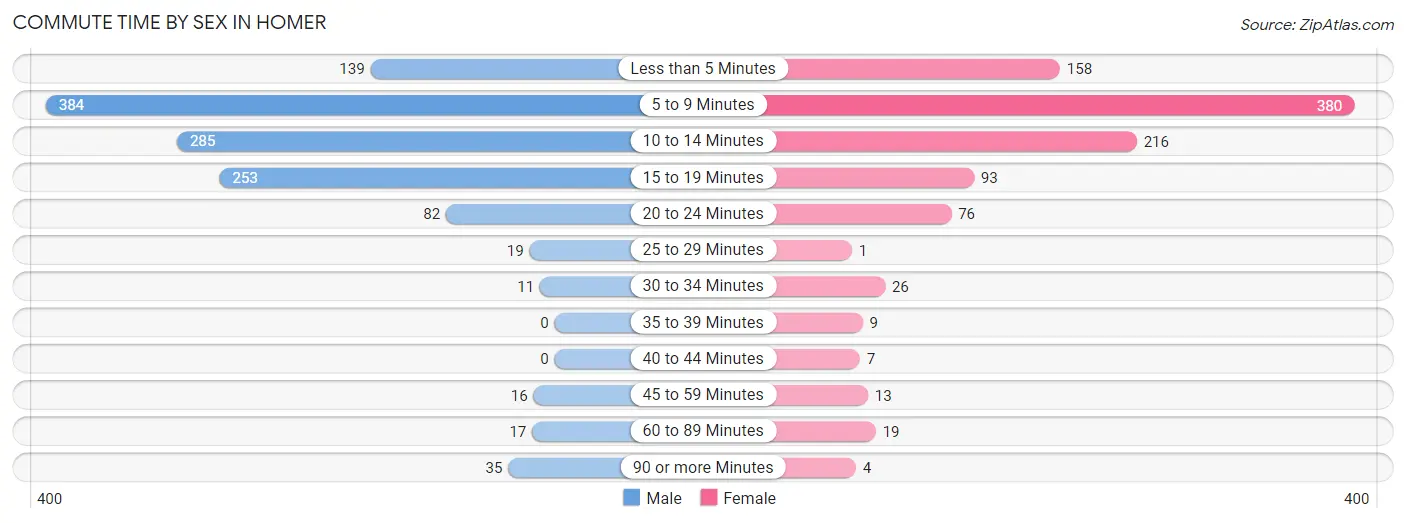
| Commute Time | Male | Female |
| Less than 5 Minutes | 139 (11.2%) | 158 (15.8%) |
| 5 to 9 Minutes | 384 (30.9%) | 380 (37.9%) |
| 10 to 14 Minutes | 285 (23.0%) | 216 (21.6%) |
| 15 to 19 Minutes | 253 (20.4%) | 93 (9.3%) |
| 20 to 24 Minutes | 82 (6.6%) | 76 (7.6%) |
| 25 to 29 Minutes | 19 (1.5%) | 1 (0.1%) |
| 30 to 34 Minutes | 11 (0.9%) | 26 (2.6%) |
| 35 to 39 Minutes | 0 (0.0%) | 9 (0.9%) |
| 40 to 44 Minutes | 0 (0.0%) | 7 (0.7%) |
| 45 to 59 Minutes | 16 (1.3%) | 13 (1.3%) |
| 60 to 89 Minutes | 17 (1.4%) | 19 (1.9%) |
| 90 or more Minutes | 35 (2.8%) | 4 (0.4%) |
Time of Departure to Work by Sex in Homer
The most frequent times of departure to work in Homer are 7:30 AM to 7:59 AM (240, 19.3%) for males and 8:30 AM to 8:59 AM (184, 18.4%) for females.
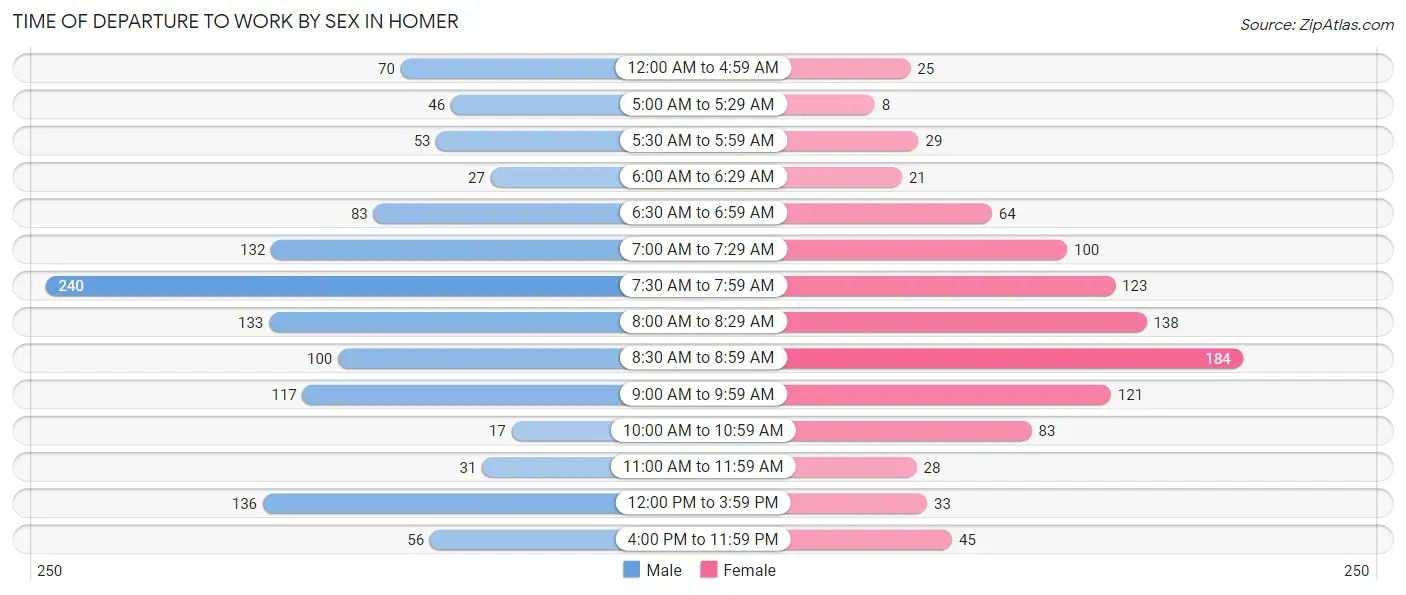
| Time of Departure | Male | Female |
| 12:00 AM to 4:59 AM | 70 (5.6%) | 25 (2.5%) |
| 5:00 AM to 5:29 AM | 46 (3.7%) | 8 (0.8%) |
| 5:30 AM to 5:59 AM | 53 (4.3%) | 29 (2.9%) |
| 6:00 AM to 6:29 AM | 27 (2.2%) | 21 (2.1%) |
| 6:30 AM to 6:59 AM | 83 (6.7%) | 64 (6.4%) |
| 7:00 AM to 7:29 AM | 132 (10.6%) | 100 (10.0%) |
| 7:30 AM to 7:59 AM | 240 (19.3%) | 123 (12.3%) |
| 8:00 AM to 8:29 AM | 133 (10.7%) | 138 (13.8%) |
| 8:30 AM to 8:59 AM | 100 (8.1%) | 184 (18.4%) |
| 9:00 AM to 9:59 AM | 117 (9.4%) | 121 (12.1%) |
| 10:00 AM to 10:59 AM | 17 (1.4%) | 83 (8.3%) |
| 11:00 AM to 11:59 AM | 31 (2.5%) | 28 (2.8%) |
| 12:00 PM to 3:59 PM | 136 (11.0%) | 33 (3.3%) |
| 4:00 PM to 11:59 PM | 56 (4.5%) | 45 (4.5%) |
| Total | 1,241 (100.0%) | 1,002 (100.0%) |
Housing Occupancy in Homer
Occupancy by Ownership in Homer
Of the total 2,352 dwellings in Homer, owner-occupied units account for 1,608 (68.4%), while renter-occupied units make up 744 (31.6%).
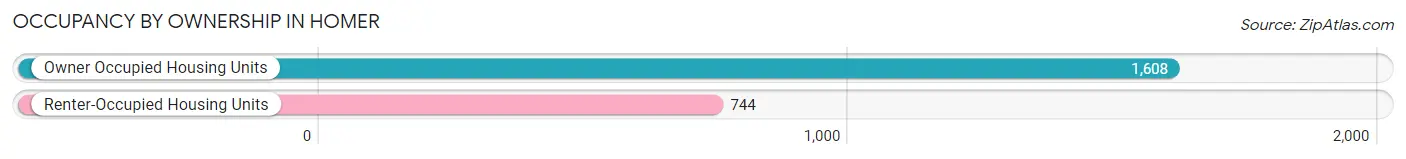
| Occupancy | # Housing Units | % Housing Units |
| Owner Occupied Housing Units | 1,608 | 68.4% |
| Renter-Occupied Housing Units | 744 | 31.6% |
| Total Occupied Housing Units | 2,352 | 100.0% |
Occupancy by Household Size in Homer
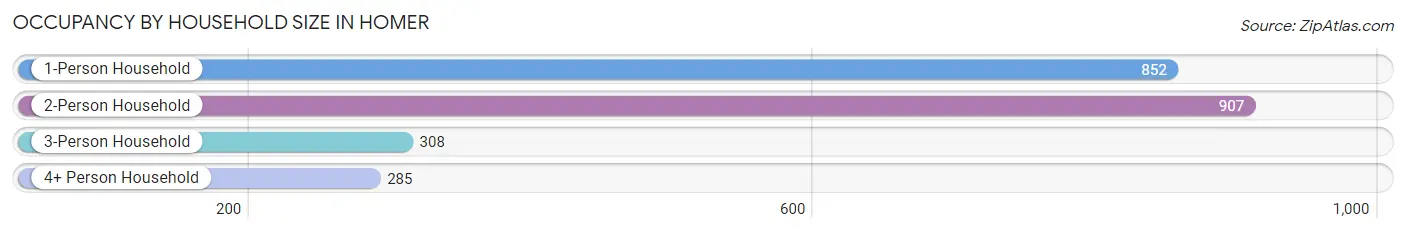
| Household Size | # Housing Units | % Housing Units |
| 1-Person Household | 852 | 36.2% |
| 2-Person Household | 907 | 38.6% |
| 3-Person Household | 308 | 13.1% |
| 4+ Person Household | 285 | 12.1% |
| Total Housing Units | 2,352 | 100.0% |
Occupancy by Ownership by Household Size in Homer
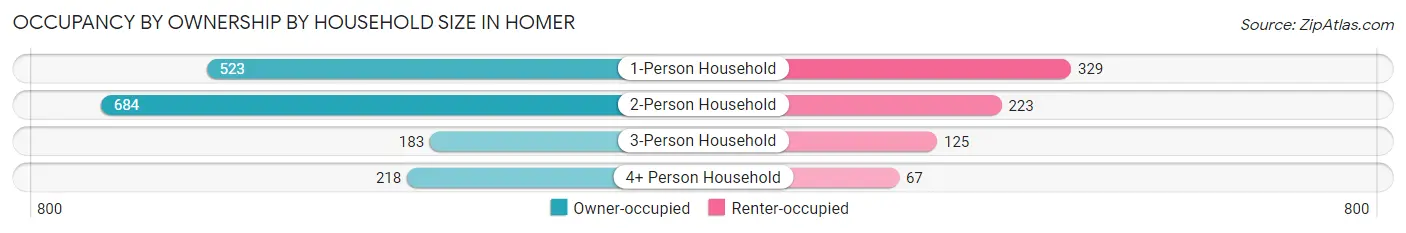
| Household Size | Owner-occupied | Renter-occupied |
| 1-Person Household | 523 (61.4%) | 329 (38.6%) |
| 2-Person Household | 684 (75.4%) | 223 (24.6%) |
| 3-Person Household | 183 (59.4%) | 125 (40.6%) |
| 4+ Person Household | 218 (76.5%) | 67 (23.5%) |
| Total Housing Units | 1,608 (68.4%) | 744 (31.6%) |
Occupancy by Educational Attainment in Homer
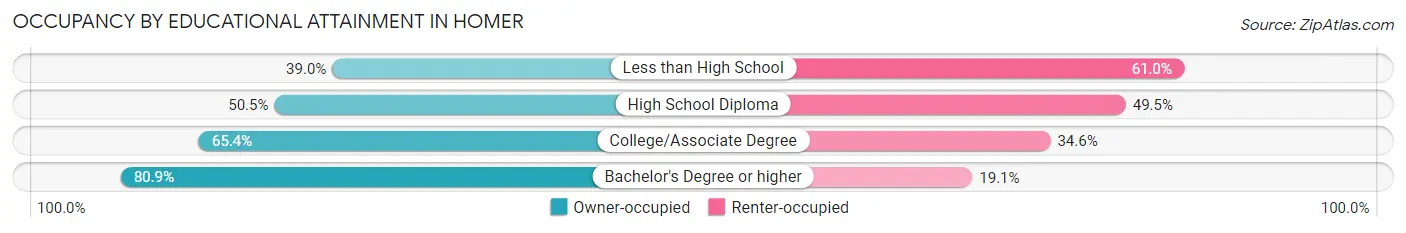
| Household Size | Owner-occupied | Renter-occupied |
| Less than High School | 32 (39.0%) | 50 (61.0%) |
| High School Diploma | 202 (50.5%) | 198 (49.5%) |
| College/Associate Degree | 589 (65.4%) | 311 (34.6%) |
| Bachelor's Degree or higher | 785 (80.9%) | 185 (19.1%) |
Occupancy by Age of Householder in Homer
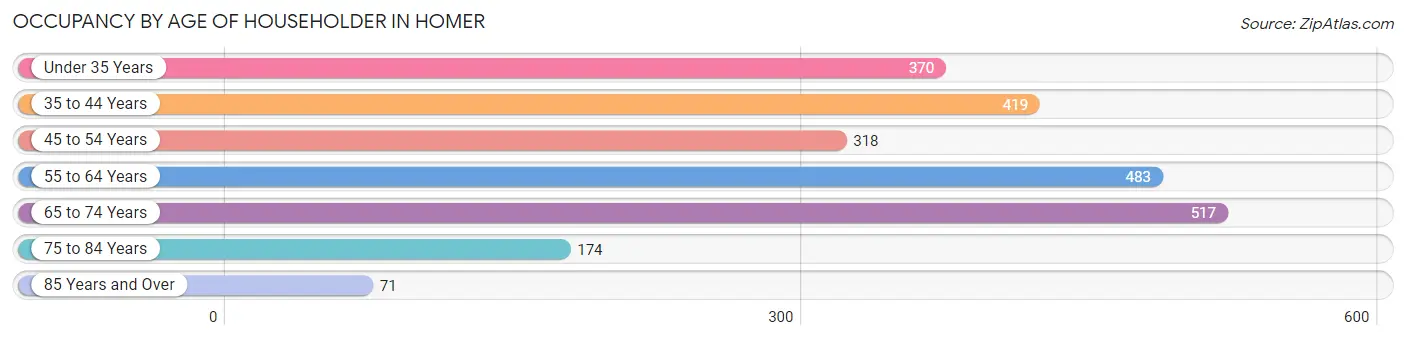
| Age Bracket | # Households | % Households |
| Under 35 Years | 370 | 15.7% |
| 35 to 44 Years | 419 | 17.8% |
| 45 to 54 Years | 318 | 13.5% |
| 55 to 64 Years | 483 | 20.5% |
| 65 to 74 Years | 517 | 22.0% |
| 75 to 84 Years | 174 | 7.4% |
| 85 Years and Over | 71 | 3.0% |
| Total | 2,352 | 100.0% |
Housing Finances in Homer
Median Income by Occupancy in Homer
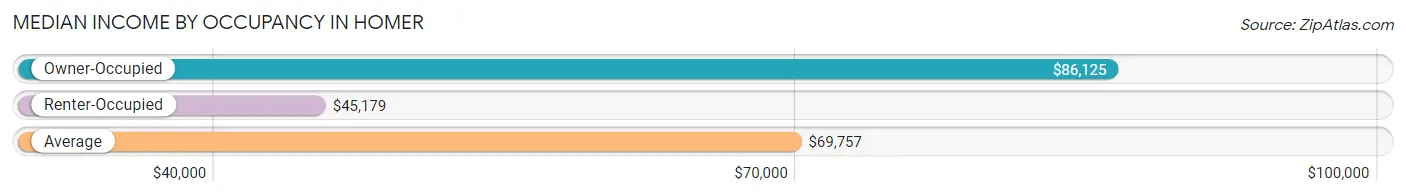
| Occupancy Type | # Households | Median Income |
| Owner-Occupied | 1,608 (68.4%) | $86,125 |
| Renter-Occupied | 744 (31.6%) | $45,179 |
| Average | 2,352 (100.0%) | $69,757 |
Occupancy by Householder Income Bracket in Homer
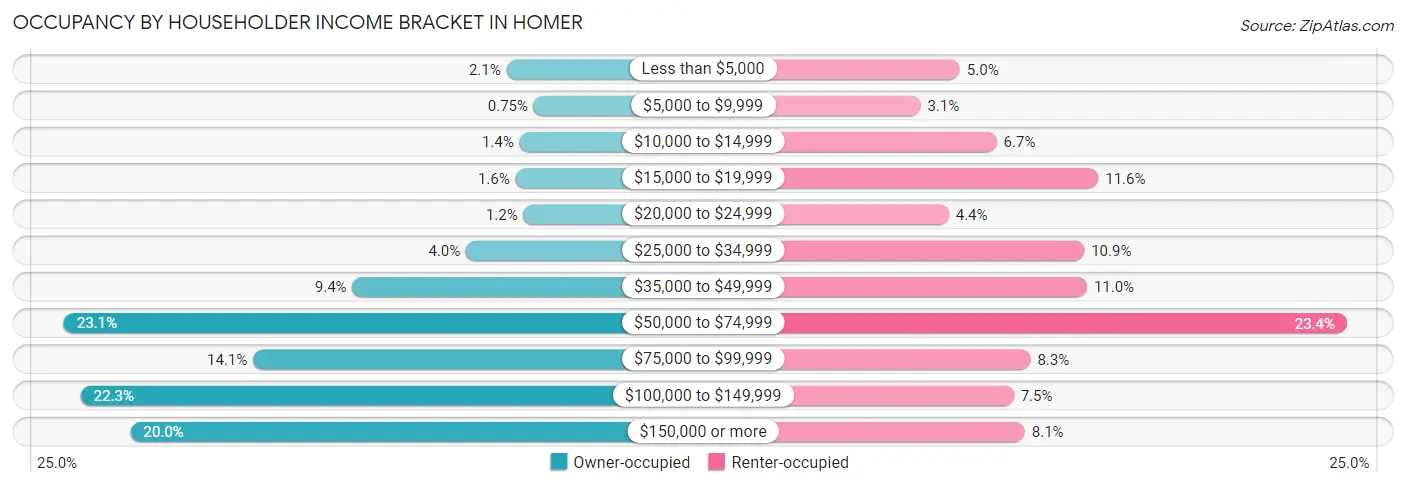
| Income Bracket | Owner-occupied | Renter-occupied |
| Less than $5,000 | 33 (2.1%) | 37 (5.0%) |
| $5,000 to $9,999 | 12 (0.7%) | 23 (3.1%) |
| $10,000 to $14,999 | 23 (1.4%) | 50 (6.7%) |
| $15,000 to $19,999 | 26 (1.6%) | 86 (11.6%) |
| $20,000 to $24,999 | 20 (1.2%) | 33 (4.4%) |
| $25,000 to $34,999 | 64 (4.0%) | 81 (10.9%) |
| $35,000 to $49,999 | 151 (9.4%) | 82 (11.0%) |
| $50,000 to $74,999 | 372 (23.1%) | 174 (23.4%) |
| $75,000 to $99,999 | 227 (14.1%) | 62 (8.3%) |
| $100,000 to $149,999 | 359 (22.3%) | 56 (7.5%) |
| $150,000 or more | 321 (20.0%) | 60 (8.1%) |
| Total | 1,608 (100.0%) | 744 (100.0%) |
Monthly Housing Cost Tiers in Homer
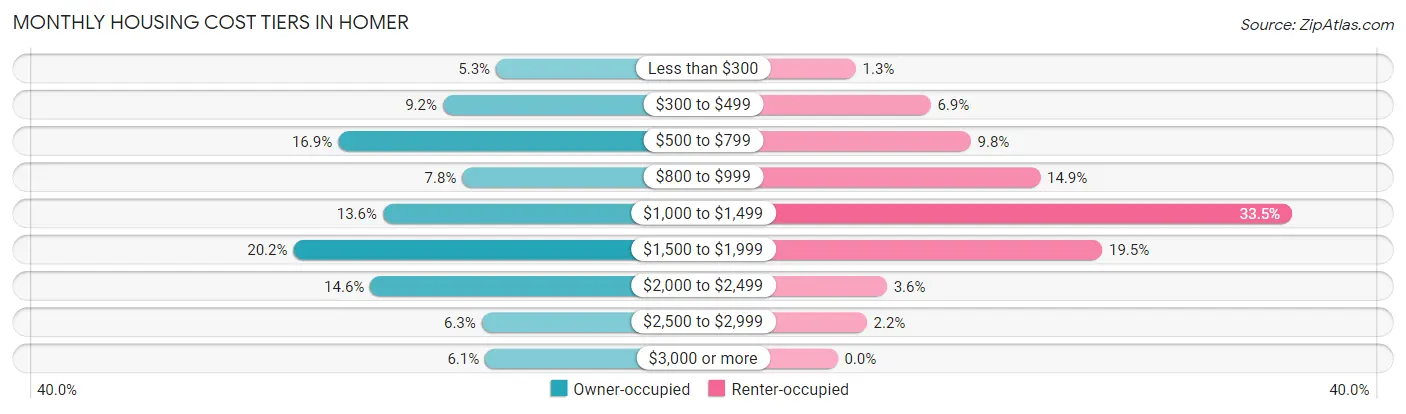
| Monthly Cost | Owner-occupied | Renter-occupied |
| Less than $300 | 85 (5.3%) | 10 (1.3%) |
| $300 to $499 | 148 (9.2%) | 51 (6.9%) |
| $500 to $799 | 272 (16.9%) | 73 (9.8%) |
| $800 to $999 | 125 (7.8%) | 111 (14.9%) |
| $1,000 to $1,499 | 219 (13.6%) | 249 (33.5%) |
| $1,500 to $1,999 | 325 (20.2%) | 145 (19.5%) |
| $2,000 to $2,499 | 234 (14.5%) | 27 (3.6%) |
| $2,500 to $2,999 | 102 (6.3%) | 16 (2.1%) |
| $3,000 or more | 98 (6.1%) | 0 (0.0%) |
| Total | 1,608 (100.0%) | 744 (100.0%) |
Physical Housing Characteristics in Homer
Housing Structures in Homer
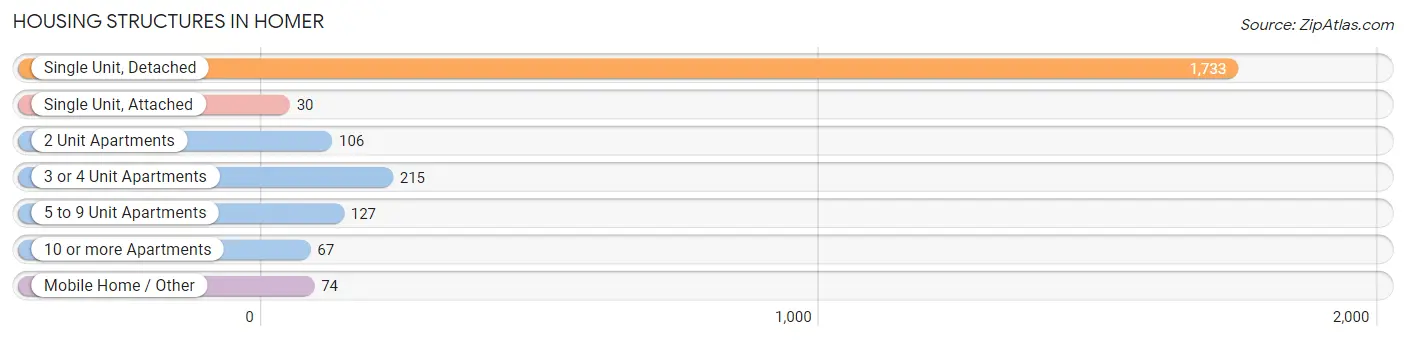
| Structure Type | # Housing Units | % Housing Units |
| Single Unit, Detached | 1,733 | 73.7% |
| Single Unit, Attached | 30 | 1.3% |
| 2 Unit Apartments | 106 | 4.5% |
| 3 or 4 Unit Apartments | 215 | 9.1% |
| 5 to 9 Unit Apartments | 127 | 5.4% |
| 10 or more Apartments | 67 | 2.9% |
| Mobile Home / Other | 74 | 3.2% |
| Total | 2,352 | 100.0% |
Housing Structures by Occupancy in Homer
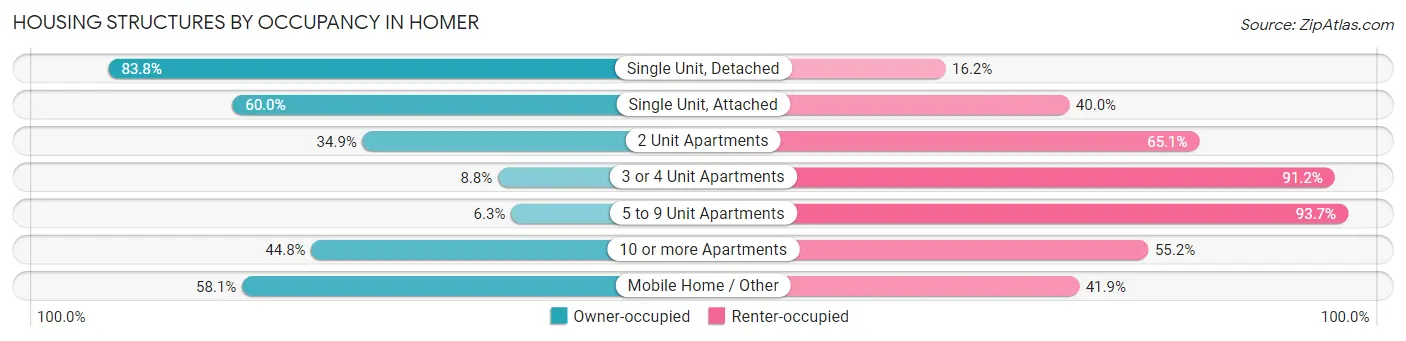
| Structure Type | Owner-occupied | Renter-occupied |
| Single Unit, Detached | 1,453 (83.8%) | 280 (16.2%) |
| Single Unit, Attached | 18 (60.0%) | 12 (40.0%) |
| 2 Unit Apartments | 37 (34.9%) | 69 (65.1%) |
| 3 or 4 Unit Apartments | 19 (8.8%) | 196 (91.2%) |
| 5 to 9 Unit Apartments | 8 (6.3%) | 119 (93.7%) |
| 10 or more Apartments | 30 (44.8%) | 37 (55.2%) |
| Mobile Home / Other | 43 (58.1%) | 31 (41.9%) |
| Total | 1,608 (68.4%) | 744 (31.6%) |
Housing Structures by Number of Rooms in Homer
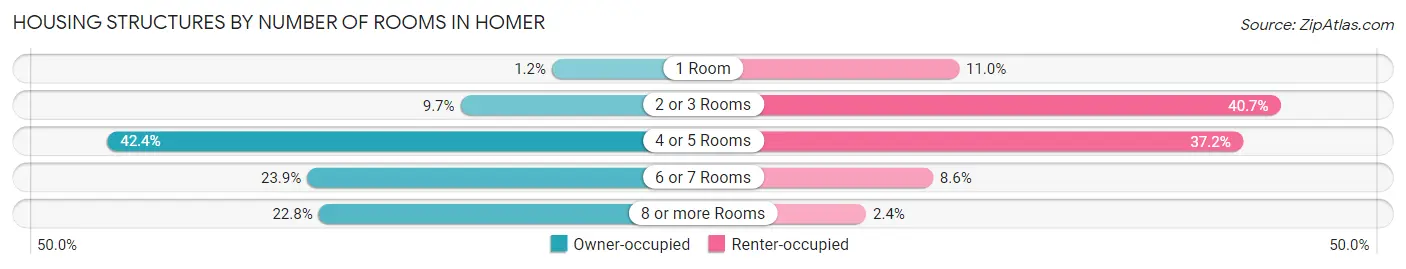
| Number of Rooms | Owner-occupied | Renter-occupied |
| 1 Room | 20 (1.2%) | 82 (11.0%) |
| 2 or 3 Rooms | 156 (9.7%) | 303 (40.7%) |
| 4 or 5 Rooms | 681 (42.3%) | 277 (37.2%) |
| 6 or 7 Rooms | 384 (23.9%) | 64 (8.6%) |
| 8 or more Rooms | 367 (22.8%) | 18 (2.4%) |
| Total | 1,608 (100.0%) | 744 (100.0%) |
Housing Structure by Heating Type in Homer
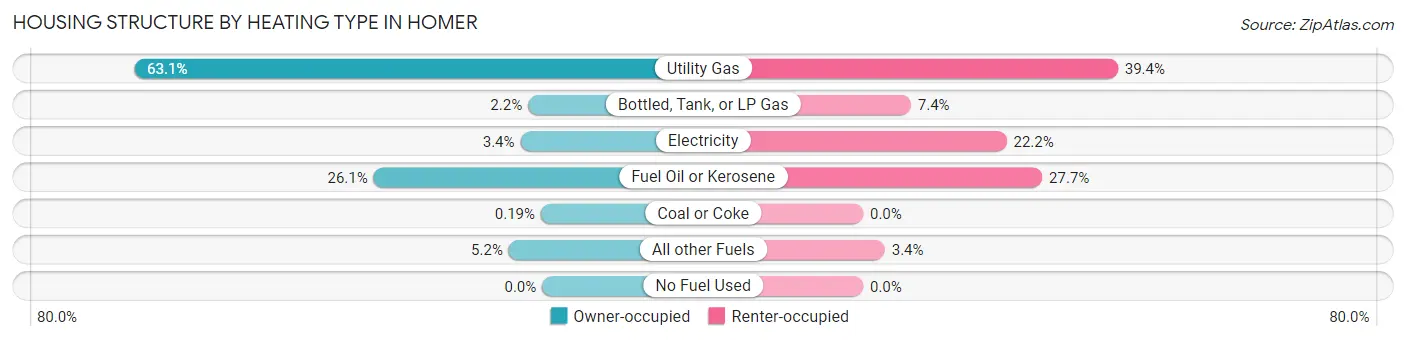
| Heating Type | Owner-occupied | Renter-occupied |
| Utility Gas | 1,014 (63.1%) | 293 (39.4%) |
| Bottled, Tank, or LP Gas | 35 (2.2%) | 55 (7.4%) |
| Electricity | 54 (3.4%) | 165 (22.2%) |
| Fuel Oil or Kerosene | 419 (26.1%) | 206 (27.7%) |
| Coal or Coke | 3 (0.2%) | 0 (0.0%) |
| All other Fuels | 83 (5.2%) | 25 (3.4%) |
| No Fuel Used | 0 (0.0%) | 0 (0.0%) |
| Total | 1,608 (100.0%) | 744 (100.0%) |
Household Vehicle Usage in Homer
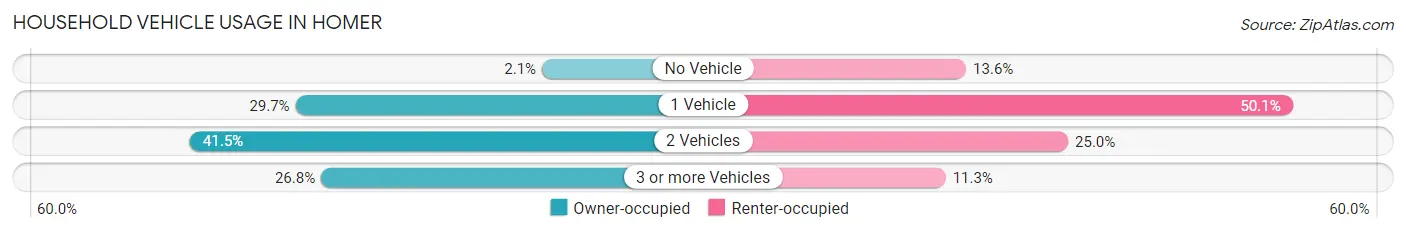
| Vehicles per Household | Owner-occupied | Renter-occupied |
| No Vehicle | 33 (2.1%) | 101 (13.6%) |
| 1 Vehicle | 477 (29.7%) | 373 (50.1%) |
| 2 Vehicles | 667 (41.5%) | 186 (25.0%) |
| 3 or more Vehicles | 431 (26.8%) | 84 (11.3%) |
| Total | 1,608 (100.0%) | 744 (100.0%) |
Real Estate & Mortgages in Homer
Real Estate and Mortgage Overview in Homer
| Characteristic | Without Mortgage | With Mortgage |
| Housing Units | 659 | 949 |
| Median Property Value | $371,500 | $340,300 |
| Median Household Income | $77,813 | $212 |
| Monthly Housing Costs | $632 | $98 |
| Real Estate Taxes | $2,231 | $50 |
Property Value by Mortgage Status in Homer
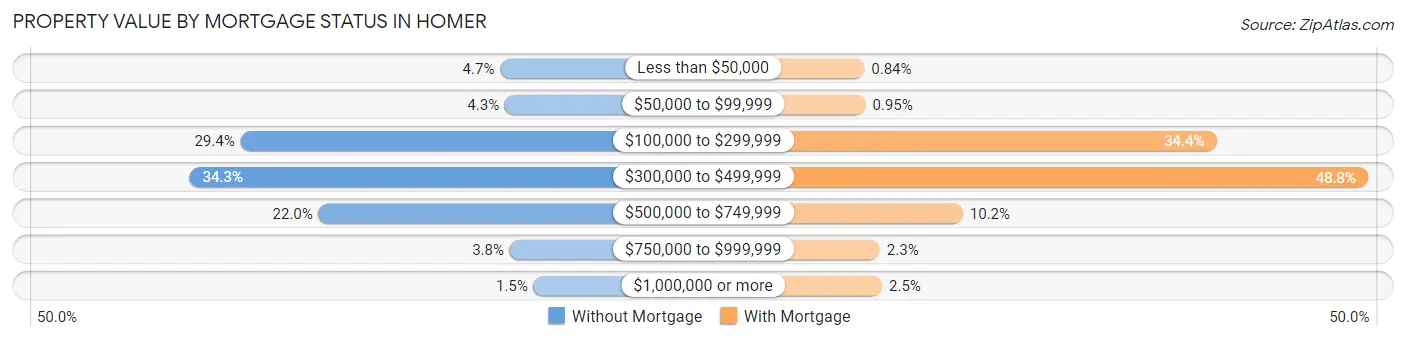
| Property Value | Without Mortgage | With Mortgage |
| Less than $50,000 | 31 (4.7%) | 8 (0.8%) |
| $50,000 to $99,999 | 28 (4.3%) | 9 (0.9%) |
| $100,000 to $299,999 | 194 (29.4%) | 326 (34.4%) |
| $300,000 to $499,999 | 226 (34.3%) | 463 (48.8%) |
| $500,000 to $749,999 | 145 (22.0%) | 97 (10.2%) |
| $750,000 to $999,999 | 25 (3.8%) | 22 (2.3%) |
| $1,000,000 or more | 10 (1.5%) | 24 (2.5%) |
| Total | 659 (100.0%) | 949 (100.0%) |
Household Income by Mortgage Status in Homer
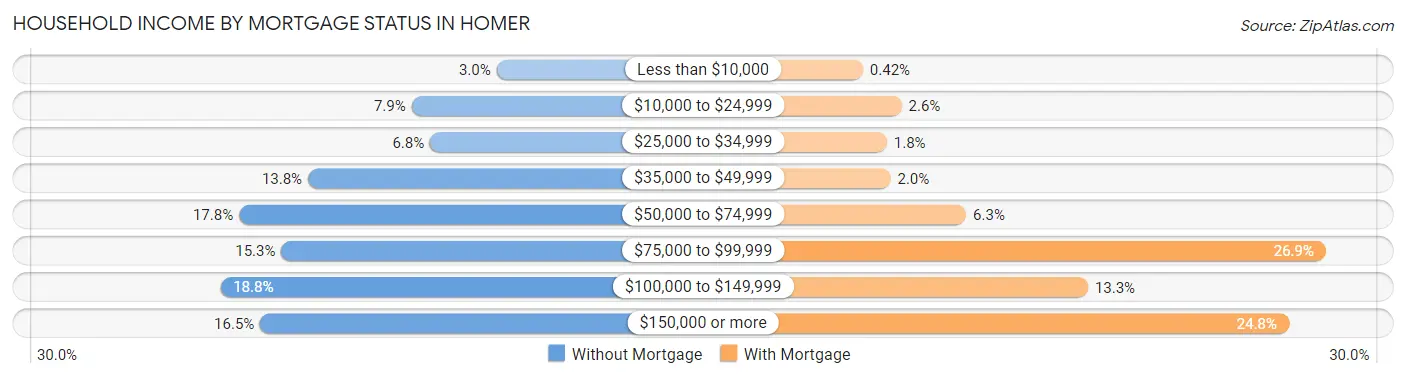
| Household Income | Without Mortgage | With Mortgage |
| Less than $10,000 | 20 (3.0%) | 4 (0.4%) |
| $10,000 to $24,999 | 52 (7.9%) | 25 (2.6%) |
| $25,000 to $34,999 | 45 (6.8%) | 17 (1.8%) |
| $35,000 to $49,999 | 91 (13.8%) | 19 (2.0%) |
| $50,000 to $74,999 | 117 (17.7%) | 60 (6.3%) |
| $75,000 to $99,999 | 101 (15.3%) | 255 (26.9%) |
| $100,000 to $149,999 | 124 (18.8%) | 126 (13.3%) |
| $150,000 or more | 109 (16.5%) | 235 (24.8%) |
| Total | 659 (100.0%) | 949 (100.0%) |
Property Value to Household Income Ratio in Homer
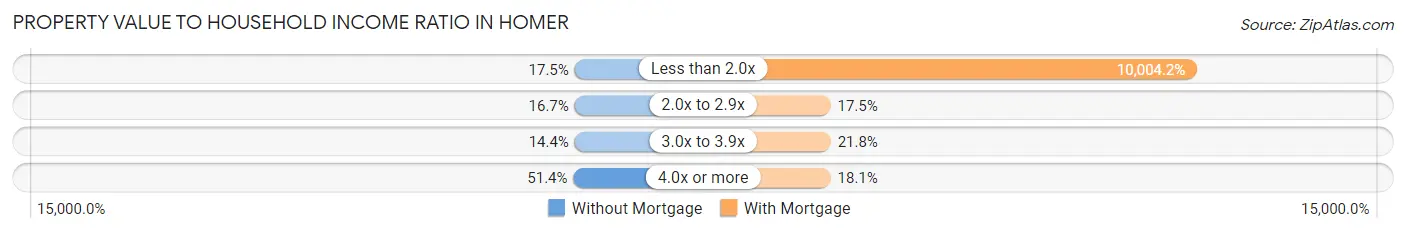
| Value-to-Income Ratio | Without Mortgage | With Mortgage |
| Less than 2.0x | 115 (17.4%) | 94,940 (10,004.2%) |
| 2.0x to 2.9x | 110 (16.7%) | 166 (17.5%) |
| 3.0x to 3.9x | 95 (14.4%) | 207 (21.8%) |
| 4.0x or more | 339 (51.4%) | 172 (18.1%) |
| Total | 659 (100.0%) | 949 (100.0%) |
Real Estate Taxes by Mortgage Status in Homer
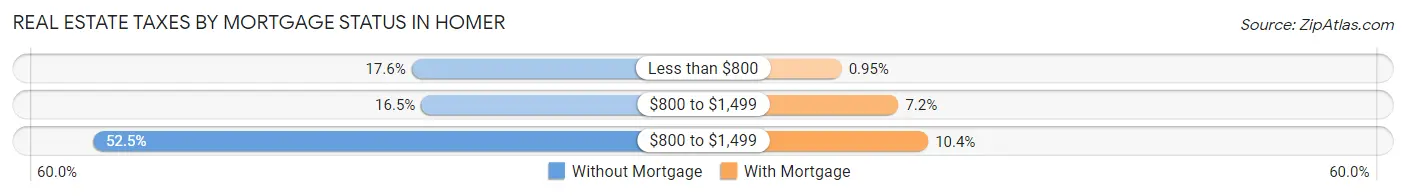
| Property Taxes | Without Mortgage | With Mortgage |
| Less than $800 | 116 (17.6%) | 9 (0.9%) |
| $800 to $1,499 | 109 (16.5%) | 68 (7.2%) |
| $800 to $1,499 | 346 (52.5%) | 99 (10.4%) |
| Total | 659 (100.0%) | 949 (100.0%) |
Health & Disability in Homer
Health Insurance Coverage by Age in Homer
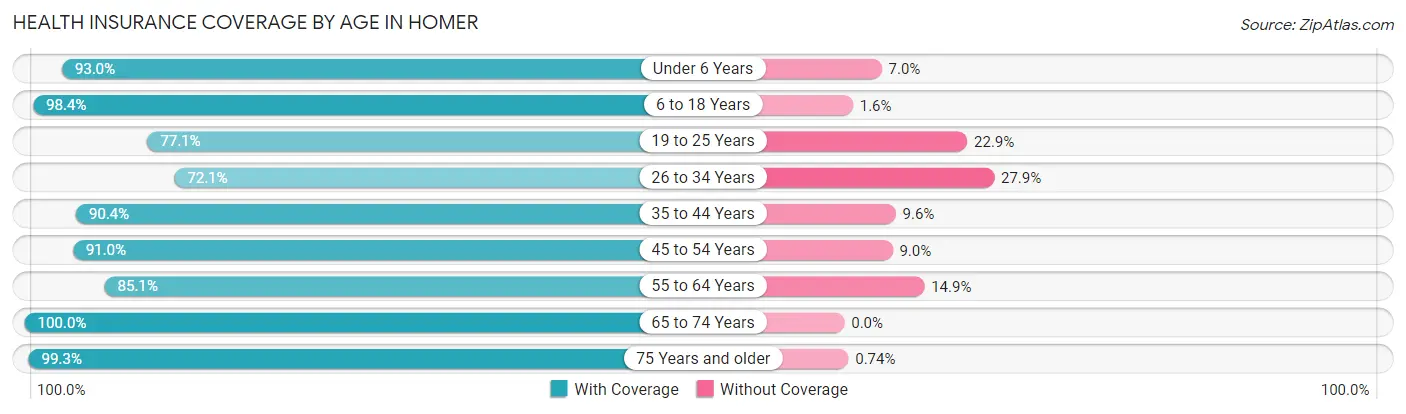
| Age Bracket | With Coverage | Without Coverage |
| Under 6 Years | 294 (93.0%) | 22 (7.0%) |
| 6 to 18 Years | 810 (98.4%) | 13 (1.6%) |
| 19 to 25 Years | 340 (77.1%) | 101 (22.9%) |
| 26 to 34 Years | 467 (72.1%) | 181 (27.9%) |
| 35 to 44 Years | 680 (90.4%) | 72 (9.6%) |
| 45 to 54 Years | 466 (91.0%) | 46 (9.0%) |
| 55 to 64 Years | 685 (85.1%) | 120 (14.9%) |
| 65 to 74 Years | 805 (100.0%) | 0 (0.0%) |
| 75 Years and older | 400 (99.3%) | 3 (0.7%) |
| Total | 4,947 (89.9%) | 558 (10.1%) |
Health Insurance Coverage by Citizenship Status in Homer
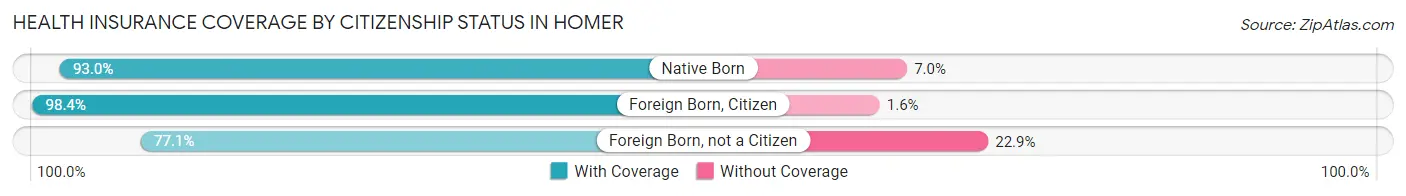
| Citizenship Status | With Coverage | Without Coverage |
| Native Born | 294 (93.0%) | 22 (7.0%) |
| Foreign Born, Citizen | 810 (98.4%) | 13 (1.6%) |
| Foreign Born, not a Citizen | 340 (77.1%) | 101 (22.9%) |
Health Insurance Coverage by Household Income in Homer
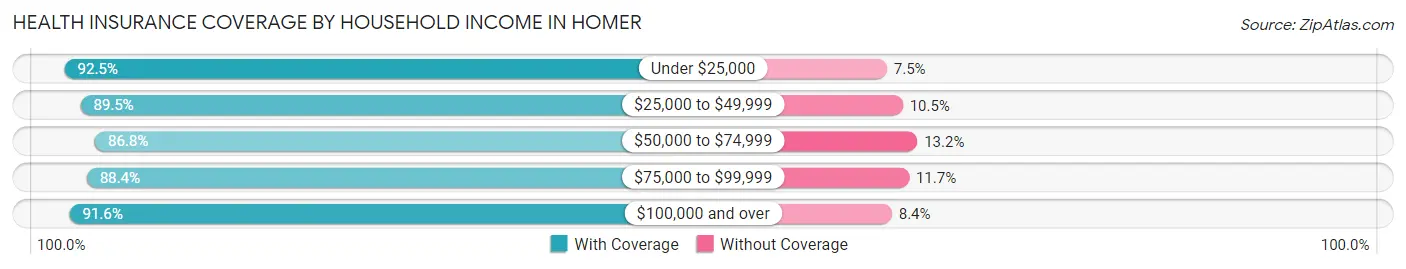
| Household Income | With Coverage | Without Coverage |
| Under $25,000 | 543 (92.5%) | 44 (7.5%) |
| $25,000 to $49,999 | 667 (89.5%) | 78 (10.5%) |
| $50,000 to $74,999 | 901 (86.8%) | 137 (13.2%) |
| $75,000 to $99,999 | 599 (88.3%) | 79 (11.7%) |
| $100,000 and over | 2,162 (91.6%) | 199 (8.4%) |
Public vs Private Health Insurance Coverage by Age in Homer
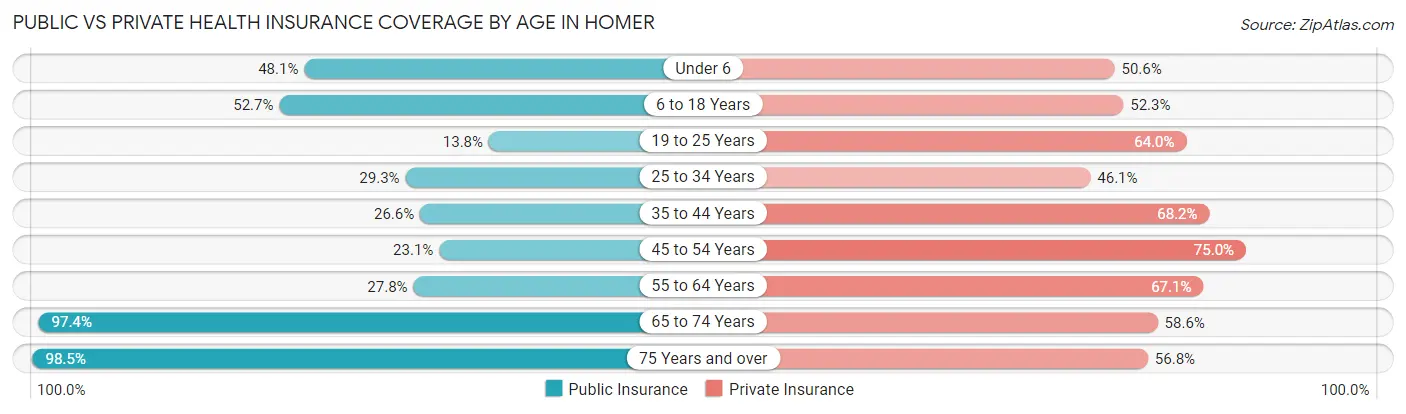
| Age Bracket | Public Insurance | Private Insurance |
| Under 6 | 152 (48.1%) | 160 (50.6%) |
| 6 to 18 Years | 434 (52.7%) | 430 (52.2%) |
| 19 to 25 Years | 61 (13.8%) | 282 (63.9%) |
| 25 to 34 Years | 190 (29.3%) | 299 (46.1%) |
| 35 to 44 Years | 200 (26.6%) | 513 (68.2%) |
| 45 to 54 Years | 118 (23.1%) | 384 (75.0%) |
| 55 to 64 Years | 224 (27.8%) | 540 (67.1%) |
| 65 to 74 Years | 784 (97.4%) | 472 (58.6%) |
| 75 Years and over | 397 (98.5%) | 229 (56.8%) |
| Total | 2,560 (46.5%) | 3,309 (60.1%) |
Disability Status by Sex by Age in Homer
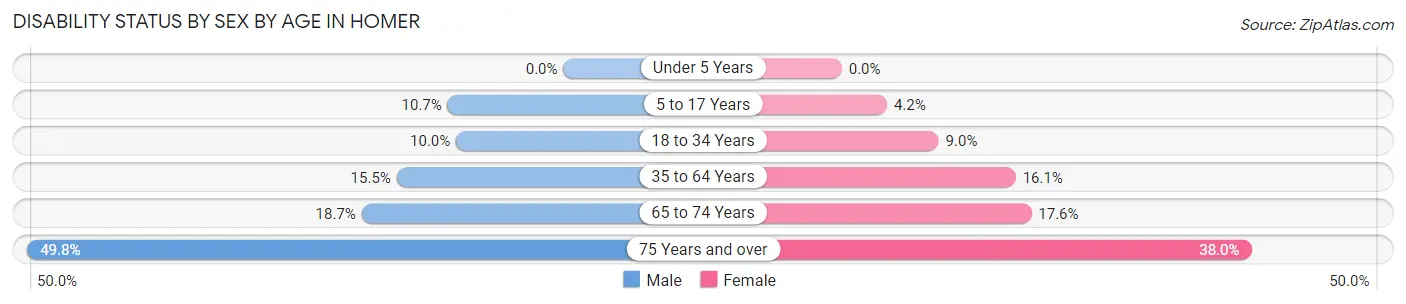
| Age Bracket | Male | Female |
| Under 5 Years | 0 (0.0%) | 0 (0.0%) |
| 5 to 17 Years | 45 (10.7%) | 16 (4.2%) |
| 18 to 34 Years | 63 (10.0%) | 48 (9.0%) |
| 35 to 64 Years | 159 (15.5%) | 168 (16.1%) |
| 65 to 74 Years | 73 (18.7%) | 73 (17.6%) |
| 75 Years and over | 101 (49.7%) | 76 (38.0%) |
Disability Class by Sex by Age in Homer
Disability Class: Hearing Difficulty
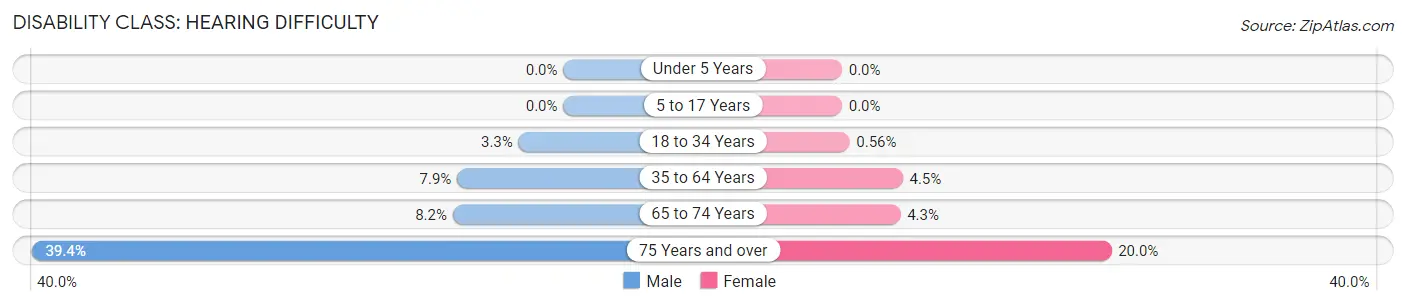
| Age Bracket | Male | Female |
| Under 5 Years | 0 (0.0%) | 0 (0.0%) |
| 5 to 17 Years | 0 (0.0%) | 0 (0.0%) |
| 18 to 34 Years | 21 (3.3%) | 3 (0.6%) |
| 35 to 64 Years | 81 (7.9%) | 47 (4.5%) |
| 65 to 74 Years | 32 (8.2%) | 18 (4.3%) |
| 75 Years and over | 80 (39.4%) | 40 (20.0%) |
Disability Class: Vision Difficulty
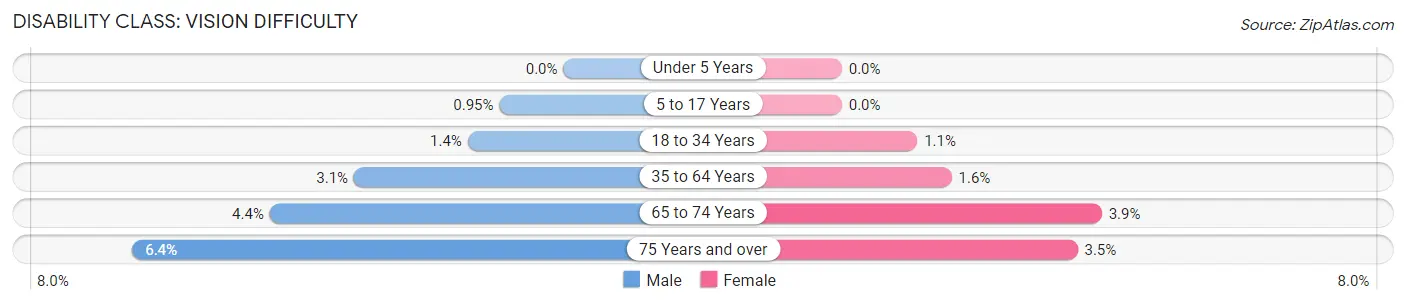
| Age Bracket | Male | Female |
| Under 5 Years | 0 (0.0%) | 0 (0.0%) |
| 5 to 17 Years | 4 (0.9%) | 0 (0.0%) |
| 18 to 34 Years | 9 (1.4%) | 6 (1.1%) |
| 35 to 64 Years | 32 (3.1%) | 17 (1.6%) |
| 65 to 74 Years | 17 (4.4%) | 16 (3.9%) |
| 75 Years and over | 13 (6.4%) | 7 (3.5%) |
Disability Class: Cognitive Difficulty
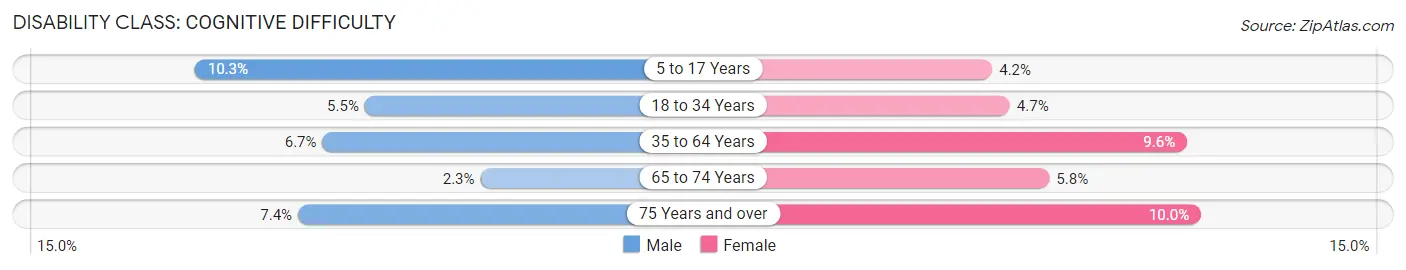
| Age Bracket | Male | Female |
| 5 to 17 Years | 43 (10.3%) | 16 (4.2%) |
| 18 to 34 Years | 35 (5.5%) | 25 (4.7%) |
| 35 to 64 Years | 69 (6.7%) | 100 (9.6%) |
| 65 to 74 Years | 9 (2.3%) | 24 (5.8%) |
| 75 Years and over | 15 (7.4%) | 20 (10.0%) |
Disability Class: Ambulatory Difficulty
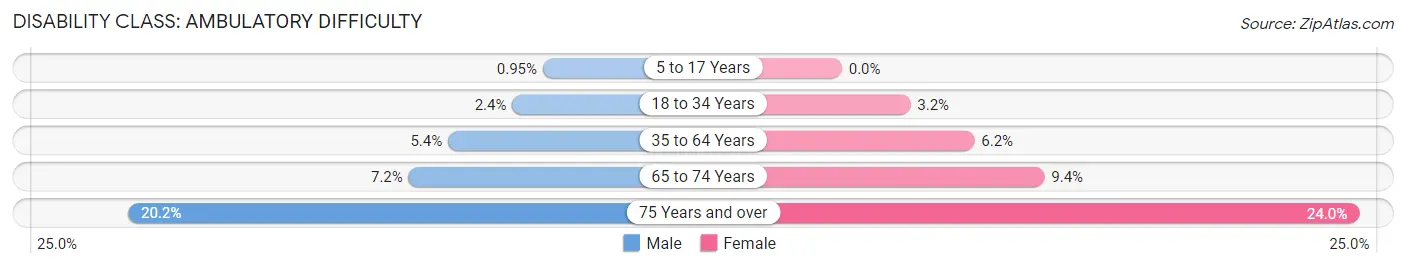
| Age Bracket | Male | Female |
| 5 to 17 Years | 4 (0.9%) | 0 (0.0%) |
| 18 to 34 Years | 15 (2.4%) | 17 (3.2%) |
| 35 to 64 Years | 55 (5.3%) | 64 (6.1%) |
| 65 to 74 Years | 28 (7.2%) | 39 (9.4%) |
| 75 Years and over | 41 (20.2%) | 48 (24.0%) |
Disability Class: Self-Care Difficulty
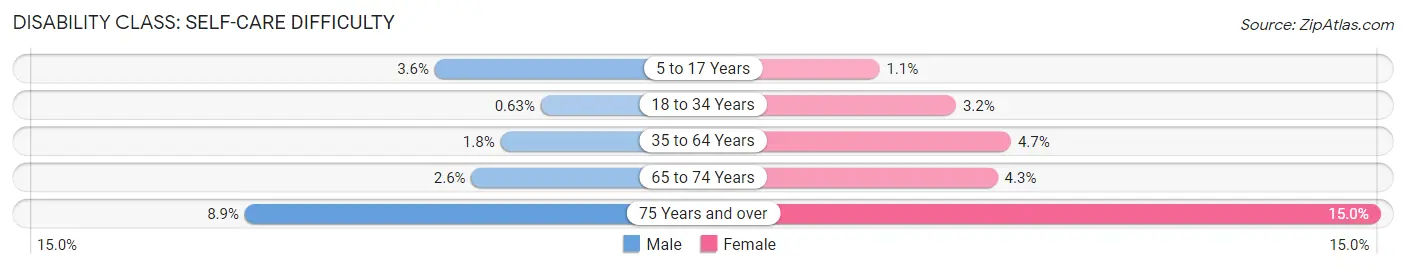
| Age Bracket | Male | Female |
| 5 to 17 Years | 15 (3.6%) | 4 (1.1%) |
| 18 to 34 Years | 4 (0.6%) | 17 (3.2%) |
| 35 to 64 Years | 18 (1.8%) | 49 (4.7%) |
| 65 to 74 Years | 10 (2.6%) | 18 (4.3%) |
| 75 Years and over | 18 (8.9%) | 30 (15.0%) |
Technology Access in Homer
Computing Device Access in Homer
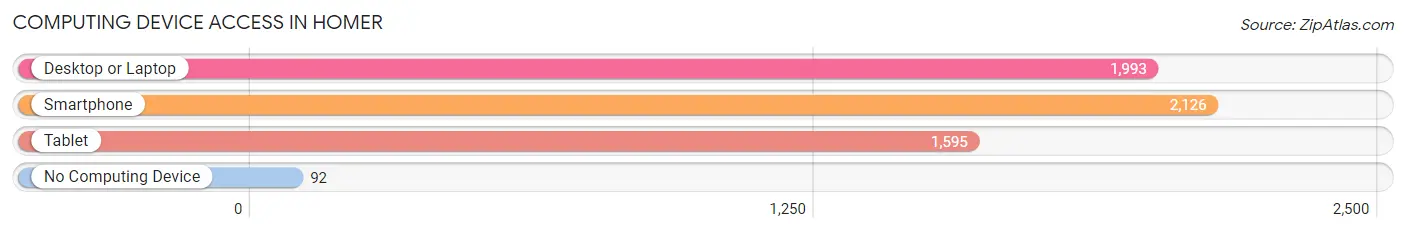
| Device Type | # Households | % Households |
| Desktop or Laptop | 1,993 | 84.7% |
| Smartphone | 2,126 | 90.4% |
| Tablet | 1,595 | 67.8% |
| No Computing Device | 92 | 3.9% |
| Total | 2,352 | 100.0% |
Internet Access in Homer
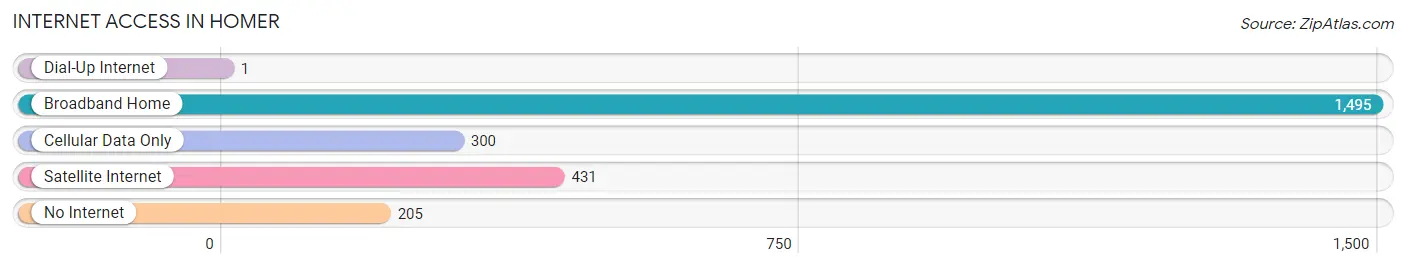
| Internet Type | # Households | % Households |
| Dial-Up Internet | 1 | 0.0% |
| Broadband Home | 1,495 | 63.6% |
| Cellular Data Only | 300 | 12.8% |
| Satellite Internet | 431 | 18.3% |
| No Internet | 205 | 8.7% |
| Total | 2,352 | 100.0% |
Homer Summary
Homer, Alaska is a small city located on the Kenai Peninsula in the south-central part of the state. It is situated on the shores of Kachemak Bay, an inlet of the Cook Inlet, and is surrounded by mountains and glaciers. The city is known for its stunning views of the bay and its surrounding landscape, as well as its vibrant arts and culture scene.
History
Homer was first settled in the late 1800s by Russian fur traders and gold miners. The city was officially incorporated in 1964 and has since grown to become the largest city on the Kenai Peninsula. The city was named after Homer Pennock, a gold prospector who discovered gold in the area in 1896.
Geography
Homer is located on the western shore of Kachemak Bay, an inlet of the Cook Inlet. The city is surrounded by mountains and glaciers, including the Kenai Mountains to the east and the Chugach Mountains to the west. The city is also home to several glaciers, including the Homer Glacier, the Grewingk Glacier, and the Beluga Glacier.
The city has a total area of 8.3 square miles, of which 7.9 square miles is land and 0.4 square miles is water. The city is located at an elevation of approximately 40 feet above sea level.
Economy
Homer’s economy is largely based on fishing, tourism, and the oil and gas industry. The city is home to several seafood processing plants, as well as a number of charter fishing businesses. Tourism is also an important part of the local economy, with visitors coming to the city to take advantage of its stunning views and outdoor activities.
The oil and gas industry is also a major contributor to the local economy. The city is home to several oil and gas companies, as well as a number of related businesses.
Demographics
As of the 2010 census, Homer had a population of 5,003. The racial makeup of the city was 87.3% White, 0.7% African American, 4.2% Native American, 0.7% Asian, 0.1% Pacific Islander, and 6.9% from other races. The median household income was $50,945, and the median family income was $60,945.
Homer is home to a diverse population, with a variety of cultures and backgrounds represented. The city is also home to a number of artists, writers, and musicians, as well as a vibrant arts and culture scene.
Conclusion
Homer, Alaska is a small city located on the Kenai Peninsula in the south-central part of the state. It is situated on the shores of Kachemak Bay, an inlet of the Cook Inlet, and is surrounded by mountains and glaciers. The city is known for its stunning views of the bay and its surrounding landscape, as well as its vibrant arts and culture scene. The city’s economy is largely based on fishing, tourism, and the oil and gas industry, and the city is home to a diverse population with a variety of cultures and backgrounds represented.
Common Questions
What is Per Capita Income in Homer?
Per Capita income in Homer is $42,604.
What is the Median Family Income in Homer?
Median Family Income in Homer is $96,923.
What is the Median Household income in Homer?
Median Household Income in Homer is $69,757.
What is Income or Wage Gap in Homer?
Income or Wage Gap in Homer is 34.8%.
Women in Homer earn 65.2 cents for every dollar earned by a man.
What is Family Income Deficit in Homer?
Family Income Deficit in Homer is $10,978.
Families that are below poverty line in Homer earn $10,978 less on average than the poverty threshold level.
What is Inequality or Gini Index in Homer?
Inequality or Gini Index in Homer is 0.45.
What is the Total Population of Homer?
Total Population of Homer is 5,623.
What is the Total Male Population of Homer?
Total Male Population of Homer is 2,880.
What is the Total Female Population of Homer?
Total Female Population of Homer is 2,743.
What is the Ratio of Males per 100 Females in Homer?
There are 104.99 Males per 100 Females in Homer.
What is the Ratio of Females per 100 Males in Homer?
There are 95.24 Females per 100 Males in Homer.
What is the Median Population Age in Homer?
Median Population Age in Homer is 40.8 Years.
What is the Average Family Size in Homer
Average Family Size in Homer is 3.0 People.
What is the Average Household Size in Homer
Average Household Size in Homer is 2.3 People.
How Large is the Labor Force in Homer?
There are 2,854 People in the Labor Forcein in Homer.
What is the Percentage of People in the Labor Force in Homer?
61.1% of People are in the Labor Force in Homer.
What is the Unemployment Rate in Homer?
Unemployment Rate in Homer is 9.0%.