Kenai, AK Map & Demographics
Kenai Map
Kenai Overview
$37,409
PER CAPITA INCOME
$89,688
AVG FAMILY INCOME
$77,335
AVG HOUSEHOLD INCOME
32.3%
WAGE / INCOME GAP [ % ]
67.7¢/ $1
WAGE / INCOME GAP [ $ ]
0.41
INEQUALITY / GINI INDEX
7,477
TOTAL POPULATION
3,810
MALE POPULATION
3,667
FEMALE POPULATION
103.90
MALES / 100 FEMALES
96.25
FEMALES / 100 MALES
34.2
MEDIAN AGE
3.4
AVG FAMILY SIZE
2.6
AVG HOUSEHOLD SIZE
3,794
LABOR FORCE [ PEOPLE ]
65.2%
PERCENT IN LABOR FORCE
8.6%
UNEMPLOYMENT RATE
Kenai Zip Codes
Kenai Area Codes
Income in Kenai
Income Overview in Kenai
Per Capita Income in Kenai is $37,409, while median incomes of families and households are $89,688 and $77,335 respectively.
| Characteristic | Number | Measure |
| Per Capita Income | 7,477 | $37,409 |
| Median Family Income | 1,621 | $89,688 |
| Mean Family Income | 1,621 | $110,243 |
| Median Household Income | 2,870 | $77,335 |
| Mean Household Income | 2,870 | $91,306 |
| Income Deficit | 1,621 | $0 |
| Wage / Income Gap (%) | 7,477 | 32.25% |
| Wage / Income Gap ($) | 7,477 | 67.75¢ per $1 |
| Gini / Inequality Index | 7,477 | 0.41 |
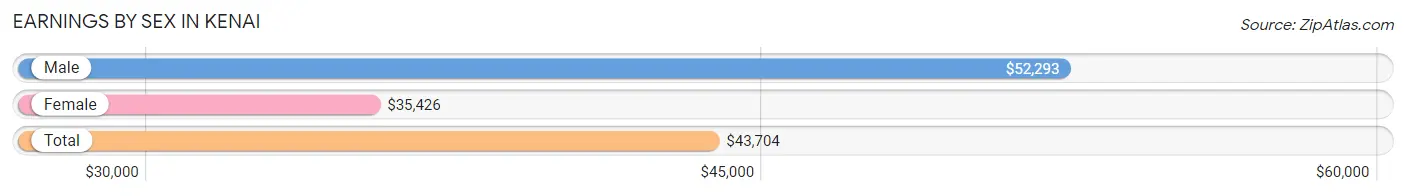
Earnings by Sex in Kenai
Average Earnings in Kenai are $43,704, $52,293 for men and $35,426 for women, a difference of 32.3%.
| Sex | Number | Average Earnings |
| Male | 2,252 (57.7%) | $52,293 |
| Female | 1,654 (42.3%) | $35,426 |
| Total | 3,906 (100.0%) | $43,704 |
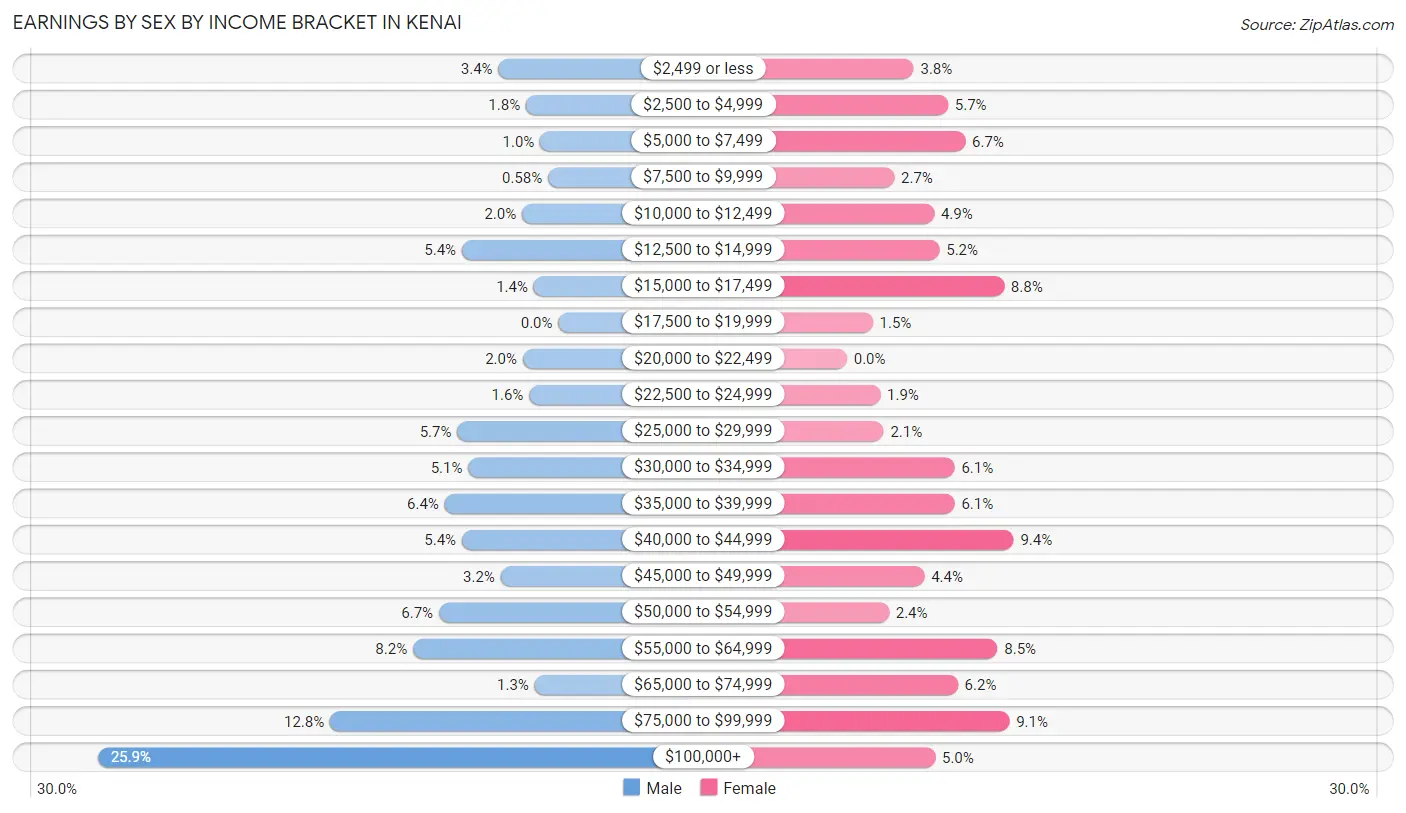
Earnings by Sex by Income Bracket in Kenai
The most common earnings brackets in Kenai are $100,000+ for men (583 | 25.9%) and $40,000 to $44,999 for women (155 | 9.4%).
| Income | Male | Female |
| $2,499 or less | 76 (3.4%) | 62 (3.7%) |
| $2,500 to $4,999 | 41 (1.8%) | 94 (5.7%) |
| $5,000 to $7,499 | 23 (1.0%) | 110 (6.7%) |
| $7,500 to $9,999 | 13 (0.6%) | 44 (2.7%) |
| $10,000 to $12,499 | 46 (2.0%) | 81 (4.9%) |
| $12,500 to $14,999 | 122 (5.4%) | 86 (5.2%) |
| $15,000 to $17,499 | 31 (1.4%) | 146 (8.8%) |
| $17,500 to $19,999 | 0 (0.0%) | 24 (1.5%) |
| $20,000 to $22,499 | 45 (2.0%) | 0 (0.0%) |
| $22,500 to $24,999 | 37 (1.6%) | 31 (1.9%) |
| $25,000 to $29,999 | 128 (5.7%) | 34 (2.1%) |
| $30,000 to $34,999 | 114 (5.1%) | 100 (6.0%) |
| $35,000 to $39,999 | 144 (6.4%) | 100 (6.0%) |
| $40,000 to $44,999 | 122 (5.4%) | 155 (9.4%) |
| $45,000 to $49,999 | 73 (3.2%) | 72 (4.3%) |
| $50,000 to $54,999 | 151 (6.7%) | 39 (2.4%) |
| $55,000 to $64,999 | 184 (8.2%) | 140 (8.5%) |
| $65,000 to $74,999 | 30 (1.3%) | 103 (6.2%) |
| $75,000 to $99,999 | 289 (12.8%) | 151 (9.1%) |
| $100,000+ | 583 (25.9%) | 82 (5.0%) |
| Total | 2,252 (100.0%) | 1,654 (100.0%) |
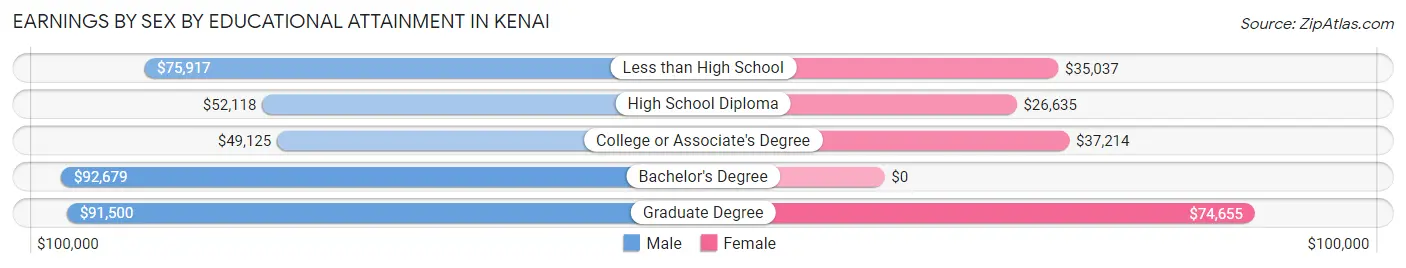
Earnings by Sex by Educational Attainment in Kenai
Average earnings in Kenai are $57,987 for men and $37,188 for women, a difference of 35.9%. Men with an educational attainment of bachelor's degree enjoy the highest average annual earnings of $92,679, while those with college or associate's degree education earn the least with $49,125. Women with an educational attainment of graduate degree earn the most with the average annual earnings of $74,655, while those with high school diploma education have the smallest earnings of $26,635.
| Educational Attainment | Male Income | Female Income |
| Less than High School | $75,917 | $35,037 |
| High School Diploma | $52,118 | $26,635 |
| College or Associate's Degree | $49,125 | $37,214 |
| Bachelor's Degree | $92,679 | $0 |
| Graduate Degree | $91,500 | $74,655 |
| Total | $57,987 | $37,188 |
Family Income in Kenai
Family Income Brackets in Kenai
According to the Kenai family income data, there are 413 families falling into the $100,000 to $149,999 income range, which is the most common income bracket and makes up 25.5% of all families.
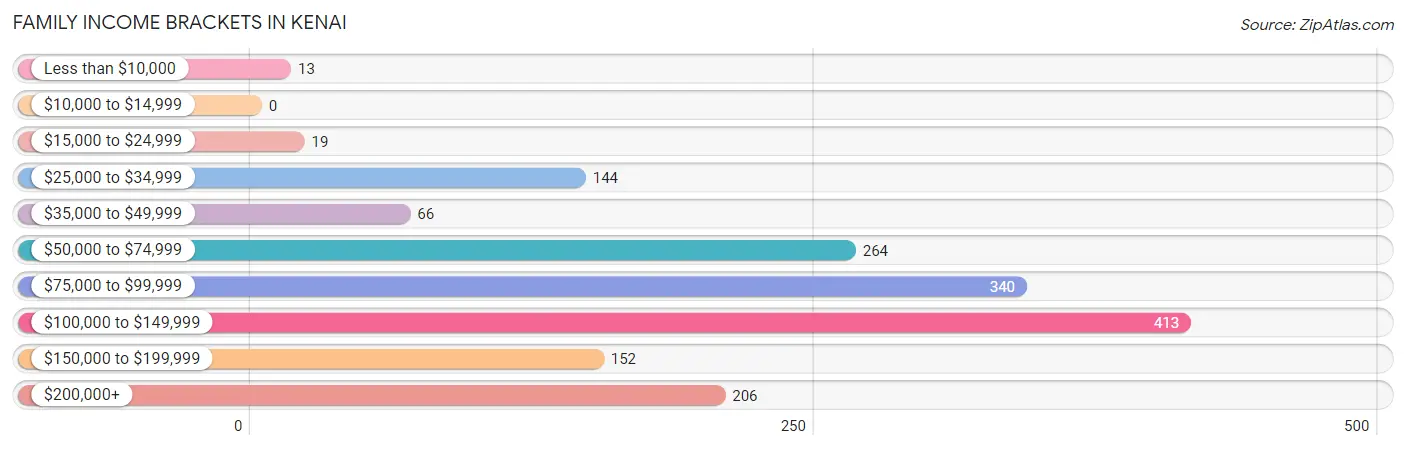
| Income Bracket | # Families | % Families |
| Less than $10,000 | 13 | 0.8% |
| $10,000 to $14,999 | 0 | 0.0% |
| $15,000 to $24,999 | 19 | 1.2% |
| $25,000 to $34,999 | 144 | 8.9% |
| $35,000 to $49,999 | 66 | 4.1% |
| $50,000 to $74,999 | 264 | 16.3% |
| $75,000 to $99,999 | 340 | 21.0% |
| $100,000 to $149,999 | 413 | 25.5% |
| $150,000 to $199,999 | 152 | 9.4% |
| $200,000+ | 206 | 12.7% |
Family Income by Famaliy Size in Kenai
5-person families (164 | 10.1%) account for the highest median family income in Kenai with $115,156 per family, while 2-person families (707 | 43.6%) have the highest median income of $50,599 per family member.
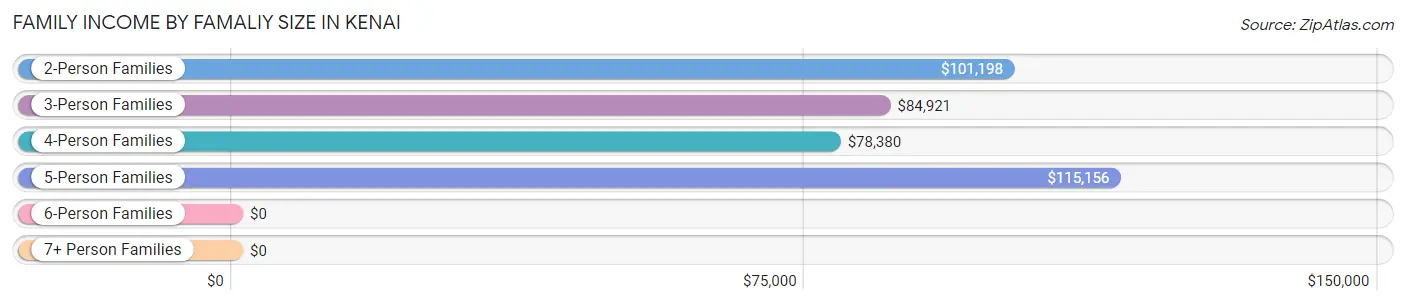
| Income Bracket | # Families | Median Income |
| 2-Person Families | 707 (43.6%) | $101,198 |
| 3-Person Families | 345 (21.3%) | $84,921 |
| 4-Person Families | 303 (18.7%) | $78,380 |
| 5-Person Families | 164 (10.1%) | $115,156 |
| 6-Person Families | 57 (3.5%) | $0 |
| 7+ Person Families | 45 (2.8%) | $0 |
| Total | 1,621 (100.0%) | $89,688 |
Family Income by Number of Earners in Kenai
The median family income in Kenai is $89,688, with families comprising 3+ earners (137) having the highest median family income of $149,811, while families with no earners (232) have the lowest median family income of $76,786, accounting for 8.5% and 14.3% of families, respectively.
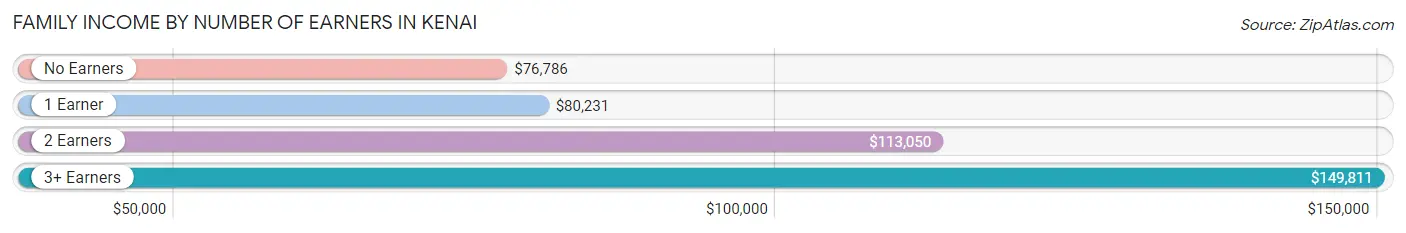
| Number of Earners | # Families | Median Income |
| No Earners | 232 (14.3%) | $76,786 |
| 1 Earner | 563 (34.7%) | $80,231 |
| 2 Earners | 689 (42.5%) | $113,050 |
| 3+ Earners | 137 (8.5%) | $149,811 |
| Total | 1,621 (100.0%) | $89,688 |
Household Income in Kenai
Household Income Brackets in Kenai
With 522 households falling in the category, the $100,000 to $149,999 income range is the most frequent in Kenai, accounting for 18.2% of all households. In contrast, only 60 households (2.1%) fall into the $10,000 to $14,999 income bracket, making it the least populous group.
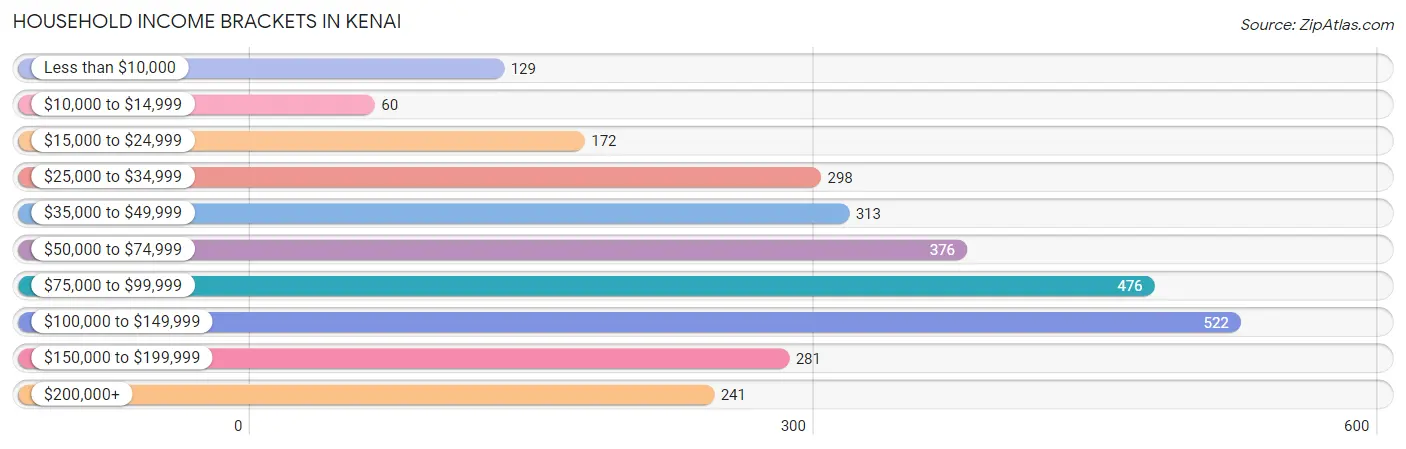
| Income Bracket | # Households | % Households |
| Less than $10,000 | 129 | 4.5% |
| $10,000 to $14,999 | 60 | 2.1% |
| $15,000 to $24,999 | 172 | 6.0% |
| $25,000 to $34,999 | 298 | 10.4% |
| $35,000 to $49,999 | 313 | 10.9% |
| $50,000 to $74,999 | 376 | 13.1% |
| $75,000 to $99,999 | 476 | 16.6% |
| $100,000 to $149,999 | 522 | 18.2% |
| $150,000 to $199,999 | 281 | 9.8% |
| $200,000+ | 241 | 8.4% |
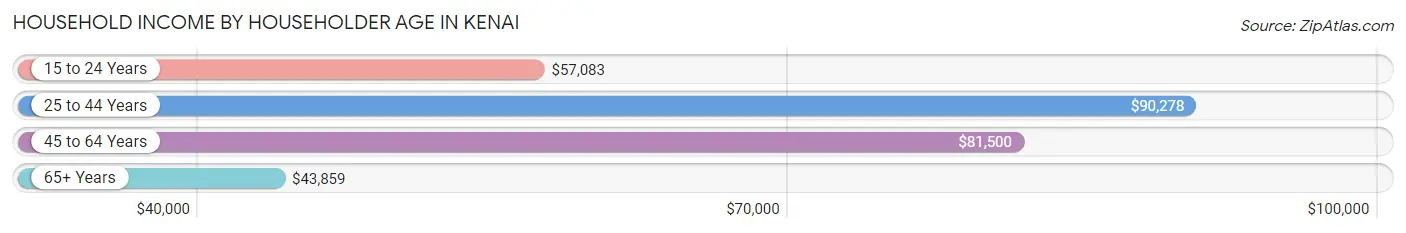
Household Income by Householder Age in Kenai
The median household income in Kenai is $77,335, with the highest median household income of $90,278 found in the 25 to 44 years age bracket for the primary householder. A total of 976 households (34.0%) fall into this category. Meanwhile, the 65+ years age bracket for the primary householder has the lowest median household income of $43,859, with 549 households (19.1%) in this group.
| Income Bracket | # Households | Median Income |
| 15 to 24 Years | 213 (7.4%) | $57,083 |
| 25 to 44 Years | 976 (34.0%) | $90,278 |
| 45 to 64 Years | 1,132 (39.4%) | $81,500 |
| 65+ Years | 549 (19.1%) | $43,859 |
| Total | 2,870 (100.0%) | $77,335 |
Poverty in Kenai
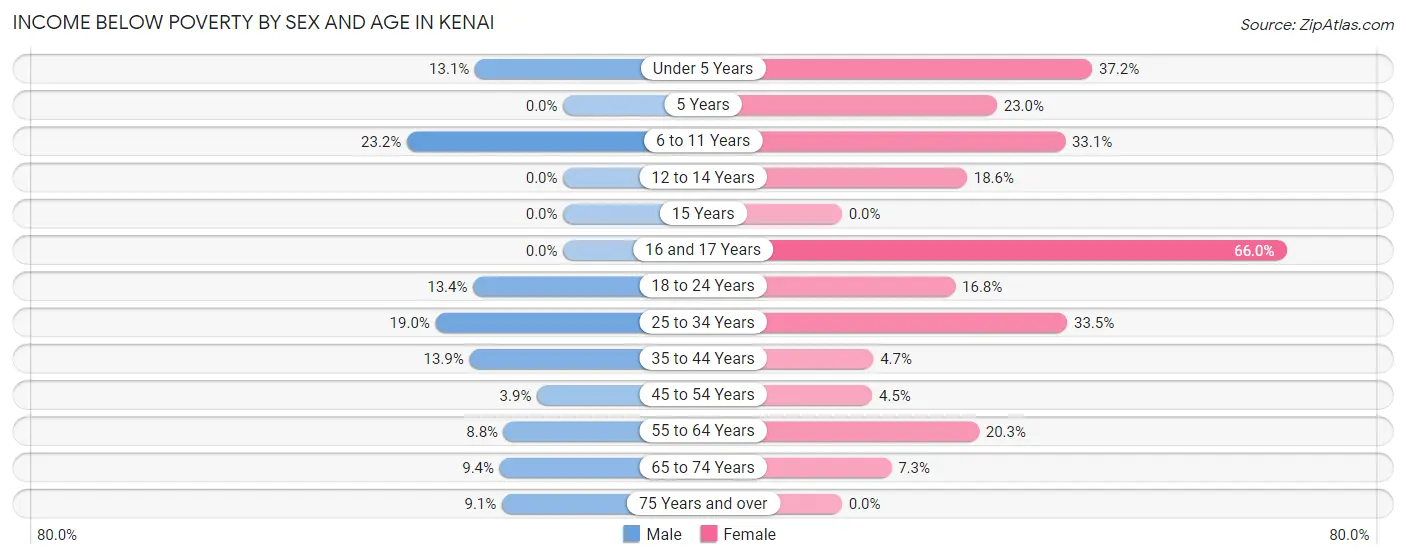
Income Below Poverty by Sex and Age in Kenai
With 12.0% poverty level for males and 19.5% for females among the residents of Kenai, 6 to 11 year old males and 16 and 17 year old females are the most vulnerable to poverty, with 58 males (23.2%) and 66 females (66.0%) in their respective age groups living below the poverty level.
| Age Bracket | Male | Female |
| Under 5 Years | 41 (13.1%) | 55 (37.2%) |
| 5 Years | 0 (0.0%) | 32 (23.0%) |
| 6 to 11 Years | 58 (23.2%) | 114 (33.1%) |
| 12 to 14 Years | 0 (0.0%) | 31 (18.6%) |
| 15 Years | 0 (0.0%) | 0 (0.0%) |
| 16 and 17 Years | 0 (0.0%) | 66 (66.0%) |
| 18 to 24 Years | 46 (13.4%) | 67 (16.8%) |
| 25 to 34 Years | 142 (19.0%) | 197 (33.5%) |
| 35 to 44 Years | 72 (13.9%) | 17 (4.7%) |
| 45 to 54 Years | 20 (3.9%) | 19 (4.5%) |
| 55 to 64 Years | 38 (8.8%) | 96 (20.3%) |
| 65 to 74 Years | 25 (9.4%) | 21 (7.3%) |
| 75 Years and over | 12 (9.1%) | 0 (0.0%) |
| Total | 454 (12.0%) | 715 (19.5%) |
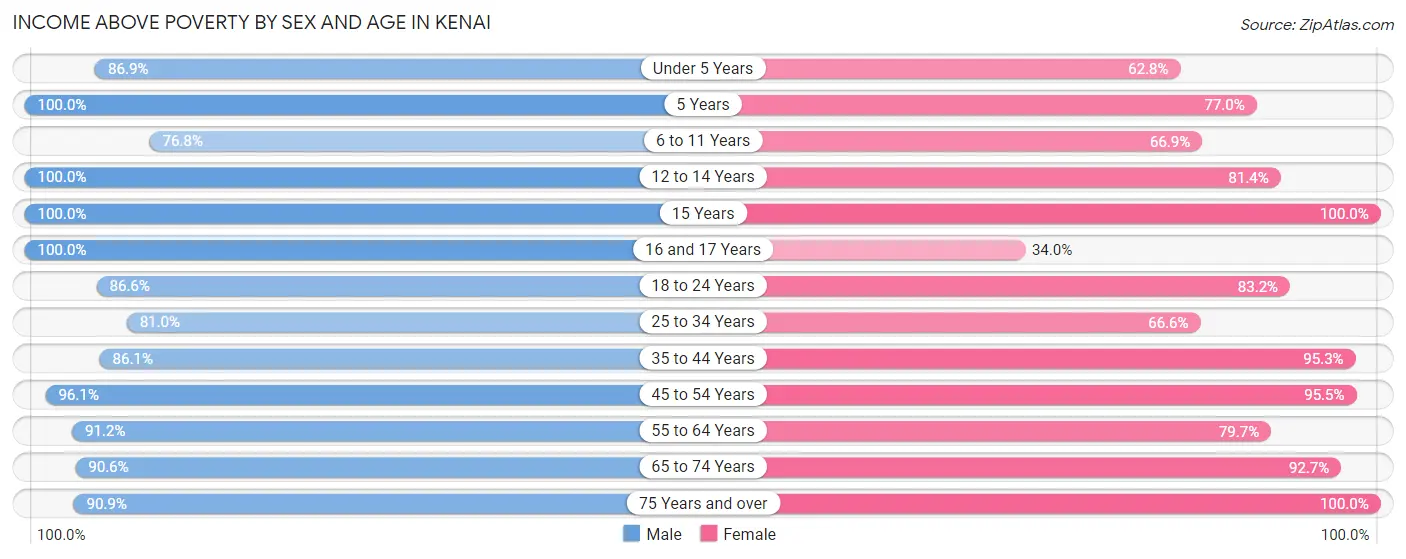
Income Above Poverty by Sex and Age in Kenai
According to the poverty statistics in Kenai, males aged 5 years and females aged 15 years are the age groups that are most secure financially, with 100.0% of males and 100.0% of females in these age groups living above the poverty line.
| Age Bracket | Male | Female |
| Under 5 Years | 272 (86.9%) | 93 (62.8%) |
| 5 Years | 31 (100.0%) | 107 (77.0%) |
| 6 to 11 Years | 192 (76.8%) | 230 (66.9%) |
| 12 to 14 Years | 144 (100.0%) | 136 (81.4%) |
| 15 Years | 33 (100.0%) | 57 (100.0%) |
| 16 and 17 Years | 45 (100.0%) | 34 (34.0%) |
| 18 to 24 Years | 298 (86.6%) | 331 (83.2%) |
| 25 to 34 Years | 607 (81.0%) | 392 (66.5%) |
| 35 to 44 Years | 445 (86.1%) | 347 (95.3%) |
| 45 to 54 Years | 495 (96.1%) | 403 (95.5%) |
| 55 to 64 Years | 393 (91.2%) | 376 (79.7%) |
| 65 to 74 Years | 240 (90.6%) | 265 (92.7%) |
| 75 Years and over | 120 (90.9%) | 179 (100.0%) |
| Total | 3,315 (87.9%) | 2,950 (80.5%) |
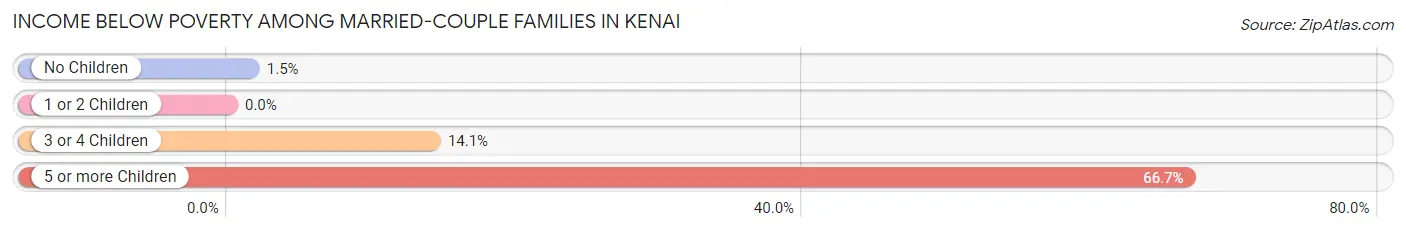
Income Below Poverty Among Married-Couple Families in Kenai
The poverty statistics for married-couple families in Kenai show that 4.3% or 53 of the total 1,240 families live below the poverty line. Families with 5 or more children have the highest poverty rate of 66.7%, comprising of 30 families. On the other hand, families with 1 or 2 children have the lowest poverty rate of 0.0%, which includes 0 families.
| Children | Above Poverty | Below Poverty |
| No Children | 647 (98.5%) | 10 (1.5%) |
| 1 or 2 Children | 446 (100.0%) | 0 (0.0%) |
| 3 or 4 Children | 79 (85.9%) | 13 (14.1%) |
| 5 or more Children | 15 (33.3%) | 30 (66.7%) |
| Total | 1,187 (95.7%) | 53 (4.3%) |
Income Below Poverty Among Single-Parent Households in Kenai
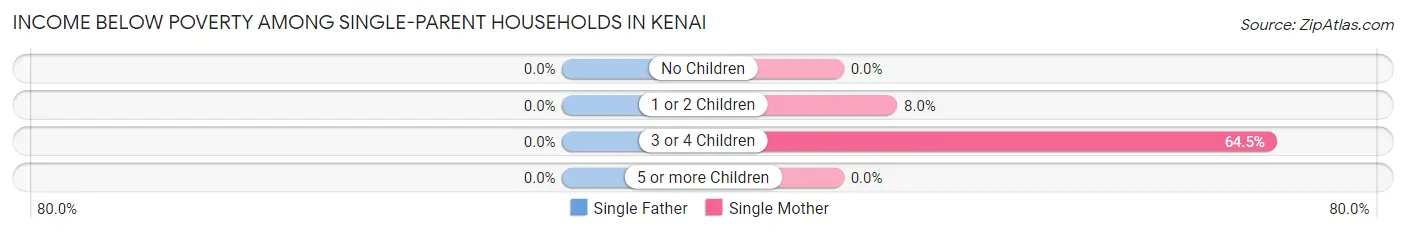
| Children | Single Father | Single Mother |
| No Children | 0 (0.0%) | 0 (0.0%) |
| 1 or 2 Children | 0 (0.0%) | 9 (8.0%) |
| 3 or 4 Children | 0 (0.0%) | 40 (64.5%) |
| 5 or more Children | 0 (0.0%) | 0 (0.0%) |
| Total | 0 (0.0%) | 49 (22.9%) |
Income Below Poverty Among Married-Couple vs Single-Parent Households in Kenai
The poverty data for Kenai shows that 53 of the married-couple family households (4.3%) and 49 of the single-parent households (12.9%) are living below the poverty level. Within the married-couple family households, those with 5 or more children have the highest poverty rate, with 30 households (66.7%) falling below the poverty line. Among the single-parent households, those with 3 or 4 children have the highest poverty rate, with 40 household (53.3%) living below poverty.
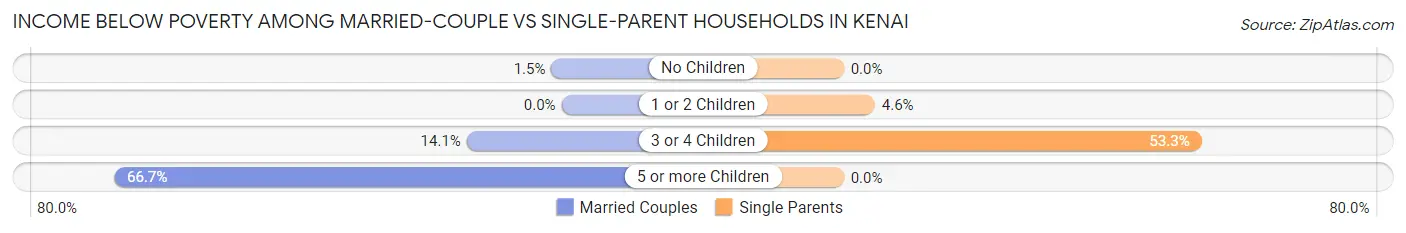
| Children | Married-Couple Families | Single-Parent Households |
| No Children | 10 (1.5%) | 0 (0.0%) |
| 1 or 2 Children | 0 (0.0%) | 9 (4.6%) |
| 3 or 4 Children | 13 (14.1%) | 40 (53.3%) |
| 5 or more Children | 30 (66.7%) | 0 (0.0%) |
| Total | 53 (4.3%) | 49 (12.9%) |
Race in Kenai
The most populous races in Kenai are White / Caucasian (5,362 | 71.7%), Native / Alaskan (784 | 10.5%), and Two or more Races (712 | 9.5%).
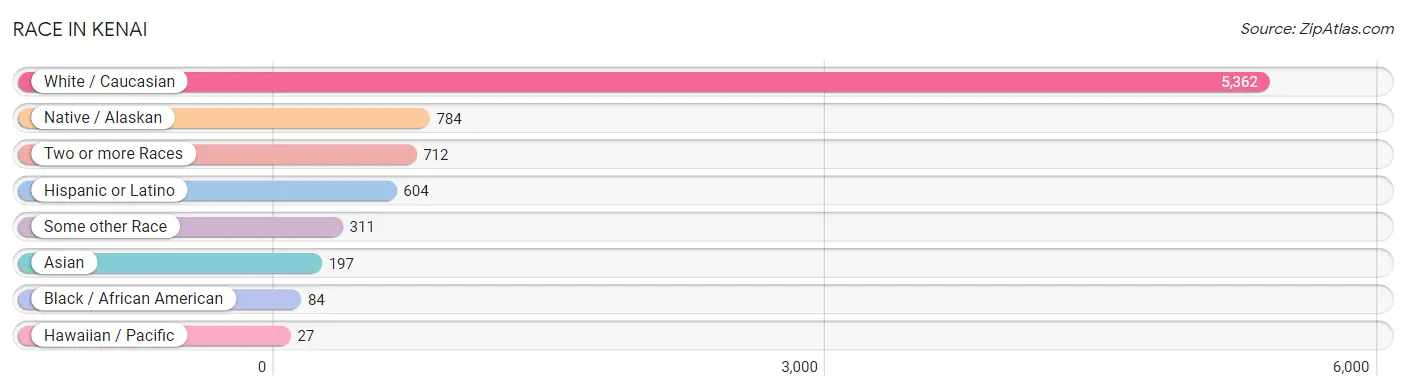
| Race | # Population | % Population |
| Asian | 197 | 2.6% |
| Black / African American | 84 | 1.1% |
| Hawaiian / Pacific | 27 | 0.4% |
| Hispanic or Latino | 604 | 8.1% |
| Native / Alaskan | 784 | 10.5% |
| White / Caucasian | 5,362 | 71.7% |
| Two or more Races | 712 | 9.5% |
| Some other Race | 311 | 4.2% |
| Total | 7,477 | 100.0% |
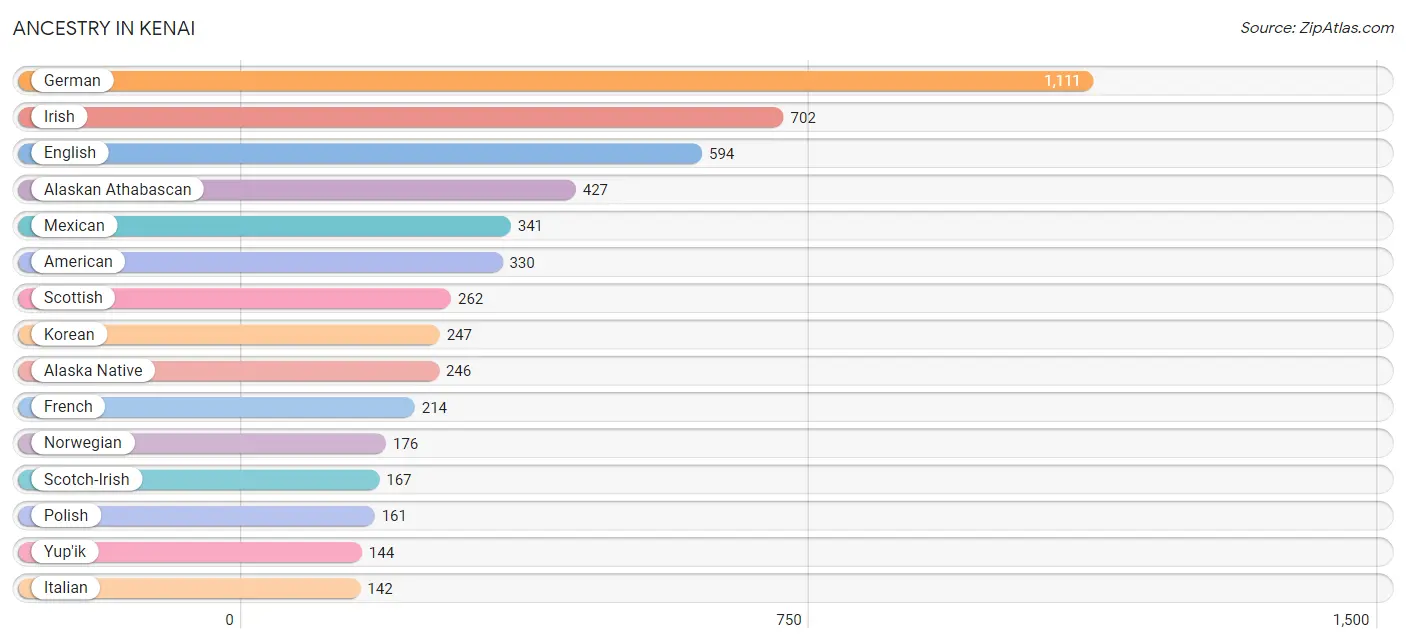
Ancestry in Kenai
The most populous ancestries reported in Kenai are German (1,111 | 14.9%), Irish (702 | 9.4%), English (594 | 7.9%), Alaskan Athabascan (427 | 5.7%), and Mexican (341 | 4.6%), together accounting for 42.5% of all Kenai residents.
| Ancestry | # Population | % Population |
| Alaska Native | 246 | 3.3% |
| Alaskan Athabascan | 427 | 5.7% |
| Aleut | 13 | 0.2% |
| American | 330 | 4.4% |
| Austrian | 80 | 1.1% |
| Bhutanese | 51 | 0.7% |
| British | 21 | 0.3% |
| Burmese | 51 | 0.7% |
| Canadian | 21 | 0.3% |
| Central American | 66 | 0.9% |
| Cherokee | 110 | 1.5% |
| Choctaw | 45 | 0.6% |
| Cree | 19 | 0.3% |
| Crow | 17 | 0.2% |
| Cuban | 30 | 0.4% |
| Czech | 28 | 0.4% |
| Danish | 134 | 1.8% |
| Dominican | 56 | 0.7% |
| Dutch | 113 | 1.5% |
| Dutch West Indian | 48 | 0.6% |
| English | 594 | 7.9% |
| European | 140 | 1.9% |
| Finnish | 122 | 1.6% |
| French | 214 | 2.9% |
| French Canadian | 102 | 1.4% |
| German | 1,111 | 14.9% |
| Greek | 13 | 0.2% |
| Icelander | 15 | 0.2% |
| Inupiat | 51 | 0.7% |
| Iranian | 13 | 0.2% |
| Irish | 702 | 9.4% |
| Iroquois | 9 | 0.1% |
| Italian | 142 | 1.9% |
| Korean | 247 | 3.3% |
| Lithuanian | 9 | 0.1% |
| Mexican | 341 | 4.6% |
| Native Hawaiian | 51 | 0.7% |
| Nicaraguan | 66 | 0.9% |
| Northern European | 18 | 0.2% |
| Norwegian | 176 | 2.4% |
| Polish | 161 | 2.1% |
| Portuguese | 24 | 0.3% |
| Puerto Rican | 45 | 0.6% |
| Russian | 40 | 0.5% |
| Samoan | 27 | 0.4% |
| Scandinavian | 100 | 1.3% |
| Scotch-Irish | 167 | 2.2% |
| Scottish | 262 | 3.5% |
| Sioux | 11 | 0.2% |
| Subsaharan African | 2 | 0.0% |
| Sudanese | 2 | 0.0% |
| Swedish | 70 | 0.9% |
| Swiss | 13 | 0.2% |
| Tlingit-Haida | 67 | 0.9% |
| Tsimshian | 53 | 0.7% |
| Ukrainian | 13 | 0.2% |
| Vietnamese | 33 | 0.4% |
| Yup'ik | 144 | 1.9% | View All 58 Rows |
Immigrants in Kenai
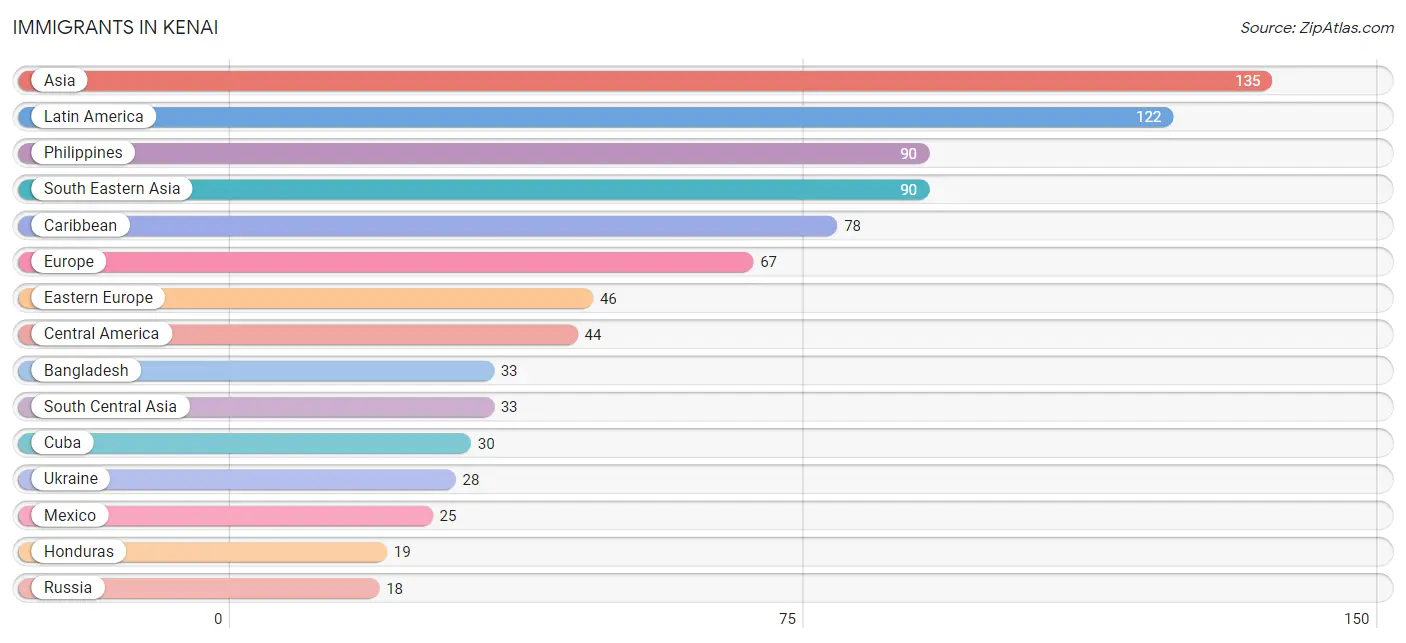
The most numerous immigrant groups reported in Kenai came from Asia (135 | 1.8%), Latin America (122 | 1.6%), Philippines (90 | 1.2%), South Eastern Asia (90 | 1.2%), and Caribbean (78 | 1.0%), together accounting for 6.9% of all Kenai residents.
| Immigration Origin | # Population | % Population |
| Africa | 11 | 0.2% |
| Asia | 135 | 1.8% |
| Bangladesh | 33 | 0.4% |
| Canada | 14 | 0.2% |
| Caribbean | 78 | 1.0% |
| Central America | 44 | 0.6% |
| Cuba | 30 | 0.4% |
| Eastern Asia | 12 | 0.2% |
| Eastern Europe | 46 | 0.6% |
| Europe | 67 | 0.9% |
| Germany | 7 | 0.1% |
| Ghana | 11 | 0.2% |
| Honduras | 19 | 0.3% |
| Korea | 12 | 0.2% |
| Latin America | 122 | 1.6% |
| Mexico | 25 | 0.3% |
| Northern Europe | 14 | 0.2% |
| Philippines | 90 | 1.2% |
| Russia | 18 | 0.2% |
| South Central Asia | 33 | 0.4% |
| South Eastern Asia | 90 | 1.2% |
| Sweden | 14 | 0.2% |
| Ukraine | 28 | 0.4% |
| Western Africa | 11 | 0.2% |
| Western Europe | 7 | 0.1% | View All 25 Rows |
Sex and Age in Kenai
Sex and Age in Kenai
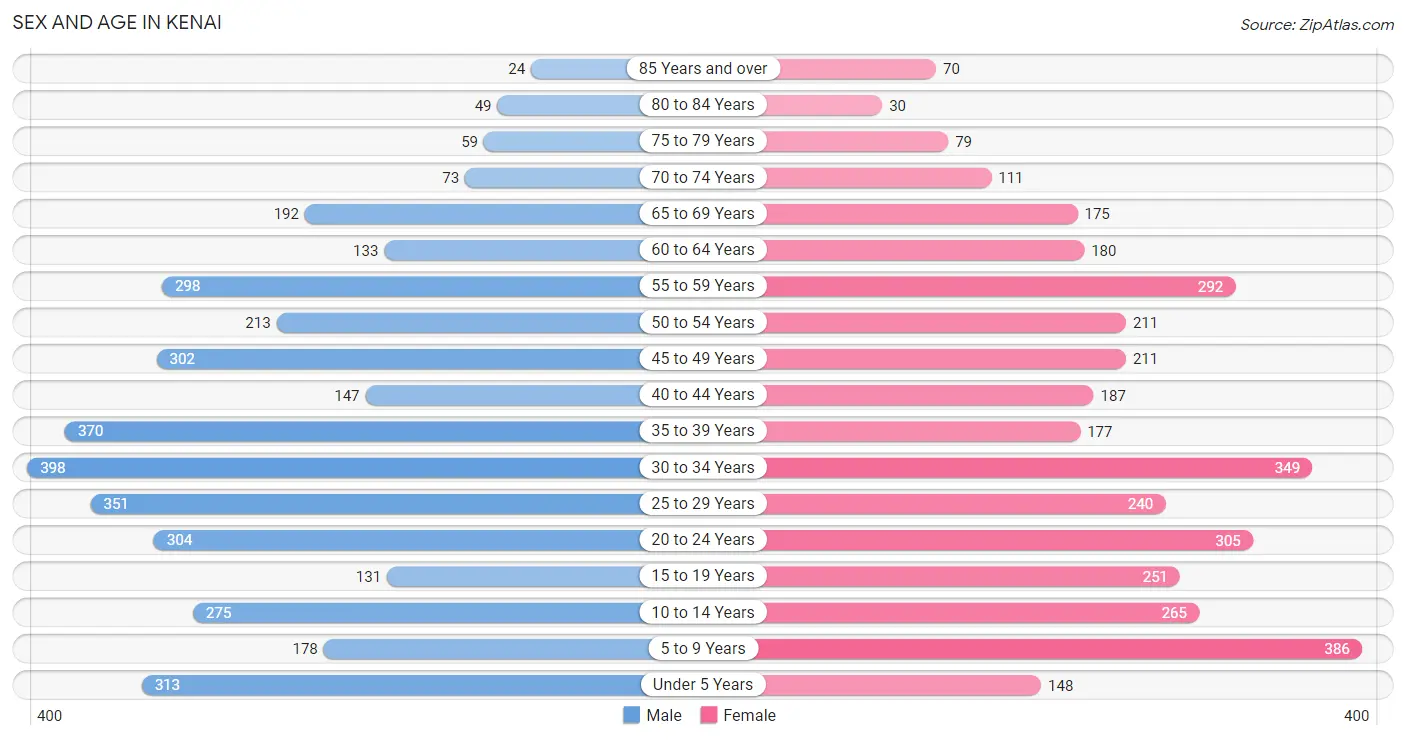
The most populous age groups in Kenai are 30 to 34 Years (398 | 10.4%) for men and 5 to 9 Years (386 | 10.5%) for women.
| Age Bracket | Male | Female |
| Under 5 Years | 313 (8.2%) | 148 (4.0%) |
| 5 to 9 Years | 178 (4.7%) | 386 (10.5%) |
| 10 to 14 Years | 275 (7.2%) | 265 (7.2%) |
| 15 to 19 Years | 131 (3.4%) | 251 (6.8%) |
| 20 to 24 Years | 304 (8.0%) | 305 (8.3%) |
| 25 to 29 Years | 351 (9.2%) | 240 (6.5%) |
| 30 to 34 Years | 398 (10.4%) | 349 (9.5%) |
| 35 to 39 Years | 370 (9.7%) | 177 (4.8%) |
| 40 to 44 Years | 147 (3.9%) | 187 (5.1%) |
| 45 to 49 Years | 302 (7.9%) | 211 (5.8%) |
| 50 to 54 Years | 213 (5.6%) | 211 (5.8%) |
| 55 to 59 Years | 298 (7.8%) | 292 (8.0%) |
| 60 to 64 Years | 133 (3.5%) | 180 (4.9%) |
| 65 to 69 Years | 192 (5.0%) | 175 (4.8%) |
| 70 to 74 Years | 73 (1.9%) | 111 (3.0%) |
| 75 to 79 Years | 59 (1.5%) | 79 (2.1%) |
| 80 to 84 Years | 49 (1.3%) | 30 (0.8%) |
| 85 Years and over | 24 (0.6%) | 70 (1.9%) |
| Total | 3,810 (100.0%) | 3,667 (100.0%) |
Families and Households in Kenai
Median Family Size in Kenai
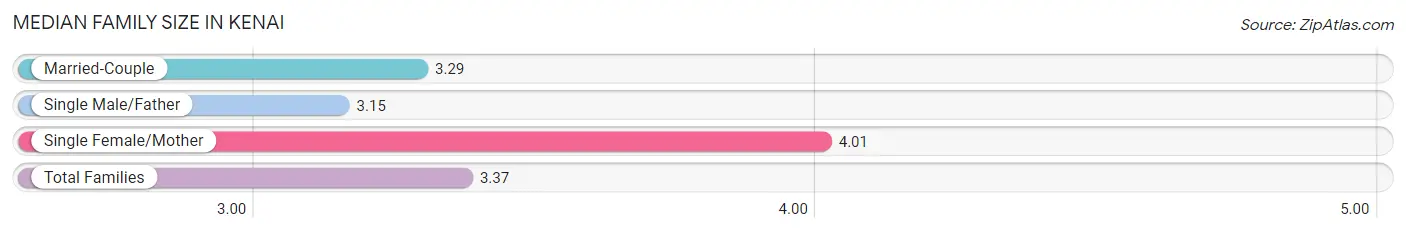
The median family size in Kenai is 3.37 persons per family, with single female/mother families (214 | 13.2%) accounting for the largest median family size of 4.01 persons per family. On the other hand, single male/father families (167 | 10.3%) represent the smallest median family size with 3.15 persons per family.
| Family Type | # Families | Family Size |
| Married-Couple | 1,240 (76.5%) | 3.29 |
| Single Male/Father | 167 (10.3%) | 3.15 |
| Single Female/Mother | 214 (13.2%) | 4.01 |
| Total Families | 1,621 (100.0%) | 3.37 |
Median Household Size in Kenai
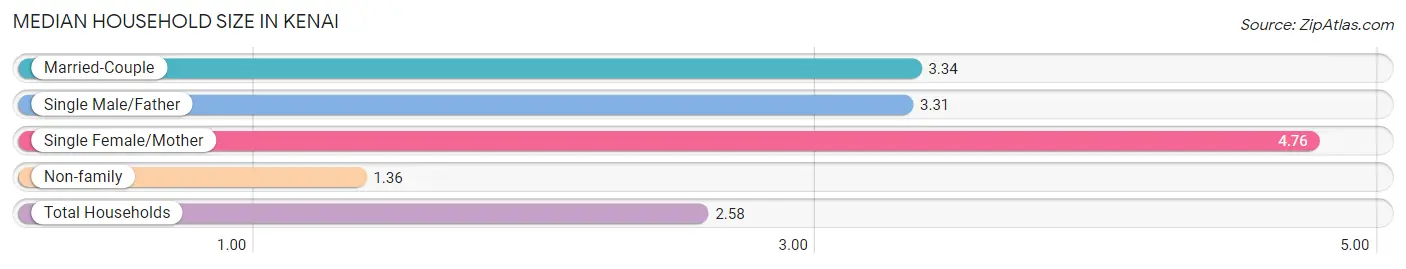
The median household size in Kenai is 2.58 persons per household, with single female/mother households (214 | 7.5%) accounting for the largest median household size of 4.76 persons per household. non-family households (1,249 | 43.5%) represent the smallest median household size with 1.36 persons per household.
| Household Type | # Households | Household Size |
| Married-Couple | 1,240 (43.2%) | 3.34 |
| Single Male/Father | 167 (5.8%) | 3.31 |
| Single Female/Mother | 214 (7.5%) | 4.76 |
| Non-family | 1,249 (43.5%) | 1.36 |
| Total Households | 2,870 (100.0%) | 2.58 |
Household Size by Marriage Status in Kenai
Out of a total of 2,870 households in Kenai, 1,621 (56.5%) are family households, while 1,249 (43.5%) are nonfamily households. The most numerous type of family households are 2-person households, comprising 644, and the most common type of nonfamily households are 1-person households, comprising 922.
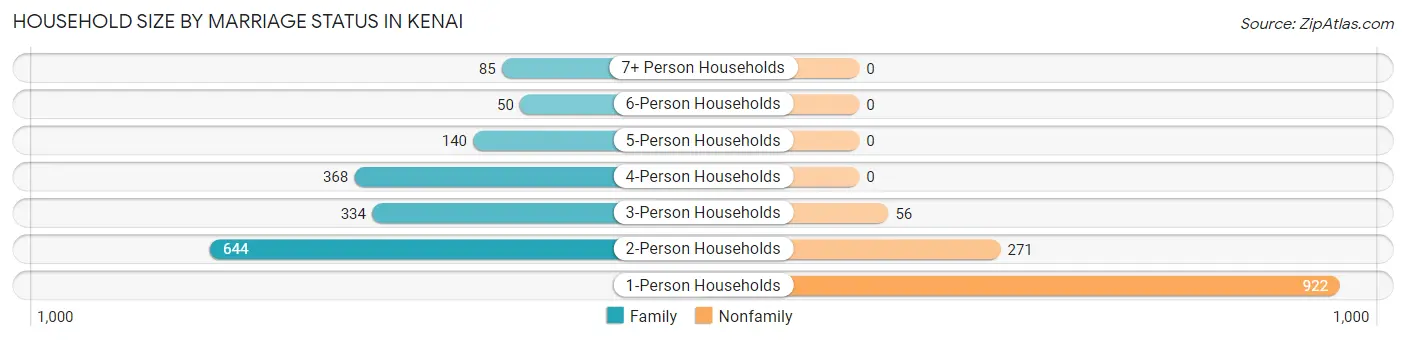
| Household Size | Family Households | Nonfamily Households |
| 1-Person Households | - | 922 (32.1%) |
| 2-Person Households | 644 (22.4%) | 271 (9.4%) |
| 3-Person Households | 334 (11.6%) | 56 (1.9%) |
| 4-Person Households | 368 (12.8%) | 0 (0.0%) |
| 5-Person Households | 140 (4.9%) | 0 (0.0%) |
| 6-Person Households | 50 (1.7%) | 0 (0.0%) |
| 7+ Person Households | 85 (3.0%) | 0 (0.0%) |
| Total | 1,621 (56.5%) | 1,249 (43.5%) |
Female Fertility in Kenai
Fertility by Age in Kenai
Average fertility rate in Kenai is 65.0 births per 1,000 women. Women in the age bracket of 20 to 34 years have the highest fertility rate with 92.0 births per 1,000 women. Women in the age bracket of 20 to 34 years acount for 70.7% of all women with births.
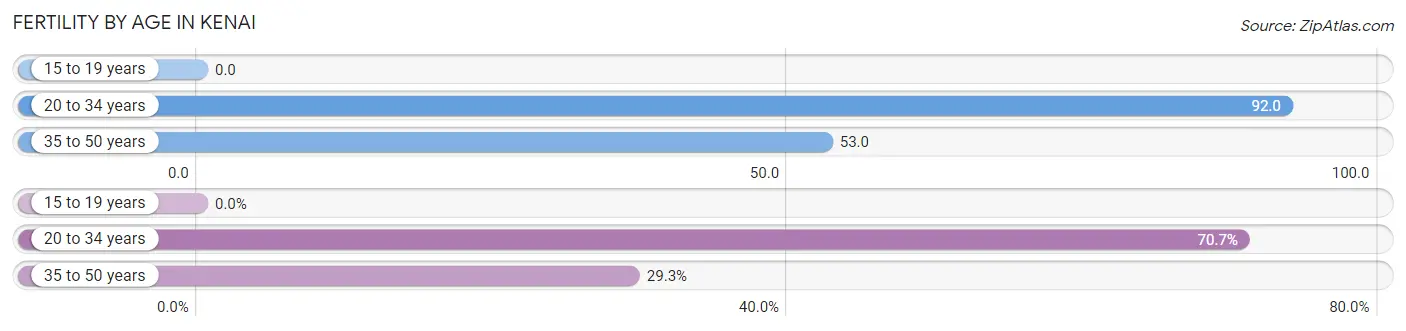
| Age Bracket | Women with Births | Births / 1,000 Women |
| 15 to 19 years | 0 (0.0%) | 0.0 |
| 20 to 34 years | 82 (70.7%) | 92.0 |
| 35 to 50 years | 34 (29.3%) | 53.0 |
| Total | 116 (100.0%) | 65.0 |
Fertility by Age by Marriage Status in Kenai
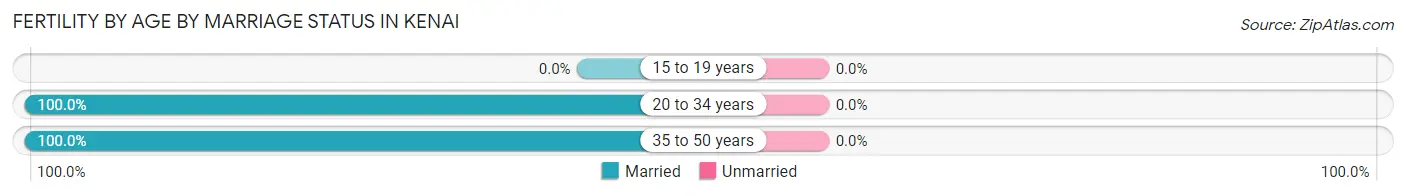
| Age Bracket | Married | Unmarried |
| 15 to 19 years | 0 (0.0%) | 0 (0.0%) |
| 20 to 34 years | 82 (100.0%) | 0 (0.0%) |
| 35 to 50 years | 34 (100.0%) | 0 (0.0%) |
| Total | 116 (100.0%) | 0 (0.0%) |
Fertility by Education in Kenai
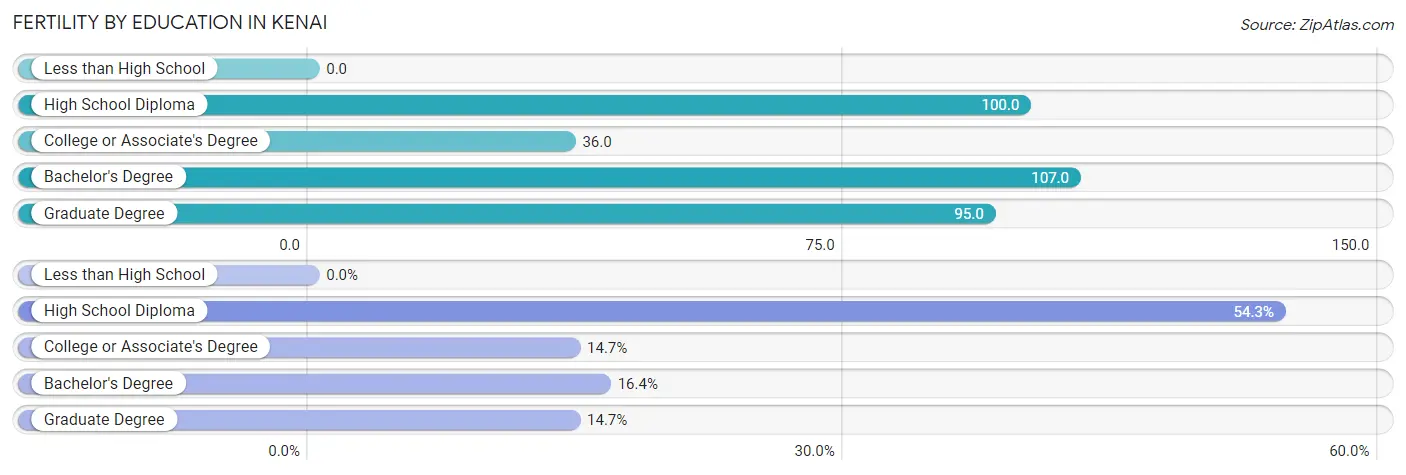
| Educational Attainment | Women with Births | Births / 1,000 Women |
| Less than High School | 0 (0.0%) | 0.0 |
| High School Diploma | 63 (54.3%) | 100.0 |
| College or Associate's Degree | 17 (14.7%) | 36.0 |
| Bachelor's Degree | 19 (16.4%) | 107.0 |
| Graduate Degree | 17 (14.7%) | 95.0 |
| Total | 116 (100.0%) | 65.0 |
Fertility by Education by Marriage Status in Kenai
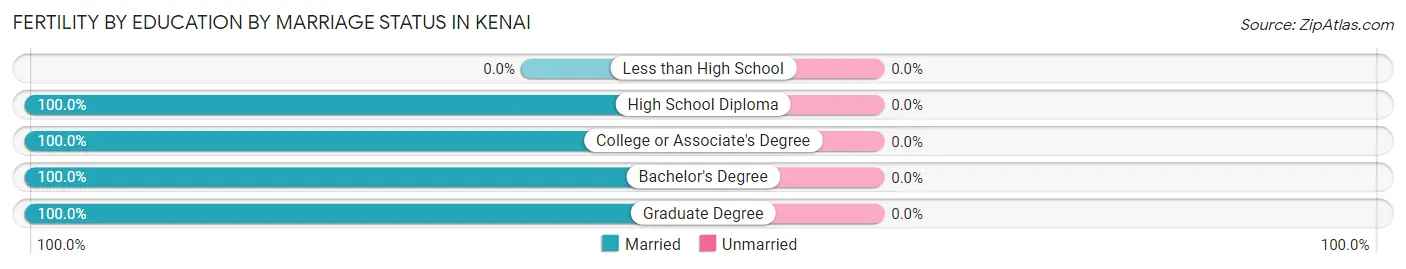
| Educational Attainment | Married | Unmarried |
| Less than High School | 0 (0.0%) | 0 (0.0%) |
| High School Diploma | 63 (100.0%) | 0 (0.0%) |
| College or Associate's Degree | 17 (100.0%) | 0 (0.0%) |
| Bachelor's Degree | 19 (100.0%) | 0 (0.0%) |
| Graduate Degree | 17 (100.0%) | 0 (0.0%) |
| Total | 116 (100.0%) | 0 (0.0%) |
Employment Characteristics in Kenai
Employment by Class of Employer in Kenai
Among the 3,289 employed individuals in Kenai, private company employees (1,688 | 51.3%), local government employees (448 | 13.6%), and not-for-profit organizations (431 | 13.1%) make up the most common classes of employment.
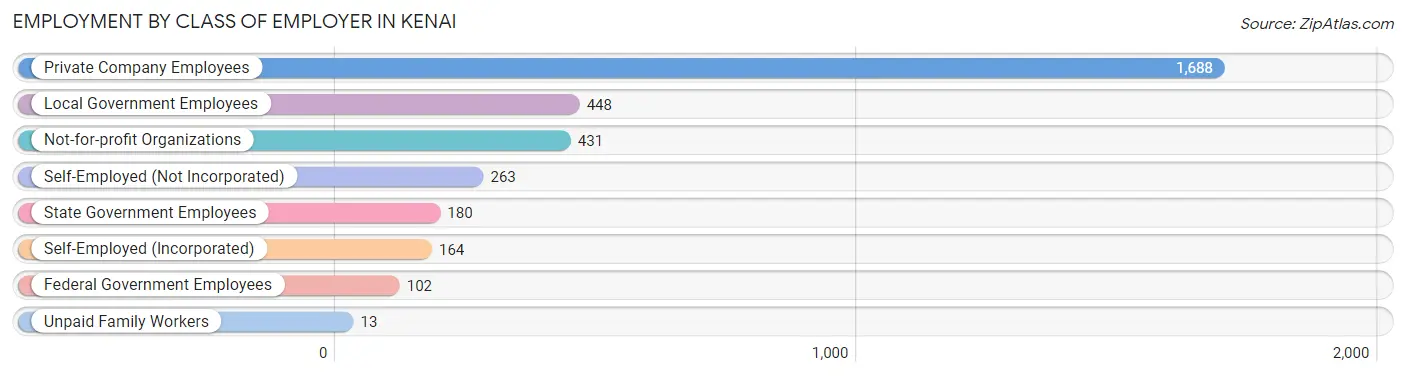
| Employer Class | # Employees | % Employees |
| Private Company Employees | 1,688 | 51.3% |
| Self-Employed (Incorporated) | 164 | 5.0% |
| Self-Employed (Not Incorporated) | 263 | 8.0% |
| Not-for-profit Organizations | 431 | 13.1% |
| Local Government Employees | 448 | 13.6% |
| State Government Employees | 180 | 5.5% |
| Federal Government Employees | 102 | 3.1% |
| Unpaid Family Workers | 13 | 0.4% |
| Total | 3,289 | 100.0% |
Employment Status by Age in Kenai
According to the labor force statistics for Kenai, out of the total population over 16 years of age (5,819), 65.2% or 3,794 individuals are in the labor force, with 8.6% or 326 of them unemployed. The age group with the highest labor force participation rate is 30 to 34 years, with 87.4% or 653 individuals in the labor force. Within the labor force, the 65 to 74 years age range has the highest percentage of unemployed individuals, with 37.9% or 36 of them being unemployed.
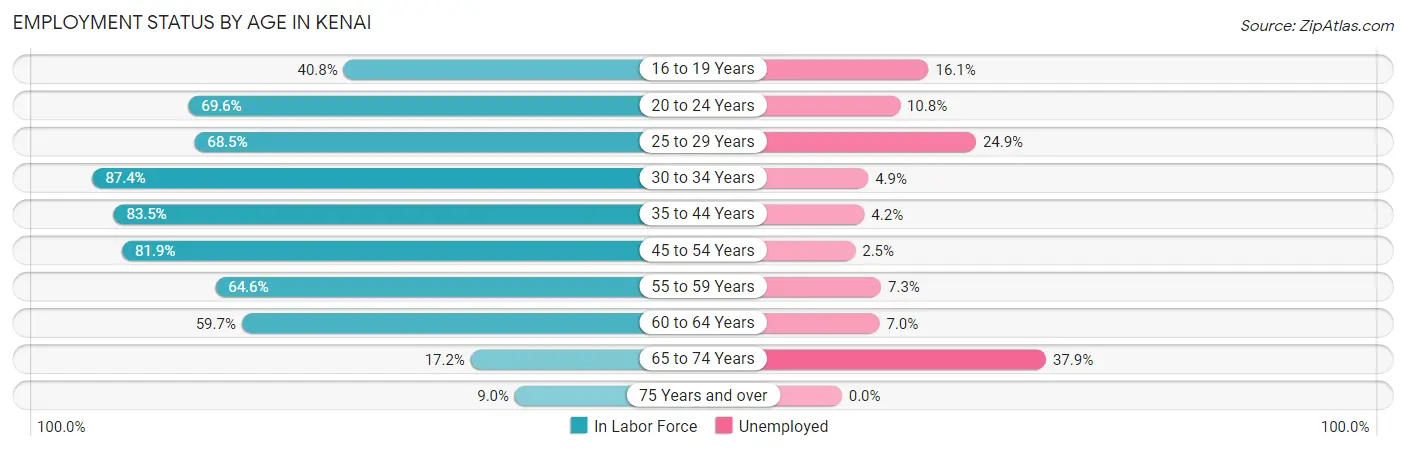
| Age Bracket | In Labor Force | Unemployed |
| 16 to 19 Years | 118 (40.8%) | 19 (16.1%) |
| 20 to 24 Years | 424 (69.6%) | 46 (10.8%) |
| 25 to 29 Years | 405 (68.5%) | 101 (24.9%) |
| 30 to 34 Years | 653 (87.4%) | 32 (4.9%) |
| 35 to 44 Years | 736 (83.5%) | 31 (4.2%) |
| 45 to 54 Years | 767 (81.9%) | 19 (2.5%) |
| 55 to 59 Years | 381 (64.6%) | 28 (7.3%) |
| 60 to 64 Years | 187 (59.7%) | 13 (7.0%) |
| 65 to 74 Years | 95 (17.2%) | 36 (37.9%) |
| 75 Years and over | 28 (9.0%) | 0 (0.0%) |
| Total | 3,794 (65.2%) | 326 (8.6%) |
Employment Status by Educational Attainment in Kenai
According to labor force statistics for Kenai, 77.1% of individuals (3,129) out of the total population between 25 and 64 years of age (4,059) are in the labor force, with 7.2% or 225 of them being unemployed. The group with the highest labor force participation rate are those with the educational attainment of bachelor's degree or higher, with 89.0% or 759 individuals in the labor force. Within the labor force, individuals with college / associate degree education have the highest percentage of unemployment, with 13.4% or 150 of them being unemployed.
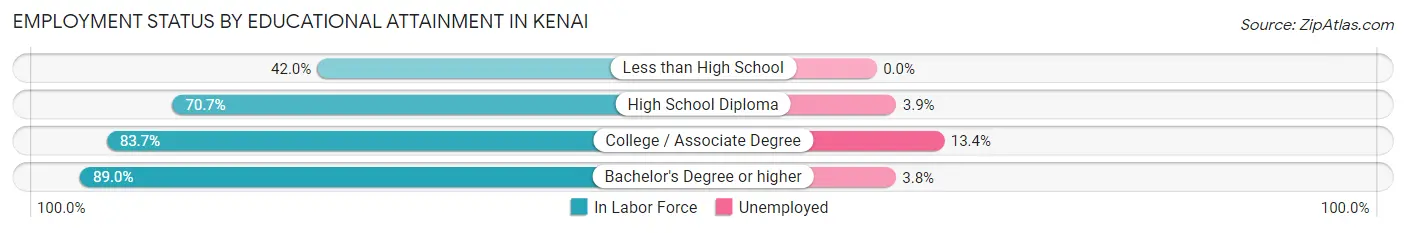
| Educational Attainment | In Labor Force | Unemployed |
| Less than High School | 102 (42.0%) | 0 (0.0%) |
| High School Diploma | 1,151 (70.7%) | 63 (3.9%) |
| College / Associate Degree | 1,117 (83.7%) | 179 (13.4%) |
| Bachelor's Degree or higher | 759 (89.0%) | 32 (3.8%) |
| Total | 3,129 (77.1%) | 292 (7.2%) |
Employment Occupations by Sex in Kenai
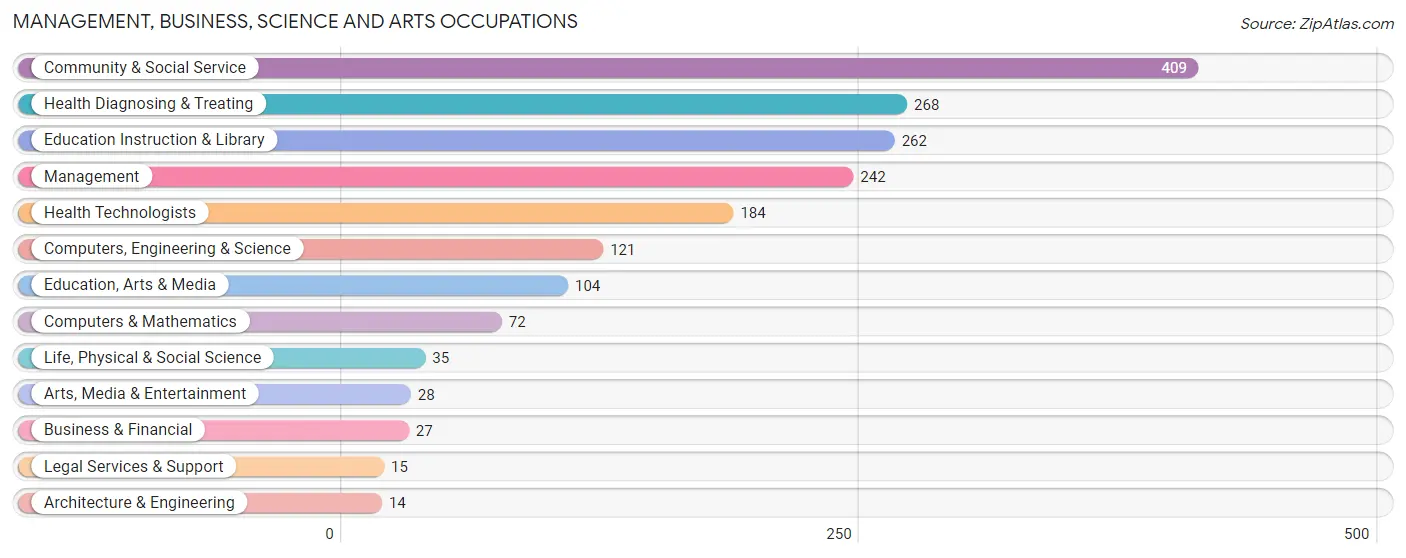
Management, Business, Science and Arts Occupations
The most common Management, Business, Science and Arts occupations in Kenai are Community & Social Service (409 | 11.8%), Health Diagnosing & Treating (268 | 7.8%), Education Instruction & Library (262 | 7.6%), Management (242 | 7.0%), and Health Technologists (184 | 5.3%).
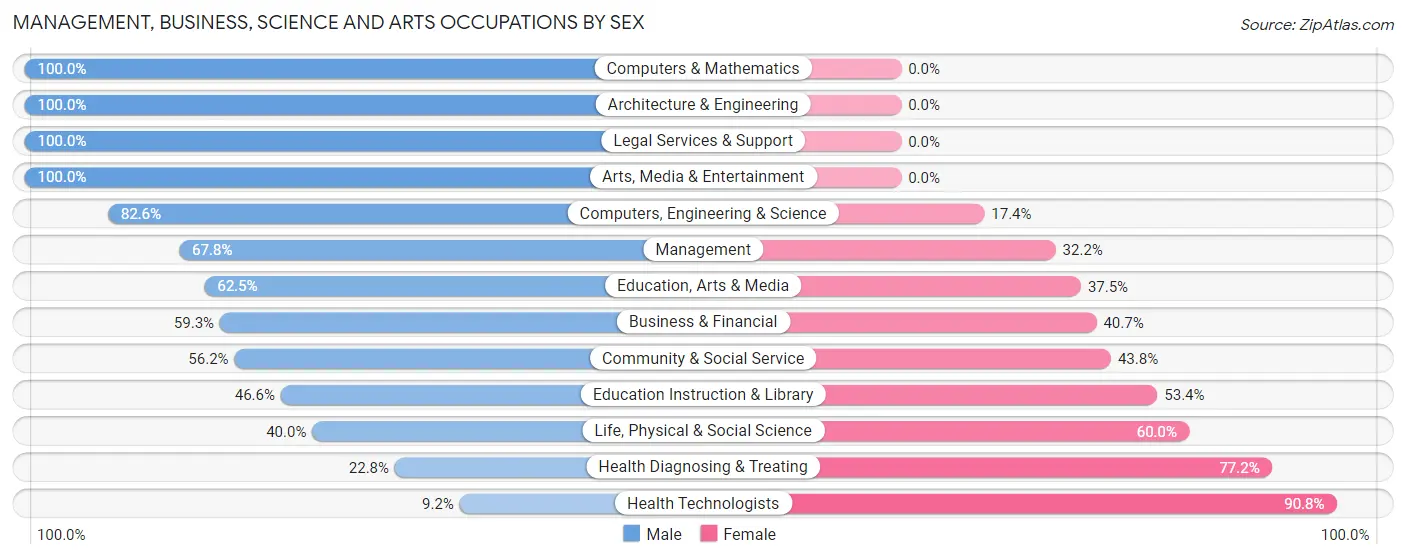
Management, Business, Science and Arts Occupations by Sex
Within the Management, Business, Science and Arts occupations in Kenai, the most male-oriented occupations are Computers & Mathematics (100.0%), Architecture & Engineering (100.0%), and Legal Services & Support (100.0%), while the most female-oriented occupations are Health Technologists (90.8%), Health Diagnosing & Treating (77.2%), and Life, Physical & Social Science (60.0%).
| Occupation | Male | Female |
| Management | 164 (67.8%) | 78 (32.2%) |
| Business & Financial | 16 (59.3%) | 11 (40.7%) |
| Computers, Engineering & Science | 100 (82.6%) | 21 (17.4%) |
| Computers & Mathematics | 72 (100.0%) | 0 (0.0%) |
| Architecture & Engineering | 14 (100.0%) | 0 (0.0%) |
| Life, Physical & Social Science | 14 (40.0%) | 21 (60.0%) |
| Community & Social Service | 230 (56.2%) | 179 (43.8%) |
| Education, Arts & Media | 65 (62.5%) | 39 (37.5%) |
| Legal Services & Support | 15 (100.0%) | 0 (0.0%) |
| Education Instruction & Library | 122 (46.6%) | 140 (53.4%) |
| Arts, Media & Entertainment | 28 (100.0%) | 0 (0.0%) |
| Health Diagnosing & Treating | 61 (22.8%) | 207 (77.2%) |
| Health Technologists | 17 (9.2%) | 167 (90.8%) |
| Total (Category) | 571 (53.5%) | 496 (46.5%) |
| Total (Overall) | 2,043 (59.2%) | 1,408 (40.8%) |
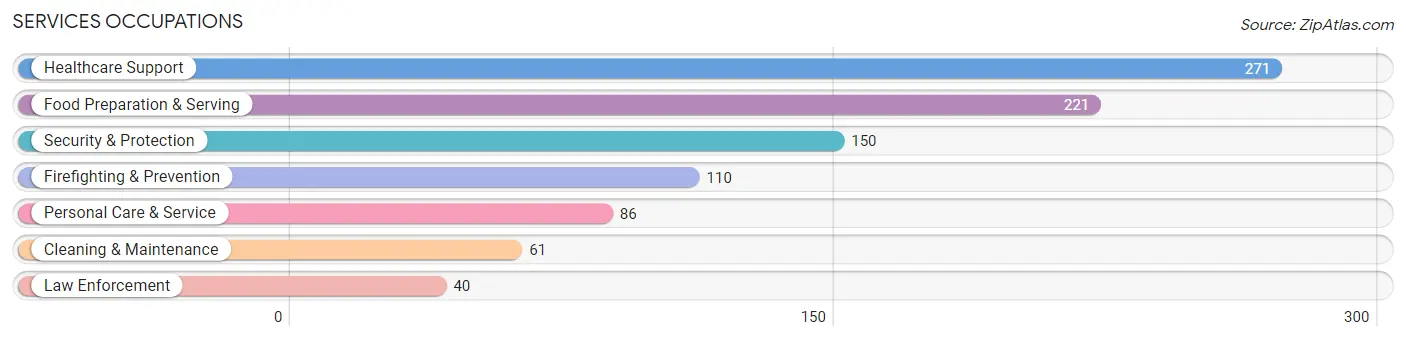
Services Occupations
The most common Services occupations in Kenai are Healthcare Support (271 | 7.9%), Food Preparation & Serving (221 | 6.4%), Security & Protection (150 | 4.3%), Firefighting & Prevention (110 | 3.2%), and Personal Care & Service (86 | 2.5%).
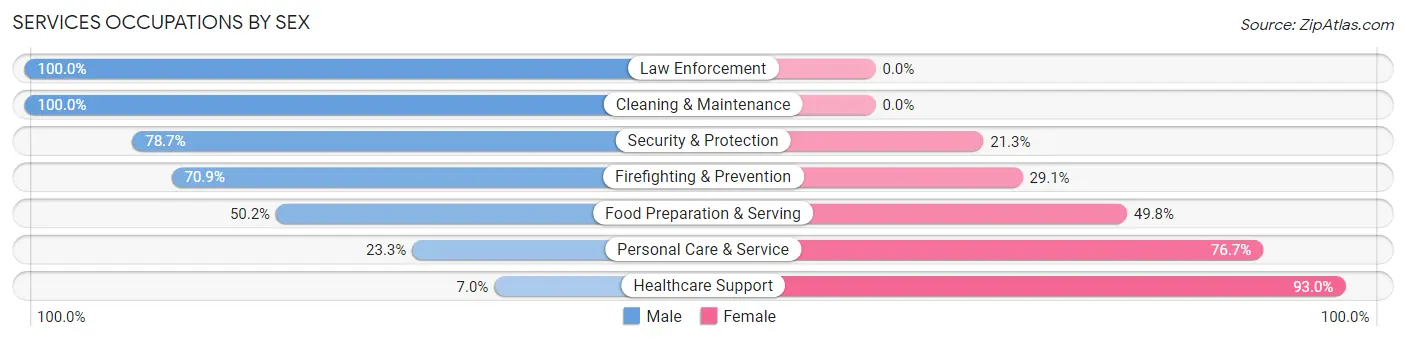
Services Occupations by Sex
Within the Services occupations in Kenai, the most male-oriented occupations are Law Enforcement (100.0%), Cleaning & Maintenance (100.0%), and Security & Protection (78.7%), while the most female-oriented occupations are Healthcare Support (93.0%), Personal Care & Service (76.7%), and Food Preparation & Serving (49.8%).
| Occupation | Male | Female |
| Healthcare Support | 19 (7.0%) | 252 (93.0%) |
| Security & Protection | 118 (78.7%) | 32 (21.3%) |
| Firefighting & Prevention | 78 (70.9%) | 32 (29.1%) |
| Law Enforcement | 40 (100.0%) | 0 (0.0%) |
| Food Preparation & Serving | 111 (50.2%) | 110 (49.8%) |
| Cleaning & Maintenance | 61 (100.0%) | 0 (0.0%) |
| Personal Care & Service | 20 (23.3%) | 66 (76.7%) |
| Total (Category) | 329 (41.7%) | 460 (58.3%) |
| Total (Overall) | 2,043 (59.2%) | 1,408 (40.8%) |
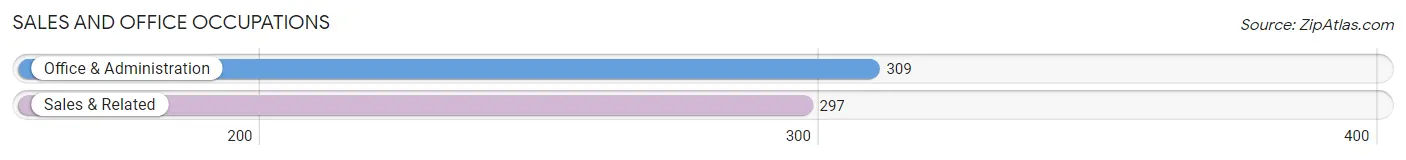
Sales and Office Occupations
The most common Sales and Office occupations in Kenai are Office & Administration (309 | 8.9%), and Sales & Related (297 | 8.6%).
Sales and Office Occupations by Sex
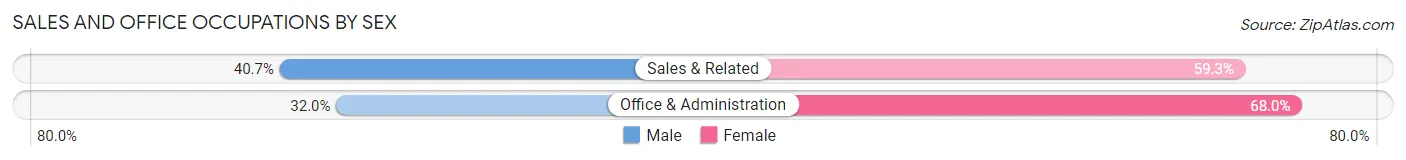
| Occupation | Male | Female |
| Sales & Related | 121 (40.7%) | 176 (59.3%) |
| Office & Administration | 99 (32.0%) | 210 (68.0%) |
| Total (Category) | 220 (36.3%) | 386 (63.7%) |
| Total (Overall) | 2,043 (59.2%) | 1,408 (40.8%) |
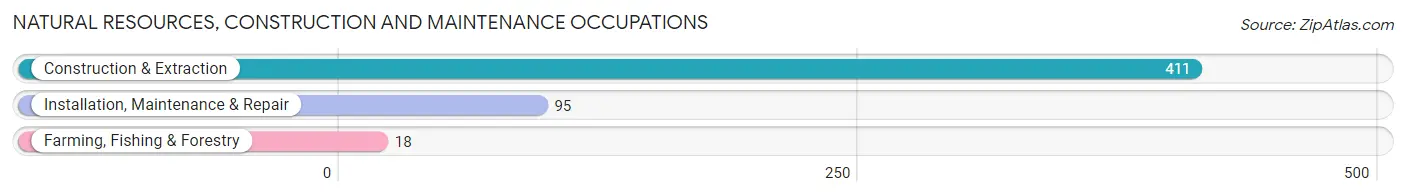
Natural Resources, Construction and Maintenance Occupations
The most common Natural Resources, Construction and Maintenance occupations in Kenai are Construction & Extraction (411 | 11.9%), Installation, Maintenance & Repair (95 | 2.8%), and Farming, Fishing & Forestry (18 | 0.5%).
Natural Resources, Construction and Maintenance Occupations by Sex
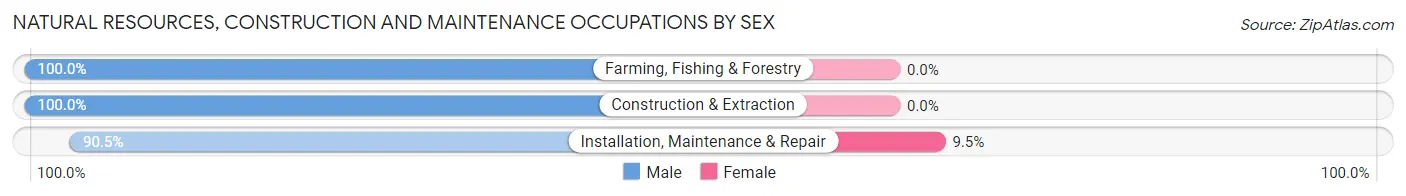
| Occupation | Male | Female |
| Farming, Fishing & Forestry | 18 (100.0%) | 0 (0.0%) |
| Construction & Extraction | 411 (100.0%) | 0 (0.0%) |
| Installation, Maintenance & Repair | 86 (90.5%) | 9 (9.5%) |
| Total (Category) | 515 (98.3%) | 9 (1.7%) |
| Total (Overall) | 2,043 (59.2%) | 1,408 (40.8%) |
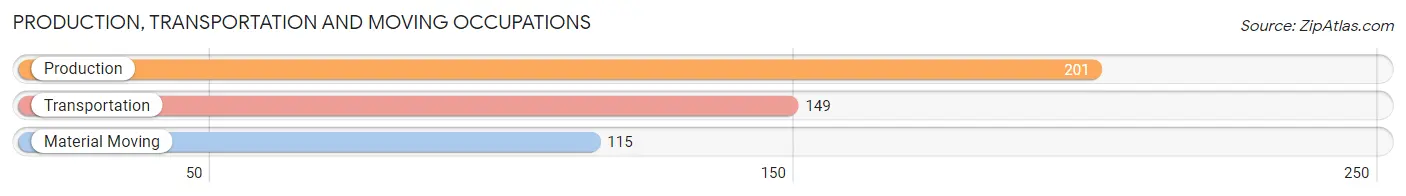
Production, Transportation and Moving Occupations
The most common Production, Transportation and Moving occupations in Kenai are Production (201 | 5.8%), Transportation (149 | 4.3%), and Material Moving (115 | 3.3%).
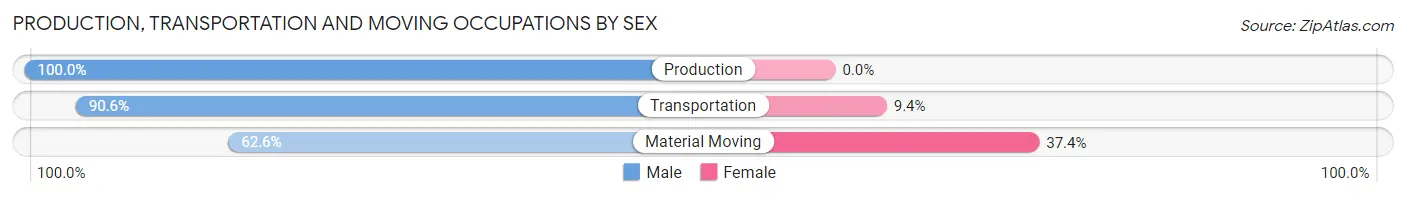
Production, Transportation and Moving Occupations by Sex
| Occupation | Male | Female |
| Production | 201 (100.0%) | 0 (0.0%) |
| Transportation | 135 (90.6%) | 14 (9.4%) |
| Material Moving | 72 (62.6%) | 43 (37.4%) |
| Total (Category) | 408 (87.7%) | 57 (12.3%) |
| Total (Overall) | 2,043 (59.2%) | 1,408 (40.8%) |
Employment Industries by Sex in Kenai
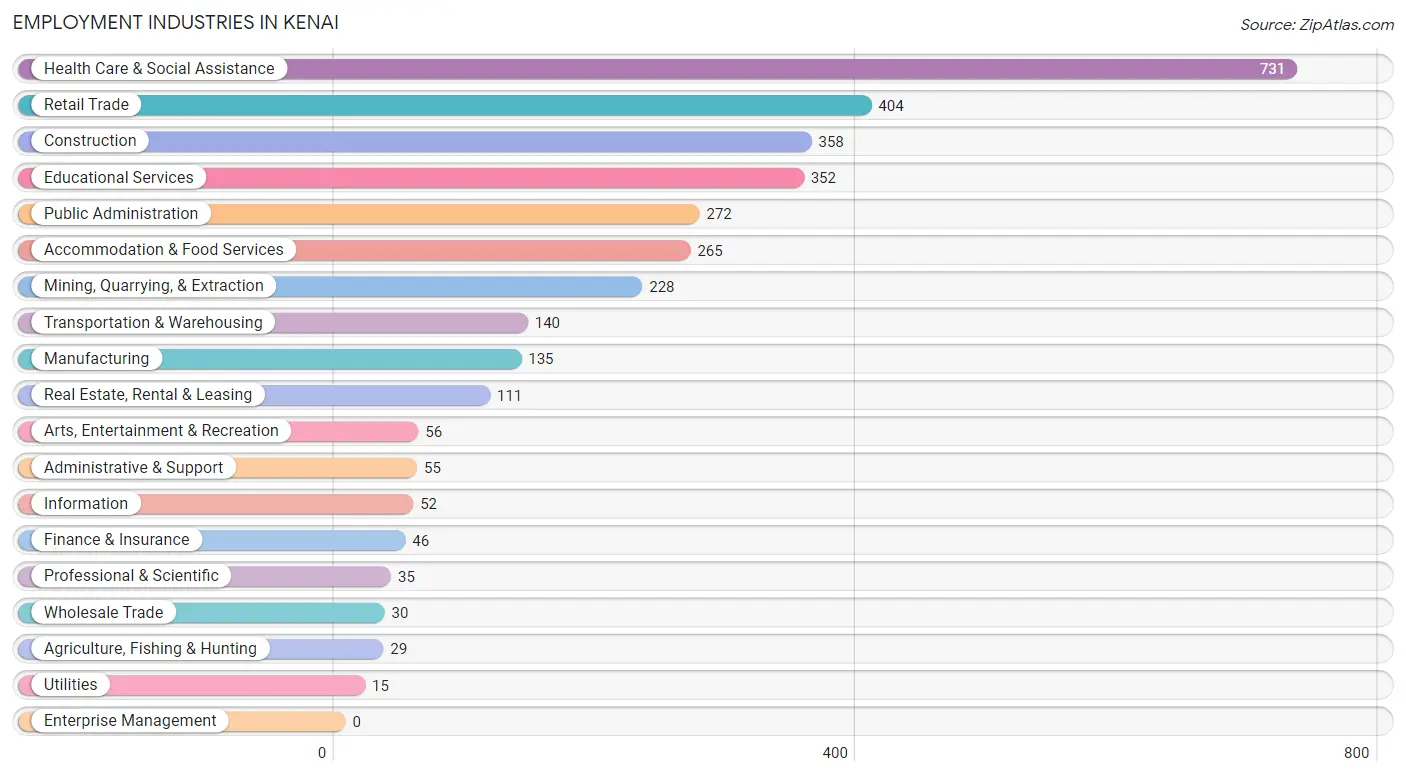
Employment Industries in Kenai
The major employment industries in Kenai include Health Care & Social Assistance (731 | 21.2%), Retail Trade (404 | 11.7%), Construction (358 | 10.4%), Educational Services (352 | 10.2%), and Public Administration (272 | 7.9%).
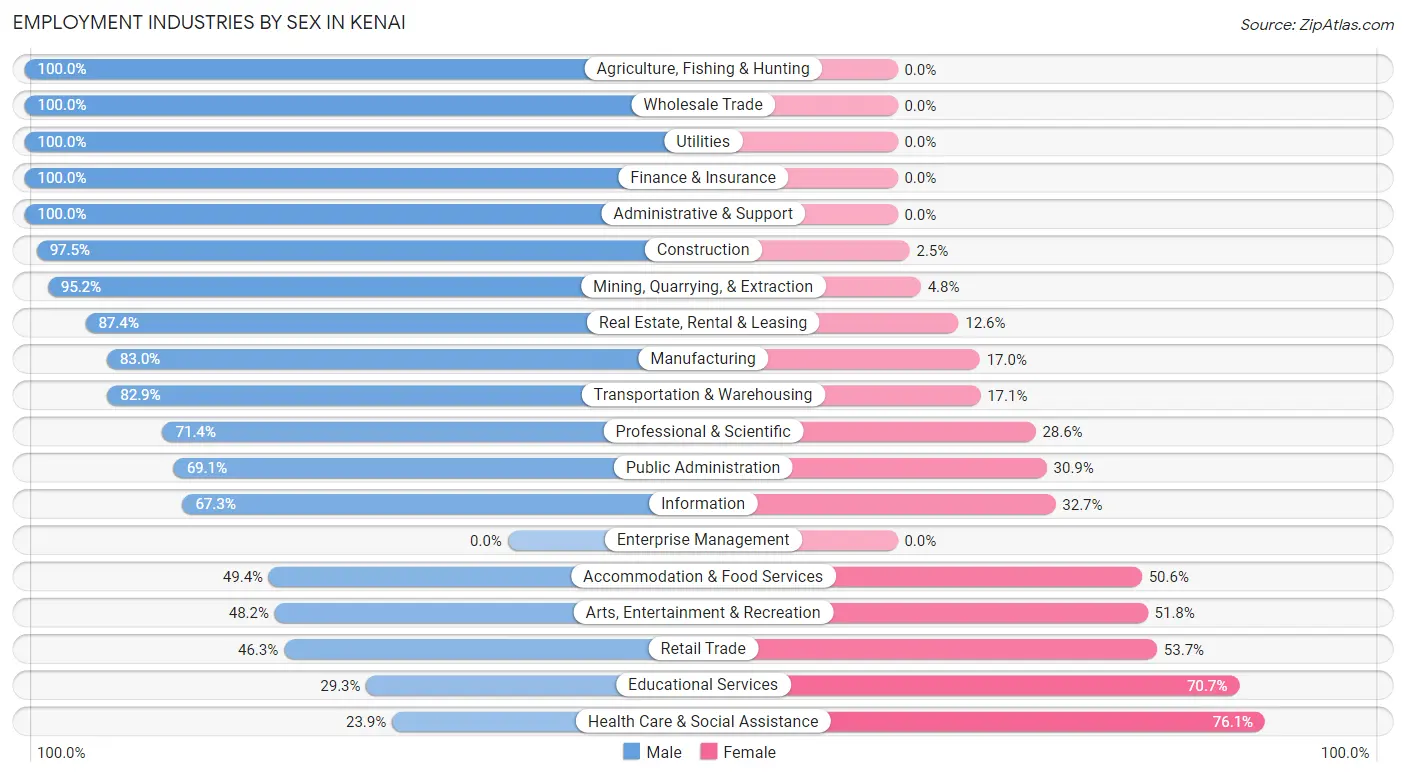
Employment Industries by Sex in Kenai
The Kenai industries that see more men than women are Agriculture, Fishing & Hunting (100.0%), Wholesale Trade (100.0%), and Utilities (100.0%), whereas the industries that tend to have a higher number of women are Health Care & Social Assistance (76.1%), Educational Services (70.7%), and Retail Trade (53.7%).
| Industry | Male | Female |
| Agriculture, Fishing & Hunting | 29 (100.0%) | 0 (0.0%) |
| Mining, Quarrying, & Extraction | 217 (95.2%) | 11 (4.8%) |
| Construction | 349 (97.5%) | 9 (2.5%) |
| Manufacturing | 112 (83.0%) | 23 (17.0%) |
| Wholesale Trade | 30 (100.0%) | 0 (0.0%) |
| Retail Trade | 187 (46.3%) | 217 (53.7%) |
| Transportation & Warehousing | 116 (82.9%) | 24 (17.1%) |
| Utilities | 15 (100.0%) | 0 (0.0%) |
| Information | 35 (67.3%) | 17 (32.7%) |
| Finance & Insurance | 46 (100.0%) | 0 (0.0%) |
| Real Estate, Rental & Leasing | 97 (87.4%) | 14 (12.6%) |
| Professional & Scientific | 25 (71.4%) | 10 (28.6%) |
| Enterprise Management | 0 (0.0%) | 0 (0.0%) |
| Administrative & Support | 55 (100.0%) | 0 (0.0%) |
| Educational Services | 103 (29.3%) | 249 (70.7%) |
| Health Care & Social Assistance | 175 (23.9%) | 556 (76.1%) |
| Arts, Entertainment & Recreation | 27 (48.2%) | 29 (51.8%) |
| Accommodation & Food Services | 131 (49.4%) | 134 (50.6%) |
| Public Administration | 188 (69.1%) | 84 (30.9%) |
| Total | 2,043 (59.2%) | 1,408 (40.8%) |
Education in Kenai
School Enrollment in Kenai
The most common levels of schooling among the 1,612 students in Kenai are middle school (440 | 27.3%), elementary school (414 | 25.7%), and high school (312 | 19.4%).
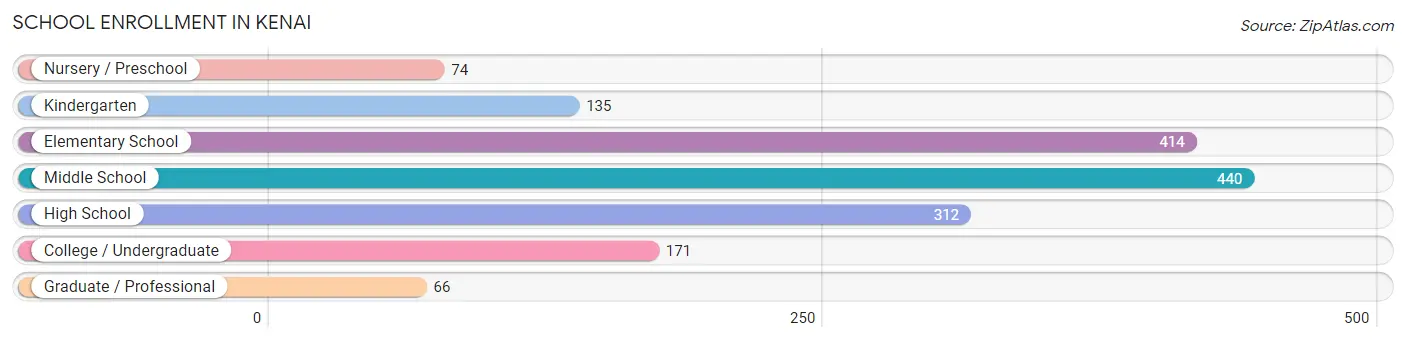
| School Level | # Students | % Students |
| Nursery / Preschool | 74 | 4.6% |
| Kindergarten | 135 | 8.4% |
| Elementary School | 414 | 25.7% |
| Middle School | 440 | 27.3% |
| High School | 312 | 19.4% |
| College / Undergraduate | 171 | 10.6% |
| Graduate / Professional | 66 | 4.1% |
| Total | 1,612 | 100.0% |
School Enrollment by Age by Funding Source in Kenai
Out of a total of 1,612 students who are enrolled in schools in Kenai, 292 (18.1%) attend a private institution, while the remaining 1,320 (81.9%) are enrolled in public schools. The age group of 3 to 4 year olds has the highest likelihood of being enrolled in private schools, with 15 (100.0% in the age bracket) enrolled. Conversely, the age group of 18 to 19 year olds has the lowest likelihood of being enrolled in a private school, with 65 (100.0% in the age bracket) attending a public institution.
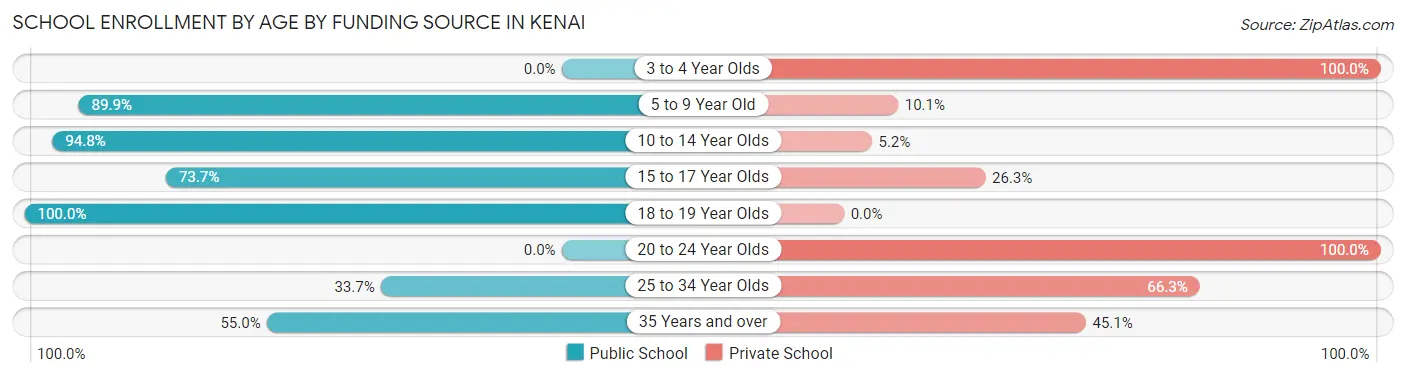
| Age Bracket | Public School | Private School |
| 3 to 4 Year Olds | 0 (0.0%) | 15 (100.0%) |
| 5 to 9 Year Old | 473 (89.9%) | 53 (10.1%) |
| 10 to 14 Year Olds | 512 (94.8%) | 28 (5.2%) |
| 15 to 17 Year Olds | 179 (73.7%) | 64 (26.3%) |
| 18 to 19 Year Olds | 65 (100.0%) | 0 (0.0%) |
| 20 to 24 Year Olds | 0 (0.0%) | 23 (100.0%) |
| 25 to 34 Year Olds | 30 (33.7%) | 59 (66.3%) |
| 35 Years and over | 61 (54.9%) | 50 (45.1%) |
| Total | 1,320 (81.9%) | 292 (18.1%) |
Educational Attainment by Field of Study in Kenai
Education (185 | 17.5%), physical & health sciences (135 | 12.8%), arts & humanities (135 | 12.8%), business (121 | 11.5%), and liberal arts & history (105 | 9.9%) are the most common fields of study among 1,057 individuals in Kenai who have obtained a bachelor's degree or higher.
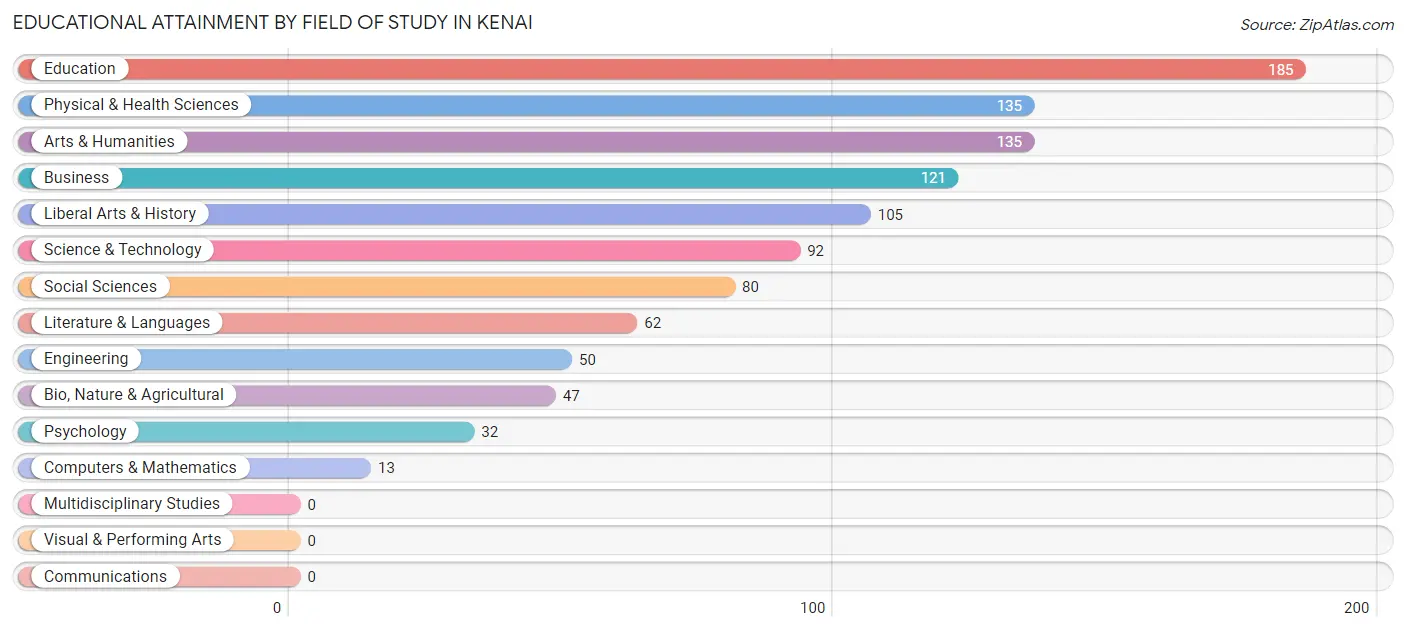
| Field of Study | # Graduates | % Graduates |
| Computers & Mathematics | 13 | 1.2% |
| Bio, Nature & Agricultural | 47 | 4.4% |
| Physical & Health Sciences | 135 | 12.8% |
| Psychology | 32 | 3.0% |
| Social Sciences | 80 | 7.6% |
| Engineering | 50 | 4.7% |
| Multidisciplinary Studies | 0 | 0.0% |
| Science & Technology | 92 | 8.7% |
| Business | 121 | 11.5% |
| Education | 185 | 17.5% |
| Literature & Languages | 62 | 5.9% |
| Liberal Arts & History | 105 | 9.9% |
| Visual & Performing Arts | 0 | 0.0% |
| Communications | 0 | 0.0% |
| Arts & Humanities | 135 | 12.8% |
| Total | 1,057 | 100.0% |
Transportation & Commute in Kenai
Vehicle Availability by Sex in Kenai
The most prevalent vehicle ownership categories in Kenai are males with 2 vehicles (733, accounting for 38.6%) and females with 2 vehicles (590, making up 53.9%).
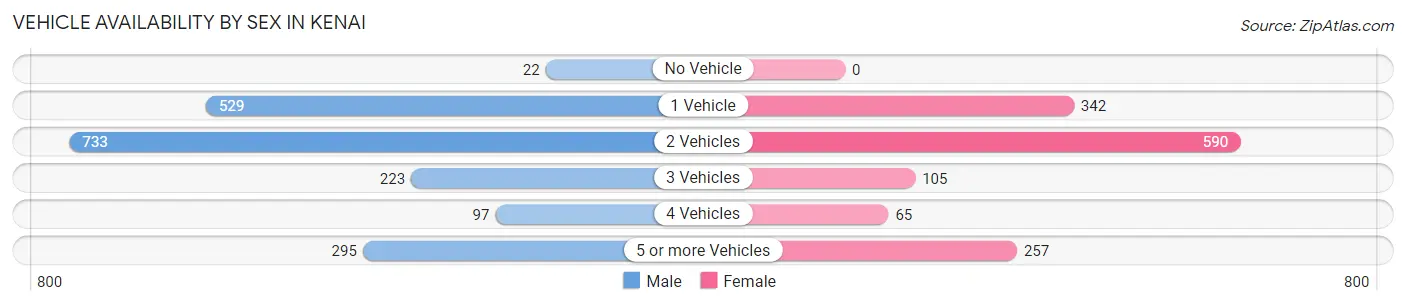
| Vehicles Available | Male | Female |
| No Vehicle | 22 (1.2%) | 0 (0.0%) |
| 1 Vehicle | 529 (27.9%) | 342 (25.2%) |
| 2 Vehicles | 733 (38.6%) | 590 (43.4%) |
| 3 Vehicles | 223 (11.7%) | 105 (7.7%) |
| 4 Vehicles | 97 (5.1%) | 65 (4.8%) |
| 5 or more Vehicles | 295 (15.5%) | 257 (18.9%) |
| Total | 1,899 (100.0%) | 1,359 (100.0%) |
Commute Time in Kenai
The most frequently occuring commute durations in Kenai are 10 to 14 minutes (670 commuters, 21.7%), 5 to 9 minutes (618 commuters, 20.0%), and 15 to 19 minutes (567 commuters, 18.4%).

| Commute Time | # Commuters | % Commuters |
| Less than 5 Minutes | 426 | 13.8% |
| 5 to 9 Minutes | 618 | 20.0% |
| 10 to 14 Minutes | 670 | 21.7% |
| 15 to 19 Minutes | 567 | 18.4% |
| 20 to 24 Minutes | 384 | 12.4% |
| 25 to 29 Minutes | 131 | 4.2% |
| 30 to 34 Minutes | 154 | 5.0% |
| 35 to 39 Minutes | 0 | 0.0% |
| 40 to 44 Minutes | 15 | 0.5% |
| 45 to 59 Minutes | 92 | 3.0% |
| 60 to 89 Minutes | 15 | 0.5% |
| 90 or more Minutes | 17 | 0.5% |
Commute Time by Sex in Kenai
The most common commute times in Kenai are 5 to 9 minutes (394 commuters, 21.8%) for males and 10 to 14 minutes (308 commuters, 24.0%) for females.
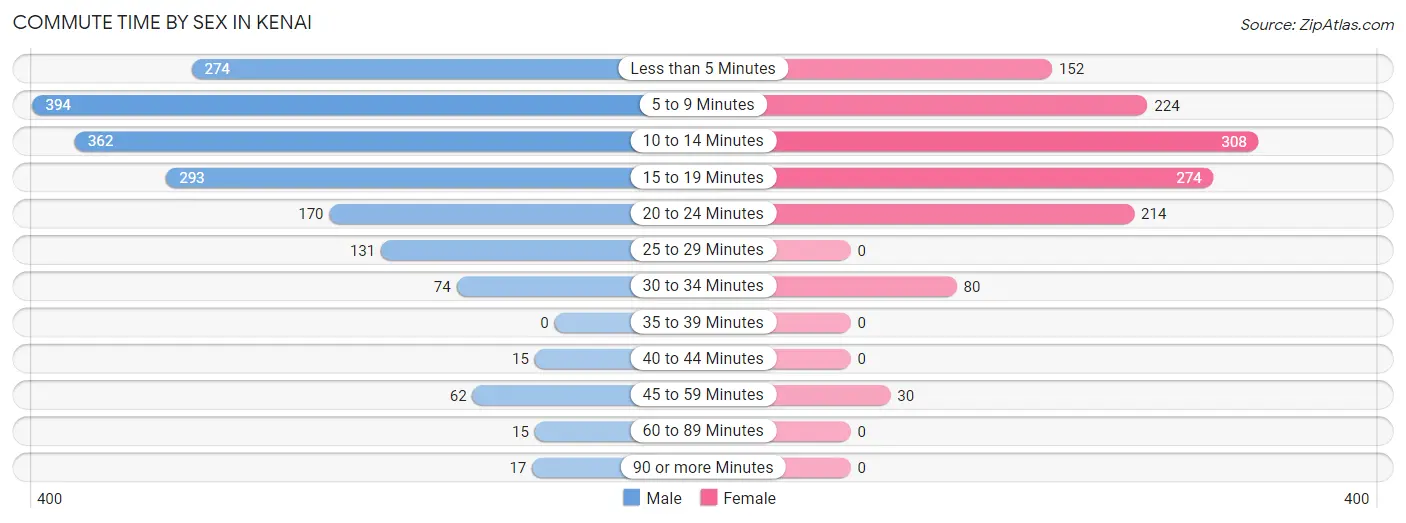
| Commute Time | Male | Female |
| Less than 5 Minutes | 274 (15.2%) | 152 (11.9%) |
| 5 to 9 Minutes | 394 (21.8%) | 224 (17.5%) |
| 10 to 14 Minutes | 362 (20.0%) | 308 (24.0%) |
| 15 to 19 Minutes | 293 (16.2%) | 274 (21.4%) |
| 20 to 24 Minutes | 170 (9.4%) | 214 (16.7%) |
| 25 to 29 Minutes | 131 (7.2%) | 0 (0.0%) |
| 30 to 34 Minutes | 74 (4.1%) | 80 (6.2%) |
| 35 to 39 Minutes | 0 (0.0%) | 0 (0.0%) |
| 40 to 44 Minutes | 15 (0.8%) | 0 (0.0%) |
| 45 to 59 Minutes | 62 (3.4%) | 30 (2.3%) |
| 60 to 89 Minutes | 15 (0.8%) | 0 (0.0%) |
| 90 or more Minutes | 17 (0.9%) | 0 (0.0%) |
Time of Departure to Work by Sex in Kenai
The most frequent times of departure to work in Kenai are 7:30 AM to 7:59 AM (376, 20.8%) for males and 8:00 AM to 8:29 AM (233, 18.2%) for females.
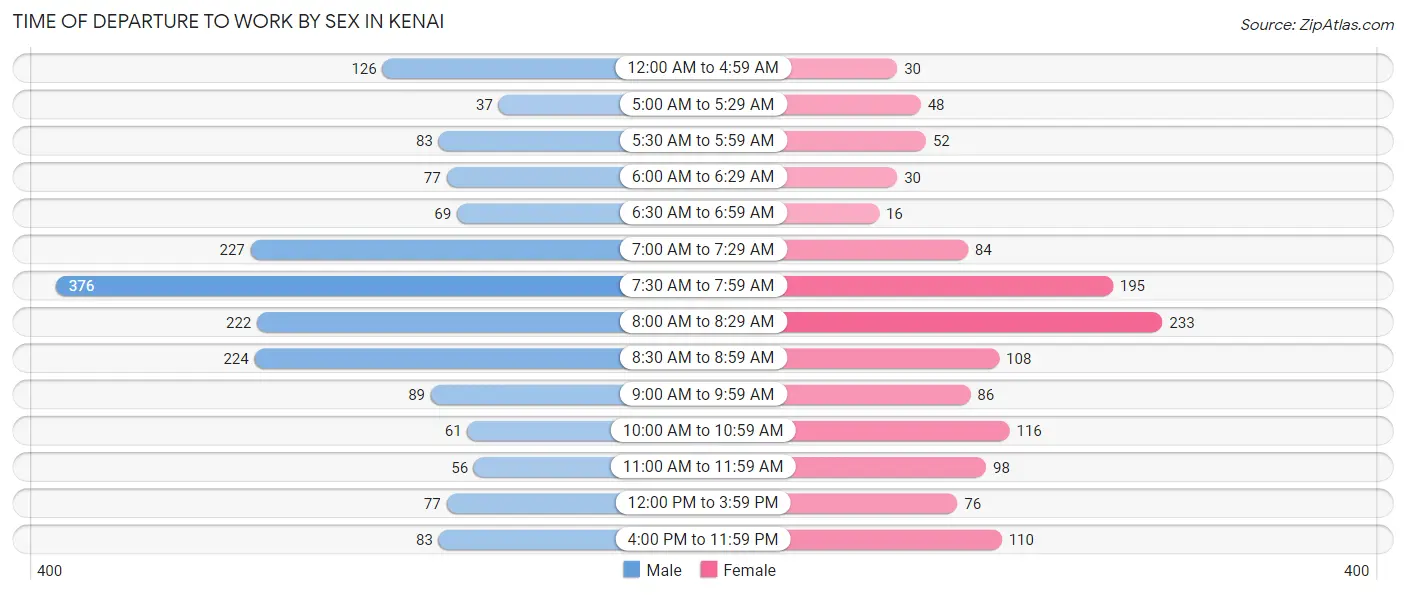
| Time of Departure | Male | Female |
| 12:00 AM to 4:59 AM | 126 (7.0%) | 30 (2.3%) |
| 5:00 AM to 5:29 AM | 37 (2.1%) | 48 (3.7%) |
| 5:30 AM to 5:59 AM | 83 (4.6%) | 52 (4.1%) |
| 6:00 AM to 6:29 AM | 77 (4.3%) | 30 (2.3%) |
| 6:30 AM to 6:59 AM | 69 (3.8%) | 16 (1.3%) |
| 7:00 AM to 7:29 AM | 227 (12.6%) | 84 (6.6%) |
| 7:30 AM to 7:59 AM | 376 (20.8%) | 195 (15.2%) |
| 8:00 AM to 8:29 AM | 222 (12.3%) | 233 (18.2%) |
| 8:30 AM to 8:59 AM | 224 (12.4%) | 108 (8.4%) |
| 9:00 AM to 9:59 AM | 89 (4.9%) | 86 (6.7%) |
| 10:00 AM to 10:59 AM | 61 (3.4%) | 116 (9.0%) |
| 11:00 AM to 11:59 AM | 56 (3.1%) | 98 (7.6%) |
| 12:00 PM to 3:59 PM | 77 (4.3%) | 76 (5.9%) |
| 4:00 PM to 11:59 PM | 83 (4.6%) | 110 (8.6%) |
| Total | 1,807 (100.0%) | 1,282 (100.0%) |
Housing Occupancy in Kenai
Occupancy by Ownership in Kenai
Of the total 2,870 dwellings in Kenai, owner-occupied units account for 1,819 (63.4%), while renter-occupied units make up 1,051 (36.6%).
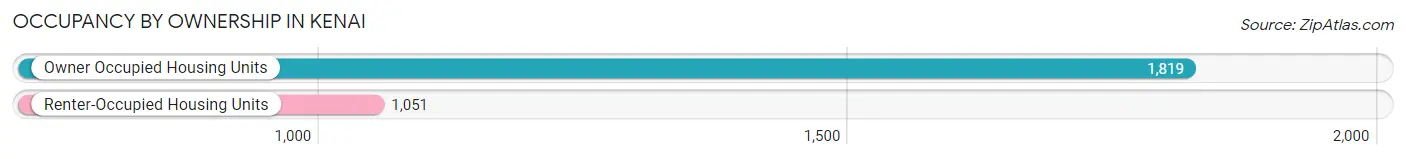
| Occupancy | # Housing Units | % Housing Units |
| Owner Occupied Housing Units | 1,819 | 63.4% |
| Renter-Occupied Housing Units | 1,051 | 36.6% |
| Total Occupied Housing Units | 2,870 | 100.0% |
Occupancy by Household Size in Kenai
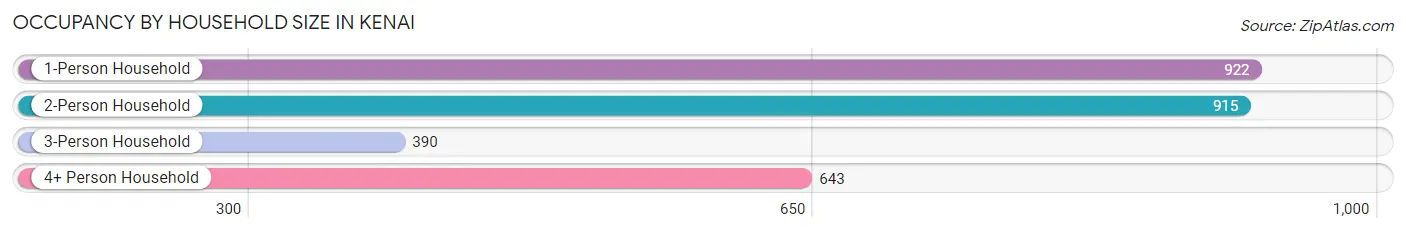
| Household Size | # Housing Units | % Housing Units |
| 1-Person Household | 922 | 32.1% |
| 2-Person Household | 915 | 31.9% |
| 3-Person Household | 390 | 13.6% |
| 4+ Person Household | 643 | 22.4% |
| Total Housing Units | 2,870 | 100.0% |
Occupancy by Ownership by Household Size in Kenai
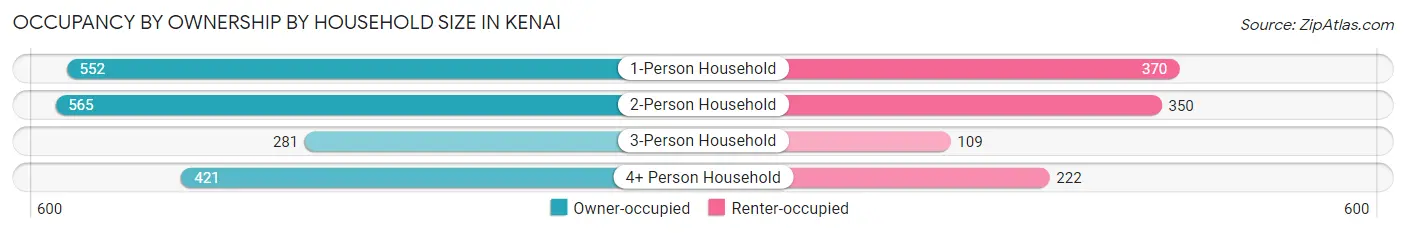
| Household Size | Owner-occupied | Renter-occupied |
| 1-Person Household | 552 (59.9%) | 370 (40.1%) |
| 2-Person Household | 565 (61.8%) | 350 (38.3%) |
| 3-Person Household | 281 (72.1%) | 109 (28.0%) |
| 4+ Person Household | 421 (65.5%) | 222 (34.5%) |
| Total Housing Units | 1,819 (63.4%) | 1,051 (36.6%) |
Occupancy by Educational Attainment in Kenai
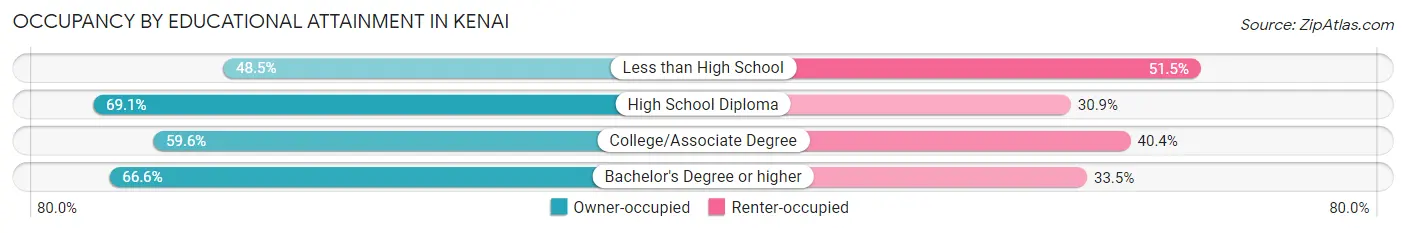
| Household Size | Owner-occupied | Renter-occupied |
| Less than High School | 65 (48.5%) | 69 (51.5%) |
| High School Diploma | 591 (69.1%) | 264 (30.9%) |
| College/Associate Degree | 767 (59.6%) | 519 (40.4%) |
| Bachelor's Degree or higher | 396 (66.5%) | 199 (33.5%) |
Occupancy by Age of Householder in Kenai
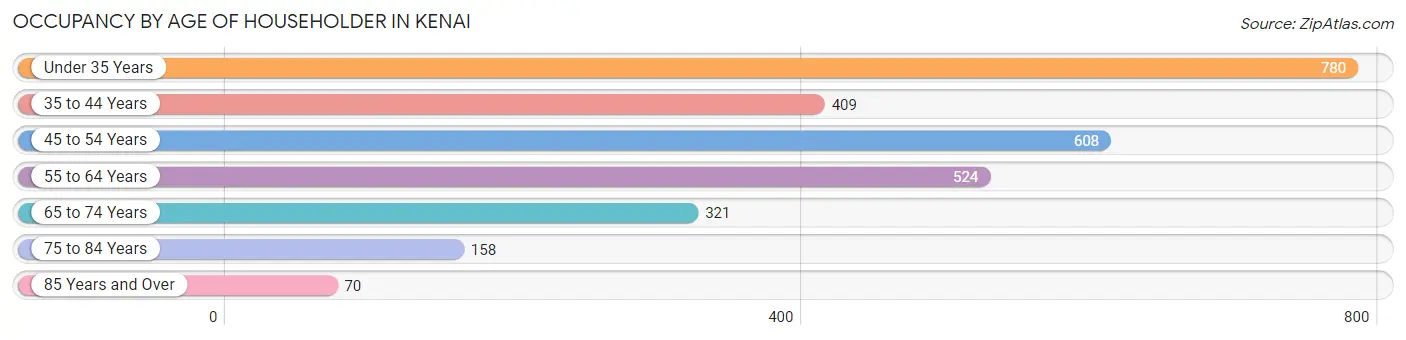
| Age Bracket | # Households | % Households |
| Under 35 Years | 780 | 27.2% |
| 35 to 44 Years | 409 | 14.2% |
| 45 to 54 Years | 608 | 21.2% |
| 55 to 64 Years | 524 | 18.3% |
| 65 to 74 Years | 321 | 11.2% |
| 75 to 84 Years | 158 | 5.5% |
| 85 Years and Over | 70 | 2.4% |
| Total | 2,870 | 100.0% |
Housing Finances in Kenai
Median Income by Occupancy in Kenai
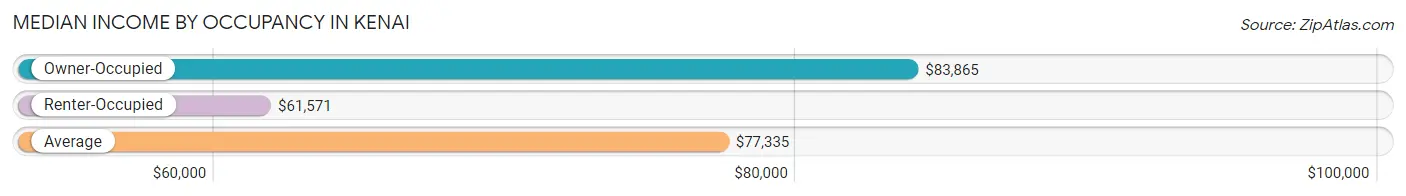
| Occupancy Type | # Households | Median Income |
| Owner-Occupied | 1,819 (63.4%) | $83,865 |
| Renter-Occupied | 1,051 (36.6%) | $61,571 |
| Average | 2,870 (100.0%) | $77,335 |
Occupancy by Householder Income Bracket in Kenai
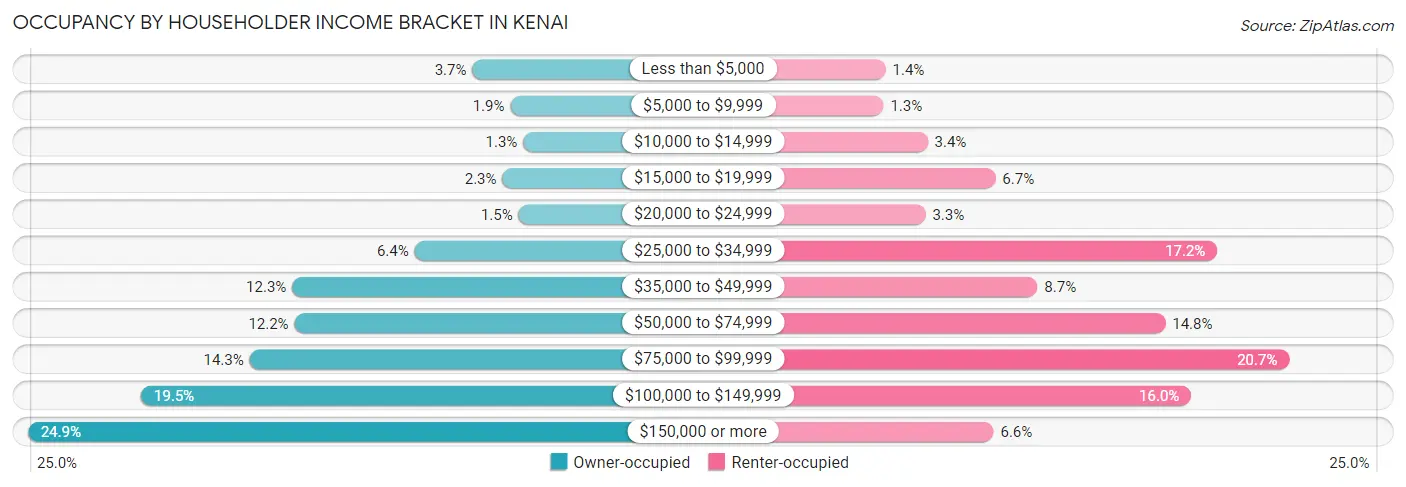
| Income Bracket | Owner-occupied | Renter-occupied |
| Less than $5,000 | 67 (3.7%) | 15 (1.4%) |
| $5,000 to $9,999 | 34 (1.9%) | 14 (1.3%) |
| $10,000 to $14,999 | 23 (1.3%) | 36 (3.4%) |
| $15,000 to $19,999 | 41 (2.2%) | 70 (6.7%) |
| $20,000 to $24,999 | 27 (1.5%) | 35 (3.3%) |
| $25,000 to $34,999 | 117 (6.4%) | 181 (17.2%) |
| $35,000 to $49,999 | 223 (12.3%) | 91 (8.7%) |
| $50,000 to $74,999 | 221 (12.1%) | 155 (14.7%) |
| $75,000 to $99,999 | 260 (14.3%) | 217 (20.6%) |
| $100,000 to $149,999 | 354 (19.5%) | 168 (16.0%) |
| $150,000 or more | 452 (24.8%) | 69 (6.6%) |
| Total | 1,819 (100.0%) | 1,051 (100.0%) |
Monthly Housing Cost Tiers in Kenai
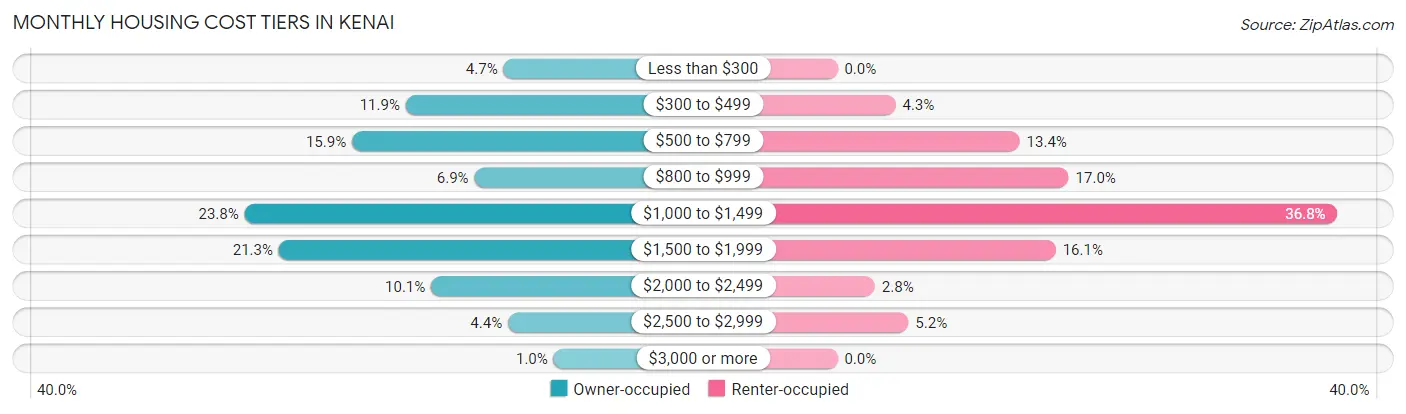
| Monthly Cost | Owner-occupied | Renter-occupied |
| Less than $300 | 86 (4.7%) | 0 (0.0%) |
| $300 to $499 | 217 (11.9%) | 45 (4.3%) |
| $500 to $799 | 289 (15.9%) | 141 (13.4%) |
| $800 to $999 | 125 (6.9%) | 179 (17.0%) |
| $1,000 to $1,499 | 433 (23.8%) | 387 (36.8%) |
| $1,500 to $1,999 | 387 (21.3%) | 169 (16.1%) |
| $2,000 to $2,499 | 183 (10.1%) | 29 (2.8%) |
| $2,500 to $2,999 | 80 (4.4%) | 55 (5.2%) |
| $3,000 or more | 19 (1.0%) | 0 (0.0%) |
| Total | 1,819 (100.0%) | 1,051 (100.0%) |
Physical Housing Characteristics in Kenai
Housing Structures in Kenai
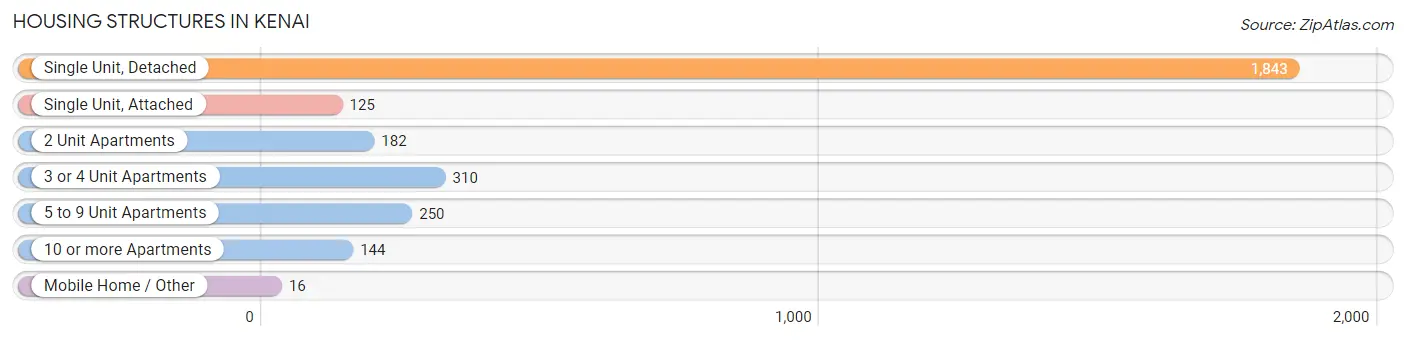
| Structure Type | # Housing Units | % Housing Units |
| Single Unit, Detached | 1,843 | 64.2% |
| Single Unit, Attached | 125 | 4.4% |
| 2 Unit Apartments | 182 | 6.3% |
| 3 or 4 Unit Apartments | 310 | 10.8% |
| 5 to 9 Unit Apartments | 250 | 8.7% |
| 10 or more Apartments | 144 | 5.0% |
| Mobile Home / Other | 16 | 0.6% |
| Total | 2,870 | 100.0% |
Housing Structures by Occupancy in Kenai
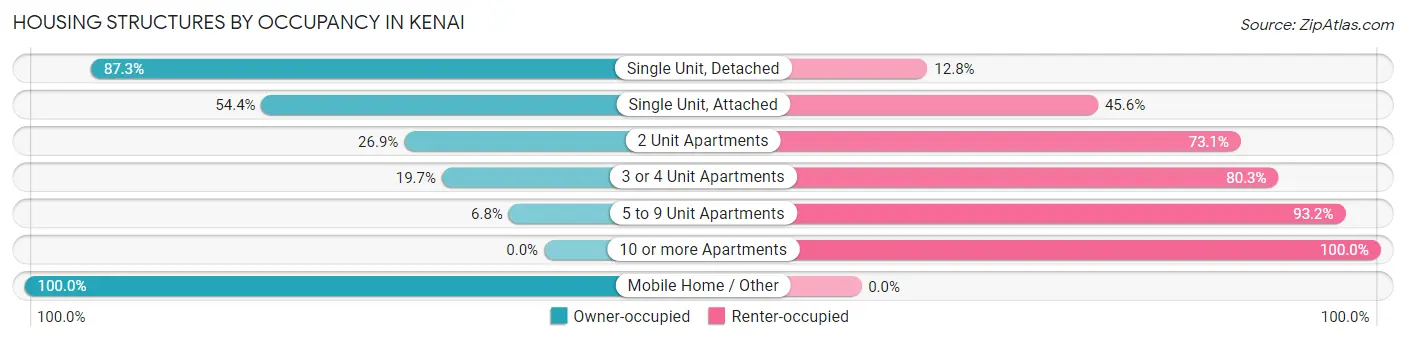
| Structure Type | Owner-occupied | Renter-occupied |
| Single Unit, Detached | 1,608 (87.3%) | 235 (12.8%) |
| Single Unit, Attached | 68 (54.4%) | 57 (45.6%) |
| 2 Unit Apartments | 49 (26.9%) | 133 (73.1%) |
| 3 or 4 Unit Apartments | 61 (19.7%) | 249 (80.3%) |
| 5 to 9 Unit Apartments | 17 (6.8%) | 233 (93.2%) |
| 10 or more Apartments | 0 (0.0%) | 144 (100.0%) |
| Mobile Home / Other | 16 (100.0%) | 0 (0.0%) |
| Total | 1,819 (63.4%) | 1,051 (36.6%) |
Housing Structures by Number of Rooms in Kenai
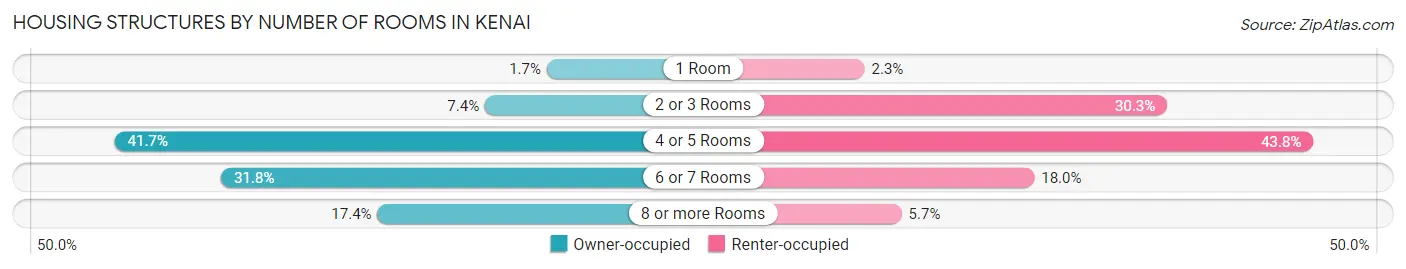
| Number of Rooms | Owner-occupied | Renter-occupied |
| 1 Room | 31 (1.7%) | 24 (2.3%) |
| 2 or 3 Rooms | 135 (7.4%) | 318 (30.3%) |
| 4 or 5 Rooms | 758 (41.7%) | 460 (43.8%) |
| 6 or 7 Rooms | 579 (31.8%) | 189 (18.0%) |
| 8 or more Rooms | 316 (17.4%) | 60 (5.7%) |
| Total | 1,819 (100.0%) | 1,051 (100.0%) |
Housing Structure by Heating Type in Kenai
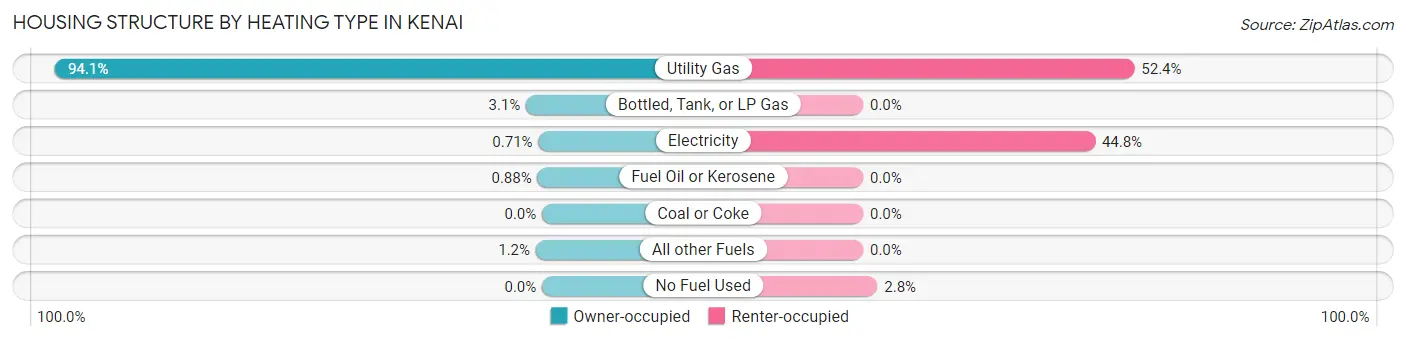
| Heating Type | Owner-occupied | Renter-occupied |
| Utility Gas | 1,712 (94.1%) | 551 (52.4%) |
| Bottled, Tank, or LP Gas | 56 (3.1%) | 0 (0.0%) |
| Electricity | 13 (0.7%) | 471 (44.8%) |
| Fuel Oil or Kerosene | 16 (0.9%) | 0 (0.0%) |
| Coal or Coke | 0 (0.0%) | 0 (0.0%) |
| All other Fuels | 22 (1.2%) | 0 (0.0%) |
| No Fuel Used | 0 (0.0%) | 29 (2.8%) |
| Total | 1,819 (100.0%) | 1,051 (100.0%) |
Household Vehicle Usage in Kenai
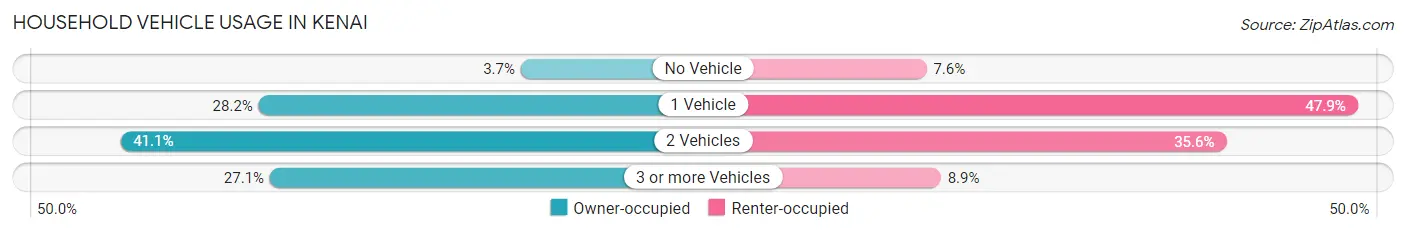
| Vehicles per Household | Owner-occupied | Renter-occupied |
| No Vehicle | 67 (3.7%) | 80 (7.6%) |
| 1 Vehicle | 512 (28.1%) | 503 (47.9%) |
| 2 Vehicles | 747 (41.1%) | 374 (35.6%) |
| 3 or more Vehicles | 493 (27.1%) | 94 (8.9%) |
| Total | 1,819 (100.0%) | 1,051 (100.0%) |
Real Estate & Mortgages in Kenai
Real Estate and Mortgage Overview in Kenai
| Characteristic | Without Mortgage | With Mortgage |
| Housing Units | 625 | 1,194 |
| Median Property Value | $233,000 | $256,800 |
| Median Household Income | $76,652 | $338 |
| Monthly Housing Costs | $548 | $19 |
| Real Estate Taxes | $1,336 | $71 |
Property Value by Mortgage Status in Kenai
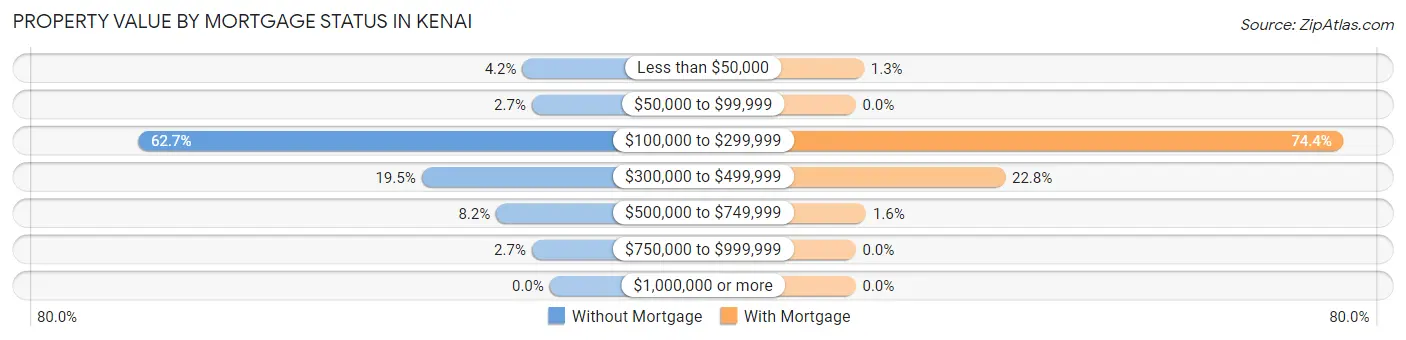
| Property Value | Without Mortgage | With Mortgage |
| Less than $50,000 | 26 (4.2%) | 15 (1.3%) |
| $50,000 to $99,999 | 17 (2.7%) | 0 (0.0%) |
| $100,000 to $299,999 | 392 (62.7%) | 888 (74.4%) |
| $300,000 to $499,999 | 122 (19.5%) | 272 (22.8%) |
| $500,000 to $749,999 | 51 (8.2%) | 19 (1.6%) |
| $750,000 to $999,999 | 17 (2.7%) | 0 (0.0%) |
| $1,000,000 or more | 0 (0.0%) | 0 (0.0%) |
| Total | 625 (100.0%) | 1,194 (100.0%) |
Household Income by Mortgage Status in Kenai
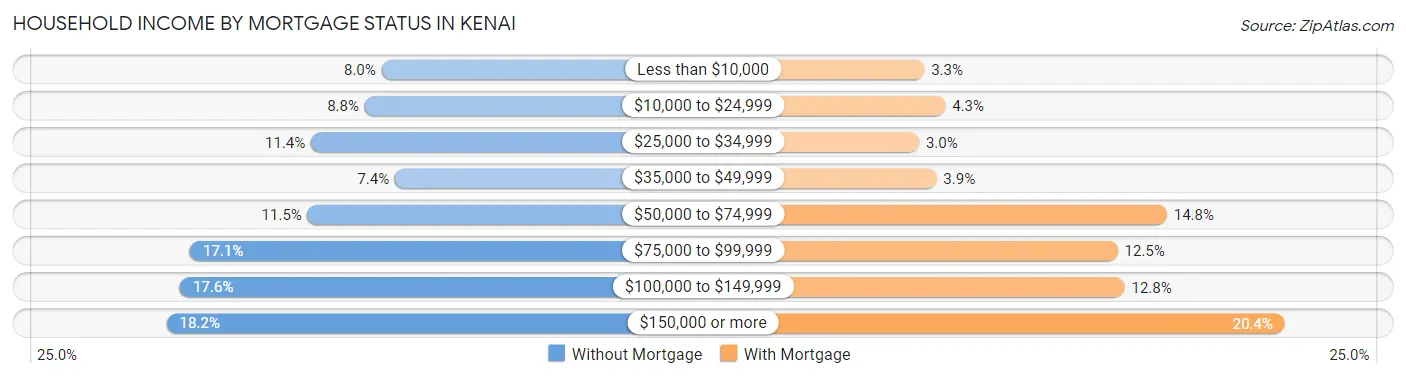
| Household Income | Without Mortgage | With Mortgage |
| Less than $10,000 | 50 (8.0%) | 39 (3.3%) |
| $10,000 to $24,999 | 55 (8.8%) | 51 (4.3%) |
| $25,000 to $34,999 | 71 (11.4%) | 36 (3.0%) |
| $35,000 to $49,999 | 46 (7.4%) | 46 (3.8%) |
| $50,000 to $74,999 | 72 (11.5%) | 177 (14.8%) |
| $75,000 to $99,999 | 107 (17.1%) | 149 (12.5%) |
| $100,000 to $149,999 | 110 (17.6%) | 153 (12.8%) |
| $150,000 or more | 114 (18.2%) | 244 (20.4%) |
| Total | 625 (100.0%) | 1,194 (100.0%) |
Property Value to Household Income Ratio in Kenai
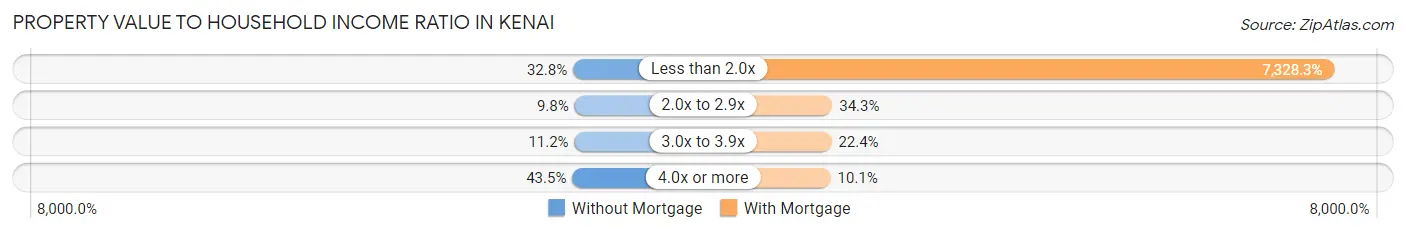
| Value-to-Income Ratio | Without Mortgage | With Mortgage |
| Less than 2.0x | 205 (32.8%) | 87,500 (7,328.3%) |
| 2.0x to 2.9x | 61 (9.8%) | 409 (34.3%) |
| 3.0x to 3.9x | 70 (11.2%) | 267 (22.4%) |
| 4.0x or more | 272 (43.5%) | 120 (10.1%) |
| Total | 625 (100.0%) | 1,194 (100.0%) |
Real Estate Taxes by Mortgage Status in Kenai
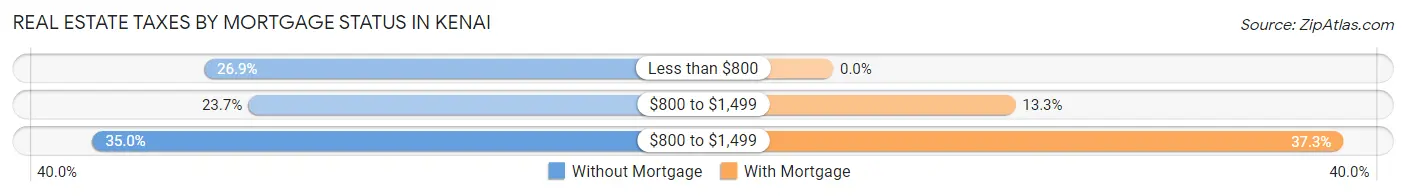
| Property Taxes | Without Mortgage | With Mortgage |
| Less than $800 | 168 (26.9%) | 0 (0.0%) |
| $800 to $1,499 | 148 (23.7%) | 159 (13.3%) |
| $800 to $1,499 | 219 (35.0%) | 445 (37.3%) |
| Total | 625 (100.0%) | 1,194 (100.0%) |
Health & Disability in Kenai
Health Insurance Coverage by Age in Kenai
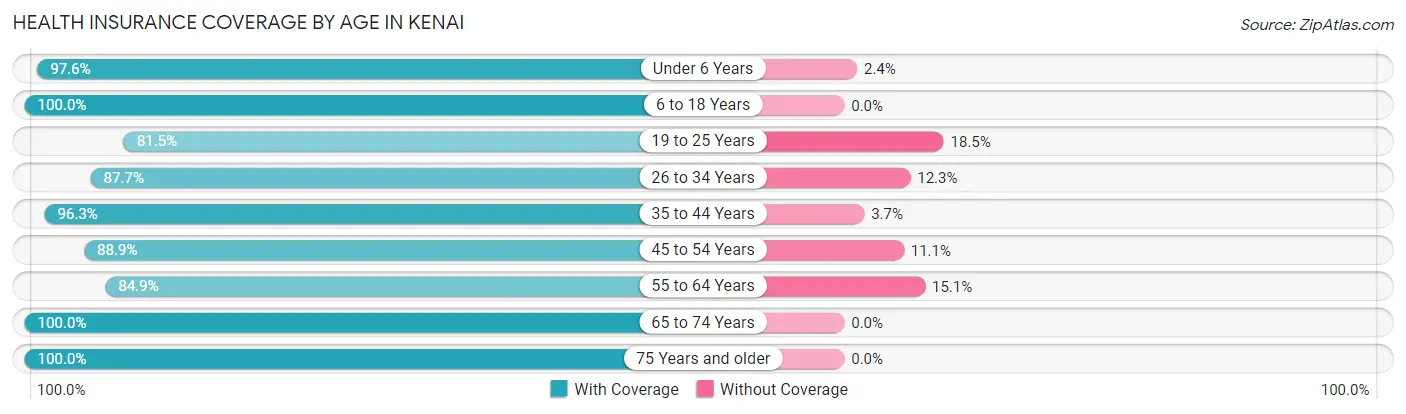
| Age Bracket | With Coverage | Without Coverage |
| Under 6 Years | 616 (97.6%) | 15 (2.4%) |
| 6 to 18 Years | 1,236 (100.0%) | 0 (0.0%) |
| 19 to 25 Years | 616 (81.5%) | 140 (18.5%) |
| 26 to 34 Years | 1,097 (87.7%) | 154 (12.3%) |
| 35 to 44 Years | 830 (96.3%) | 32 (3.7%) |
| 45 to 54 Years | 833 (88.9%) | 104 (11.1%) |
| 55 to 64 Years | 767 (84.9%) | 136 (15.1%) |
| 65 to 74 Years | 551 (100.0%) | 0 (0.0%) |
| 75 Years and older | 311 (100.0%) | 0 (0.0%) |
| Total | 6,857 (92.2%) | 581 (7.8%) |
Health Insurance Coverage by Citizenship Status in Kenai
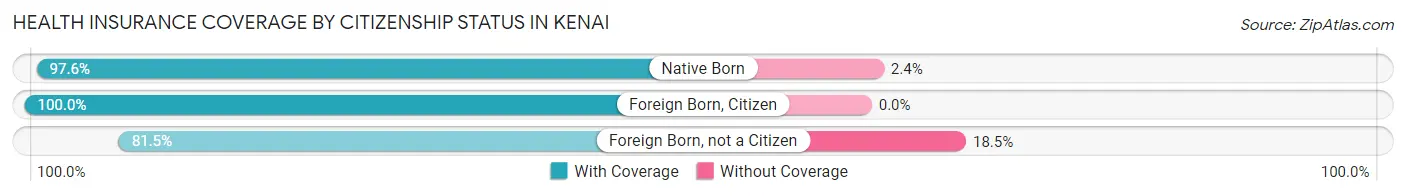
| Citizenship Status | With Coverage | Without Coverage |
| Native Born | 616 (97.6%) | 15 (2.4%) |
| Foreign Born, Citizen | 1,236 (100.0%) | 0 (0.0%) |
| Foreign Born, not a Citizen | 616 (81.5%) | 140 (18.5%) |
Health Insurance Coverage by Household Income in Kenai
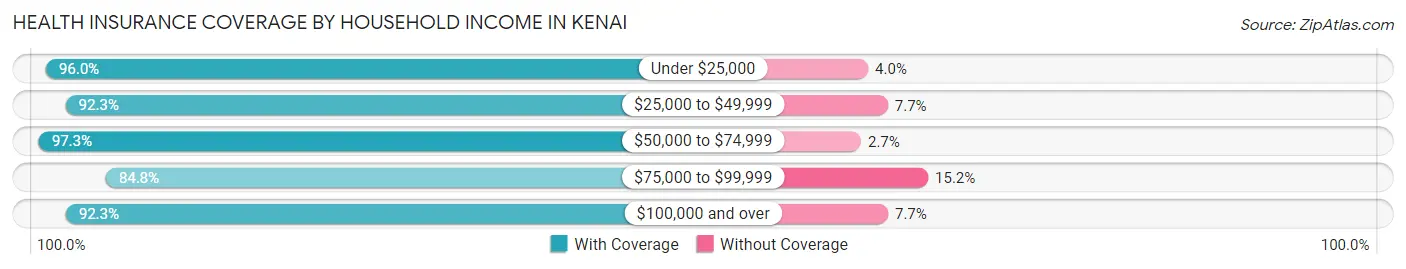
| Household Income | With Coverage | Without Coverage |
| Under $25,000 | 456 (96.0%) | 19 (4.0%) |
| $25,000 to $49,999 | 1,345 (92.3%) | 112 (7.7%) |
| $50,000 to $74,999 | 1,019 (97.3%) | 28 (2.7%) |
| $75,000 to $99,999 | 902 (84.8%) | 162 (15.2%) |
| $100,000 and over | 3,091 (92.3%) | 259 (7.7%) |
Public vs Private Health Insurance Coverage by Age in Kenai
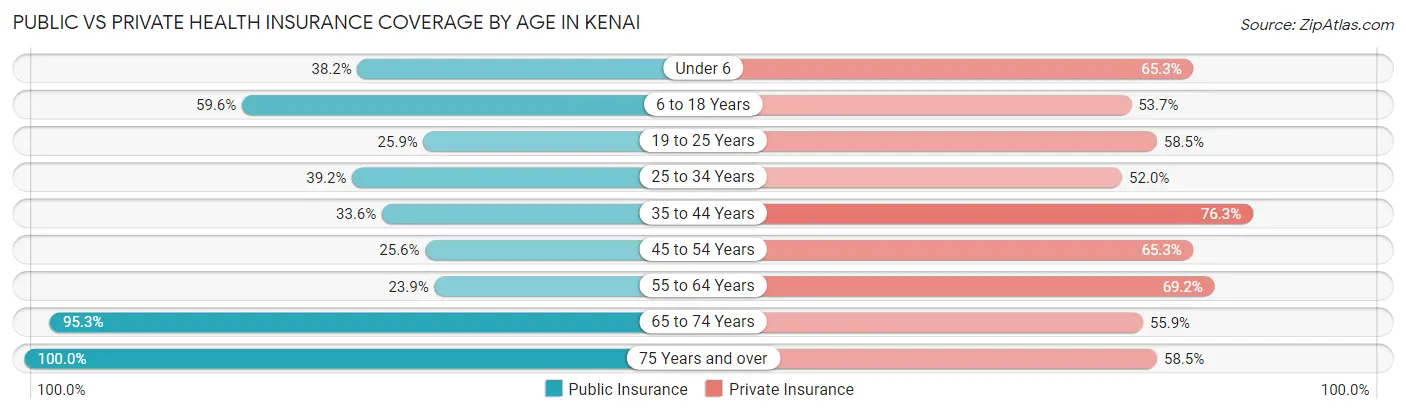
| Age Bracket | Public Insurance | Private Insurance |
| Under 6 | 241 (38.2%) | 412 (65.3%) |
| 6 to 18 Years | 737 (59.6%) | 664 (53.7%) |
| 19 to 25 Years | 196 (25.9%) | 442 (58.5%) |
| 25 to 34 Years | 490 (39.2%) | 651 (52.0%) |
| 35 to 44 Years | 290 (33.6%) | 658 (76.3%) |
| 45 to 54 Years | 240 (25.6%) | 612 (65.3%) |
| 55 to 64 Years | 216 (23.9%) | 625 (69.2%) |
| 65 to 74 Years | 525 (95.3%) | 308 (55.9%) |
| 75 Years and over | 311 (100.0%) | 182 (58.5%) |
| Total | 3,246 (43.6%) | 4,554 (61.2%) |
Disability Status by Sex by Age in Kenai
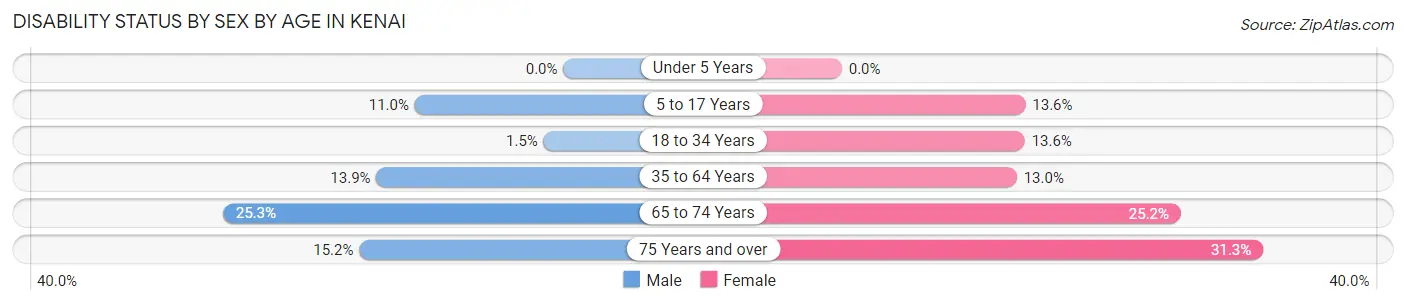
| Age Bracket | Male | Female |
| Under 5 Years | 0 (0.0%) | 0 (0.0%) |
| 5 to 17 Years | 58 (11.0%) | 110 (13.6%) |
| 18 to 34 Years | 16 (1.5%) | 134 (13.6%) |
| 35 to 64 Years | 203 (13.9%) | 161 (13.0%) |
| 65 to 74 Years | 67 (25.3%) | 72 (25.2%) |
| 75 Years and over | 20 (15.1%) | 56 (31.3%) |
Disability Class by Sex by Age in Kenai
Disability Class: Hearing Difficulty
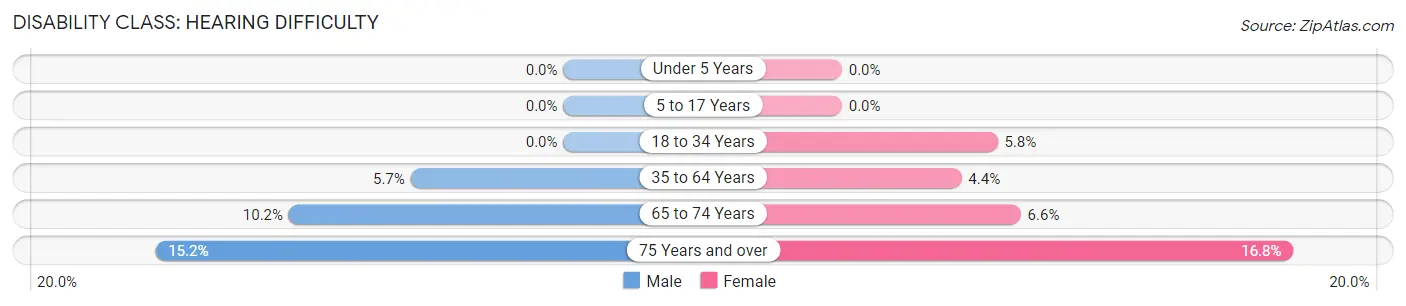
| Age Bracket | Male | Female |
| Under 5 Years | 0 (0.0%) | 0 (0.0%) |
| 5 to 17 Years | 0 (0.0%) | 0 (0.0%) |
| 18 to 34 Years | 0 (0.0%) | 57 (5.8%) |
| 35 to 64 Years | 83 (5.7%) | 55 (4.4%) |
| 65 to 74 Years | 27 (10.2%) | 19 (6.6%) |
| 75 Years and over | 20 (15.1%) | 30 (16.8%) |
Disability Class: Vision Difficulty
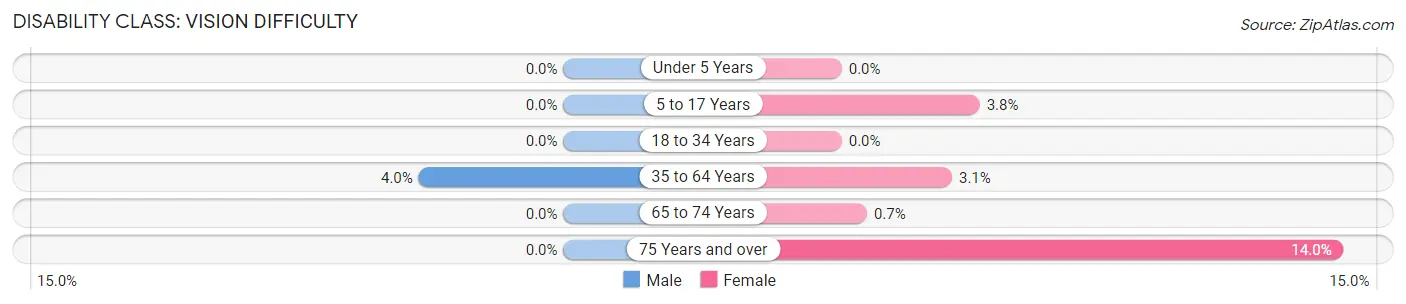
| Age Bracket | Male | Female |
| Under 5 Years | 0 (0.0%) | 0 (0.0%) |
| 5 to 17 Years | 0 (0.0%) | 31 (3.8%) |
| 18 to 34 Years | 0 (0.0%) | 0 (0.0%) |
| 35 to 64 Years | 59 (4.0%) | 38 (3.1%) |
| 65 to 74 Years | 0 (0.0%) | 2 (0.7%) |
| 75 Years and over | 0 (0.0%) | 25 (14.0%) |
Disability Class: Cognitive Difficulty
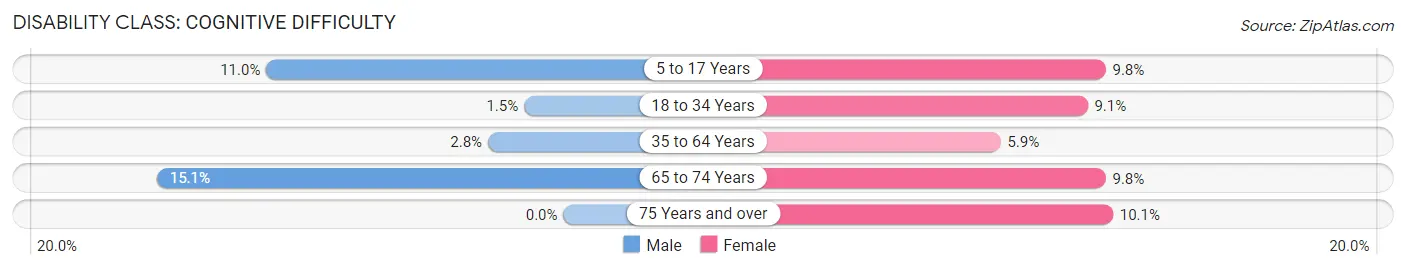
| Age Bracket | Male | Female |
| 5 to 17 Years | 58 (11.0%) | 79 (9.8%) |
| 18 to 34 Years | 16 (1.5%) | 90 (9.1%) |
| 35 to 64 Years | 41 (2.8%) | 73 (5.9%) |
| 65 to 74 Years | 40 (15.1%) | 28 (9.8%) |
| 75 Years and over | 0 (0.0%) | 18 (10.1%) |
Disability Class: Ambulatory Difficulty
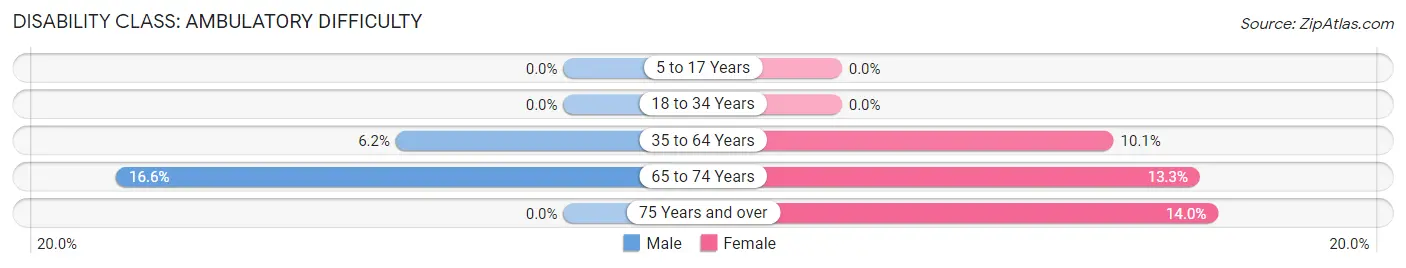
| Age Bracket | Male | Female |
| 5 to 17 Years | 0 (0.0%) | 0 (0.0%) |
| 18 to 34 Years | 0 (0.0%) | 0 (0.0%) |
| 35 to 64 Years | 91 (6.2%) | 125 (10.1%) |
| 65 to 74 Years | 44 (16.6%) | 38 (13.3%) |
| 75 Years and over | 0 (0.0%) | 25 (14.0%) |
Disability Class: Self-Care Difficulty
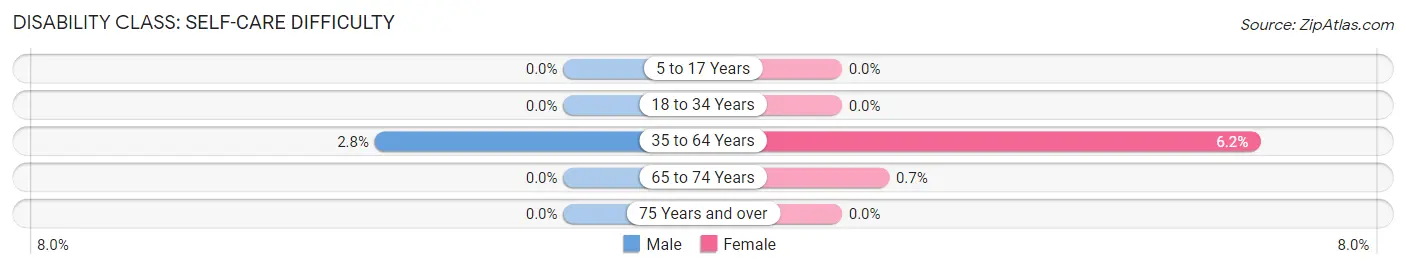
| Age Bracket | Male | Female |
| 5 to 17 Years | 0 (0.0%) | 0 (0.0%) |
| 18 to 34 Years | 0 (0.0%) | 0 (0.0%) |
| 35 to 64 Years | 41 (2.8%) | 77 (6.2%) |
| 65 to 74 Years | 0 (0.0%) | 2 (0.7%) |
| 75 Years and over | 0 (0.0%) | 0 (0.0%) |
Technology Access in Kenai
Computing Device Access in Kenai
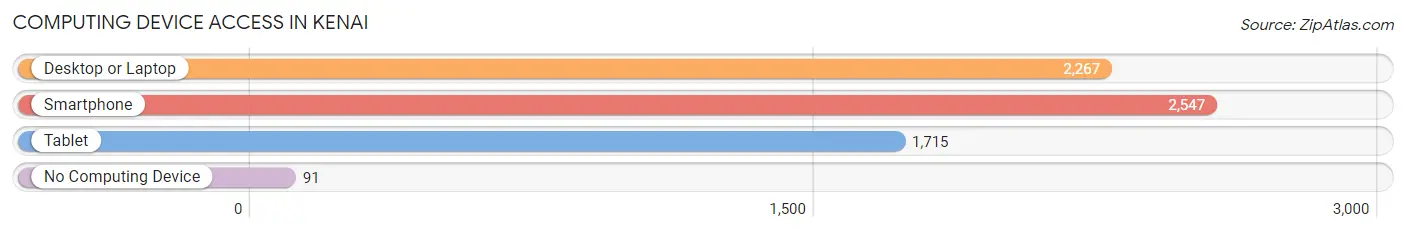
| Device Type | # Households | % Households |
| Desktop or Laptop | 2,267 | 79.0% |
| Smartphone | 2,547 | 88.7% |
| Tablet | 1,715 | 59.8% |
| No Computing Device | 91 | 3.2% |
| Total | 2,870 | 100.0% |
Internet Access in Kenai
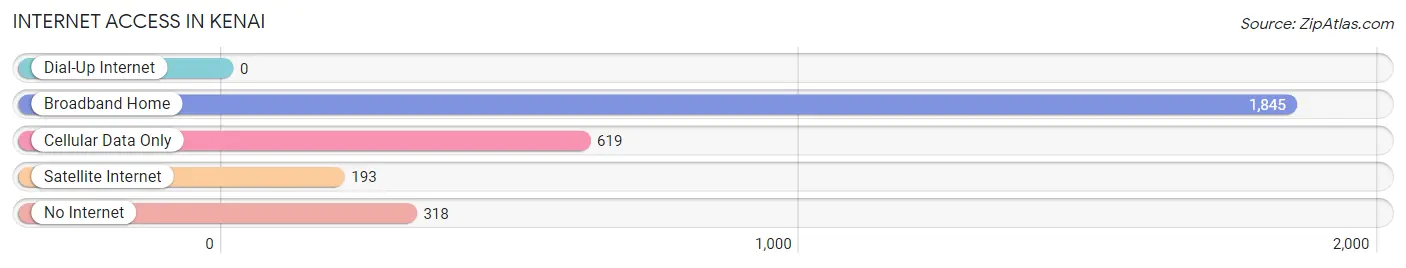
| Internet Type | # Households | % Households |
| Dial-Up Internet | 0 | 0.0% |
| Broadband Home | 1,845 | 64.3% |
| Cellular Data Only | 619 | 21.6% |
| Satellite Internet | 193 | 6.7% |
| No Internet | 318 | 11.1% |
| Total | 2,870 | 100.0% |
Kenai Summary
Kenai, Alaska is a city located on the Kenai Peninsula in the southcentral region of the state. It is the third largest city in Alaska, with a population of 7,100 as of the 2010 census. The city is located on the Kenai River, which flows into Cook Inlet, and is the gateway to the Kenai National Wildlife Refuge.
History
The area around Kenai has been inhabited for thousands of years by the Dena’ina Athabascan people. The first Europeans to explore the area were Russian fur traders in the late 1700s. The city of Kenai was founded in 1786 by the Russian-American Company, and was named after the Kenai River. The city was a major trading post for the fur trade, and was the site of the first Russian Orthodox Church in Alaska.
In 1867, the United States purchased Alaska from Russia, and the area around Kenai was incorporated into the Alaska Territory. The city was a major fishing center during the early 1900s, and was the site of the first salmon cannery in Alaska. In the 1950s, oil was discovered in the area, and the city became a major center for oil exploration and production.
Geography
Kenai is located on the Kenai Peninsula in southcentral Alaska, about 100 miles southwest of Anchorage. The city is situated on the Kenai River, which flows into Cook Inlet. The city is surrounded by mountains, including the Chugach Mountains to the east and the Kenai Mountains to the west. The city has a total area of 8.3 square miles, of which 8.2 square miles is land and 0.1 square miles is water.
Economy
Kenai’s economy is largely based on fishing, oil, and tourism. The city is home to several major fishing companies, including Trident Seafoods, Ocean Beauty Seafoods, and Alaska General Seafoods. The city is also a major center for oil exploration and production, with several major oil companies operating in the area. Tourism is also an important part of the local economy, with visitors coming to the area to fish, hunt, and explore the Kenai National Wildlife Refuge.
Demographics
As of the 2010 census, there were 7,100 people, 2,845 households, and 1,845 families residing in the city. The population density was 854.3 people per square mile. The racial makeup of the city was 79.2% White, 0.7% African American, 8.3% Native American, 0.7% Asian, 0.1% Pacific Islander, 0.3% from other races, and 10.7% from two or more races. Hispanic or Latino of any race were 3.2% of the population.
The median income for a household in the city was $50,938, and the median income for a family was $60,938. The per capita income for the city was $25,938. About 8.3% of families and 11.2% of the population were below the poverty line, including 15.2% of those under age 18 and 8.3% of those age 65 or over.
Conclusion
Kenai, Alaska is a city located on the Kenai Peninsula in the southcentral region of the state. It has a long history, dating back to the 1700s when it was founded by the Russian-American Company. The city is a major center for fishing, oil exploration and production, and tourism. As of the 2010 census, the population of Kenai was 7,100, with a median household income of $50,938.
Common Questions
What is Per Capita Income in Kenai?
Per Capita income in Kenai is $37,409.
What is the Median Family Income in Kenai?
Median Family Income in Kenai is $89,688.
What is the Median Household income in Kenai?
Median Household Income in Kenai is $77,335.
What is Income or Wage Gap in Kenai?
Income or Wage Gap in Kenai is 32.3%.
Women in Kenai earn 67.7 cents for every dollar earned by a man.
What is Inequality or Gini Index in Kenai?
Inequality or Gini Index in Kenai is 0.41.
What is the Total Population of Kenai?
Total Population of Kenai is 7,477.
What is the Total Male Population of Kenai?
Total Male Population of Kenai is 3,810.
What is the Total Female Population of Kenai?
Total Female Population of Kenai is 3,667.
What is the Ratio of Males per 100 Females in Kenai?
There are 103.90 Males per 100 Females in Kenai.
What is the Ratio of Females per 100 Males in Kenai?
There are 96.25 Females per 100 Males in Kenai.
What is the Median Population Age in Kenai?
Median Population Age in Kenai is 34.2 Years.
What is the Average Family Size in Kenai
Average Family Size in Kenai is 3.4 People.
What is the Average Household Size in Kenai
Average Household Size in Kenai is 2.6 People.
How Large is the Labor Force in Kenai?
There are 3,794 People in the Labor Forcein in Kenai.
What is the Percentage of People in the Labor Force in Kenai?
65.2% of People are in the Labor Force in Kenai.
What is the Unemployment Rate in Kenai?
Unemployment Rate in Kenai is 8.6%.