Soldotna, AK Map & Demographics
Soldotna Map
Soldotna Overview
$36,352
PER CAPITA INCOME
$87,022
AVG FAMILY INCOME
$67,365
AVG HOUSEHOLD INCOME
20.0%
WAGE / INCOME GAP [ % ]
80.0¢/ $1
WAGE / INCOME GAP [ $ ]
0.46
INEQUALITY / GINI INDEX
4,394
TOTAL POPULATION
1,930
MALE POPULATION
2,464
FEMALE POPULATION
78.33
MALES / 100 FEMALES
127.67
FEMALES / 100 MALES
37.1
MEDIAN AGE
3.1
AVG FAMILY SIZE
2.5
AVG HOUSEHOLD SIZE
2,188
LABOR FORCE [ PEOPLE ]
60.3%
PERCENT IN LABOR FORCE
5.6%
UNEMPLOYMENT RATE
Soldotna Zip Codes
Soldotna Area Codes
Income in Soldotna
Income Overview in Soldotna
Per Capita Income in Soldotna is $36,352, while median incomes of families and households are $87,022 and $67,365 respectively.
| Characteristic | Number | Measure |
| Per Capita Income | 4,394 | $36,352 |
| Median Family Income | 1,017 | $87,022 |
| Mean Family Income | 1,017 | $104,118 |
| Median Household Income | 1,739 | $67,365 |
| Mean Household Income | 1,739 | $86,396 |
| Income Deficit | 1,017 | $0 |
| Wage / Income Gap (%) | 4,394 | 20.04% |
| Wage / Income Gap ($) | 4,394 | 79.96¢ per $1 |
| Gini / Inequality Index | 4,394 | 0.46 |
Earnings by Sex in Soldotna
Average Earnings in Soldotna are $40,845, $46,833 for men and $37,449 for women, a difference of 20.0%.
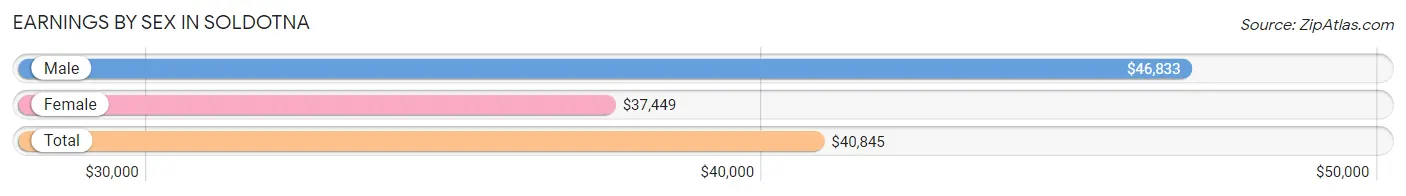
| Sex | Number | Average Earnings |
| Male | 1,140 (48.7%) | $46,833 |
| Female | 1,199 (51.3%) | $37,449 |
| Total | 2,339 (100.0%) | $40,845 |
Earnings by Sex by Income Bracket in Soldotna
The most common earnings brackets in Soldotna are $100,000+ for men (198 | 17.4%) and $75,000 to $99,999 for women (135 | 11.3%).
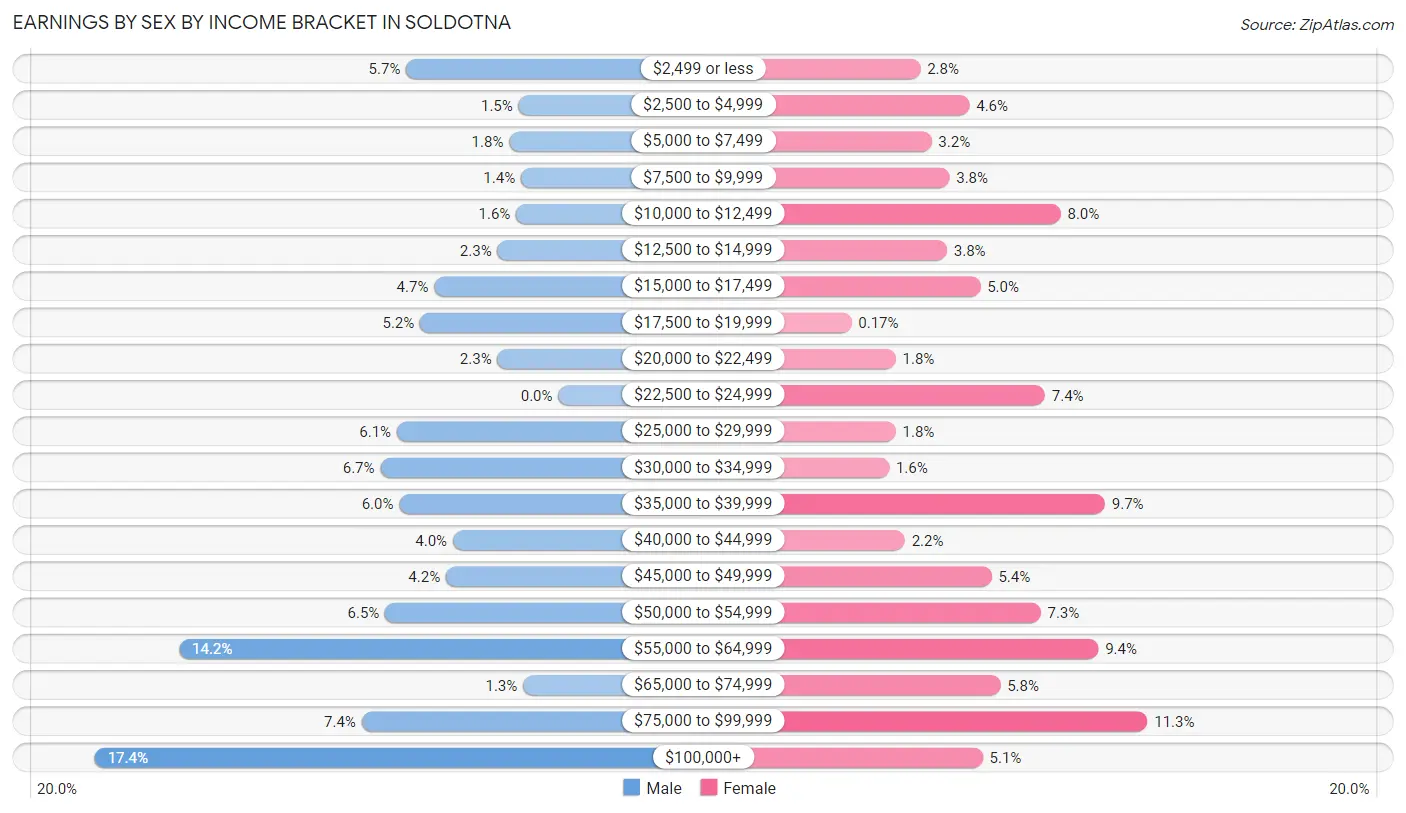
| Income | Male | Female |
| $2,499 or less | 65 (5.7%) | 33 (2.8%) |
| $2,500 to $4,999 | 17 (1.5%) | 55 (4.6%) |
| $5,000 to $7,499 | 21 (1.8%) | 38 (3.2%) |
| $7,500 to $9,999 | 16 (1.4%) | 46 (3.8%) |
| $10,000 to $12,499 | 18 (1.6%) | 96 (8.0%) |
| $12,500 to $14,999 | 26 (2.3%) | 45 (3.7%) |
| $15,000 to $17,499 | 53 (4.6%) | 60 (5.0%) |
| $17,500 to $19,999 | 59 (5.2%) | 2 (0.2%) |
| $20,000 to $22,499 | 26 (2.3%) | 22 (1.8%) |
| $22,500 to $24,999 | 0 (0.0%) | 89 (7.4%) |
| $25,000 to $29,999 | 69 (6.0%) | 22 (1.8%) |
| $30,000 to $34,999 | 76 (6.7%) | 19 (1.6%) |
| $35,000 to $39,999 | 68 (6.0%) | 116 (9.7%) |
| $40,000 to $44,999 | 45 (4.0%) | 26 (2.2%) |
| $45,000 to $49,999 | 48 (4.2%) | 65 (5.4%) |
| $50,000 to $54,999 | 74 (6.5%) | 87 (7.3%) |
| $55,000 to $64,999 | 162 (14.2%) | 113 (9.4%) |
| $65,000 to $74,999 | 15 (1.3%) | 69 (5.8%) |
| $75,000 to $99,999 | 84 (7.4%) | 135 (11.3%) |
| $100,000+ | 198 (17.4%) | 61 (5.1%) |
| Total | 1,140 (100.0%) | 1,199 (100.0%) |
Earnings by Sex by Educational Attainment in Soldotna
Average earnings in Soldotna are $51,738 for men and $39,851 for women, a difference of 23.0%. Men with an educational attainment of bachelor's degree enjoy the highest average annual earnings of $96,563, while those with high school diploma education earn the least with $37,216. Women with an educational attainment of graduate degree earn the most with the average annual earnings of $75,588, while those with bachelor's degree education have the smallest earnings of $24,375.
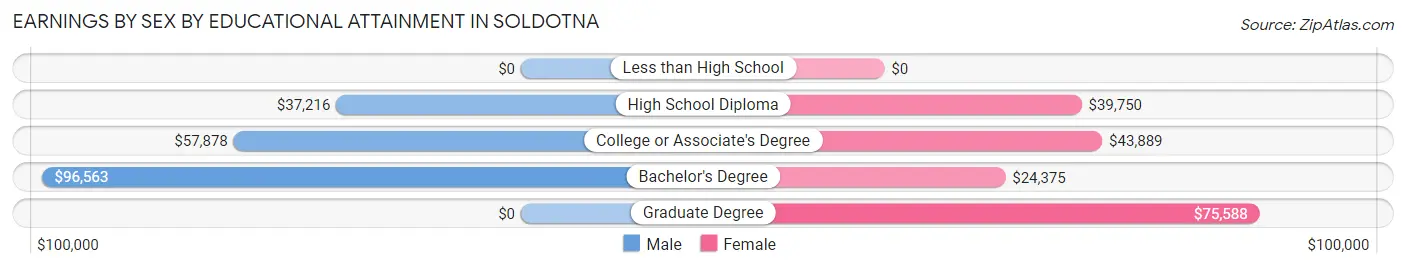
| Educational Attainment | Male Income | Female Income |
| Less than High School | - | - |
| High School Diploma | $37,216 | $39,750 |
| College or Associate's Degree | $57,878 | $43,889 |
| Bachelor's Degree | $96,563 | $24,375 |
| Graduate Degree | - | - |
| Total | $51,738 | $39,851 |
Family Income in Soldotna
Family Income Brackets in Soldotna
According to the Soldotna family income data, there are 323 families falling into the $100,000 to $149,999 income range, which is the most common income bracket and makes up 31.8% of all families.
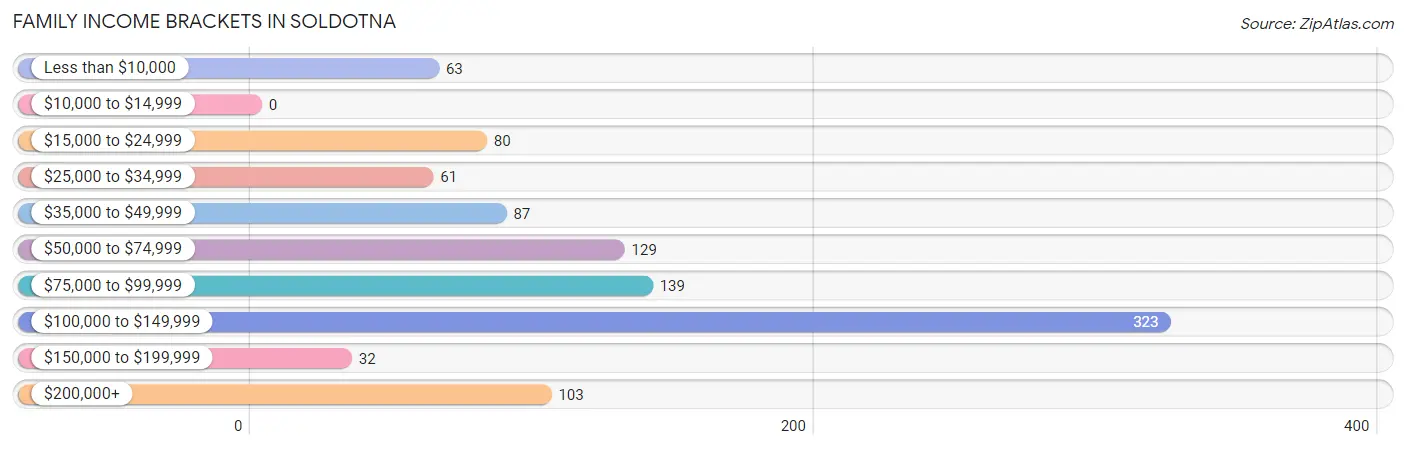
| Income Bracket | # Families | % Families |
| Less than $10,000 | 63 | 6.2% |
| $10,000 to $14,999 | 0 | 0.0% |
| $15,000 to $24,999 | 80 | 7.9% |
| $25,000 to $34,999 | 61 | 6.0% |
| $35,000 to $49,999 | 87 | 8.6% |
| $50,000 to $74,999 | 129 | 12.7% |
| $75,000 to $99,999 | 139 | 13.7% |
| $100,000 to $149,999 | 323 | 31.8% |
| $150,000 to $199,999 | 32 | 3.1% |
| $200,000+ | 103 | 10.1% |
Family Income by Famaliy Size in Soldotna
5-person families (121 | 11.9%) account for the highest median family income in Soldotna with $129,583 per family, while 3-person families (201 | 19.8%) have the highest median income of $35,865 per family member.
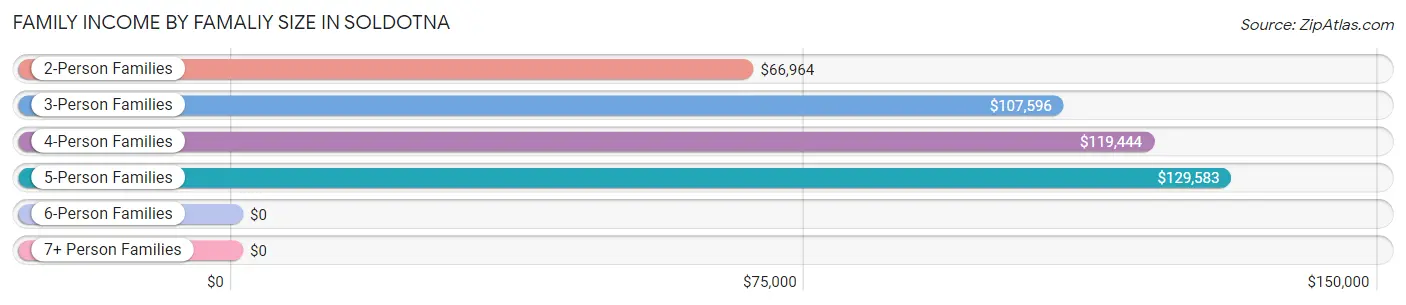
| Income Bracket | # Families | Median Income |
| 2-Person Families | 566 (55.6%) | $66,964 |
| 3-Person Families | 201 (19.8%) | $107,596 |
| 4-Person Families | 112 (11.0%) | $119,444 |
| 5-Person Families | 121 (11.9%) | $129,583 |
| 6-Person Families | 17 (1.7%) | $0 |
| 7+ Person Families | 0 (0.0%) | $0 |
| Total | 1,017 (100.0%) | $87,022 |
Family Income by Number of Earners in Soldotna
The median family income in Soldotna is $87,022, with families comprising 3+ earners (87) having the highest median family income of $135,096, while families with no earners (206) have the lowest median family income of $31,667, accounting for 8.6% and 20.3% of families, respectively.
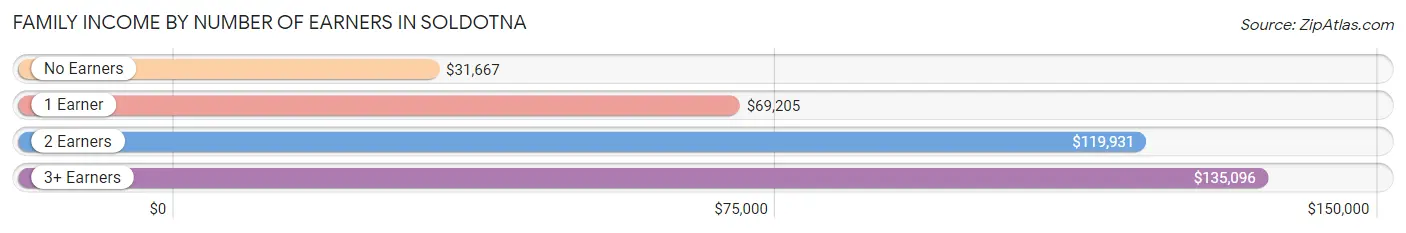
| Number of Earners | # Families | Median Income |
| No Earners | 206 (20.3%) | $31,667 |
| 1 Earner | 269 (26.5%) | $69,205 |
| 2 Earners | 455 (44.7%) | $119,931 |
| 3+ Earners | 87 (8.6%) | $135,096 |
| Total | 1,017 (100.0%) | $87,022 |
Household Income in Soldotna
Household Income Brackets in Soldotna
With 400 households falling in the category, the $100,000 to $149,999 income range is the most frequent in Soldotna, accounting for 23.0% of all households. In contrast, only 17 households (1.0%) fall into the $10,000 to $14,999 income bracket, making it the least populous group.
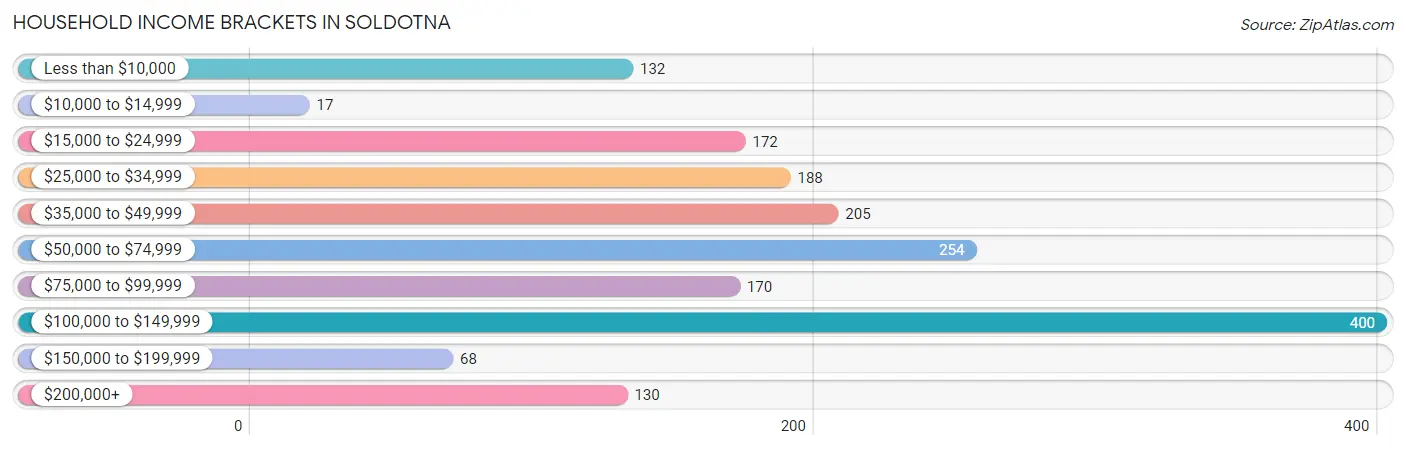
| Income Bracket | # Households | % Households |
| Less than $10,000 | 132 | 7.6% |
| $10,000 to $14,999 | 17 | 1.0% |
| $15,000 to $24,999 | 172 | 9.9% |
| $25,000 to $34,999 | 188 | 10.8% |
| $35,000 to $49,999 | 205 | 11.8% |
| $50,000 to $74,999 | 254 | 14.6% |
| $75,000 to $99,999 | 170 | 9.8% |
| $100,000 to $149,999 | 400 | 23.0% |
| $150,000 to $199,999 | 68 | 3.9% |
| $200,000+ | 130 | 7.5% |
Household Income by Householder Age in Soldotna
The median household income in Soldotna is $67,365, with the highest median household income of $125,827 found in the 15 to 24 years age bracket for the primary householder. A total of 109 households (6.3%) fall into this category. Meanwhile, the 65+ years age bracket for the primary householder has the lowest median household income of $48,920, with 541 households (31.1%) in this group.
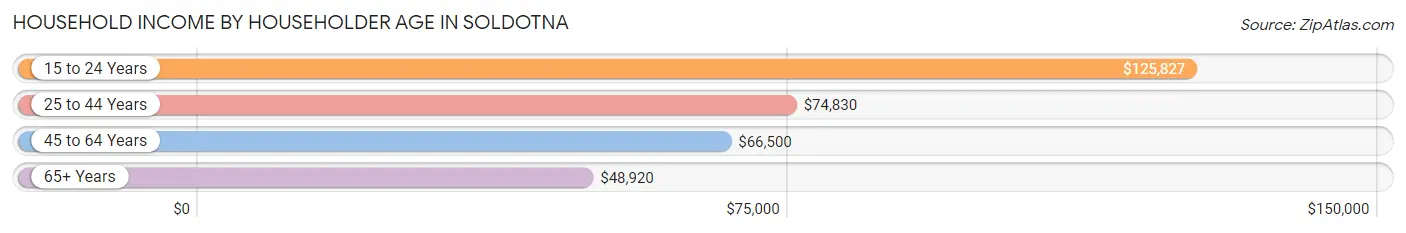
| Income Bracket | # Households | Median Income |
| 15 to 24 Years | 109 (6.3%) | $125,827 |
| 25 to 44 Years | 419 (24.1%) | $74,830 |
| 45 to 64 Years | 670 (38.5%) | $66,500 |
| 65+ Years | 541 (31.1%) | $48,920 |
| Total | 1,739 (100.0%) | $67,365 |
Poverty in Soldotna
Income Below Poverty by Sex and Age in Soldotna
With 12.8% poverty level for males and 19.1% for females among the residents of Soldotna, 6 to 11 year old males and 5 year old females are the most vulnerable to poverty, with 86 males (51.8%) and 15 females (100.0%) in their respective age groups living below the poverty level.
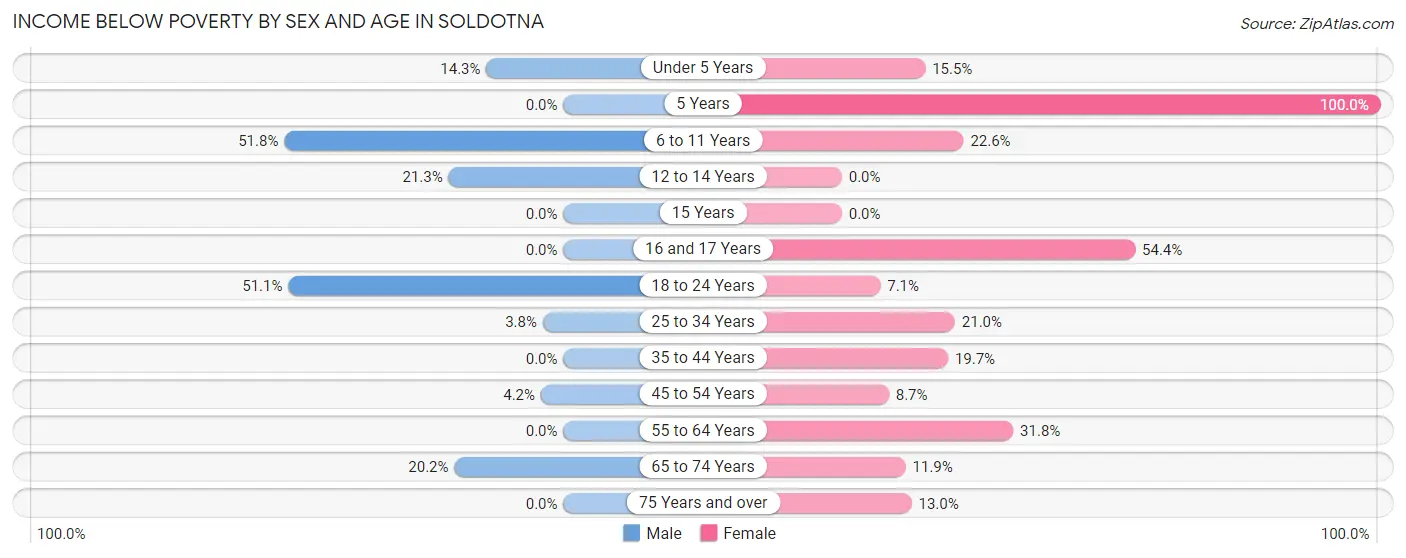
| Age Bracket | Male | Female |
| Under 5 Years | 11 (14.3%) | 24 (15.5%) |
| 5 Years | 0 (0.0%) | 15 (100.0%) |
| 6 to 11 Years | 86 (51.8%) | 42 (22.6%) |
| 12 to 14 Years | 13 (21.3%) | 0 (0.0%) |
| 15 Years | 0 (0.0%) | 0 (0.0%) |
| 16 and 17 Years | 0 (0.0%) | 49 (54.4%) |
| 18 to 24 Years | 73 (51.0%) | 15 (7.1%) |
| 25 to 34 Years | 12 (3.8%) | 85 (21.0%) |
| 35 to 44 Years | 0 (0.0%) | 40 (19.7%) |
| 45 to 54 Years | 10 (4.2%) | 26 (8.7%) |
| 55 to 64 Years | 0 (0.0%) | 111 (31.8%) |
| 65 to 74 Years | 35 (20.2%) | 34 (11.8%) |
| 75 Years and over | 0 (0.0%) | 25 (13.0%) |
| Total | 240 (12.8%) | 466 (19.1%) |
Income Above Poverty by Sex and Age in Soldotna
According to the poverty statistics in Soldotna, males aged 5 years and females aged 12 to 14 years are the age groups that are most secure financially, with 100.0% of males and 100.0% of females in these age groups living above the poverty line.
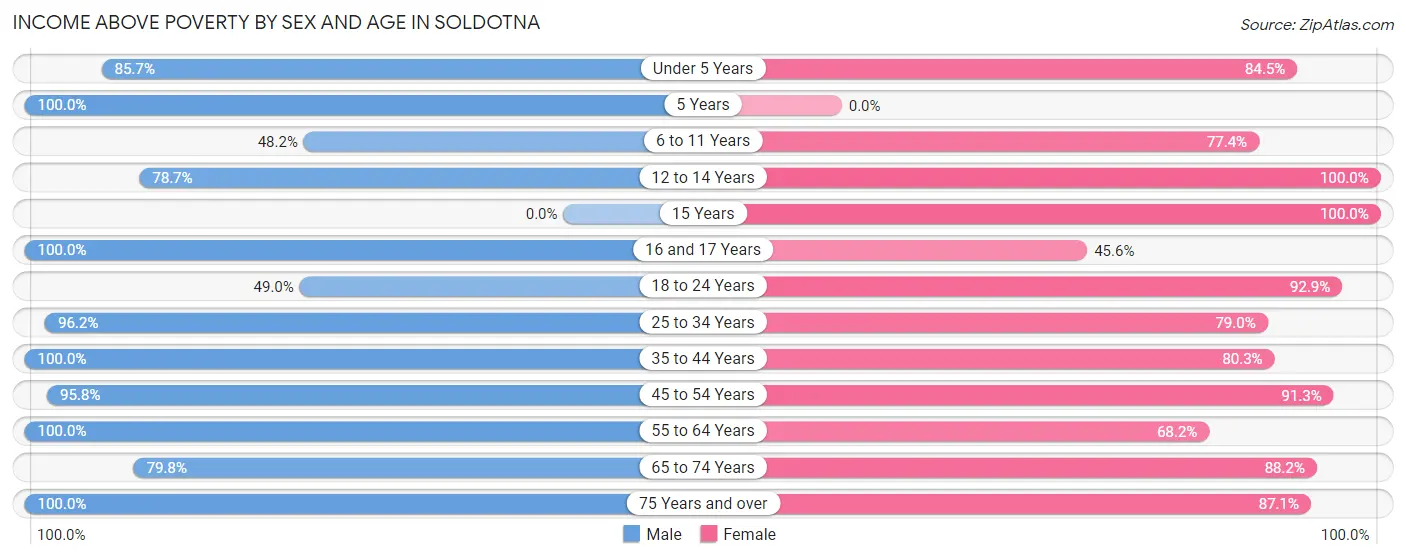
| Age Bracket | Male | Female |
| Under 5 Years | 66 (85.7%) | 131 (84.5%) |
| 5 Years | 34 (100.0%) | 0 (0.0%) |
| 6 to 11 Years | 80 (48.2%) | 144 (77.4%) |
| 12 to 14 Years | 48 (78.7%) | 41 (100.0%) |
| 15 Years | 0 (0.0%) | 11 (100.0%) |
| 16 and 17 Years | 97 (100.0%) | 41 (45.6%) |
| 18 to 24 Years | 70 (48.9%) | 195 (92.9%) |
| 25 to 34 Years | 303 (96.2%) | 320 (79.0%) |
| 35 to 44 Years | 252 (100.0%) | 163 (80.3%) |
| 45 to 54 Years | 230 (95.8%) | 272 (91.3%) |
| 55 to 64 Years | 251 (100.0%) | 238 (68.2%) |
| 65 to 74 Years | 138 (79.8%) | 253 (88.1%) |
| 75 Years and over | 66 (100.0%) | 168 (87.1%) |
| Total | 1,635 (87.2%) | 1,977 (80.9%) |
Income Below Poverty Among Married-Couple Families in Soldotna
The poverty statistics for married-couple families in Soldotna show that 2.8% or 18 of the total 640 families live below the poverty line. Families with no children have the highest poverty rate of 4.8%, comprising of 18 families. On the other hand, families with 1 or 2 children have the lowest poverty rate of 0.0%, which includes 0 families.
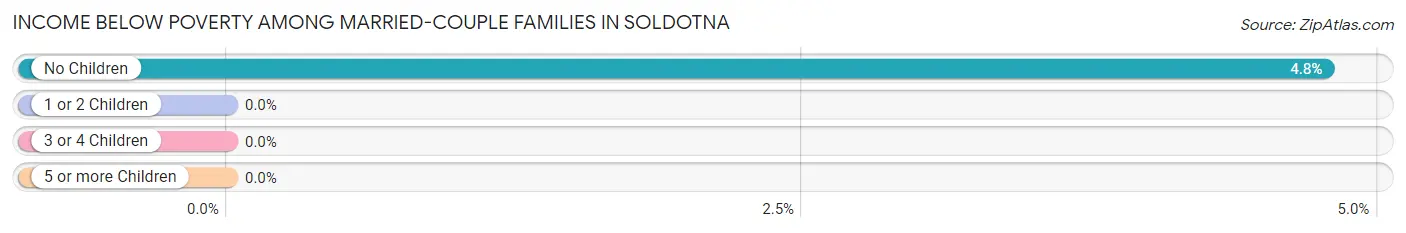
| Children | Above Poverty | Below Poverty |
| No Children | 359 (95.2%) | 18 (4.8%) |
| 1 or 2 Children | 157 (100.0%) | 0 (0.0%) |
| 3 or 4 Children | 106 (100.0%) | 0 (0.0%) |
| 5 or more Children | 0 (0.0%) | 0 (0.0%) |
| Total | 622 (97.2%) | 18 (2.8%) |
Income Below Poverty Among Single-Parent Households in Soldotna
| Children | Single Father | Single Mother |
| No Children | 0 (0.0%) | 43 (24.6%) |
| 1 or 2 Children | 0 (0.0%) | 71 (61.7%) |
| 3 or 4 Children | 0 (0.0%) | 10 (100.0%) |
| 5 or more Children | 0 (0.0%) | 0 (0.0%) |
| Total | 0 (0.0%) | 124 (41.3%) |
Income Below Poverty Among Married-Couple vs Single-Parent Households in Soldotna
The poverty data for Soldotna shows that 18 of the married-couple family households (2.8%) and 124 of the single-parent households (32.9%) are living below the poverty level. Within the married-couple family households, those with no children have the highest poverty rate, with 18 households (4.8%) falling below the poverty line. Among the single-parent households, those with 3 or 4 children have the highest poverty rate, with 10 household (100.0%) living below poverty.
| Children | Married-Couple Families | Single-Parent Households |
| No Children | 18 (4.8%) | 43 (21.3%) |
| 1 or 2 Children | 0 (0.0%) | 71 (43.0%) |
| 3 or 4 Children | 0 (0.0%) | 10 (100.0%) |
| 5 or more Children | 0 (0.0%) | 0 (0.0%) |
| Total | 18 (2.8%) | 124 (32.9%) |
Race in Soldotna
The most populous races in Soldotna are White / Caucasian (3,555 | 80.9%), Two or more Races (504 | 11.5%), and Hispanic or Latino (208 | 4.7%).
| Race | # Population | % Population |
| Asian | 52 | 1.2% |
| Black / African American | 49 | 1.1% |
| Hawaiian / Pacific | 0 | 0.0% |
| Hispanic or Latino | 208 | 4.7% |
| Native / Alaskan | 204 | 4.6% |
| White / Caucasian | 3,555 | 80.9% |
| Two or more Races | 504 | 11.5% |
| Some other Race | 30 | 0.7% |
| Total | 4,394 | 100.0% |
Ancestry in Soldotna
The most populous ancestries reported in Soldotna are German (918 | 20.9%), Irish (546 | 12.4%), English (404 | 9.2%), European (361 | 8.2%), and American (161 | 3.7%), together accounting for 54.4% of all Soldotna residents.
| Ancestry | # Population | % Population |
| African | 12 | 0.3% |
| Alaskan Athabascan | 67 | 1.5% |
| Aleut | 72 | 1.6% |
| American | 161 | 3.7% |
| Arab | 14 | 0.3% |
| Austrian | 21 | 0.5% |
| Bhutanese | 39 | 0.9% |
| British | 31 | 0.7% |
| Burmese | 24 | 0.5% |
| Celtic | 18 | 0.4% |
| Cherokee | 65 | 1.5% |
| Choctaw | 22 | 0.5% |
| Colombian | 38 | 0.9% |
| Czech | 120 | 2.7% |
| Danish | 44 | 1.0% |
| Dutch | 31 | 0.7% |
| English | 404 | 9.2% |
| European | 361 | 8.2% |
| French | 111 | 2.5% |
| French Canadian | 35 | 0.8% |
| German | 918 | 20.9% |
| Greek | 21 | 0.5% |
| Hungarian | 17 | 0.4% |
| Indian (Asian) | 7 | 0.2% |
| Inupiat | 1 | 0.0% |
| Irish | 546 | 12.4% |
| Italian | 116 | 2.6% |
| Korean | 40 | 0.9% |
| Lithuanian | 24 | 0.5% |
| Lumbee | 68 | 1.5% |
| Mexican | 100 | 2.3% |
| Northern European | 17 | 0.4% |
| Norwegian | 113 | 2.6% |
| Polish | 101 | 2.3% |
| Portuguese | 10 | 0.2% |
| Scandinavian | 15 | 0.3% |
| Scotch-Irish | 53 | 1.2% |
| Scottish | 53 | 1.2% |
| South American | 58 | 1.3% |
| Spaniard | 20 | 0.5% |
| Spanish | 30 | 0.7% |
| Subsaharan African | 12 | 0.3% |
| Swedish | 146 | 3.3% |
| Swiss | 16 | 0.4% |
| Syrian | 14 | 0.3% |
| Thai | 7 | 0.2% |
| Tlingit-Haida | 31 | 0.7% |
| Ukrainian | 58 | 1.3% |
| Ute | 93 | 2.1% |
| Venezuelan | 20 | 0.5% |
| Welsh | 38 | 0.9% | View All 51 Rows |
Immigrants in Soldotna
The most numerous immigrant groups reported in Soldotna came from Asia (50 | 1.1%), China (29 | 0.7%), Eastern Asia (29 | 0.7%), Latin America (20 | 0.5%), and South America (20 | 0.5%), together accounting for 3.4% of all Soldotna residents.
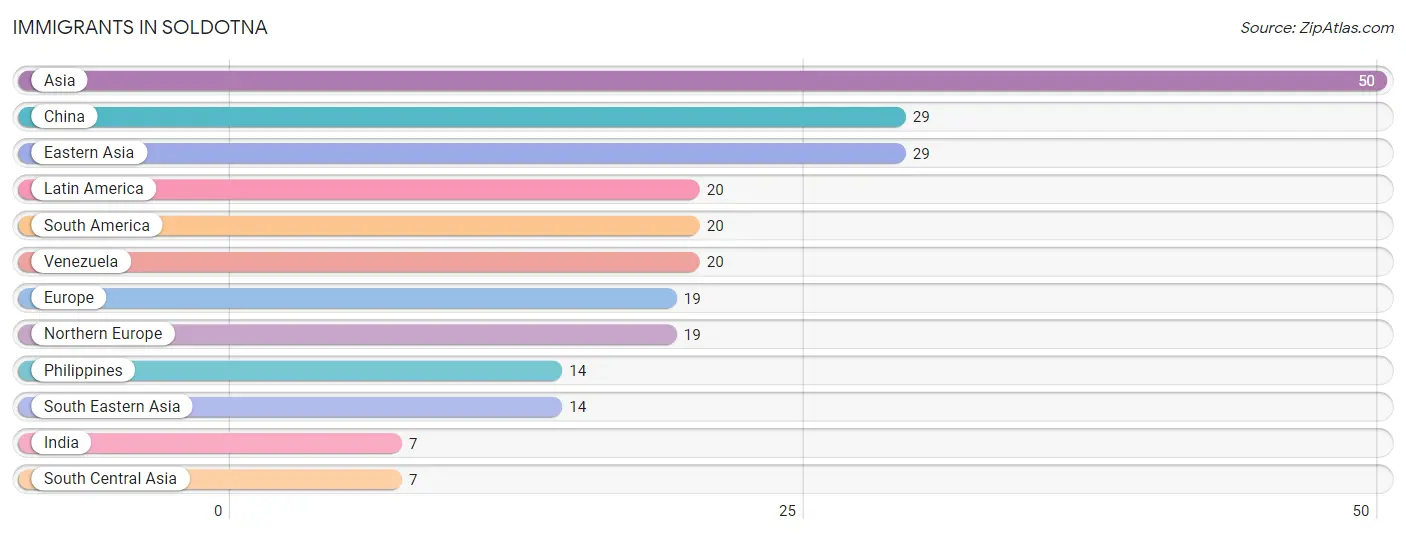
| Immigration Origin | # Population | % Population |
| Asia | 50 | 1.1% |
| China | 29 | 0.7% |
| Eastern Asia | 29 | 0.7% |
| Europe | 19 | 0.4% |
| India | 7 | 0.2% |
| Latin America | 20 | 0.5% |
| Northern Europe | 19 | 0.4% |
| Philippines | 14 | 0.3% |
| South America | 20 | 0.5% |
| South Central Asia | 7 | 0.2% |
| South Eastern Asia | 14 | 0.3% |
| Venezuela | 20 | 0.5% | View All 12 Rows |
Sex and Age in Soldotna
Sex and Age in Soldotna
The most populous age groups in Soldotna are 25 to 29 Years (212 | 11.0%) for men and 25 to 29 Years (305 | 12.4%) for women.
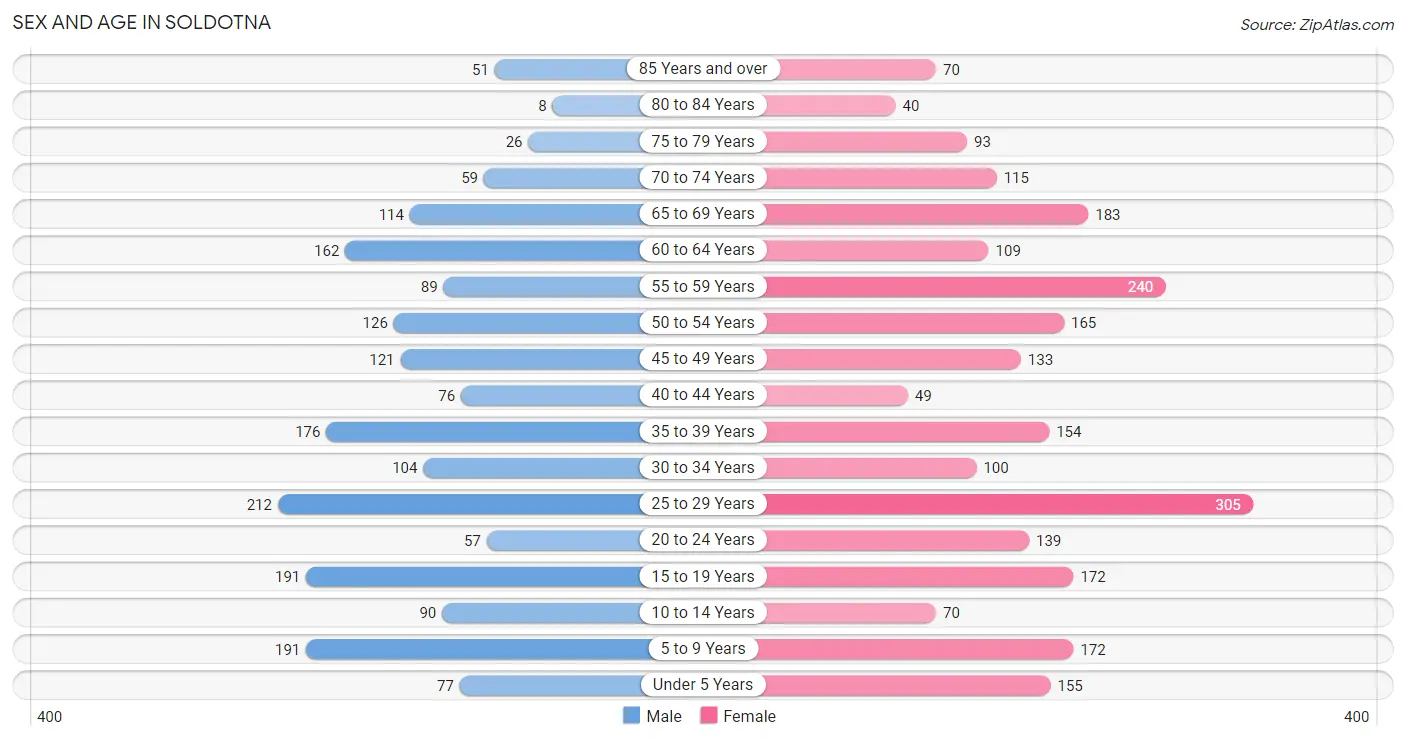
| Age Bracket | Male | Female |
| Under 5 Years | 77 (4.0%) | 155 (6.3%) |
| 5 to 9 Years | 191 (9.9%) | 172 (7.0%) |
| 10 to 14 Years | 90 (4.7%) | 70 (2.8%) |
| 15 to 19 Years | 191 (9.9%) | 172 (7.0%) |
| 20 to 24 Years | 57 (2.9%) | 139 (5.6%) |
| 25 to 29 Years | 212 (11.0%) | 305 (12.4%) |
| 30 to 34 Years | 104 (5.4%) | 100 (4.1%) |
| 35 to 39 Years | 176 (9.1%) | 154 (6.2%) |
| 40 to 44 Years | 76 (3.9%) | 49 (2.0%) |
| 45 to 49 Years | 121 (6.3%) | 133 (5.4%) |
| 50 to 54 Years | 126 (6.5%) | 165 (6.7%) |
| 55 to 59 Years | 89 (4.6%) | 240 (9.7%) |
| 60 to 64 Years | 162 (8.4%) | 109 (4.4%) |
| 65 to 69 Years | 114 (5.9%) | 183 (7.4%) |
| 70 to 74 Years | 59 (3.1%) | 115 (4.7%) |
| 75 to 79 Years | 26 (1.3%) | 93 (3.8%) |
| 80 to 84 Years | 8 (0.4%) | 40 (1.6%) |
| 85 Years and over | 51 (2.6%) | 70 (2.8%) |
| Total | 1,930 (100.0%) | 2,464 (100.0%) |
Families and Households in Soldotna
Median Family Size in Soldotna
The median family size in Soldotna is 3.15 persons per family, with single female/mother families (300 | 29.5%) accounting for the largest median family size of 3.26 persons per family. On the other hand, married-couple families (640 | 62.9%) represent the smallest median family size with 3.09 persons per family.
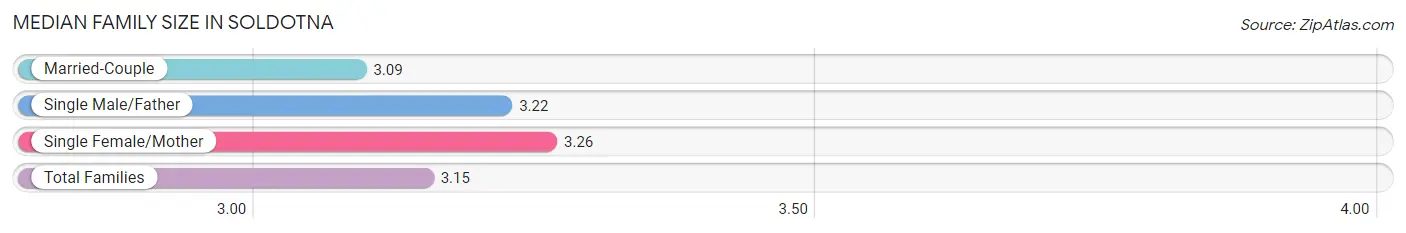
| Family Type | # Families | Family Size |
| Married-Couple | 640 (62.9%) | 3.09 |
| Single Male/Father | 77 (7.6%) | 3.22 |
| Single Female/Mother | 300 (29.5%) | 3.26 |
| Total Families | 1,017 (100.0%) | 3.15 |
Median Household Size in Soldotna
The median household size in Soldotna is 2.49 persons per household, with single female/mother households (300 | 17.2%) accounting for the largest median household size of 3.82 persons per household. non-family households (722 | 41.5%) represent the smallest median household size with 1.28 persons per household.
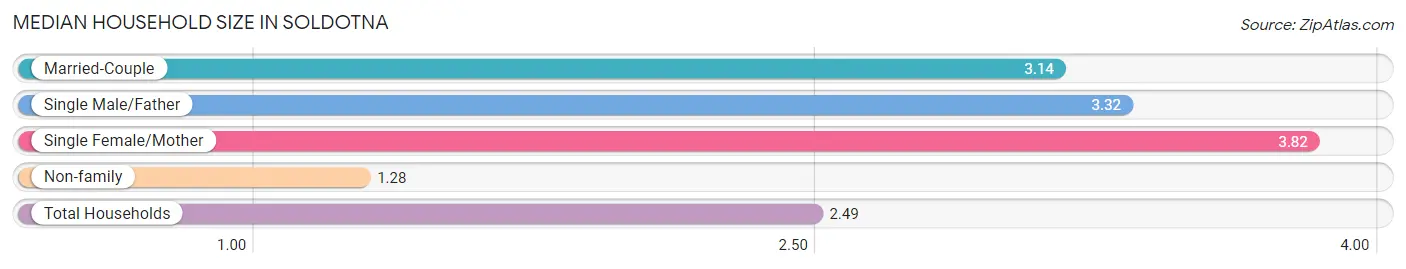
| Household Type | # Households | Household Size |
| Married-Couple | 640 (36.8%) | 3.14 |
| Single Male/Father | 77 (4.4%) | 3.32 |
| Single Female/Mother | 300 (17.2%) | 3.82 |
| Non-family | 722 (41.5%) | 1.28 |
| Total Households | 1,739 (100.0%) | 2.49 |
Household Size by Marriage Status in Soldotna
Out of a total of 1,739 households in Soldotna, 1,017 (58.5%) are family households, while 722 (41.5%) are nonfamily households. The most numerous type of family households are 2-person households, comprising 523, and the most common type of nonfamily households are 1-person households, comprising 555.
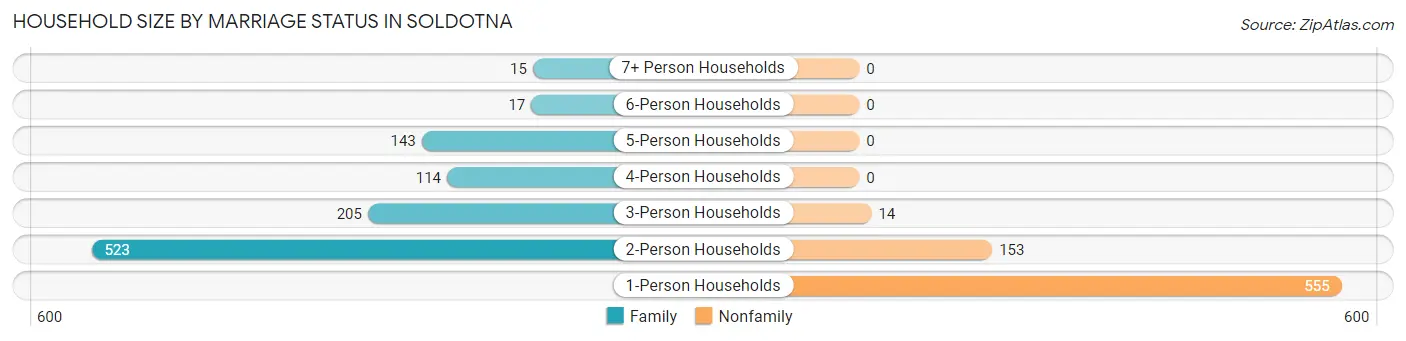
| Household Size | Family Households | Nonfamily Households |
| 1-Person Households | - | 555 (31.9%) |
| 2-Person Households | 523 (30.1%) | 153 (8.8%) |
| 3-Person Households | 205 (11.8%) | 14 (0.8%) |
| 4-Person Households | 114 (6.6%) | 0 (0.0%) |
| 5-Person Households | 143 (8.2%) | 0 (0.0%) |
| 6-Person Households | 17 (1.0%) | 0 (0.0%) |
| 7+ Person Households | 15 (0.9%) | 0 (0.0%) |
| Total | 1,017 (58.5%) | 722 (41.5%) |
Female Fertility in Soldotna
Fertility by Age in Soldotna
| Age Bracket | Women with Births | Births / 1,000 Women |
| 15 to 19 years | 0 (0.0%) | 0.0 |
| 20 to 34 years | 0 (0.0%) | 0.0 |
| 35 to 50 years | 0 (0.0%) | 0.0 |
| Total | 0 (0.0%) | 0.0 |
Fertility by Age by Marriage Status in Soldotna
| Age Bracket | Married | Unmarried |
| 15 to 19 years | 0 (0.0%) | 0 (0.0%) |
| 20 to 34 years | 0 (0.0%) | 0 (0.0%) |
| 35 to 50 years | 0 (0.0%) | 0 (0.0%) |
| Total | 0 (0.0%) | 0 (0.0%) |
Fertility by Education in Soldotna
| Educational Attainment | Women with Births | Births / 1,000 Women |
| Less than High School | 0 (0.0%) | 0.0 |
| High School Diploma | 0 (0.0%) | 0.0 |
| College or Associate's Degree | 0 (0.0%) | 0.0 |
| Bachelor's Degree | 0 (0.0%) | 0.0 |
| Graduate Degree | 0 (0.0%) | 0.0 |
| Total | 0 (0.0%) | 0.0 |
Fertility by Education by Marriage Status in Soldotna
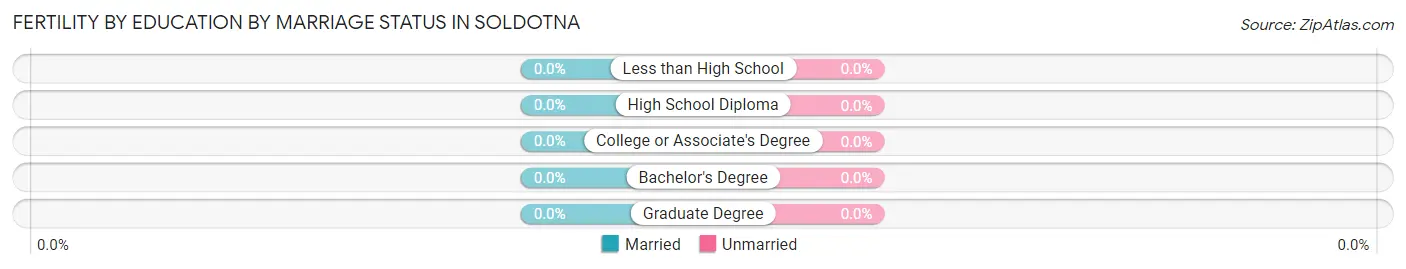
| Educational Attainment | Married | Unmarried |
| Less than High School | 0 (0.0%) | 0 (0.0%) |
| High School Diploma | 0 (0.0%) | 0 (0.0%) |
| College or Associate's Degree | 0 (0.0%) | 0 (0.0%) |
| Bachelor's Degree | 0 (0.0%) | 0 (0.0%) |
| Graduate Degree | 0 (0.0%) | 0 (0.0%) |
| Total | 0 (0.0%) | 0 (0.0%) |
Employment Characteristics in Soldotna
Employment by Class of Employer in Soldotna
Among the 2,001 employed individuals in Soldotna, private company employees (1,081 | 54.0%), not-for-profit organizations (287 | 14.3%), and local government employees (189 | 9.5%) make up the most common classes of employment.
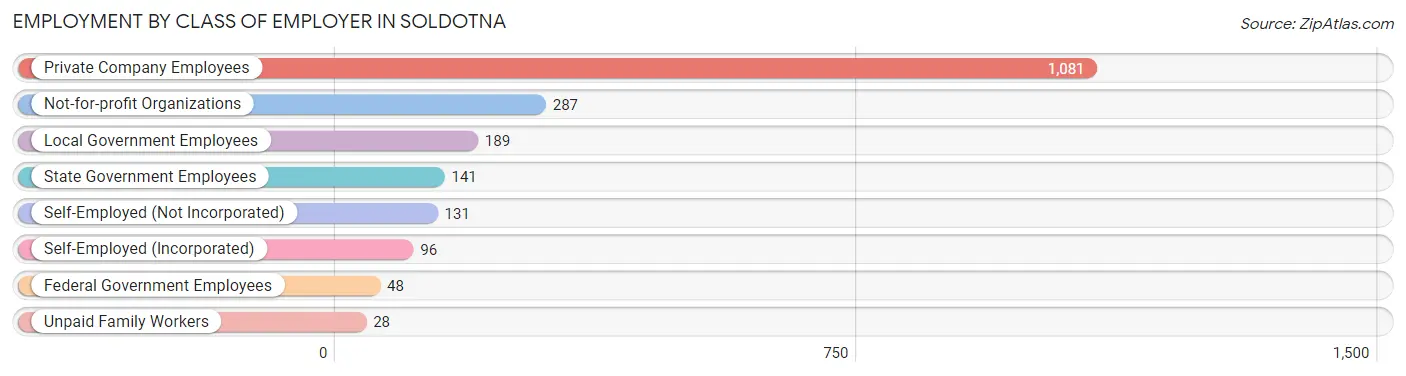
| Employer Class | # Employees | % Employees |
| Private Company Employees | 1,081 | 54.0% |
| Self-Employed (Incorporated) | 96 | 4.8% |
| Self-Employed (Not Incorporated) | 131 | 6.6% |
| Not-for-profit Organizations | 287 | 14.3% |
| Local Government Employees | 189 | 9.5% |
| State Government Employees | 141 | 7.0% |
| Federal Government Employees | 48 | 2.4% |
| Unpaid Family Workers | 28 | 1.4% |
| Total | 2,001 | 100.0% |
Employment Status by Age in Soldotna
According to the labor force statistics for Soldotna, out of the total population over 16 years of age (3,628), 60.3% or 2,188 individuals are in the labor force, with 5.6% or 123 of them unemployed. The age group with the highest labor force participation rate is 20 to 24 years, with 93.9% or 184 individuals in the labor force. Within the labor force, the 16 to 19 years age range has the highest percentage of unemployed individuals, with 38.8% or 69 of them being unemployed.
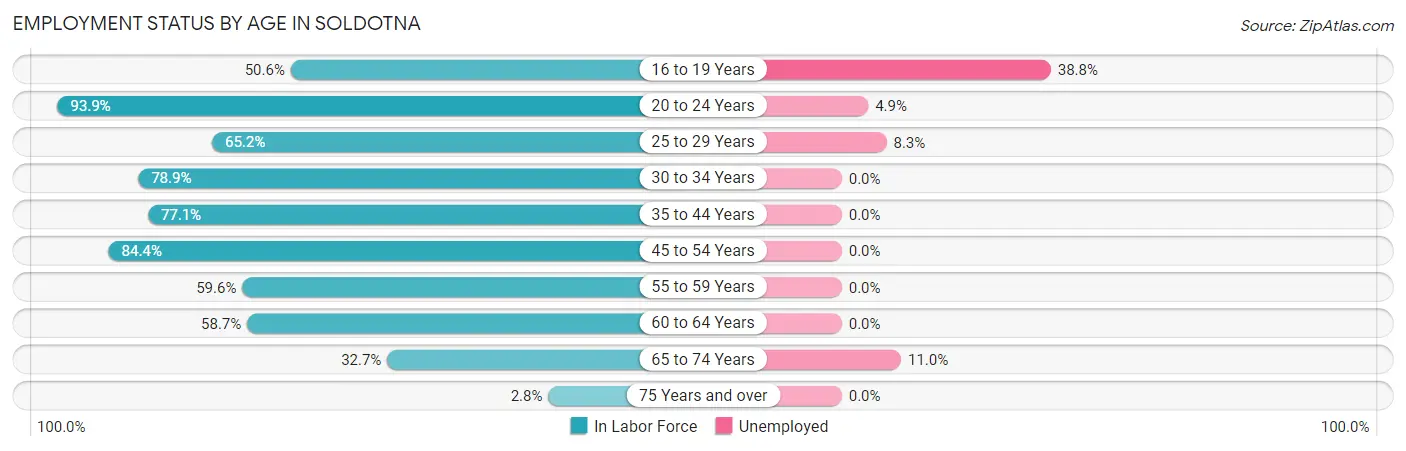
| Age Bracket | In Labor Force | Unemployed |
| 16 to 19 Years | 178 (50.6%) | 69 (38.8%) |
| 20 to 24 Years | 184 (93.9%) | 9 (4.9%) |
| 25 to 29 Years | 337 (65.2%) | 28 (8.3%) |
| 30 to 34 Years | 161 (78.9%) | 0 (0.0%) |
| 35 to 44 Years | 351 (77.1%) | 0 (0.0%) |
| 45 to 54 Years | 460 (84.4%) | 0 (0.0%) |
| 55 to 59 Years | 196 (59.6%) | 0 (0.0%) |
| 60 to 64 Years | 159 (58.7%) | 0 (0.0%) |
| 65 to 74 Years | 154 (32.7%) | 17 (11.0%) |
| 75 Years and over | 8 (2.8%) | 0 (0.0%) |
| Total | 2,188 (60.3%) | 123 (5.6%) |
Employment Status by Educational Attainment in Soldotna
According to labor force statistics for Soldotna, 71.7% of individuals (1,664) out of the total population between 25 and 64 years of age (2,321) are in the labor force, with 1.7% or 28 of them being unemployed. The group with the highest labor force participation rate are those with the educational attainment of college / associate degree, with 81.7% or 842 individuals in the labor force. Within the labor force, individuals with high school diploma education have the highest percentage of unemployment, with 5.6% or 28 of them being unemployed.
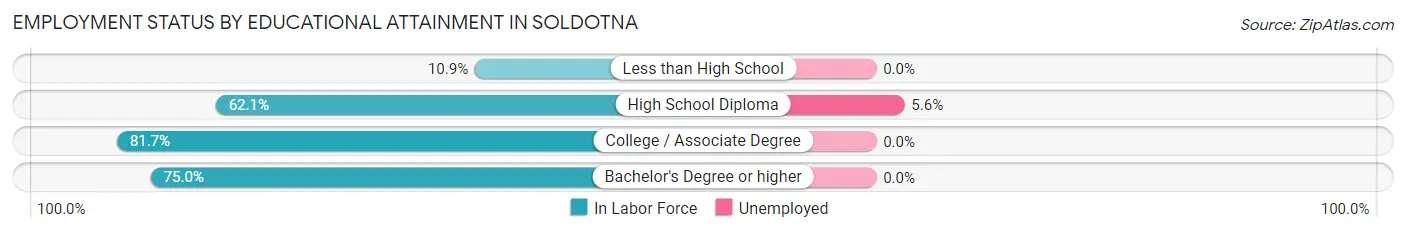
| Educational Attainment | In Labor Force | Unemployed |
| Less than High School | 7 (10.9%) | 0 (0.0%) |
| High School Diploma | 501 (62.1%) | 45 (5.6%) |
| College / Associate Degree | 842 (81.7%) | 0 (0.0%) |
| Bachelor's Degree or higher | 315 (75.0%) | 0 (0.0%) |
| Total | 1,664 (71.7%) | 39 (1.7%) |
Employment Occupations by Sex in Soldotna
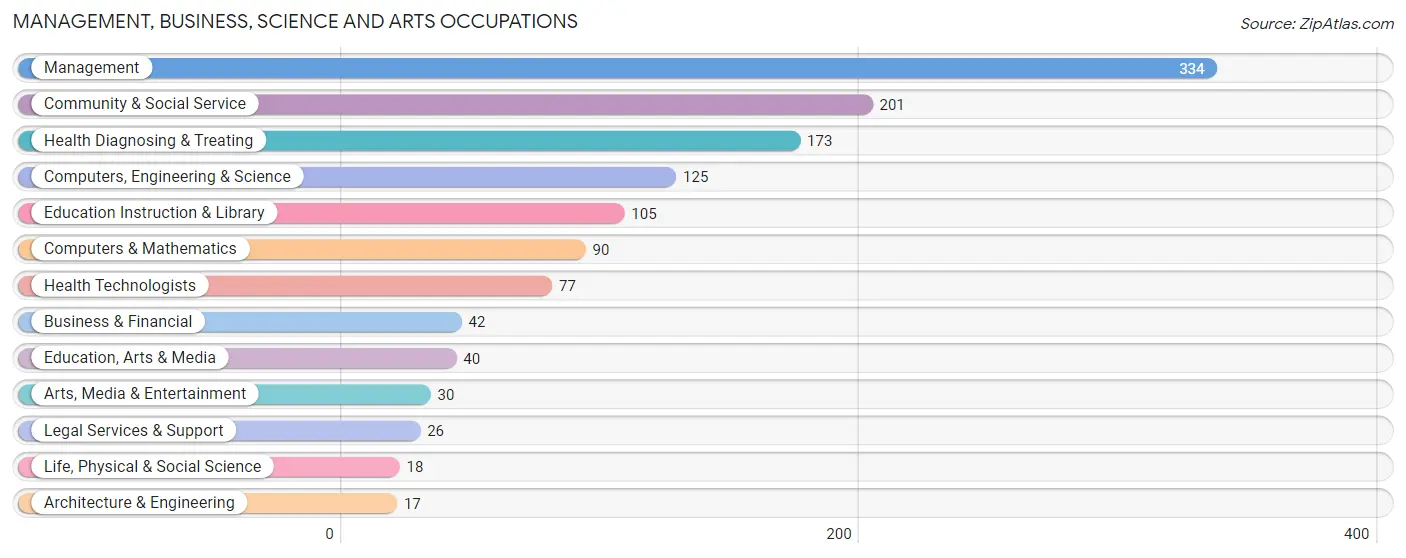
Management, Business, Science and Arts Occupations
The most common Management, Business, Science and Arts occupations in Soldotna are Management (334 | 16.2%), Community & Social Service (201 | 9.7%), Health Diagnosing & Treating (173 | 8.4%), Computers, Engineering & Science (125 | 6.0%), and Education Instruction & Library (105 | 5.1%).
Management, Business, Science and Arts Occupations by Sex
Within the Management, Business, Science and Arts occupations in Soldotna, the most male-oriented occupations are Architecture & Engineering (100.0%), Life, Physical & Social Science (100.0%), and Computers, Engineering & Science (76.8%), while the most female-oriented occupations are Legal Services & Support (100.0%), Health Diagnosing & Treating (69.9%), and Management (68.9%).
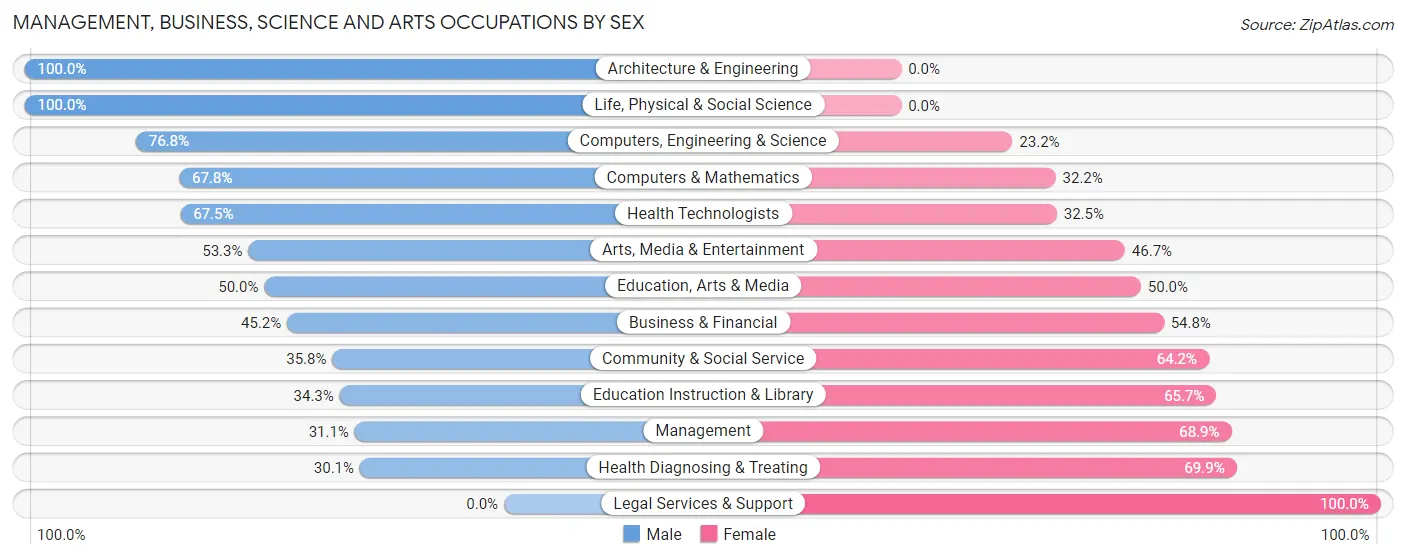
| Occupation | Male | Female |
| Management | 104 (31.1%) | 230 (68.9%) |
| Business & Financial | 19 (45.2%) | 23 (54.8%) |
| Computers, Engineering & Science | 96 (76.8%) | 29 (23.2%) |
| Computers & Mathematics | 61 (67.8%) | 29 (32.2%) |
| Architecture & Engineering | 17 (100.0%) | 0 (0.0%) |
| Life, Physical & Social Science | 18 (100.0%) | 0 (0.0%) |
| Community & Social Service | 72 (35.8%) | 129 (64.2%) |
| Education, Arts & Media | 20 (50.0%) | 20 (50.0%) |
| Legal Services & Support | 0 (0.0%) | 26 (100.0%) |
| Education Instruction & Library | 36 (34.3%) | 69 (65.7%) |
| Arts, Media & Entertainment | 16 (53.3%) | 14 (46.7%) |
| Health Diagnosing & Treating | 52 (30.1%) | 121 (69.9%) |
| Health Technologists | 52 (67.5%) | 25 (32.5%) |
| Total (Category) | 343 (39.2%) | 532 (60.8%) |
| Total (Overall) | 1,045 (50.6%) | 1,020 (49.4%) |
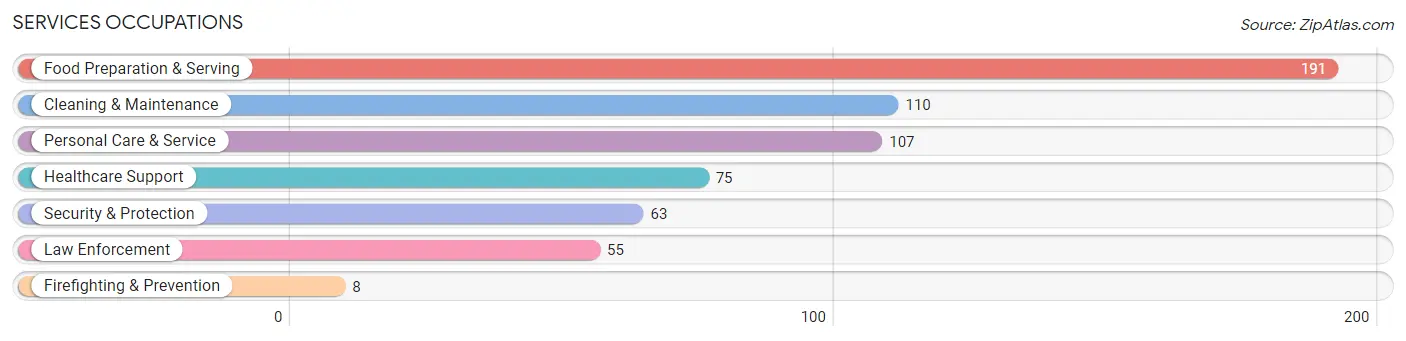
Services Occupations
The most common Services occupations in Soldotna are Food Preparation & Serving (191 | 9.2%), Cleaning & Maintenance (110 | 5.3%), Personal Care & Service (107 | 5.2%), Healthcare Support (75 | 3.6%), and Security & Protection (63 | 3.0%).
Services Occupations by Sex
Within the Services occupations in Soldotna, the most male-oriented occupations are Firefighting & Prevention (100.0%), Cleaning & Maintenance (100.0%), and Food Preparation & Serving (46.6%), while the most female-oriented occupations are Healthcare Support (94.7%), Law Enforcement (70.9%), and Personal Care & Service (69.2%).
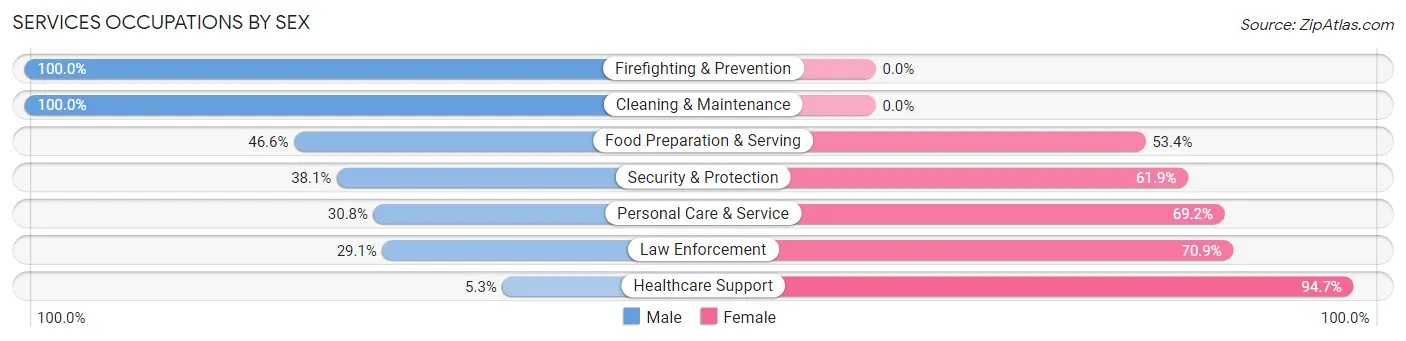
| Occupation | Male | Female |
| Healthcare Support | 4 (5.3%) | 71 (94.7%) |
| Security & Protection | 24 (38.1%) | 39 (61.9%) |
| Firefighting & Prevention | 8 (100.0%) | 0 (0.0%) |
| Law Enforcement | 16 (29.1%) | 39 (70.9%) |
| Food Preparation & Serving | 89 (46.6%) | 102 (53.4%) |
| Cleaning & Maintenance | 110 (100.0%) | 0 (0.0%) |
| Personal Care & Service | 33 (30.8%) | 74 (69.2%) |
| Total (Category) | 260 (47.6%) | 286 (52.4%) |
| Total (Overall) | 1,045 (50.6%) | 1,020 (49.4%) |
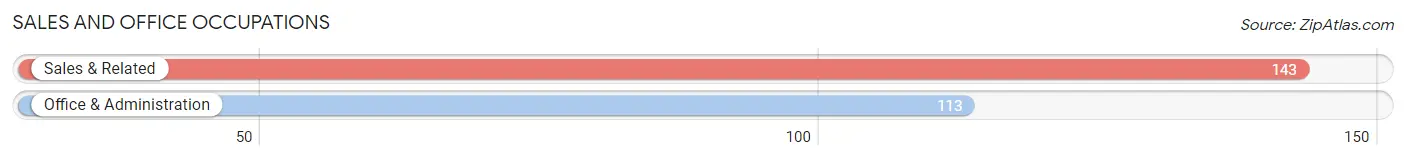
Sales and Office Occupations
The most common Sales and Office occupations in Soldotna are Sales & Related (143 | 6.9%), and Office & Administration (113 | 5.5%).
Sales and Office Occupations by Sex
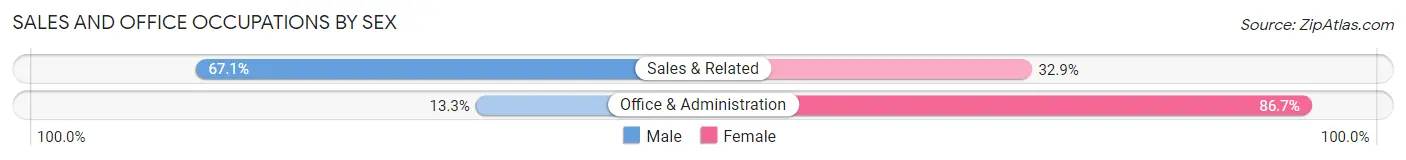
| Occupation | Male | Female |
| Sales & Related | 96 (67.1%) | 47 (32.9%) |
| Office & Administration | 15 (13.3%) | 98 (86.7%) |
| Total (Category) | 111 (43.4%) | 145 (56.6%) |
| Total (Overall) | 1,045 (50.6%) | 1,020 (49.4%) |
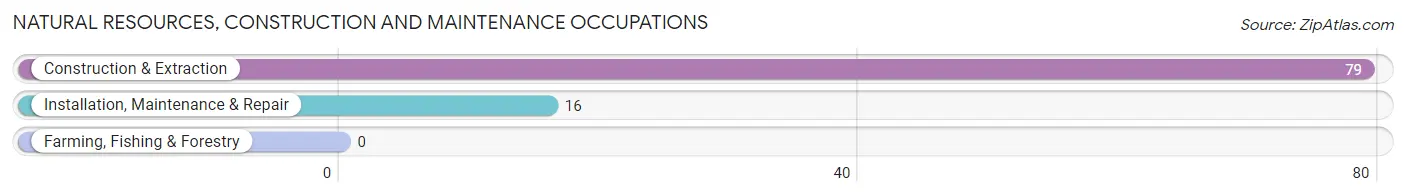
Natural Resources, Construction and Maintenance Occupations
The most common Natural Resources, Construction and Maintenance occupations in Soldotna are Construction & Extraction (79 | 3.8%), and Installation, Maintenance & Repair (16 | 0.8%).
Natural Resources, Construction and Maintenance Occupations by Sex
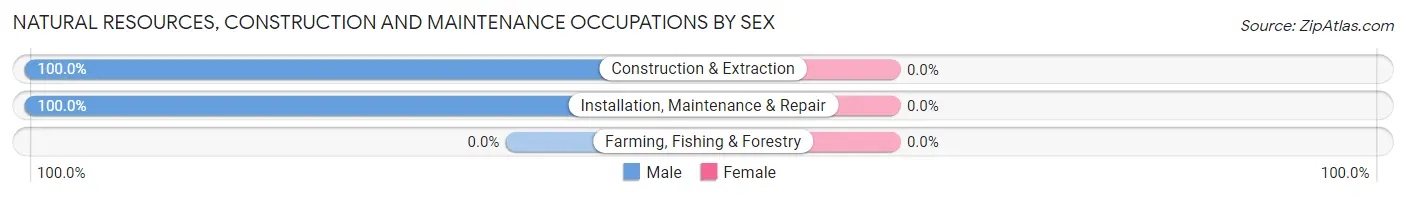
| Occupation | Male | Female |
| Farming, Fishing & Forestry | 0 (0.0%) | 0 (0.0%) |
| Construction & Extraction | 79 (100.0%) | 0 (0.0%) |
| Installation, Maintenance & Repair | 16 (100.0%) | 0 (0.0%) |
| Total (Category) | 95 (100.0%) | 0 (0.0%) |
| Total (Overall) | 1,045 (50.6%) | 1,020 (49.4%) |
Production, Transportation and Moving Occupations
The most common Production, Transportation and Moving occupations in Soldotna are Transportation (119 | 5.8%), Material Moving (99 | 4.8%), and Production (75 | 3.6%).
Production, Transportation and Moving Occupations by Sex
| Occupation | Male | Female |
| Production | 53 (70.7%) | 22 (29.3%) |
| Transportation | 105 (88.2%) | 14 (11.8%) |
| Material Moving | 78 (78.8%) | 21 (21.2%) |
| Total (Category) | 236 (80.5%) | 57 (19.5%) |
| Total (Overall) | 1,045 (50.6%) | 1,020 (49.4%) |
Employment Industries by Sex in Soldotna
Employment Industries in Soldotna
The major employment industries in Soldotna include Health Care & Social Assistance (453 | 21.9%), Retail Trade (276 | 13.4%), Public Administration (242 | 11.7%), Accommodation & Food Services (227 | 11.0%), and Transportation & Warehousing (125 | 6.0%).
Employment Industries by Sex in Soldotna
The Soldotna industries that see more men than women are Mining, Quarrying, & Extraction (100.0%), Construction (100.0%), and Transportation & Warehousing (80.8%), whereas the industries that tend to have a higher number of women are Real Estate, Rental & Leasing (100.0%), Professional & Scientific (100.0%), and Finance & Insurance (87.9%).
| Industry | Male | Female |
| Agriculture, Fishing & Hunting | 28 (59.6%) | 19 (40.4%) |
| Mining, Quarrying, & Extraction | 49 (100.0%) | 0 (0.0%) |
| Construction | 60 (100.0%) | 0 (0.0%) |
| Manufacturing | 39 (50.6%) | 38 (49.3%) |
| Wholesale Trade | 17 (37.0%) | 29 (63.0%) |
| Retail Trade | 209 (75.7%) | 67 (24.3%) |
| Transportation & Warehousing | 101 (80.8%) | 24 (19.2%) |
| Utilities | 0 (0.0%) | 0 (0.0%) |
| Information | 16 (40.0%) | 24 (60.0%) |
| Finance & Insurance | 12 (12.1%) | 87 (87.9%) |
| Real Estate, Rental & Leasing | 0 (0.0%) | 2 (100.0%) |
| Professional & Scientific | 0 (0.0%) | 42 (100.0%) |
| Enterprise Management | 0 (0.0%) | 0 (0.0%) |
| Administrative & Support | 21 (60.0%) | 14 (40.0%) |
| Educational Services | 54 (45.8%) | 64 (54.2%) |
| Health Care & Social Assistance | 133 (29.4%) | 320 (70.6%) |
| Arts, Entertainment & Recreation | 0 (0.0%) | 0 (0.0%) |
| Accommodation & Food Services | 131 (57.7%) | 96 (42.3%) |
| Public Administration | 134 (55.4%) | 108 (44.6%) |
| Total | 1,045 (50.6%) | 1,020 (49.4%) |
Education in Soldotna
School Enrollment in Soldotna
The most common levels of schooling among the 966 students in Soldotna are high school (278 | 28.8%), elementary school (222 | 23.0%), and college / undergraduate (151 | 15.6%).
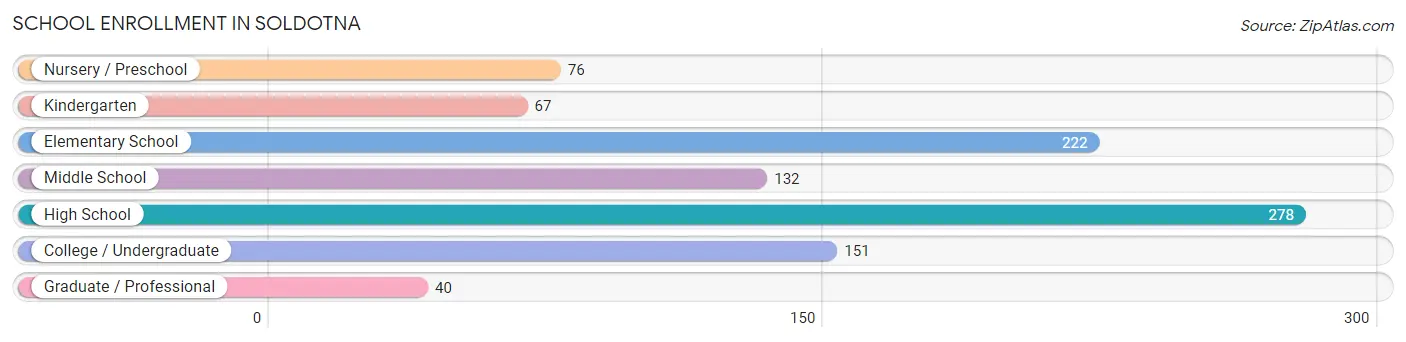
| School Level | # Students | % Students |
| Nursery / Preschool | 76 | 7.9% |
| Kindergarten | 67 | 6.9% |
| Elementary School | 222 | 23.0% |
| Middle School | 132 | 13.7% |
| High School | 278 | 28.8% |
| College / Undergraduate | 151 | 15.6% |
| Graduate / Professional | 40 | 4.1% |
| Total | 966 | 100.0% |
School Enrollment by Age by Funding Source in Soldotna
Out of a total of 966 students who are enrolled in schools in Soldotna, 314 (32.5%) attend a private institution, while the remaining 652 (67.5%) are enrolled in public schools. The age group of 20 to 24 year olds has the highest likelihood of being enrolled in private schools, with 76 (93.8% in the age bracket) enrolled. Conversely, the age group of 10 to 14 year olds has the lowest likelihood of being enrolled in a private school, with 137 (90.1% in the age bracket) attending a public institution.
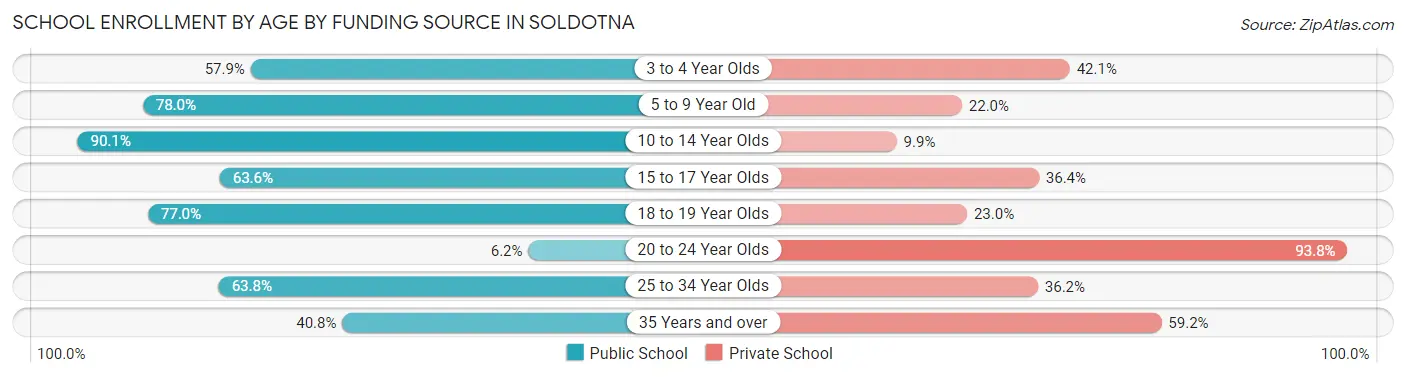
| Age Bracket | Public School | Private School |
| 3 to 4 Year Olds | 22 (57.9%) | 16 (42.1%) |
| 5 to 9 Year Old | 255 (78.0%) | 72 (22.0%) |
| 10 to 14 Year Olds | 137 (90.1%) | 15 (9.9%) |
| 15 to 17 Year Olds | 126 (63.6%) | 72 (36.4%) |
| 18 to 19 Year Olds | 57 (77.0%) | 17 (23.0%) |
| 20 to 24 Year Olds | 5 (6.2%) | 76 (93.8%) |
| 25 to 34 Year Olds | 30 (63.8%) | 17 (36.2%) |
| 35 Years and over | 20 (40.8%) | 29 (59.2%) |
| Total | 652 (67.5%) | 314 (32.5%) |
Educational Attainment by Field of Study in Soldotna
Business (97 | 15.3%), liberal arts & history (77 | 12.2%), social sciences (61 | 9.6%), bio, nature & agricultural (56 | 8.8%), and education (53 | 8.4%) are the most common fields of study among 633 individuals in Soldotna who have obtained a bachelor's degree or higher.
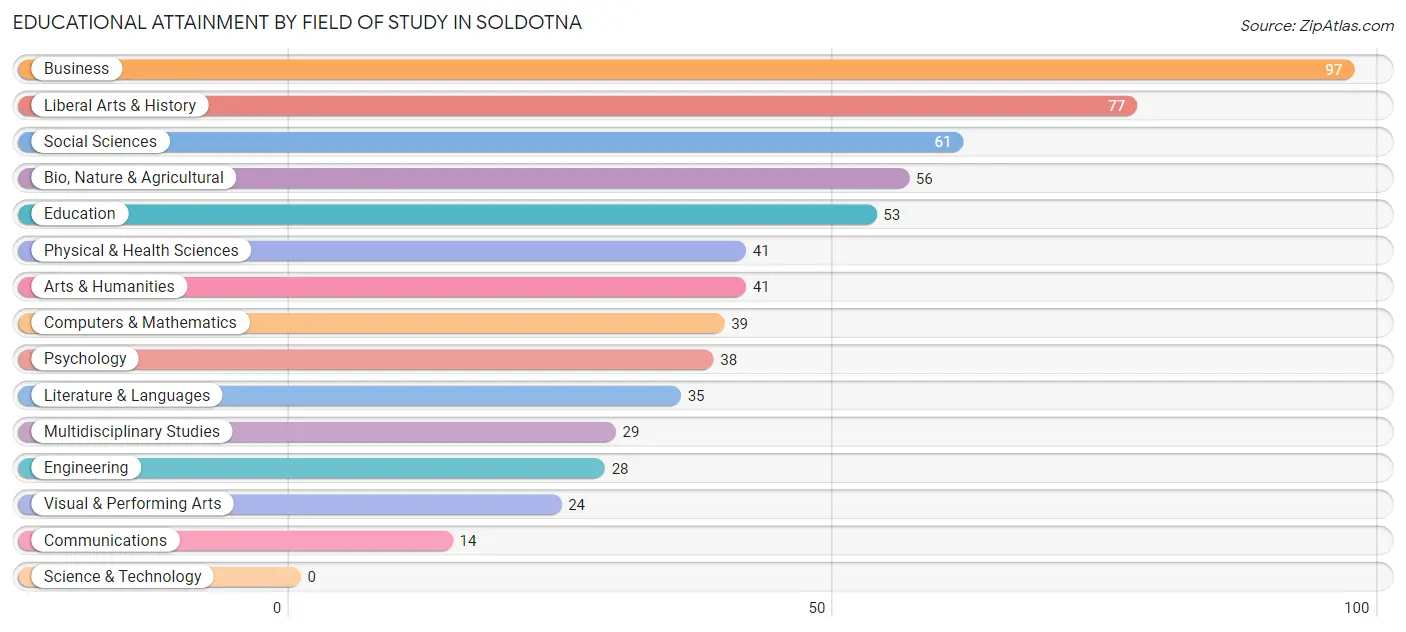
| Field of Study | # Graduates | % Graduates |
| Computers & Mathematics | 39 | 6.2% |
| Bio, Nature & Agricultural | 56 | 8.8% |
| Physical & Health Sciences | 41 | 6.5% |
| Psychology | 38 | 6.0% |
| Social Sciences | 61 | 9.6% |
| Engineering | 28 | 4.4% |
| Multidisciplinary Studies | 29 | 4.6% |
| Science & Technology | 0 | 0.0% |
| Business | 97 | 15.3% |
| Education | 53 | 8.4% |
| Literature & Languages | 35 | 5.5% |
| Liberal Arts & History | 77 | 12.2% |
| Visual & Performing Arts | 24 | 3.8% |
| Communications | 14 | 2.2% |
| Arts & Humanities | 41 | 6.5% |
| Total | 633 | 100.0% |
Transportation & Commute in Soldotna
Vehicle Availability by Sex in Soldotna
The most prevalent vehicle ownership categories in Soldotna are males with 2 vehicles (357, accounting for 35.9%) and females with 2 vehicles (394, making up 35.6%).
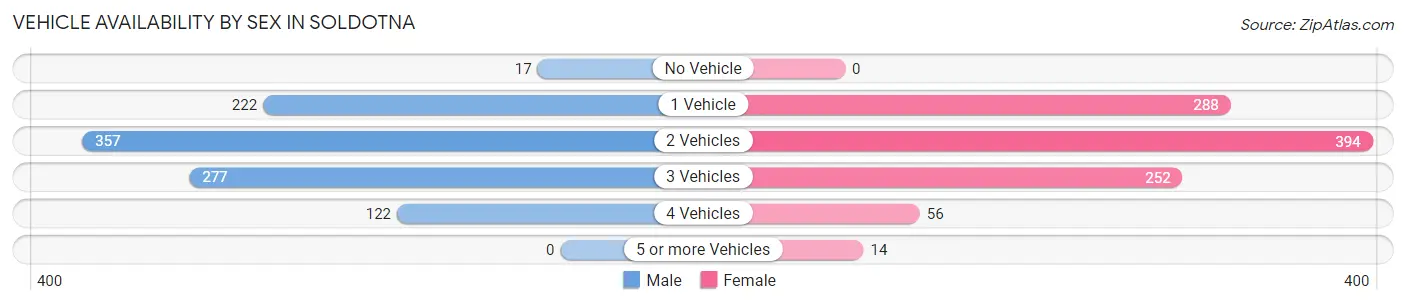
| Vehicles Available | Male | Female |
| No Vehicle | 17 (1.7%) | 0 (0.0%) |
| 1 Vehicle | 222 (22.3%) | 288 (28.7%) |
| 2 Vehicles | 357 (35.9%) | 394 (39.2%) |
| 3 Vehicles | 277 (27.8%) | 252 (25.1%) |
| 4 Vehicles | 122 (12.3%) | 56 (5.6%) |
| 5 or more Vehicles | 0 (0.0%) | 14 (1.4%) |
| Total | 995 (100.0%) | 1,004 (100.0%) |
Commute Time in Soldotna
The most frequently occuring commute durations in Soldotna are 5 to 9 minutes (477 commuters, 24.9%), less than 5 minutes (402 commuters, 21.0%), and 10 to 14 minutes (338 commuters, 17.6%).
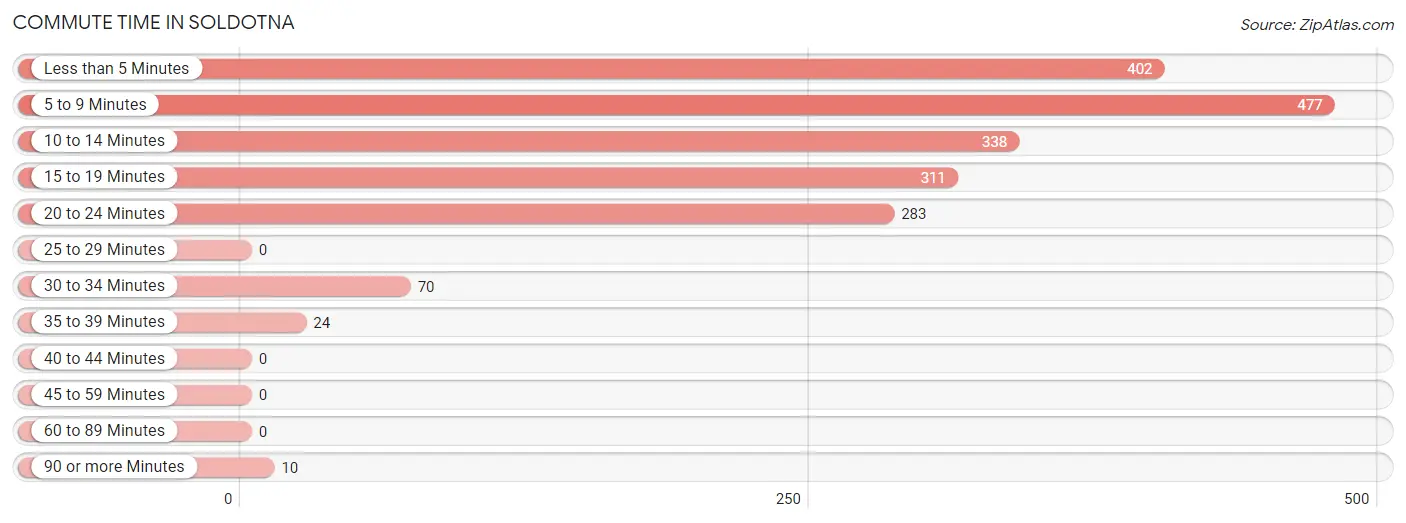
| Commute Time | # Commuters | % Commuters |
| Less than 5 Minutes | 402 | 21.0% |
| 5 to 9 Minutes | 477 | 24.9% |
| 10 to 14 Minutes | 338 | 17.6% |
| 15 to 19 Minutes | 311 | 16.2% |
| 20 to 24 Minutes | 283 | 14.8% |
| 25 to 29 Minutes | 0 | 0.0% |
| 30 to 34 Minutes | 70 | 3.7% |
| 35 to 39 Minutes | 24 | 1.3% |
| 40 to 44 Minutes | 0 | 0.0% |
| 45 to 59 Minutes | 0 | 0.0% |
| 60 to 89 Minutes | 0 | 0.0% |
| 90 or more Minutes | 10 | 0.5% |
Commute Time by Sex in Soldotna
The most common commute times in Soldotna are 10 to 14 minutes (237 commuters, 24.3%) for males and 5 to 9 minutes (256 commuters, 27.2%) for females.
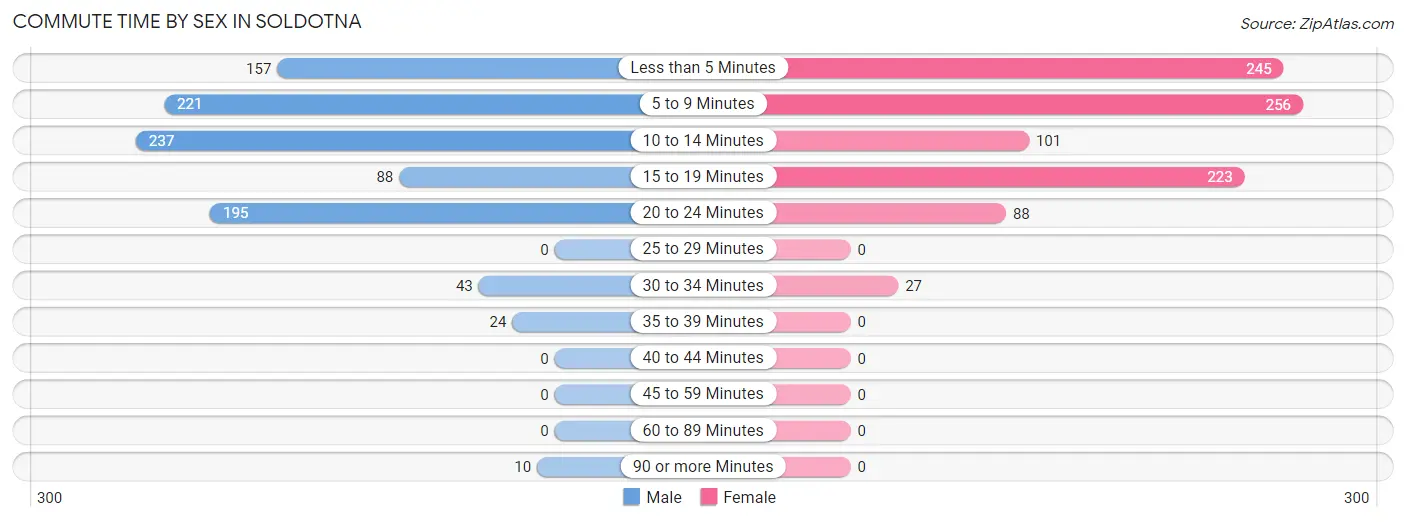
| Commute Time | Male | Female |
| Less than 5 Minutes | 157 (16.1%) | 245 (26.1%) |
| 5 to 9 Minutes | 221 (22.7%) | 256 (27.2%) |
| 10 to 14 Minutes | 237 (24.3%) | 101 (10.7%) |
| 15 to 19 Minutes | 88 (9.0%) | 223 (23.7%) |
| 20 to 24 Minutes | 195 (20.0%) | 88 (9.4%) |
| 25 to 29 Minutes | 0 (0.0%) | 0 (0.0%) |
| 30 to 34 Minutes | 43 (4.4%) | 27 (2.9%) |
| 35 to 39 Minutes | 24 (2.5%) | 0 (0.0%) |
| 40 to 44 Minutes | 0 (0.0%) | 0 (0.0%) |
| 45 to 59 Minutes | 0 (0.0%) | 0 (0.0%) |
| 60 to 89 Minutes | 0 (0.0%) | 0 (0.0%) |
| 90 or more Minutes | 10 (1.0%) | 0 (0.0%) |
Time of Departure to Work by Sex in Soldotna
The most frequent times of departure to work in Soldotna are 9:00 AM to 9:59 AM (197, 20.2%) for males and 8:00 AM to 8:29 AM (148, 15.7%) for females.
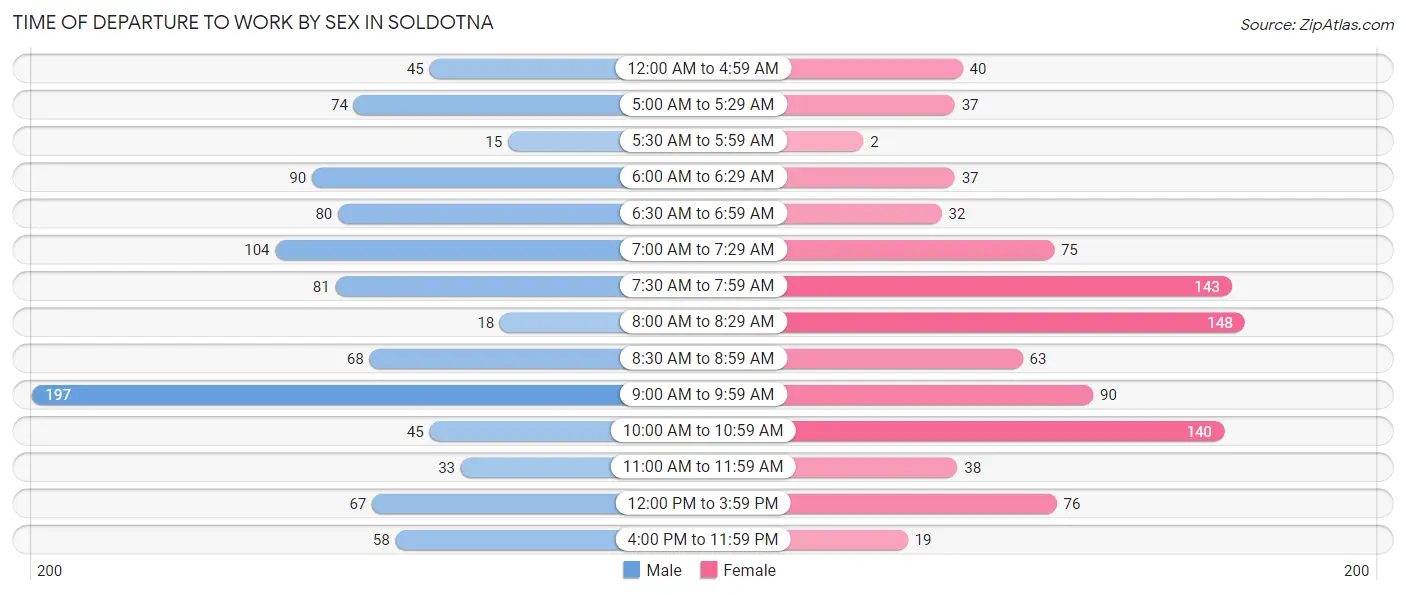
| Time of Departure | Male | Female |
| 12:00 AM to 4:59 AM | 45 (4.6%) | 40 (4.3%) |
| 5:00 AM to 5:29 AM | 74 (7.6%) | 37 (3.9%) |
| 5:30 AM to 5:59 AM | 15 (1.5%) | 2 (0.2%) |
| 6:00 AM to 6:29 AM | 90 (9.2%) | 37 (3.9%) |
| 6:30 AM to 6:59 AM | 80 (8.2%) | 32 (3.4%) |
| 7:00 AM to 7:29 AM | 104 (10.7%) | 75 (8.0%) |
| 7:30 AM to 7:59 AM | 81 (8.3%) | 143 (15.2%) |
| 8:00 AM to 8:29 AM | 18 (1.8%) | 148 (15.7%) |
| 8:30 AM to 8:59 AM | 68 (7.0%) | 63 (6.7%) |
| 9:00 AM to 9:59 AM | 197 (20.2%) | 90 (9.6%) |
| 10:00 AM to 10:59 AM | 45 (4.6%) | 140 (14.9%) |
| 11:00 AM to 11:59 AM | 33 (3.4%) | 38 (4.0%) |
| 12:00 PM to 3:59 PM | 67 (6.9%) | 76 (8.1%) |
| 4:00 PM to 11:59 PM | 58 (5.9%) | 19 (2.0%) |
| Total | 975 (100.0%) | 940 (100.0%) |
Housing Occupancy in Soldotna
Occupancy by Ownership in Soldotna
Of the total 1,739 dwellings in Soldotna, owner-occupied units account for 990 (56.9%), while renter-occupied units make up 749 (43.1%).
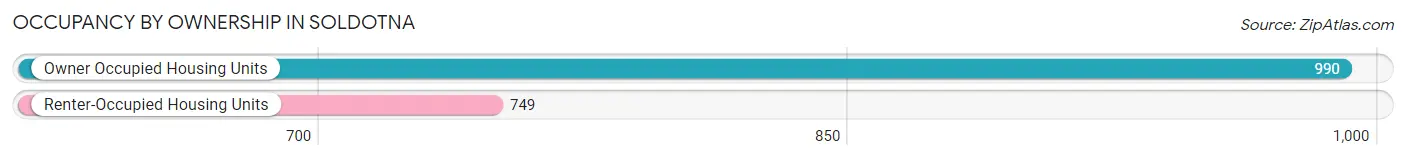
| Occupancy | # Housing Units | % Housing Units |
| Owner Occupied Housing Units | 990 | 56.9% |
| Renter-Occupied Housing Units | 749 | 43.1% |
| Total Occupied Housing Units | 1,739 | 100.0% |
Occupancy by Household Size in Soldotna
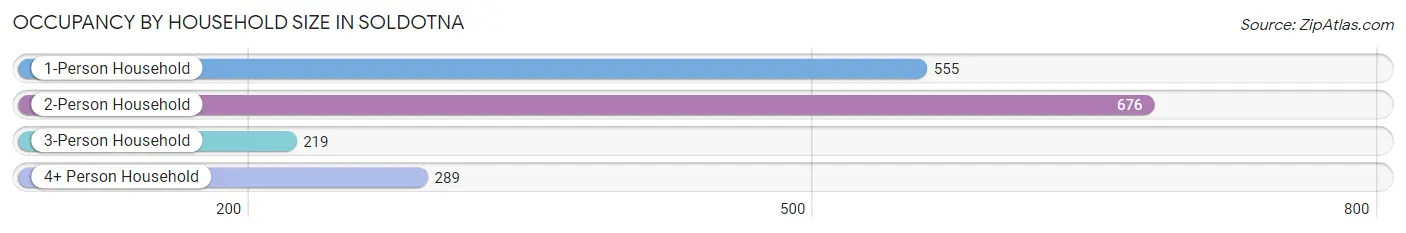
| Household Size | # Housing Units | % Housing Units |
| 1-Person Household | 555 | 31.9% |
| 2-Person Household | 676 | 38.9% |
| 3-Person Household | 219 | 12.6% |
| 4+ Person Household | 289 | 16.6% |
| Total Housing Units | 1,739 | 100.0% |
Occupancy by Ownership by Household Size in Soldotna
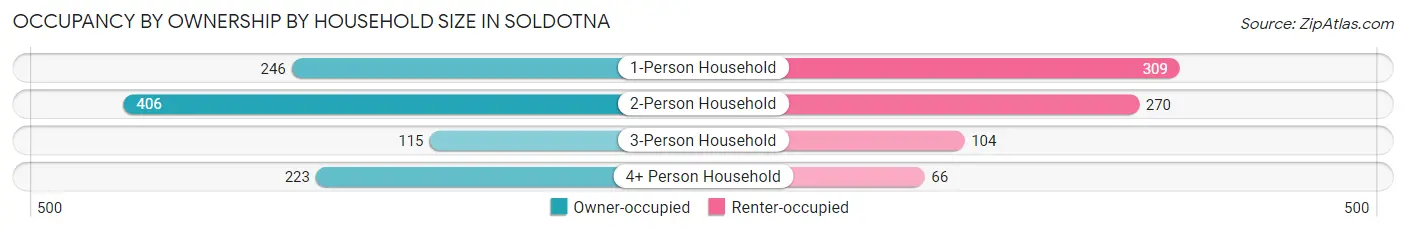
| Household Size | Owner-occupied | Renter-occupied |
| 1-Person Household | 246 (44.3%) | 309 (55.7%) |
| 2-Person Household | 406 (60.1%) | 270 (39.9%) |
| 3-Person Household | 115 (52.5%) | 104 (47.5%) |
| 4+ Person Household | 223 (77.2%) | 66 (22.8%) |
| Total Housing Units | 990 (56.9%) | 749 (43.1%) |
Occupancy by Educational Attainment in Soldotna
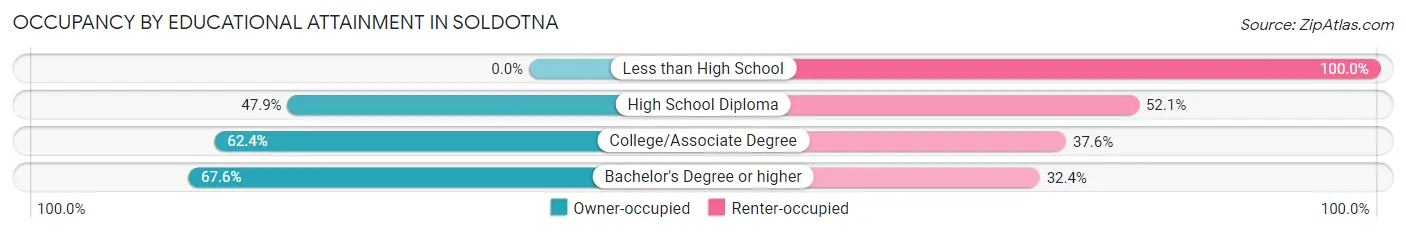
| Household Size | Owner-occupied | Renter-occupied |
| Less than High School | 0 (0.0%) | 33 (100.0%) |
| High School Diploma | 295 (47.9%) | 321 (52.1%) |
| College/Associate Degree | 497 (62.4%) | 300 (37.6%) |
| Bachelor's Degree or higher | 198 (67.6%) | 95 (32.4%) |
Occupancy by Age of Householder in Soldotna
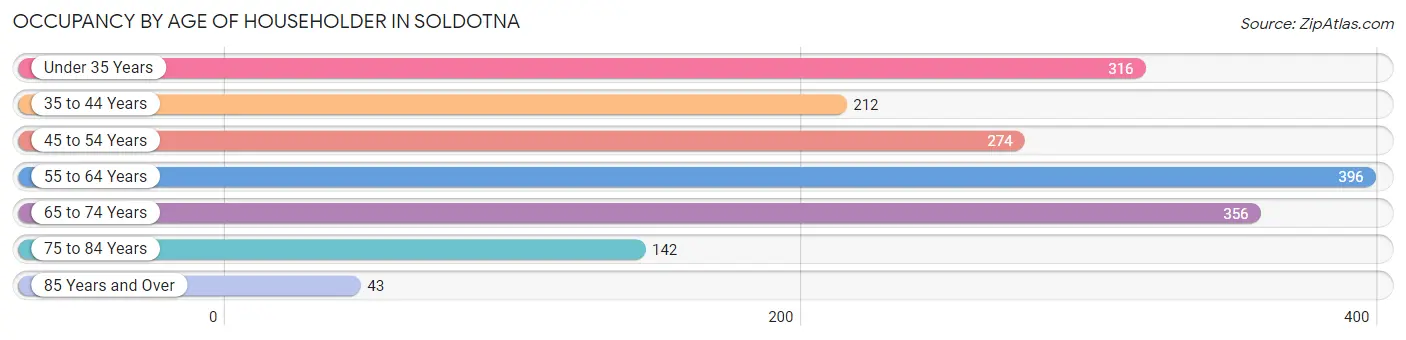
| Age Bracket | # Households | % Households |
| Under 35 Years | 316 | 18.2% |
| 35 to 44 Years | 212 | 12.2% |
| 45 to 54 Years | 274 | 15.8% |
| 55 to 64 Years | 396 | 22.8% |
| 65 to 74 Years | 356 | 20.5% |
| 75 to 84 Years | 142 | 8.2% |
| 85 Years and Over | 43 | 2.5% |
| Total | 1,739 | 100.0% |
Housing Finances in Soldotna
Median Income by Occupancy in Soldotna
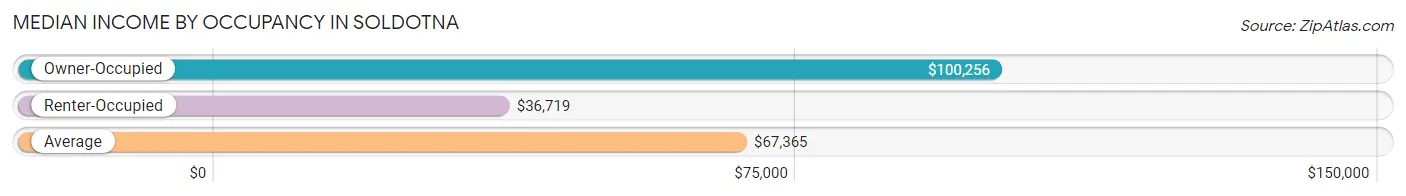
| Occupancy Type | # Households | Median Income |
| Owner-Occupied | 990 (56.9%) | $100,256 |
| Renter-Occupied | 749 (43.1%) | $36,719 |
| Average | 1,739 (100.0%) | $67,365 |
Occupancy by Householder Income Bracket in Soldotna
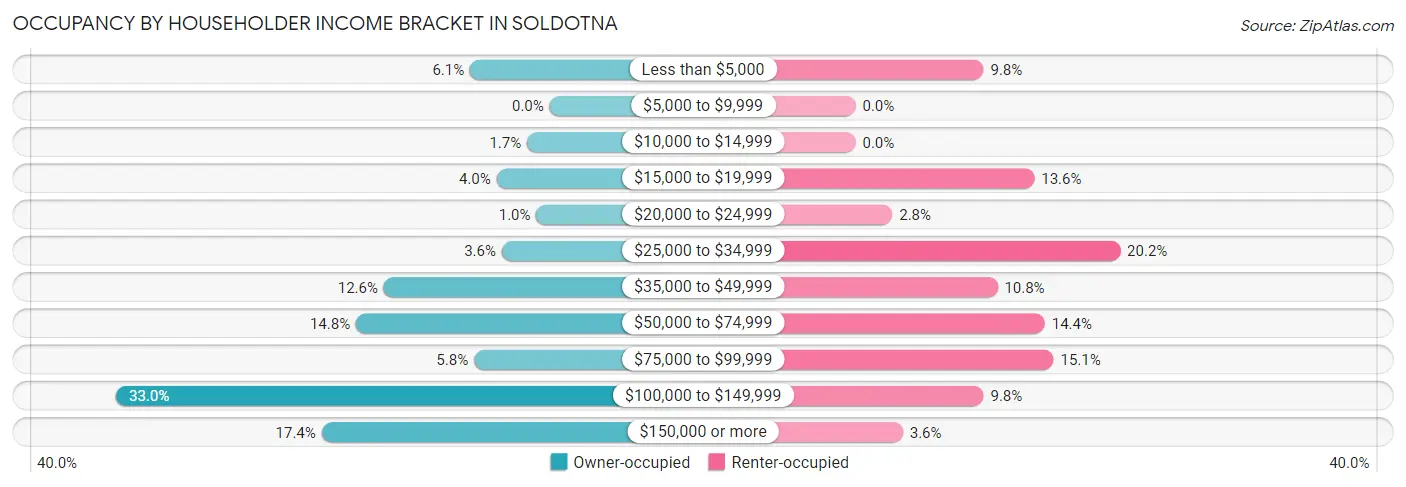
| Income Bracket | Owner-occupied | Renter-occupied |
| Less than $5,000 | 60 (6.1%) | 73 (9.8%) |
| $5,000 to $9,999 | 0 (0.0%) | 0 (0.0%) |
| $10,000 to $14,999 | 17 (1.7%) | 0 (0.0%) |
| $15,000 to $19,999 | 40 (4.0%) | 102 (13.6%) |
| $20,000 to $24,999 | 10 (1.0%) | 21 (2.8%) |
| $25,000 to $34,999 | 36 (3.6%) | 151 (20.2%) |
| $35,000 to $49,999 | 125 (12.6%) | 81 (10.8%) |
| $50,000 to $74,999 | 146 (14.7%) | 108 (14.4%) |
| $75,000 to $99,999 | 57 (5.8%) | 113 (15.1%) |
| $100,000 to $149,999 | 327 (33.0%) | 73 (9.8%) |
| $150,000 or more | 172 (17.4%) | 27 (3.6%) |
| Total | 990 (100.0%) | 749 (100.0%) |
Monthly Housing Cost Tiers in Soldotna
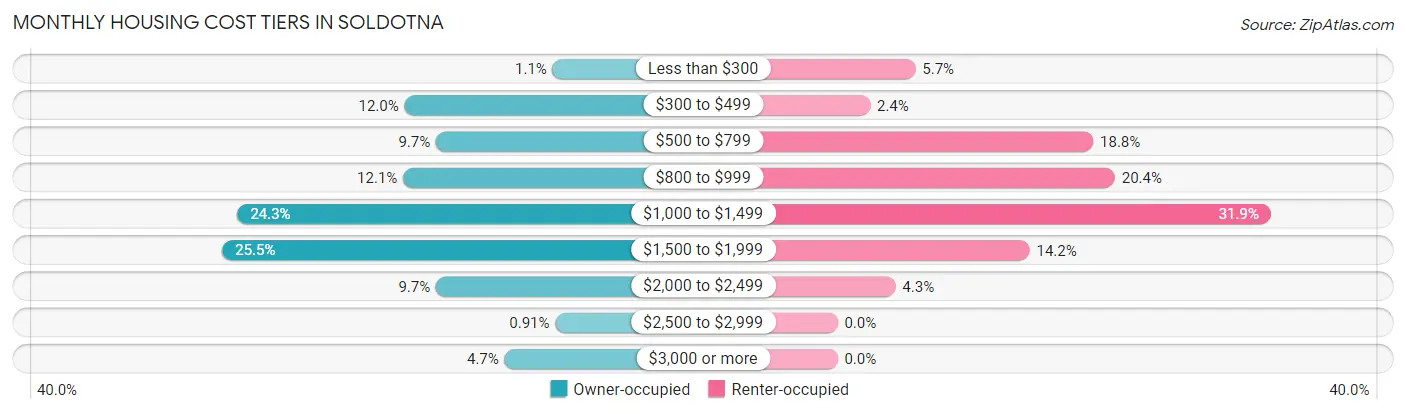
| Monthly Cost | Owner-occupied | Renter-occupied |
| Less than $300 | 11 (1.1%) | 43 (5.7%) |
| $300 to $499 | 119 (12.0%) | 18 (2.4%) |
| $500 to $799 | 96 (9.7%) | 141 (18.8%) |
| $800 to $999 | 120 (12.1%) | 153 (20.4%) |
| $1,000 to $1,499 | 241 (24.3%) | 239 (31.9%) |
| $1,500 to $1,999 | 252 (25.5%) | 106 (14.1%) |
| $2,000 to $2,499 | 96 (9.7%) | 32 (4.3%) |
| $2,500 to $2,999 | 9 (0.9%) | 0 (0.0%) |
| $3,000 or more | 46 (4.6%) | 0 (0.0%) |
| Total | 990 (100.0%) | 749 (100.0%) |
Physical Housing Characteristics in Soldotna
Housing Structures in Soldotna
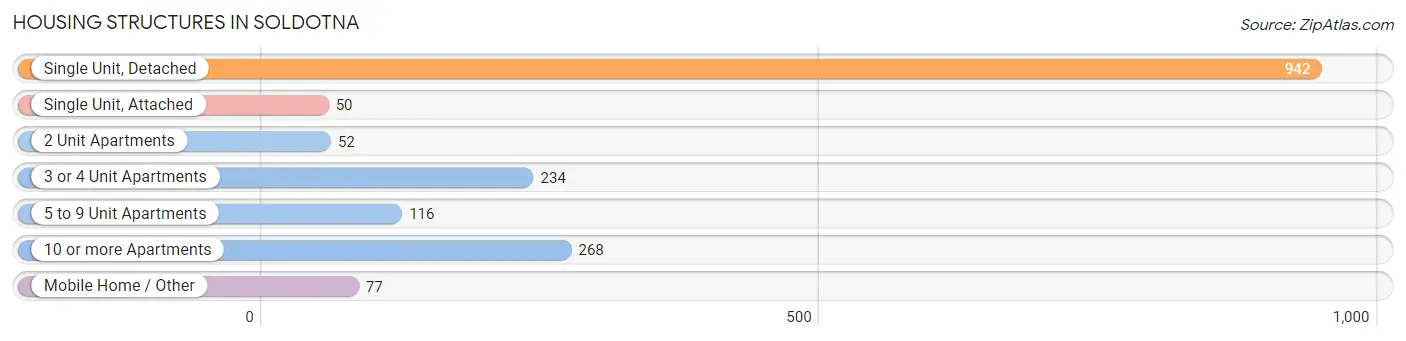
| Structure Type | # Housing Units | % Housing Units |
| Single Unit, Detached | 942 | 54.2% |
| Single Unit, Attached | 50 | 2.9% |
| 2 Unit Apartments | 52 | 3.0% |
| 3 or 4 Unit Apartments | 234 | 13.5% |
| 5 to 9 Unit Apartments | 116 | 6.7% |
| 10 or more Apartments | 268 | 15.4% |
| Mobile Home / Other | 77 | 4.4% |
| Total | 1,739 | 100.0% |
Housing Structures by Occupancy in Soldotna
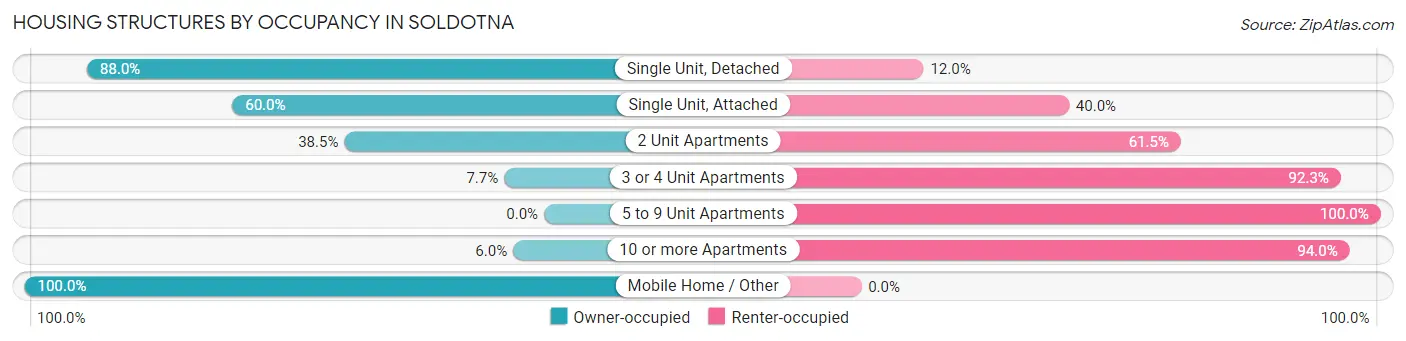
| Structure Type | Owner-occupied | Renter-occupied |
| Single Unit, Detached | 829 (88.0%) | 113 (12.0%) |
| Single Unit, Attached | 30 (60.0%) | 20 (40.0%) |
| 2 Unit Apartments | 20 (38.5%) | 32 (61.5%) |
| 3 or 4 Unit Apartments | 18 (7.7%) | 216 (92.3%) |
| 5 to 9 Unit Apartments | 0 (0.0%) | 116 (100.0%) |
| 10 or more Apartments | 16 (6.0%) | 252 (94.0%) |
| Mobile Home / Other | 77 (100.0%) | 0 (0.0%) |
| Total | 990 (56.9%) | 749 (43.1%) |
Housing Structures by Number of Rooms in Soldotna
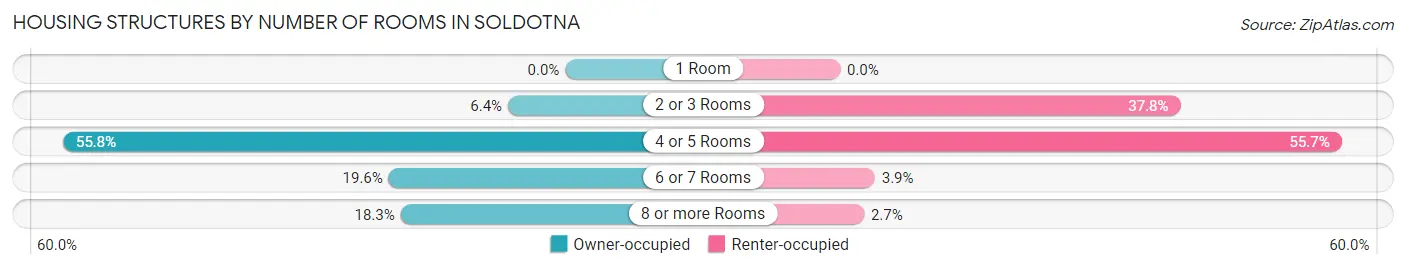
| Number of Rooms | Owner-occupied | Renter-occupied |
| 1 Room | 0 (0.0%) | 0 (0.0%) |
| 2 or 3 Rooms | 63 (6.4%) | 283 (37.8%) |
| 4 or 5 Rooms | 552 (55.8%) | 417 (55.7%) |
| 6 or 7 Rooms | 194 (19.6%) | 29 (3.9%) |
| 8 or more Rooms | 181 (18.3%) | 20 (2.7%) |
| Total | 990 (100.0%) | 749 (100.0%) |
Housing Structure by Heating Type in Soldotna
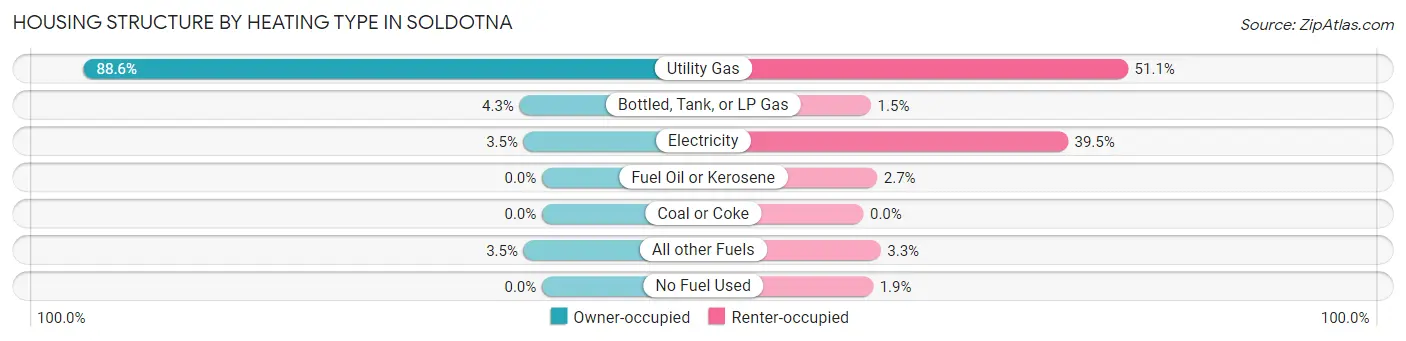
| Heating Type | Owner-occupied | Renter-occupied |
| Utility Gas | 877 (88.6%) | 383 (51.1%) |
| Bottled, Tank, or LP Gas | 43 (4.3%) | 11 (1.5%) |
| Electricity | 35 (3.5%) | 296 (39.5%) |
| Fuel Oil or Kerosene | 0 (0.0%) | 20 (2.7%) |
| Coal or Coke | 0 (0.0%) | 0 (0.0%) |
| All other Fuels | 35 (3.5%) | 25 (3.3%) |
| No Fuel Used | 0 (0.0%) | 14 (1.9%) |
| Total | 990 (100.0%) | 749 (100.0%) |
Household Vehicle Usage in Soldotna
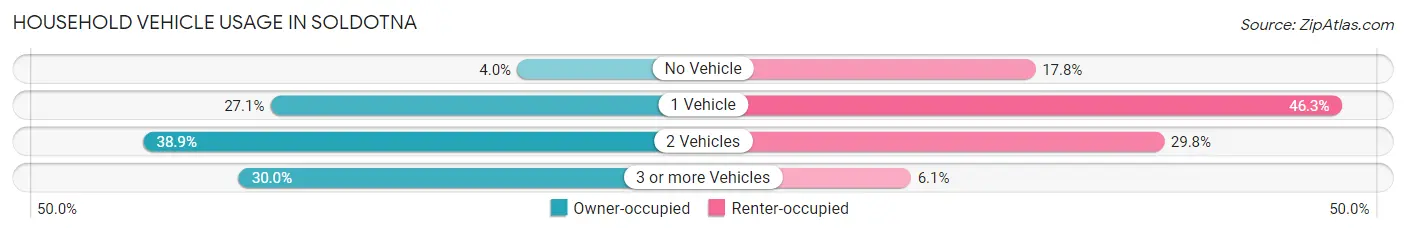
| Vehicles per Household | Owner-occupied | Renter-occupied |
| No Vehicle | 40 (4.0%) | 133 (17.8%) |
| 1 Vehicle | 268 (27.1%) | 347 (46.3%) |
| 2 Vehicles | 385 (38.9%) | 223 (29.8%) |
| 3 or more Vehicles | 297 (30.0%) | 46 (6.1%) |
| Total | 990 (100.0%) | 749 (100.0%) |
Real Estate & Mortgages in Soldotna
Real Estate and Mortgage Overview in Soldotna
| Characteristic | Without Mortgage | With Mortgage |
| Housing Units | 264 | 726 |
| Median Property Value | $195,500 | $265,600 |
| Median Household Income | $48,864 | $133 |
| Monthly Housing Costs | $506 | $46 |
| Real Estate Taxes | - | - |
Property Value by Mortgage Status in Soldotna
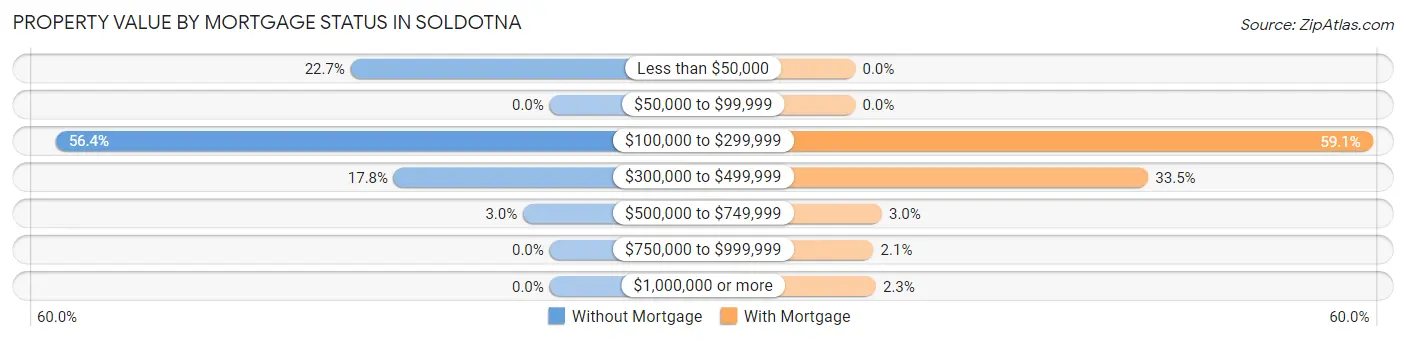
| Property Value | Without Mortgage | With Mortgage |
| Less than $50,000 | 60 (22.7%) | 0 (0.0%) |
| $50,000 to $99,999 | 0 (0.0%) | 0 (0.0%) |
| $100,000 to $299,999 | 149 (56.4%) | 429 (59.1%) |
| $300,000 to $499,999 | 47 (17.8%) | 243 (33.5%) |
| $500,000 to $749,999 | 8 (3.0%) | 22 (3.0%) |
| $750,000 to $999,999 | 0 (0.0%) | 15 (2.1%) |
| $1,000,000 or more | 0 (0.0%) | 17 (2.3%) |
| Total | 264 (100.0%) | 726 (100.0%) |
Household Income by Mortgage Status in Soldotna
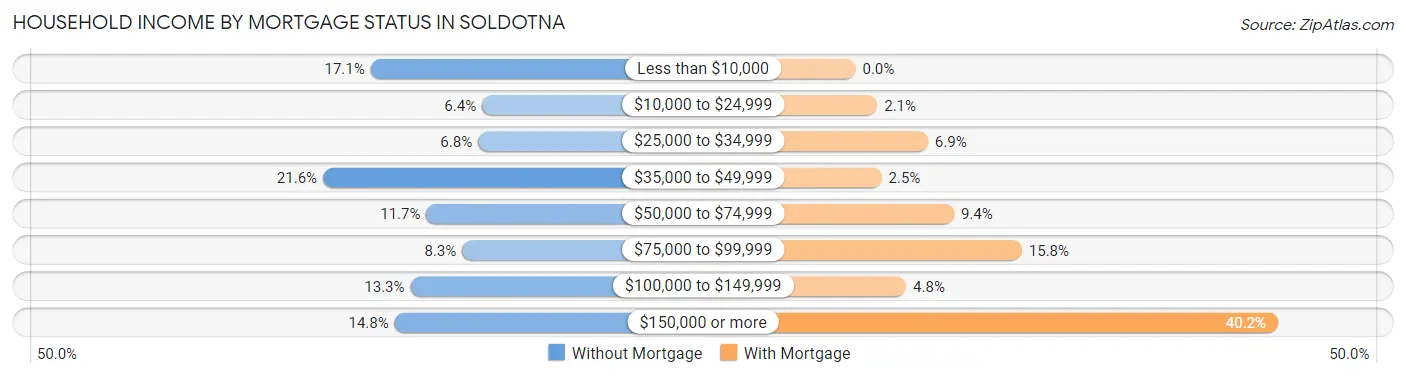
| Household Income | Without Mortgage | With Mortgage |
| Less than $10,000 | 45 (17.1%) | 0 (0.0%) |
| $10,000 to $24,999 | 17 (6.4%) | 15 (2.1%) |
| $25,000 to $34,999 | 18 (6.8%) | 50 (6.9%) |
| $35,000 to $49,999 | 57 (21.6%) | 18 (2.5%) |
| $50,000 to $74,999 | 31 (11.7%) | 68 (9.4%) |
| $75,000 to $99,999 | 22 (8.3%) | 115 (15.8%) |
| $100,000 to $149,999 | 35 (13.3%) | 35 (4.8%) |
| $150,000 or more | 39 (14.8%) | 292 (40.2%) |
| Total | 264 (100.0%) | 726 (100.0%) |
Property Value to Household Income Ratio in Soldotna
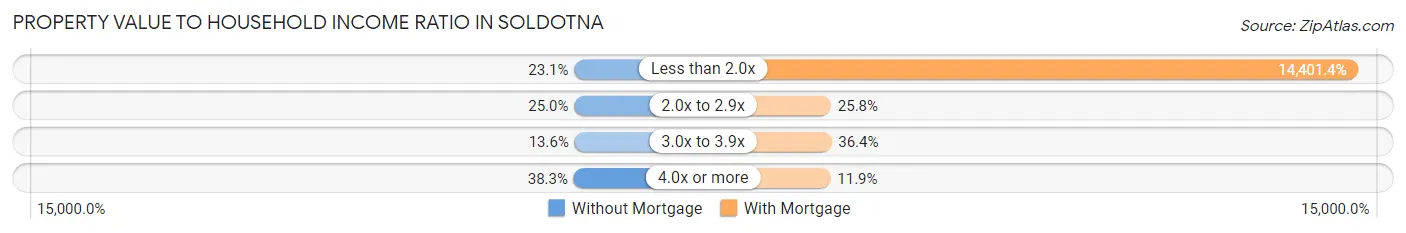
| Value-to-Income Ratio | Without Mortgage | With Mortgage |
| Less than 2.0x | 61 (23.1%) | 104,554 (14,401.4%) |
| 2.0x to 2.9x | 66 (25.0%) | 187 (25.8%) |
| 3.0x to 3.9x | 36 (13.6%) | 264 (36.4%) |
| 4.0x or more | 101 (38.3%) | 86 (11.8%) |
| Total | 264 (100.0%) | 726 (100.0%) |
Real Estate Taxes by Mortgage Status in Soldotna
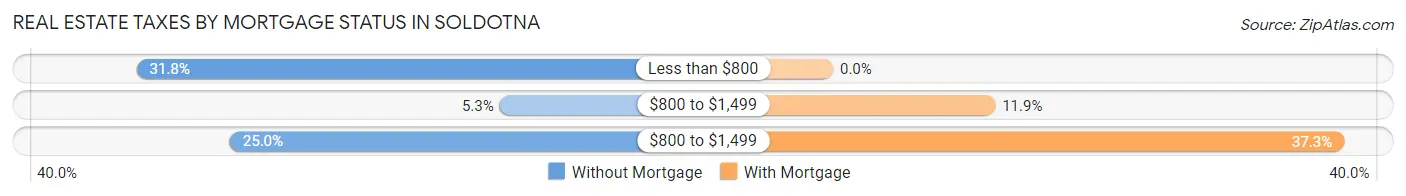
| Property Taxes | Without Mortgage | With Mortgage |
| Less than $800 | 84 (31.8%) | 0 (0.0%) |
| $800 to $1,499 | 14 (5.3%) | 86 (11.8%) |
| $800 to $1,499 | 66 (25.0%) | 271 (37.3%) |
| Total | 264 (100.0%) | 726 (100.0%) |
Health & Disability in Soldotna
Health Insurance Coverage by Age in Soldotna
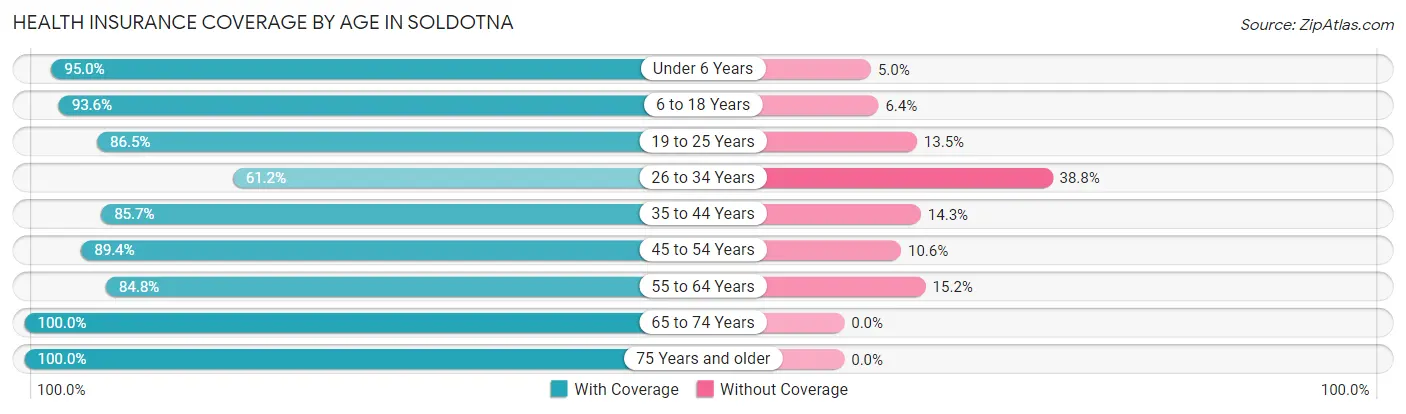
| Age Bracket | With Coverage | Without Coverage |
| Under 6 Years | 286 (95.0%) | 15 (5.0%) |
| 6 to 18 Years | 646 (93.6%) | 44 (6.4%) |
| 19 to 25 Years | 415 (86.5%) | 65 (13.5%) |
| 26 to 34 Years | 345 (61.2%) | 219 (38.8%) |
| 35 to 44 Years | 390 (85.7%) | 65 (14.3%) |
| 45 to 54 Years | 481 (89.4%) | 57 (10.6%) |
| 55 to 64 Years | 509 (84.8%) | 91 (15.2%) |
| 65 to 74 Years | 460 (100.0%) | 0 (0.0%) |
| 75 Years and older | 259 (100.0%) | 0 (0.0%) |
| Total | 3,791 (87.2%) | 556 (12.8%) |
Health Insurance Coverage by Citizenship Status in Soldotna
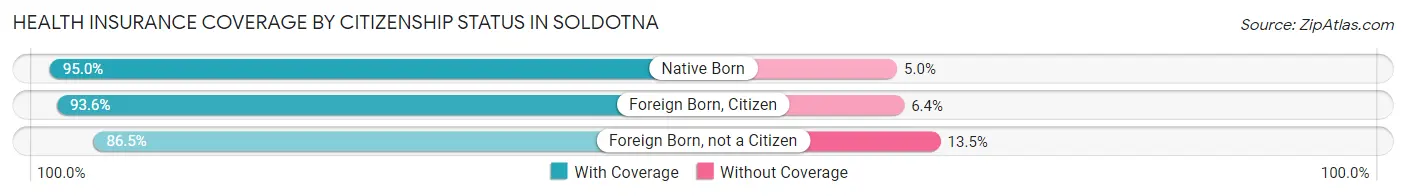
| Citizenship Status | With Coverage | Without Coverage |
| Native Born | 286 (95.0%) | 15 (5.0%) |
| Foreign Born, Citizen | 646 (93.6%) | 44 (6.4%) |
| Foreign Born, not a Citizen | 415 (86.5%) | 65 (13.5%) |
Health Insurance Coverage by Household Income in Soldotna
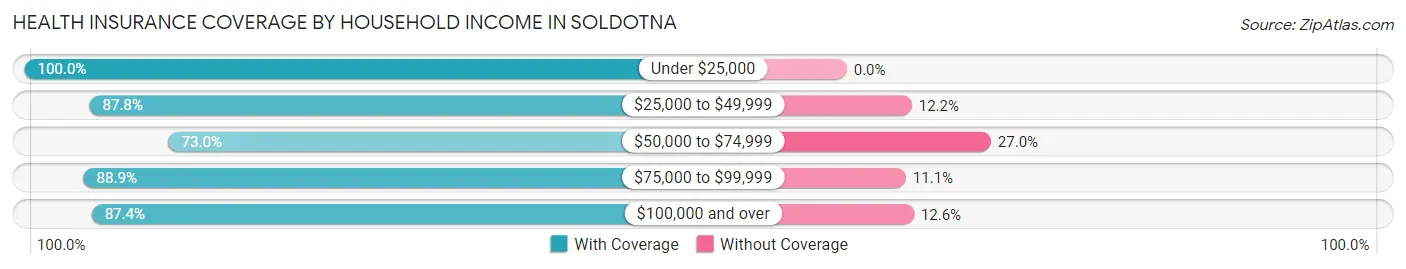
| Household Income | With Coverage | Without Coverage |
| Under $25,000 | 539 (100.0%) | 0 (0.0%) |
| $25,000 to $49,999 | 584 (87.8%) | 81 (12.2%) |
| $50,000 to $74,999 | 446 (73.0%) | 165 (27.0%) |
| $75,000 to $99,999 | 434 (88.9%) | 54 (11.1%) |
| $100,000 and over | 1,772 (87.4%) | 255 (12.6%) |
Public vs Private Health Insurance Coverage by Age in Soldotna
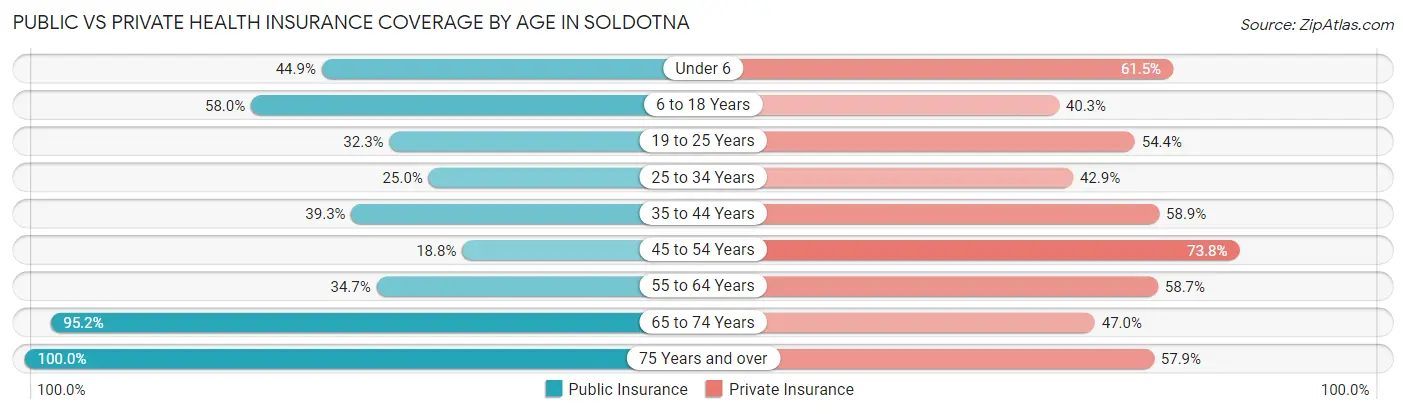
| Age Bracket | Public Insurance | Private Insurance |
| Under 6 | 135 (44.9%) | 185 (61.5%) |
| 6 to 18 Years | 400 (58.0%) | 278 (40.3%) |
| 19 to 25 Years | 155 (32.3%) | 261 (54.4%) |
| 25 to 34 Years | 141 (25.0%) | 242 (42.9%) |
| 35 to 44 Years | 179 (39.3%) | 268 (58.9%) |
| 45 to 54 Years | 101 (18.8%) | 397 (73.8%) |
| 55 to 64 Years | 208 (34.7%) | 352 (58.7%) |
| 65 to 74 Years | 438 (95.2%) | 216 (47.0%) |
| 75 Years and over | 259 (100.0%) | 150 (57.9%) |
| Total | 2,016 (46.4%) | 2,349 (54.0%) |
Disability Status by Sex by Age in Soldotna
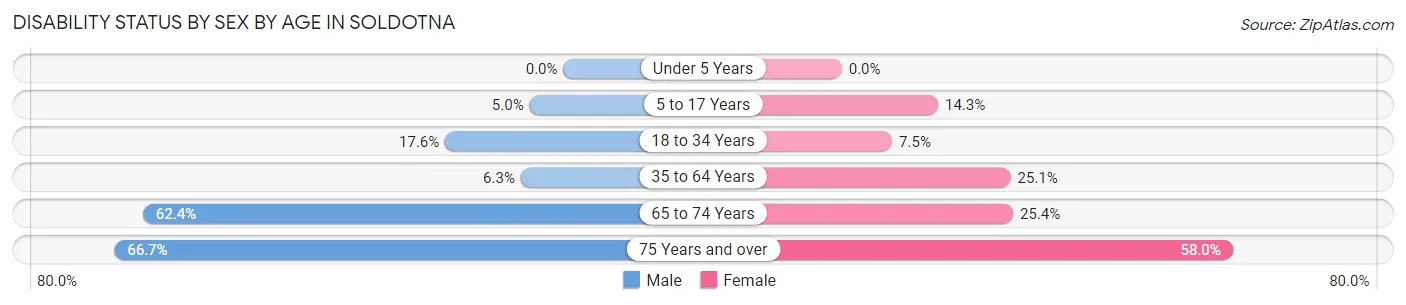
| Age Bracket | Male | Female |
| Under 5 Years | 0 (0.0%) | 0 (0.0%) |
| 5 to 17 Years | 19 (5.0%) | 49 (14.3%) |
| 18 to 34 Years | 82 (17.6%) | 46 (7.5%) |
| 35 to 64 Years | 47 (6.3%) | 213 (25.1%) |
| 65 to 74 Years | 108 (62.4%) | 73 (25.4%) |
| 75 Years and over | 44 (66.7%) | 112 (58.0%) |
Disability Class by Sex by Age in Soldotna
Disability Class: Hearing Difficulty
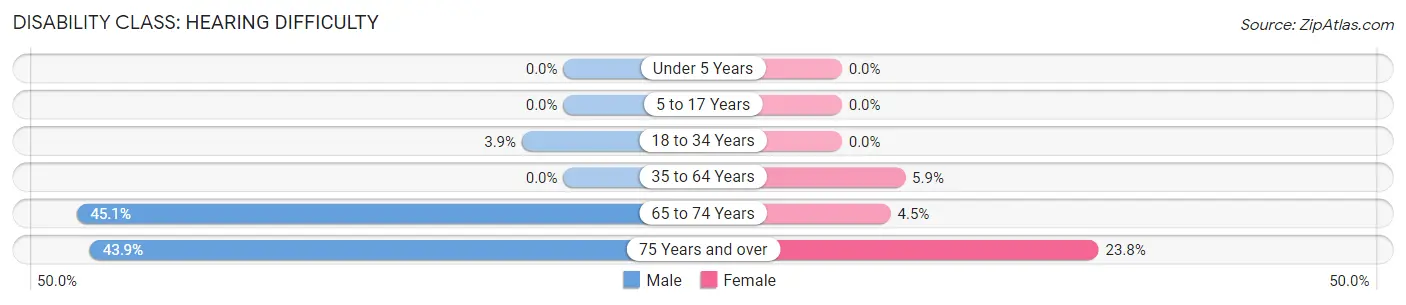
| Age Bracket | Male | Female |
| Under 5 Years | 0 (0.0%) | 0 (0.0%) |
| 5 to 17 Years | 0 (0.0%) | 0 (0.0%) |
| 18 to 34 Years | 18 (3.8%) | 0 (0.0%) |
| 35 to 64 Years | 0 (0.0%) | 50 (5.9%) |
| 65 to 74 Years | 78 (45.1%) | 13 (4.5%) |
| 75 Years and over | 29 (43.9%) | 46 (23.8%) |
Disability Class: Vision Difficulty
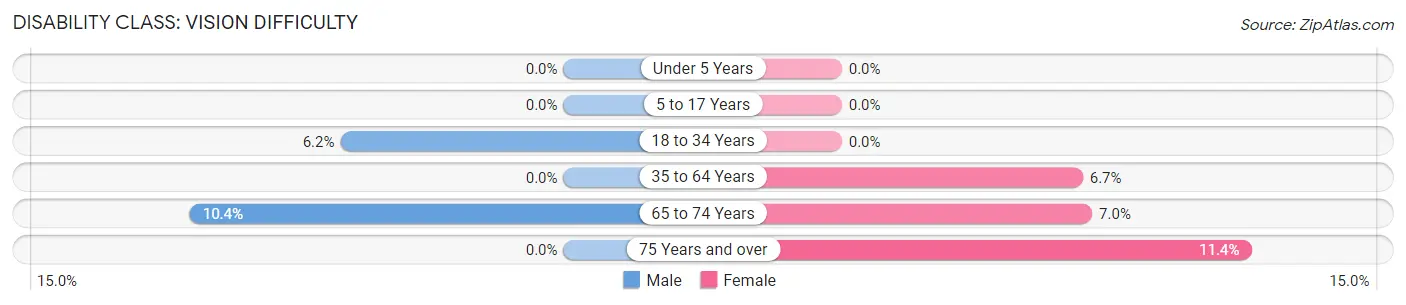
| Age Bracket | Male | Female |
| Under 5 Years | 0 (0.0%) | 0 (0.0%) |
| 5 to 17 Years | 0 (0.0%) | 0 (0.0%) |
| 18 to 34 Years | 29 (6.2%) | 0 (0.0%) |
| 35 to 64 Years | 0 (0.0%) | 57 (6.7%) |
| 65 to 74 Years | 18 (10.4%) | 20 (7.0%) |
| 75 Years and over | 0 (0.0%) | 22 (11.4%) |
Disability Class: Cognitive Difficulty
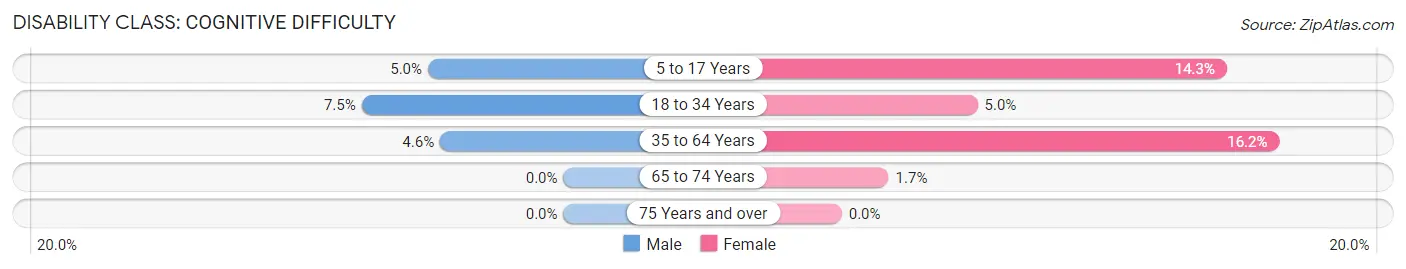
| Age Bracket | Male | Female |
| 5 to 17 Years | 19 (5.0%) | 49 (14.3%) |
| 18 to 34 Years | 35 (7.5%) | 31 (5.0%) |
| 35 to 64 Years | 34 (4.6%) | 138 (16.2%) |
| 65 to 74 Years | 0 (0.0%) | 5 (1.7%) |
| 75 Years and over | 0 (0.0%) | 0 (0.0%) |
Disability Class: Ambulatory Difficulty
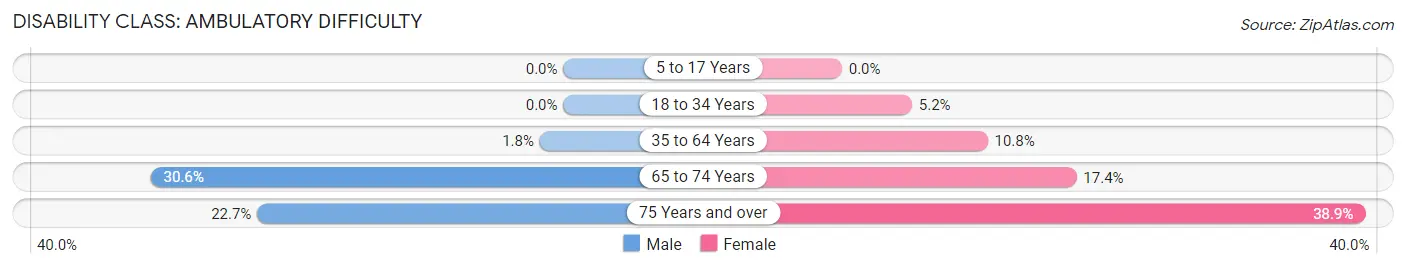
| Age Bracket | Male | Female |
| 5 to 17 Years | 0 (0.0%) | 0 (0.0%) |
| 18 to 34 Years | 0 (0.0%) | 32 (5.2%) |
| 35 to 64 Years | 13 (1.8%) | 92 (10.8%) |
| 65 to 74 Years | 53 (30.6%) | 50 (17.4%) |
| 75 Years and over | 15 (22.7%) | 75 (38.9%) |
Disability Class: Self-Care Difficulty
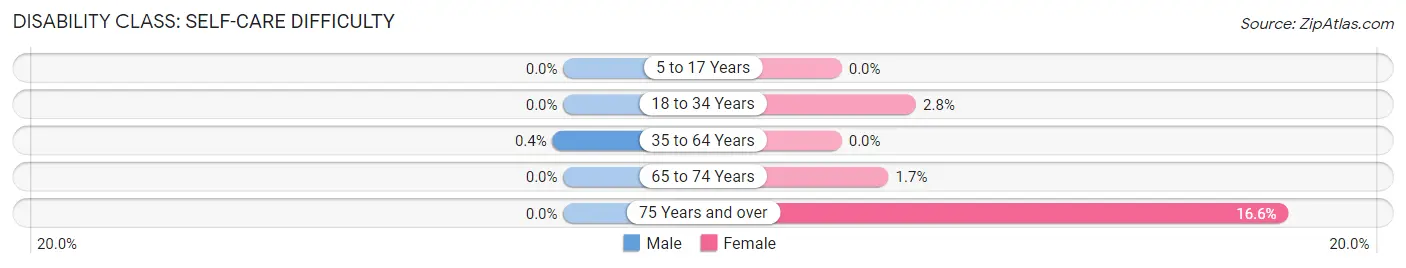
| Age Bracket | Male | Female |
| 5 to 17 Years | 0 (0.0%) | 0 (0.0%) |
| 18 to 34 Years | 0 (0.0%) | 17 (2.8%) |
| 35 to 64 Years | 3 (0.4%) | 0 (0.0%) |
| 65 to 74 Years | 0 (0.0%) | 5 (1.7%) |
| 75 Years and over | 0 (0.0%) | 32 (16.6%) |
Technology Access in Soldotna
Computing Device Access in Soldotna
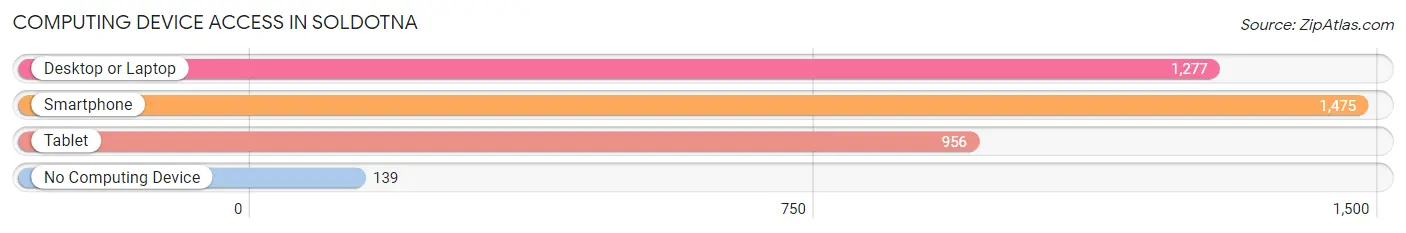
| Device Type | # Households | % Households |
| Desktop or Laptop | 1,277 | 73.4% |
| Smartphone | 1,475 | 84.8% |
| Tablet | 956 | 55.0% |
| No Computing Device | 139 | 8.0% |
| Total | 1,739 | 100.0% |
Internet Access in Soldotna
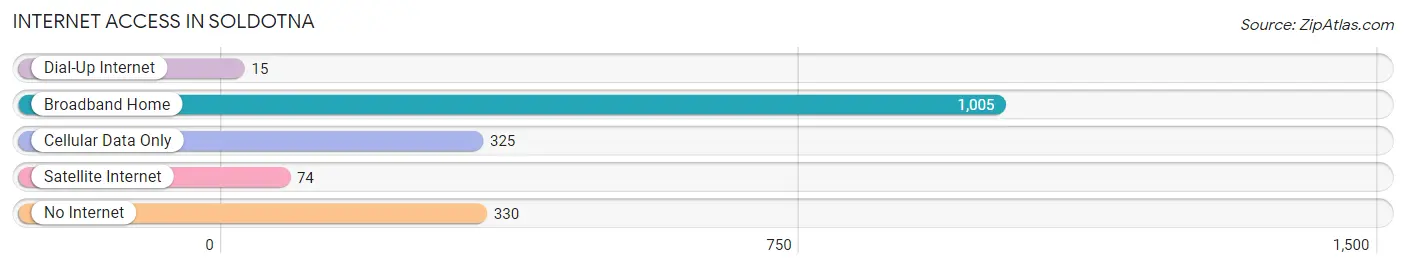
| Internet Type | # Households | % Households |
| Dial-Up Internet | 15 | 0.9% |
| Broadband Home | 1,005 | 57.8% |
| Cellular Data Only | 325 | 18.7% |
| Satellite Internet | 74 | 4.3% |
| No Internet | 330 | 19.0% |
| Total | 1,739 | 100.0% |
Soldotna Summary
History
The area now known as Soldotna, Alaska was first inhabited by the Dena’ina Athabascan people. The Dena’ina Athabascan people have lived in the area for thousands of years and have a rich culture and history. The Dena’ina Athabascan people were nomadic and followed the seasonal migration of the salmon. They lived in small villages along the Kenai River and its tributaries.
The first non-native settlers arrived in the area in the late 1800s. These settlers were mostly trappers and fur traders who were drawn to the area by the abundance of fur-bearing animals. The first permanent non-native settlement in the area was established in the early 1900s by a group of homesteaders. The homesteaders built a small community and named it Soldotna, after the nearby Soldotna Creek.
The area around Soldotna began to grow in the 1950s when the Alaska Statehood Act was passed. This act opened up the area to development and the population began to grow. The first school in the area was built in 1954 and the first post office was established in 1956.
In the 1960s, the area around Soldotna began to experience a boom in population and development. The Kenai Peninsula Borough was formed in 1964 and Soldotna was incorporated as a city in 1967. The city has continued to grow since then and is now home to over 4,000 people.
Geography
Soldotna is located on the Kenai Peninsula in south-central Alaska. The city is situated on the banks of the Kenai River, which is the longest river in Alaska. The city is surrounded by mountains and forests and is close to the Kenai National Wildlife Refuge.
The climate in Soldotna is mild and temperate. The average temperature in the summer is around 60°F and the average temperature in the winter is around 20°F. The area receives an average of 20 inches of precipitation per year.
Economy
The economy of Soldotna is largely based on tourism and fishing. The city is a popular destination for tourists who come to enjoy the natural beauty of the area and to fish for salmon in the Kenai River. The city is also home to several businesses, including restaurants, hotels, and retail stores.
The city is also home to several industries, including oil and gas, timber, and mining. The oil and gas industry is the largest employer in the area and provides jobs for many of the city’s residents.
Demographics
As of the 2010 census, the population of Soldotna was 4,163. The population is made up of a diverse mix of people from different backgrounds. The largest ethnic group in the city is white, making up 78.3% of the population. The next largest ethnic group is Native American, making up 11.2% of the population. Other ethnic groups include Asian (3.2%), African American (2.2%), and Hispanic (2.1%).
The median household income in Soldotna is $63,944 and the median home value is $219,400. The city has a low unemployment rate of 4.2%. The city also has a high rate of homeownership, with 73.3% of the population owning their own homes.
Conclusion
Soldotna, Alaska is a small city located on the Kenai Peninsula in south-central Alaska. The city has a rich history and culture and is home to a diverse population. The economy of the city is largely based on tourism and fishing and the city is home to several businesses and industries. The city has a low unemployment rate and a high rate of homeownership.
Common Questions
What is Per Capita Income in Soldotna?
Per Capita income in Soldotna is $36,352.
What is the Median Family Income in Soldotna?
Median Family Income in Soldotna is $87,022.
What is the Median Household income in Soldotna?
Median Household Income in Soldotna is $67,365.
What is Income or Wage Gap in Soldotna?
Income or Wage Gap in Soldotna is 20.0%.
Women in Soldotna earn 80.0 cents for every dollar earned by a man.
What is Inequality or Gini Index in Soldotna?
Inequality or Gini Index in Soldotna is 0.46.
What is the Total Population of Soldotna?
Total Population of Soldotna is 4,394.
What is the Total Male Population of Soldotna?
Total Male Population of Soldotna is 1,930.
What is the Total Female Population of Soldotna?
Total Female Population of Soldotna is 2,464.
What is the Ratio of Males per 100 Females in Soldotna?
There are 78.33 Males per 100 Females in Soldotna.
What is the Ratio of Females per 100 Males in Soldotna?
There are 127.67 Females per 100 Males in Soldotna.
What is the Median Population Age in Soldotna?
Median Population Age in Soldotna is 37.1 Years.
What is the Average Family Size in Soldotna
Average Family Size in Soldotna is 3.1 People.
What is the Average Household Size in Soldotna
Average Household Size in Soldotna is 2.5 People.
How Large is the Labor Force in Soldotna?
There are 2,188 People in the Labor Forcein in Soldotna.
What is the Percentage of People in the Labor Force in Soldotna?
60.3% of People are in the Labor Force in Soldotna.
What is the Unemployment Rate in Soldotna?
Unemployment Rate in Soldotna is 5.6%.