Palmer, AK Map & Demographics
Palmer Map
Palmer Overview
$32,155
PER CAPITA INCOME
$83,182
AVG FAMILY INCOME
$68,929
AVG HOUSEHOLD INCOME
32.1%
WAGE / INCOME GAP [ % ]
67.9¢/ $1
WAGE / INCOME GAP [ $ ]
0.41
INEQUALITY / GINI INDEX
6,091
TOTAL POPULATION
3,110
MALE POPULATION
2,981
FEMALE POPULATION
104.33
MALES / 100 FEMALES
95.85
FEMALES / 100 MALES
31.2
MEDIAN AGE
3.3
AVG FAMILY SIZE
2.6
AVG HOUSEHOLD SIZE
2,942
LABOR FORCE [ PEOPLE ]
60.9%
PERCENT IN LABOR FORCE
9.6%
UNEMPLOYMENT RATE
Palmer Zip Codes
Palmer Area Codes
Income in Palmer
Income Overview in Palmer
Per Capita Income in Palmer is $32,155, while median incomes of families and households are $83,182 and $68,929 respectively.
| Characteristic | Number | Measure |
| Per Capita Income | 6,091 | $32,155 |
| Median Family Income | 1,354 | $83,182 |
| Mean Family Income | 1,354 | $99,861 |
| Median Household Income | 2,232 | $68,929 |
| Mean Household Income | 2,232 | $85,013 |
| Income Deficit | 1,354 | $0 |
| Wage / Income Gap (%) | 6,091 | 32.07% |
| Wage / Income Gap ($) | 6,091 | 67.93¢ per $1 |
| Gini / Inequality Index | 6,091 | 0.41 |
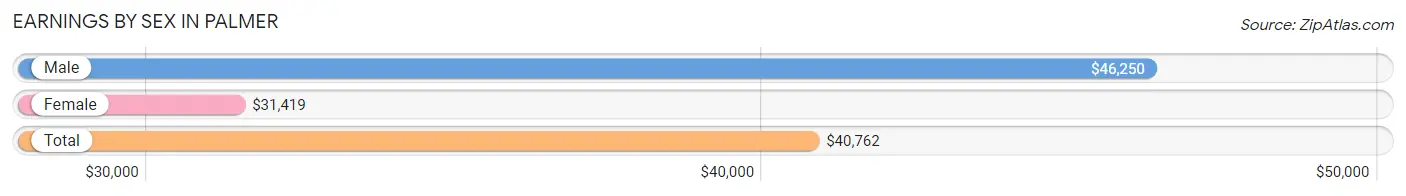
Earnings by Sex in Palmer
Average Earnings in Palmer are $40,762, $46,250 for men and $31,419 for women, a difference of 32.1%.
| Sex | Number | Average Earnings |
| Male | 1,723 (55.8%) | $46,250 |
| Female | 1,365 (44.2%) | $31,419 |
| Total | 3,088 (100.0%) | $40,762 |
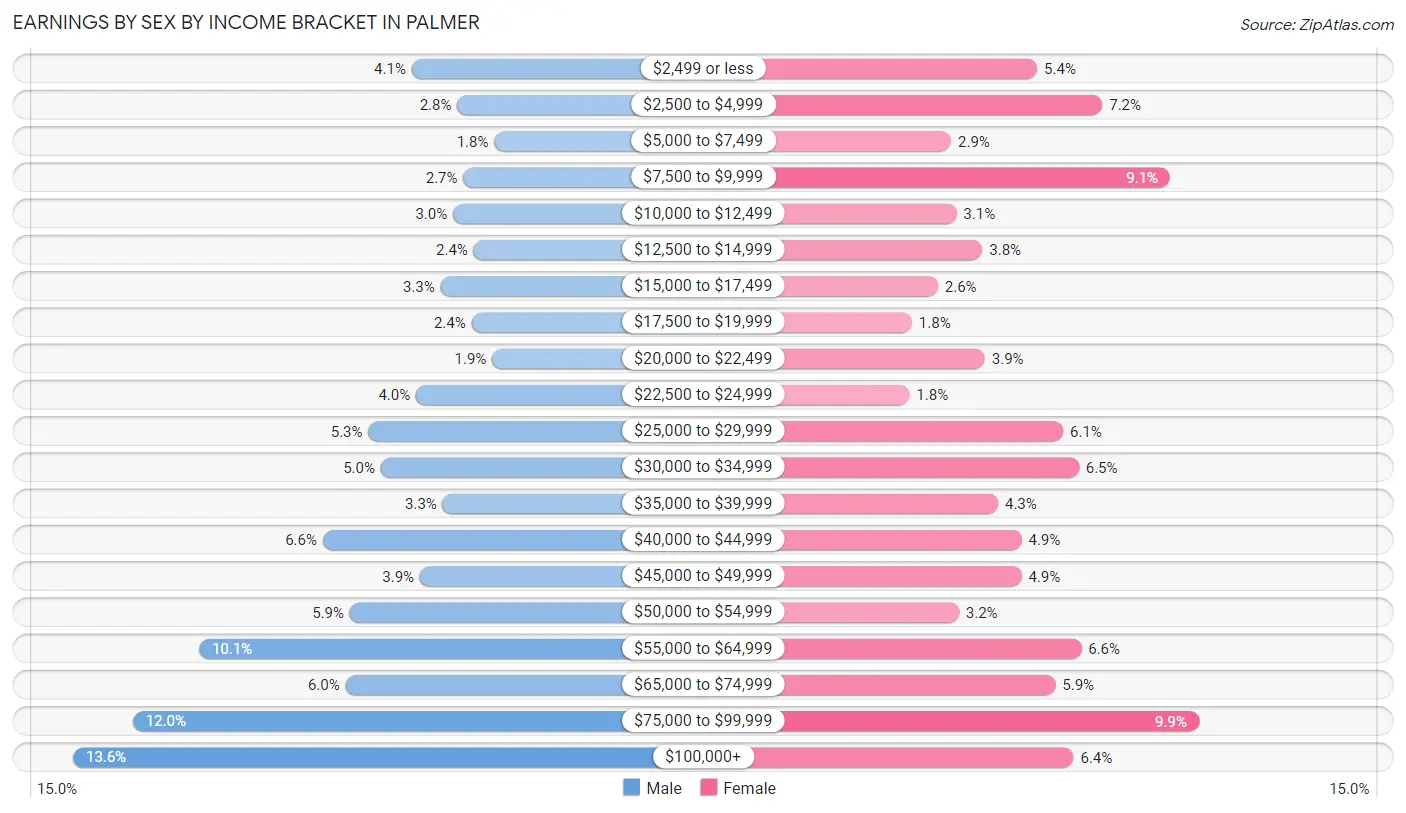
Earnings by Sex by Income Bracket in Palmer
The most common earnings brackets in Palmer are $100,000+ for men (235 | 13.6%) and $75,000 to $99,999 for women (135 | 9.9%).
| Income | Male | Female |
| $2,499 or less | 71 (4.1%) | 73 (5.3%) |
| $2,500 to $4,999 | 49 (2.8%) | 98 (7.2%) |
| $5,000 to $7,499 | 31 (1.8%) | 40 (2.9%) |
| $7,500 to $9,999 | 46 (2.7%) | 124 (9.1%) |
| $10,000 to $12,499 | 51 (3.0%) | 42 (3.1%) |
| $12,500 to $14,999 | 41 (2.4%) | 52 (3.8%) |
| $15,000 to $17,499 | 57 (3.3%) | 35 (2.6%) |
| $17,500 to $19,999 | 42 (2.4%) | 25 (1.8%) |
| $20,000 to $22,499 | 32 (1.9%) | 53 (3.9%) |
| $22,500 to $24,999 | 69 (4.0%) | 24 (1.8%) |
| $25,000 to $29,999 | 92 (5.3%) | 83 (6.1%) |
| $30,000 to $34,999 | 86 (5.0%) | 89 (6.5%) |
| $35,000 to $39,999 | 56 (3.3%) | 58 (4.3%) |
| $40,000 to $44,999 | 114 (6.6%) | 67 (4.9%) |
| $45,000 to $49,999 | 67 (3.9%) | 67 (4.9%) |
| $50,000 to $54,999 | 101 (5.9%) | 43 (3.2%) |
| $55,000 to $64,999 | 174 (10.1%) | 90 (6.6%) |
| $65,000 to $74,999 | 103 (6.0%) | 80 (5.9%) |
| $75,000 to $99,999 | 206 (12.0%) | 135 (9.9%) |
| $100,000+ | 235 (13.6%) | 87 (6.4%) |
| Total | 1,723 (100.0%) | 1,365 (100.0%) |
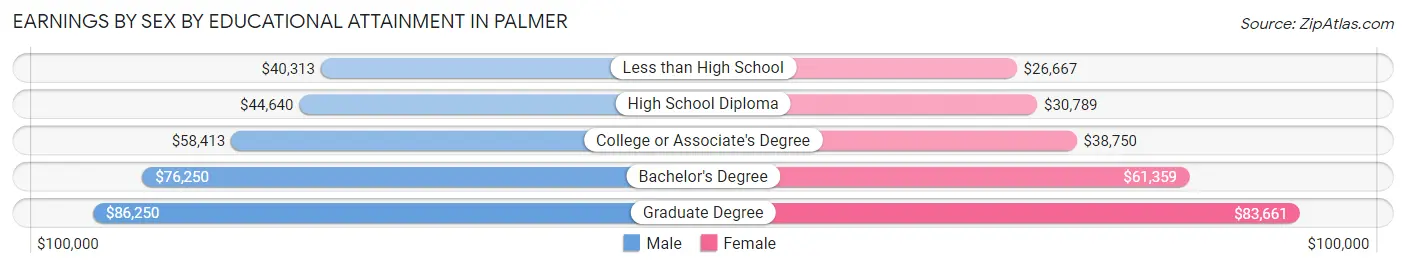
Earnings by Sex by Educational Attainment in Palmer
Average earnings in Palmer are $55,650 for men and $41,810 for women, a difference of 24.9%. Men with an educational attainment of graduate degree enjoy the highest average annual earnings of $86,250, while those with less than high school education earn the least with $40,313. Women with an educational attainment of graduate degree earn the most with the average annual earnings of $83,661, while those with less than high school education have the smallest earnings of $26,667.
| Educational Attainment | Male Income | Female Income |
| Less than High School | $40,313 | $26,667 |
| High School Diploma | $44,640 | $30,789 |
| College or Associate's Degree | $58,413 | $38,750 |
| Bachelor's Degree | $76,250 | $61,359 |
| Graduate Degree | $86,250 | $83,661 |
| Total | $55,650 | $41,810 |
Family Income in Palmer
Family Income Brackets in Palmer
According to the Palmer family income data, there are 284 families falling into the $50,000 to $74,999 income range, which is the most common income bracket and makes up 21.0% of all families. Conversely, the $10,000 to $14,999 income bracket is the least frequent group with only 15 families (1.1%) belonging to this category.
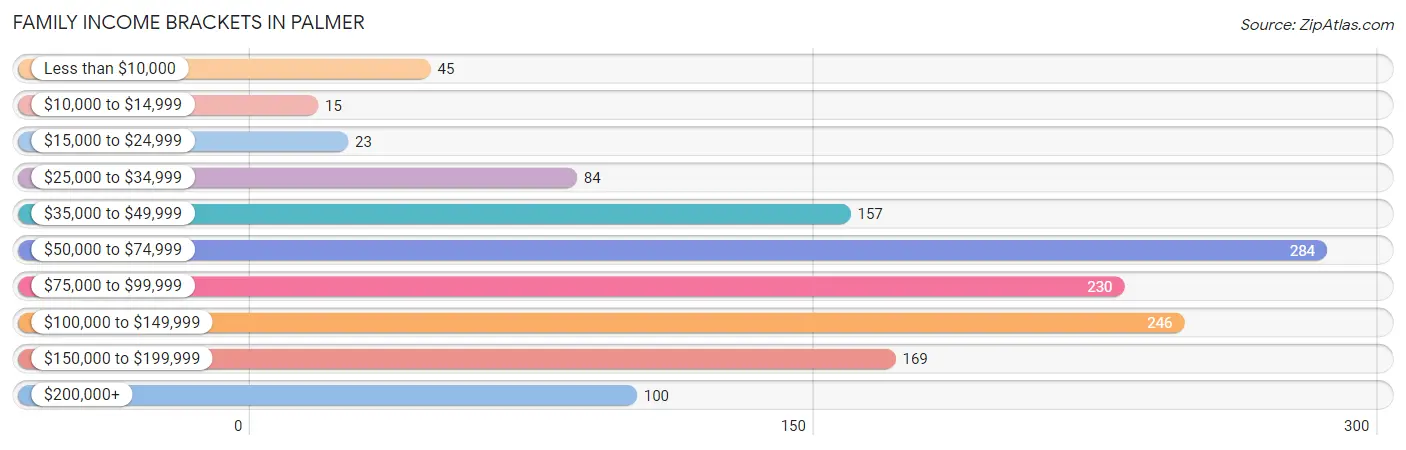
| Income Bracket | # Families | % Families |
| Less than $10,000 | 45 | 3.3% |
| $10,000 to $14,999 | 15 | 1.1% |
| $15,000 to $24,999 | 23 | 1.7% |
| $25,000 to $34,999 | 84 | 6.2% |
| $35,000 to $49,999 | 157 | 11.6% |
| $50,000 to $74,999 | 284 | 21.0% |
| $75,000 to $99,999 | 230 | 17.0% |
| $100,000 to $149,999 | 246 | 18.2% |
| $150,000 to $199,999 | 169 | 12.5% |
| $200,000+ | 100 | 7.4% |
Family Income by Famaliy Size in Palmer
7+ person families (32 | 2.4%) account for the highest median family income in Palmer with $159,375 per family, while 2-person families (562 | 41.5%) have the highest median income of $36,146 per family member.
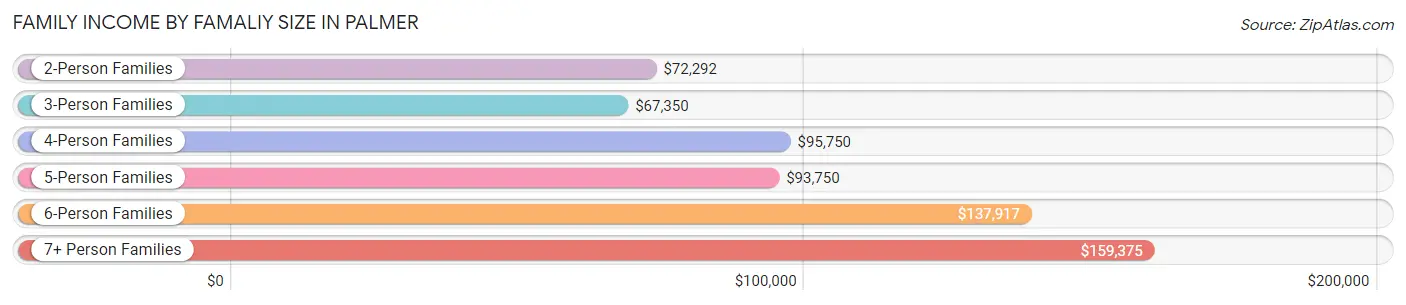
| Income Bracket | # Families | Median Income |
| 2-Person Families | 562 (41.5%) | $72,292 |
| 3-Person Families | 317 (23.4%) | $67,350 |
| 4-Person Families | 275 (20.3%) | $95,750 |
| 5-Person Families | 114 (8.4%) | $93,750 |
| 6-Person Families | 54 (4.0%) | $137,917 |
| 7+ Person Families | 32 (2.4%) | $159,375 |
| Total | 1,354 (100.0%) | $83,182 |
Family Income by Number of Earners in Palmer
The median family income in Palmer is $83,182, with families comprising 3+ earners (150) having the highest median family income of $160,556, while families with no earners (198) have the lowest median family income of $48,750, accounting for 11.1% and 14.6% of families, respectively.
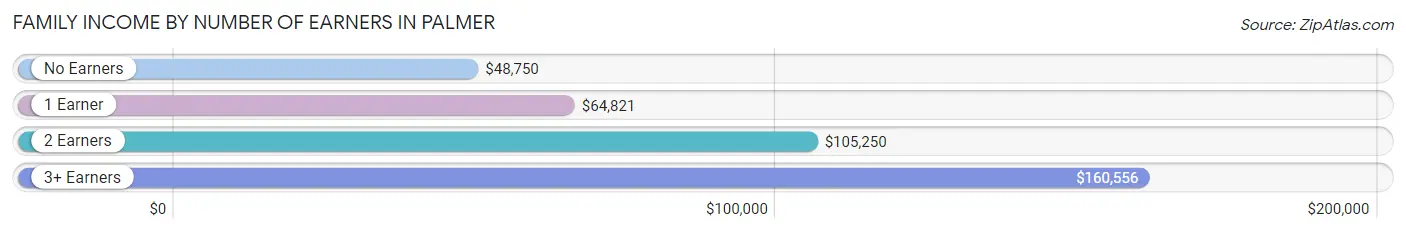
| Number of Earners | # Families | Median Income |
| No Earners | 198 (14.6%) | $48,750 |
| 1 Earner | 468 (34.6%) | $64,821 |
| 2 Earners | 538 (39.7%) | $105,250 |
| 3+ Earners | 150 (11.1%) | $160,556 |
| Total | 1,354 (100.0%) | $83,182 |
Household Income in Palmer
Household Income Brackets in Palmer
With 446 households falling in the category, the $50,000 to $74,999 income range is the most frequent in Palmer, accounting for 20.0% of all households. In contrast, only 62 households (2.8%) fall into the $10,000 to $14,999 income bracket, making it the least populous group.
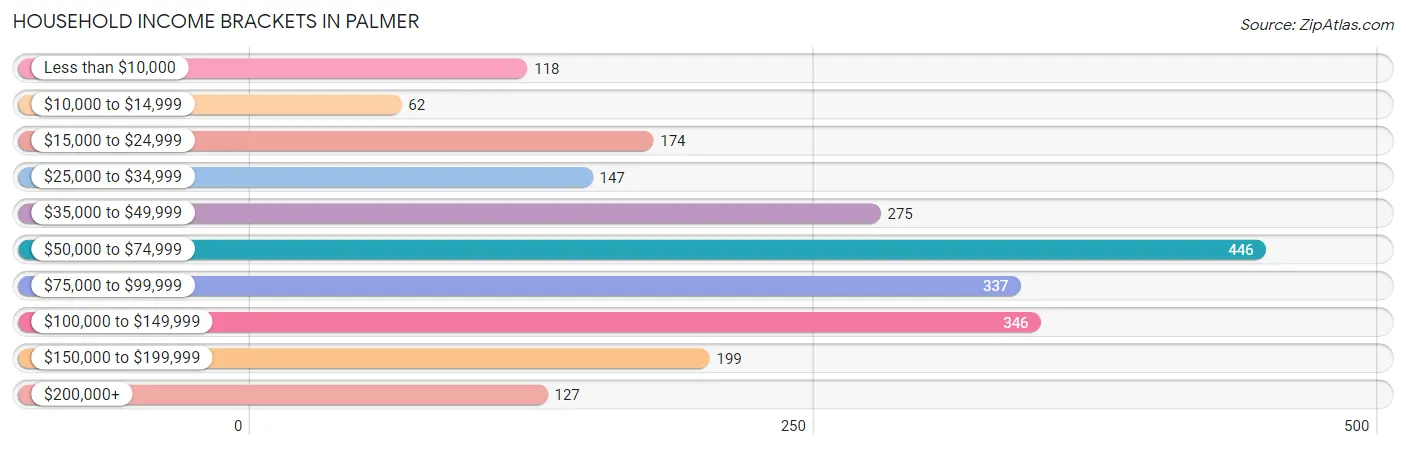
| Income Bracket | # Households | % Households |
| Less than $10,000 | 118 | 5.3% |
| $10,000 to $14,999 | 62 | 2.8% |
| $15,000 to $24,999 | 174 | 7.8% |
| $25,000 to $34,999 | 147 | 6.6% |
| $35,000 to $49,999 | 275 | 12.3% |
| $50,000 to $74,999 | 446 | 20.0% |
| $75,000 to $99,999 | 337 | 15.1% |
| $100,000 to $149,999 | 346 | 15.5% |
| $150,000 to $199,999 | 199 | 8.9% |
| $200,000+ | 127 | 5.7% |
Household Income by Householder Age in Palmer
The median household income in Palmer is $68,929, with the highest median household income of $87,083 found in the 45 to 64 years age bracket for the primary householder. A total of 686 households (30.7%) fall into this category. Meanwhile, the 65+ years age bracket for the primary householder has the lowest median household income of $46,648, with 543 households (24.3%) in this group.
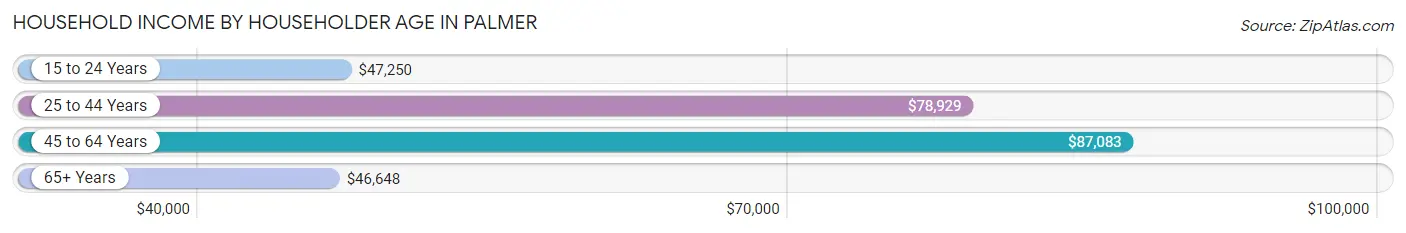
| Income Bracket | # Households | Median Income |
| 15 to 24 Years | 141 (6.3%) | $47,250 |
| 25 to 44 Years | 862 (38.6%) | $78,929 |
| 45 to 64 Years | 686 (30.7%) | $87,083 |
| 65+ Years | 543 (24.3%) | $46,648 |
| Total | 2,232 (100.0%) | $68,929 |
Poverty in Palmer
Income Below Poverty by Sex and Age in Palmer
With 8.1% poverty level for males and 11.6% for females among the residents of Palmer, 18 to 24 year old males and 15 year old females are the most vulnerable to poverty, with 69 males (20.3%) and 10 females (21.7%) in their respective age groups living below the poverty level.
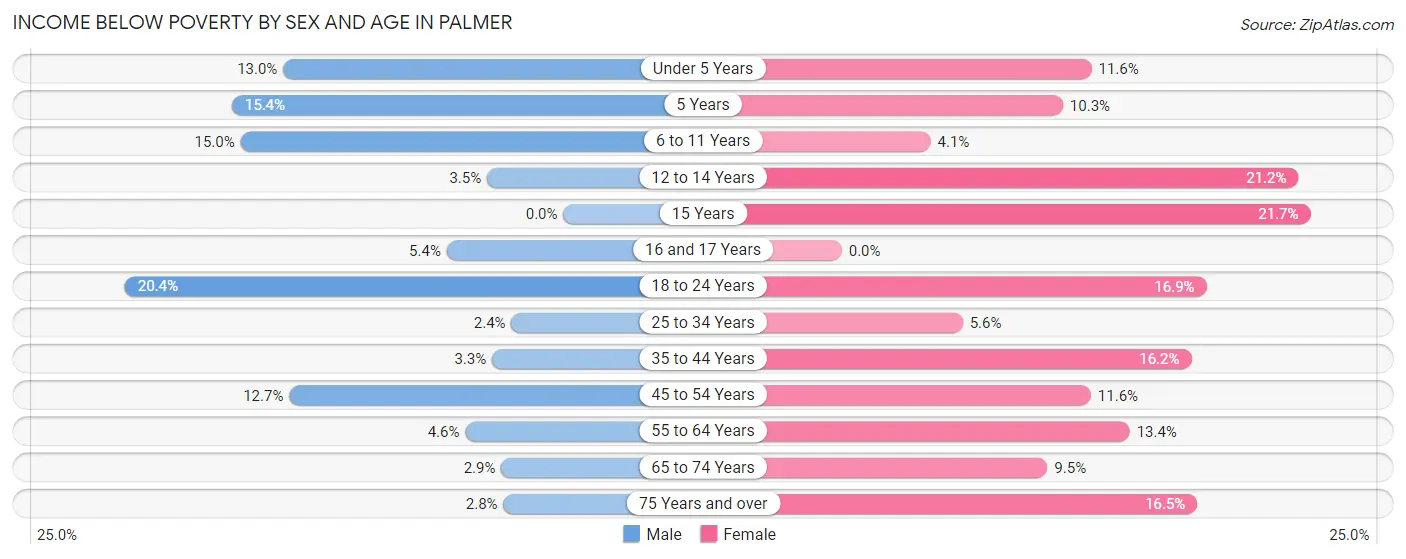
| Age Bracket | Male | Female |
| Under 5 Years | 29 (13.0%) | 24 (11.6%) |
| 5 Years | 4 (15.4%) | 4 (10.3%) |
| 6 to 11 Years | 37 (15.0%) | 8 (4.1%) |
| 12 to 14 Years | 4 (3.5%) | 18 (21.2%) |
| 15 Years | 0 (0.0%) | 10 (21.7%) |
| 16 and 17 Years | 6 (5.4%) | 0 (0.0%) |
| 18 to 24 Years | 69 (20.3%) | 56 (16.9%) |
| 25 to 34 Years | 14 (2.4%) | 27 (5.6%) |
| 35 to 44 Years | 12 (3.3%) | 48 (16.2%) |
| 45 to 54 Years | 36 (12.7%) | 40 (11.6%) |
| 55 to 64 Years | 11 (4.5%) | 39 (13.4%) |
| 65 to 74 Years | 6 (2.9%) | 27 (9.5%) |
| 75 Years and over | 3 (2.8%) | 32 (16.5%) |
| Total | 231 (8.1%) | 333 (11.6%) |
Income Above Poverty by Sex and Age in Palmer
According to the poverty statistics in Palmer, males aged 15 years and females aged 16 and 17 years are the age groups that are most secure financially, with 100.0% of males and 100.0% of females in these age groups living above the poverty line.
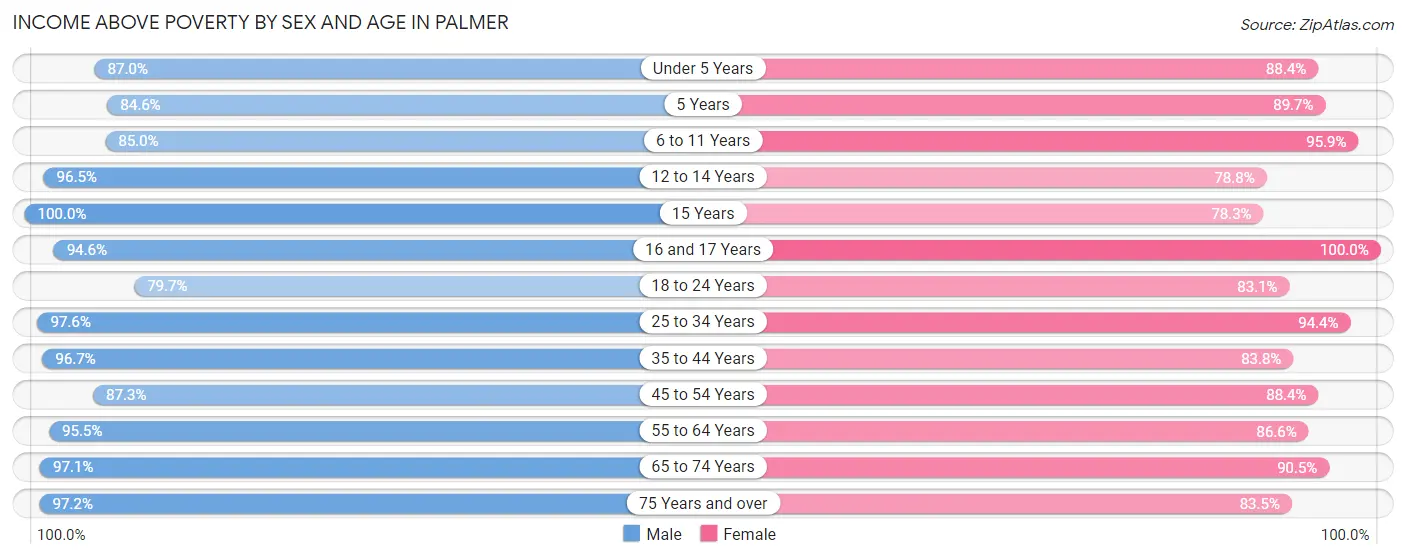
| Age Bracket | Male | Female |
| Under 5 Years | 194 (87.0%) | 183 (88.4%) |
| 5 Years | 22 (84.6%) | 35 (89.7%) |
| 6 to 11 Years | 210 (85.0%) | 186 (95.9%) |
| 12 to 14 Years | 109 (96.5%) | 67 (78.8%) |
| 15 Years | 27 (100.0%) | 36 (78.3%) |
| 16 and 17 Years | 105 (94.6%) | 72 (100.0%) |
| 18 to 24 Years | 270 (79.6%) | 275 (83.1%) |
| 25 to 34 Years | 566 (97.6%) | 454 (94.4%) |
| 35 to 44 Years | 350 (96.7%) | 248 (83.8%) |
| 45 to 54 Years | 247 (87.3%) | 306 (88.4%) |
| 55 to 64 Years | 231 (95.5%) | 253 (86.6%) |
| 65 to 74 Years | 202 (97.1%) | 256 (90.5%) |
| 75 Years and over | 105 (97.2%) | 162 (83.5%) |
| Total | 2,638 (91.9%) | 2,533 (88.4%) |
Income Below Poverty Among Married-Couple Families in Palmer
The poverty statistics for married-couple families in Palmer show that 1.3% or 13 of the total 960 families live below the poverty line. Families with 5 or more children have the highest poverty rate of 22.2%, comprising of 4 families. On the other hand, families with no children have the lowest poverty rate of 0.6%, which includes 3 families.
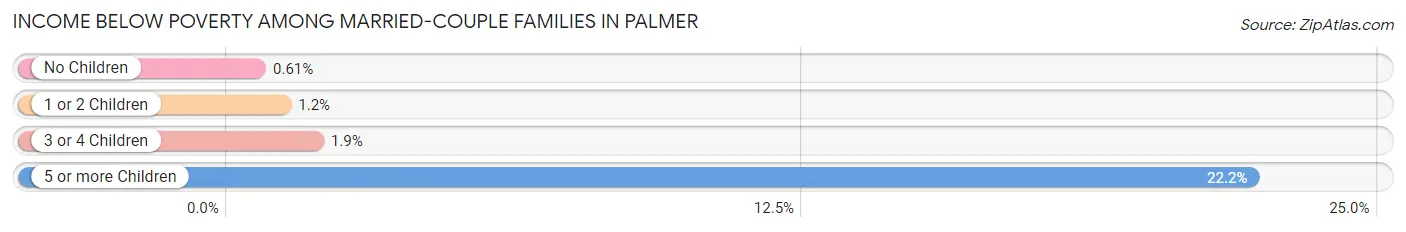
| Children | Above Poverty | Below Poverty |
| No Children | 488 (99.4%) | 3 (0.6%) |
| 1 or 2 Children | 340 (98.8%) | 4 (1.2%) |
| 3 or 4 Children | 105 (98.1%) | 2 (1.9%) |
| 5 or more Children | 14 (77.8%) | 4 (22.2%) |
| Total | 947 (98.7%) | 13 (1.3%) |
Income Below Poverty Among Single-Parent Households in Palmer
According to the poverty data in Palmer, 5.7% or 9 single-father households and 23.6% or 56 single-mother households are living below the poverty line. Among single-father households, those with no children have the highest poverty rate, with 4 households (7.4%) experiencing poverty. Likewise, among single-mother households, those with 3 or 4 children have the highest poverty rate, with 20 households (52.6%) falling below the poverty line.
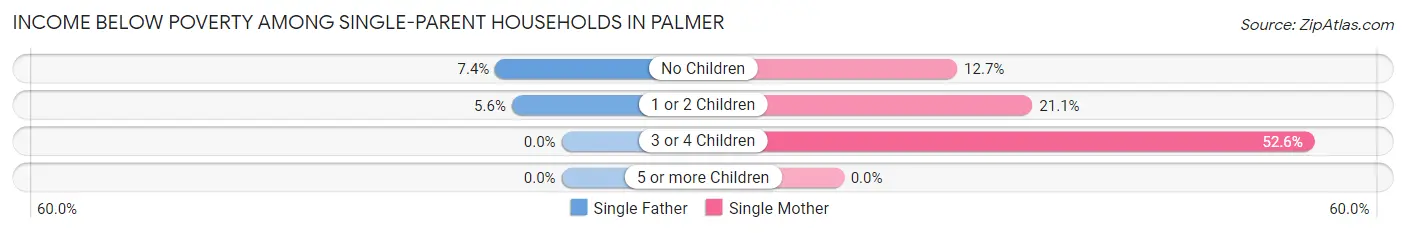
| Children | Single Father | Single Mother |
| No Children | 4 (7.4%) | 9 (12.7%) |
| 1 or 2 Children | 5 (5.6%) | 27 (21.1%) |
| 3 or 4 Children | 0 (0.0%) | 20 (52.6%) |
| 5 or more Children | 0 (0.0%) | 0 (0.0%) |
| Total | 9 (5.7%) | 56 (23.6%) |
Income Below Poverty Among Married-Couple vs Single-Parent Households in Palmer
The poverty data for Palmer shows that 13 of the married-couple family households (1.3%) and 65 of the single-parent households (16.5%) are living below the poverty level. Within the married-couple family households, those with 5 or more children have the highest poverty rate, with 4 households (22.2%) falling below the poverty line. Among the single-parent households, those with 3 or 4 children have the highest poverty rate, with 20 household (41.7%) living below poverty.
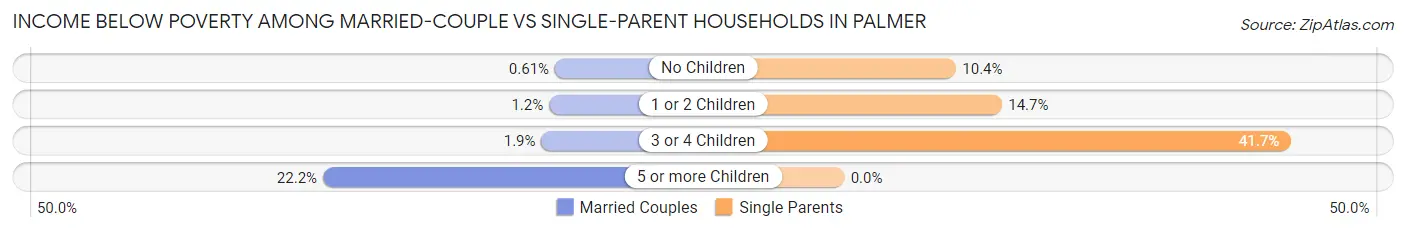
| Children | Married-Couple Families | Single-Parent Households |
| No Children | 3 (0.6%) | 13 (10.4%) |
| 1 or 2 Children | 4 (1.2%) | 32 (14.7%) |
| 3 or 4 Children | 2 (1.9%) | 20 (41.7%) |
| 5 or more Children | 4 (22.2%) | 0 (0.0%) |
| Total | 13 (1.3%) | 65 (16.5%) |
Race in Palmer
The most populous races in Palmer are White / Caucasian (4,273 | 70.2%), Two or more Races (727 | 11.9%), and Native / Alaskan (614 | 10.1%).
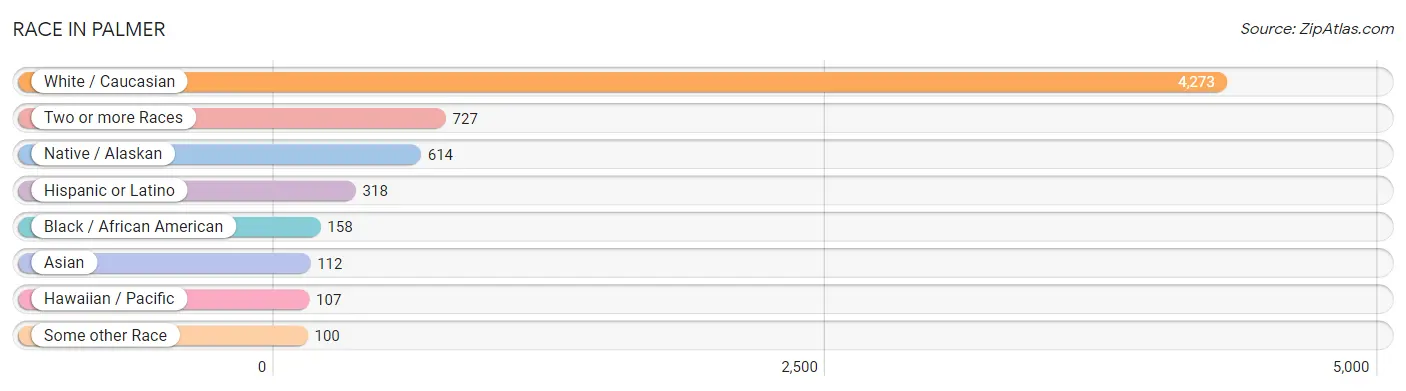
| Race | # Population | % Population |
| Asian | 112 | 1.8% |
| Black / African American | 158 | 2.6% |
| Hawaiian / Pacific | 107 | 1.8% |
| Hispanic or Latino | 318 | 5.2% |
| Native / Alaskan | 614 | 10.1% |
| White / Caucasian | 4,273 | 70.2% |
| Two or more Races | 727 | 11.9% |
| Some other Race | 100 | 1.6% |
| Total | 6,091 | 100.0% |
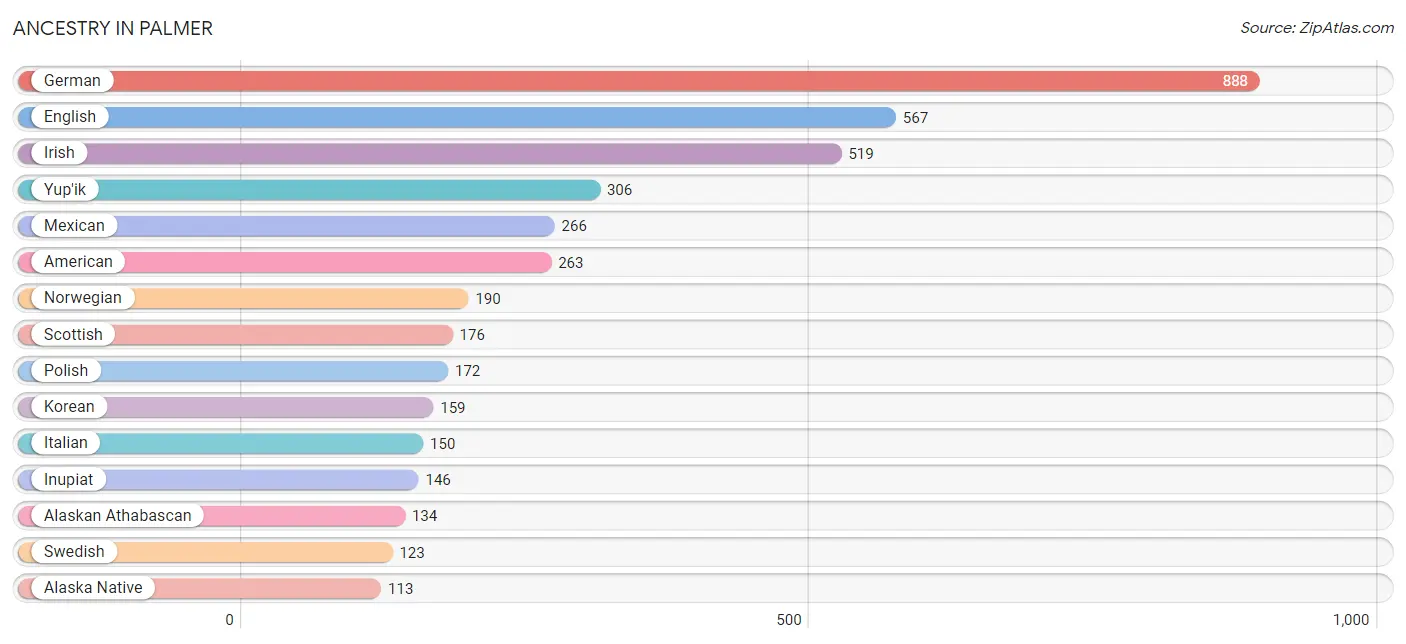
Ancestry in Palmer
The most populous ancestries reported in Palmer are German (888 | 14.6%), English (567 | 9.3%), Irish (519 | 8.5%), Yup'ik (306 | 5.0%), and Mexican (266 | 4.4%), together accounting for 41.8% of all Palmer residents.
| Ancestry | # Population | % Population |
| African | 23 | 0.4% |
| Alaska Native | 113 | 1.9% |
| Alaskan Athabascan | 134 | 2.2% |
| Aleut | 77 | 1.3% |
| American | 263 | 4.3% |
| Arab | 10 | 0.2% |
| Austrian | 5 | 0.1% |
| Belgian | 5 | 0.1% |
| Bhutanese | 22 | 0.4% |
| Blackfeet | 17 | 0.3% |
| British | 20 | 0.3% |
| Burmese | 23 | 0.4% |
| Cajun | 3 | 0.1% |
| Canadian | 4 | 0.1% |
| Central American | 7 | 0.1% |
| Central American Indian | 1 | 0.0% |
| Cherokee | 53 | 0.9% |
| Cheyenne | 4 | 0.1% |
| Chickasaw | 5 | 0.1% |
| Choctaw | 63 | 1.0% |
| Croatian | 14 | 0.2% |
| Czech | 34 | 0.6% |
| Czechoslovakian | 5 | 0.1% |
| Danish | 70 | 1.1% |
| Dutch | 70 | 1.1% |
| Eastern European | 9 | 0.2% |
| English | 567 | 9.3% |
| European | 109 | 1.8% |
| Finnish | 62 | 1.0% |
| French | 89 | 1.5% |
| French Canadian | 53 | 0.9% |
| German | 888 | 14.6% |
| Guamanian / Chamorro | 109 | 1.8% |
| Honduran | 7 | 0.1% |
| Hungarian | 15 | 0.3% |
| Icelander | 4 | 0.1% |
| Indian (Asian) | 4 | 0.1% |
| Inupiat | 146 | 2.4% |
| Irish | 519 | 8.5% |
| Iroquois | 7 | 0.1% |
| Italian | 150 | 2.5% |
| Jamaican | 9 | 0.2% |
| Korean | 159 | 2.6% |
| Lebanese | 3 | 0.1% |
| Lithuanian | 16 | 0.3% |
| Malaysian | 20 | 0.3% |
| Mexican | 266 | 4.4% |
| Mexican American Indian | 1 | 0.0% |
| Native Hawaiian | 67 | 1.1% |
| Navajo | 3 | 0.1% |
| Nigerian | 1 | 0.0% |
| Northern European | 32 | 0.5% |
| Norwegian | 190 | 3.1% |
| Pakistani | 3 | 0.1% |
| Polish | 172 | 2.8% |
| Portuguese | 6 | 0.1% |
| Puerto Rican | 32 | 0.5% |
| Puget Sound Salish | 12 | 0.2% |
| Romanian | 3 | 0.1% |
| Russian | 5 | 0.1% |
| Samoan | 4 | 0.1% |
| Scandinavian | 65 | 1.1% |
| Scotch-Irish | 69 | 1.1% |
| Scottish | 176 | 2.9% |
| Sioux | 45 | 0.7% |
| Slovak | 1 | 0.0% |
| Slovene | 3 | 0.1% |
| Spaniard | 7 | 0.1% |
| Spanish | 6 | 0.1% |
| Sri Lankan | 3 | 0.1% |
| Subsaharan African | 24 | 0.4% |
| Swedish | 123 | 2.0% |
| Swiss | 13 | 0.2% |
| Syrian | 7 | 0.1% |
| Thai | 2 | 0.0% |
| Tlingit-Haida | 27 | 0.4% |
| Trinidadian and Tobagonian | 28 | 0.5% |
| Ukrainian | 7 | 0.1% |
| Welsh | 51 | 0.8% |
| Yugoslavian | 6 | 0.1% |
| Yup'ik | 306 | 5.0% | View All 81 Rows |
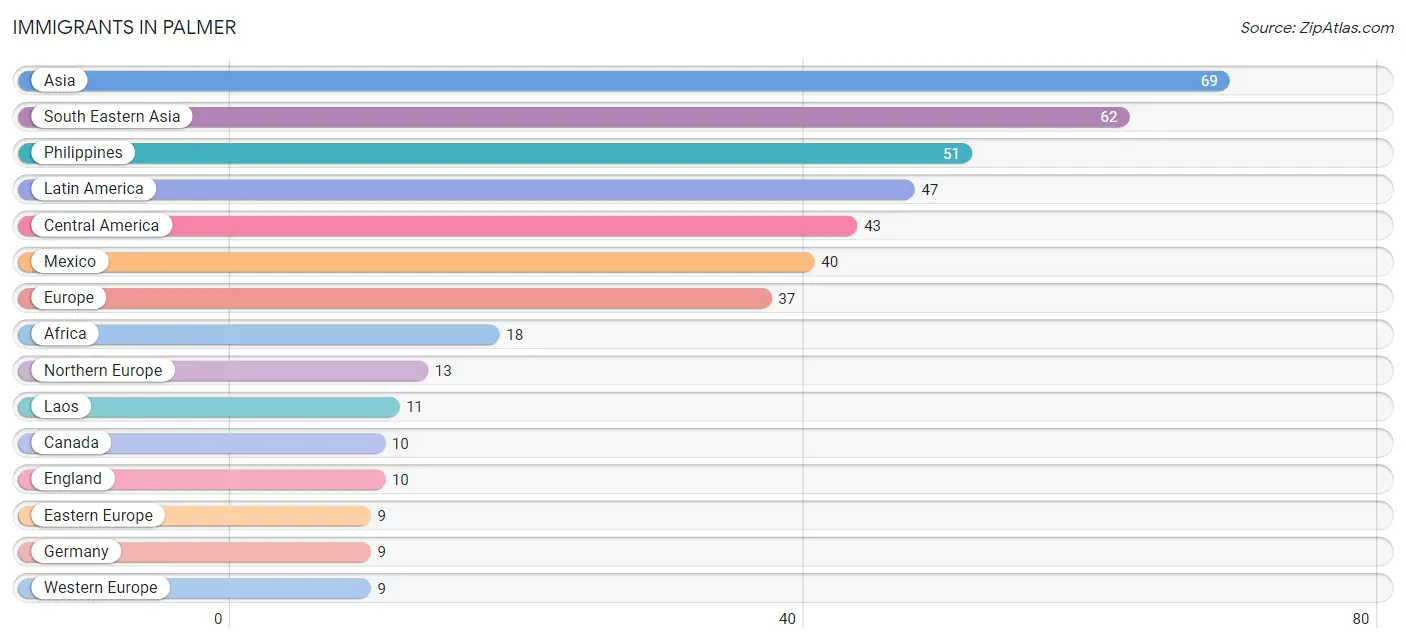
Immigrants in Palmer
The most numerous immigrant groups reported in Palmer came from Asia (69 | 1.1%), South Eastern Asia (62 | 1.0%), Philippines (51 | 0.8%), Latin America (47 | 0.8%), and Central America (43 | 0.7%), together accounting for 4.5% of all Palmer residents.
| Immigration Origin | # Population | % Population |
| Africa | 18 | 0.3% |
| Asia | 69 | 1.1% |
| Australia | 3 | 0.1% |
| Brazil | 4 | 0.1% |
| Canada | 10 | 0.2% |
| Central America | 43 | 0.7% |
| China | 4 | 0.1% |
| Denmark | 3 | 0.1% |
| Eastern Africa | 4 | 0.1% |
| Eastern Asia | 7 | 0.1% |
| Eastern Europe | 9 | 0.2% |
| England | 10 | 0.2% |
| Europe | 37 | 0.6% |
| Germany | 9 | 0.2% |
| Ghana | 7 | 0.1% |
| Honduras | 3 | 0.1% |
| Italy | 6 | 0.1% |
| Korea | 3 | 0.1% |
| Laos | 11 | 0.2% |
| Latin America | 47 | 0.8% |
| Mexico | 40 | 0.7% |
| Moldova | 5 | 0.1% |
| Northern Europe | 13 | 0.2% |
| Oceania | 7 | 0.1% |
| Philippines | 51 | 0.8% |
| Poland | 4 | 0.1% |
| South America | 4 | 0.1% |
| South Eastern Asia | 62 | 1.0% |
| Southern Europe | 6 | 0.1% |
| Taiwan | 4 | 0.1% |
| Western Africa | 7 | 0.1% |
| Western Europe | 9 | 0.2% | View All 32 Rows |
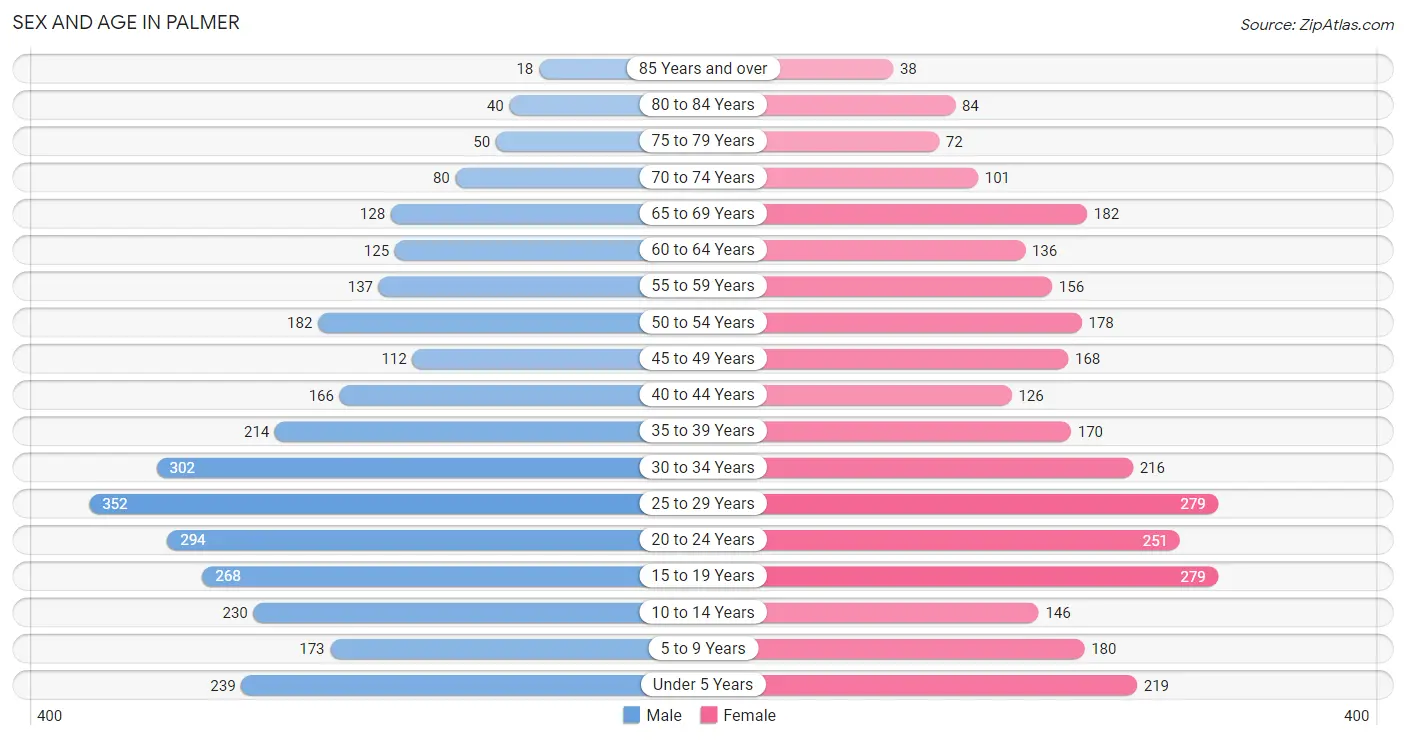
Sex and Age in Palmer
Sex and Age in Palmer
The most populous age groups in Palmer are 25 to 29 Years (352 | 11.3%) for men and 15 to 19 Years (279 | 9.4%) for women.
| Age Bracket | Male | Female |
| Under 5 Years | 239 (7.7%) | 219 (7.3%) |
| 5 to 9 Years | 173 (5.6%) | 180 (6.0%) |
| 10 to 14 Years | 230 (7.4%) | 146 (4.9%) |
| 15 to 19 Years | 268 (8.6%) | 279 (9.4%) |
| 20 to 24 Years | 294 (9.5%) | 251 (8.4%) |
| 25 to 29 Years | 352 (11.3%) | 279 (9.4%) |
| 30 to 34 Years | 302 (9.7%) | 216 (7.2%) |
| 35 to 39 Years | 214 (6.9%) | 170 (5.7%) |
| 40 to 44 Years | 166 (5.3%) | 126 (4.2%) |
| 45 to 49 Years | 112 (3.6%) | 168 (5.6%) |
| 50 to 54 Years | 182 (5.9%) | 178 (6.0%) |
| 55 to 59 Years | 137 (4.4%) | 156 (5.2%) |
| 60 to 64 Years | 125 (4.0%) | 136 (4.6%) |
| 65 to 69 Years | 128 (4.1%) | 182 (6.1%) |
| 70 to 74 Years | 80 (2.6%) | 101 (3.4%) |
| 75 to 79 Years | 50 (1.6%) | 72 (2.4%) |
| 80 to 84 Years | 40 (1.3%) | 84 (2.8%) |
| 85 Years and over | 18 (0.6%) | 38 (1.3%) |
| Total | 3,110 (100.0%) | 2,981 (100.0%) |
Families and Households in Palmer
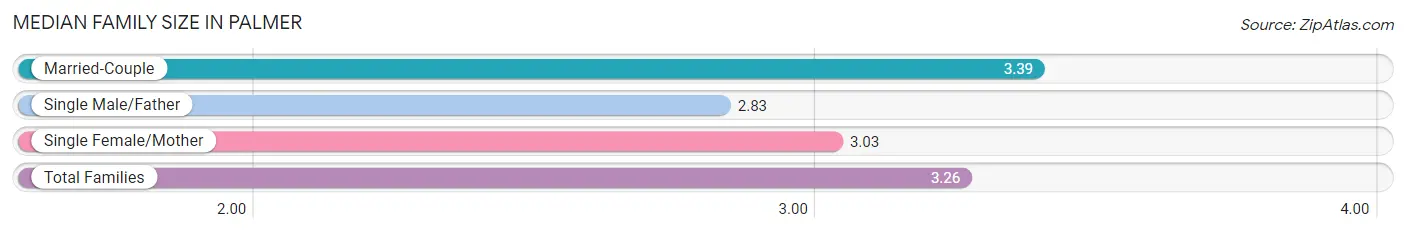
Median Family Size in Palmer
The median family size in Palmer is 3.26 persons per family, with married-couple families (960 | 70.9%) accounting for the largest median family size of 3.39 persons per family. On the other hand, single male/father families (157 | 11.6%) represent the smallest median family size with 2.83 persons per family.
| Family Type | # Families | Family Size |
| Married-Couple | 960 (70.9%) | 3.39 |
| Single Male/Father | 157 (11.6%) | 2.83 |
| Single Female/Mother | 237 (17.5%) | 3.03 |
| Total Families | 1,354 (100.0%) | 3.26 |
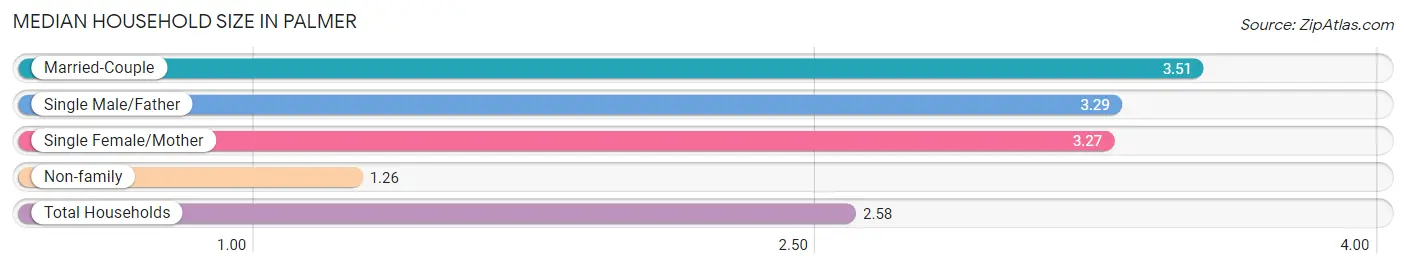
Median Household Size in Palmer
The median household size in Palmer is 2.58 persons per household, with married-couple households (960 | 43.0%) accounting for the largest median household size of 3.51 persons per household. non-family households (878 | 39.3%) represent the smallest median household size with 1.26 persons per household.
| Household Type | # Households | Household Size |
| Married-Couple | 960 (43.0%) | 3.51 |
| Single Male/Father | 157 (7.0%) | 3.29 |
| Single Female/Mother | 237 (10.6%) | 3.27 |
| Non-family | 878 (39.3%) | 1.26 |
| Total Households | 2,232 (100.0%) | 2.58 |
Household Size by Marriage Status in Palmer
Out of a total of 2,232 households in Palmer, 1,354 (60.7%) are family households, while 878 (39.3%) are nonfamily households. The most numerous type of family households are 2-person households, comprising 515, and the most common type of nonfamily households are 1-person households, comprising 684.
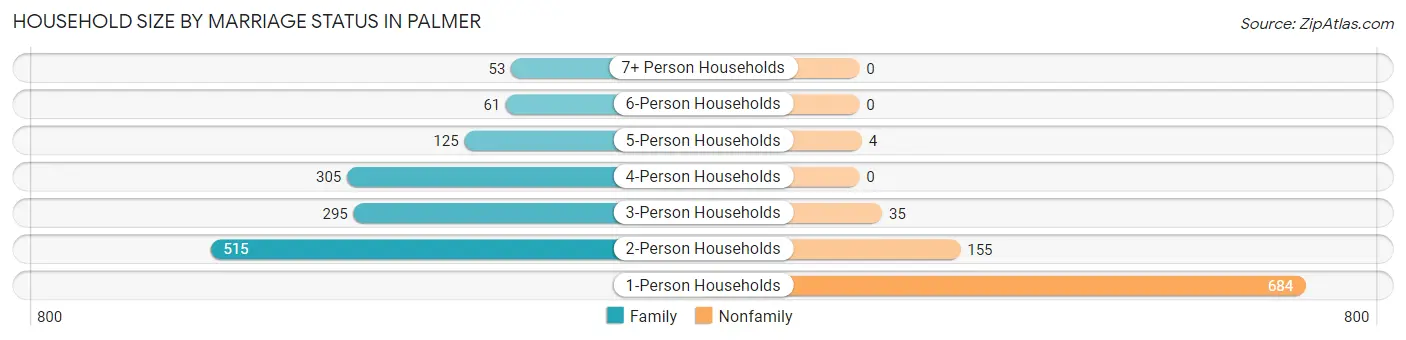
| Household Size | Family Households | Nonfamily Households |
| 1-Person Households | - | 684 (30.6%) |
| 2-Person Households | 515 (23.1%) | 155 (6.9%) |
| 3-Person Households | 295 (13.2%) | 35 (1.6%) |
| 4-Person Households | 305 (13.7%) | 0 (0.0%) |
| 5-Person Households | 125 (5.6%) | 4 (0.2%) |
| 6-Person Households | 61 (2.7%) | 0 (0.0%) |
| 7+ Person Households | 53 (2.4%) | 0 (0.0%) |
| Total | 1,354 (60.7%) | 878 (39.3%) |
Female Fertility in Palmer
Fertility by Age in Palmer
Average fertility rate in Palmer is 76.0 births per 1,000 women. Women in the age bracket of 20 to 34 years have the highest fertility rate with 122.0 births per 1,000 women. Women in the age bracket of 20 to 34 years acount for 78.4% of all women with births.
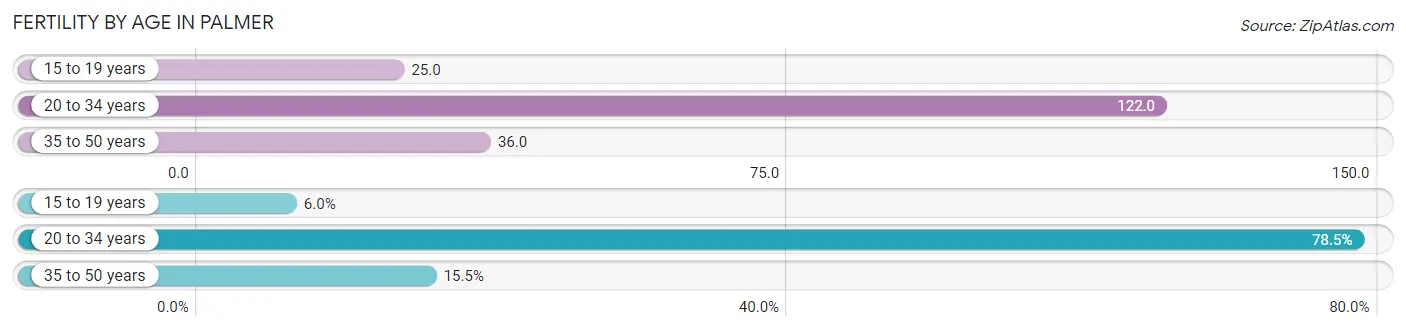
| Age Bracket | Women with Births | Births / 1,000 Women |
| 15 to 19 years | 7 (6.0%) | 25.0 |
| 20 to 34 years | 91 (78.4%) | 122.0 |
| 35 to 50 years | 18 (15.5%) | 36.0 |
| Total | 116 (100.0%) | 76.0 |
Fertility by Age by Marriage Status in Palmer
75.0% of women with births (116) in Palmer are married. The highest percentage of unmarried women with births falls into 15 to 19 years age bracket with 100.0% of them unmarried at the time of birth, while the lowest percentage of unmarried women with births belong to 20 to 34 years age bracket with 17.6% of them unmarried.
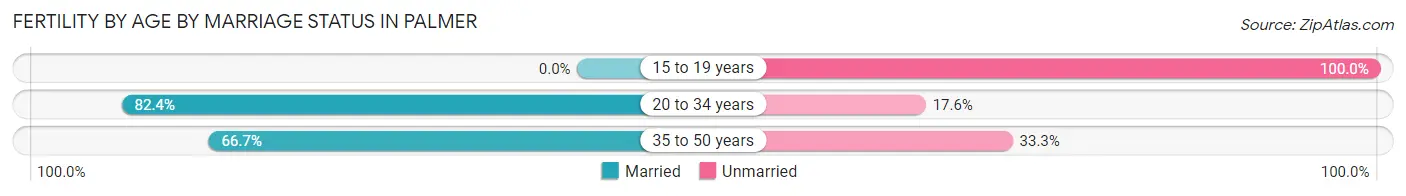
| Age Bracket | Married | Unmarried |
| 15 to 19 years | 0 (0.0%) | 7 (100.0%) |
| 20 to 34 years | 75 (82.4%) | 16 (17.6%) |
| 35 to 50 years | 12 (66.7%) | 6 (33.3%) |
| Total | 87 (75.0%) | 29 (25.0%) |
Fertility by Education in Palmer
Average fertility rate in Palmer is 76.0 births per 1,000 women. Women with the education attainment of graduate degree have the highest fertility rate of 128.0 births per 1,000 women, while women with the education attainment of bachelor's degree have the lowest fertility at 27.0 births per 1,000 women. Women with the education attainment of high school diploma represent 42.2% of all women with births.
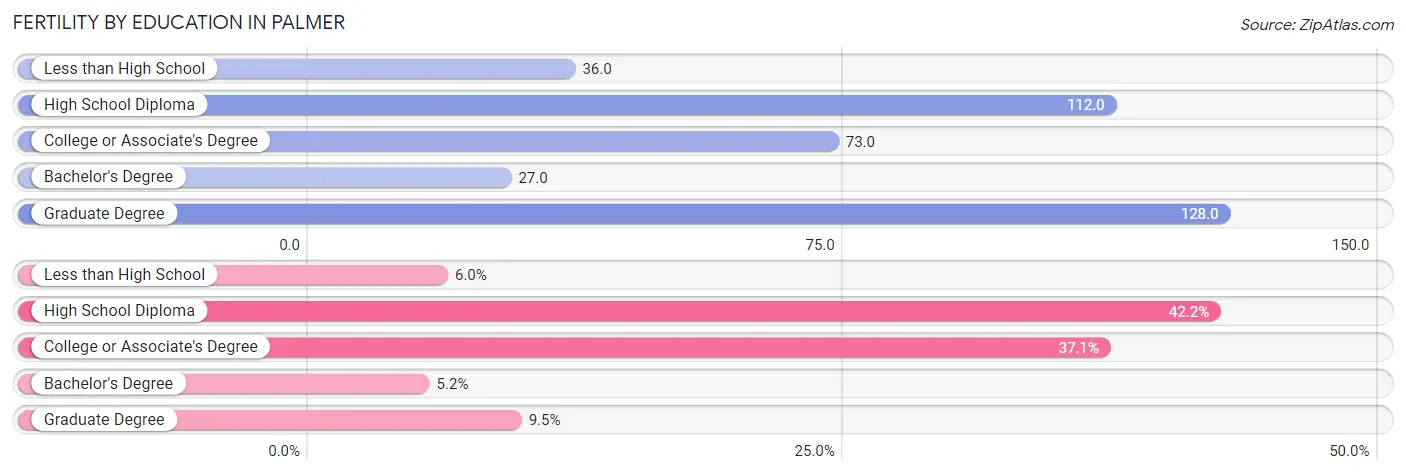
| Educational Attainment | Women with Births | Births / 1,000 Women |
| Less than High School | 7 (6.0%) | 36.0 |
| High School Diploma | 49 (42.2%) | 112.0 |
| College or Associate's Degree | 43 (37.1%) | 73.0 |
| Bachelor's Degree | 6 (5.2%) | 27.0 |
| Graduate Degree | 11 (9.5%) | 128.0 |
| Total | 116 (100.0%) | 76.0 |
Fertility by Education by Marriage Status in Palmer
25.0% of women with births in Palmer are unmarried. Women with the educational attainment of college or associate's degree are most likely to be married with 100.0% of them married at childbirth, while women with the educational attainment of high school diploma are least likely to be married with 55.1% of them unmarried at childbirth.
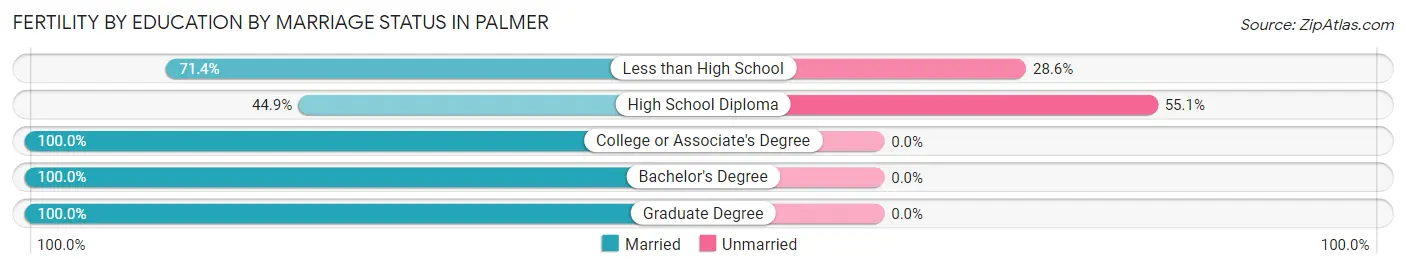
| Educational Attainment | Married | Unmarried |
| Less than High School | 5 (71.4%) | 2 (28.6%) |
| High School Diploma | 22 (44.9%) | 27 (55.1%) |
| College or Associate's Degree | 43 (100.0%) | 0 (0.0%) |
| Bachelor's Degree | 6 (100.0%) | 0 (0.0%) |
| Graduate Degree | 11 (100.0%) | 0 (0.0%) |
| Total | 87 (75.0%) | 29 (25.0%) |
Employment Characteristics in Palmer
Employment by Class of Employer in Palmer
Among the 2,634 employed individuals in Palmer, private company employees (1,542 | 58.5%), local government employees (258 | 9.8%), and not-for-profit organizations (229 | 8.7%) make up the most common classes of employment.
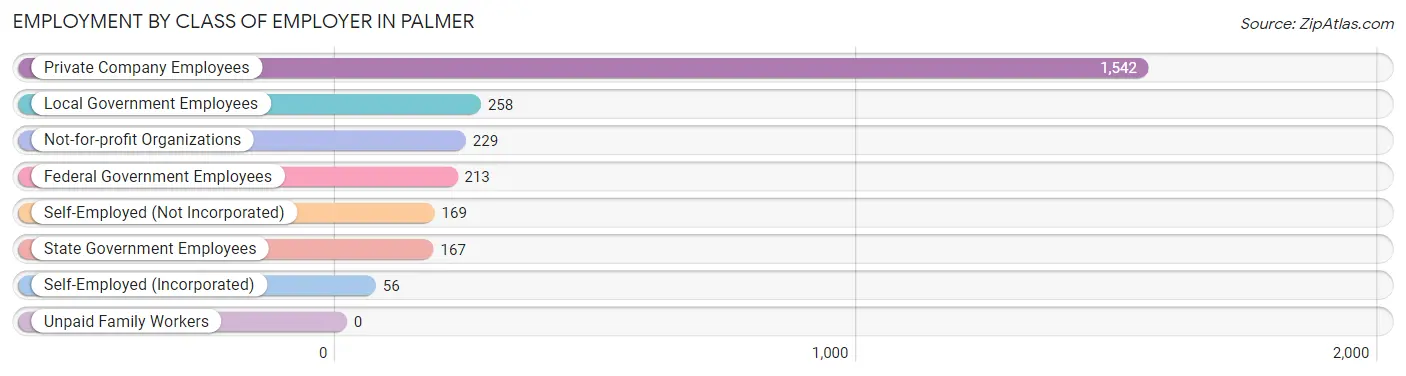
| Employer Class | # Employees | % Employees |
| Private Company Employees | 1,542 | 58.5% |
| Self-Employed (Incorporated) | 56 | 2.1% |
| Self-Employed (Not Incorporated) | 169 | 6.4% |
| Not-for-profit Organizations | 229 | 8.7% |
| Local Government Employees | 258 | 9.8% |
| State Government Employees | 167 | 6.3% |
| Federal Government Employees | 213 | 8.1% |
| Unpaid Family Workers | 0 | 0.0% |
| Total | 2,634 | 100.0% |
Employment Status by Age in Palmer
According to the labor force statistics for Palmer, out of the total population over 16 years of age (4,831), 60.9% or 2,942 individuals are in the labor force, with 9.6% or 282 of them unemployed. The age group with the highest labor force participation rate is 30 to 34 years, with 83.8% or 434 individuals in the labor force. Within the labor force, the 16 to 19 years age range has the highest percentage of unemployed individuals, with 35.5% or 83 of them being unemployed.
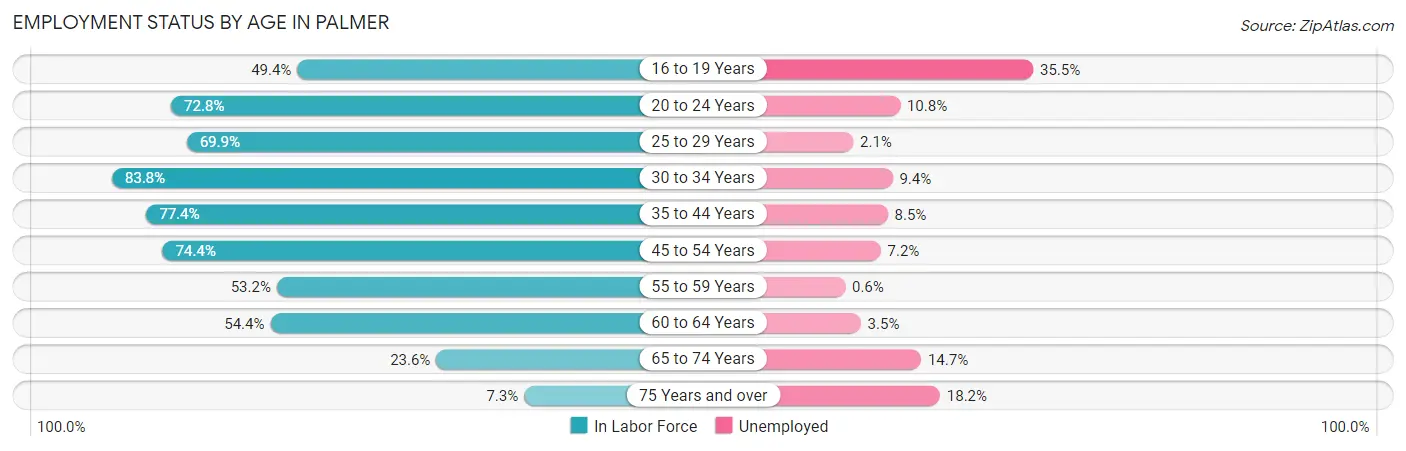
| Age Bracket | In Labor Force | Unemployed |
| 16 to 19 Years | 234 (49.4%) | 83 (35.5%) |
| 20 to 24 Years | 397 (72.8%) | 43 (10.8%) |
| 25 to 29 Years | 441 (69.9%) | 9 (2.1%) |
| 30 to 34 Years | 434 (83.8%) | 41 (9.4%) |
| 35 to 44 Years | 523 (77.4%) | 44 (8.5%) |
| 45 to 54 Years | 476 (74.4%) | 34 (7.2%) |
| 55 to 59 Years | 156 (53.2%) | 1 (0.6%) |
| 60 to 64 Years | 142 (54.4%) | 5 (3.5%) |
| 65 to 74 Years | 116 (23.6%) | 17 (14.7%) |
| 75 Years and over | 22 (7.3%) | 4 (18.2%) |
| Total | 2,942 (60.9%) | 282 (9.6%) |
Employment Status by Educational Attainment in Palmer
According to labor force statistics for Palmer, 71.9% of individuals (2,171) out of the total population between 25 and 64 years of age (3,019) are in the labor force, with 6.2% or 135 of them being unemployed. The group with the highest labor force participation rate are those with the educational attainment of bachelor's degree or higher, with 85.2% or 595 individuals in the labor force. Within the labor force, individuals with less than high school education have the highest percentage of unemployment, with 9.5% or 9 of them being unemployed.
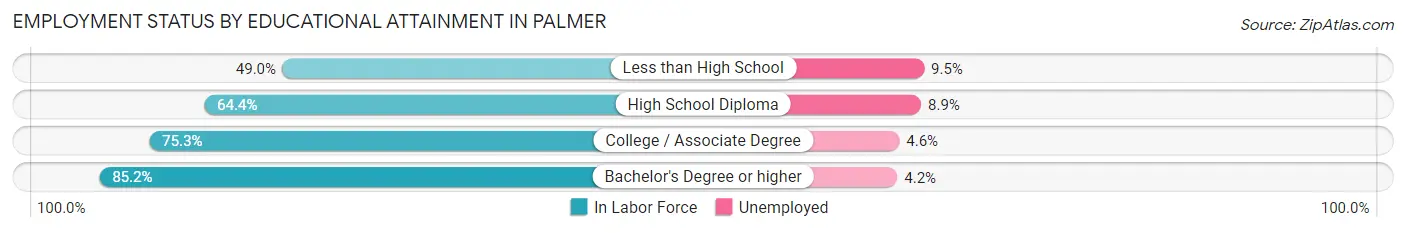
| Educational Attainment | In Labor Force | Unemployed |
| Less than High School | 95 (49.0%) | 18 (9.5%) |
| High School Diploma | 708 (64.4%) | 98 (8.9%) |
| College / Associate Degree | 774 (75.3%) | 47 (4.6%) |
| Bachelor's Degree or higher | 595 (85.2%) | 29 (4.2%) |
| Total | 2,171 (71.9%) | 187 (6.2%) |
Employment Occupations by Sex in Palmer
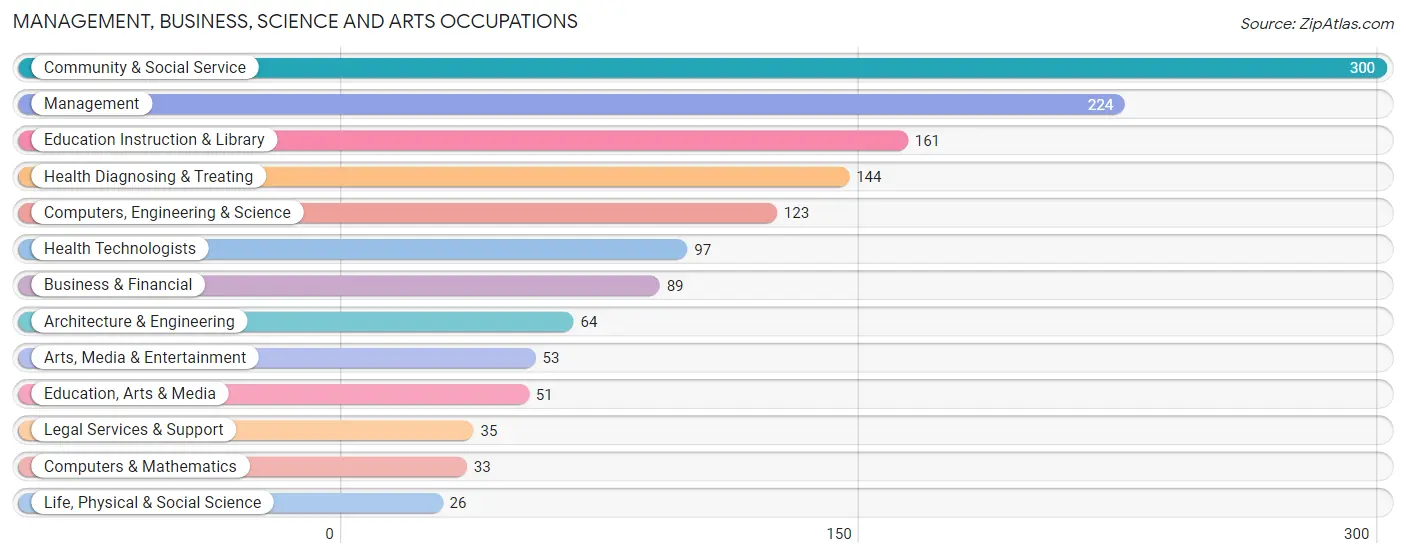
Management, Business, Science and Arts Occupations
The most common Management, Business, Science and Arts occupations in Palmer are Community & Social Service (300 | 11.7%), Management (224 | 8.7%), Education Instruction & Library (161 | 6.3%), Health Diagnosing & Treating (144 | 5.6%), and Computers, Engineering & Science (123 | 4.8%).
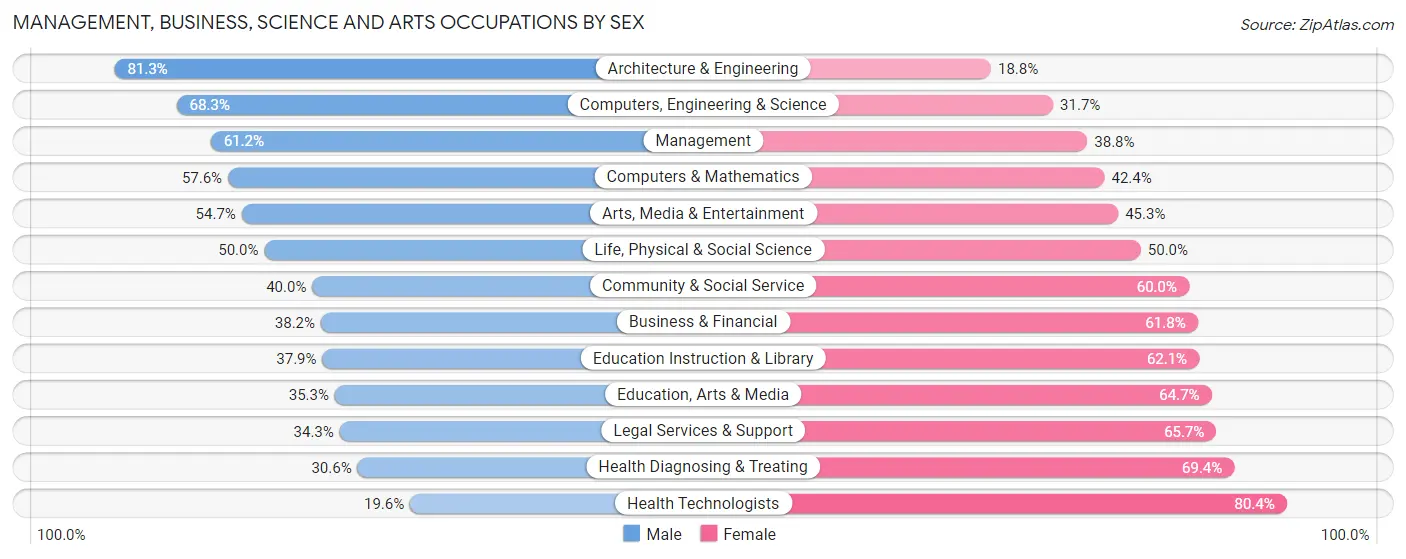
Management, Business, Science and Arts Occupations by Sex
Within the Management, Business, Science and Arts occupations in Palmer, the most male-oriented occupations are Architecture & Engineering (81.2%), Computers, Engineering & Science (68.3%), and Management (61.2%), while the most female-oriented occupations are Health Technologists (80.4%), Health Diagnosing & Treating (69.4%), and Legal Services & Support (65.7%).
| Occupation | Male | Female |
| Management | 137 (61.2%) | 87 (38.8%) |
| Business & Financial | 34 (38.2%) | 55 (61.8%) |
| Computers, Engineering & Science | 84 (68.3%) | 39 (31.7%) |
| Computers & Mathematics | 19 (57.6%) | 14 (42.4%) |
| Architecture & Engineering | 52 (81.2%) | 12 (18.8%) |
| Life, Physical & Social Science | 13 (50.0%) | 13 (50.0%) |
| Community & Social Service | 120 (40.0%) | 180 (60.0%) |
| Education, Arts & Media | 18 (35.3%) | 33 (64.7%) |
| Legal Services & Support | 12 (34.3%) | 23 (65.7%) |
| Education Instruction & Library | 61 (37.9%) | 100 (62.1%) |
| Arts, Media & Entertainment | 29 (54.7%) | 24 (45.3%) |
| Health Diagnosing & Treating | 44 (30.6%) | 100 (69.4%) |
| Health Technologists | 19 (19.6%) | 78 (80.4%) |
| Total (Category) | 419 (47.6%) | 461 (52.4%) |
| Total (Overall) | 1,422 (55.3%) | 1,150 (44.7%) |
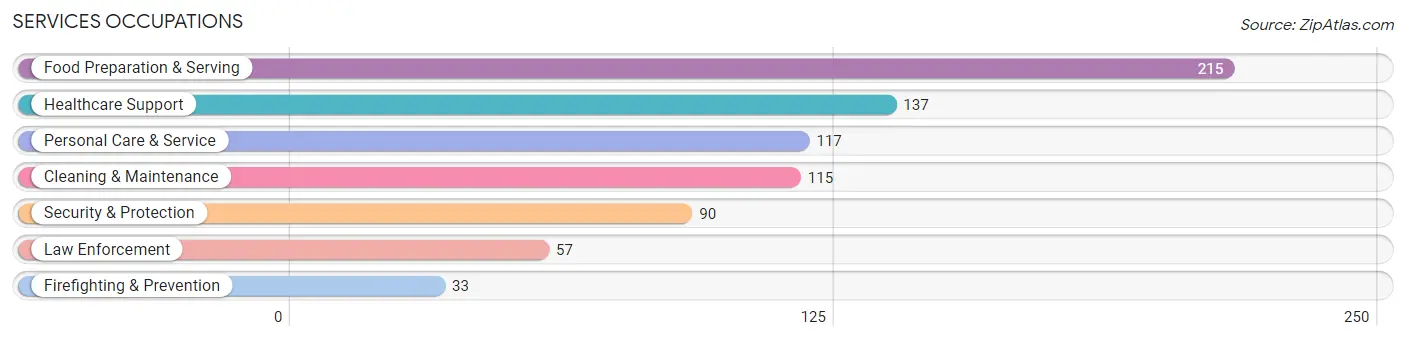
Services Occupations
The most common Services occupations in Palmer are Food Preparation & Serving (215 | 8.4%), Healthcare Support (137 | 5.3%), Personal Care & Service (117 | 4.5%), Cleaning & Maintenance (115 | 4.5%), and Security & Protection (90 | 3.5%).
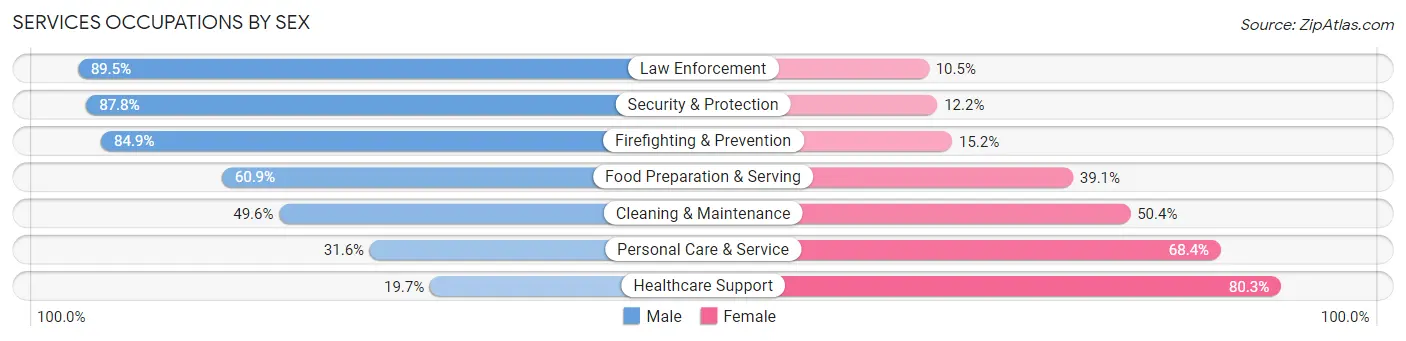
Services Occupations by Sex
Within the Services occupations in Palmer, the most male-oriented occupations are Law Enforcement (89.5%), Security & Protection (87.8%), and Firefighting & Prevention (84.9%), while the most female-oriented occupations are Healthcare Support (80.3%), Personal Care & Service (68.4%), and Cleaning & Maintenance (50.4%).
| Occupation | Male | Female |
| Healthcare Support | 27 (19.7%) | 110 (80.3%) |
| Security & Protection | 79 (87.8%) | 11 (12.2%) |
| Firefighting & Prevention | 28 (84.9%) | 5 (15.1%) |
| Law Enforcement | 51 (89.5%) | 6 (10.5%) |
| Food Preparation & Serving | 131 (60.9%) | 84 (39.1%) |
| Cleaning & Maintenance | 57 (49.6%) | 58 (50.4%) |
| Personal Care & Service | 37 (31.6%) | 80 (68.4%) |
| Total (Category) | 331 (49.1%) | 343 (50.9%) |
| Total (Overall) | 1,422 (55.3%) | 1,150 (44.7%) |
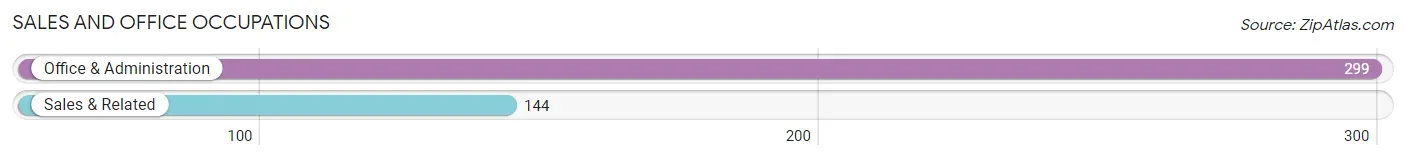
Sales and Office Occupations
The most common Sales and Office occupations in Palmer are Office & Administration (299 | 11.6%), and Sales & Related (144 | 5.6%).
Sales and Office Occupations by Sex
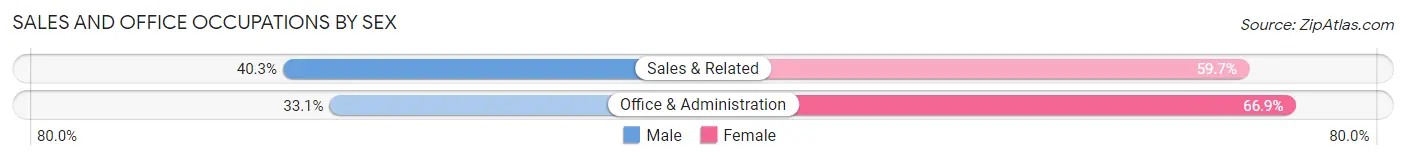
| Occupation | Male | Female |
| Sales & Related | 58 (40.3%) | 86 (59.7%) |
| Office & Administration | 99 (33.1%) | 200 (66.9%) |
| Total (Category) | 157 (35.4%) | 286 (64.6%) |
| Total (Overall) | 1,422 (55.3%) | 1,150 (44.7%) |
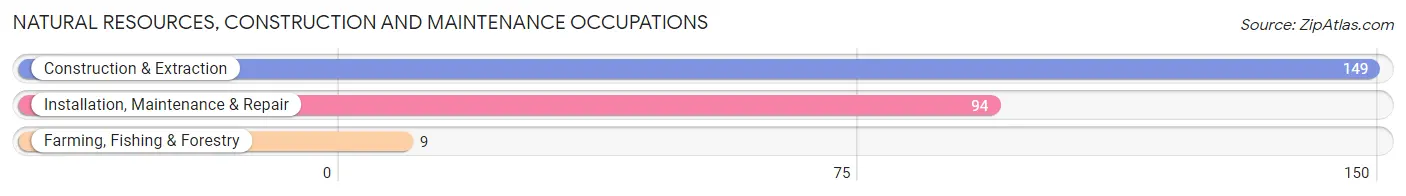
Natural Resources, Construction and Maintenance Occupations
The most common Natural Resources, Construction and Maintenance occupations in Palmer are Construction & Extraction (149 | 5.8%), Installation, Maintenance & Repair (94 | 3.6%), and Farming, Fishing & Forestry (9 | 0.4%).
Natural Resources, Construction and Maintenance Occupations by Sex
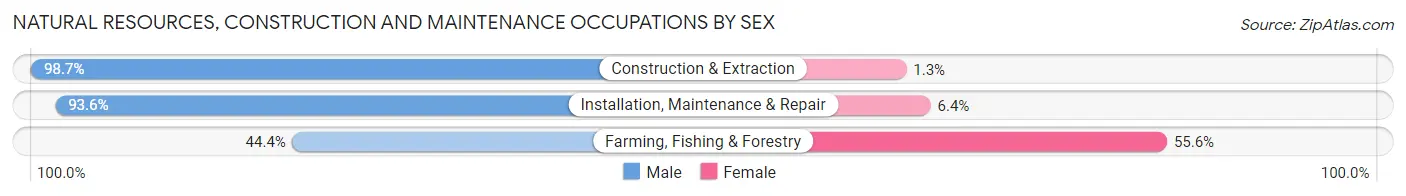
| Occupation | Male | Female |
| Farming, Fishing & Forestry | 4 (44.4%) | 5 (55.6%) |
| Construction & Extraction | 147 (98.7%) | 2 (1.3%) |
| Installation, Maintenance & Repair | 88 (93.6%) | 6 (6.4%) |
| Total (Category) | 239 (94.8%) | 13 (5.2%) |
| Total (Overall) | 1,422 (55.3%) | 1,150 (44.7%) |
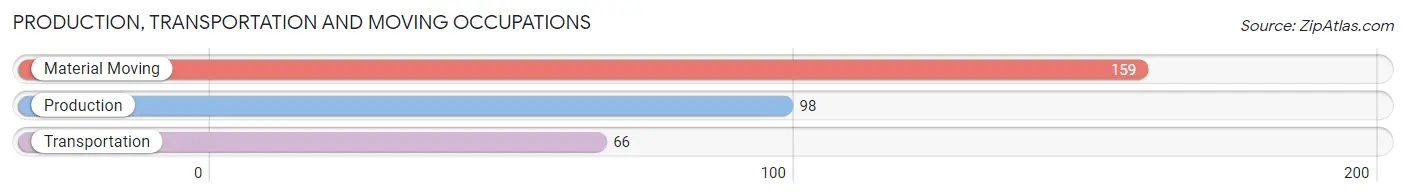
Production, Transportation and Moving Occupations
The most common Production, Transportation and Moving occupations in Palmer are Material Moving (159 | 6.2%), Production (98 | 3.8%), and Transportation (66 | 2.6%).
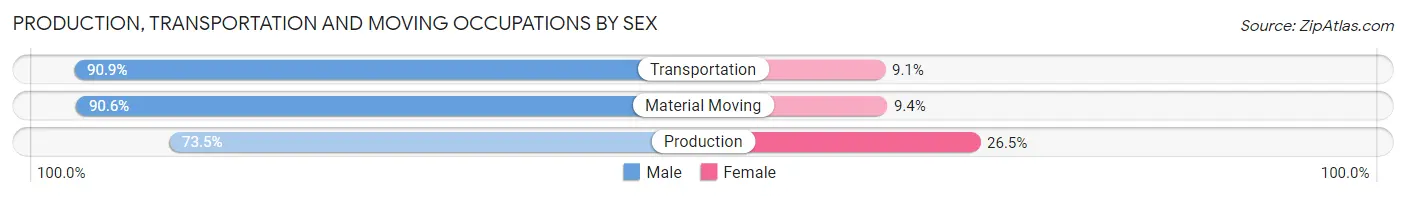
Production, Transportation and Moving Occupations by Sex
| Occupation | Male | Female |
| Production | 72 (73.5%) | 26 (26.5%) |
| Transportation | 60 (90.9%) | 6 (9.1%) |
| Material Moving | 144 (90.6%) | 15 (9.4%) |
| Total (Category) | 276 (85.5%) | 47 (14.5%) |
| Total (Overall) | 1,422 (55.3%) | 1,150 (44.7%) |
Employment Industries by Sex in Palmer
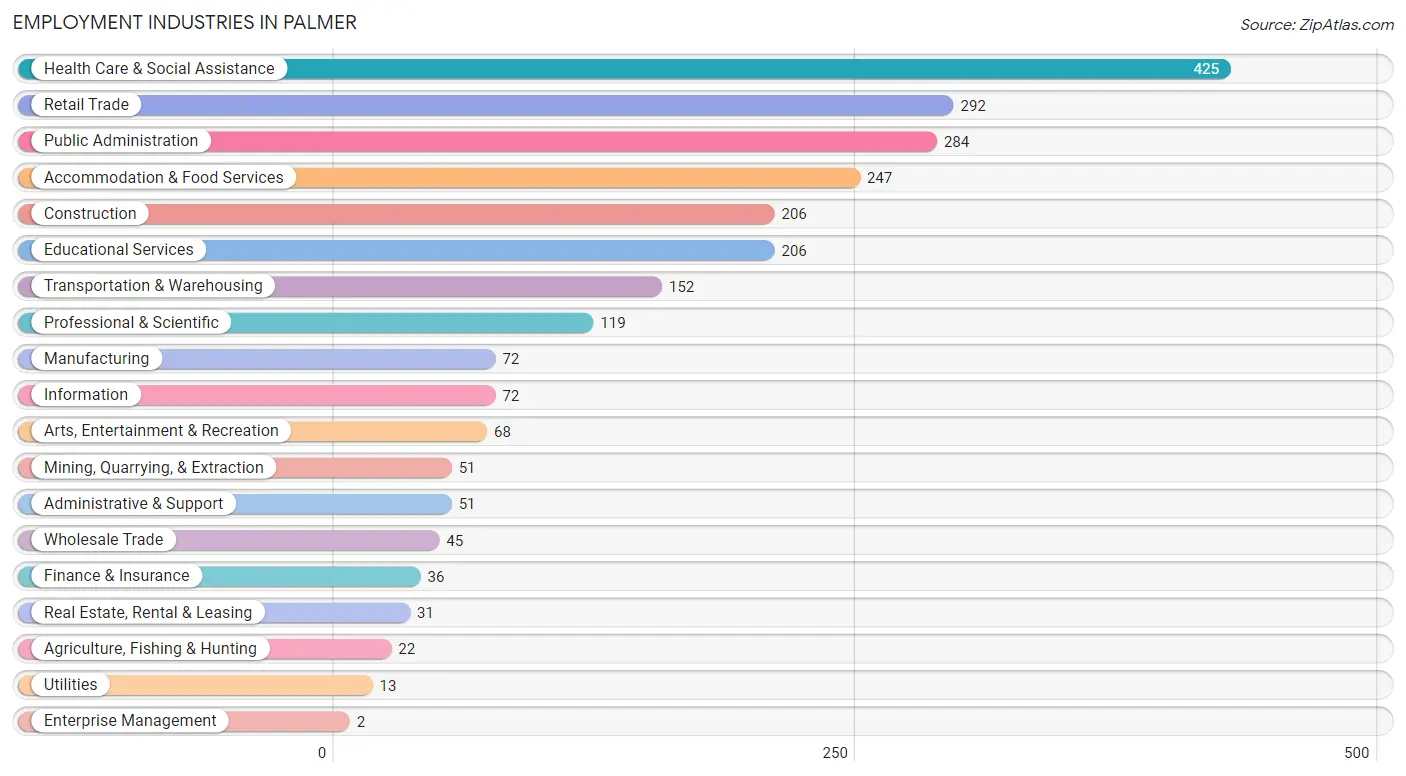
Employment Industries in Palmer
The major employment industries in Palmer include Health Care & Social Assistance (425 | 16.5%), Retail Trade (292 | 11.4%), Public Administration (284 | 11.0%), Accommodation & Food Services (247 | 9.6%), and Construction (206 | 8.0%).
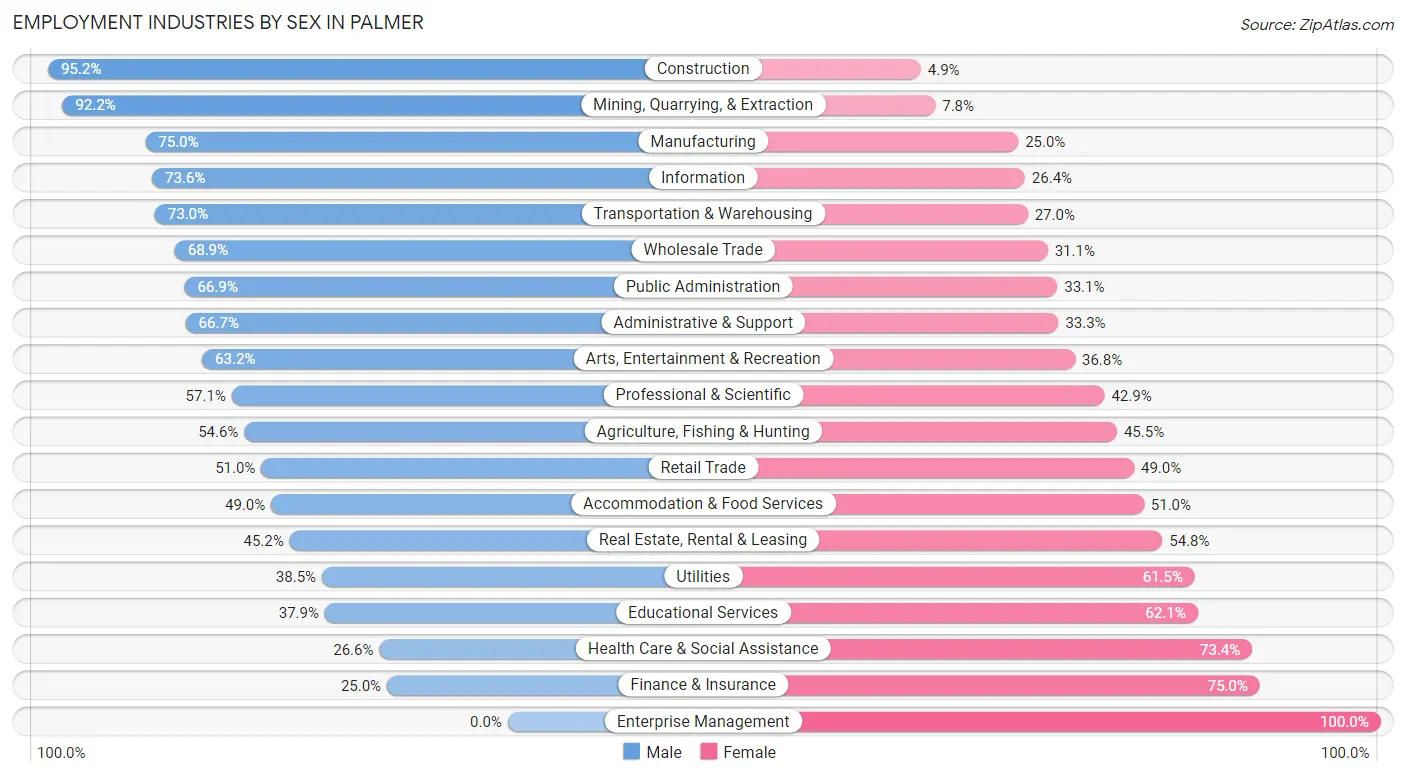
Employment Industries by Sex in Palmer
The Palmer industries that see more men than women are Construction (95.2%), Mining, Quarrying, & Extraction (92.2%), and Manufacturing (75.0%), whereas the industries that tend to have a higher number of women are Enterprise Management (100.0%), Finance & Insurance (75.0%), and Health Care & Social Assistance (73.4%).
| Industry | Male | Female |
| Agriculture, Fishing & Hunting | 12 (54.5%) | 10 (45.5%) |
| Mining, Quarrying, & Extraction | 47 (92.2%) | 4 (7.8%) |
| Construction | 196 (95.2%) | 10 (4.9%) |
| Manufacturing | 54 (75.0%) | 18 (25.0%) |
| Wholesale Trade | 31 (68.9%) | 14 (31.1%) |
| Retail Trade | 149 (51.0%) | 143 (49.0%) |
| Transportation & Warehousing | 111 (73.0%) | 41 (27.0%) |
| Utilities | 5 (38.5%) | 8 (61.5%) |
| Information | 53 (73.6%) | 19 (26.4%) |
| Finance & Insurance | 9 (25.0%) | 27 (75.0%) |
| Real Estate, Rental & Leasing | 14 (45.2%) | 17 (54.8%) |
| Professional & Scientific | 68 (57.1%) | 51 (42.9%) |
| Enterprise Management | 0 (0.0%) | 2 (100.0%) |
| Administrative & Support | 34 (66.7%) | 17 (33.3%) |
| Educational Services | 78 (37.9%) | 128 (62.1%) |
| Health Care & Social Assistance | 113 (26.6%) | 312 (73.4%) |
| Arts, Entertainment & Recreation | 43 (63.2%) | 25 (36.8%) |
| Accommodation & Food Services | 121 (49.0%) | 126 (51.0%) |
| Public Administration | 190 (66.9%) | 94 (33.1%) |
| Total | 1,422 (55.3%) | 1,150 (44.7%) |
Education in Palmer
School Enrollment in Palmer
The most common levels of schooling among the 1,415 students in Palmer are high school (334 | 23.6%), college / undergraduate (319 | 22.5%), and middle school (312 | 22.1%).
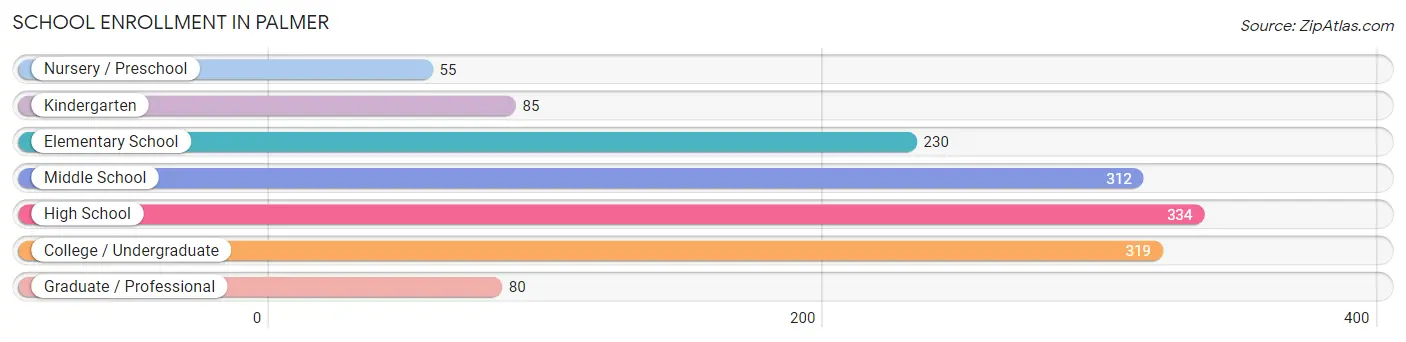
| School Level | # Students | % Students |
| Nursery / Preschool | 55 | 3.9% |
| Kindergarten | 85 | 6.0% |
| Elementary School | 230 | 16.3% |
| Middle School | 312 | 22.1% |
| High School | 334 | 23.6% |
| College / Undergraduate | 319 | 22.5% |
| Graduate / Professional | 80 | 5.7% |
| Total | 1,415 | 100.0% |
School Enrollment by Age by Funding Source in Palmer
Out of a total of 1,415 students who are enrolled in schools in Palmer, 277 (19.6%) attend a private institution, while the remaining 1,138 (80.4%) are enrolled in public schools. The age group of 3 to 4 year olds has the highest likelihood of being enrolled in private schools, with 18 (40.9% in the age bracket) enrolled. Conversely, the age group of 18 to 19 year olds has the lowest likelihood of being enrolled in a private school, with 133 (91.7% in the age bracket) attending a public institution.
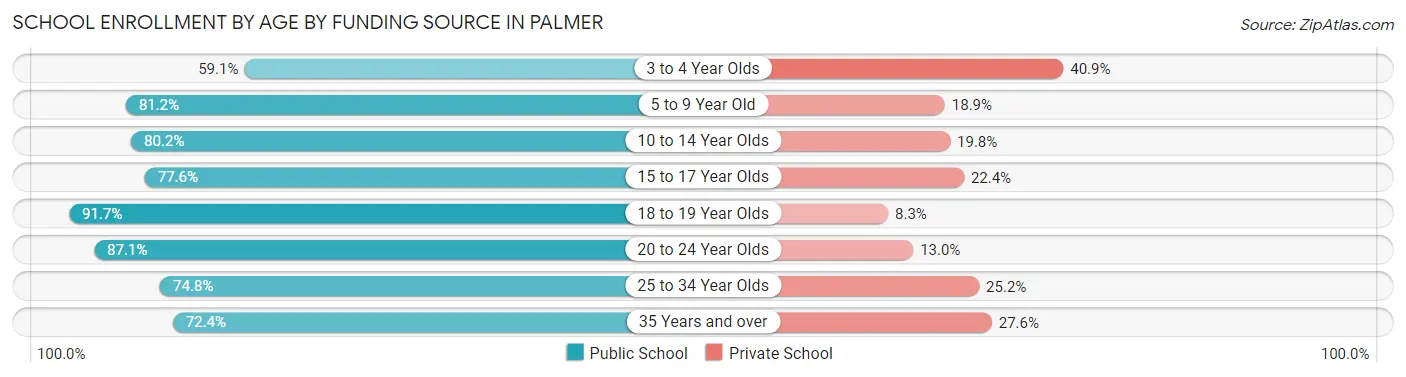
| Age Bracket | Public School | Private School |
| 3 to 4 Year Olds | 26 (59.1%) | 18 (40.9%) |
| 5 to 9 Year Old | 254 (81.1%) | 59 (18.9%) |
| 10 to 14 Year Olds | 291 (80.2%) | 72 (19.8%) |
| 15 to 17 Year Olds | 194 (77.6%) | 56 (22.4%) |
| 18 to 19 Year Olds | 133 (91.7%) | 12 (8.3%) |
| 20 to 24 Year Olds | 121 (87.1%) | 18 (13.0%) |
| 25 to 34 Year Olds | 77 (74.8%) | 26 (25.2%) |
| 35 Years and over | 42 (72.4%) | 16 (27.6%) |
| Total | 1,138 (80.4%) | 277 (19.6%) |
Educational Attainment by Field of Study in Palmer
Business (129 | 13.7%), education (114 | 12.1%), science & technology (109 | 11.6%), arts & humanities (101 | 10.7%), and computers & mathematics (67 | 7.1%) are the most common fields of study among 944 individuals in Palmer who have obtained a bachelor's degree or higher.
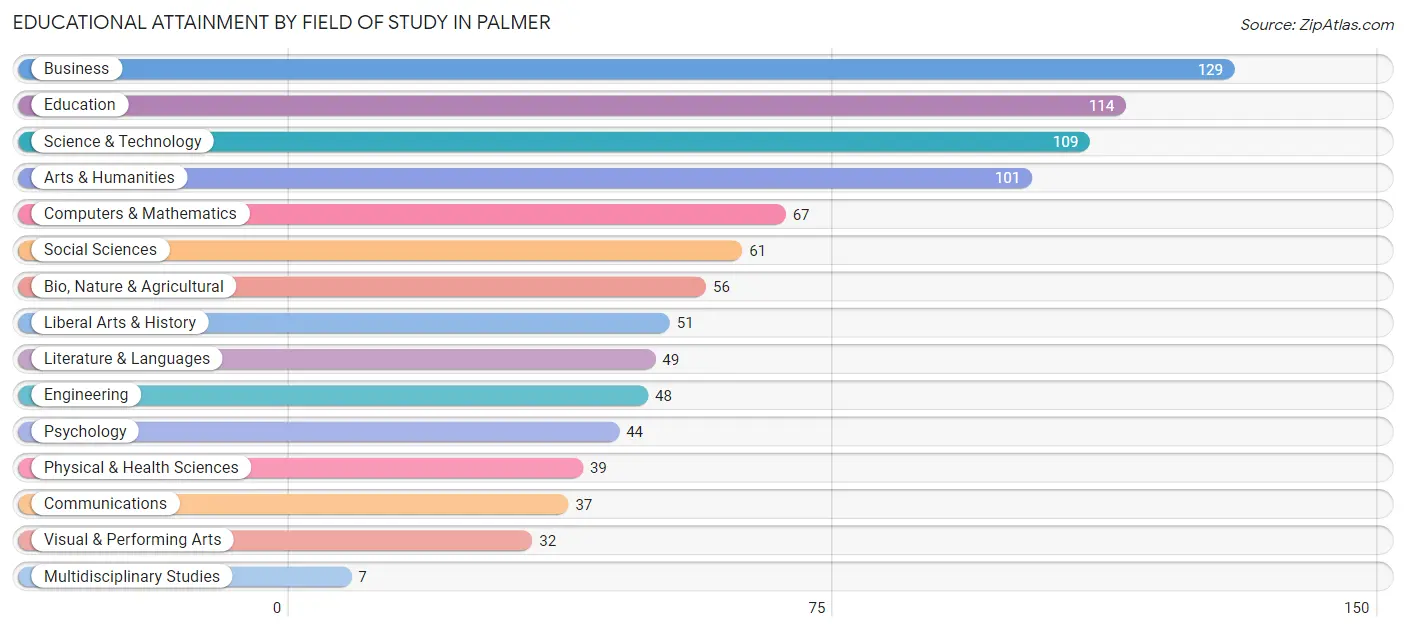
| Field of Study | # Graduates | % Graduates |
| Computers & Mathematics | 67 | 7.1% |
| Bio, Nature & Agricultural | 56 | 5.9% |
| Physical & Health Sciences | 39 | 4.1% |
| Psychology | 44 | 4.7% |
| Social Sciences | 61 | 6.5% |
| Engineering | 48 | 5.1% |
| Multidisciplinary Studies | 7 | 0.7% |
| Science & Technology | 109 | 11.6% |
| Business | 129 | 13.7% |
| Education | 114 | 12.1% |
| Literature & Languages | 49 | 5.2% |
| Liberal Arts & History | 51 | 5.4% |
| Visual & Performing Arts | 32 | 3.4% |
| Communications | 37 | 3.9% |
| Arts & Humanities | 101 | 10.7% |
| Total | 944 | 100.0% |
Transportation & Commute in Palmer
Vehicle Availability by Sex in Palmer
The most prevalent vehicle ownership categories in Palmer are males with 2 vehicles (596, accounting for 41.1%) and females with 2 vehicles (538, making up 51.9%).
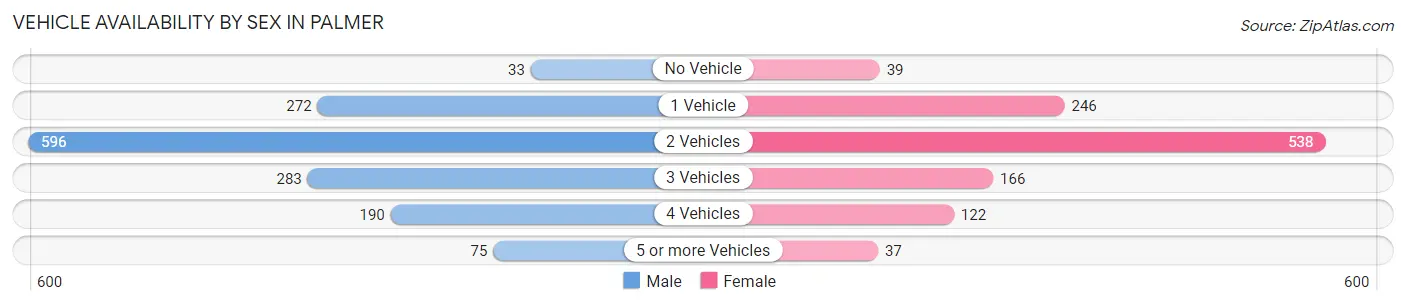
| Vehicles Available | Male | Female |
| No Vehicle | 33 (2.3%) | 39 (3.4%) |
| 1 Vehicle | 272 (18.8%) | 246 (21.4%) |
| 2 Vehicles | 596 (41.1%) | 538 (46.9%) |
| 3 Vehicles | 283 (19.5%) | 166 (14.5%) |
| 4 Vehicles | 190 (13.1%) | 122 (10.6%) |
| 5 or more Vehicles | 75 (5.2%) | 37 (3.2%) |
| Total | 1,449 (100.0%) | 1,148 (100.0%) |
Commute Time in Palmer
The most frequently occuring commute durations in Palmer are 5 to 9 minutes (463 commuters, 18.9%), 45 to 59 minutes (356 commuters, 14.5%), and 10 to 14 minutes (334 commuters, 13.6%).
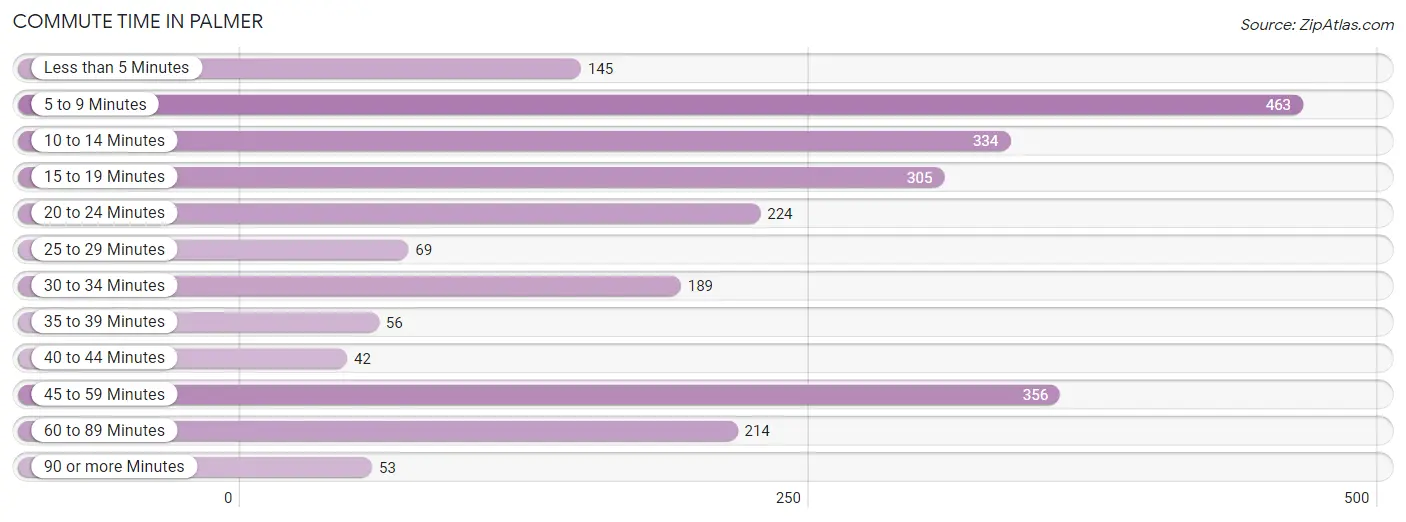
| Commute Time | # Commuters | % Commuters |
| Less than 5 Minutes | 145 | 5.9% |
| 5 to 9 Minutes | 463 | 18.9% |
| 10 to 14 Minutes | 334 | 13.6% |
| 15 to 19 Minutes | 305 | 12.4% |
| 20 to 24 Minutes | 224 | 9.1% |
| 25 to 29 Minutes | 69 | 2.8% |
| 30 to 34 Minutes | 189 | 7.7% |
| 35 to 39 Minutes | 56 | 2.3% |
| 40 to 44 Minutes | 42 | 1.7% |
| 45 to 59 Minutes | 356 | 14.5% |
| 60 to 89 Minutes | 214 | 8.7% |
| 90 or more Minutes | 53 | 2.2% |
Commute Time by Sex in Palmer
The most common commute times in Palmer are 5 to 9 minutes (261 commuters, 18.8%) for males and 5 to 9 minutes (202 commuters, 19.1%) for females.
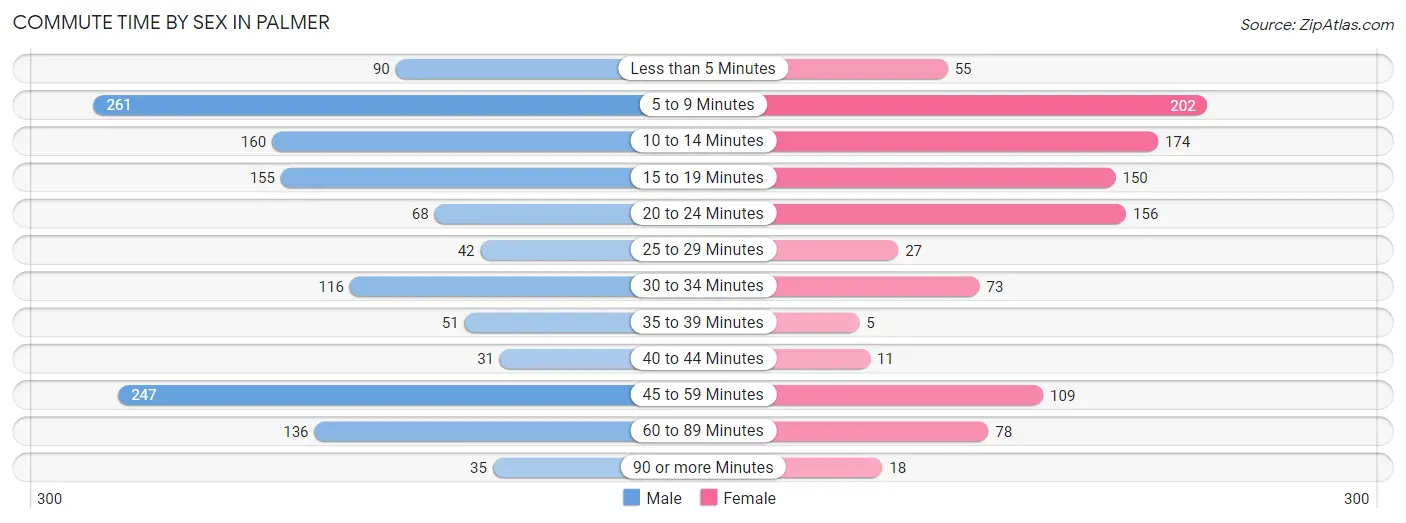
| Commute Time | Male | Female |
| Less than 5 Minutes | 90 (6.5%) | 55 (5.2%) |
| 5 to 9 Minutes | 261 (18.8%) | 202 (19.1%) |
| 10 to 14 Minutes | 160 (11.5%) | 174 (16.5%) |
| 15 to 19 Minutes | 155 (11.1%) | 150 (14.2%) |
| 20 to 24 Minutes | 68 (4.9%) | 156 (14.7%) |
| 25 to 29 Minutes | 42 (3.0%) | 27 (2.5%) |
| 30 to 34 Minutes | 116 (8.3%) | 73 (6.9%) |
| 35 to 39 Minutes | 51 (3.7%) | 5 (0.5%) |
| 40 to 44 Minutes | 31 (2.2%) | 11 (1.0%) |
| 45 to 59 Minutes | 247 (17.7%) | 109 (10.3%) |
| 60 to 89 Minutes | 136 (9.8%) | 78 (7.4%) |
| 90 or more Minutes | 35 (2.5%) | 18 (1.7%) |
Time of Departure to Work by Sex in Palmer
The most frequent times of departure to work in Palmer are 7:00 AM to 7:29 AM (163, 11.7%) for males and 7:30 AM to 7:59 AM (155, 14.6%) for females.
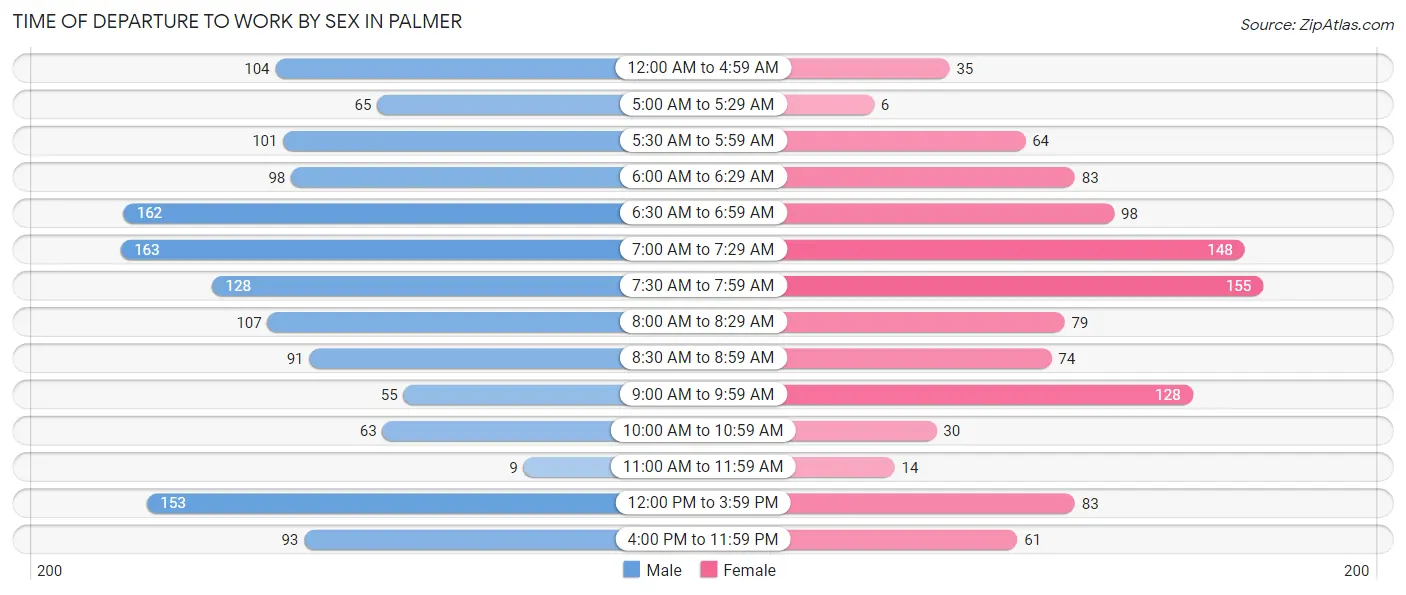
| Time of Departure | Male | Female |
| 12:00 AM to 4:59 AM | 104 (7.5%) | 35 (3.3%) |
| 5:00 AM to 5:29 AM | 65 (4.7%) | 6 (0.6%) |
| 5:30 AM to 5:59 AM | 101 (7.3%) | 64 (6.0%) |
| 6:00 AM to 6:29 AM | 98 (7.0%) | 83 (7.8%) |
| 6:30 AM to 6:59 AM | 162 (11.6%) | 98 (9.3%) |
| 7:00 AM to 7:29 AM | 163 (11.7%) | 148 (14.0%) |
| 7:30 AM to 7:59 AM | 128 (9.2%) | 155 (14.6%) |
| 8:00 AM to 8:29 AM | 107 (7.7%) | 79 (7.5%) |
| 8:30 AM to 8:59 AM | 91 (6.5%) | 74 (7.0%) |
| 9:00 AM to 9:59 AM | 55 (4.0%) | 128 (12.1%) |
| 10:00 AM to 10:59 AM | 63 (4.5%) | 30 (2.8%) |
| 11:00 AM to 11:59 AM | 9 (0.6%) | 14 (1.3%) |
| 12:00 PM to 3:59 PM | 153 (11.0%) | 83 (7.8%) |
| 4:00 PM to 11:59 PM | 93 (6.7%) | 61 (5.8%) |
| Total | 1,392 (100.0%) | 1,058 (100.0%) |
Housing Occupancy in Palmer
Occupancy by Ownership in Palmer
Of the total 2,232 dwellings in Palmer, owner-occupied units account for 1,395 (62.5%), while renter-occupied units make up 837 (37.5%).
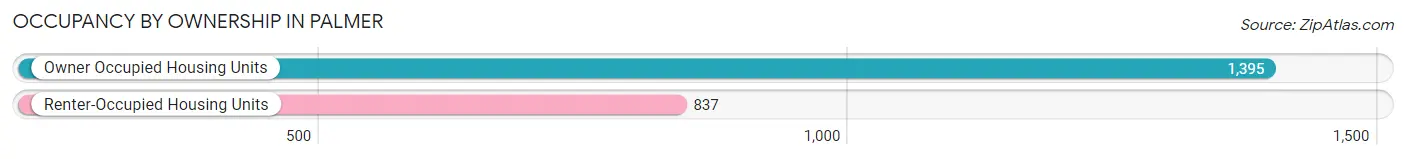
| Occupancy | # Housing Units | % Housing Units |
| Owner Occupied Housing Units | 1,395 | 62.5% |
| Renter-Occupied Housing Units | 837 | 37.5% |
| Total Occupied Housing Units | 2,232 | 100.0% |
Occupancy by Household Size in Palmer
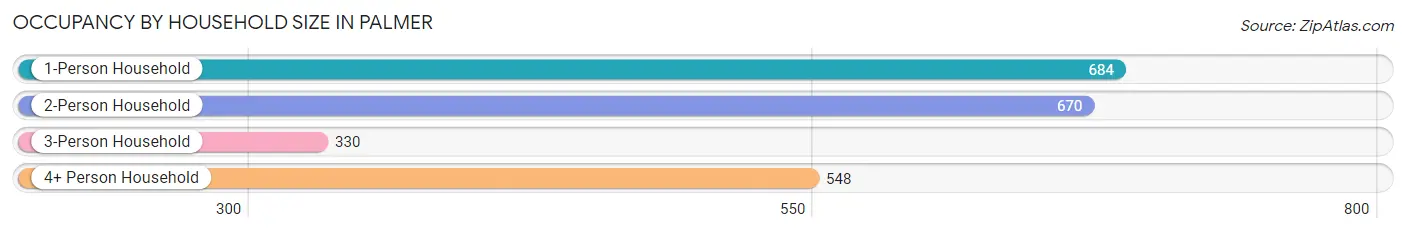
| Household Size | # Housing Units | % Housing Units |
| 1-Person Household | 684 | 30.6% |
| 2-Person Household | 670 | 30.0% |
| 3-Person Household | 330 | 14.8% |
| 4+ Person Household | 548 | 24.5% |
| Total Housing Units | 2,232 | 100.0% |
Occupancy by Ownership by Household Size in Palmer
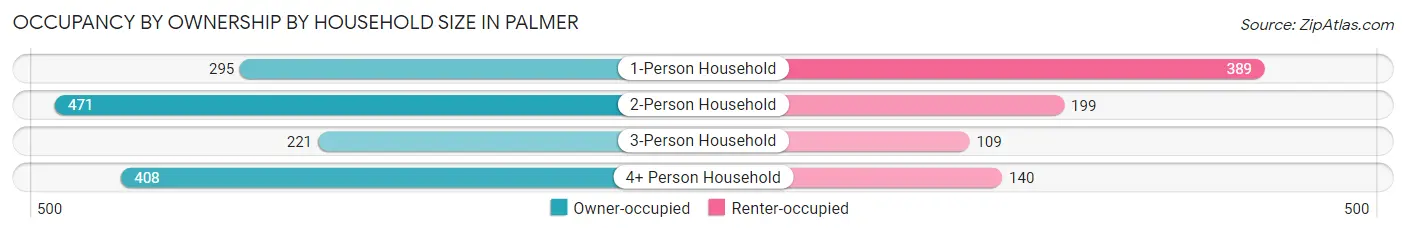
| Household Size | Owner-occupied | Renter-occupied |
| 1-Person Household | 295 (43.1%) | 389 (56.9%) |
| 2-Person Household | 471 (70.3%) | 199 (29.7%) |
| 3-Person Household | 221 (67.0%) | 109 (33.0%) |
| 4+ Person Household | 408 (74.5%) | 140 (25.6%) |
| Total Housing Units | 1,395 (62.5%) | 837 (37.5%) |
Occupancy by Educational Attainment in Palmer
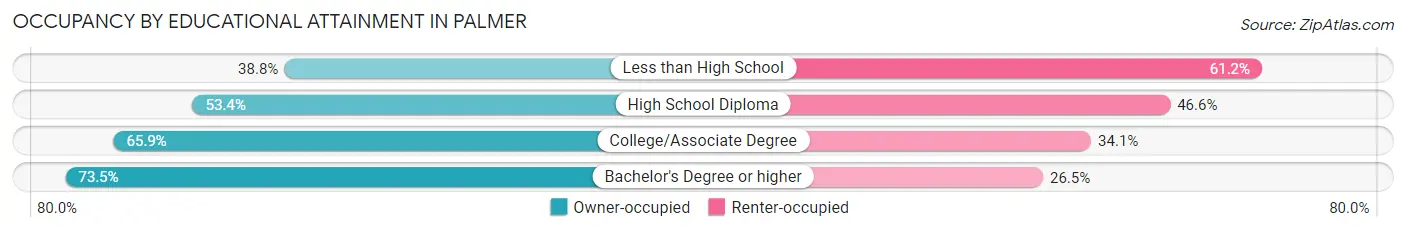
| Household Size | Owner-occupied | Renter-occupied |
| Less than High School | 40 (38.8%) | 63 (61.2%) |
| High School Diploma | 381 (53.4%) | 333 (46.6%) |
| College/Associate Degree | 574 (65.9%) | 297 (34.1%) |
| Bachelor's Degree or higher | 400 (73.5%) | 144 (26.5%) |
Occupancy by Age of Householder in Palmer
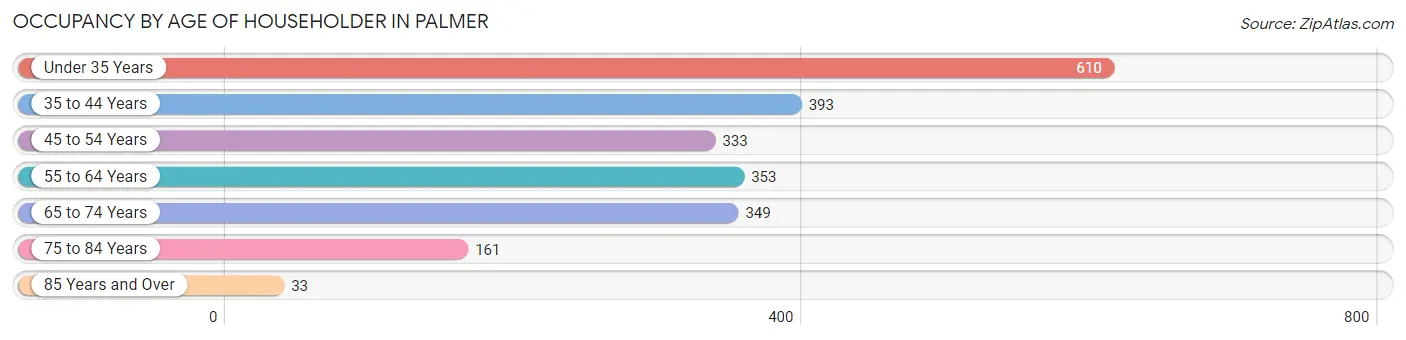
| Age Bracket | # Households | % Households |
| Under 35 Years | 610 | 27.3% |
| 35 to 44 Years | 393 | 17.6% |
| 45 to 54 Years | 333 | 14.9% |
| 55 to 64 Years | 353 | 15.8% |
| 65 to 74 Years | 349 | 15.6% |
| 75 to 84 Years | 161 | 7.2% |
| 85 Years and Over | 33 | 1.5% |
| Total | 2,232 | 100.0% |
Housing Finances in Palmer
Median Income by Occupancy in Palmer
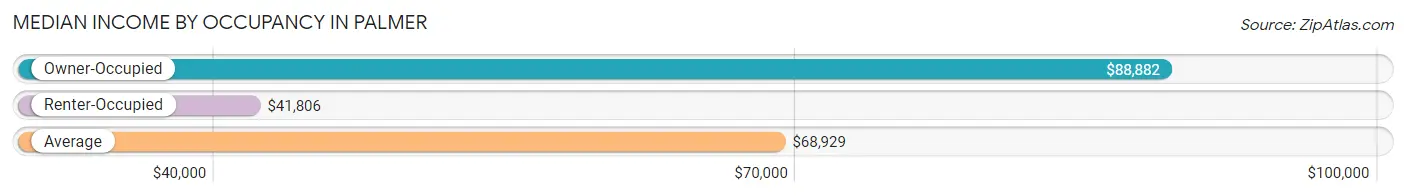
| Occupancy Type | # Households | Median Income |
| Owner-Occupied | 1,395 (62.5%) | $88,882 |
| Renter-Occupied | 837 (37.5%) | $41,806 |
| Average | 2,232 (100.0%) | $68,929 |
Occupancy by Householder Income Bracket in Palmer
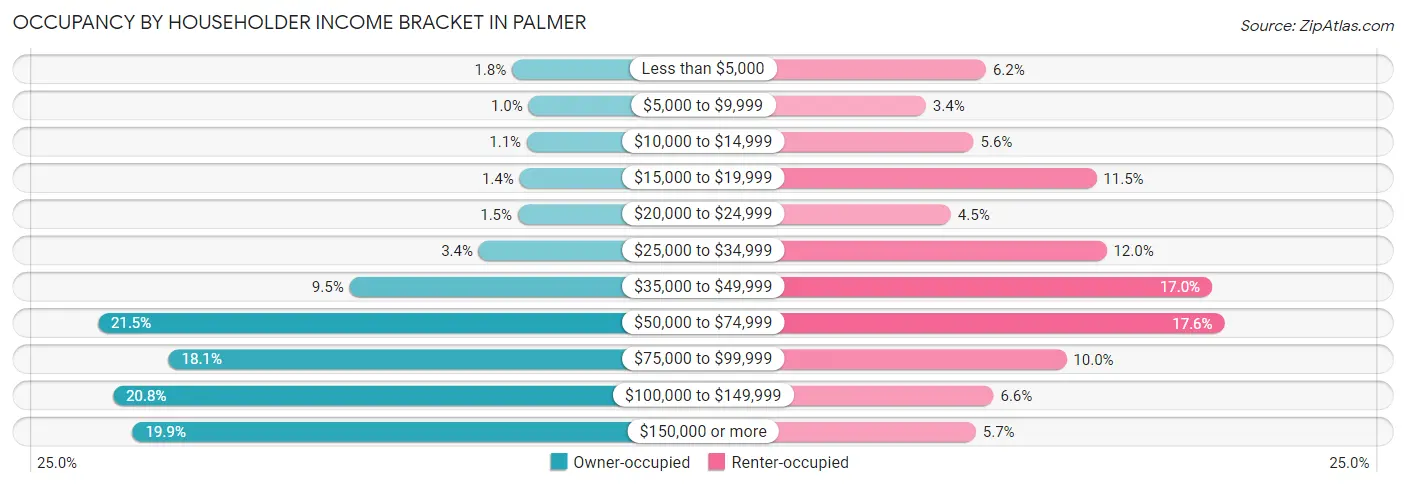
| Income Bracket | Owner-occupied | Renter-occupied |
| Less than $5,000 | 25 (1.8%) | 52 (6.2%) |
| $5,000 to $9,999 | 14 (1.0%) | 28 (3.4%) |
| $10,000 to $14,999 | 15 (1.1%) | 47 (5.6%) |
| $15,000 to $19,999 | 20 (1.4%) | 96 (11.5%) |
| $20,000 to $24,999 | 21 (1.5%) | 38 (4.5%) |
| $25,000 to $34,999 | 47 (3.4%) | 100 (11.9%) |
| $35,000 to $49,999 | 133 (9.5%) | 142 (17.0%) |
| $50,000 to $74,999 | 300 (21.5%) | 147 (17.6%) |
| $75,000 to $99,999 | 253 (18.1%) | 84 (10.0%) |
| $100,000 to $149,999 | 290 (20.8%) | 55 (6.6%) |
| $150,000 or more | 277 (19.9%) | 48 (5.7%) |
| Total | 1,395 (100.0%) | 837 (100.0%) |
Monthly Housing Cost Tiers in Palmer
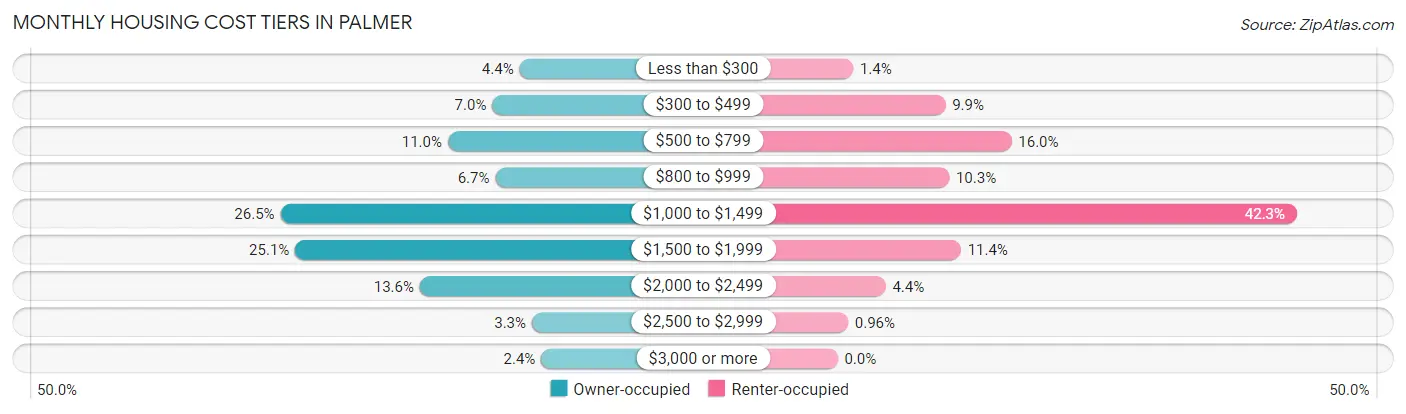
| Monthly Cost | Owner-occupied | Renter-occupied |
| Less than $300 | 62 (4.4%) | 12 (1.4%) |
| $300 to $499 | 97 (7.0%) | 83 (9.9%) |
| $500 to $799 | 154 (11.0%) | 134 (16.0%) |
| $800 to $999 | 93 (6.7%) | 86 (10.3%) |
| $1,000 to $1,499 | 369 (26.5%) | 354 (42.3%) |
| $1,500 to $1,999 | 350 (25.1%) | 95 (11.4%) |
| $2,000 to $2,499 | 190 (13.6%) | 37 (4.4%) |
| $2,500 to $2,999 | 46 (3.3%) | 8 (1.0%) |
| $3,000 or more | 34 (2.4%) | 0 (0.0%) |
| Total | 1,395 (100.0%) | 837 (100.0%) |
Physical Housing Characteristics in Palmer
Housing Structures in Palmer
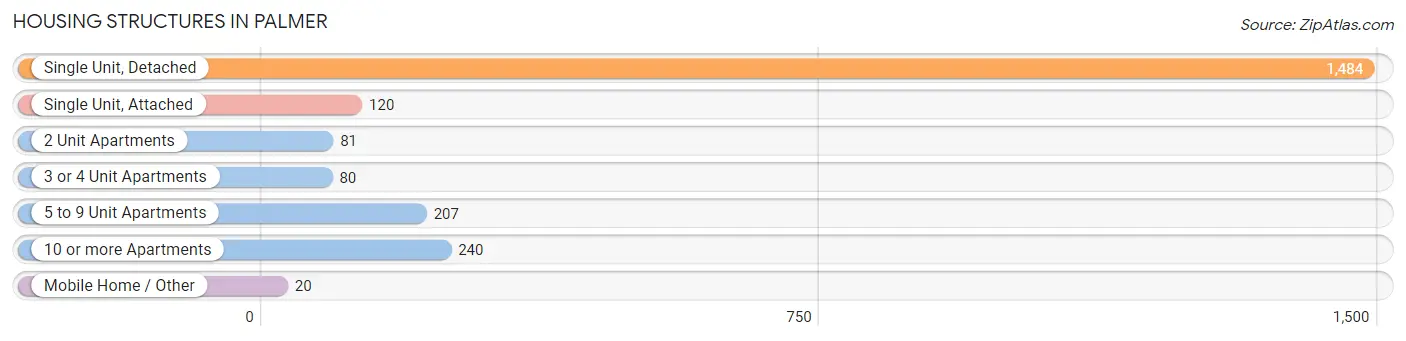
| Structure Type | # Housing Units | % Housing Units |
| Single Unit, Detached | 1,484 | 66.5% |
| Single Unit, Attached | 120 | 5.4% |
| 2 Unit Apartments | 81 | 3.6% |
| 3 or 4 Unit Apartments | 80 | 3.6% |
| 5 to 9 Unit Apartments | 207 | 9.3% |
| 10 or more Apartments | 240 | 10.7% |
| Mobile Home / Other | 20 | 0.9% |
| Total | 2,232 | 100.0% |
Housing Structures by Occupancy in Palmer
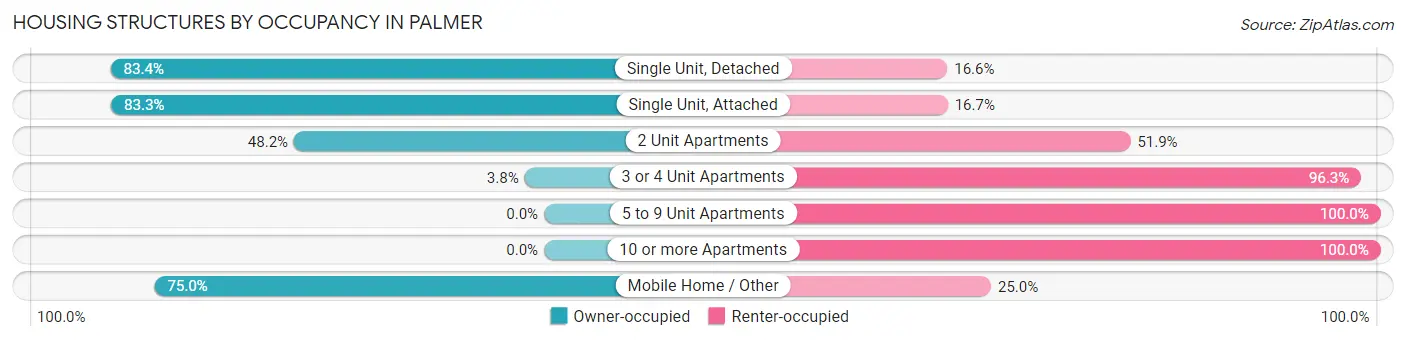
| Structure Type | Owner-occupied | Renter-occupied |
| Single Unit, Detached | 1,238 (83.4%) | 246 (16.6%) |
| Single Unit, Attached | 100 (83.3%) | 20 (16.7%) |
| 2 Unit Apartments | 39 (48.1%) | 42 (51.8%) |
| 3 or 4 Unit Apartments | 3 (3.7%) | 77 (96.3%) |
| 5 to 9 Unit Apartments | 0 (0.0%) | 207 (100.0%) |
| 10 or more Apartments | 0 (0.0%) | 240 (100.0%) |
| Mobile Home / Other | 15 (75.0%) | 5 (25.0%) |
| Total | 1,395 (62.5%) | 837 (37.5%) |
Housing Structures by Number of Rooms in Palmer
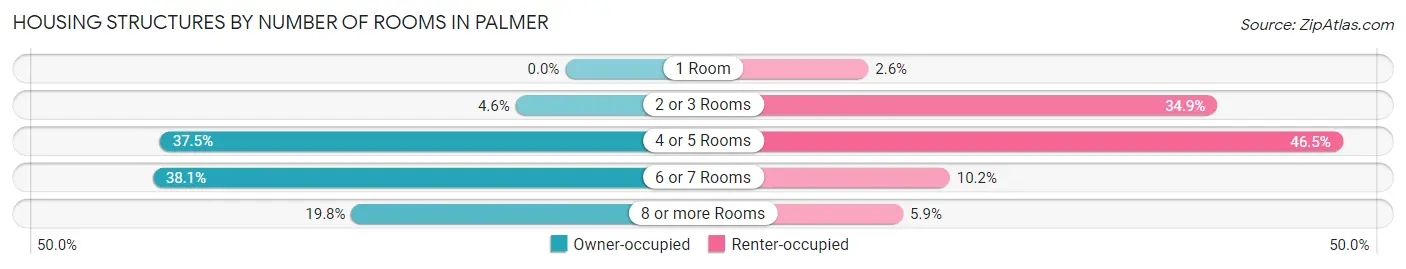
| Number of Rooms | Owner-occupied | Renter-occupied |
| 1 Room | 0 (0.0%) | 22 (2.6%) |
| 2 or 3 Rooms | 64 (4.6%) | 292 (34.9%) |
| 4 or 5 Rooms | 523 (37.5%) | 389 (46.5%) |
| 6 or 7 Rooms | 532 (38.1%) | 85 (10.2%) |
| 8 or more Rooms | 276 (19.8%) | 49 (5.9%) |
| Total | 1,395 (100.0%) | 837 (100.0%) |
Housing Structure by Heating Type in Palmer
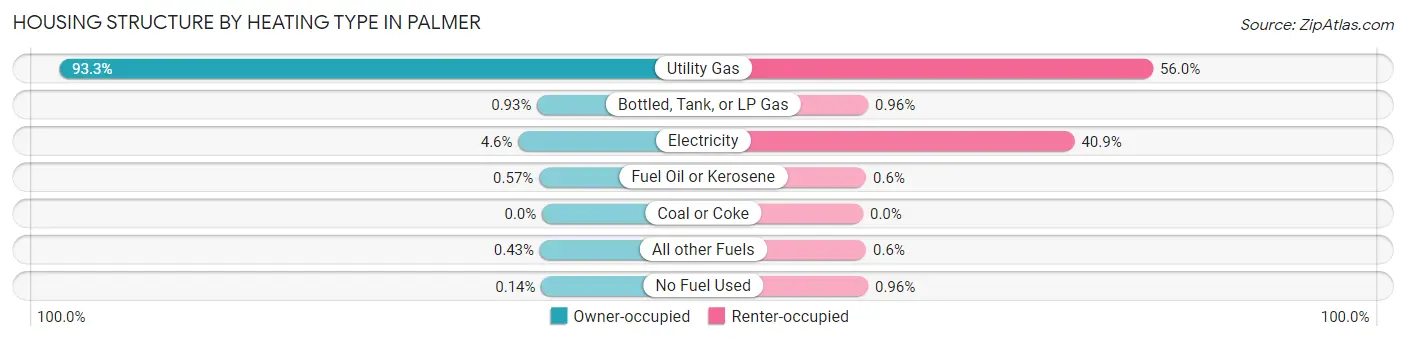
| Heating Type | Owner-occupied | Renter-occupied |
| Utility Gas | 1,302 (93.3%) | 469 (56.0%) |
| Bottled, Tank, or LP Gas | 13 (0.9%) | 8 (1.0%) |
| Electricity | 64 (4.6%) | 342 (40.9%) |
| Fuel Oil or Kerosene | 8 (0.6%) | 5 (0.6%) |
| Coal or Coke | 0 (0.0%) | 0 (0.0%) |
| All other Fuels | 6 (0.4%) | 5 (0.6%) |
| No Fuel Used | 2 (0.1%) | 8 (1.0%) |
| Total | 1,395 (100.0%) | 837 (100.0%) |
Household Vehicle Usage in Palmer
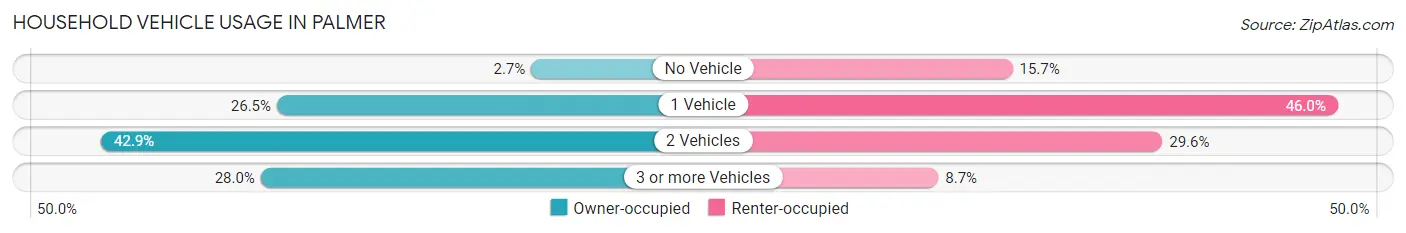
| Vehicles per Household | Owner-occupied | Renter-occupied |
| No Vehicle | 38 (2.7%) | 131 (15.7%) |
| 1 Vehicle | 369 (26.5%) | 385 (46.0%) |
| 2 Vehicles | 598 (42.9%) | 248 (29.6%) |
| 3 or more Vehicles | 390 (28.0%) | 73 (8.7%) |
| Total | 1,395 (100.0%) | 837 (100.0%) |
Real Estate & Mortgages in Palmer
Real Estate and Mortgage Overview in Palmer
| Characteristic | Without Mortgage | With Mortgage |
| Housing Units | 391 | 1,004 |
| Median Property Value | $256,800 | $256,100 |
| Median Household Income | $68,594 | $237 |
| Monthly Housing Costs | $567 | $34 |
| Real Estate Taxes | $2,100 | $114 |
Property Value by Mortgage Status in Palmer
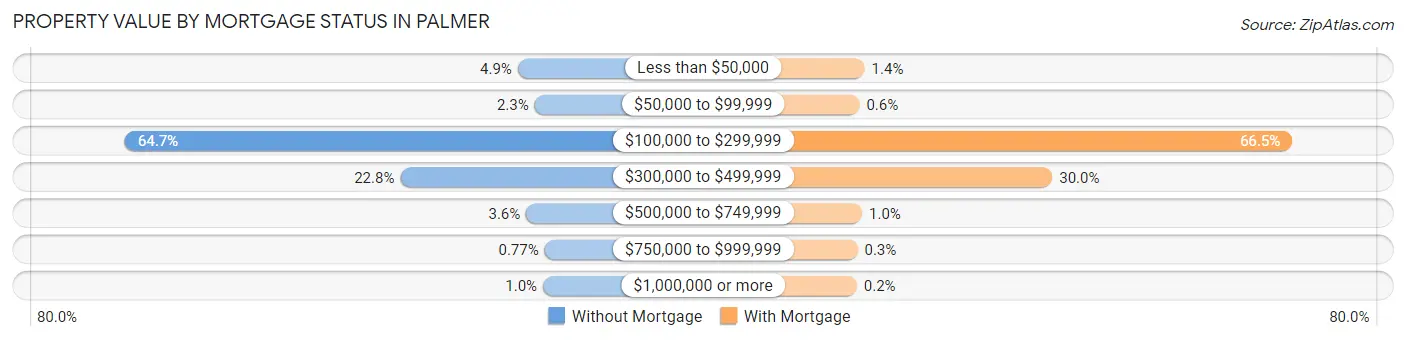
| Property Value | Without Mortgage | With Mortgage |
| Less than $50,000 | 19 (4.9%) | 14 (1.4%) |
| $50,000 to $99,999 | 9 (2.3%) | 6 (0.6%) |
| $100,000 to $299,999 | 253 (64.7%) | 668 (66.5%) |
| $300,000 to $499,999 | 89 (22.8%) | 301 (30.0%) |
| $500,000 to $749,999 | 14 (3.6%) | 10 (1.0%) |
| $750,000 to $999,999 | 3 (0.8%) | 3 (0.3%) |
| $1,000,000 or more | 4 (1.0%) | 2 (0.2%) |
| Total | 391 (100.0%) | 1,004 (100.0%) |
Household Income by Mortgage Status in Palmer
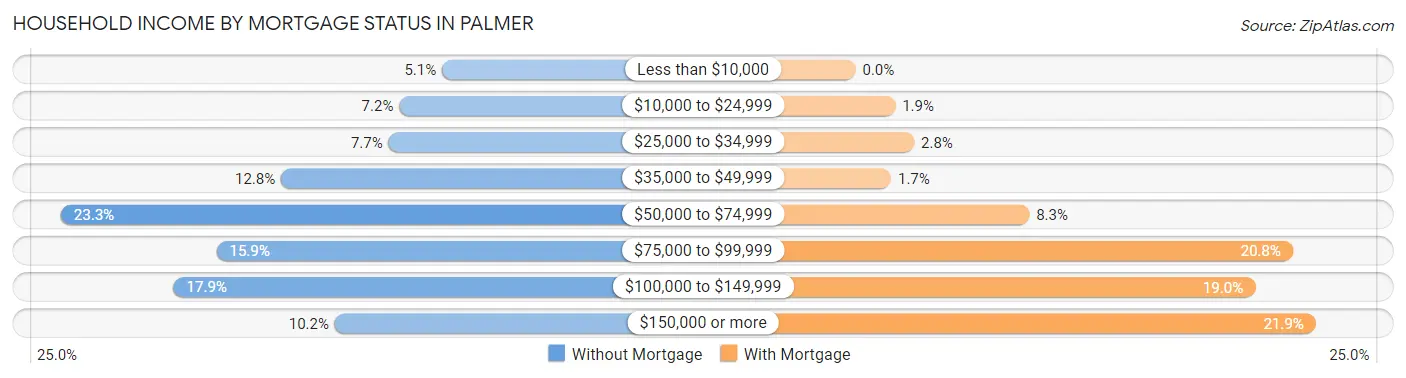
| Household Income | Without Mortgage | With Mortgage |
| Less than $10,000 | 20 (5.1%) | 0 (0.0%) |
| $10,000 to $24,999 | 28 (7.2%) | 19 (1.9%) |
| $25,000 to $34,999 | 30 (7.7%) | 28 (2.8%) |
| $35,000 to $49,999 | 50 (12.8%) | 17 (1.7%) |
| $50,000 to $74,999 | 91 (23.3%) | 83 (8.3%) |
| $75,000 to $99,999 | 62 (15.9%) | 209 (20.8%) |
| $100,000 to $149,999 | 70 (17.9%) | 191 (19.0%) |
| $150,000 or more | 40 (10.2%) | 220 (21.9%) |
| Total | 391 (100.0%) | 1,004 (100.0%) |
Property Value to Household Income Ratio in Palmer
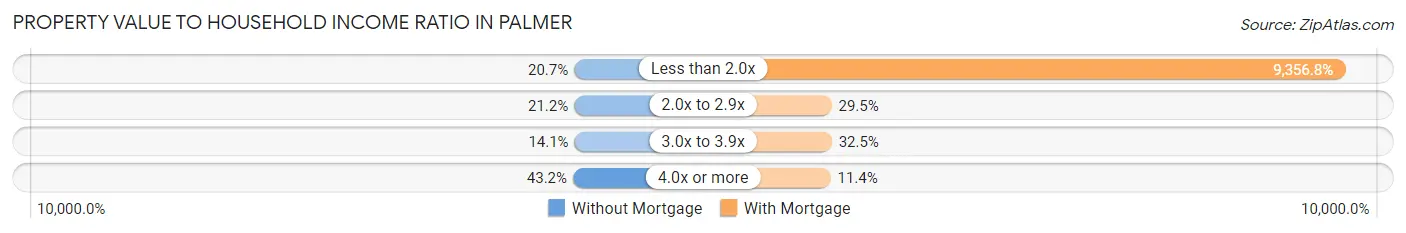
| Value-to-Income Ratio | Without Mortgage | With Mortgage |
| Less than 2.0x | 81 (20.7%) | 93,942 (9,356.8%) |
| 2.0x to 2.9x | 83 (21.2%) | 296 (29.5%) |
| 3.0x to 3.9x | 55 (14.1%) | 326 (32.5%) |
| 4.0x or more | 169 (43.2%) | 114 (11.4%) |
| Total | 391 (100.0%) | 1,004 (100.0%) |
Real Estate Taxes by Mortgage Status in Palmer
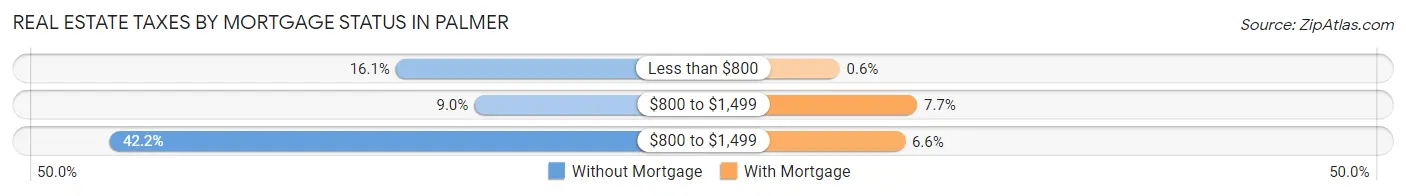
| Property Taxes | Without Mortgage | With Mortgage |
| Less than $800 | 63 (16.1%) | 6 (0.6%) |
| $800 to $1,499 | 35 (8.9%) | 77 (7.7%) |
| $800 to $1,499 | 165 (42.2%) | 66 (6.6%) |
| Total | 391 (100.0%) | 1,004 (100.0%) |
Health & Disability in Palmer
Health Insurance Coverage by Age in Palmer
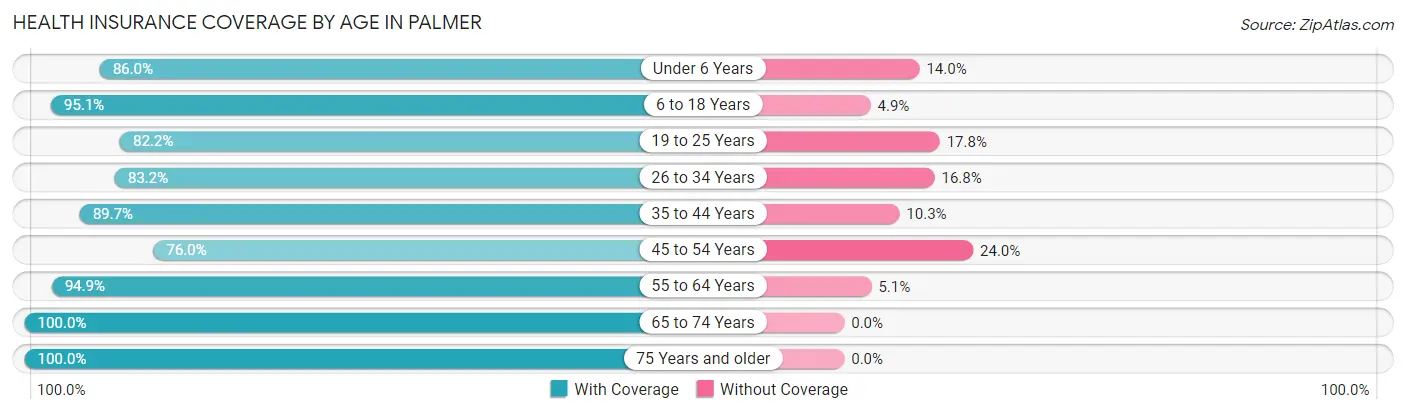
| Age Bracket | With Coverage | Without Coverage |
| Under 6 Years | 454 (86.0%) | 74 (14.0%) |
| 6 to 18 Years | 968 (95.1%) | 50 (4.9%) |
| 19 to 25 Years | 642 (82.2%) | 139 (17.8%) |
| 26 to 34 Years | 776 (83.2%) | 157 (16.8%) |
| 35 to 44 Years | 576 (89.7%) | 66 (10.3%) |
| 45 to 54 Years | 465 (76.0%) | 147 (24.0%) |
| 55 to 64 Years | 507 (94.9%) | 27 (5.1%) |
| 65 to 74 Years | 491 (100.0%) | 0 (0.0%) |
| 75 Years and older | 302 (100.0%) | 0 (0.0%) |
| Total | 5,181 (88.7%) | 660 (11.3%) |
Health Insurance Coverage by Citizenship Status in Palmer
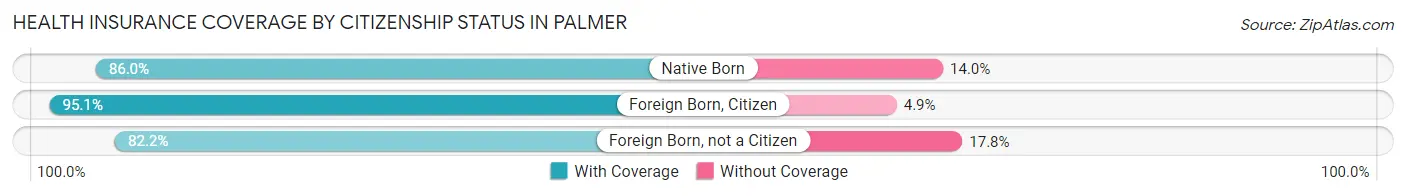
| Citizenship Status | With Coverage | Without Coverage |
| Native Born | 454 (86.0%) | 74 (14.0%) |
| Foreign Born, Citizen | 968 (95.1%) | 50 (4.9%) |
| Foreign Born, not a Citizen | 642 (82.2%) | 139 (17.8%) |
Health Insurance Coverage by Household Income in Palmer
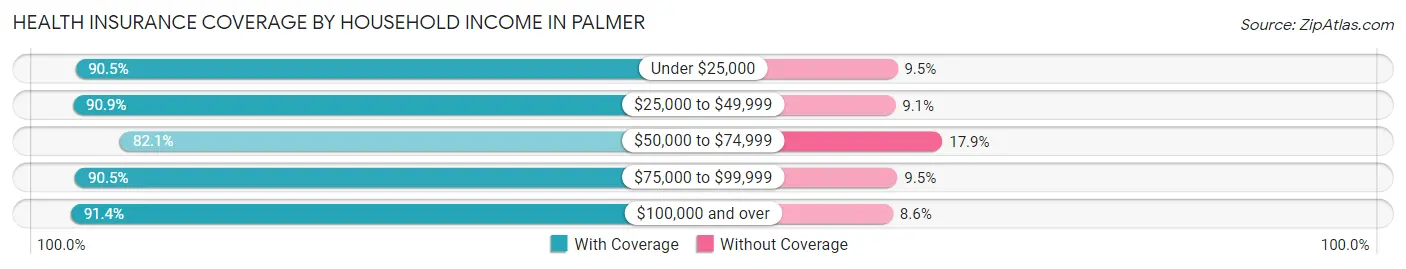
| Household Income | With Coverage | Without Coverage |
| Under $25,000 | 496 (90.5%) | 52 (9.5%) |
| $25,000 to $49,999 | 761 (90.9%) | 76 (9.1%) |
| $50,000 to $74,999 | 922 (82.1%) | 201 (17.9%) |
| $75,000 to $99,999 | 850 (90.5%) | 89 (9.5%) |
| $100,000 and over | 2,029 (91.4%) | 192 (8.6%) |
Public vs Private Health Insurance Coverage by Age in Palmer
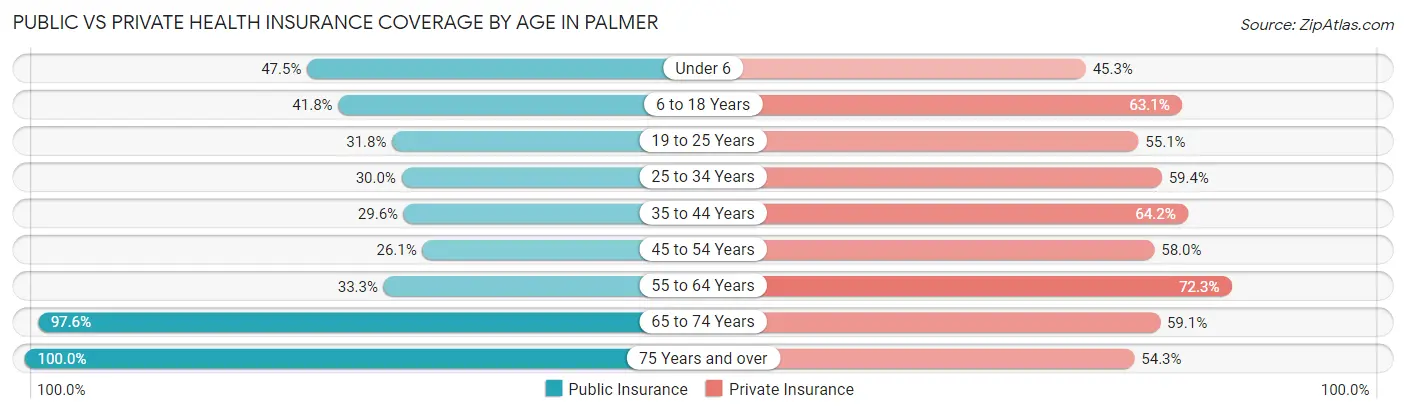
| Age Bracket | Public Insurance | Private Insurance |
| Under 6 | 251 (47.5%) | 239 (45.3%) |
| 6 to 18 Years | 425 (41.7%) | 642 (63.1%) |
| 19 to 25 Years | 248 (31.8%) | 430 (55.1%) |
| 25 to 34 Years | 280 (30.0%) | 554 (59.4%) |
| 35 to 44 Years | 190 (29.6%) | 412 (64.2%) |
| 45 to 54 Years | 160 (26.1%) | 355 (58.0%) |
| 55 to 64 Years | 178 (33.3%) | 386 (72.3%) |
| 65 to 74 Years | 479 (97.6%) | 290 (59.1%) |
| 75 Years and over | 302 (100.0%) | 164 (54.3%) |
| Total | 2,513 (43.0%) | 3,472 (59.4%) |
Disability Status by Sex by Age in Palmer
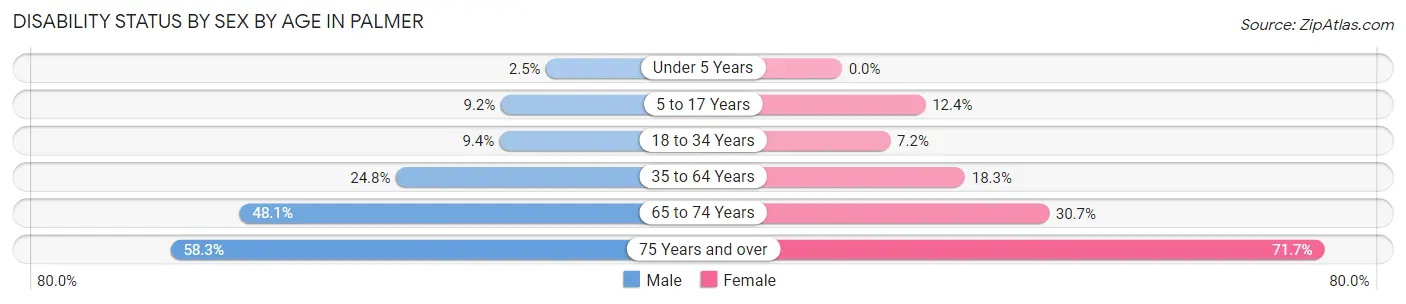
| Age Bracket | Male | Female |
| Under 5 Years | 6 (2.5%) | 0 (0.0%) |
| 5 to 17 Years | 50 (9.2%) | 55 (12.4%) |
| 18 to 34 Years | 87 (9.4%) | 64 (7.2%) |
| 35 to 64 Years | 214 (24.8%) | 169 (18.3%) |
| 65 to 74 Years | 100 (48.1%) | 87 (30.7%) |
| 75 Years and over | 63 (58.3%) | 139 (71.7%) |
Disability Class by Sex by Age in Palmer
Disability Class: Hearing Difficulty
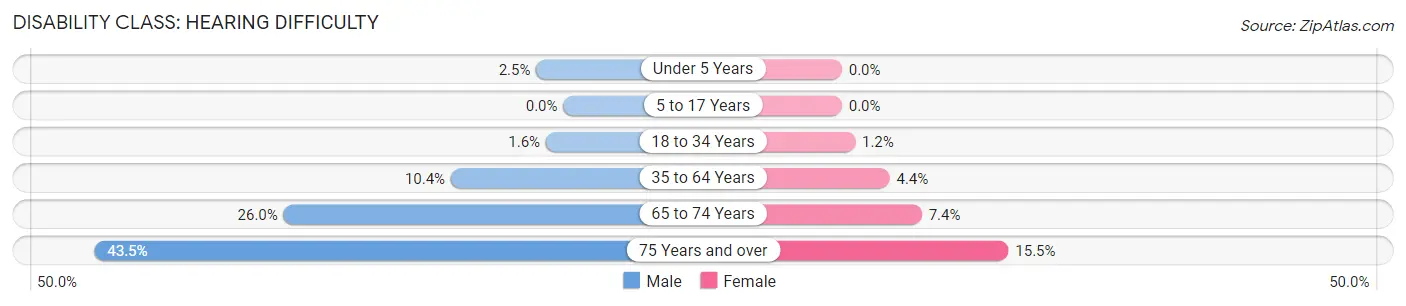
| Age Bracket | Male | Female |
| Under 5 Years | 6 (2.5%) | 0 (0.0%) |
| 5 to 17 Years | 0 (0.0%) | 0 (0.0%) |
| 18 to 34 Years | 15 (1.6%) | 11 (1.2%) |
| 35 to 64 Years | 90 (10.4%) | 41 (4.4%) |
| 65 to 74 Years | 54 (26.0%) | 21 (7.4%) |
| 75 Years and over | 47 (43.5%) | 30 (15.5%) |
Disability Class: Vision Difficulty
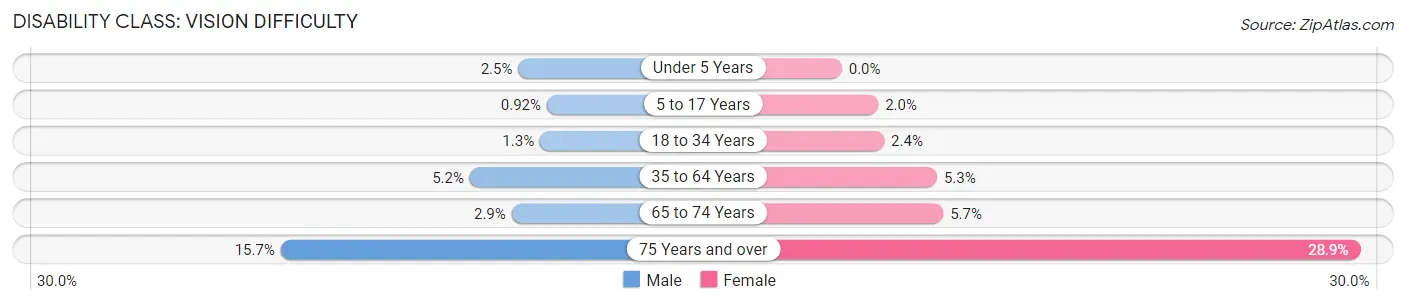
| Age Bracket | Male | Female |
| Under 5 Years | 6 (2.5%) | 0 (0.0%) |
| 5 to 17 Years | 5 (0.9%) | 9 (2.0%) |
| 18 to 34 Years | 12 (1.3%) | 21 (2.4%) |
| 35 to 64 Years | 45 (5.2%) | 49 (5.3%) |
| 65 to 74 Years | 6 (2.9%) | 16 (5.7%) |
| 75 Years and over | 17 (15.7%) | 56 (28.9%) |
Disability Class: Cognitive Difficulty
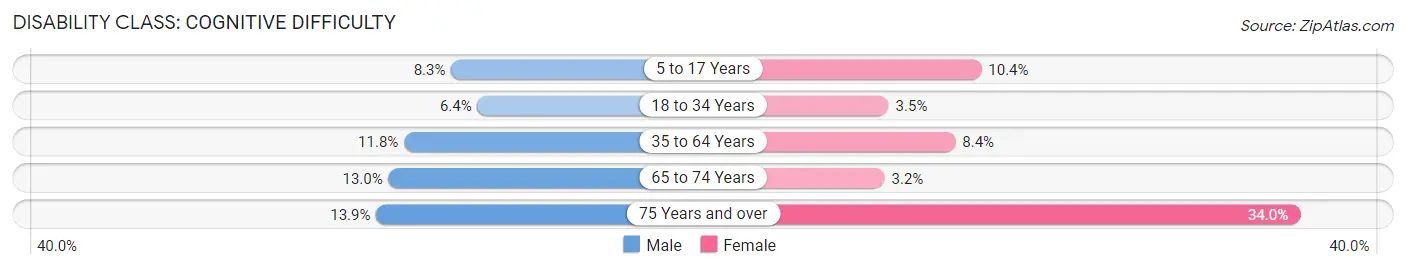
| Age Bracket | Male | Female |
| 5 to 17 Years | 45 (8.3%) | 46 (10.4%) |
| 18 to 34 Years | 59 (6.4%) | 31 (3.5%) |
| 35 to 64 Years | 102 (11.8%) | 78 (8.4%) |
| 65 to 74 Years | 27 (13.0%) | 9 (3.2%) |
| 75 Years and over | 15 (13.9%) | 66 (34.0%) |
Disability Class: Ambulatory Difficulty
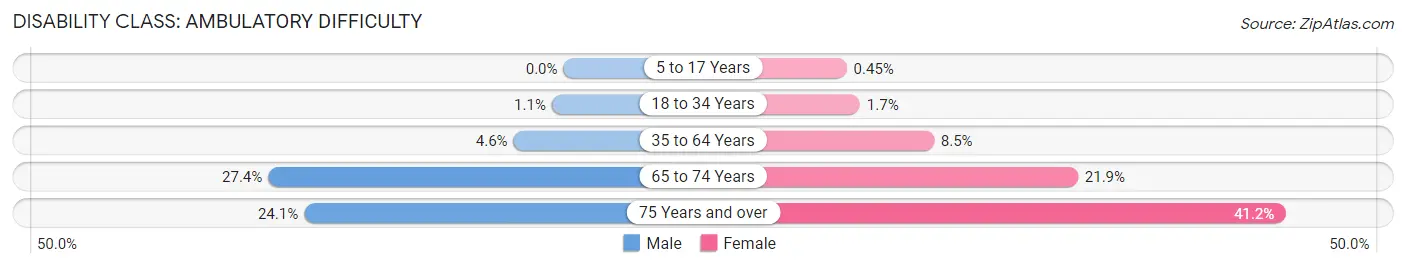
| Age Bracket | Male | Female |
| 5 to 17 Years | 0 (0.0%) | 2 (0.4%) |
| 18 to 34 Years | 10 (1.1%) | 15 (1.7%) |
| 35 to 64 Years | 40 (4.6%) | 79 (8.5%) |
| 65 to 74 Years | 57 (27.4%) | 62 (21.9%) |
| 75 Years and over | 26 (24.1%) | 80 (41.2%) |
Disability Class: Self-Care Difficulty
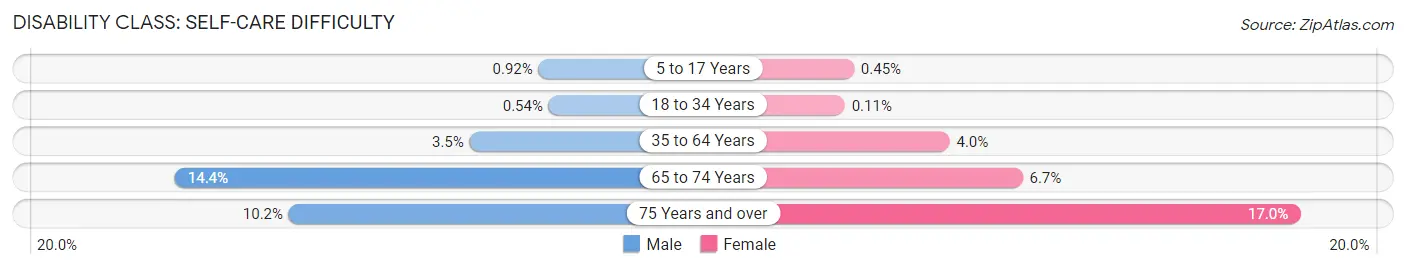
| Age Bracket | Male | Female |
| 5 to 17 Years | 5 (0.9%) | 2 (0.4%) |
| 18 to 34 Years | 5 (0.5%) | 1 (0.1%) |
| 35 to 64 Years | 30 (3.5%) | 37 (4.0%) |
| 65 to 74 Years | 30 (14.4%) | 19 (6.7%) |
| 75 Years and over | 11 (10.2%) | 33 (17.0%) |
Technology Access in Palmer
Computing Device Access in Palmer
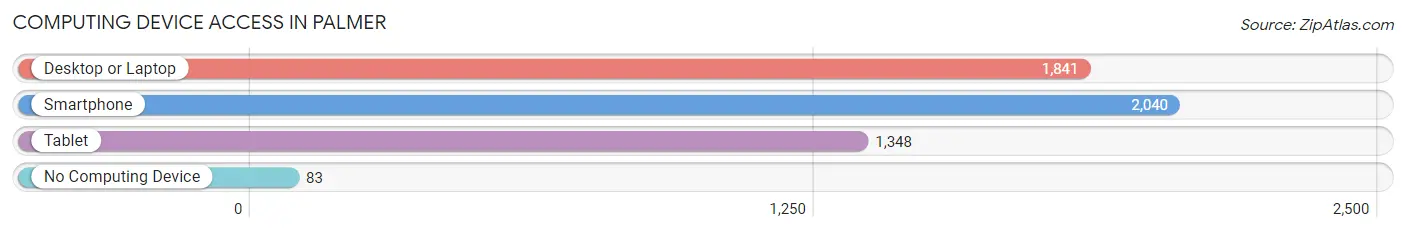
| Device Type | # Households | % Households |
| Desktop or Laptop | 1,841 | 82.5% |
| Smartphone | 2,040 | 91.4% |
| Tablet | 1,348 | 60.4% |
| No Computing Device | 83 | 3.7% |
| Total | 2,232 | 100.0% |
Internet Access in Palmer
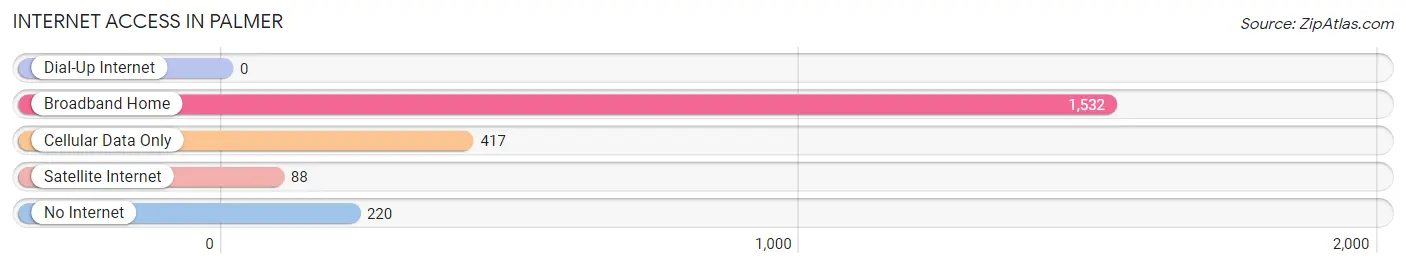
| Internet Type | # Households | % Households |
| Dial-Up Internet | 0 | 0.0% |
| Broadband Home | 1,532 | 68.6% |
| Cellular Data Only | 417 | 18.7% |
| Satellite Internet | 88 | 3.9% |
| No Internet | 220 | 9.9% |
| Total | 2,232 | 100.0% |
Palmer Summary
Palmer, Alaska is a small city located in the Matanuska-Susitna Borough of the state of Alaska. It is located about 40 miles northeast of Anchorage and is the borough seat of the Matanuska-Susitna Borough. The city was founded in 1935 by the Alaska Railroad and was named after the railroad's president, James W. Palmer. The city has a population of about 7,000 people and is the largest city in the Matanuska-Susitna Borough.
Geography
Palmer is located in the Matanuska-Susitna Valley, which is a large glacial valley located in south-central Alaska. The valley is surrounded by the Chugach Mountains to the east and the Talkeetna Mountains to the west. The valley is about 100 miles long and 25 miles wide and is home to the Matanuska Glacier, the largest glacier in the United States. The city of Palmer is located at the northern end of the valley and is situated at an elevation of about 300 feet.
The climate in Palmer is generally mild, with temperatures ranging from the mid-30s in the winter to the mid-60s in the summer. The city receives an average of about 20 inches of precipitation per year, with most of it falling in the form of snow.
Economy
The economy of Palmer is largely based on agriculture and tourism. The city is home to several large farms, including the Matanuska Valley Farm, which is the largest farm in the state of Alaska. The farm produces a variety of vegetables, fruits, and dairy products. The city is also home to several tourist attractions, including the Alaska State Fair, which is held annually in August.
The city is also home to several manufacturing and industrial businesses, including a paper mill, a cannery, and a brewery. The city is also home to several retail stores, restaurants, and other businesses.
Demographics
As of the 2010 census, the population of Palmer was 7,013. The racial makeup of the city was 87.3% White, 0.7% Black or African American, 4.2% Native American, 0.7% Asian, 0.1% Pacific Islander, and 6.9% from two or more races. The median household income in Palmer was $60,945, and the median family income was $68,958.
Palmer is home to several churches, including the First Presbyterian Church, the First Baptist Church, and the Church of Jesus Christ of Latter-day Saints. The city is also home to several schools, including the Matanuska-Susitna Borough School District, the Palmer High School, and the Matanuska-Susitna College.
Conclusion
Palmer, Alaska is a small city located in the Matanuska-Susitna Borough of the state of Alaska. It is located about 40 miles northeast of Anchorage and is the borough seat of the Matanuska-Susitna Borough. The city was founded in 1935 by the Alaska Railroad and was named after the railroad's president, James W. Palmer. The city has a population of about 7,000 people and is the largest city in the Matanuska-Susitna Borough. The economy of Palmer is largely based on agriculture and tourism, and the city is home to several large farms, tourist attractions, manufacturing and industrial businesses, and retail stores. The racial makeup of the city is 87.3% White, 0.7% Black or African American, 4.2% Native American, 0.7% Asian, 0.1% Pacific Islander, and 6.9% from two or more races. The median household income in Palmer was $60,945, and the median family income was $68,958. Palmer is home to several churches, schools, and other businesses.
Common Questions
What is Per Capita Income in Palmer?
Per Capita income in Palmer is $32,155.
What is the Median Family Income in Palmer?
Median Family Income in Palmer is $83,182.
What is the Median Household income in Palmer?
Median Household Income in Palmer is $68,929.
What is Income or Wage Gap in Palmer?
Income or Wage Gap in Palmer is 32.1%.
Women in Palmer earn 67.9 cents for every dollar earned by a man.
What is Inequality or Gini Index in Palmer?
Inequality or Gini Index in Palmer is 0.41.
What is the Total Population of Palmer?
Total Population of Palmer is 6,091.
What is the Total Male Population of Palmer?
Total Male Population of Palmer is 3,110.
What is the Total Female Population of Palmer?
Total Female Population of Palmer is 2,981.
What is the Ratio of Males per 100 Females in Palmer?
There are 104.33 Males per 100 Females in Palmer.
What is the Ratio of Females per 100 Males in Palmer?
There are 95.85 Females per 100 Males in Palmer.
What is the Median Population Age in Palmer?
Median Population Age in Palmer is 31.2 Years.
What is the Average Family Size in Palmer
Average Family Size in Palmer is 3.3 People.
What is the Average Household Size in Palmer
Average Household Size in Palmer is 2.6 People.
How Large is the Labor Force in Palmer?
There are 2,942 People in the Labor Forcein in Palmer.
What is the Percentage of People in the Labor Force in Palmer?
60.9% of People are in the Labor Force in Palmer.
What is the Unemployment Rate in Palmer?
Unemployment Rate in Palmer is 9.6%.