Cavendish, VT Map & Demographics
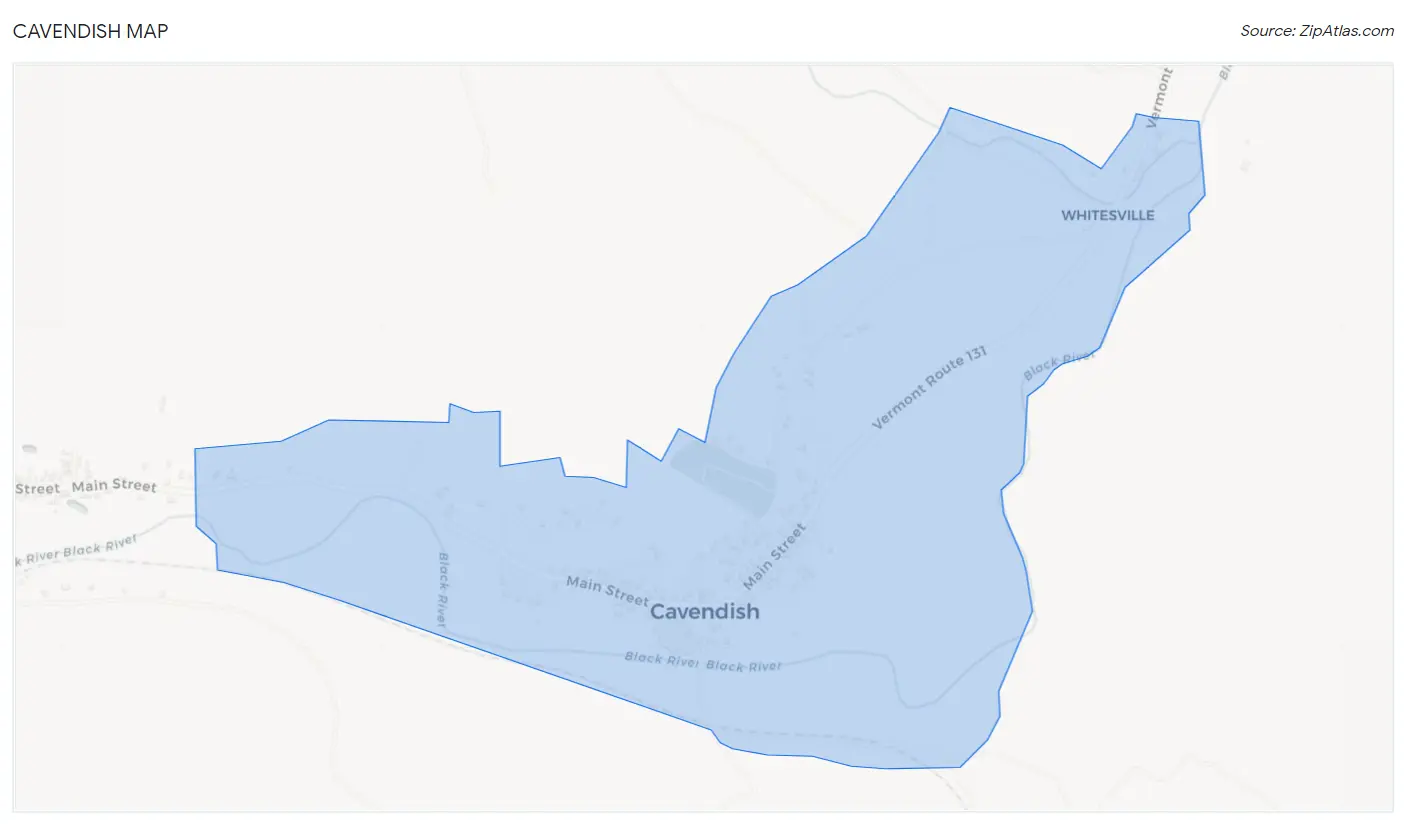
Cavendish Map
Cavendish Overview
$50,029
PER CAPITA INCOME
$145,417
AVG FAMILY INCOME
0.55
INEQUALITY / GINI INDEX
208
TOTAL POPULATION
118
MALE POPULATION
90
FEMALE POPULATION
131.11
MALES / 100 FEMALES
76.27
FEMALES / 100 MALES
35.8
MEDIAN AGE
3.8
AVG FAMILY SIZE
3.2
AVG HOUSEHOLD SIZE
113
LABOR FORCE [ PEOPLE ]
66.1%
PERCENT IN LABOR FORCE
12.4%
UNEMPLOYMENT RATE
Cavendish Zip Codes
Cavendish Area Codes
Income in Cavendish
Income Overview in Cavendish
| Characteristic | Number | Measure |
| Per Capita Income | 208 | $50,029 |
| Median Family Income | 52 | $145,417 |
| Mean Family Income | 52 | $184,821 |
| Median Household Income | 65 | $0 |
| Mean Household Income | 65 | $152,265 |
| Income Deficit | 52 | $0 |
| Wage / Income Gap (%) | 208 | 0.00% |
| Wage / Income Gap ($) | 208 | 100.00¢ per $1 |
| Gini / Inequality Index | 208 | 0.55 |
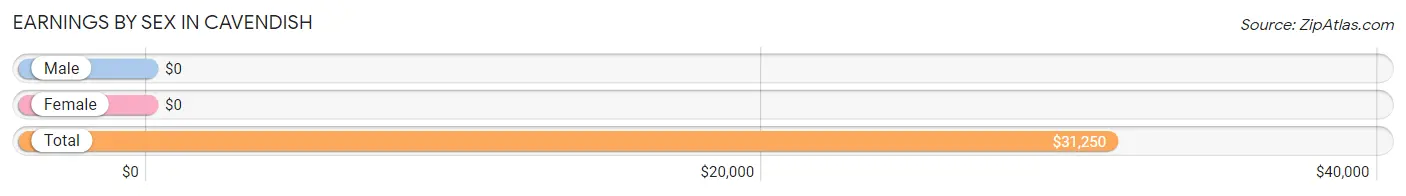
Earnings by Sex in Cavendish
| Sex | Number | Average Earnings |
| Male | 68 (57.6%) | $0 |
| Female | 50 (42.4%) | $0 |
| Total | 118 (100.0%) | $31,250 |
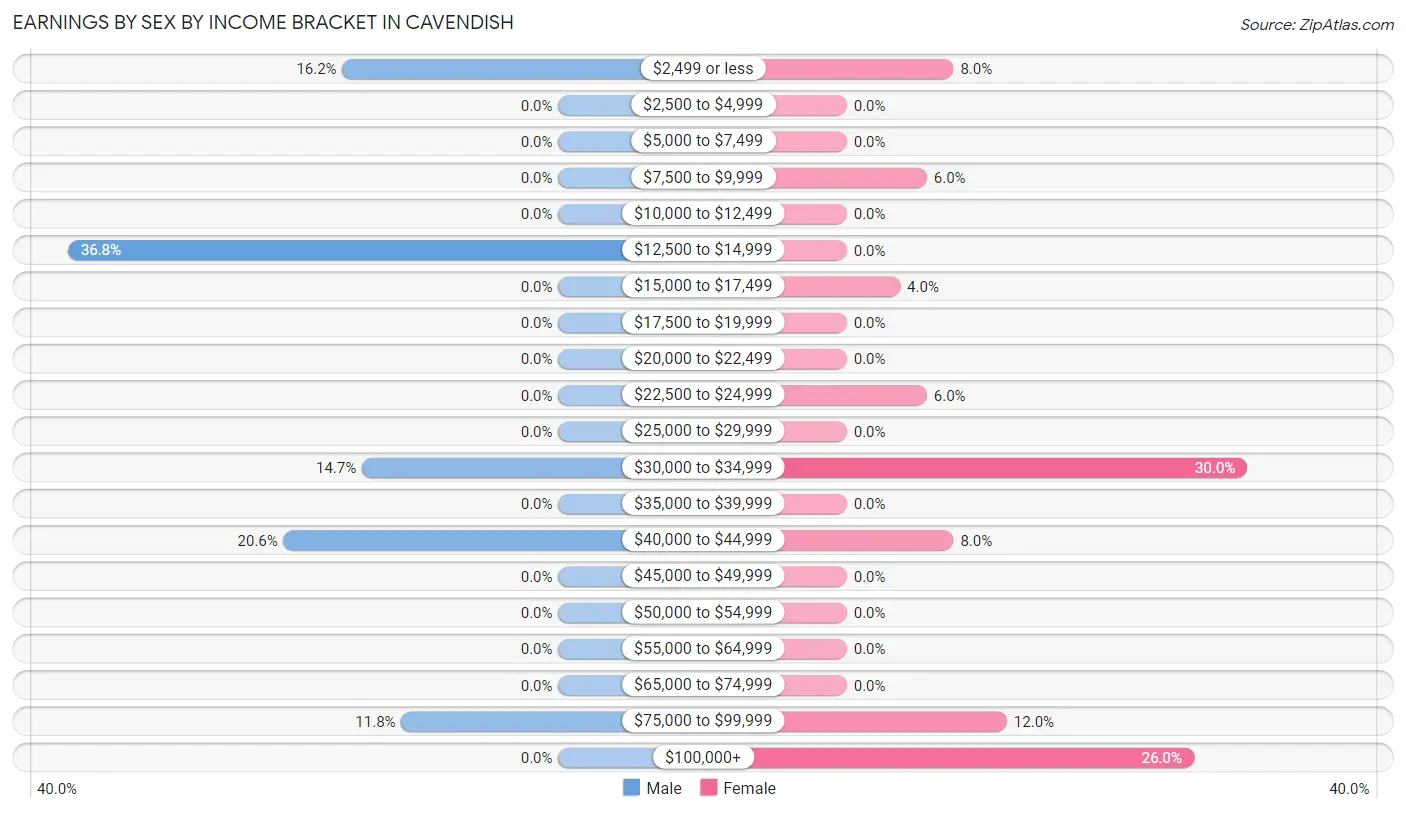
Earnings by Sex by Income Bracket in Cavendish
The most common earnings brackets in Cavendish are $12,500 to $14,999 for men (25 | 36.8%) and $30,000 to $34,999 for women (15 | 30.0%).
| Income | Male | Female |
| $2,499 or less | 11 (16.2%) | 4 (8.0%) |
| $2,500 to $4,999 | 0 (0.0%) | 0 (0.0%) |
| $5,000 to $7,499 | 0 (0.0%) | 0 (0.0%) |
| $7,500 to $9,999 | 0 (0.0%) | 3 (6.0%) |
| $10,000 to $12,499 | 0 (0.0%) | 0 (0.0%) |
| $12,500 to $14,999 | 25 (36.8%) | 0 (0.0%) |
| $15,000 to $17,499 | 0 (0.0%) | 2 (4.0%) |
| $17,500 to $19,999 | 0 (0.0%) | 0 (0.0%) |
| $20,000 to $22,499 | 0 (0.0%) | 0 (0.0%) |
| $22,500 to $24,999 | 0 (0.0%) | 3 (6.0%) |
| $25,000 to $29,999 | 0 (0.0%) | 0 (0.0%) |
| $30,000 to $34,999 | 10 (14.7%) | 15 (30.0%) |
| $35,000 to $39,999 | 0 (0.0%) | 0 (0.0%) |
| $40,000 to $44,999 | 14 (20.6%) | 4 (8.0%) |
| $45,000 to $49,999 | 0 (0.0%) | 0 (0.0%) |
| $50,000 to $54,999 | 0 (0.0%) | 0 (0.0%) |
| $55,000 to $64,999 | 0 (0.0%) | 0 (0.0%) |
| $65,000 to $74,999 | 0 (0.0%) | 0 (0.0%) |
| $75,000 to $99,999 | 8 (11.8%) | 6 (12.0%) |
| $100,000+ | 0 (0.0%) | 13 (26.0%) |
| Total | 68 (100.0%) | 50 (100.0%) |
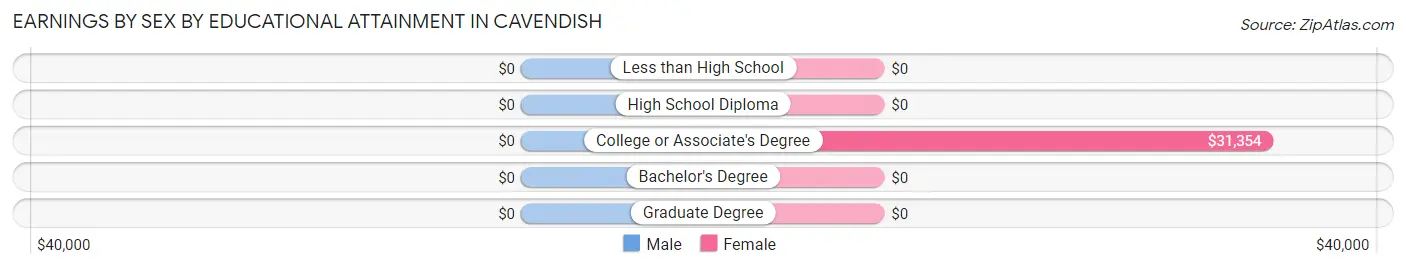
Earnings by Sex by Educational Attainment in Cavendish
| Educational Attainment | Male Income | Female Income |
| Less than High School | - | - |
| High School Diploma | - | - |
| College or Associate's Degree | - | - |
| Bachelor's Degree | - | - |
| Graduate Degree | - | - |
| Total | - | - |
Family Income in Cavendish
Family Income Brackets in Cavendish
According to the Cavendish family income data, there are 15 families falling into the $200,000+ income range, which is the most common income bracket and makes up 28.8% of all families.
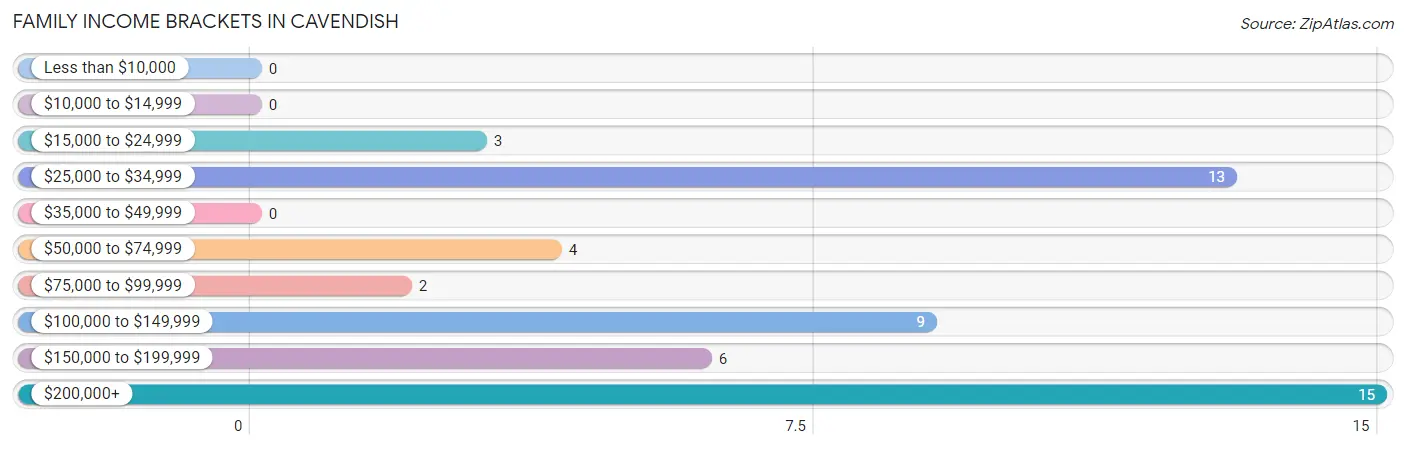
| Income Bracket | # Families | % Families |
| Less than $10,000 | 0 | 0.0% |
| $10,000 to $14,999 | 0 | 0.0% |
| $15,000 to $24,999 | 3 | 5.8% |
| $25,000 to $34,999 | 13 | 25.0% |
| $35,000 to $49,999 | 0 | 0.0% |
| $50,000 to $74,999 | 4 | 7.7% |
| $75,000 to $99,999 | 2 | 3.8% |
| $100,000 to $149,999 | 9 | 17.3% |
| $150,000 to $199,999 | 6 | 11.5% |
| $200,000+ | 15 | 28.8% |
Family Income by Famaliy Size in Cavendish
2-person families (15 | 28.8%) account for the highest median family income in Cavendish with $83,125 per family, while 2-person families (15 | 28.8%) have the highest median income of $41,562 per family member.
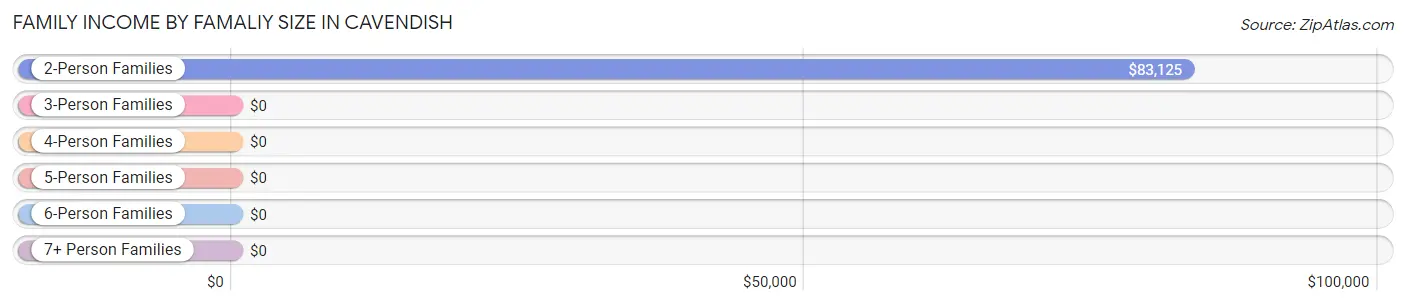
| Income Bracket | # Families | Median Income |
| 2-Person Families | 15 (28.8%) | $83,125 |
| 3-Person Families | 19 (36.5%) | $0 |
| 4-Person Families | 18 (34.6%) | $0 |
| 5-Person Families | 0 (0.0%) | $0 |
| 6-Person Families | 0 (0.0%) | $0 |
| 7+ Person Families | 0 (0.0%) | $0 |
| Total | 52 (100.0%) | $145,417 |
Family Income by Number of Earners in Cavendish
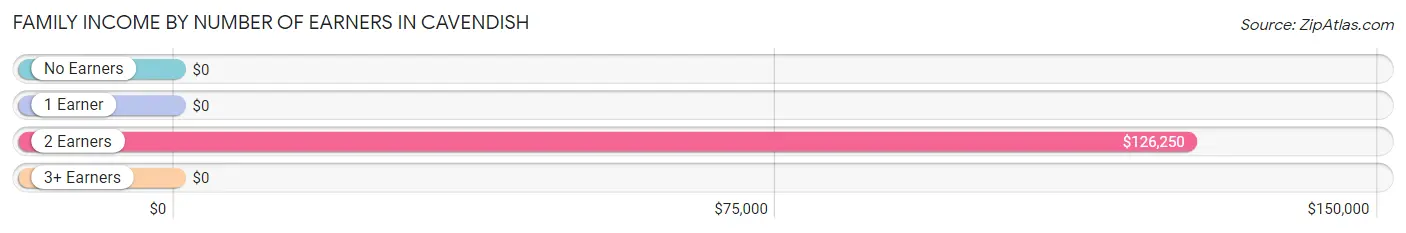
| Number of Earners | # Families | Median Income |
| No Earners | 8 (15.4%) | $0 |
| 1 Earner | 21 (40.4%) | $0 |
| 2 Earners | 5 (9.6%) | $126,250 |
| 3+ Earners | 18 (34.6%) | $0 |
| Total | 52 (100.0%) | $145,417 |
Household Income in Cavendish
Household Income Brackets in Cavendish
With 18 households falling in the category, the $25,000 to $34,999 income range is the most frequent in Cavendish, accounting for 27.7% of all households.
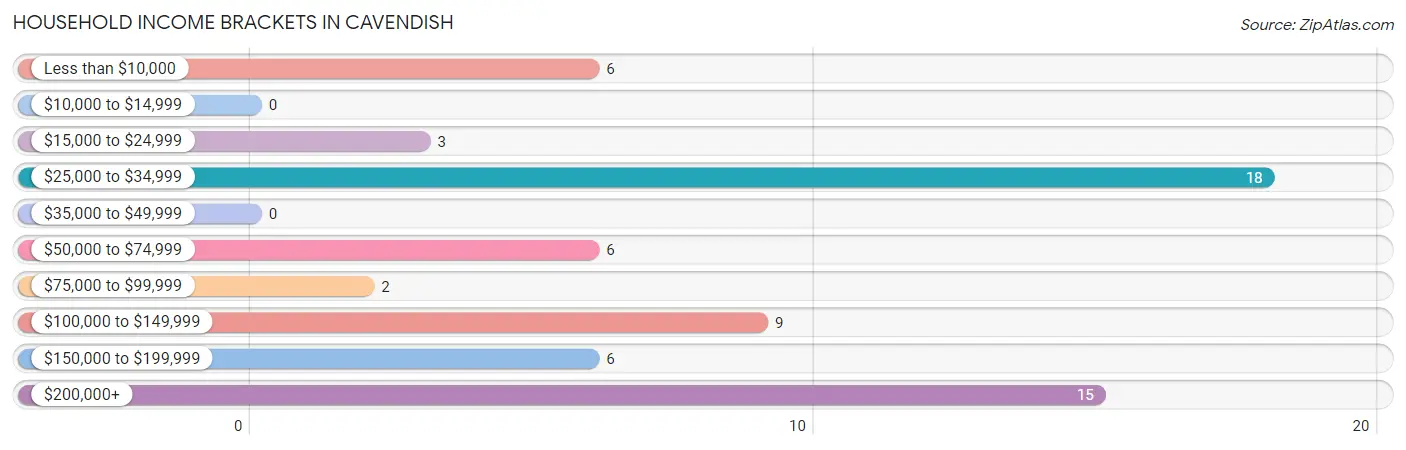
| Income Bracket | # Households | % Households |
| Less than $10,000 | 6 | 9.2% |
| $10,000 to $14,999 | 0 | 0.0% |
| $15,000 to $24,999 | 3 | 4.6% |
| $25,000 to $34,999 | 18 | 27.7% |
| $35,000 to $49,999 | 0 | 0.0% |
| $50,000 to $74,999 | 6 | 9.2% |
| $75,000 to $99,999 | 2 | 3.1% |
| $100,000 to $149,999 | 9 | 13.8% |
| $150,000 to $199,999 | 6 | 9.2% |
| $200,000+ | 15 | 23.1% |
Household Income by Householder Age in Cavendish
The median household income in Cavendish is $0, with the highest median household income of $147,292 found in the 45 to 64 years age bracket for the primary householder. A total of 39 households (60.0%) fall into this category.
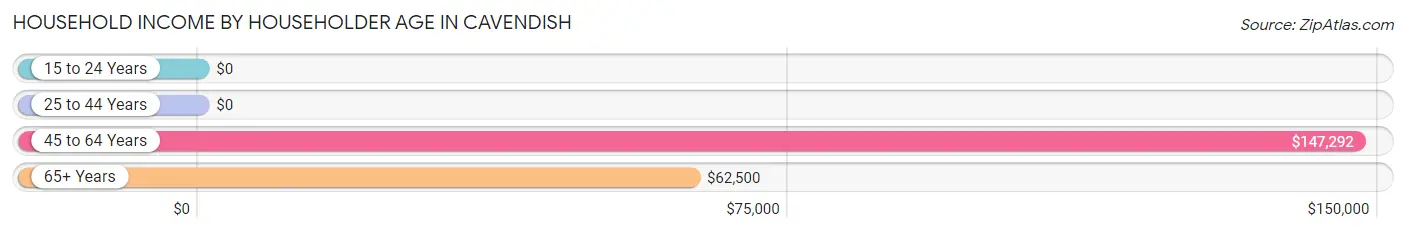
| Income Bracket | # Households | Median Income |
| 15 to 24 Years | 0 (0.0%) | $0 |
| 25 to 44 Years | 16 (24.6%) | $0 |
| 45 to 64 Years | 39 (60.0%) | $147,292 |
| 65+ Years | 10 (15.4%) | $62,500 |
| Total | 65 (100.0%) | $0 |
Poverty in Cavendish
Income Below Poverty by Sex and Age in Cavendish
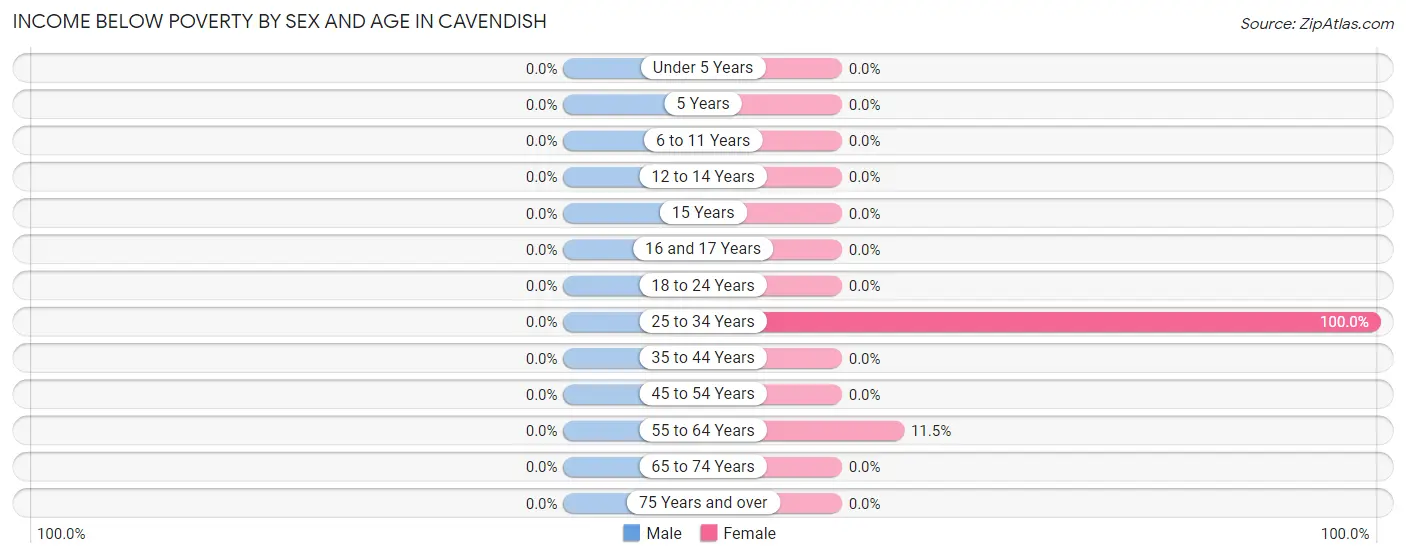
| Age Bracket | Male | Female |
| Under 5 Years | 0 (0.0%) | 0 (0.0%) |
| 5 Years | 0 (0.0%) | 0 (0.0%) |
| 6 to 11 Years | 0 (0.0%) | 0 (0.0%) |
| 12 to 14 Years | 0 (0.0%) | 0 (0.0%) |
| 15 Years | 0 (0.0%) | 0 (0.0%) |
| 16 and 17 Years | 0 (0.0%) | 0 (0.0%) |
| 18 to 24 Years | 0 (0.0%) | 0 (0.0%) |
| 25 to 34 Years | 0 (0.0%) | 3 (100.0%) |
| 35 to 44 Years | 0 (0.0%) | 0 (0.0%) |
| 45 to 54 Years | 0 (0.0%) | 0 (0.0%) |
| 55 to 64 Years | 0 (0.0%) | 3 (11.5%) |
| 65 to 74 Years | 0 (0.0%) | 0 (0.0%) |
| 75 Years and over | 0 (0.0%) | 0 (0.0%) |
| Total | 0 (0.0%) | 6 (6.7%) |
Income Above Poverty by Sex and Age in Cavendish
According to the poverty statistics in Cavendish, males aged 6 to 11 years and females aged 6 to 11 years are the age groups that are most secure financially, with 100.0% of males and 100.0% of females in these age groups living above the poverty line.
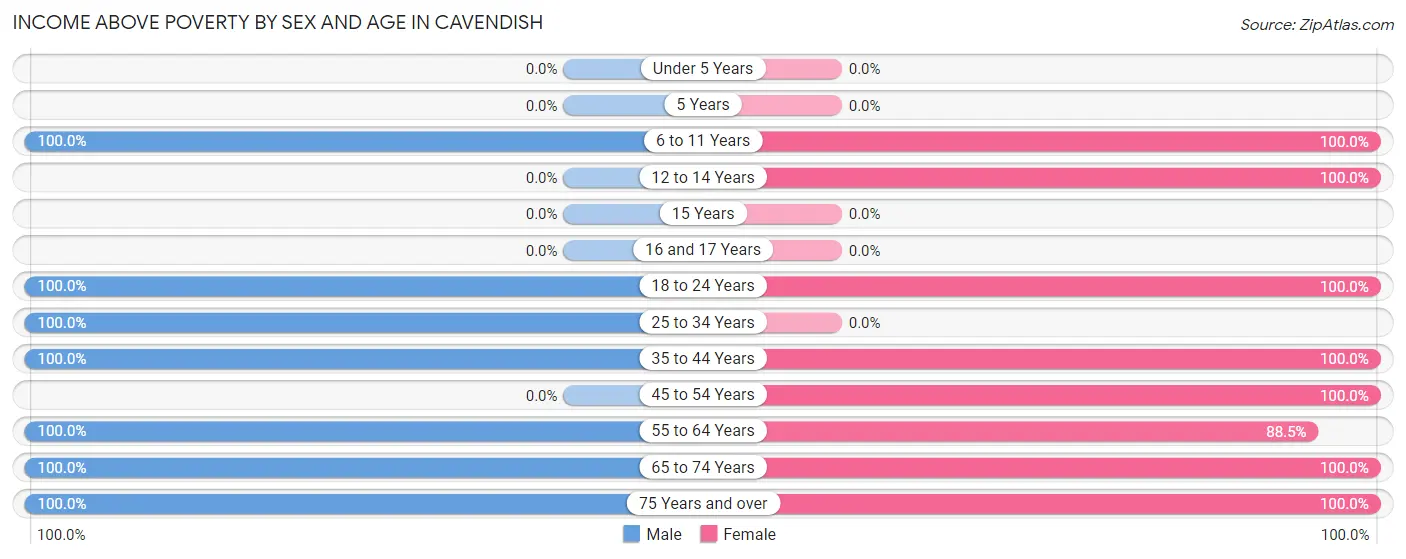
| Age Bracket | Male | Female |
| Under 5 Years | 0 (0.0%) | 0 (0.0%) |
| 5 Years | 0 (0.0%) | 0 (0.0%) |
| 6 to 11 Years | 15 (100.0%) | 15 (100.0%) |
| 12 to 14 Years | 0 (0.0%) | 7 (100.0%) |
| 15 Years | 0 (0.0%) | 0 (0.0%) |
| 16 and 17 Years | 0 (0.0%) | 0 (0.0%) |
| 18 to 24 Years | 27 (100.0%) | 2 (100.0%) |
| 25 to 34 Years | 25 (100.0%) | 0 (0.0%) |
| 35 to 44 Years | 13 (100.0%) | 12 (100.0%) |
| 45 to 54 Years | 0 (0.0%) | 13 (100.0%) |
| 55 to 64 Years | 28 (100.0%) | 23 (88.5%) |
| 65 to 74 Years | 3 (100.0%) | 7 (100.0%) |
| 75 Years and over | 7 (100.0%) | 5 (100.0%) |
| Total | 118 (100.0%) | 84 (93.3%) |
Income Below Poverty Among Married-Couple Families in Cavendish
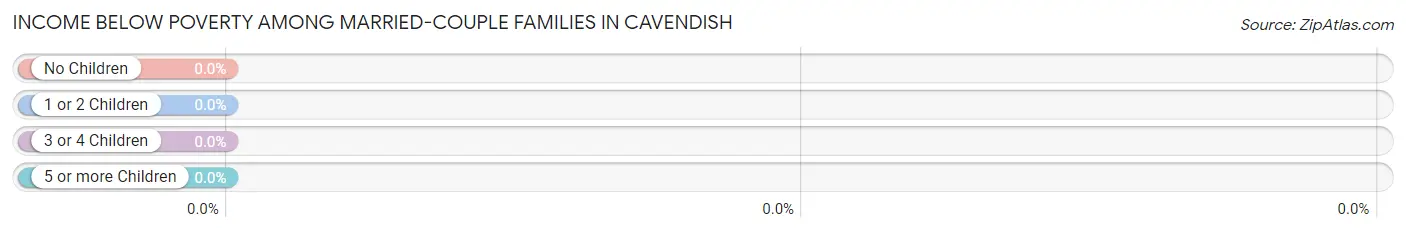
| Children | Above Poverty | Below Poverty |
| No Children | 29 (100.0%) | 0 (0.0%) |
| 1 or 2 Children | 19 (100.0%) | 0 (0.0%) |
| 3 or 4 Children | 0 (0.0%) | 0 (0.0%) |
| 5 or more Children | 0 (0.0%) | 0 (0.0%) |
| Total | 48 (100.0%) | 0 (0.0%) |
Income Below Poverty Among Single-Parent Households in Cavendish
| Children | Single Father | Single Mother |
| No Children | 0 (0.0%) | 0 (0.0%) |
| 1 or 2 Children | 0 (0.0%) | 0 (0.0%) |
| 3 or 4 Children | 0 (0.0%) | 0 (0.0%) |
| 5 or more Children | 0 (0.0%) | 0 (0.0%) |
| Total | 0 (0.0%) | 0 (0.0%) |
Income Below Poverty Among Married-Couple vs Single-Parent Households in Cavendish
| Children | Married-Couple Families | Single-Parent Households |
| No Children | 0 (0.0%) | 0 (0.0%) |
| 1 or 2 Children | 0 (0.0%) | 0 (0.0%) |
| 3 or 4 Children | 0 (0.0%) | 0 (0.0%) |
| 5 or more Children | 0 (0.0%) | 0 (0.0%) |
| Total | 0 (0.0%) | 0 (0.0%) |
Race in Cavendish
The most populous races in Cavendish are , and White / Caucasian (208 | 100.0%).
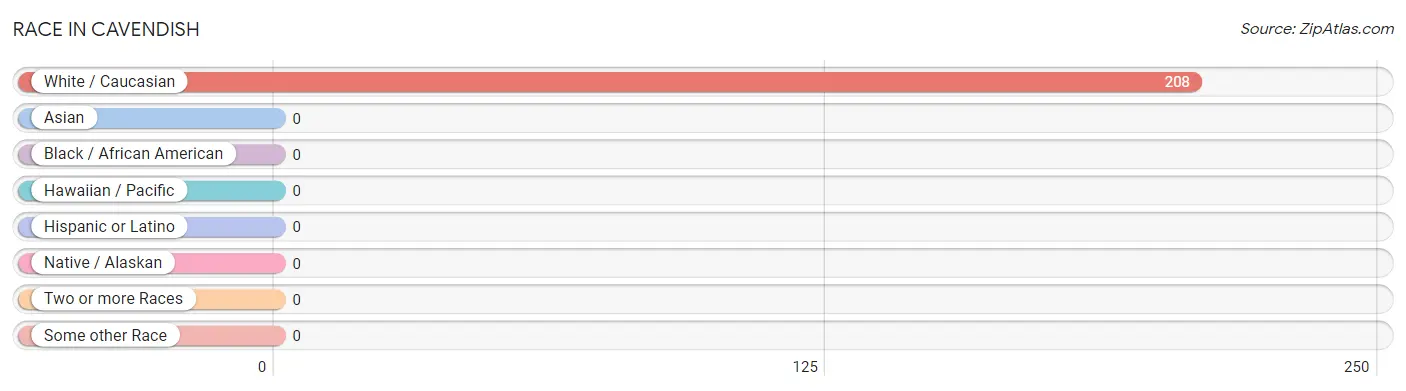
| Race | # Population | % Population |
| Asian | 0 | 0.0% |
| Black / African American | 0 | 0.0% |
| Hawaiian / Pacific | 0 | 0.0% |
| Hispanic or Latino | 0 | 0.0% |
| Native / Alaskan | 0 | 0.0% |
| White / Caucasian | 208 | 100.0% |
| Two or more Races | 0 | 0.0% |
| Some other Race | 0 | 0.0% |
| Total | 208 | 100.0% |
Ancestry in Cavendish
The most populous ancestries reported in Cavendish are English (97 | 46.6%), Irish (43 | 20.7%), French (23 | 11.1%), Welsh (13 | 6.2%), and Greek (10 | 4.8%), together accounting for 89.4% of all Cavendish residents.
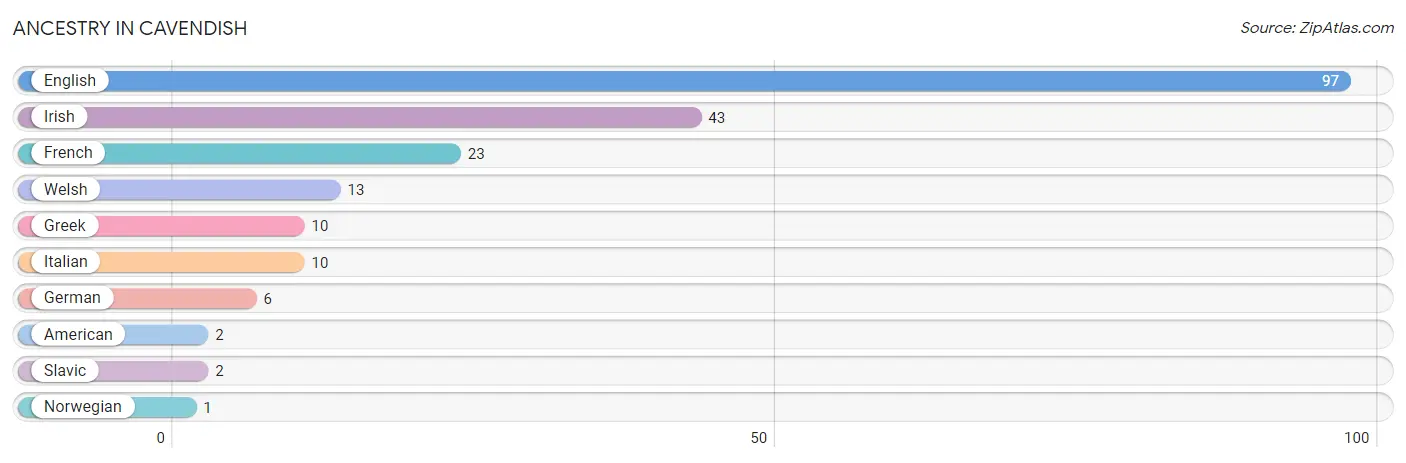
| Ancestry | # Population | % Population |
| American | 2 | 1.0% |
| English | 97 | 46.6% |
| French | 23 | 11.1% |
| German | 6 | 2.9% |
| Greek | 10 | 4.8% |
| Irish | 43 | 20.7% |
| Italian | 10 | 4.8% |
| Norwegian | 1 | 0.5% |
| Slavic | 2 | 1.0% |
| Welsh | 13 | 6.2% | View All 10 Rows |
Immigrants in Cavendish

| Immigration Origin | # Population | % Population | View All 0 Rows |
Sex and Age in Cavendish
Sex and Age in Cavendish
The most populous age groups in Cavendish are 60 to 64 Years (28 | 23.7%) for men and 60 to 64 Years (23 | 25.6%) for women.
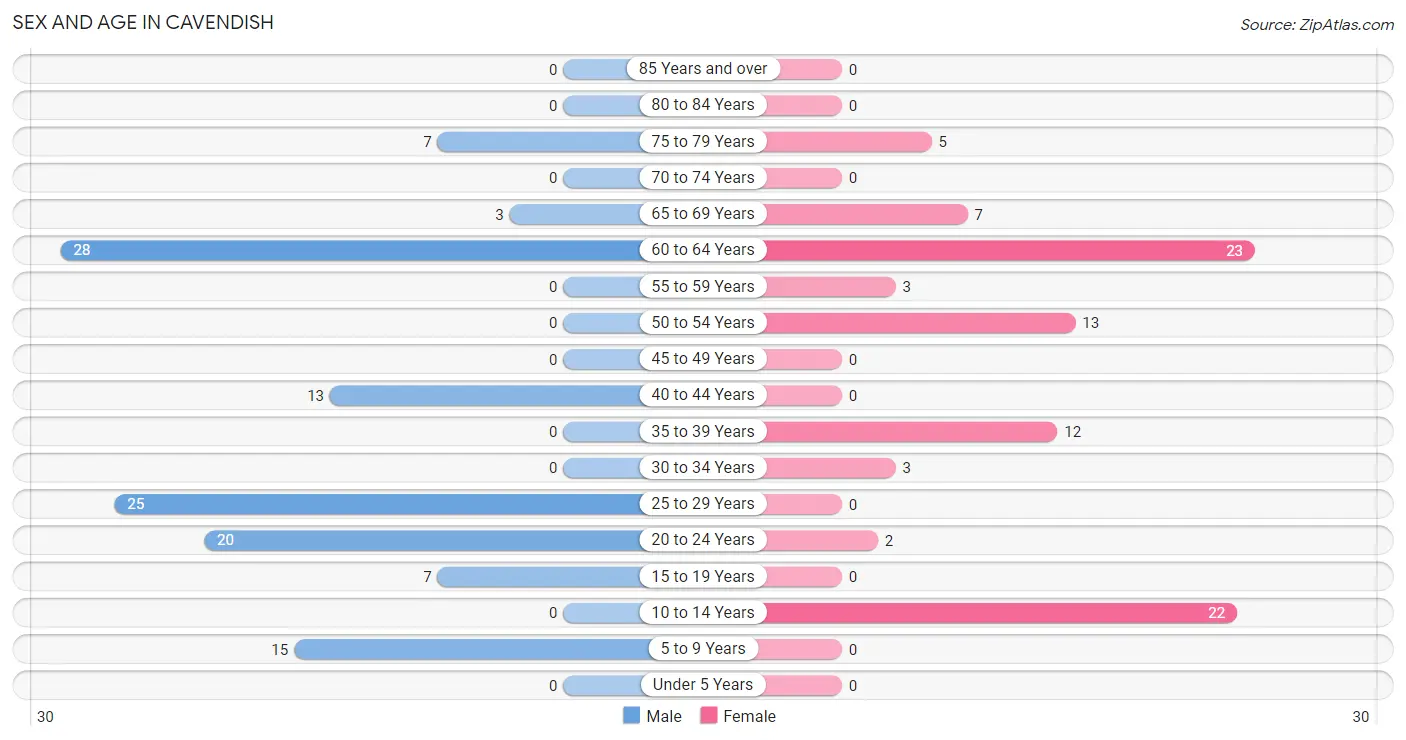
| Age Bracket | Male | Female |
| Under 5 Years | 0 (0.0%) | 0 (0.0%) |
| 5 to 9 Years | 15 (12.7%) | 0 (0.0%) |
| 10 to 14 Years | 0 (0.0%) | 22 (24.4%) |
| 15 to 19 Years | 7 (5.9%) | 0 (0.0%) |
| 20 to 24 Years | 20 (17.0%) | 2 (2.2%) |
| 25 to 29 Years | 25 (21.2%) | 0 (0.0%) |
| 30 to 34 Years | 0 (0.0%) | 3 (3.3%) |
| 35 to 39 Years | 0 (0.0%) | 12 (13.3%) |
| 40 to 44 Years | 13 (11.0%) | 0 (0.0%) |
| 45 to 49 Years | 0 (0.0%) | 0 (0.0%) |
| 50 to 54 Years | 0 (0.0%) | 13 (14.4%) |
| 55 to 59 Years | 0 (0.0%) | 3 (3.3%) |
| 60 to 64 Years | 28 (23.7%) | 23 (25.6%) |
| 65 to 69 Years | 3 (2.5%) | 7 (7.8%) |
| 70 to 74 Years | 0 (0.0%) | 0 (0.0%) |
| 75 to 79 Years | 7 (5.9%) | 5 (5.6%) |
| 80 to 84 Years | 0 (0.0%) | 0 (0.0%) |
| 85 Years and over | 0 (0.0%) | 0 (0.0%) |
| Total | 118 (100.0%) | 90 (100.0%) |
Families and Households in Cavendish
Median Family Size in Cavendish
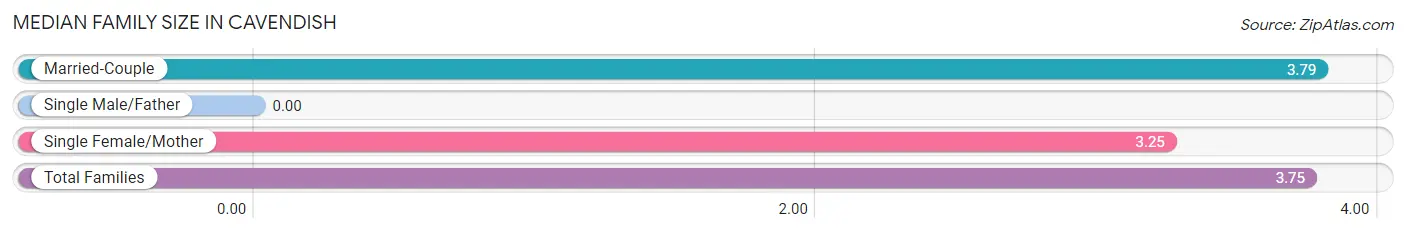
| Family Type | # Families | Family Size |
| Married-Couple | 48 (92.3%) | 3.79 |
| Single Male/Father | 0 (0.0%) | - |
| Single Female/Mother | 4 (7.7%) | 3.25 |
| Total Families | 52 (100.0%) | 3.75 |
Median Household Size in Cavendish
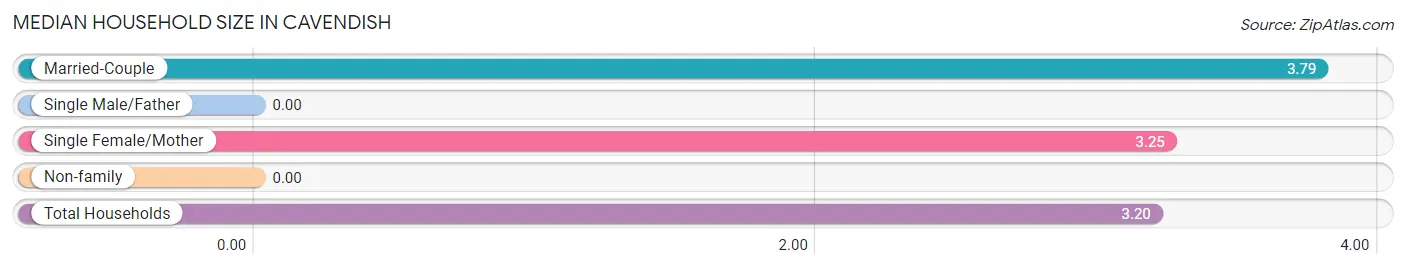
| Household Type | # Households | Household Size |
| Married-Couple | 48 (73.9%) | 3.79 |
| Single Male/Father | 0 (0.0%) | - |
| Single Female/Mother | 4 (6.1%) | 3.25 |
| Non-family | 13 (20.0%) | - |
| Total Households | 65 (100.0%) | 3.20 |
Household Size by Marriage Status in Cavendish
Out of a total of 65 households in Cavendish, 52 (80.0%) are family households, while 13 (20.0%) are nonfamily households. The most numerous type of family households are 3-person households, comprising 19, and the most common type of nonfamily households are 1-person households, comprising 13.
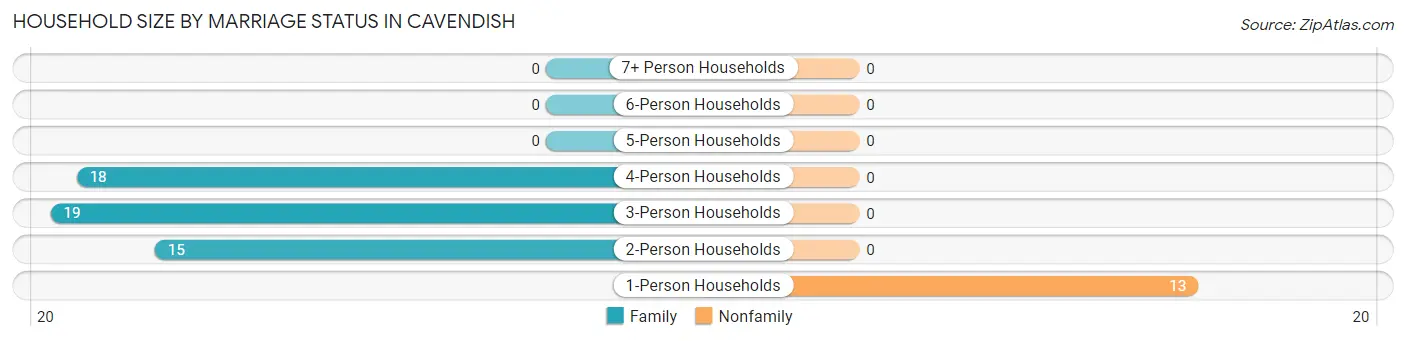
| Household Size | Family Households | Nonfamily Households |
| 1-Person Households | - | 13 (20.0%) |
| 2-Person Households | 15 (23.1%) | 0 (0.0%) |
| 3-Person Households | 19 (29.2%) | 0 (0.0%) |
| 4-Person Households | 18 (27.7%) | 0 (0.0%) |
| 5-Person Households | 0 (0.0%) | 0 (0.0%) |
| 6-Person Households | 0 (0.0%) | 0 (0.0%) |
| 7+ Person Households | 0 (0.0%) | 0 (0.0%) |
| Total | 52 (80.0%) | 13 (20.0%) |
Female Fertility in Cavendish
Fertility by Age in Cavendish
| Age Bracket | Women with Births | Births / 1,000 Women |
| 15 to 19 years | 0 (0.0%) | 0.0 |
| 20 to 34 years | 0 (0.0%) | 0.0 |
| 35 to 50 years | 0 (0.0%) | 0.0 |
| Total | 0 (0.0%) | 0.0 |
Fertility by Age by Marriage Status in Cavendish
| Age Bracket | Married | Unmarried |
| 15 to 19 years | 0 (0.0%) | 0 (0.0%) |
| 20 to 34 years | 0 (0.0%) | 0 (0.0%) |
| 35 to 50 years | 0 (0.0%) | 0 (0.0%) |
| Total | 0 (0.0%) | 0 (0.0%) |
Fertility by Education in Cavendish
| Educational Attainment | Women with Births | Births / 1,000 Women |
| Less than High School | 0 (0.0%) | 0.0 |
| High School Diploma | 0 (0.0%) | 0.0 |
| College or Associate's Degree | 0 (0.0%) | 0.0 |
| Bachelor's Degree | 0 (0.0%) | 0.0 |
| Graduate Degree | 0 (0.0%) | 0.0 |
| Total | 0 (0.0%) | 0.0 |
Fertility by Education by Marriage Status in Cavendish
| Educational Attainment | Married | Unmarried |
| Less than High School | 0 (0.0%) | 0 (0.0%) |
| High School Diploma | 0 (0.0%) | 0 (0.0%) |
| College or Associate's Degree | 0 (0.0%) | 0 (0.0%) |
| Bachelor's Degree | 0 (0.0%) | 0 (0.0%) |
| Graduate Degree | 0 (0.0%) | 0 (0.0%) |
| Total | 0 (0.0%) | 0 (0.0%) |
Employment Characteristics in Cavendish
Employment by Class of Employer in Cavendish
Among the 97 employed individuals in Cavendish, private company employees (93 | 95.9%), not-for-profit organizations (3 | 3.1%), and self-employed (not incorporated) (1 | 1.0%) make up the most common classes of employment.
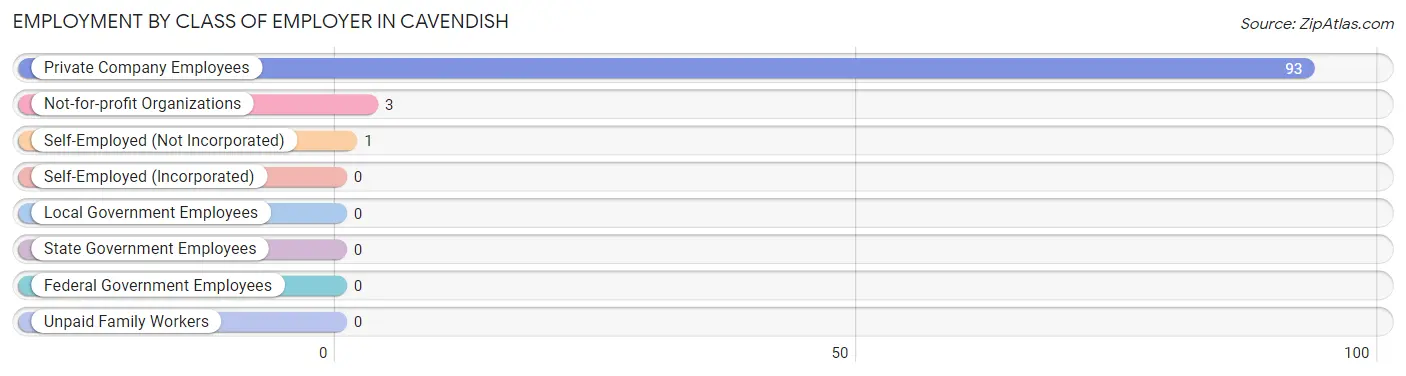
| Employer Class | # Employees | % Employees |
| Private Company Employees | 93 | 95.9% |
| Self-Employed (Incorporated) | 0 | 0.0% |
| Self-Employed (Not Incorporated) | 1 | 1.0% |
| Not-for-profit Organizations | 3 | 3.1% |
| Local Government Employees | 0 | 0.0% |
| State Government Employees | 0 | 0.0% |
| Federal Government Employees | 0 | 0.0% |
| Unpaid Family Workers | 0 | 0.0% |
| Total | 97 | 100.0% |
Employment Status by Age in Cavendish
According to the labor force statistics for Cavendish, out of the total population over 16 years of age (171), 66.1% or 113 individuals are in the labor force, with 12.4% or 14 of them unemployed. The age group with the highest labor force participation rate is 25 to 29 years, with 100.0% or 25 individuals in the labor force. Within the labor force, the 55 to 59 years age range has the highest percentage of unemployed individuals, with 100.0% or 3 of them being unemployed.
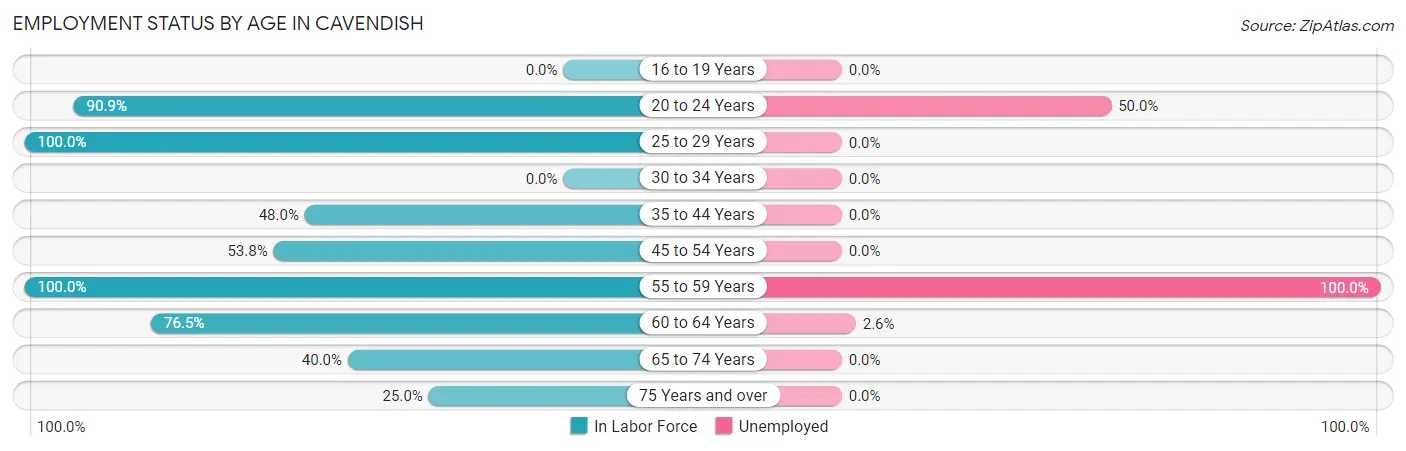
| Age Bracket | In Labor Force | Unemployed |
| 16 to 19 Years | 0 (0.0%) | 0 (0.0%) |
| 20 to 24 Years | 20 (90.9%) | 10 (50.0%) |
| 25 to 29 Years | 25 (100.0%) | 0 (0.0%) |
| 30 to 34 Years | 0 (0.0%) | 0 (0.0%) |
| 35 to 44 Years | 12 (48.0%) | 0 (0.0%) |
| 45 to 54 Years | 7 (53.8%) | 0 (0.0%) |
| 55 to 59 Years | 3 (100.0%) | 3 (100.0%) |
| 60 to 64 Years | 39 (76.5%) | 1 (2.6%) |
| 65 to 74 Years | 4 (40.0%) | 0 (0.0%) |
| 75 Years and over | 3 (25.0%) | 0 (0.0%) |
| Total | 113 (66.1%) | 14 (12.4%) |
Employment Status by Educational Attainment in Cavendish
According to labor force statistics for Cavendish, 71.7% of individuals (86) out of the total population between 25 and 64 years of age (120) are in the labor force, with 4.7% or 4 of them being unemployed. The group with the highest labor force participation rate are those with the educational attainment of bachelor's degree or higher, with 87.0% or 20 individuals in the labor force. Within the labor force, individuals with college / associate degree education have the highest percentage of unemployment, with 10.8% or 4 of them being unemployed.
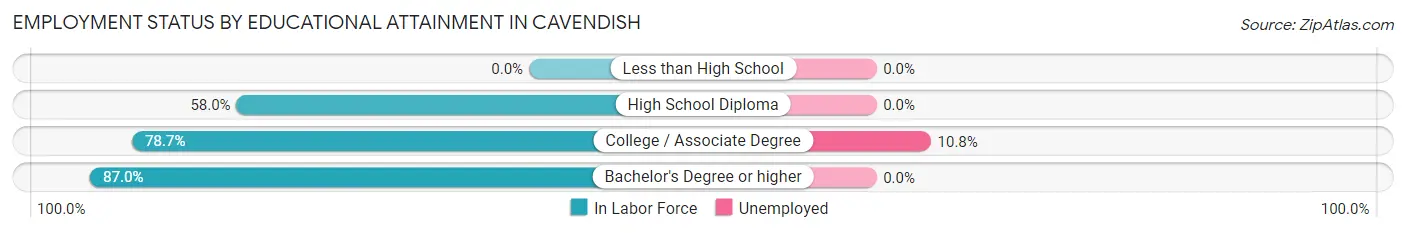
| Educational Attainment | In Labor Force | Unemployed |
| Less than High School | 0 (0.0%) | 0 (0.0%) |
| High School Diploma | 29 (58.0%) | 0 (0.0%) |
| College / Associate Degree | 37 (78.7%) | 5 (10.8%) |
| Bachelor's Degree or higher | 20 (87.0%) | 0 (0.0%) |
| Total | 86 (71.7%) | 6 (4.7%) |
Employment Occupations by Sex in Cavendish
Management, Business, Science and Arts Occupations
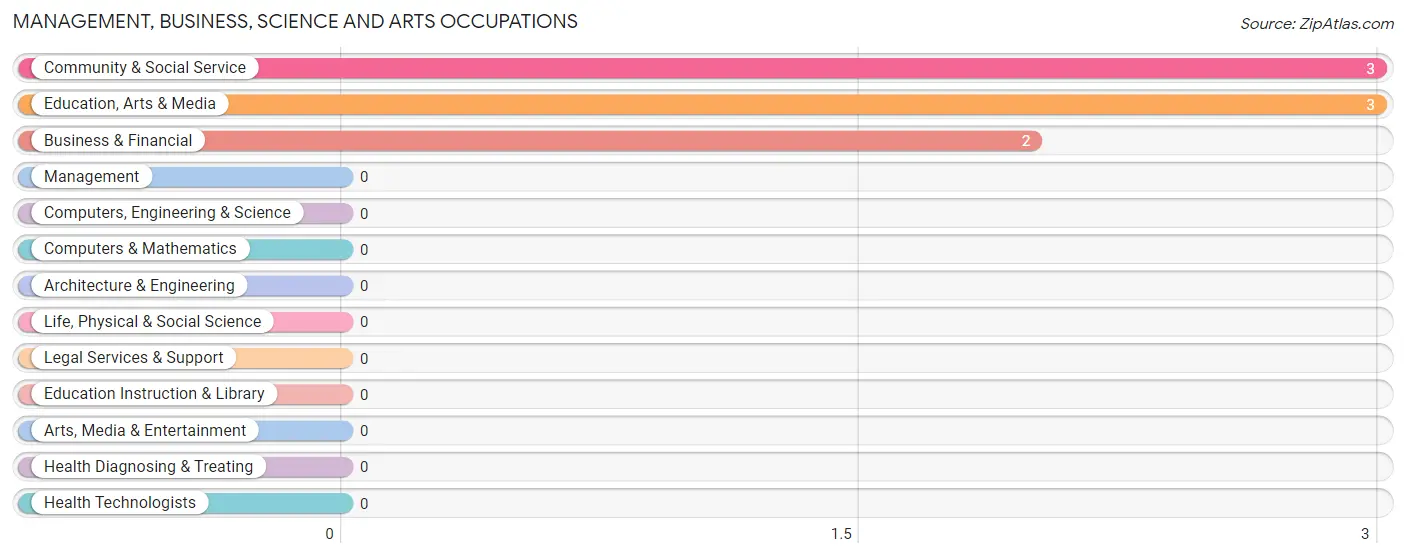
The most common Management, Business, Science and Arts occupations in Cavendish are Community & Social Service (3 | 3.0%), Education, Arts & Media (3 | 3.0%), and Business & Financial (2 | 2.0%).
Management, Business, Science and Arts Occupations by Sex
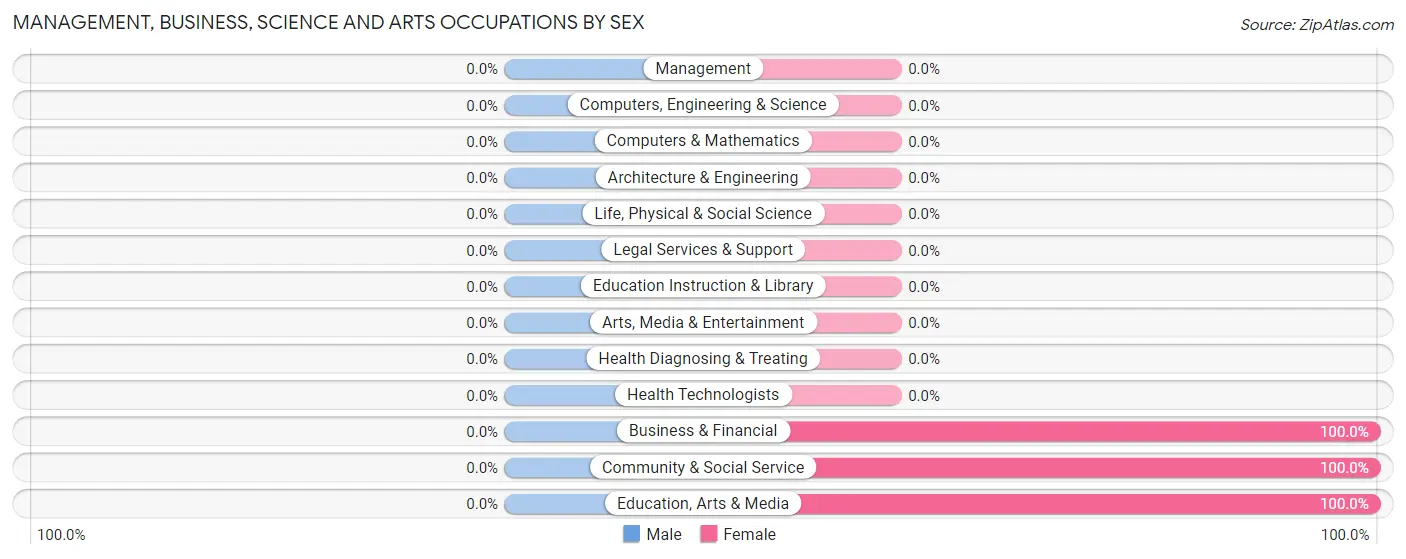
| Occupation | Male | Female |
| Management | 0 (0.0%) | 0 (0.0%) |
| Business & Financial | 0 (0.0%) | 2 (100.0%) |
| Computers, Engineering & Science | 0 (0.0%) | 0 (0.0%) |
| Computers & Mathematics | 0 (0.0%) | 0 (0.0%) |
| Architecture & Engineering | 0 (0.0%) | 0 (0.0%) |
| Life, Physical & Social Science | 0 (0.0%) | 0 (0.0%) |
| Community & Social Service | 0 (0.0%) | 3 (100.0%) |
| Education, Arts & Media | 0 (0.0%) | 3 (100.0%) |
| Legal Services & Support | 0 (0.0%) | 0 (0.0%) |
| Education Instruction & Library | 0 (0.0%) | 0 (0.0%) |
| Arts, Media & Entertainment | 0 (0.0%) | 0 (0.0%) |
| Health Diagnosing & Treating | 0 (0.0%) | 0 (0.0%) |
| Health Technologists | 0 (0.0%) | 0 (0.0%) |
| Total (Category) | 0 (0.0%) | 5 (100.0%) |
| Total (Overall) | 54 (54.5%) | 45 (45.5%) |
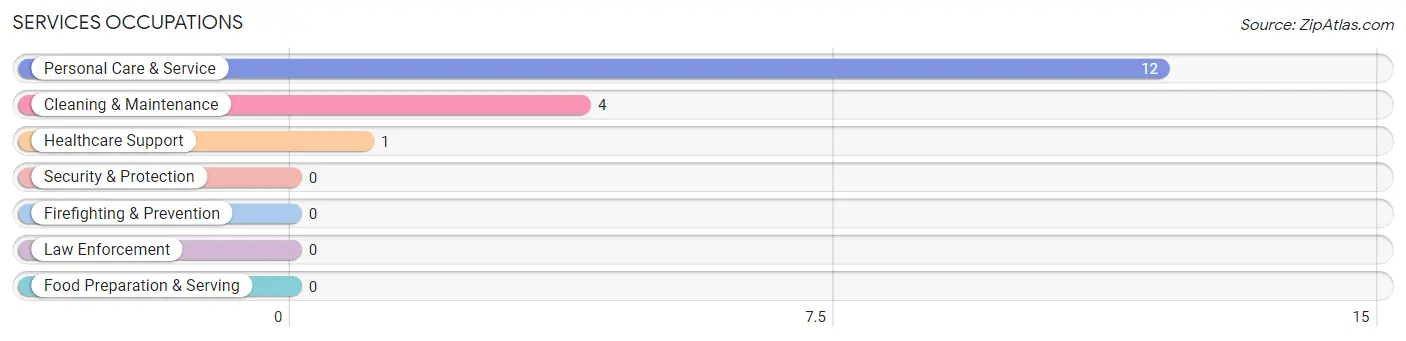
Services Occupations
The most common Services occupations in Cavendish are Personal Care & Service (12 | 12.1%), Cleaning & Maintenance (4 | 4.0%), and Healthcare Support (1 | 1.0%).
Services Occupations by Sex
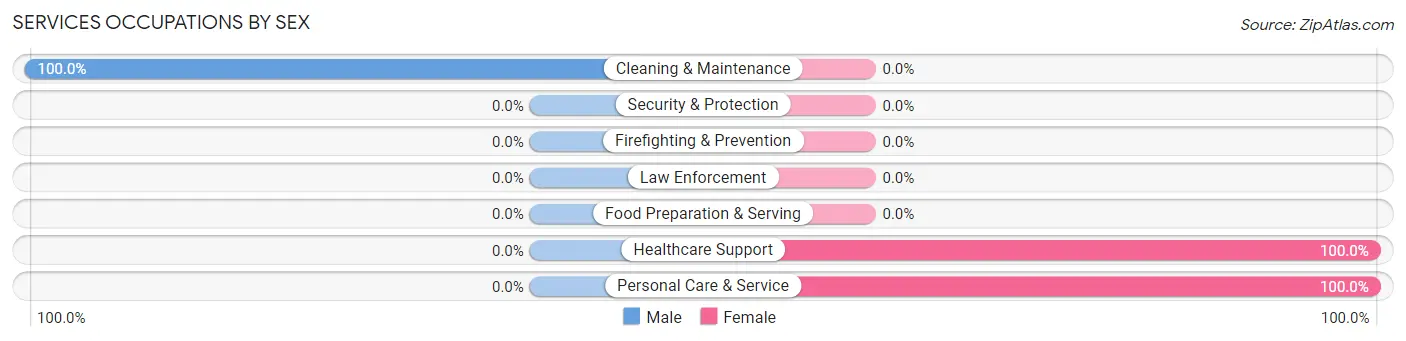
| Occupation | Male | Female |
| Healthcare Support | 0 (0.0%) | 1 (100.0%) |
| Security & Protection | 0 (0.0%) | 0 (0.0%) |
| Firefighting & Prevention | 0 (0.0%) | 0 (0.0%) |
| Law Enforcement | 0 (0.0%) | 0 (0.0%) |
| Food Preparation & Serving | 0 (0.0%) | 0 (0.0%) |
| Cleaning & Maintenance | 4 (100.0%) | 0 (0.0%) |
| Personal Care & Service | 0 (0.0%) | 12 (100.0%) |
| Total (Category) | 4 (23.5%) | 13 (76.5%) |
| Total (Overall) | 54 (54.5%) | 45 (45.5%) |
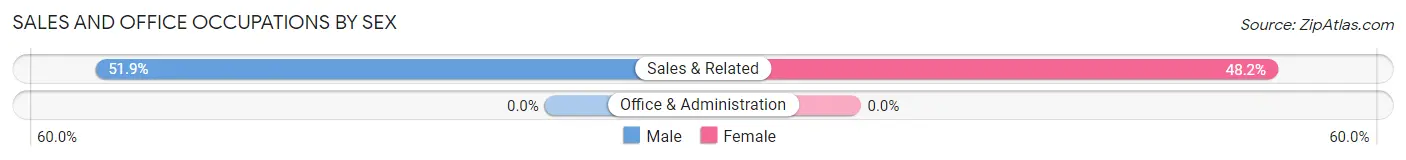
Sales and Office Occupations
The most common Sales and Office occupations in Cavendish are , and Sales & Related (27 | 27.3%).
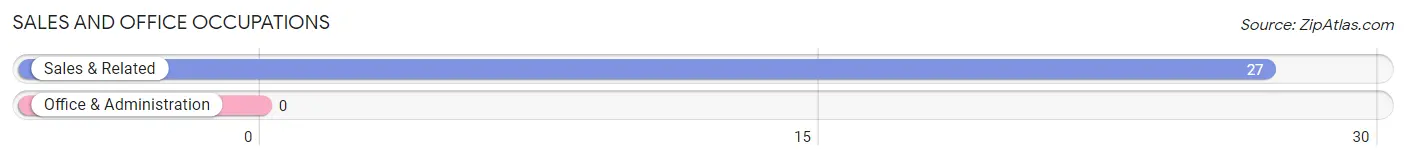
Sales and Office Occupations by Sex
| Occupation | Male | Female |
| Sales & Related | 14 (51.8%) | 13 (48.1%) |
| Office & Administration | 0 (0.0%) | 0 (0.0%) |
| Total (Category) | 14 (51.8%) | 13 (48.1%) |
| Total (Overall) | 54 (54.5%) | 45 (45.5%) |
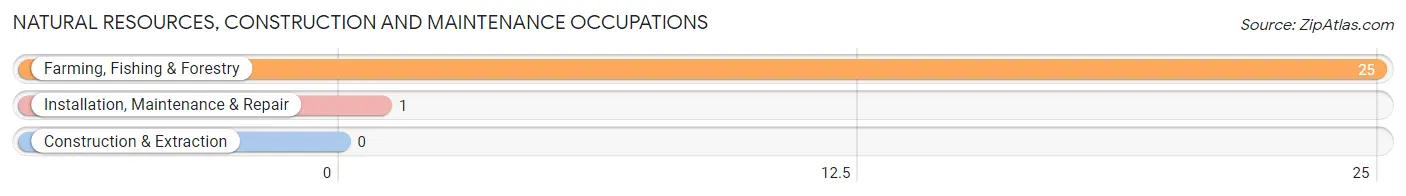
Natural Resources, Construction and Maintenance Occupations
The most common Natural Resources, Construction and Maintenance occupations in Cavendish are Farming, Fishing & Forestry (25 | 25.3%), and Installation, Maintenance & Repair (1 | 1.0%).
Natural Resources, Construction and Maintenance Occupations by Sex
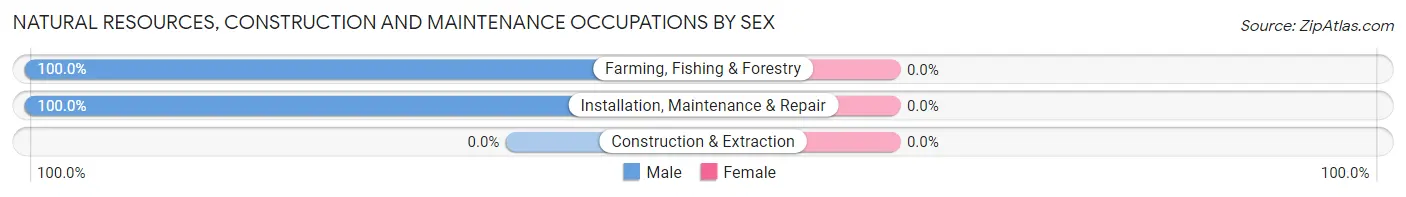
| Occupation | Male | Female |
| Farming, Fishing & Forestry | 25 (100.0%) | 0 (0.0%) |
| Construction & Extraction | 0 (0.0%) | 0 (0.0%) |
| Installation, Maintenance & Repair | 1 (100.0%) | 0 (0.0%) |
| Total (Category) | 26 (100.0%) | 0 (0.0%) |
| Total (Overall) | 54 (54.5%) | 45 (45.5%) |
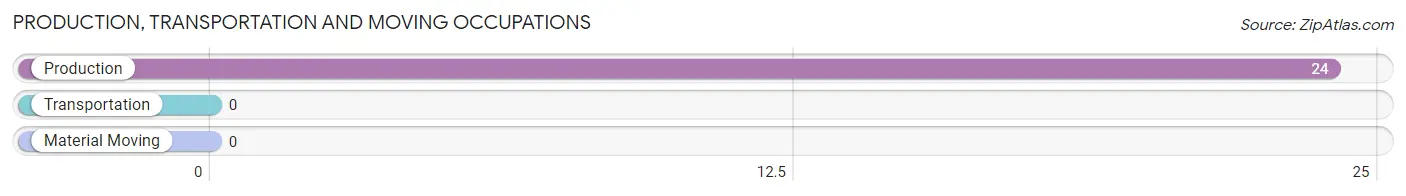
Production, Transportation and Moving Occupations
The most common Production, Transportation and Moving occupations in Cavendish are , and Production (24 | 24.2%).
Production, Transportation and Moving Occupations by Sex
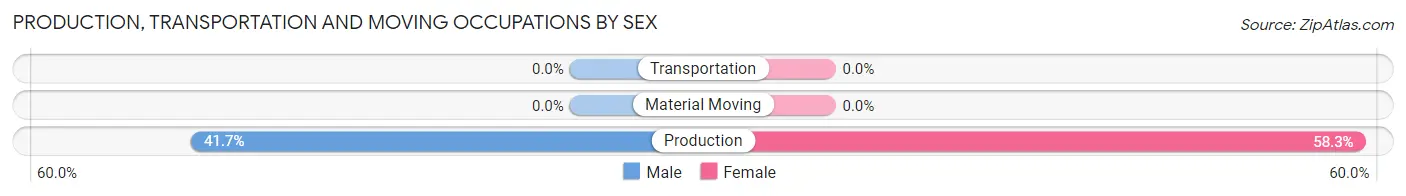
| Occupation | Male | Female |
| Production | 10 (41.7%) | 14 (58.3%) |
| Transportation | 0 (0.0%) | 0 (0.0%) |
| Material Moving | 0 (0.0%) | 0 (0.0%) |
| Total (Category) | 10 (41.7%) | 14 (58.3%) |
| Total (Overall) | 54 (54.5%) | 45 (45.5%) |
Employment Industries by Sex in Cavendish
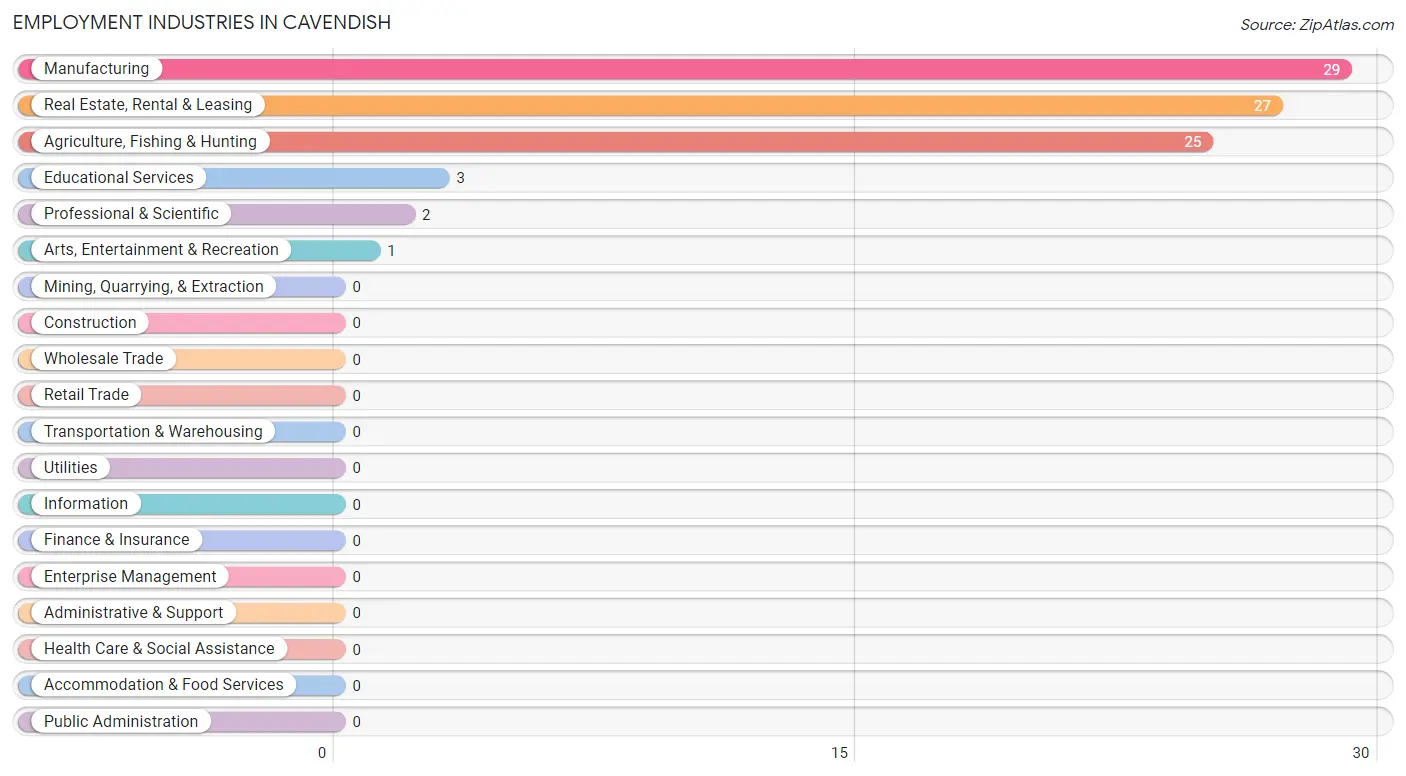
Employment Industries in Cavendish
The major employment industries in Cavendish include Manufacturing (29 | 29.3%), Real Estate, Rental & Leasing (27 | 27.3%), Agriculture, Fishing & Hunting (25 | 25.3%), Educational Services (3 | 3.0%), and Professional & Scientific (2 | 2.0%).
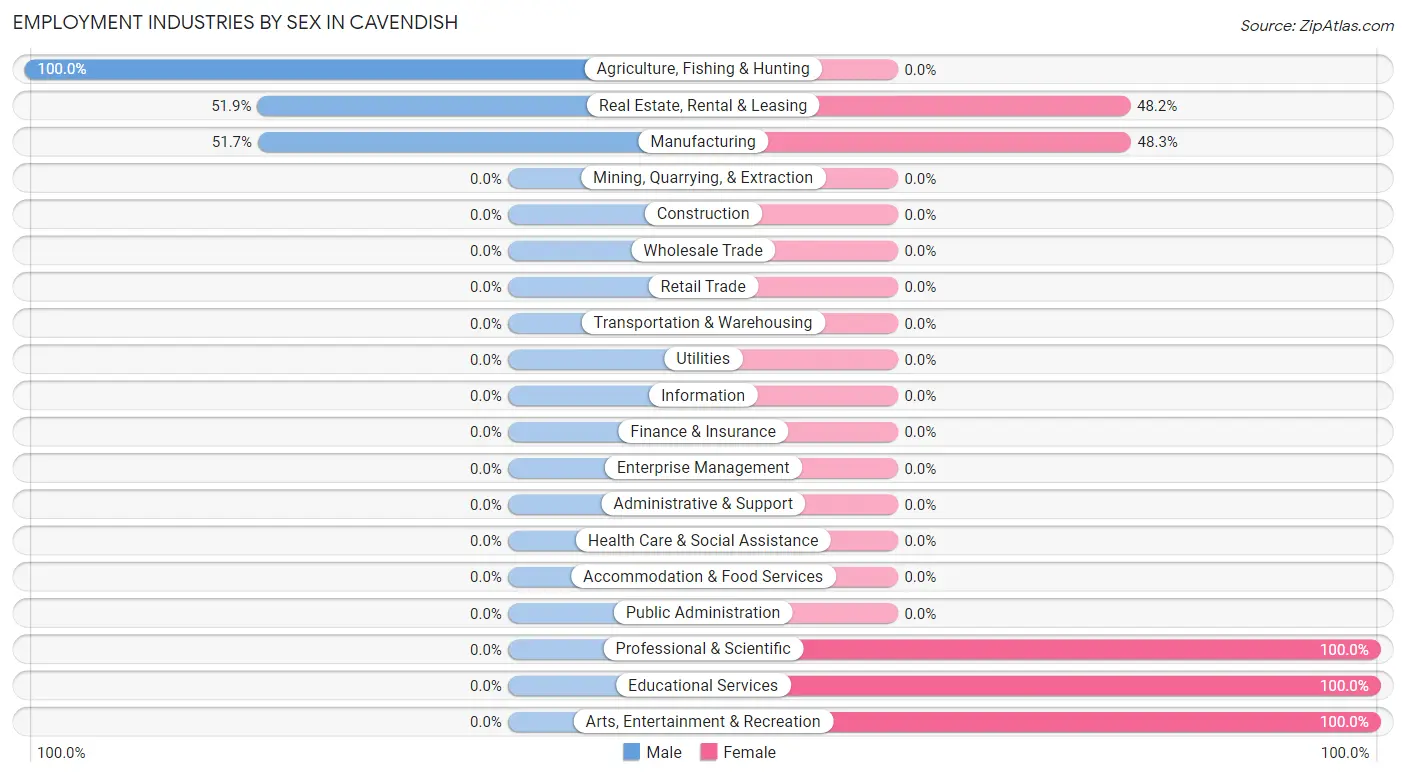
Employment Industries by Sex in Cavendish
The Cavendish industries that see more men than women are Agriculture, Fishing & Hunting (100.0%), Real Estate, Rental & Leasing (51.8%), and Manufacturing (51.7%), whereas the industries that tend to have a higher number of women are Professional & Scientific (100.0%), Educational Services (100.0%), and Arts, Entertainment & Recreation (100.0%).
| Industry | Male | Female |
| Agriculture, Fishing & Hunting | 25 (100.0%) | 0 (0.0%) |
| Mining, Quarrying, & Extraction | 0 (0.0%) | 0 (0.0%) |
| Construction | 0 (0.0%) | 0 (0.0%) |
| Manufacturing | 15 (51.7%) | 14 (48.3%) |
| Wholesale Trade | 0 (0.0%) | 0 (0.0%) |
| Retail Trade | 0 (0.0%) | 0 (0.0%) |
| Transportation & Warehousing | 0 (0.0%) | 0 (0.0%) |
| Utilities | 0 (0.0%) | 0 (0.0%) |
| Information | 0 (0.0%) | 0 (0.0%) |
| Finance & Insurance | 0 (0.0%) | 0 (0.0%) |
| Real Estate, Rental & Leasing | 14 (51.8%) | 13 (48.1%) |
| Professional & Scientific | 0 (0.0%) | 2 (100.0%) |
| Enterprise Management | 0 (0.0%) | 0 (0.0%) |
| Administrative & Support | 0 (0.0%) | 0 (0.0%) |
| Educational Services | 0 (0.0%) | 3 (100.0%) |
| Health Care & Social Assistance | 0 (0.0%) | 0 (0.0%) |
| Arts, Entertainment & Recreation | 0 (0.0%) | 1 (100.0%) |
| Accommodation & Food Services | 0 (0.0%) | 0 (0.0%) |
| Public Administration | 0 (0.0%) | 0 (0.0%) |
| Total | 54 (54.5%) | 45 (45.5%) |
Education in Cavendish
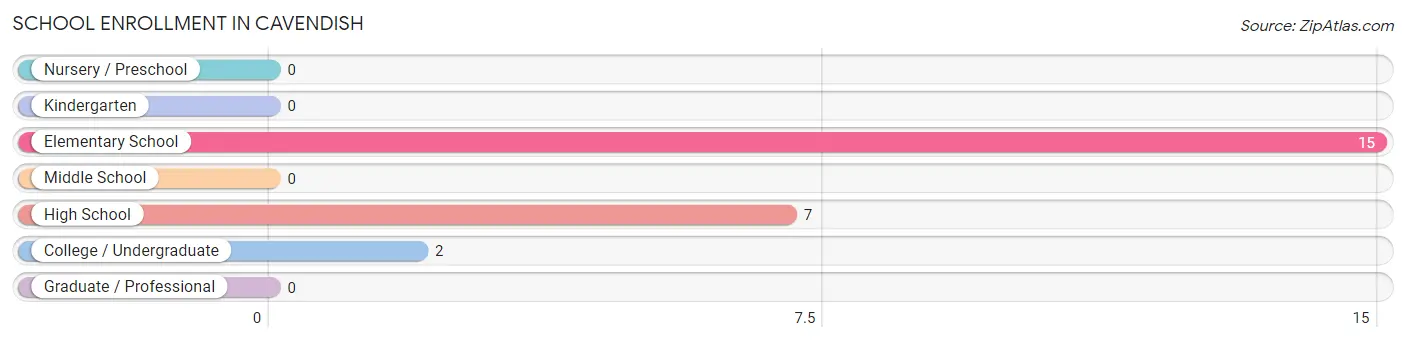
School Enrollment in Cavendish
The most common levels of schooling among the 24 students in Cavendish are elementary school (15 | 62.5%), high school (7 | 29.2%), and college / undergraduate (2 | 8.3%).
| School Level | # Students | % Students |
| Nursery / Preschool | 0 | 0.0% |
| Kindergarten | 0 | 0.0% |
| Elementary School | 15 | 62.5% |
| Middle School | 0 | 0.0% |
| High School | 7 | 29.2% |
| College / Undergraduate | 2 | 8.3% |
| Graduate / Professional | 0 | 0.0% |
| Total | 24 | 100.0% |
School Enrollment by Age by Funding Source in Cavendish
Out of a total of 24 students who are enrolled in schools in Cavendish, 2 (8.3%) attend a private institution, while the remaining 22 (91.7%) are enrolled in public schools. The age group of 20 to 24 year olds has the highest likelihood of being enrolled in private schools, with 2 (100.0% in the age bracket) enrolled. Conversely, the age group of 10 to 14 year olds has the lowest likelihood of being enrolled in a private school, with 22 (100.0% in the age bracket) attending a public institution.
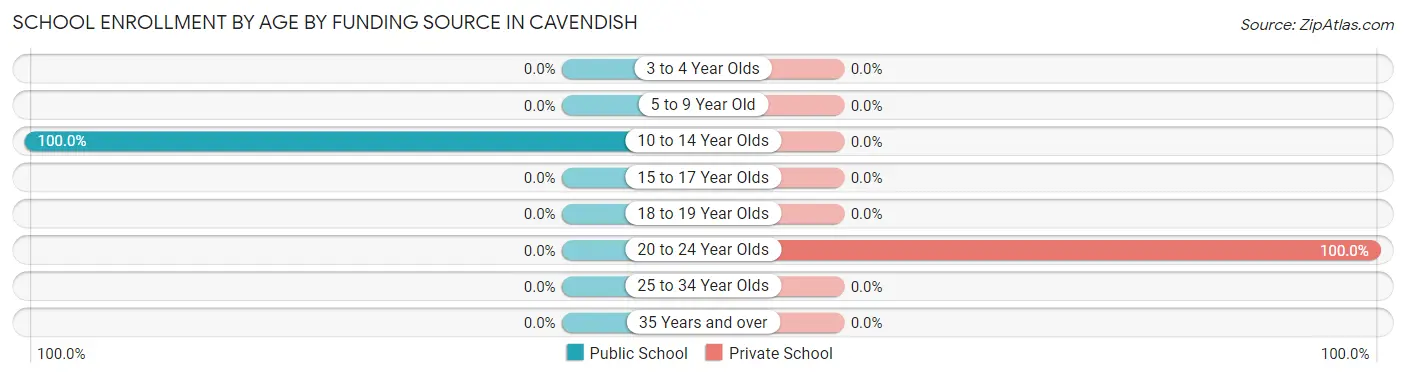
| Age Bracket | Public School | Private School |
| 3 to 4 Year Olds | 0 (0.0%) | 0 (0.0%) |
| 5 to 9 Year Old | 0 (0.0%) | 0 (0.0%) |
| 10 to 14 Year Olds | 22 (100.0%) | 0 (0.0%) |
| 15 to 17 Year Olds | 0 (0.0%) | 0 (0.0%) |
| 18 to 19 Year Olds | 0 (0.0%) | 0 (0.0%) |
| 20 to 24 Year Olds | 0 (0.0%) | 2 (100.0%) |
| 25 to 34 Year Olds | 0 (0.0%) | 0 (0.0%) |
| 35 Years and over | 0 (0.0%) | 0 (0.0%) |
| Total | 22 (91.7%) | 2 (8.3%) |
Educational Attainment by Field of Study in Cavendish
Psychology (15 | 46.9%), literature & languages (6 | 18.8%), bio, nature & agricultural (3 | 9.4%), arts & humanities (3 | 9.4%), and computers & mathematics (2 | 6.2%) are the most common fields of study among 32 individuals in Cavendish who have obtained a bachelor's degree or higher.
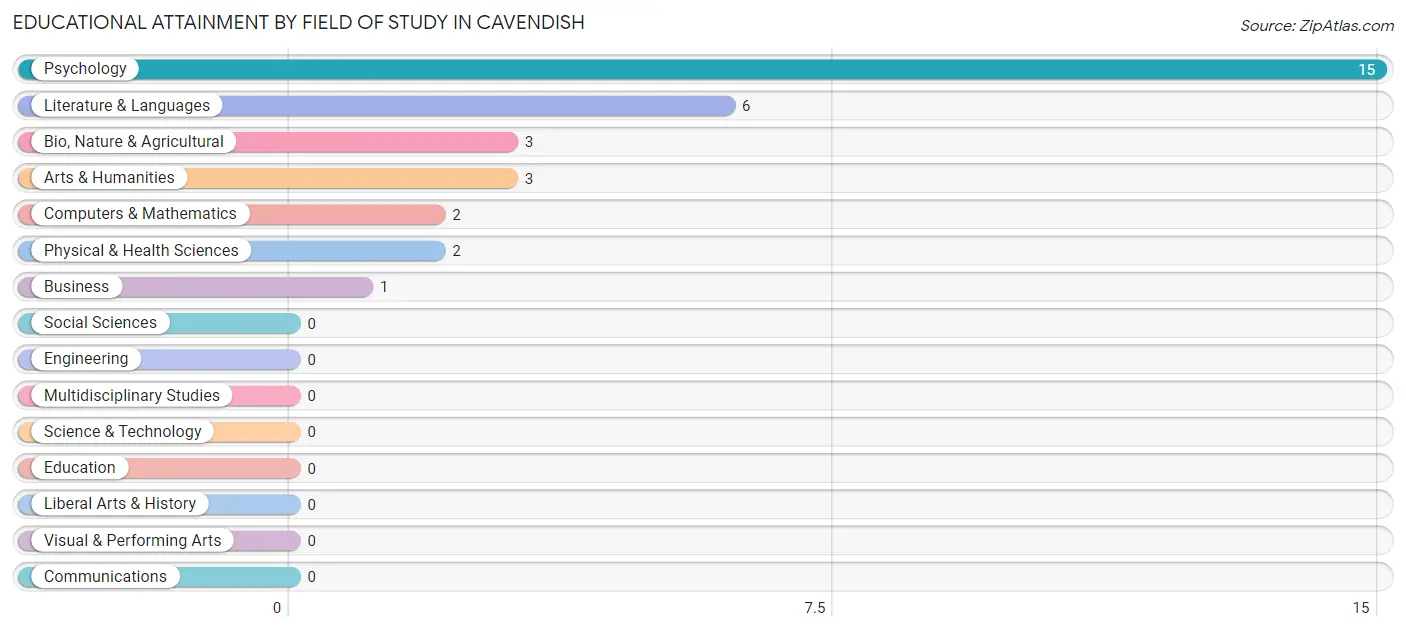
| Field of Study | # Graduates | % Graduates |
| Computers & Mathematics | 2 | 6.2% |
| Bio, Nature & Agricultural | 3 | 9.4% |
| Physical & Health Sciences | 2 | 6.2% |
| Psychology | 15 | 46.9% |
| Social Sciences | 0 | 0.0% |
| Engineering | 0 | 0.0% |
| Multidisciplinary Studies | 0 | 0.0% |
| Science & Technology | 0 | 0.0% |
| Business | 1 | 3.1% |
| Education | 0 | 0.0% |
| Literature & Languages | 6 | 18.8% |
| Liberal Arts & History | 0 | 0.0% |
| Visual & Performing Arts | 0 | 0.0% |
| Communications | 0 | 0.0% |
| Arts & Humanities | 3 | 9.4% |
| Total | 32 | 100.0% |
Transportation & Commute in Cavendish
Vehicle Availability by Sex in Cavendish
The most prevalent vehicle ownership categories in Cavendish are males with 3 vehicles (49, accounting for 90.7%) and females with 3 vehicles (23, making up 113.9%).
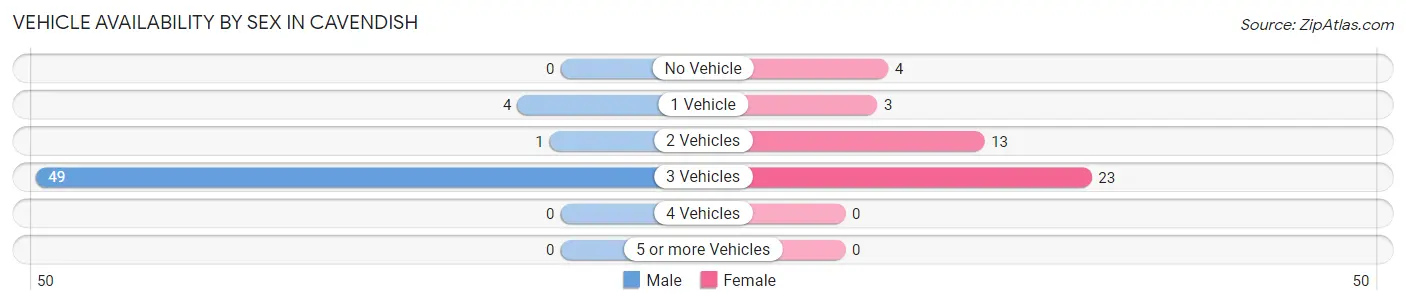
| Vehicles Available | Male | Female |
| No Vehicle | 0 (0.0%) | 4 (9.3%) |
| 1 Vehicle | 4 (7.4%) | 3 (7.0%) |
| 2 Vehicles | 1 (1.8%) | 13 (30.2%) |
| 3 Vehicles | 49 (90.7%) | 23 (53.5%) |
| 4 Vehicles | 0 (0.0%) | 0 (0.0%) |
| 5 or more Vehicles | 0 (0.0%) | 0 (0.0%) |
| Total | 54 (100.0%) | 43 (100.0%) |
Commute Time in Cavendish
The most frequently occuring commute durations in Cavendish are 20 to 24 minutes (38 commuters, 39.6%), 15 to 19 minutes (22 commuters, 22.9%), and 45 to 59 minutes (18 commuters, 18.8%).
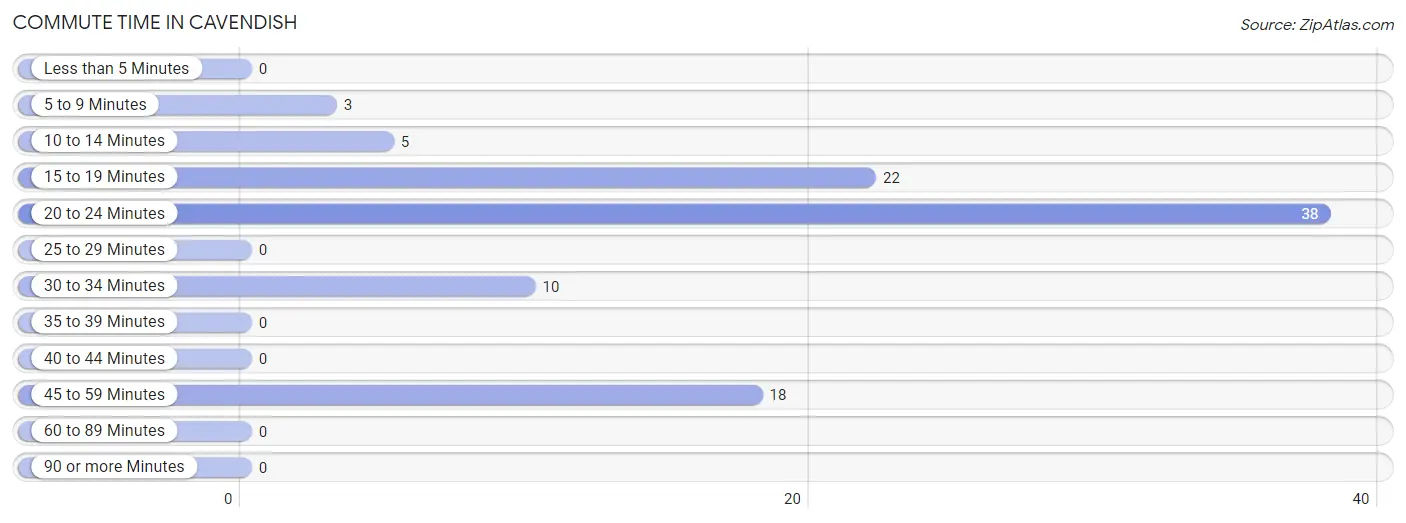
| Commute Time | # Commuters | % Commuters |
| Less than 5 Minutes | 0 | 0.0% |
| 5 to 9 Minutes | 3 | 3.1% |
| 10 to 14 Minutes | 5 | 5.2% |
| 15 to 19 Minutes | 22 | 22.9% |
| 20 to 24 Minutes | 38 | 39.6% |
| 25 to 29 Minutes | 0 | 0.0% |
| 30 to 34 Minutes | 10 | 10.4% |
| 35 to 39 Minutes | 0 | 0.0% |
| 40 to 44 Minutes | 0 | 0.0% |
| 45 to 59 Minutes | 18 | 18.8% |
| 60 to 89 Minutes | 0 | 0.0% |
| 90 or more Minutes | 0 | 0.0% |
Commute Time by Sex in Cavendish
The most common commute times in Cavendish are 20 to 24 minutes (25 commuters, 47.2%) for males and 45 to 59 minutes (18 commuters, 41.9%) for females.
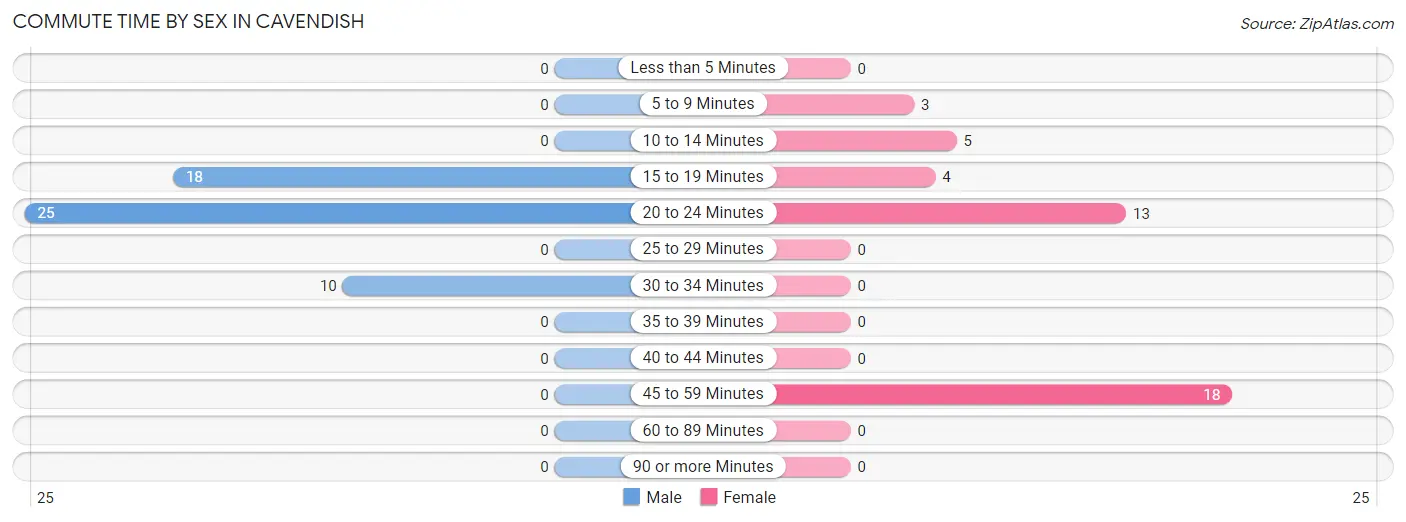
| Commute Time | Male | Female |
| Less than 5 Minutes | 0 (0.0%) | 0 (0.0%) |
| 5 to 9 Minutes | 0 (0.0%) | 3 (7.0%) |
| 10 to 14 Minutes | 0 (0.0%) | 5 (11.6%) |
| 15 to 19 Minutes | 18 (34.0%) | 4 (9.3%) |
| 20 to 24 Minutes | 25 (47.2%) | 13 (30.2%) |
| 25 to 29 Minutes | 0 (0.0%) | 0 (0.0%) |
| 30 to 34 Minutes | 10 (18.9%) | 0 (0.0%) |
| 35 to 39 Minutes | 0 (0.0%) | 0 (0.0%) |
| 40 to 44 Minutes | 0 (0.0%) | 0 (0.0%) |
| 45 to 59 Minutes | 0 (0.0%) | 18 (41.9%) |
| 60 to 89 Minutes | 0 (0.0%) | 0 (0.0%) |
| 90 or more Minutes | 0 (0.0%) | 0 (0.0%) |
Time of Departure to Work by Sex in Cavendish
The most frequent times of departure to work in Cavendish are 9:00 AM to 9:59 AM (25, 47.2%) for males and 7:00 AM to 7:29 AM (13, 30.2%) for females.
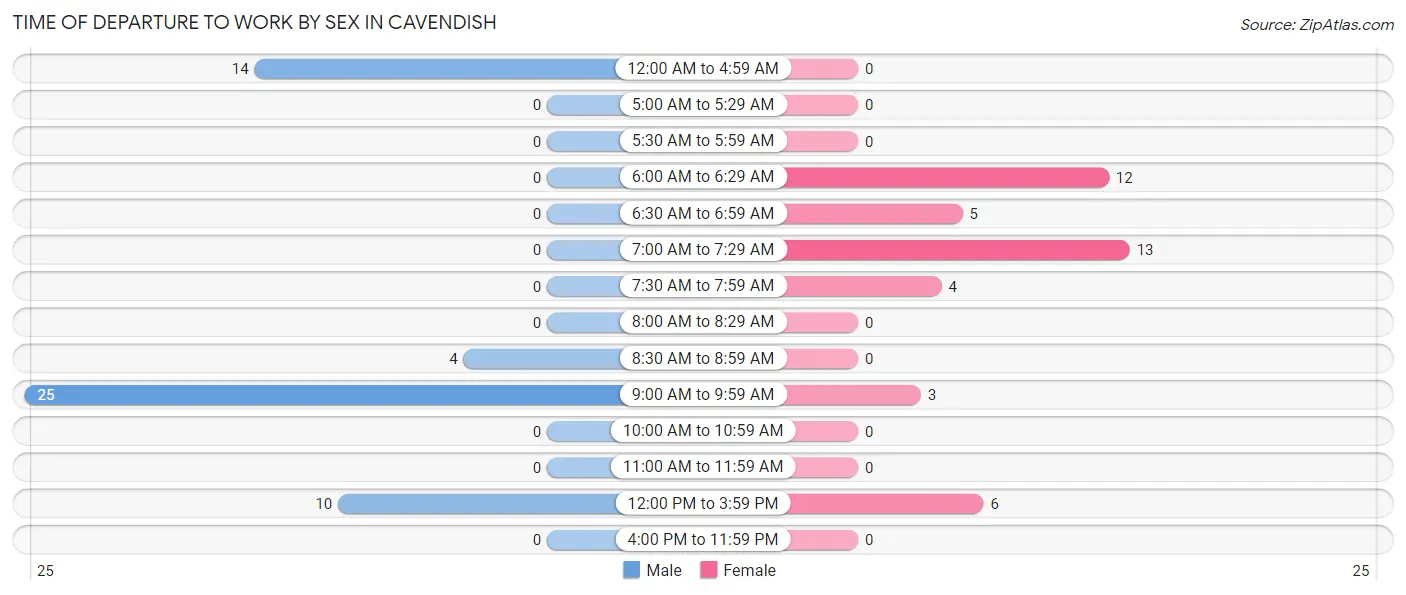
| Time of Departure | Male | Female |
| 12:00 AM to 4:59 AM | 14 (26.4%) | 0 (0.0%) |
| 5:00 AM to 5:29 AM | 0 (0.0%) | 0 (0.0%) |
| 5:30 AM to 5:59 AM | 0 (0.0%) | 0 (0.0%) |
| 6:00 AM to 6:29 AM | 0 (0.0%) | 12 (27.9%) |
| 6:30 AM to 6:59 AM | 0 (0.0%) | 5 (11.6%) |
| 7:00 AM to 7:29 AM | 0 (0.0%) | 13 (30.2%) |
| 7:30 AM to 7:59 AM | 0 (0.0%) | 4 (9.3%) |
| 8:00 AM to 8:29 AM | 0 (0.0%) | 0 (0.0%) |
| 8:30 AM to 8:59 AM | 4 (7.5%) | 0 (0.0%) |
| 9:00 AM to 9:59 AM | 25 (47.2%) | 3 (7.0%) |
| 10:00 AM to 10:59 AM | 0 (0.0%) | 0 (0.0%) |
| 11:00 AM to 11:59 AM | 0 (0.0%) | 0 (0.0%) |
| 12:00 PM to 3:59 PM | 10 (18.9%) | 6 (14.0%) |
| 4:00 PM to 11:59 PM | 0 (0.0%) | 0 (0.0%) |
| Total | 53 (100.0%) | 43 (100.0%) |
Housing Occupancy in Cavendish
Occupancy by Ownership in Cavendish
Of the total 65 dwellings in Cavendish, owner-occupied units account for 44 (67.7%), while renter-occupied units make up 21 (32.3%).
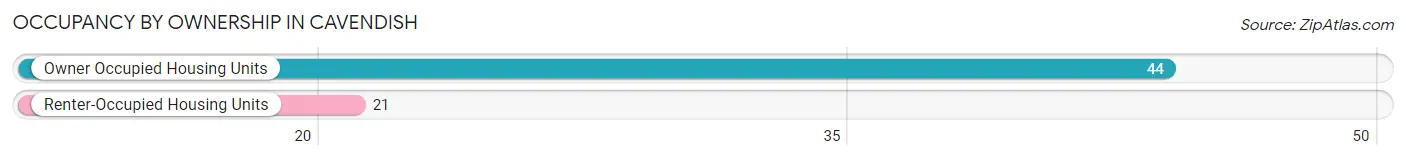
| Occupancy | # Housing Units | % Housing Units |
| Owner Occupied Housing Units | 44 | 67.7% |
| Renter-Occupied Housing Units | 21 | 32.3% |
| Total Occupied Housing Units | 65 | 100.0% |
Occupancy by Household Size in Cavendish
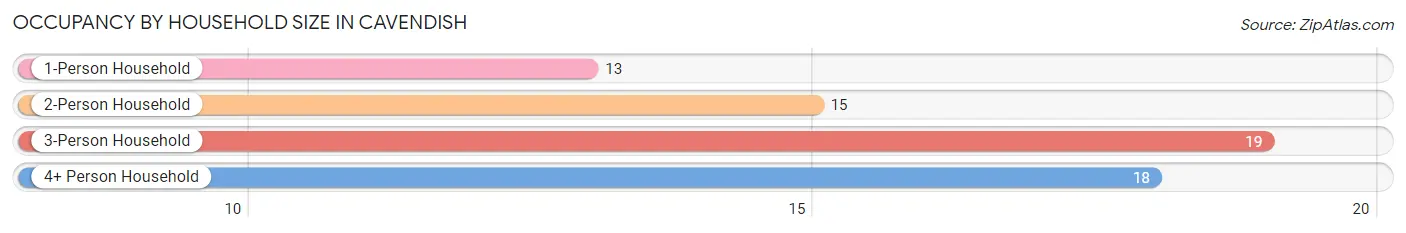
| Household Size | # Housing Units | % Housing Units |
| 1-Person Household | 13 | 20.0% |
| 2-Person Household | 15 | 23.1% |
| 3-Person Household | 19 | 29.2% |
| 4+ Person Household | 18 | 27.7% |
| Total Housing Units | 65 | 100.0% |
Occupancy by Ownership by Household Size in Cavendish
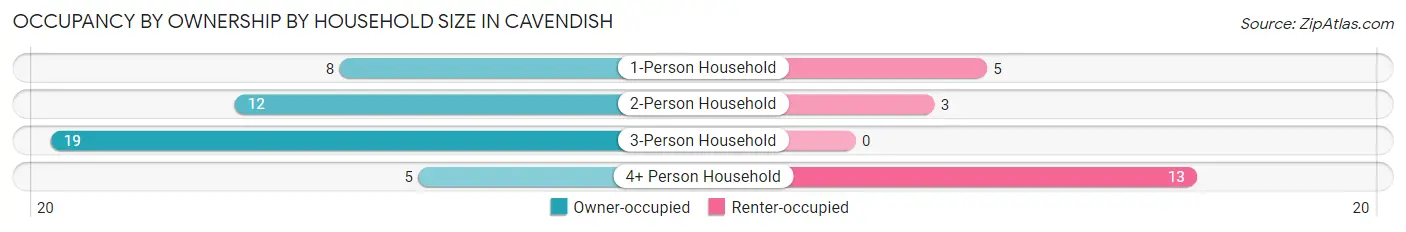
| Household Size | Owner-occupied | Renter-occupied |
| 1-Person Household | 8 (61.5%) | 5 (38.5%) |
| 2-Person Household | 12 (80.0%) | 3 (20.0%) |
| 3-Person Household | 19 (100.0%) | 0 (0.0%) |
| 4+ Person Household | 5 (27.8%) | 13 (72.2%) |
| Total Housing Units | 44 (67.7%) | 21 (32.3%) |
Occupancy by Educational Attainment in Cavendish
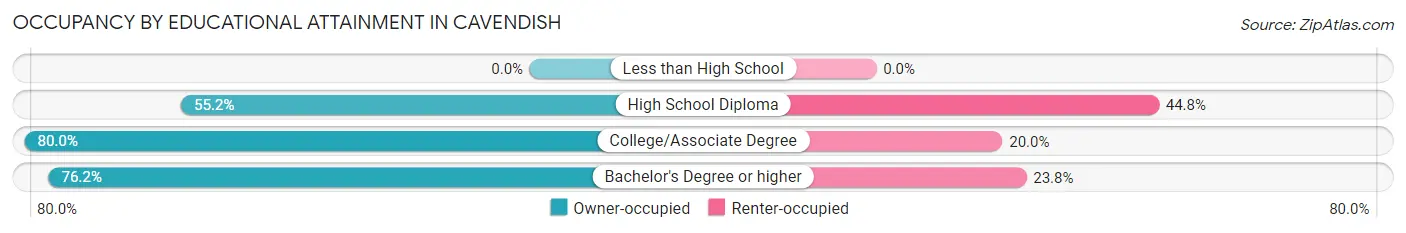
| Household Size | Owner-occupied | Renter-occupied |
| Less than High School | 0 (0.0%) | 0 (0.0%) |
| High School Diploma | 16 (55.2%) | 13 (44.8%) |
| College/Associate Degree | 12 (80.0%) | 3 (20.0%) |
| Bachelor's Degree or higher | 16 (76.2%) | 5 (23.8%) |
Occupancy by Age of Householder in Cavendish
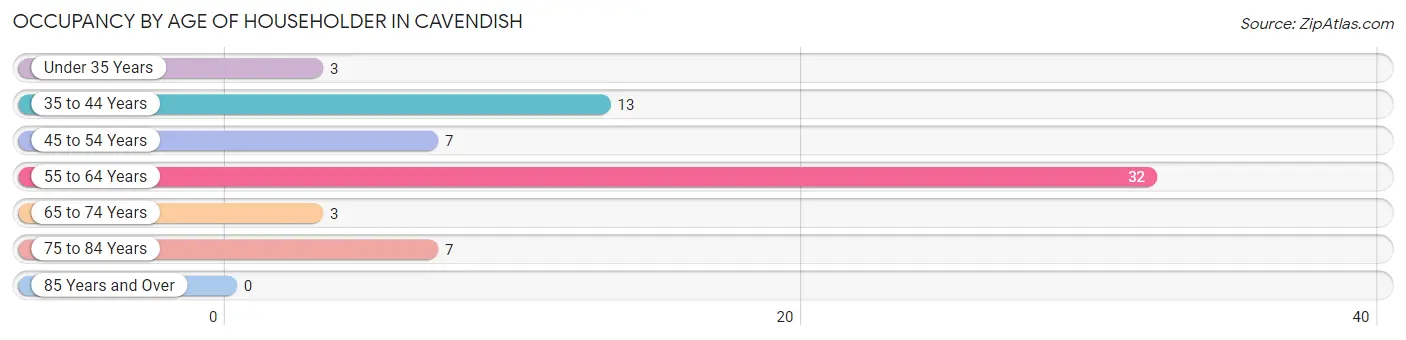
| Age Bracket | # Households | % Households |
| Under 35 Years | 3 | 4.6% |
| 35 to 44 Years | 13 | 20.0% |
| 45 to 54 Years | 7 | 10.8% |
| 55 to 64 Years | 32 | 49.2% |
| 65 to 74 Years | 3 | 4.6% |
| 75 to 84 Years | 7 | 10.8% |
| 85 Years and Over | 0 | 0.0% |
| Total | 65 | 100.0% |
Housing Finances in Cavendish
Median Income by Occupancy in Cavendish
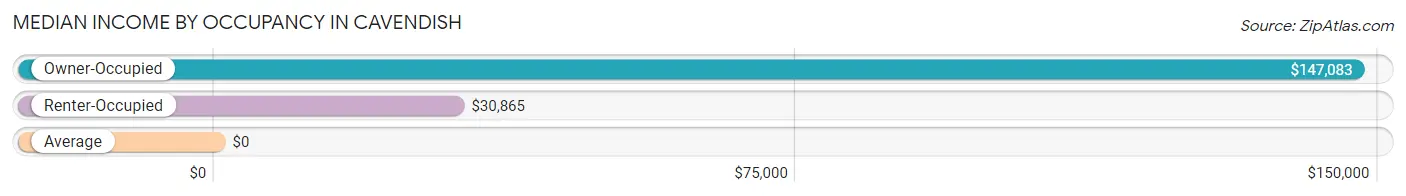
| Occupancy Type | # Households | Median Income |
| Owner-Occupied | 44 (67.7%) | $147,083 |
| Renter-Occupied | 21 (32.3%) | $30,865 |
| Average | 65 (100.0%) | $0 |
Occupancy by Householder Income Bracket in Cavendish
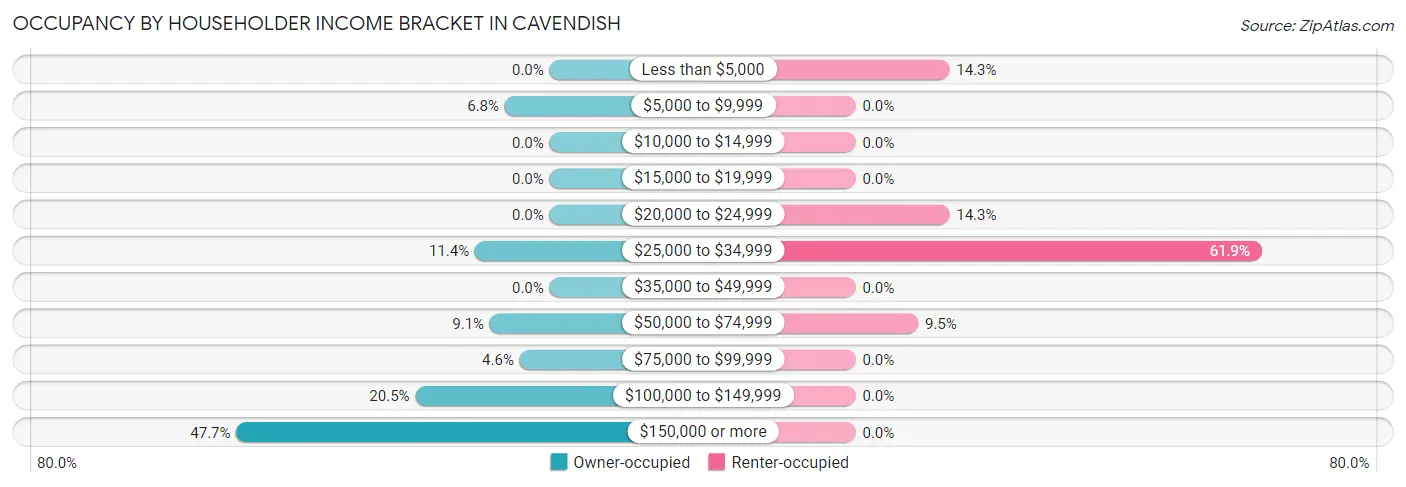
| Income Bracket | Owner-occupied | Renter-occupied |
| Less than $5,000 | 0 (0.0%) | 3 (14.3%) |
| $5,000 to $9,999 | 3 (6.8%) | 0 (0.0%) |
| $10,000 to $14,999 | 0 (0.0%) | 0 (0.0%) |
| $15,000 to $19,999 | 0 (0.0%) | 0 (0.0%) |
| $20,000 to $24,999 | 0 (0.0%) | 3 (14.3%) |
| $25,000 to $34,999 | 5 (11.4%) | 13 (61.9%) |
| $35,000 to $49,999 | 0 (0.0%) | 0 (0.0%) |
| $50,000 to $74,999 | 4 (9.1%) | 2 (9.5%) |
| $75,000 to $99,999 | 2 (4.5%) | 0 (0.0%) |
| $100,000 to $149,999 | 9 (20.4%) | 0 (0.0%) |
| $150,000 or more | 21 (47.7%) | 0 (0.0%) |
| Total | 44 (100.0%) | 21 (100.0%) |
Monthly Housing Cost Tiers in Cavendish
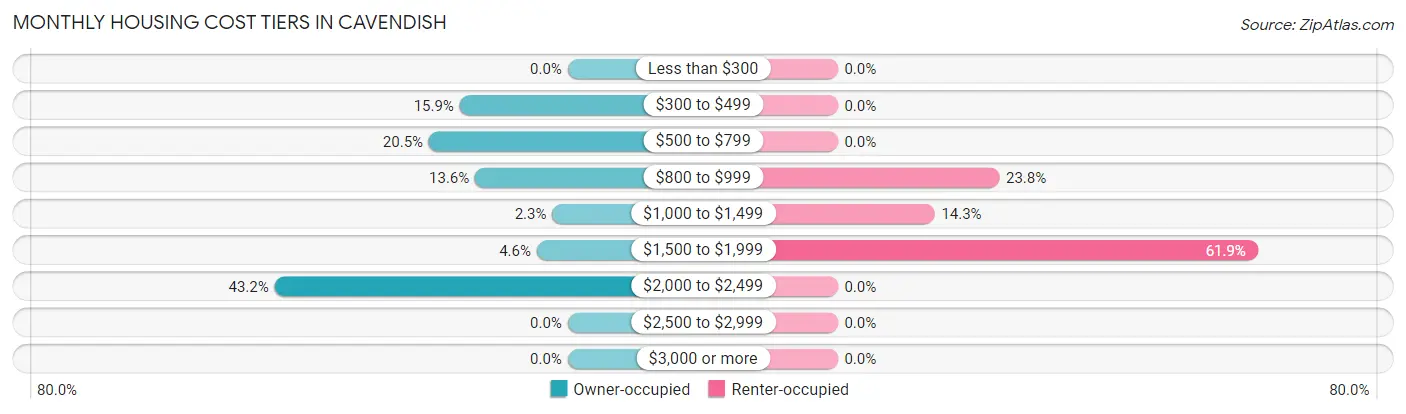
| Monthly Cost | Owner-occupied | Renter-occupied |
| Less than $300 | 0 (0.0%) | 0 (0.0%) |
| $300 to $499 | 7 (15.9%) | 0 (0.0%) |
| $500 to $799 | 9 (20.4%) | 0 (0.0%) |
| $800 to $999 | 6 (13.6%) | 5 (23.8%) |
| $1,000 to $1,499 | 1 (2.3%) | 3 (14.3%) |
| $1,500 to $1,999 | 2 (4.5%) | 13 (61.9%) |
| $2,000 to $2,499 | 19 (43.2%) | 0 (0.0%) |
| $2,500 to $2,999 | 0 (0.0%) | 0 (0.0%) |
| $3,000 or more | 0 (0.0%) | 0 (0.0%) |
| Total | 44 (100.0%) | 21 (100.0%) |
Physical Housing Characteristics in Cavendish
Housing Structures in Cavendish
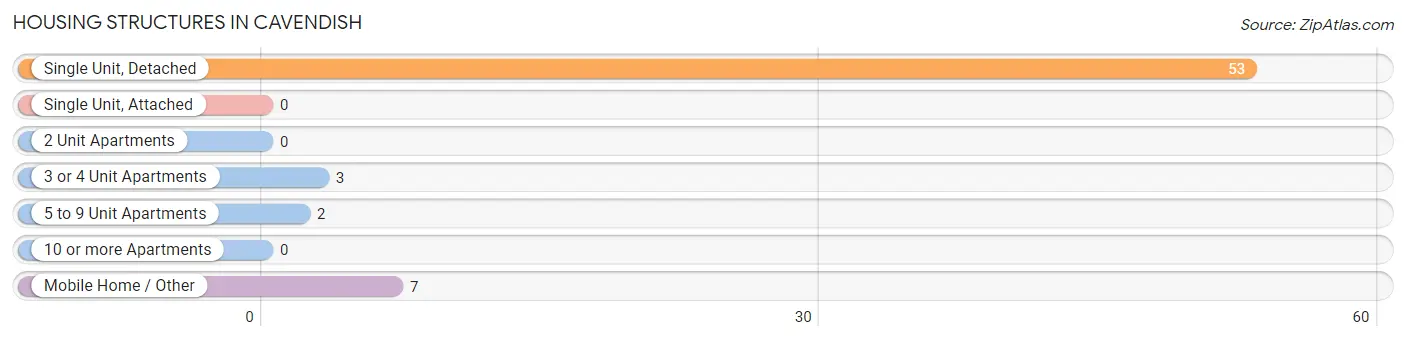
| Structure Type | # Housing Units | % Housing Units |
| Single Unit, Detached | 53 | 81.5% |
| Single Unit, Attached | 0 | 0.0% |
| 2 Unit Apartments | 0 | 0.0% |
| 3 or 4 Unit Apartments | 3 | 4.6% |
| 5 to 9 Unit Apartments | 2 | 3.1% |
| 10 or more Apartments | 0 | 0.0% |
| Mobile Home / Other | 7 | 10.8% |
| Total | 65 | 100.0% |
Housing Structures by Occupancy in Cavendish
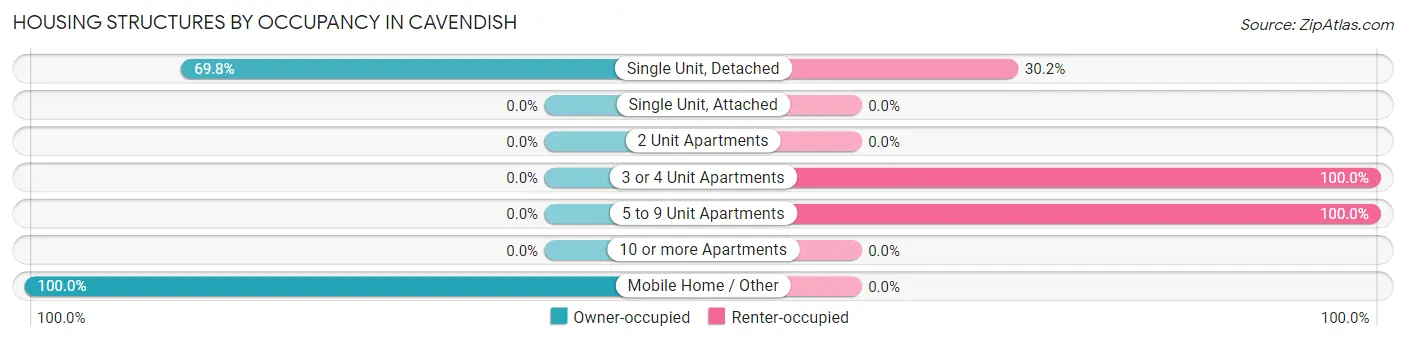
| Structure Type | Owner-occupied | Renter-occupied |
| Single Unit, Detached | 37 (69.8%) | 16 (30.2%) |
| Single Unit, Attached | 0 (0.0%) | 0 (0.0%) |
| 2 Unit Apartments | 0 (0.0%) | 0 (0.0%) |
| 3 or 4 Unit Apartments | 0 (0.0%) | 3 (100.0%) |
| 5 to 9 Unit Apartments | 0 (0.0%) | 2 (100.0%) |
| 10 or more Apartments | 0 (0.0%) | 0 (0.0%) |
| Mobile Home / Other | 7 (100.0%) | 0 (0.0%) |
| Total | 44 (67.7%) | 21 (32.3%) |
Housing Structures by Number of Rooms in Cavendish
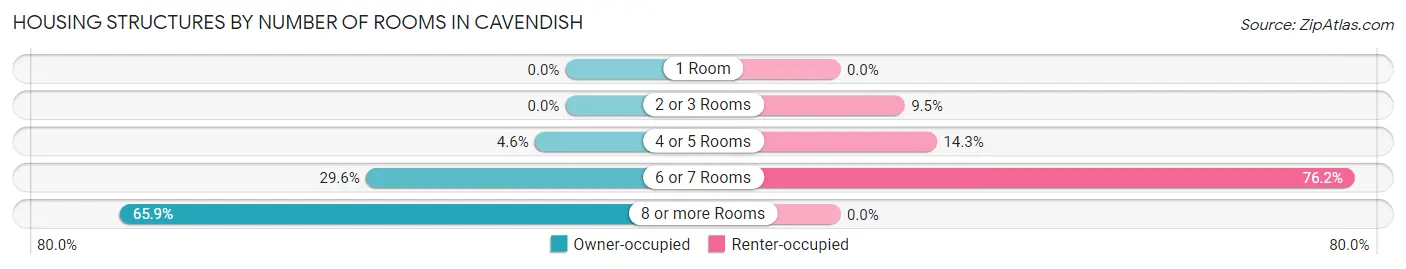
| Number of Rooms | Owner-occupied | Renter-occupied |
| 1 Room | 0 (0.0%) | 0 (0.0%) |
| 2 or 3 Rooms | 0 (0.0%) | 2 (9.5%) |
| 4 or 5 Rooms | 2 (4.5%) | 3 (14.3%) |
| 6 or 7 Rooms | 13 (29.5%) | 16 (76.2%) |
| 8 or more Rooms | 29 (65.9%) | 0 (0.0%) |
| Total | 44 (100.0%) | 21 (100.0%) |
Housing Structure by Heating Type in Cavendish
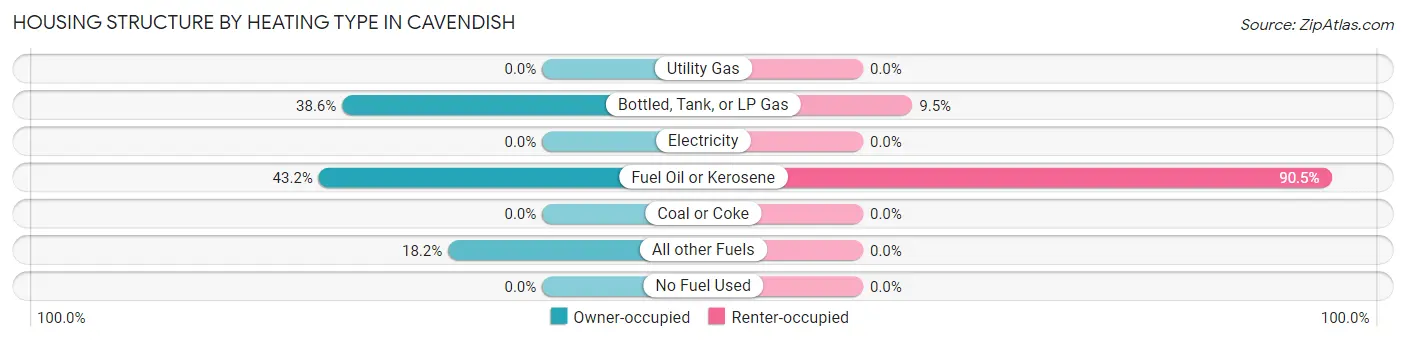
| Heating Type | Owner-occupied | Renter-occupied |
| Utility Gas | 0 (0.0%) | 0 (0.0%) |
| Bottled, Tank, or LP Gas | 17 (38.6%) | 2 (9.5%) |
| Electricity | 0 (0.0%) | 0 (0.0%) |
| Fuel Oil or Kerosene | 19 (43.2%) | 19 (90.5%) |
| Coal or Coke | 0 (0.0%) | 0 (0.0%) |
| All other Fuels | 8 (18.2%) | 0 (0.0%) |
| No Fuel Used | 0 (0.0%) | 0 (0.0%) |
| Total | 44 (100.0%) | 21 (100.0%) |
Household Vehicle Usage in Cavendish
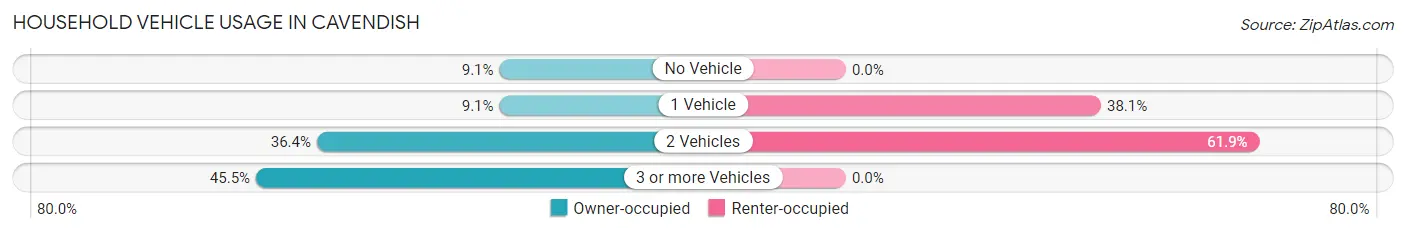
| Vehicles per Household | Owner-occupied | Renter-occupied |
| No Vehicle | 4 (9.1%) | 0 (0.0%) |
| 1 Vehicle | 4 (9.1%) | 8 (38.1%) |
| 2 Vehicles | 16 (36.4%) | 13 (61.9%) |
| 3 or more Vehicles | 20 (45.5%) | 0 (0.0%) |
| Total | 44 (100.0%) | 21 (100.0%) |
Real Estate & Mortgages in Cavendish
Real Estate and Mortgage Overview in Cavendish
| Characteristic | Without Mortgage | With Mortgage |
| Housing Units | 22 | 22 |
| Median Property Value | $146,900 | $230,800 |
| Median Household Income | - | - |
| Monthly Housing Costs | $650 | $0 |
| Real Estate Taxes | $2,875 | $0 |
Property Value by Mortgage Status in Cavendish
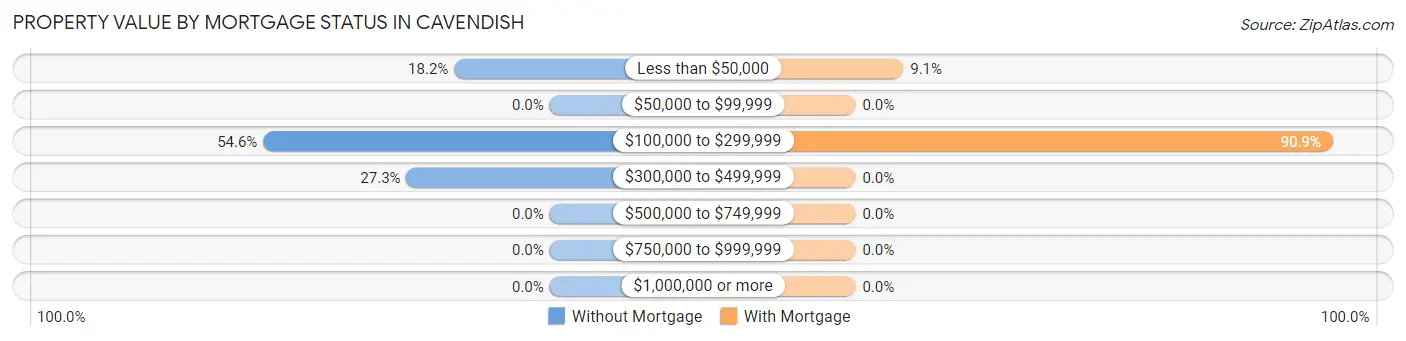
| Property Value | Without Mortgage | With Mortgage |
| Less than $50,000 | 4 (18.2%) | 2 (9.1%) |
| $50,000 to $99,999 | 0 (0.0%) | 0 (0.0%) |
| $100,000 to $299,999 | 12 (54.5%) | 20 (90.9%) |
| $300,000 to $499,999 | 6 (27.3%) | 0 (0.0%) |
| $500,000 to $749,999 | 0 (0.0%) | 0 (0.0%) |
| $750,000 to $999,999 | 0 (0.0%) | 0 (0.0%) |
| $1,000,000 or more | 0 (0.0%) | 0 (0.0%) |
| Total | 22 (100.0%) | 22 (100.0%) |
Household Income by Mortgage Status in Cavendish
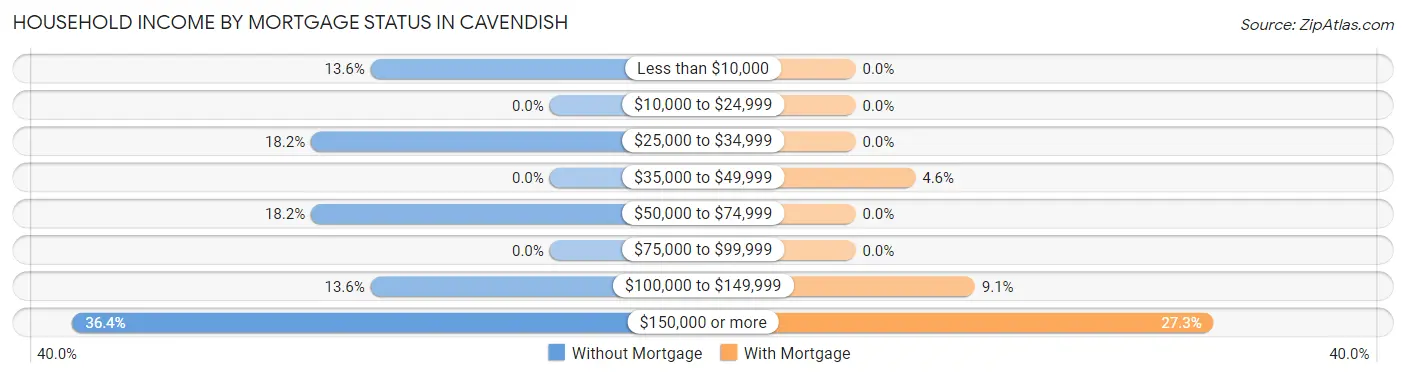
| Household Income | Without Mortgage | With Mortgage |
| Less than $10,000 | 3 (13.6%) | 0 (0.0%) |
| $10,000 to $24,999 | 0 (0.0%) | 0 (0.0%) |
| $25,000 to $34,999 | 4 (18.2%) | 0 (0.0%) |
| $35,000 to $49,999 | 0 (0.0%) | 1 (4.5%) |
| $50,000 to $74,999 | 4 (18.2%) | 0 (0.0%) |
| $75,000 to $99,999 | 0 (0.0%) | 0 (0.0%) |
| $100,000 to $149,999 | 3 (13.6%) | 2 (9.1%) |
| $150,000 or more | 8 (36.4%) | 6 (27.3%) |
| Total | 22 (100.0%) | 22 (100.0%) |
Property Value to Household Income Ratio in Cavendish
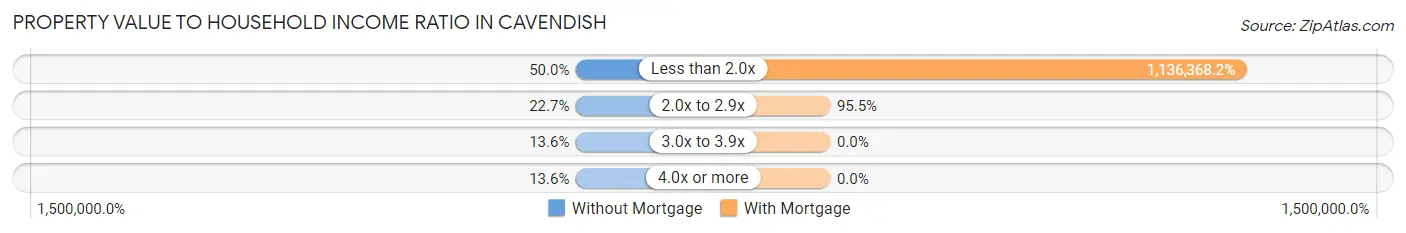
| Value-to-Income Ratio | Without Mortgage | With Mortgage |
| Less than 2.0x | 11 (50.0%) | 250,001 (1,136,368.2%) |
| 2.0x to 2.9x | 5 (22.7%) | 21 (95.5%) |
| 3.0x to 3.9x | 3 (13.6%) | 0 (0.0%) |
| 4.0x or more | 3 (13.6%) | 0 (0.0%) |
| Total | 22 (100.0%) | 22 (100.0%) |
Real Estate Taxes by Mortgage Status in Cavendish
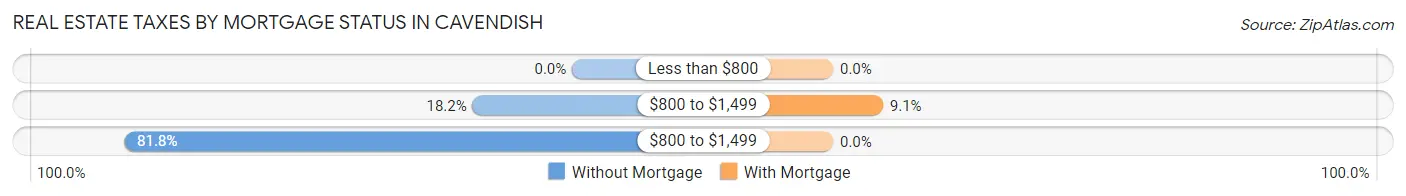
| Property Taxes | Without Mortgage | With Mortgage |
| Less than $800 | 0 (0.0%) | 0 (0.0%) |
| $800 to $1,499 | 4 (18.2%) | 2 (9.1%) |
| $800 to $1,499 | 18 (81.8%) | 0 (0.0%) |
| Total | 22 (100.0%) | 22 (100.0%) |
Health & Disability in Cavendish
Health Insurance Coverage by Age in Cavendish
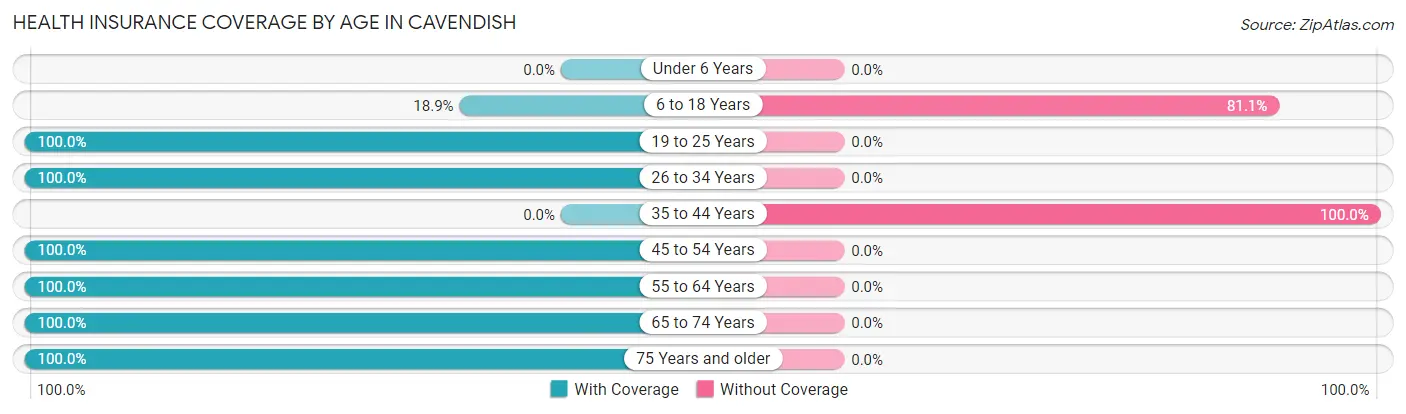
| Age Bracket | With Coverage | Without Coverage |
| Under 6 Years | 0 (0.0%) | 0 (0.0%) |
| 6 to 18 Years | 7 (18.9%) | 30 (81.1%) |
| 19 to 25 Years | 29 (100.0%) | 0 (0.0%) |
| 26 to 34 Years | 28 (100.0%) | 0 (0.0%) |
| 35 to 44 Years | 0 (0.0%) | 25 (100.0%) |
| 45 to 54 Years | 13 (100.0%) | 0 (0.0%) |
| 55 to 64 Years | 54 (100.0%) | 0 (0.0%) |
| 65 to 74 Years | 10 (100.0%) | 0 (0.0%) |
| 75 Years and older | 12 (100.0%) | 0 (0.0%) |
| Total | 153 (73.6%) | 55 (26.4%) |
Health Insurance Coverage by Citizenship Status in Cavendish
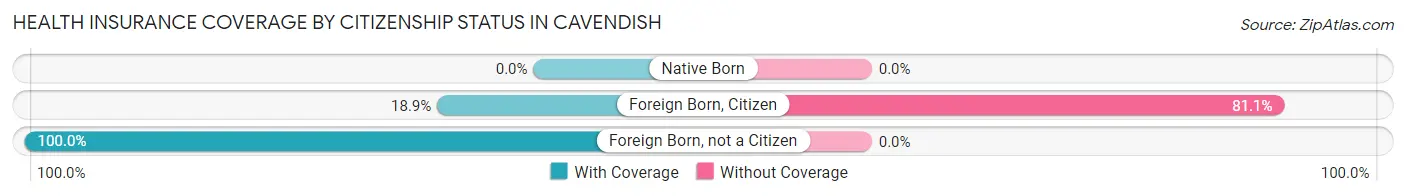
| Citizenship Status | With Coverage | Without Coverage |
| Native Born | 0 (0.0%) | 0 (0.0%) |
| Foreign Born, Citizen | 7 (18.9%) | 30 (81.1%) |
| Foreign Born, not a Citizen | 29 (100.0%) | 0 (0.0%) |
Health Insurance Coverage by Household Income in Cavendish
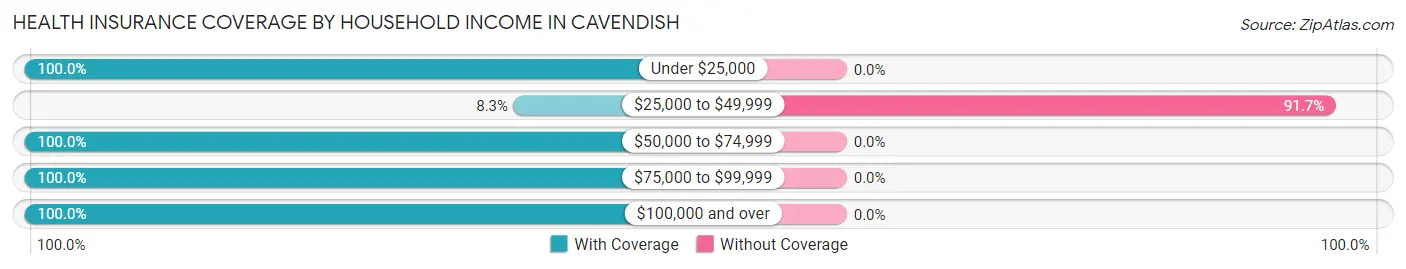
| Household Income | With Coverage | Without Coverage |
| Under $25,000 | 16 (100.0%) | 0 (0.0%) |
| $25,000 to $49,999 | 5 (8.3%) | 55 (91.7%) |
| $50,000 to $74,999 | 11 (100.0%) | 0 (0.0%) |
| $75,000 to $99,999 | 6 (100.0%) | 0 (0.0%) |
| $100,000 and over | 115 (100.0%) | 0 (0.0%) |
Public vs Private Health Insurance Coverage by Age in Cavendish
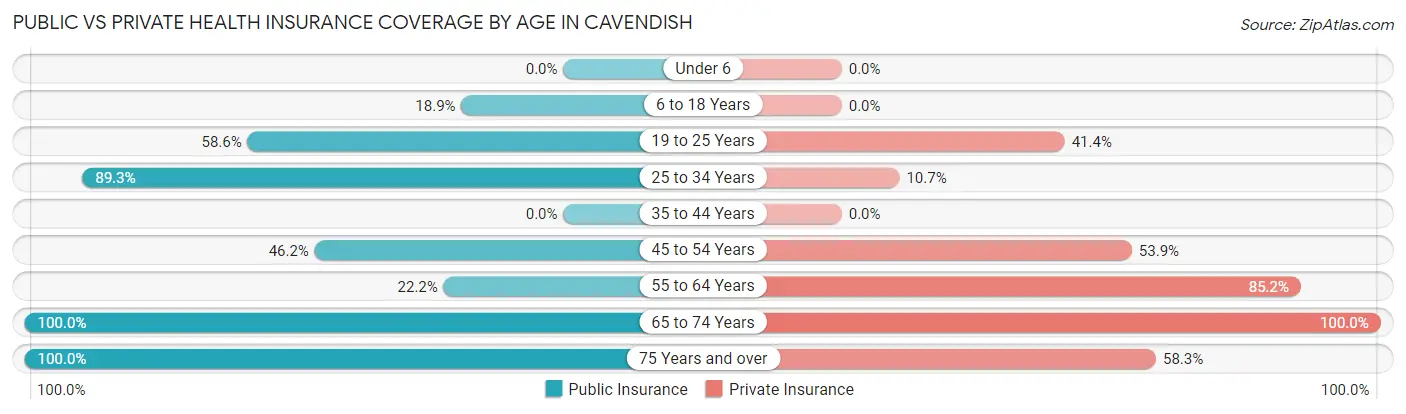
| Age Bracket | Public Insurance | Private Insurance |
| Under 6 | 0 (0.0%) | 0 (0.0%) |
| 6 to 18 Years | 7 (18.9%) | 0 (0.0%) |
| 19 to 25 Years | 17 (58.6%) | 12 (41.4%) |
| 25 to 34 Years | 25 (89.3%) | 3 (10.7%) |
| 35 to 44 Years | 0 (0.0%) | 0 (0.0%) |
| 45 to 54 Years | 6 (46.2%) | 7 (53.8%) |
| 55 to 64 Years | 12 (22.2%) | 46 (85.2%) |
| 65 to 74 Years | 10 (100.0%) | 10 (100.0%) |
| 75 Years and over | 12 (100.0%) | 7 (58.3%) |
| Total | 89 (42.8%) | 85 (40.9%) |
Disability Status by Sex by Age in Cavendish
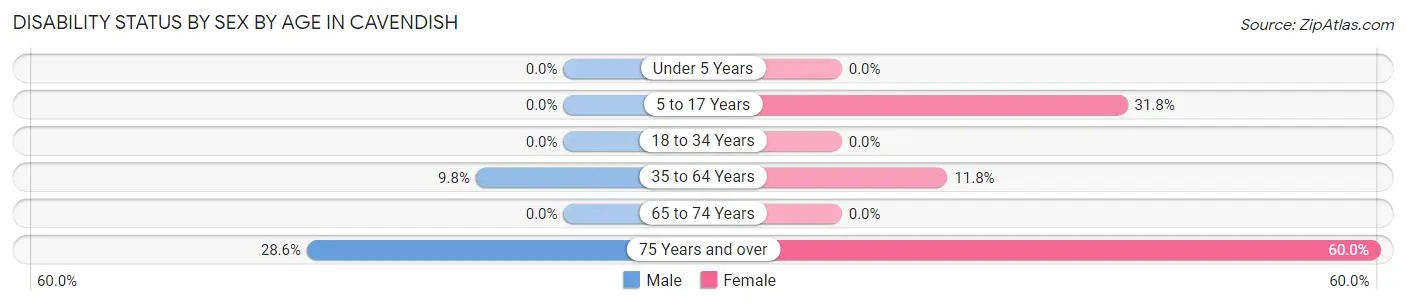
| Age Bracket | Male | Female |
| Under 5 Years | 0 (0.0%) | 0 (0.0%) |
| 5 to 17 Years | 0 (0.0%) | 7 (31.8%) |
| 18 to 34 Years | 0 (0.0%) | 0 (0.0%) |
| 35 to 64 Years | 4 (9.8%) | 6 (11.8%) |
| 65 to 74 Years | 0 (0.0%) | 0 (0.0%) |
| 75 Years and over | 2 (28.6%) | 3 (60.0%) |
Disability Class by Sex by Age in Cavendish
Disability Class: Hearing Difficulty
| Age Bracket | Male | Female |
| Under 5 Years | 0 (0.0%) | 0 (0.0%) |
| 5 to 17 Years | 0 (0.0%) | 0 (0.0%) |
| 18 to 34 Years | 0 (0.0%) | 0 (0.0%) |
| 35 to 64 Years | 0 (0.0%) | 0 (0.0%) |
| 65 to 74 Years | 0 (0.0%) | 0 (0.0%) |
| 75 Years and over | 0 (0.0%) | 0 (0.0%) |
Disability Class: Vision Difficulty
| Age Bracket | Male | Female |
| Under 5 Years | 0 (0.0%) | 0 (0.0%) |
| 5 to 17 Years | 0 (0.0%) | 0 (0.0%) |
| 18 to 34 Years | 0 (0.0%) | 0 (0.0%) |
| 35 to 64 Years | 0 (0.0%) | 0 (0.0%) |
| 65 to 74 Years | 0 (0.0%) | 0 (0.0%) |
| 75 Years and over | 0 (0.0%) | 0 (0.0%) |
Disability Class: Cognitive Difficulty
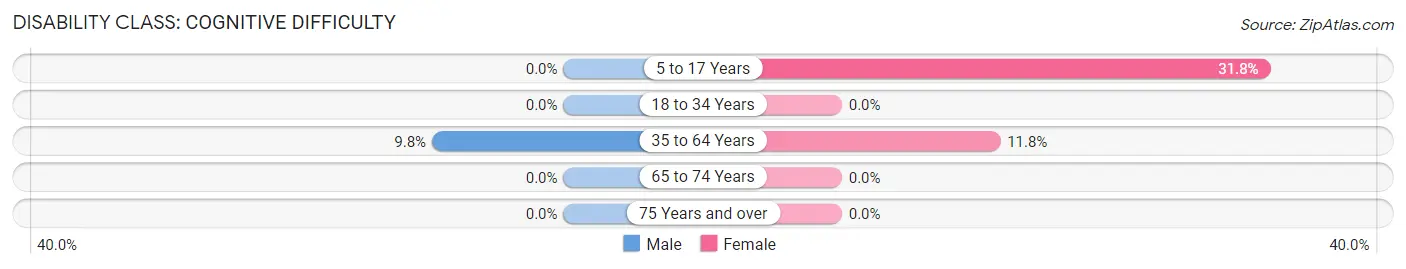
| Age Bracket | Male | Female |
| 5 to 17 Years | 0 (0.0%) | 7 (31.8%) |
| 18 to 34 Years | 0 (0.0%) | 0 (0.0%) |
| 35 to 64 Years | 4 (9.8%) | 6 (11.8%) |
| 65 to 74 Years | 0 (0.0%) | 0 (0.0%) |
| 75 Years and over | 0 (0.0%) | 0 (0.0%) |
Disability Class: Ambulatory Difficulty
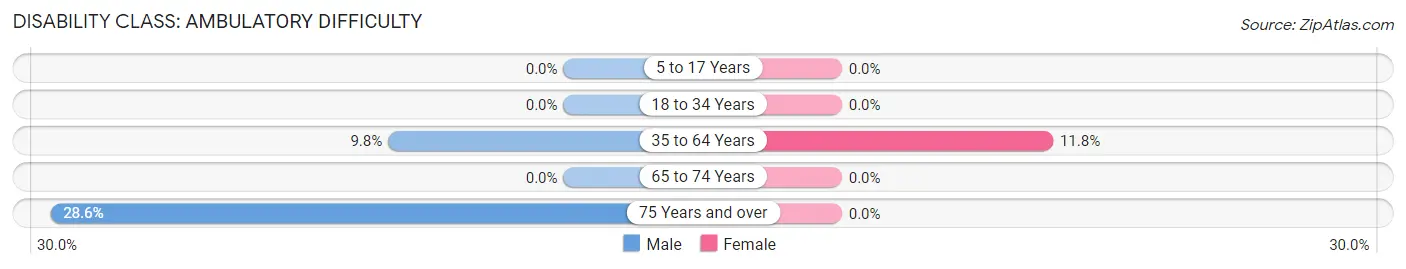
| Age Bracket | Male | Female |
| 5 to 17 Years | 0 (0.0%) | 0 (0.0%) |
| 18 to 34 Years | 0 (0.0%) | 0 (0.0%) |
| 35 to 64 Years | 4 (9.8%) | 6 (11.8%) |
| 65 to 74 Years | 0 (0.0%) | 0 (0.0%) |
| 75 Years and over | 2 (28.6%) | 0 (0.0%) |
Disability Class: Self-Care Difficulty
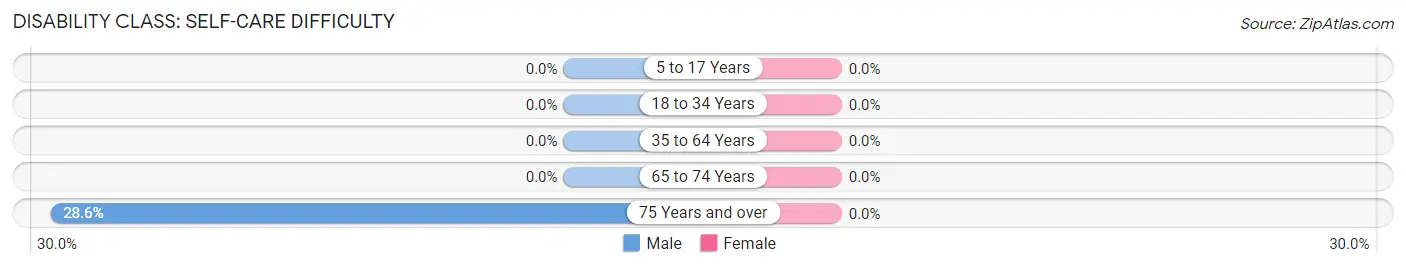
| Age Bracket | Male | Female |
| 5 to 17 Years | 0 (0.0%) | 0 (0.0%) |
| 18 to 34 Years | 0 (0.0%) | 0 (0.0%) |
| 35 to 64 Years | 0 (0.0%) | 0 (0.0%) |
| 65 to 74 Years | 0 (0.0%) | 0 (0.0%) |
| 75 Years and over | 2 (28.6%) | 0 (0.0%) |
Technology Access in Cavendish
Computing Device Access in Cavendish
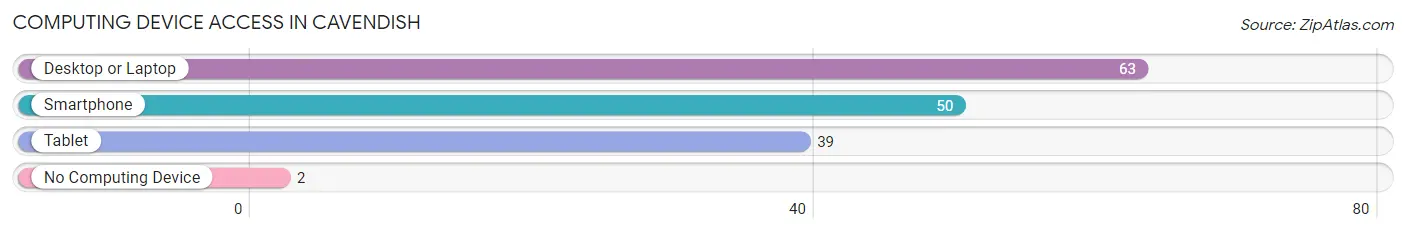
| Device Type | # Households | % Households |
| Desktop or Laptop | 63 | 96.9% |
| Smartphone | 50 | 76.9% |
| Tablet | 39 | 60.0% |
| No Computing Device | 2 | 3.1% |
| Total | 65 | 100.0% |
Internet Access in Cavendish
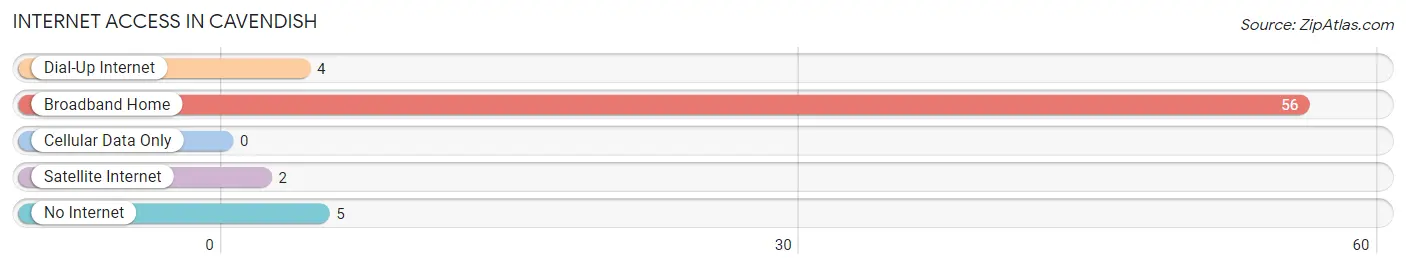
| Internet Type | # Households | % Households |
| Dial-Up Internet | 4 | 6.1% |
| Broadband Home | 56 | 86.2% |
| Cellular Data Only | 0 | 0.0% |
| Satellite Internet | 2 | 3.1% |
| No Internet | 5 | 7.7% |
| Total | 65 | 100.0% |
Cavendish Summary
Cavendish, Vermont is a small town located in the southeastern part of the state, in Windsor County. It is bordered by the towns of Weathersfield, Ludlow, Plymouth, and Reading. The town was first settled in 1761 and was incorporated in 1781. The town was named after William Cavendish, the 4th Duke of Devonshire.
Geography
Cavendish is located in the Green Mountains of Vermont, and is situated in the Connecticut River Valley. The town is located at the intersection of US Route 103 and Vermont Route 131. The town is home to the Black River, which flows through the town and is a tributary of the Connecticut River. The town is also home to the Proctorsville Covered Bridge, which is the longest covered bridge in the state. The town has a total area of 33.2 square miles, of which 32.9 square miles is land and 0.3 square miles is water.
Economy
Cavendish is a rural town with a population of 1,077 as of the 2010 census. The town is home to several small businesses, including a general store, a hardware store, a gas station, and a few restaurants. The town is also home to several farms, which produce dairy, beef, and maple syrup. The town is also home to the Cavendish Historical Society, which is dedicated to preserving the town's history.
Demographics
As of the 2010 census, the population of Cavendish was 1,077, with a population density of 32.5 people per square mile. The median age of the population was 44.7 years, with a gender ratio of 49.7% male and 50.3% female. The median household income was $50,938, and the median family income was $60,625. The per capita income was $25,945. The town is 97.2% white, 0.7% African American, 0.3% Native American, 0.3% Asian, 0.2% from other races, and 1.3% from two or more races.
Conclusion
Cavendish, Vermont is a small town located in the southeastern part of the state, in Windsor County. It is bordered by the towns of Weathersfield, Ludlow, Plymouth, and Reading. The town was first settled in 1761 and was incorporated in 1781. The town is home to several small businesses, farms, and the Cavendish Historical Society. The population of Cavendish was 1,077 as of the 2010 census, with a median age of 44.7 years and a median household income of $50,938. The town is 97.2% white, with the remainder of the population being made up of African American, Native American, Asian, and other races.
Common Questions
What is Per Capita Income in Cavendish?
Per Capita income in Cavendish is $50,029.
What is the Median Family Income in Cavendish?
Median Family Income in Cavendish is $145,417.
What is Inequality or Gini Index in Cavendish?
Inequality or Gini Index in Cavendish is 0.55.
What is the Total Population of Cavendish?
Total Population of Cavendish is 208.
What is the Total Male Population of Cavendish?
Total Male Population of Cavendish is 118.
What is the Total Female Population of Cavendish?
Total Female Population of Cavendish is 90.
What is the Ratio of Males per 100 Females in Cavendish?
There are 131.11 Males per 100 Females in Cavendish.
What is the Ratio of Females per 100 Males in Cavendish?
There are 76.27 Females per 100 Males in Cavendish.
What is the Median Population Age in Cavendish?
Median Population Age in Cavendish is 35.8 Years.
What is the Average Family Size in Cavendish
Average Family Size in Cavendish is 3.8 People.
What is the Average Household Size in Cavendish
Average Household Size in Cavendish is 3.2 People.
How Large is the Labor Force in Cavendish?
There are 113 People in the Labor Forcein in Cavendish.
What is the Percentage of People in the Labor Force in Cavendish?
66.1% of People are in the Labor Force in Cavendish.
What is the Unemployment Rate in Cavendish?
Unemployment Rate in Cavendish is 12.4%.