Zip Codes with the Highest Percentage of Population Employed in Architecture & Engineering in Colchester, VT
RELATED REPORTS & OPTIONS
Architecture & Engineering
Colchester
Compare Zip Codes
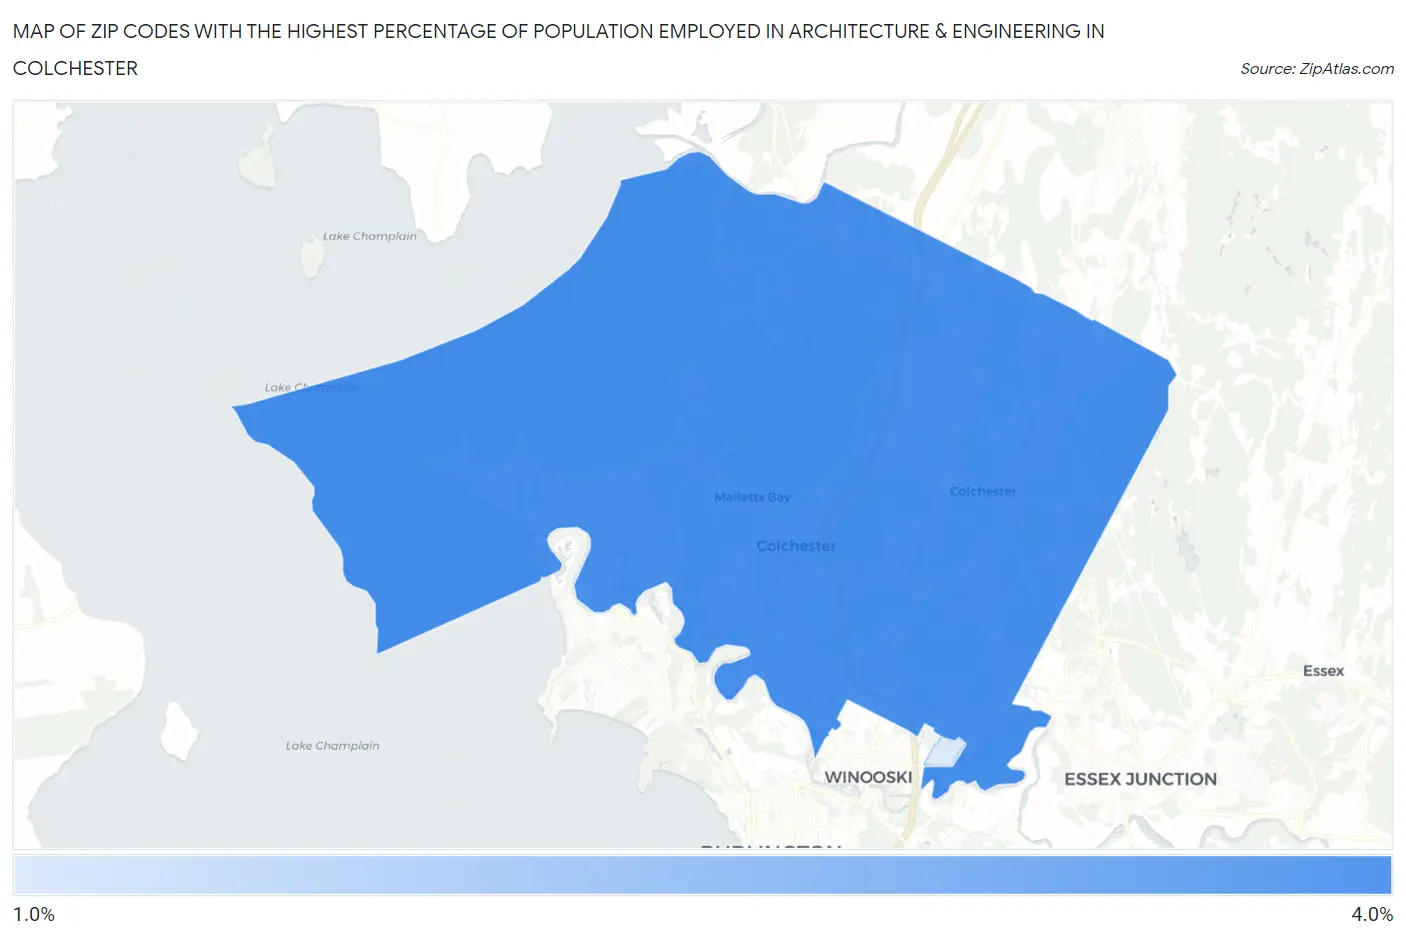
Map of Zip Codes with the Highest Percentage of Population Employed in Architecture & Engineering in Colchester
1.3%
3.6%
Zip Codes with the Highest Percentage of Population Employed in Architecture & Engineering in Colchester, VT
| Zip Code | % Employed | vs State | vs National | |
| 1. | 05446 | 3.6% | 2.0%(+1.62)#21 | 2.1%(+1.47)#3,470 |
| 2. | 05439 | 1.3% | 2.0%(-0.695)#103 | 2.1%(-0.842)#14,266 |
1
Common Questions
What are the Top Zip Codes with the Highest Percentage of Population Employed in Architecture & Engineering in Colchester, VT?
Top Zip Codes with the Highest Percentage of Population Employed in Architecture & Engineering in Colchester, VT are:
What zip code has the Highest Percentage of Population Employed in Architecture & Engineering in Colchester, VT?
05446 has the Highest Percentage of Population Employed in Architecture & Engineering in Colchester, VT with 3.6%.
What is the Percentage of Population Employed in Architecture & Engineering in Vermont?
Percentage of Population Employed in Architecture & Engineering in Vermont is 2.0%.
What is the Percentage of Population Employed in Architecture & Engineering in the United States?
Percentage of Population Employed in Architecture & Engineering in the United States is 2.1%.