Zip Codes with the Highest Percentage of Population Employed in Architecture & Engineering in Burlington, VT
RELATED REPORTS & OPTIONS
Architecture & Engineering
Burlington
Compare Zip Codes
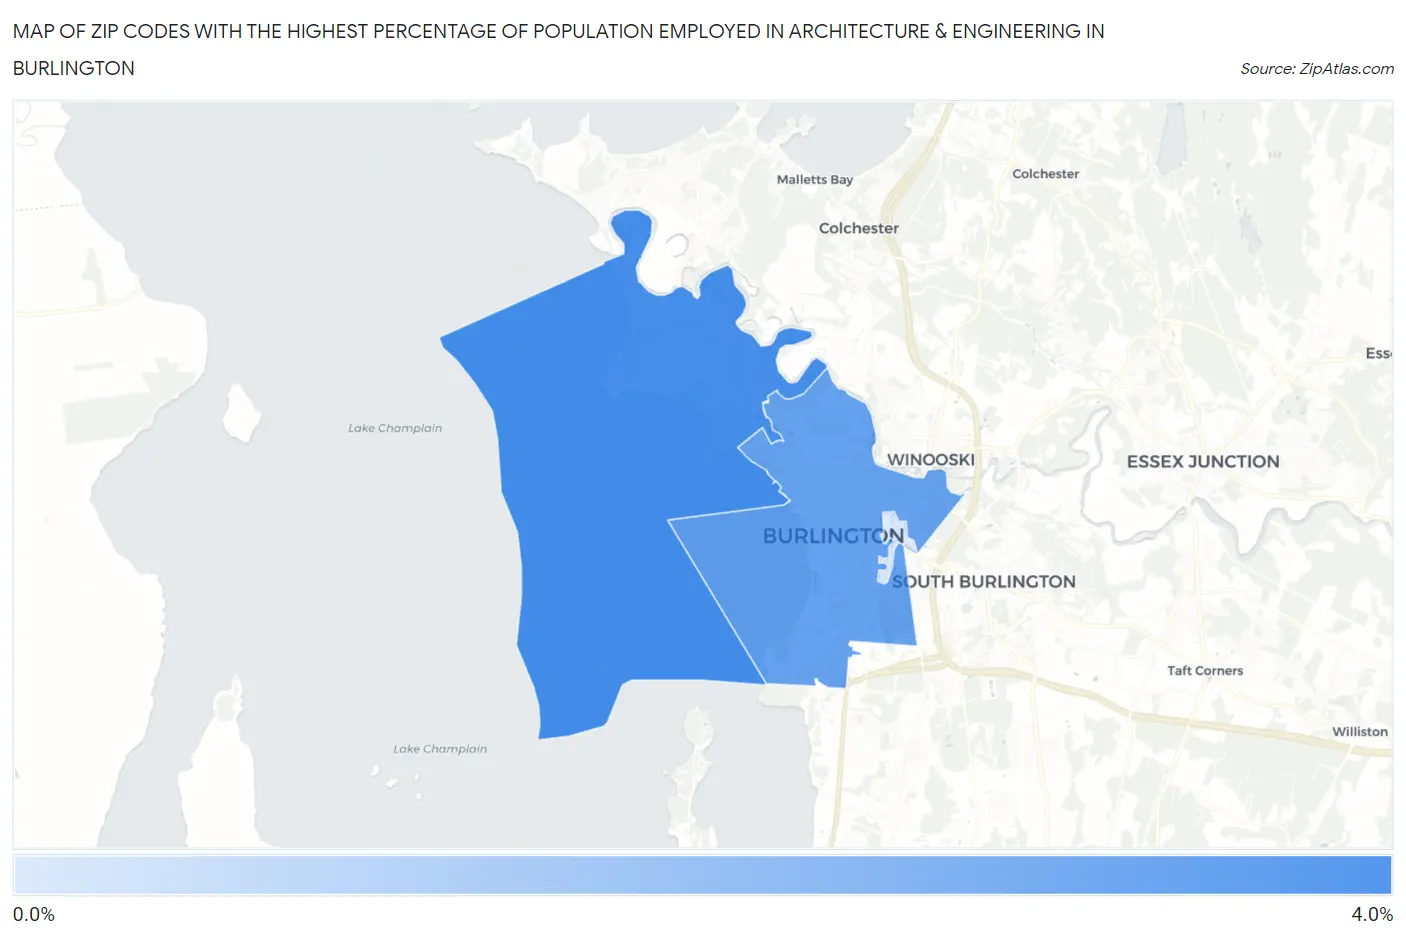
Map of Zip Codes with the Highest Percentage of Population Employed in Architecture & Engineering in Burlington
0.90%
3.3%
Zip Codes with the Highest Percentage of Population Employed in Architecture & Engineering in Burlington, VT
| Zip Code | % Employed | vs State | vs National | |
| 1. | 05408 | 3.3% | 2.0%(+1.25)#29 | 2.1%(+1.10)#4,327 |
| 2. | 05401 | 2.8% | 2.0%(+0.771)#46 | 2.1%(+0.624)#5,890 |
| 3. | 05405 | 0.90% | 2.0%(-1.10)#124 | 2.1%(-1.25)#17,354 |
1
Common Questions
What are the Top Zip Codes with the Highest Percentage of Population Employed in Architecture & Engineering in Burlington, VT?
Top Zip Codes with the Highest Percentage of Population Employed in Architecture & Engineering in Burlington, VT are:
What zip code has the Highest Percentage of Population Employed in Architecture & Engineering in Burlington, VT?
05408 has the Highest Percentage of Population Employed in Architecture & Engineering in Burlington, VT with 3.3%.
What is the Percentage of Population Employed in Architecture & Engineering in Burlington, VT?
Percentage of Population Employed in Architecture & Engineering in Burlington is 2.8%.
What is the Percentage of Population Employed in Architecture & Engineering in Vermont?
Percentage of Population Employed in Architecture & Engineering in Vermont is 2.0%.
What is the Percentage of Population Employed in Architecture & Engineering in the United States?
Percentage of Population Employed in Architecture & Engineering in the United States is 2.1%.