Zip Codes with the Highest Percentage of Population Employed in Architecture & Engineering in Cordova, TN
RELATED REPORTS & OPTIONS
Architecture & Engineering
Cordova
Compare Zip Codes
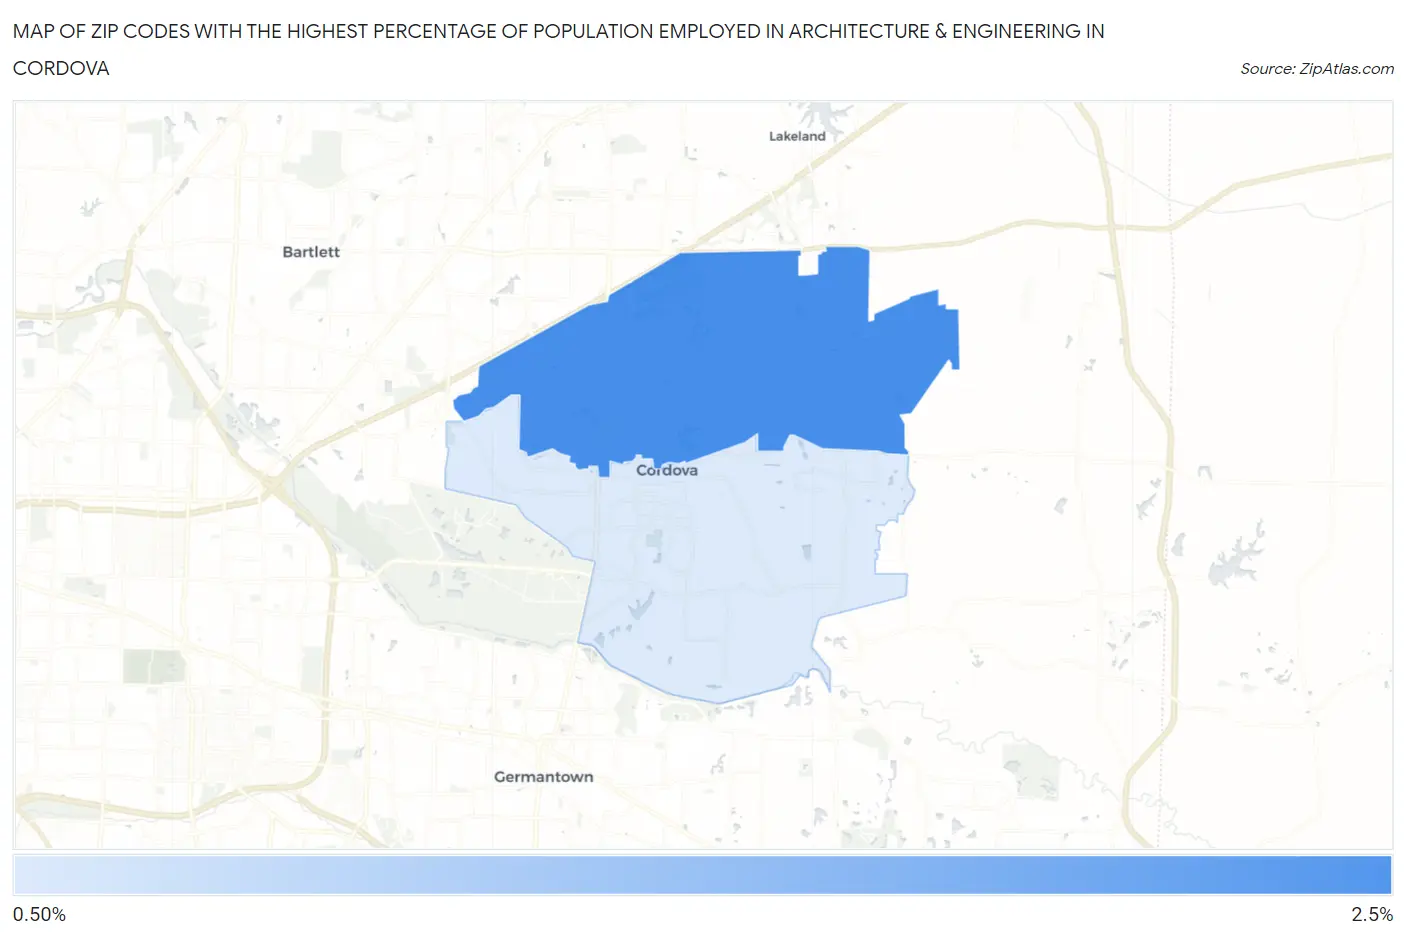
Map of Zip Codes with the Highest Percentage of Population Employed in Architecture & Engineering in Cordova
1.5%
2.2%
Zip Codes with the Highest Percentage of Population Employed in Architecture & Engineering in Cordova, TN
| Zip Code | % Employed | vs State | vs National | |
| 1. | 38016 | 2.2% | 1.7%(+0.539)#135 | 2.1%(+0.058)#8,443 |
| 2. | 38018 | 1.5% | 1.7%(-0.180)#249 | 2.1%(-0.661)#12,977 |
1
Common Questions
What are the Top Zip Codes with the Highest Percentage of Population Employed in Architecture & Engineering in Cordova, TN?
Top Zip Codes with the Highest Percentage of Population Employed in Architecture & Engineering in Cordova, TN are:
What zip code has the Highest Percentage of Population Employed in Architecture & Engineering in Cordova, TN?
38016 has the Highest Percentage of Population Employed in Architecture & Engineering in Cordova, TN with 2.2%.
What is the Percentage of Population Employed in Architecture & Engineering in Tennessee?
Percentage of Population Employed in Architecture & Engineering in Tennessee is 1.7%.
What is the Percentage of Population Employed in Architecture & Engineering in the United States?
Percentage of Population Employed in Architecture & Engineering in the United States is 2.1%.