Zip Codes with the Highest Percentage of Population Employed in Architecture & Engineering in Sevierville, TN
RELATED REPORTS & OPTIONS
Architecture & Engineering
Sevierville
Compare Zip Codes
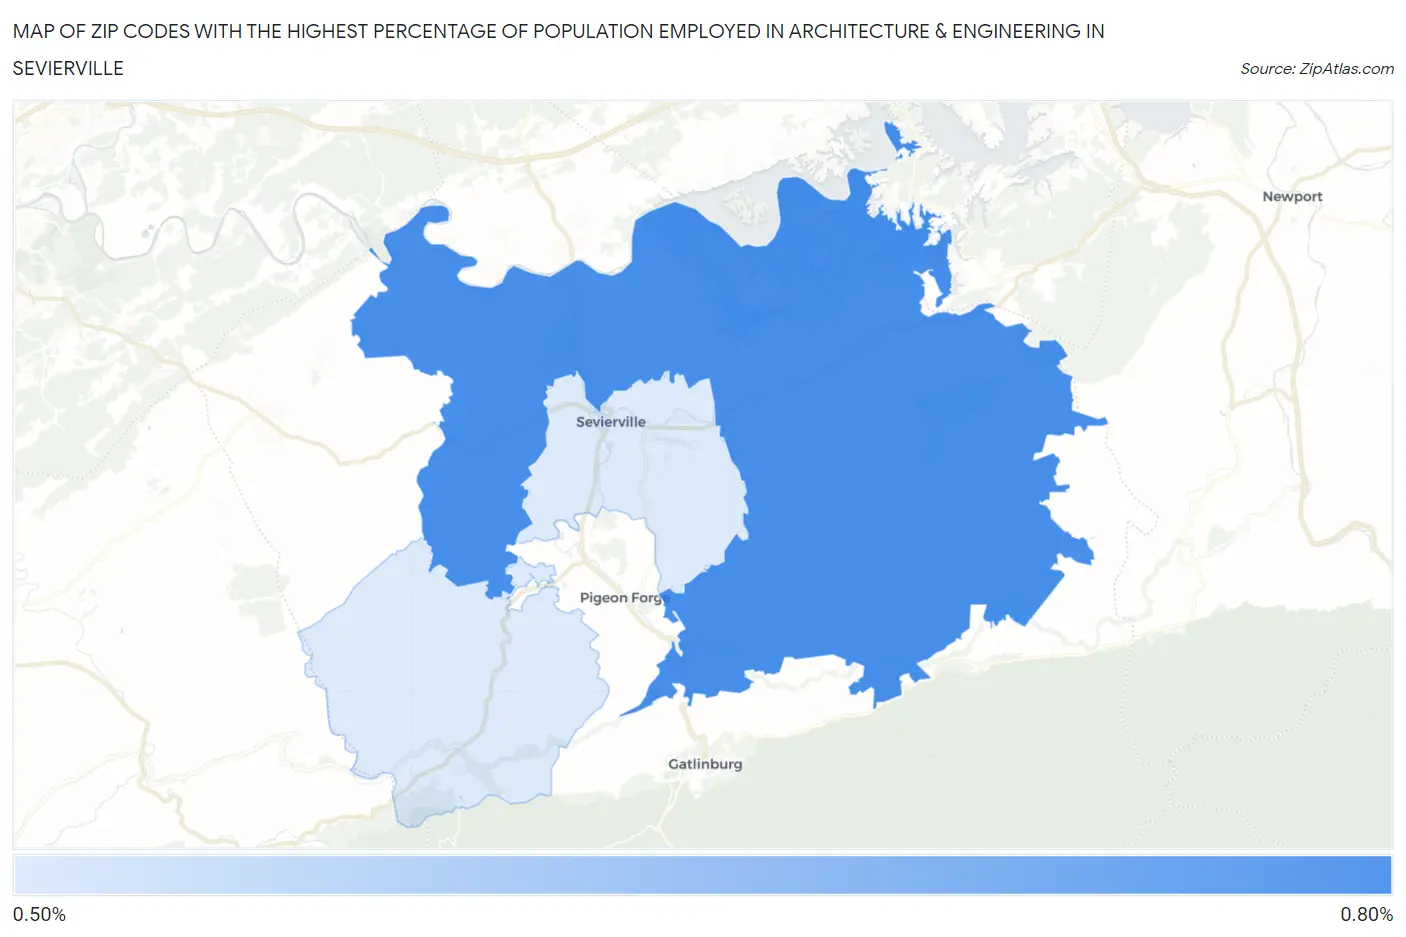
Map of Zip Codes with the Highest Percentage of Population Employed in Architecture & Engineering in Sevierville
0.58%
0.73%
Zip Codes with the Highest Percentage of Population Employed in Architecture & Engineering in Sevierville, TN
| Zip Code | % Employed | vs State | vs National | |
| 1. | 37876 | 0.73% | 1.7%(-0.934)#381 | 2.1%(-1.42)#18,655 |
| 2. | 37862 | 0.58% | 1.7%(-1.08)#405 | 2.1%(-1.56)#19,736 |
1
Common Questions
What are the Top Zip Codes with the Highest Percentage of Population Employed in Architecture & Engineering in Sevierville, TN?
Top Zip Codes with the Highest Percentage of Population Employed in Architecture & Engineering in Sevierville, TN are:
What zip code has the Highest Percentage of Population Employed in Architecture & Engineering in Sevierville, TN?
37876 has the Highest Percentage of Population Employed in Architecture & Engineering in Sevierville, TN with 0.73%.
What is the Percentage of Population Employed in Architecture & Engineering in Sevierville, TN?
Percentage of Population Employed in Architecture & Engineering in Sevierville is 0.62%.
What is the Percentage of Population Employed in Architecture & Engineering in Tennessee?
Percentage of Population Employed in Architecture & Engineering in Tennessee is 1.7%.
What is the Percentage of Population Employed in Architecture & Engineering in the United States?
Percentage of Population Employed in Architecture & Engineering in the United States is 2.1%.