Zip Codes with the Highest Percentage of Population Employed in Architecture & Engineering in Tennessee
RELATED REPORTS & OPTIONS
Architecture & Engineering
Tennessee
Compare Zip Codes
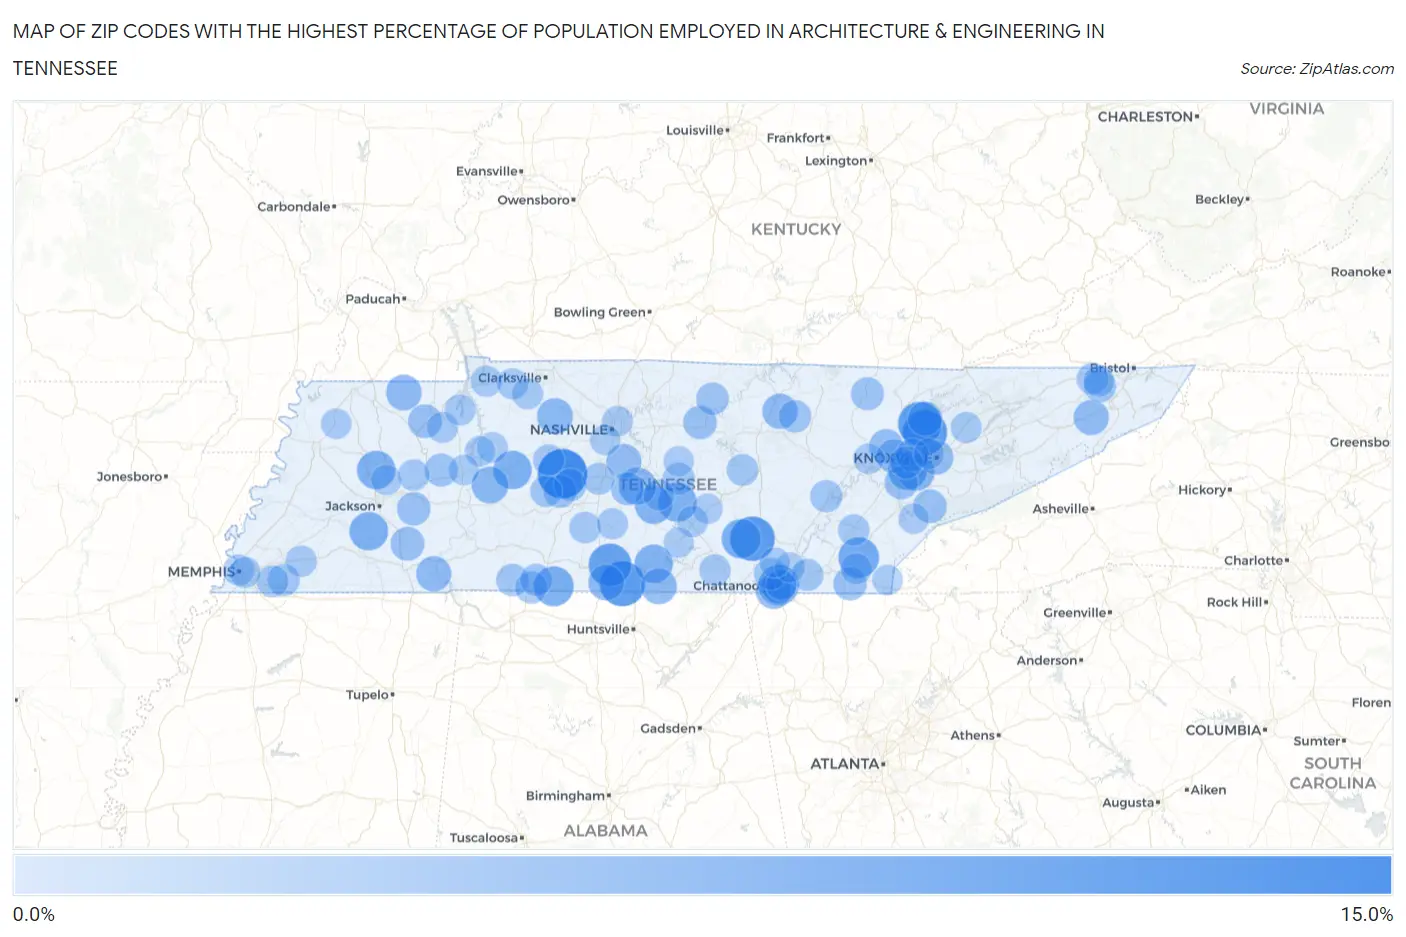
Map of Zip Codes with the Highest Percentage of Population Employed in Architecture & Engineering in Tennessee
0.0%
15.0%
Zip Codes with the Highest Percentage of Population Employed in Architecture & Engineering in Tennessee
| Zip Code | % Employed | vs State | vs National | |
| 1. | 38476 | 11.3% | 1.7%(+9.63)#1 | 2.1%(+9.14)#272 |
| 2. | 38488 | 9.3% | 1.7%(+7.63)#2 | 2.1%(+7.15)#386 |
| 3. | 37365 | 9.0% | 1.7%(+7.37)#3 | 2.1%(+6.89)#414 |
| 4. | 37754 | 8.9% | 1.7%(+7.21)#4 | 2.1%(+6.73)#436 |
| 5. | 37828 | 8.7% | 1.7%(+7.05)#5 | 2.1%(+6.57)#457 |
| 6. | 38459 | 8.2% | 1.7%(+6.55)#6 | 2.1%(+6.07)#533 |
| 7. | 37325 | 7.2% | 1.7%(+5.54)#7 | 2.1%(+5.06)#707 |
| 8. | 37402 | 7.1% | 1.7%(+5.45)#8 | 2.1%(+4.97)#722 |
| 9. | 38457 | 6.9% | 1.7%(+5.19)#9 | 2.1%(+4.70)#786 |
| 10. | 37934 | 6.6% | 1.7%(+4.95)#10 | 2.1%(+4.47)#848 |
| 11. | 37339 | 6.6% | 1.7%(+4.93)#11 | 2.1%(+4.45)#853 |
| 12. | 37018 | 6.3% | 1.7%(+4.68)#12 | 2.1%(+4.20)#944 |
| 13. | 37140 | 6.2% | 1.7%(+4.58)#13 | 2.1%(+4.10)#980 |
| 14. | 38338 | 6.2% | 1.7%(+4.58)#14 | 2.1%(+4.10)#984 |
| 15. | 38356 | 6.2% | 1.7%(+4.55)#15 | 2.1%(+4.07)#995 |
| 16. | 37359 | 6.2% | 1.7%(+4.51)#16 | 2.1%(+4.03)#1,010 |
| 17. | 37020 | 5.9% | 1.7%(+4.23)#17 | 2.1%(+3.75)#1,128 |
| 18. | 37153 | 5.7% | 1.7%(+4.02)#18 | 2.1%(+3.54)#1,223 |
| 19. | 37097 | 5.5% | 1.7%(+3.83)#19 | 2.1%(+3.34)#1,327 |
| 20. | 37922 | 5.4% | 1.7%(+3.75)#20 | 2.1%(+3.27)#1,379 |
| 21. | 37036 | 5.2% | 1.7%(+3.50)#21 | 2.1%(+3.01)#1,547 |
| 22. | 37328 | 5.1% | 1.7%(+3.44)#22 | 2.1%(+2.95)#1,594 |
| 23. | 38449 | 5.0% | 1.7%(+3.37)#23 | 2.1%(+2.89)#1,638 |
| 24. | 38241 | 5.0% | 1.7%(+3.35)#24 | 2.1%(+2.87)#1,646 |
| 25. | 37409 | 4.9% | 1.7%(+3.22)#25 | 2.1%(+2.74)#1,752 |
| 26. | 38580 | 4.8% | 1.7%(+3.16)#26 | 2.1%(+2.68)#1,806 |
| 27. | 38376 | 4.8% | 1.7%(+3.14)#27 | 2.1%(+2.66)#1,822 |
| 28. | 37690 | 4.8% | 1.7%(+3.14)#28 | 2.1%(+2.66)#1,829 |
| 29. | 37408 | 4.6% | 1.7%(+2.90)#29 | 2.1%(+2.42)#2,050 |
| 30. | 37135 | 4.6% | 1.7%(+2.89)#30 | 2.1%(+2.41)#2,065 |
| 31. | 37705 | 4.4% | 1.7%(+2.74)#31 | 2.1%(+2.25)#2,252 |
| 32. | 37902 | 4.4% | 1.7%(+2.72)#32 | 2.1%(+2.24)#2,264 |
| 33. | 37840 | 4.4% | 1.7%(+2.69)#33 | 2.1%(+2.21)#2,311 |
| 34. | 37830 | 4.3% | 1.7%(+2.67)#34 | 2.1%(+2.19)#2,328 |
| 35. | 38334 | 4.2% | 1.7%(+2.54)#35 | 2.1%(+2.06)#2,485 |
| 36. | 38231 | 4.2% | 1.7%(+2.52)#36 | 2.1%(+2.04)#2,501 |
| 37. | 38563 | 4.1% | 1.7%(+2.43)#37 | 2.1%(+1.94)#2,626 |
| 38. | 37878 | 4.1% | 1.7%(+2.41)#38 | 2.1%(+1.93)#2,657 |
| 39. | 37362 | 4.0% | 1.7%(+2.36)#39 | 2.1%(+1.88)#2,728 |
| 40. | 37772 | 4.0% | 1.7%(+2.35)#40 | 2.1%(+1.87)#2,740 |
| 41. | 38345 | 4.0% | 1.7%(+2.33)#41 | 2.1%(+1.84)#2,771 |
| 42. | 38387 | 3.9% | 1.7%(+2.22)#42 | 2.1%(+1.74)#2,954 |
| 43. | 38487 | 3.8% | 1.7%(+2.16)#43 | 2.1%(+1.68)#3,034 |
| 44. | 37755 | 3.8% | 1.7%(+2.16)#44 | 2.1%(+1.68)#3,044 |
| 45. | 37931 | 3.8% | 1.7%(+2.15)#45 | 2.1%(+1.67)#3,054 |
| 46. | 37060 | 3.8% | 1.7%(+2.13)#46 | 2.1%(+1.65)#3,090 |
| 47. | 37932 | 3.7% | 1.7%(+2.00)#47 | 2.1%(+1.52)#3,366 |
| 48. | 38482 | 3.7% | 1.7%(+1.99)#48 | 2.1%(+1.51)#3,375 |
| 49. | 37145 | 3.6% | 1.7%(+1.98)#49 | 2.1%(+1.50)#3,418 |
| 50. | 38554 | 3.6% | 1.7%(+1.96)#50 | 2.1%(+1.48)#3,448 |
| 51. | 38463 | 3.6% | 1.7%(+1.93)#51 | 2.1%(+1.45)#3,517 |
| 52. | 38481 | 3.5% | 1.7%(+1.88)#52 | 2.1%(+1.40)#3,625 |
| 53. | 37381 | 3.5% | 1.7%(+1.81)#53 | 2.1%(+1.33)#3,793 |
| 54. | 38469 | 3.5% | 1.7%(+1.81)#54 | 2.1%(+1.33)#3,797 |
| 55. | 37663 | 3.4% | 1.7%(+1.77)#55 | 2.1%(+1.29)#3,875 |
| 56. | 38017 | 3.4% | 1.7%(+1.76)#56 | 2.1%(+1.28)#3,917 |
| 57. | 37405 | 3.4% | 1.7%(+1.75)#57 | 2.1%(+1.27)#3,924 |
| 58. | 37149 | 3.4% | 1.7%(+1.72)#58 | 2.1%(+1.24)#3,979 |
| 59. | 37363 | 3.4% | 1.7%(+1.71)#59 | 2.1%(+1.23)#4,008 |
| 60. | 38587 | 3.3% | 1.7%(+1.62)#60 | 2.1%(+1.14)#4,225 |
| 61. | 37179 | 3.3% | 1.7%(+1.62)#61 | 2.1%(+1.14)#4,241 |
| 62. | 38454 | 3.3% | 1.7%(+1.60)#62 | 2.1%(+1.12)#4,268 |
| 63. | 38139 | 3.3% | 1.7%(+1.60)#63 | 2.1%(+1.12)#4,282 |
| 64. | 37660 | 3.2% | 1.7%(+1.56)#64 | 2.1%(+1.07)#4,407 |
| 65. | 38451 | 3.2% | 1.7%(+1.51)#65 | 2.1%(+1.03)#4,514 |
| 66. | 37303 | 3.2% | 1.7%(+1.49)#66 | 2.1%(+1.01)#4,588 |
| 67. | 37025 | 3.2% | 1.7%(+1.48)#67 | 2.1%(+1.00)#4,606 |
| 68. | 37375 | 3.1% | 1.7%(+1.43)#68 | 2.1%(+0.954)#4,738 |
| 69. | 38321 | 3.1% | 1.7%(+1.42)#69 | 2.1%(+0.940)#4,772 |
| 70. | 37058 | 3.1% | 1.7%(+1.40)#70 | 2.1%(+0.921)#4,809 |
| 71. | 38060 | 3.1% | 1.7%(+1.40)#71 | 2.1%(+0.919)#4,818 |
| 72. | 38236 | 3.0% | 1.7%(+1.33)#72 | 2.1%(+0.847)#5,068 |
| 73. | 38103 | 3.0% | 1.7%(+1.33)#73 | 2.1%(+0.845)#5,075 |
| 74. | 37079 | 3.0% | 1.7%(+1.32)#74 | 2.1%(+0.835)#5,107 |
| 75. | 37037 | 3.0% | 1.7%(+1.31)#75 | 2.1%(+0.828)#5,130 |
| 76. | 37355 | 3.0% | 1.7%(+1.31)#76 | 2.1%(+0.826)#5,140 |
| 77. | 37142 | 3.0% | 1.7%(+1.31)#77 | 2.1%(+0.826)#5,141 |
| 78. | 38104 | 3.0% | 1.7%(+1.30)#78 | 2.1%(+0.820)#5,165 |
| 79. | 38256 | 3.0% | 1.7%(+1.30)#79 | 2.1%(+0.816)#5,174 |
| 80. | 37091 | 3.0% | 1.7%(+1.29)#80 | 2.1%(+0.812)#5,194 |
| 81. | 37709 | 3.0% | 1.7%(+1.29)#81 | 2.1%(+0.806)#5,215 |
| 82. | 37307 | 3.0% | 1.7%(+1.29)#82 | 2.1%(+0.805)#5,222 |
| 83. | 37664 | 2.9% | 1.7%(+1.25)#83 | 2.1%(+0.768)#5,369 |
| 84. | 37185 | 2.9% | 1.7%(+1.22)#84 | 2.1%(+0.735)#5,472 |
| 85. | 37216 | 2.8% | 1.7%(+1.16)#85 | 2.1%(+0.681)#5,659 |
| 86. | 37921 | 2.8% | 1.7%(+1.13)#86 | 2.1%(+0.647)#5,804 |
| 87. | 37403 | 2.8% | 1.7%(+1.12)#87 | 2.1%(+0.637)#5,835 |
| 88. | 38259 | 2.8% | 1.7%(+1.11)#88 | 2.1%(+0.629)#5,876 |
| 89. | 37748 | 2.8% | 1.7%(+1.10)#89 | 2.1%(+0.618)#5,908 |
| 90. | 37134 | 2.7% | 1.7%(+1.06)#90 | 2.1%(+0.582)#6,038 |
| 91. | 38341 | 2.7% | 1.7%(+1.05)#91 | 2.1%(+0.565)#6,103 |
| 92. | 37357 | 2.7% | 1.7%(+1.02)#92 | 2.1%(+0.543)#6,195 |
| 93. | 37118 | 2.7% | 1.7%(+1.01)#93 | 2.1%(+0.529)#6,248 |
| 94. | 37215 | 2.7% | 1.7%(+1.01)#94 | 2.1%(+0.529)#6,251 |
| 95. | 38355 | 2.7% | 1.7%(+1.01)#95 | 2.1%(+0.527)#6,260 |
| 96. | 37343 | 2.7% | 1.7%(+1.00)#96 | 2.1%(+0.519)#6,296 |
| 97. | 37388 | 2.7% | 1.7%(+0.998)#97 | 2.1%(+0.517)#6,307 |
| 98. | 37885 | 2.7% | 1.7%(+0.996)#98 | 2.1%(+0.515)#6,317 |
| 99. | 37391 | 2.7% | 1.7%(+0.993)#99 | 2.1%(+0.512)#6,325 |
| 100. | 37377 | 2.6% | 1.7%(+0.982)#100 | 2.1%(+0.501)#6,367 |
Common Questions
What are the Top 10 Zip Codes with the Highest Percentage of Population Employed in Architecture & Engineering in Tennessee?
Top 10 Zip Codes with the Highest Percentage of Population Employed in Architecture & Engineering in Tennessee are:
What zip code has the Highest Percentage of Population Employed in Architecture & Engineering in Tennessee?
38476 has the Highest Percentage of Population Employed in Architecture & Engineering in Tennessee with 11.3%.
What is the Percentage of Population Employed in Architecture & Engineering in the State of Tennessee?
Percentage of Population Employed in Architecture & Engineering in Tennessee is 1.7%.
What is the Percentage of Population Employed in Architecture & Engineering in the United States?
Percentage of Population Employed in Architecture & Engineering in the United States is 2.1%.