Zip Codes with the Highest Percentage of Population Employed in Architecture & Engineering in Maryville, TN
RELATED REPORTS & OPTIONS
Architecture & Engineering
Maryville
Compare Zip Codes
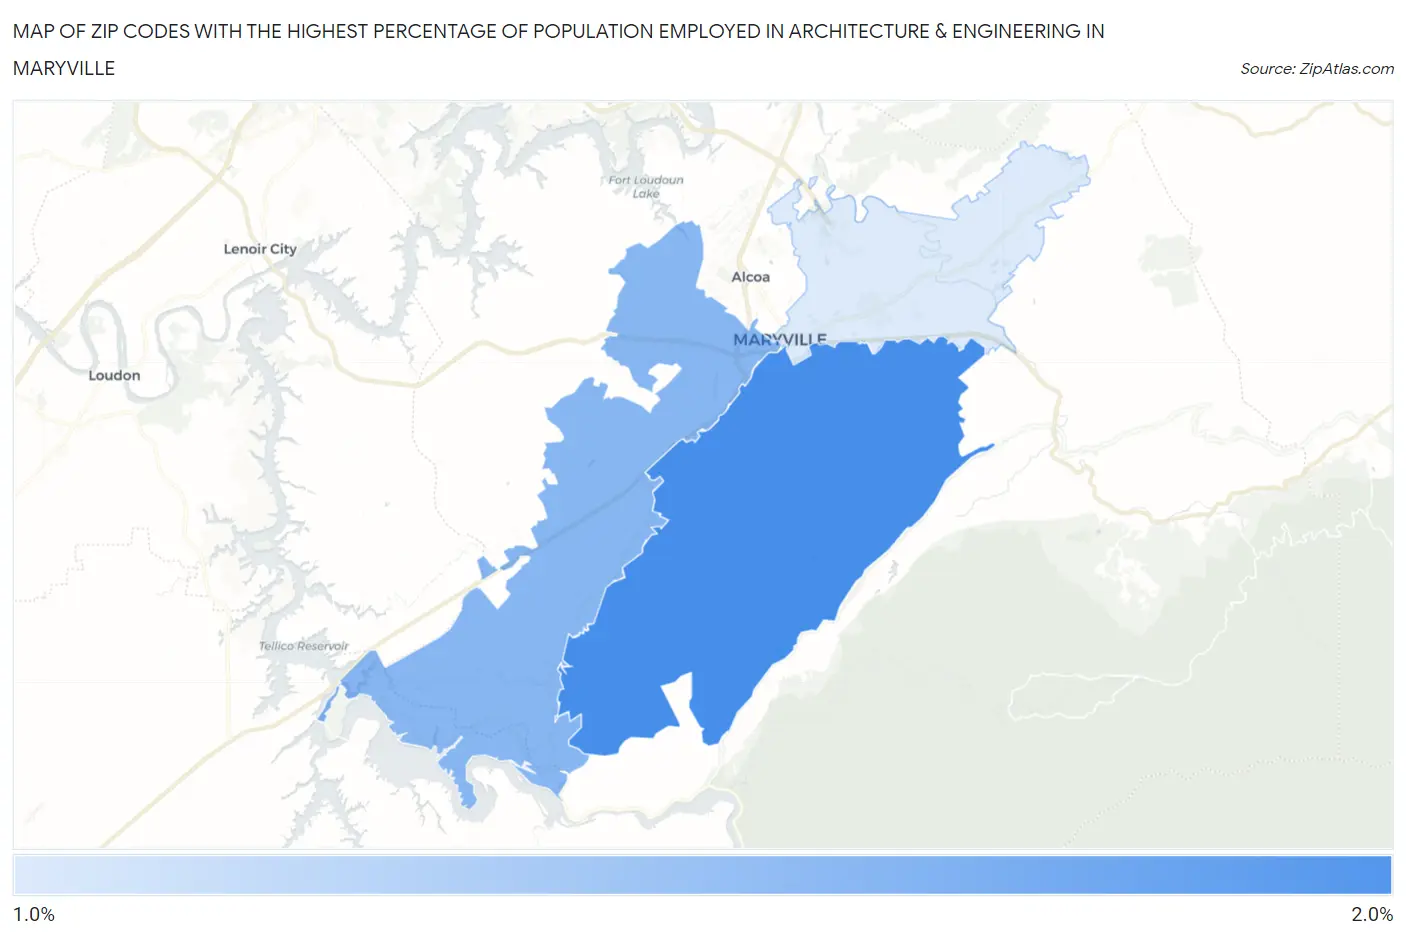
Map of Zip Codes with the Highest Percentage of Population Employed in Architecture & Engineering in Maryville
1.0%
1.8%
Zip Codes with the Highest Percentage of Population Employed in Architecture & Engineering in Maryville, TN
| Zip Code | % Employed | vs State | vs National | |
| 1. | 37803 | 1.8% | 1.7%(+0.142)#200 | 2.1%(-0.340)#10,774 |
| 2. | 37801 | 1.5% | 1.7%(-0.196)#251 | 2.1%(-0.677)#13,081 |
| 3. | 37804 | 1.0% | 1.7%(-0.640)#329 | 2.1%(-1.12)#16,406 |
1
Common Questions
What are the Top Zip Codes with the Highest Percentage of Population Employed in Architecture & Engineering in Maryville, TN?
Top Zip Codes with the Highest Percentage of Population Employed in Architecture & Engineering in Maryville, TN are:
What zip code has the Highest Percentage of Population Employed in Architecture & Engineering in Maryville, TN?
37803 has the Highest Percentage of Population Employed in Architecture & Engineering in Maryville, TN with 1.8%.
What is the Percentage of Population Employed in Architecture & Engineering in Maryville, TN?
Percentage of Population Employed in Architecture & Engineering in Maryville is 1.4%.
What is the Percentage of Population Employed in Architecture & Engineering in Tennessee?
Percentage of Population Employed in Architecture & Engineering in Tennessee is 1.7%.
What is the Percentage of Population Employed in Architecture & Engineering in the United States?
Percentage of Population Employed in Architecture & Engineering in the United States is 2.1%.