Powells Crossroads, TN Map & Demographics
Powells Crossroads Map
Powells Crossroads Overview
$28,586
PER CAPITA INCOME
$80,035
AVG FAMILY INCOME
$64,100
AVG HOUSEHOLD INCOME
40.6%
WAGE / INCOME GAP [ % ]
59.4¢/ $1
WAGE / INCOME GAP [ $ ]
0.33
INEQUALITY / GINI INDEX
1,686
TOTAL POPULATION
894
MALE POPULATION
792
FEMALE POPULATION
112.88
MALES / 100 FEMALES
88.59
FEMALES / 100 MALES
38.8
MEDIAN AGE
3.0
AVG FAMILY SIZE
2.6
AVG HOUSEHOLD SIZE
814
LABOR FORCE [ PEOPLE ]
61.8%
PERCENT IN LABOR FORCE
5.2%
UNEMPLOYMENT RATE
Powells Crossroads Area Codes
Income in Powells Crossroads
Income Overview in Powells Crossroads
Per Capita Income in Powells Crossroads is $28,586, while median incomes of families and households are $80,035 and $64,100 respectively.
| Characteristic | Number | Measure |
| Per Capita Income | 1,686 | $28,586 |
| Median Family Income | 479 | $80,035 |
| Mean Family Income | 479 | $81,803 |
| Median Household Income | 640 | $64,100 |
| Mean Household Income | 640 | $74,079 |
| Income Deficit | 479 | $0 |
| Wage / Income Gap (%) | 1,686 | 40.57% |
| Wage / Income Gap ($) | 1,686 | 59.43¢ per $1 |
| Gini / Inequality Index | 1,686 | 0.33 |
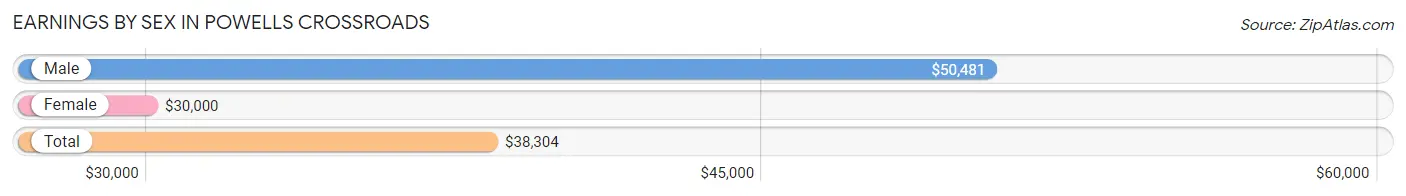
Earnings by Sex in Powells Crossroads
Average Earnings in Powells Crossroads are $38,304, $50,481 for men and $30,000 for women, a difference of 40.6%.
| Sex | Number | Average Earnings |
| Male | 465 (56.8%) | $50,481 |
| Female | 354 (43.2%) | $30,000 |
| Total | 819 (100.0%) | $38,304 |
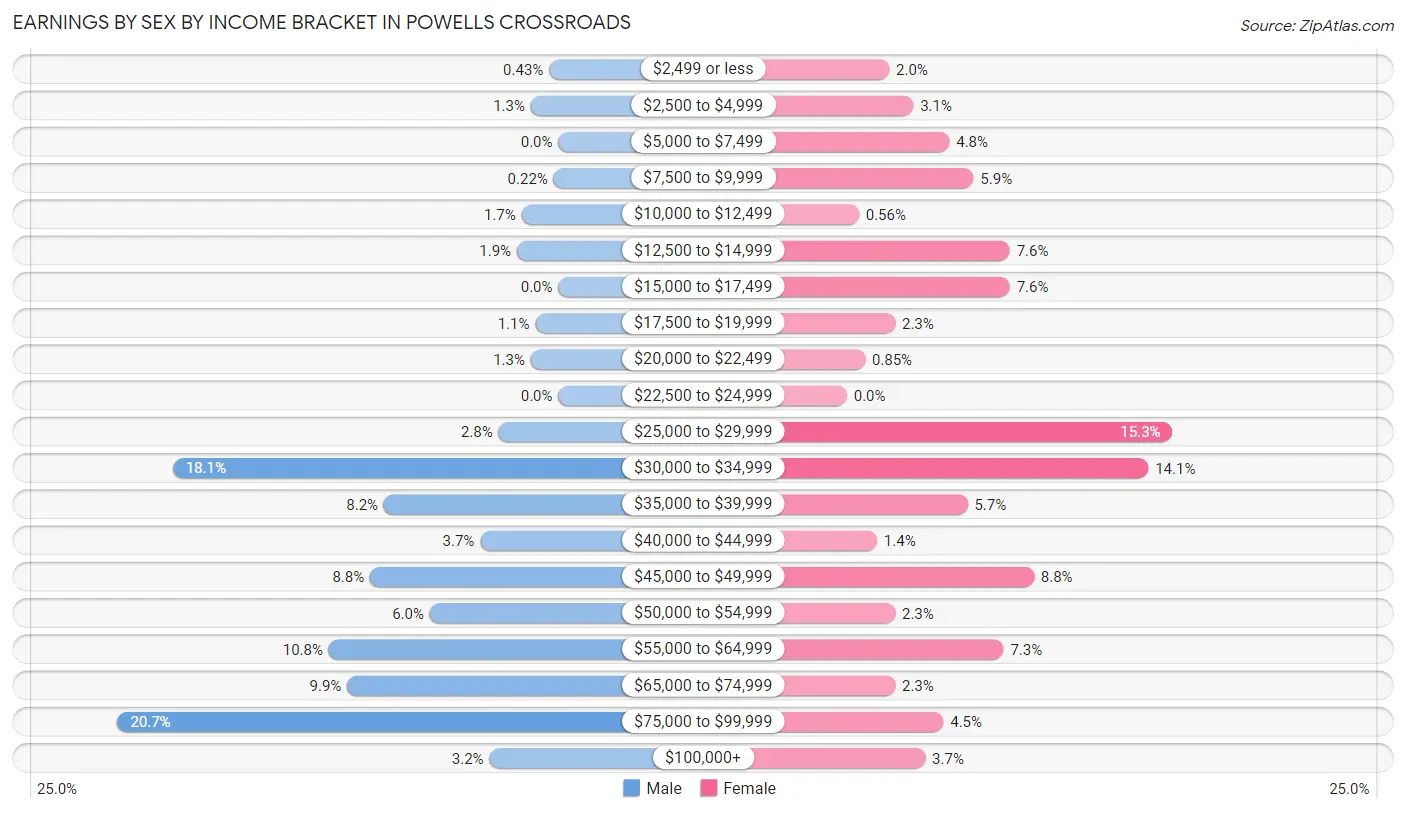
Earnings by Sex by Income Bracket in Powells Crossroads
The most common earnings brackets in Powells Crossroads are $75,000 to $99,999 for men (96 | 20.6%) and $25,000 to $29,999 for women (54 | 15.2%).
| Income | Male | Female |
| $2,499 or less | 2 (0.4%) | 7 (2.0%) |
| $2,500 to $4,999 | 6 (1.3%) | 11 (3.1%) |
| $5,000 to $7,499 | 0 (0.0%) | 17 (4.8%) |
| $7,500 to $9,999 | 1 (0.2%) | 21 (5.9%) |
| $10,000 to $12,499 | 8 (1.7%) | 2 (0.6%) |
| $12,500 to $14,999 | 9 (1.9%) | 27 (7.6%) |
| $15,000 to $17,499 | 0 (0.0%) | 27 (7.6%) |
| $17,500 to $19,999 | 5 (1.1%) | 8 (2.3%) |
| $20,000 to $22,499 | 6 (1.3%) | 3 (0.9%) |
| $22,500 to $24,999 | 0 (0.0%) | 0 (0.0%) |
| $25,000 to $29,999 | 13 (2.8%) | 54 (15.2%) |
| $30,000 to $34,999 | 84 (18.1%) | 50 (14.1%) |
| $35,000 to $39,999 | 38 (8.2%) | 20 (5.7%) |
| $40,000 to $44,999 | 17 (3.7%) | 5 (1.4%) |
| $45,000 to $49,999 | 41 (8.8%) | 31 (8.8%) |
| $50,000 to $54,999 | 28 (6.0%) | 8 (2.3%) |
| $55,000 to $64,999 | 50 (10.7%) | 26 (7.3%) |
| $65,000 to $74,999 | 46 (9.9%) | 8 (2.3%) |
| $75,000 to $99,999 | 96 (20.6%) | 16 (4.5%) |
| $100,000+ | 15 (3.2%) | 13 (3.7%) |
| Total | 465 (100.0%) | 354 (100.0%) |
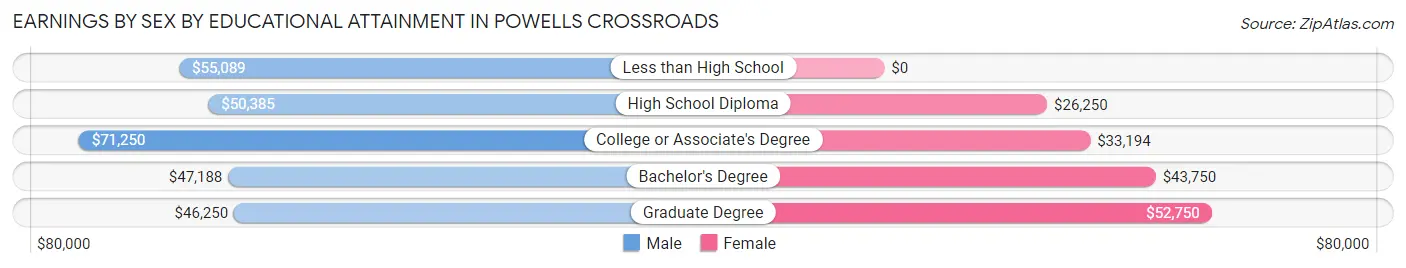
Earnings by Sex by Educational Attainment in Powells Crossroads
Average earnings in Powells Crossroads are $55,547 for men and $30,750 for women, a difference of 44.6%. Men with an educational attainment of college or associate's degree enjoy the highest average annual earnings of $71,250, while those with graduate degree education earn the least with $46,250. Women with an educational attainment of graduate degree earn the most with the average annual earnings of $52,750, while those with high school diploma education have the smallest earnings of $26,250.
| Educational Attainment | Male Income | Female Income |
| Less than High School | $55,089 | $0 |
| High School Diploma | $50,385 | $26,250 |
| College or Associate's Degree | $71,250 | $33,194 |
| Bachelor's Degree | $47,188 | $43,750 |
| Graduate Degree | $46,250 | $52,750 |
| Total | $55,547 | $30,750 |
Family Income in Powells Crossroads
Family Income Brackets in Powells Crossroads
According to the Powells Crossroads family income data, there are 135 families falling into the $100,000 to $149,999 income range, which is the most common income bracket and makes up 28.2% of all families. Conversely, the less than $10,000 income bracket is the least frequent group with only 4 families (0.8%) belonging to this category.
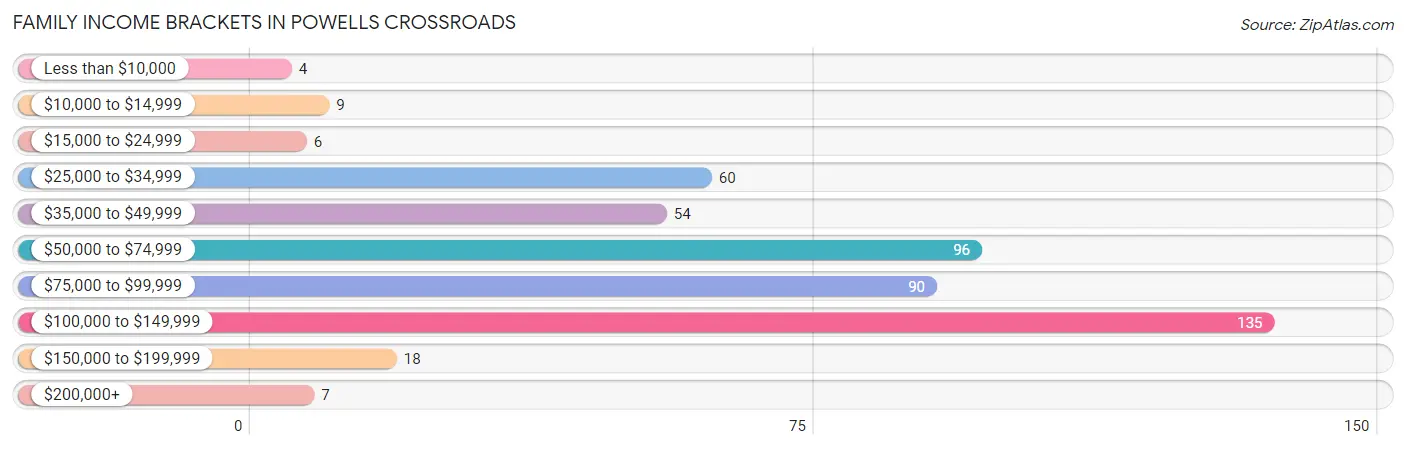
| Income Bracket | # Families | % Families |
| Less than $10,000 | 4 | 0.8% |
| $10,000 to $14,999 | 9 | 1.9% |
| $15,000 to $24,999 | 6 | 1.3% |
| $25,000 to $34,999 | 60 | 12.5% |
| $35,000 to $49,999 | 54 | 11.3% |
| $50,000 to $74,999 | 96 | 20.0% |
| $75,000 to $99,999 | 90 | 18.8% |
| $100,000 to $149,999 | 135 | 28.2% |
| $150,000 to $199,999 | 18 | 3.8% |
| $200,000+ | 7 | 1.5% |
Family Income by Famaliy Size in Powells Crossroads
4-person families (86 | 17.9%) account for the highest median family income in Powells Crossroads with $114,085 per family, while 2-person families (213 | 44.5%) have the highest median income of $29,062 per family member.
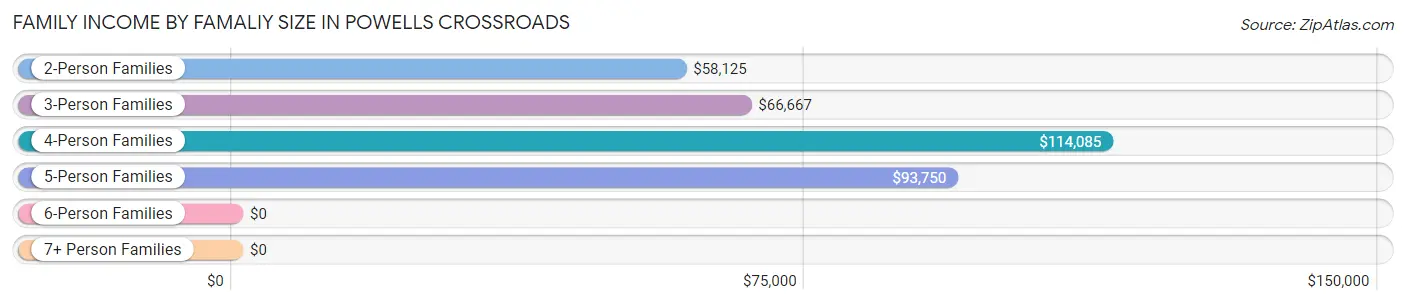
| Income Bracket | # Families | Median Income |
| 2-Person Families | 213 (44.5%) | $58,125 |
| 3-Person Families | 108 (22.6%) | $66,667 |
| 4-Person Families | 86 (17.9%) | $114,085 |
| 5-Person Families | 72 (15.0%) | $93,750 |
| 6-Person Families | 0 (0.0%) | $0 |
| 7+ Person Families | 0 (0.0%) | $0 |
| Total | 479 (100.0%) | $80,035 |
Family Income by Number of Earners in Powells Crossroads
The median family income in Powells Crossroads is $80,035, with families comprising 2 earners (191) having the highest median family income of $102,750, while families with 1 earner (179) have the lowest median family income of $48,036, accounting for 39.9% and 37.4% of families, respectively.
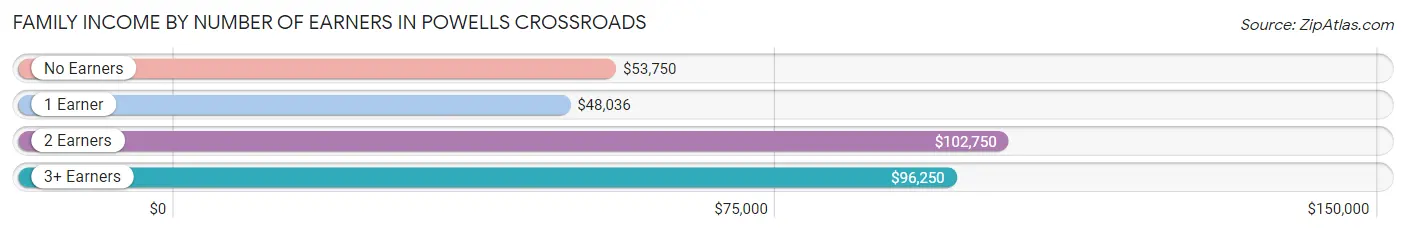
| Number of Earners | # Families | Median Income |
| No Earners | 76 (15.9%) | $53,750 |
| 1 Earner | 179 (37.4%) | $48,036 |
| 2 Earners | 191 (39.9%) | $102,750 |
| 3+ Earners | 33 (6.9%) | $96,250 |
| Total | 479 (100.0%) | $80,035 |
Household Income in Powells Crossroads
Household Income Brackets in Powells Crossroads
With 173 households falling in the category, the $50,000 to $74,999 income range is the most frequent in Powells Crossroads, accounting for 27.0% of all households. In contrast, only 10 households (1.6%) fall into the $200,000+ income bracket, making it the least populous group.
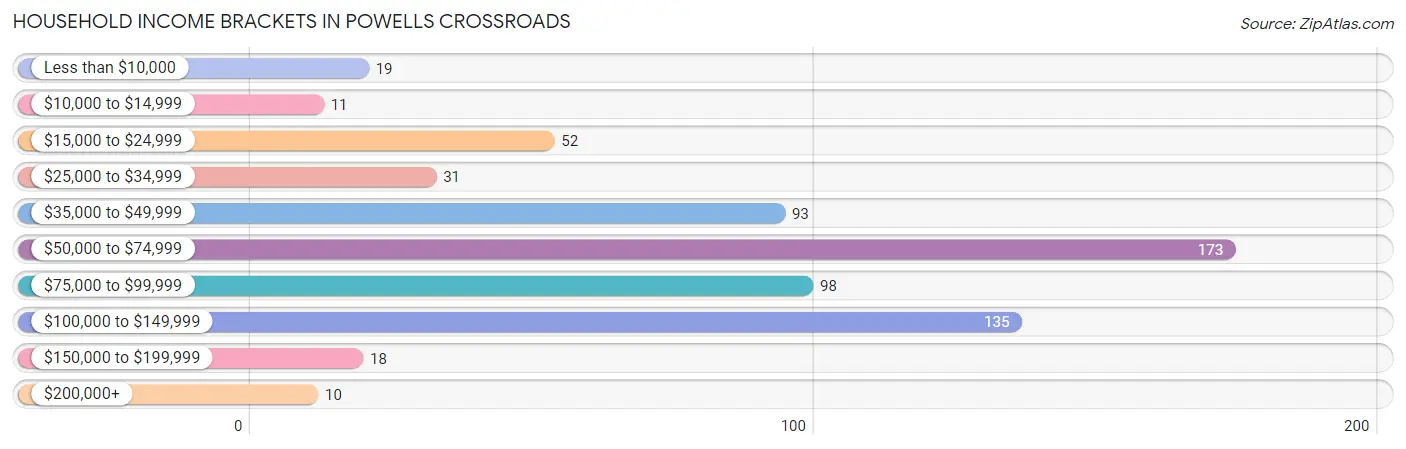
| Income Bracket | # Households | % Households |
| Less than $10,000 | 19 | 3.0% |
| $10,000 to $14,999 | 11 | 1.7% |
| $15,000 to $24,999 | 52 | 8.1% |
| $25,000 to $34,999 | 31 | 4.8% |
| $35,000 to $49,999 | 93 | 14.5% |
| $50,000 to $74,999 | 173 | 27.0% |
| $75,000 to $99,999 | 98 | 15.3% |
| $100,000 to $149,999 | 135 | 21.1% |
| $150,000 to $199,999 | 18 | 2.8% |
| $200,000+ | 10 | 1.6% |
Household Income by Householder Age in Powells Crossroads
The median household income in Powells Crossroads is $64,100, with the highest median household income of $86,607 found in the 25 to 44 years age bracket for the primary householder. A total of 165 households (25.8%) fall into this category. Meanwhile, the 65+ years age bracket for the primary householder has the lowest median household income of $38,438, with 184 households (28.7%) in this group.
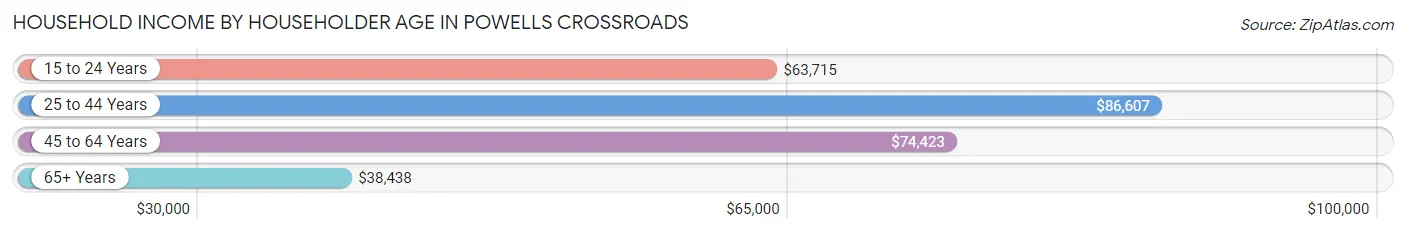
| Income Bracket | # Households | Median Income |
| 15 to 24 Years | 47 (7.3%) | $63,715 |
| 25 to 44 Years | 165 (25.8%) | $86,607 |
| 45 to 64 Years | 244 (38.1%) | $74,423 |
| 65+ Years | 184 (28.7%) | $38,438 |
| Total | 640 (100.0%) | $64,100 |
Poverty in Powells Crossroads
Income Below Poverty by Sex and Age in Powells Crossroads
With 3.7% poverty level for males and 2.6% for females among the residents of Powells Crossroads, 65 to 74 year old males and 55 to 64 year old females are the most vulnerable to poverty, with 15 males (22.1%) and 10 females (8.8%) in their respective age groups living below the poverty level.
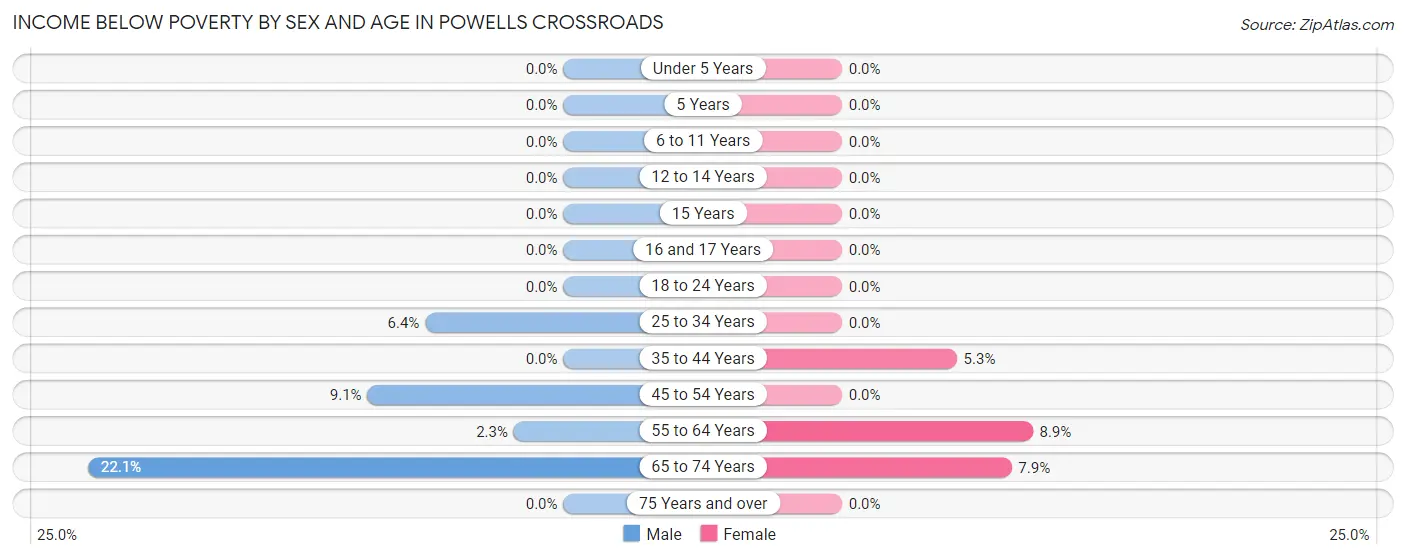
| Age Bracket | Male | Female |
| Under 5 Years | 0 (0.0%) | 0 (0.0%) |
| 5 Years | 0 (0.0%) | 0 (0.0%) |
| 6 to 11 Years | 0 (0.0%) | 0 (0.0%) |
| 12 to 14 Years | 0 (0.0%) | 0 (0.0%) |
| 15 Years | 0 (0.0%) | 0 (0.0%) |
| 16 and 17 Years | 0 (0.0%) | 0 (0.0%) |
| 18 to 24 Years | 0 (0.0%) | 0 (0.0%) |
| 25 to 34 Years | 5 (6.4%) | 0 (0.0%) |
| 35 to 44 Years | 0 (0.0%) | 4 (5.3%) |
| 45 to 54 Years | 9 (9.1%) | 0 (0.0%) |
| 55 to 64 Years | 4 (2.3%) | 10 (8.8%) |
| 65 to 74 Years | 15 (22.1%) | 7 (7.9%) |
| 75 Years and over | 0 (0.0%) | 0 (0.0%) |
| Total | 33 (3.7%) | 21 (2.6%) |
Income Above Poverty by Sex and Age in Powells Crossroads
According to the poverty statistics in Powells Crossroads, males aged under 5 years and females aged under 5 years are the age groups that are most secure financially, with 100.0% of males and 100.0% of females in these age groups living above the poverty line.
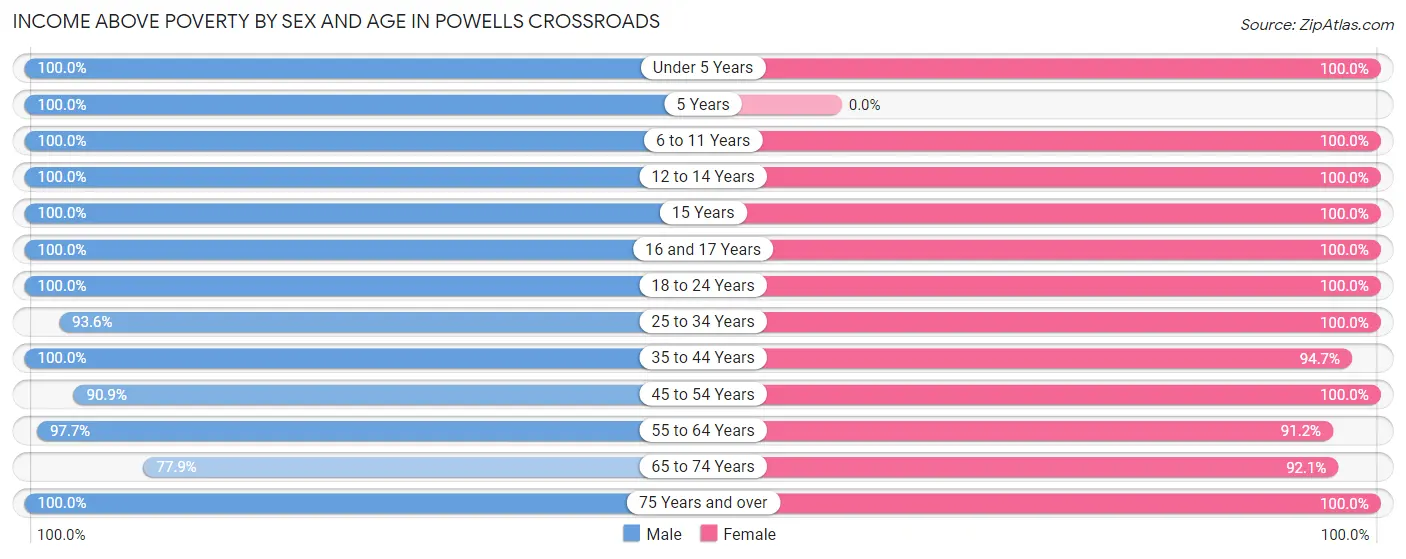
| Age Bracket | Male | Female |
| Under 5 Years | 42 (100.0%) | 65 (100.0%) |
| 5 Years | 5 (100.0%) | 0 (0.0%) |
| 6 to 11 Years | 66 (100.0%) | 66 (100.0%) |
| 12 to 14 Years | 18 (100.0%) | 49 (100.0%) |
| 15 Years | 49 (100.0%) | 9 (100.0%) |
| 16 and 17 Years | 12 (100.0%) | 13 (100.0%) |
| 18 to 24 Years | 136 (100.0%) | 90 (100.0%) |
| 25 to 34 Years | 73 (93.6%) | 69 (100.0%) |
| 35 to 44 Years | 113 (100.0%) | 71 (94.7%) |
| 45 to 54 Years | 90 (90.9%) | 79 (100.0%) |
| 55 to 64 Years | 170 (97.7%) | 103 (91.1%) |
| 65 to 74 Years | 53 (77.9%) | 82 (92.1%) |
| 75 Years and over | 34 (100.0%) | 75 (100.0%) |
| Total | 861 (96.3%) | 771 (97.4%) |
Income Below Poverty Among Married-Couple Families in Powells Crossroads
The poverty statistics for married-couple families in Powells Crossroads show that 3.5% or 13 of the total 367 families live below the poverty line. Families with no children have the highest poverty rate of 6.9%, comprising of 13 families. On the other hand, families with 1 or 2 children have the lowest poverty rate of 0.0%, which includes 0 families.
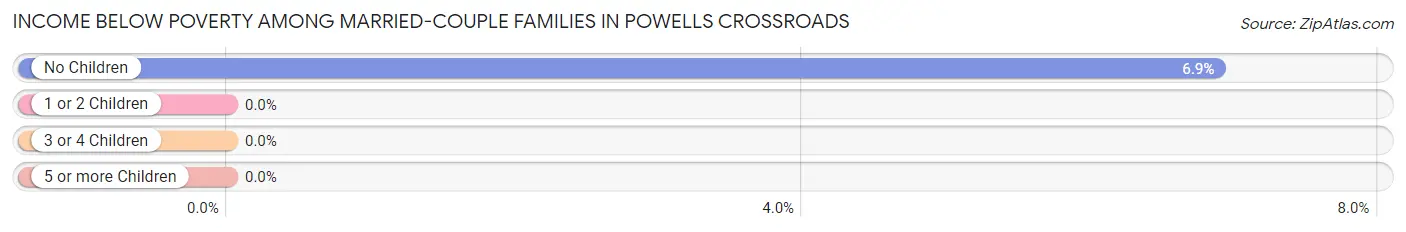
| Children | Above Poverty | Below Poverty |
| No Children | 176 (93.1%) | 13 (6.9%) |
| 1 or 2 Children | 132 (100.0%) | 0 (0.0%) |
| 3 or 4 Children | 46 (100.0%) | 0 (0.0%) |
| 5 or more Children | 0 (0.0%) | 0 (0.0%) |
| Total | 354 (96.5%) | 13 (3.5%) |
Income Below Poverty Among Single-Parent Households in Powells Crossroads
| Children | Single Father | Single Mother |
| No Children | 0 (0.0%) | 0 (0.0%) |
| 1 or 2 Children | 0 (0.0%) | 0 (0.0%) |
| 3 or 4 Children | 0 (0.0%) | 0 (0.0%) |
| 5 or more Children | 0 (0.0%) | 0 (0.0%) |
| Total | 0 (0.0%) | 0 (0.0%) |
Income Below Poverty Among Married-Couple vs Single-Parent Households in Powells Crossroads
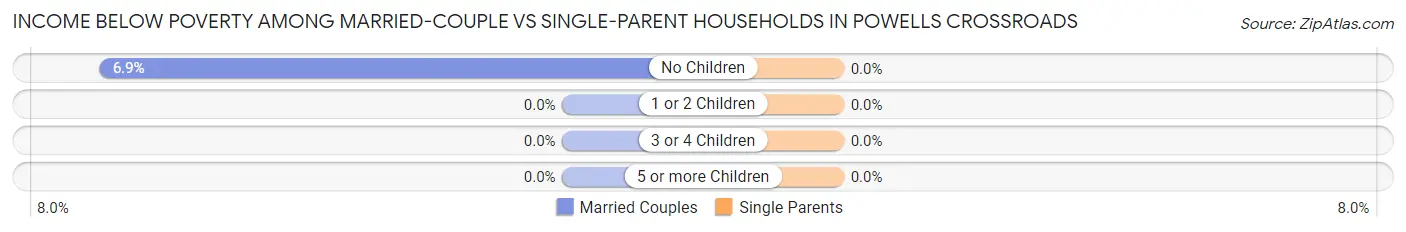
| Children | Married-Couple Families | Single-Parent Households |
| No Children | 13 (6.9%) | 0 (0.0%) |
| 1 or 2 Children | 0 (0.0%) | 0 (0.0%) |
| 3 or 4 Children | 0 (0.0%) | 0 (0.0%) |
| 5 or more Children | 0 (0.0%) | 0 (0.0%) |
| Total | 13 (3.5%) | 0 (0.0%) |
Race in Powells Crossroads
The most populous races in Powells Crossroads are White / Caucasian (1,638 | 97.2%), Hispanic or Latino (50 | 3.0%), and Two or more Races (33 | 2.0%).
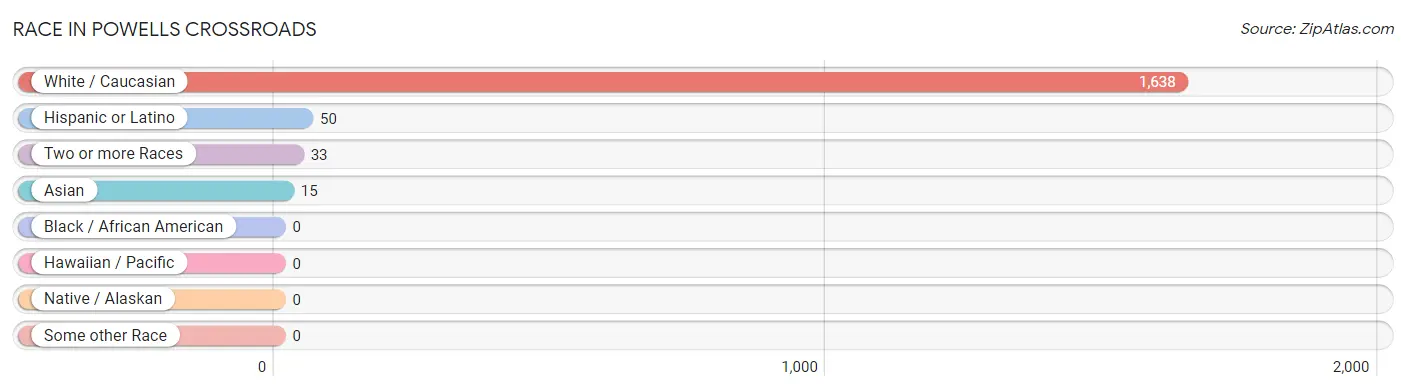
| Race | # Population | % Population |
| Asian | 15 | 0.9% |
| Black / African American | 0 | 0.0% |
| Hawaiian / Pacific | 0 | 0.0% |
| Hispanic or Latino | 50 | 3.0% |
| Native / Alaskan | 0 | 0.0% |
| White / Caucasian | 1,638 | 97.2% |
| Two or more Races | 33 | 2.0% |
| Some other Race | 0 | 0.0% |
| Total | 1,686 | 100.0% |
Ancestry in Powells Crossroads
The most populous ancestries reported in Powells Crossroads are English (275 | 16.3%), American (271 | 16.1%), Irish (108 | 6.4%), German (65 | 3.9%), and Scottish (65 | 3.9%), together accounting for 46.5% of all Powells Crossroads residents.
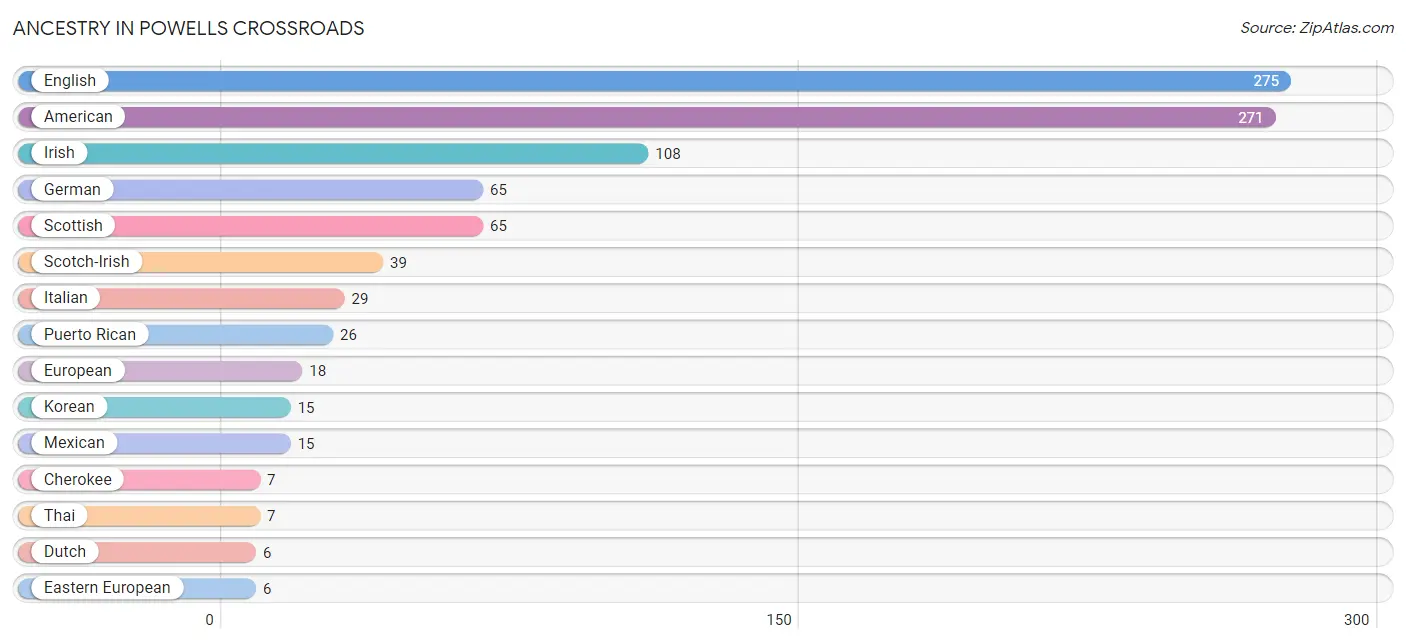
| Ancestry | # Population | % Population |
| American | 271 | 16.1% |
| Cherokee | 7 | 0.4% |
| Danish | 5 | 0.3% |
| Dutch | 6 | 0.4% |
| Eastern European | 6 | 0.4% |
| English | 275 | 16.3% |
| European | 18 | 1.1% |
| French | 5 | 0.3% |
| German | 65 | 3.9% |
| Irish | 108 | 6.4% |
| Italian | 29 | 1.7% |
| Korean | 15 | 0.9% |
| Lumbee | 5 | 0.3% |
| Mexican | 15 | 0.9% |
| Norwegian | 4 | 0.2% |
| Puerto Rican | 26 | 1.5% |
| Scandinavian | 4 | 0.2% |
| Scotch-Irish | 39 | 2.3% |
| Scottish | 65 | 3.9% |
| Swiss | 6 | 0.4% |
| Thai | 7 | 0.4% |
| Welsh | 5 | 0.3% | View All 22 Rows |
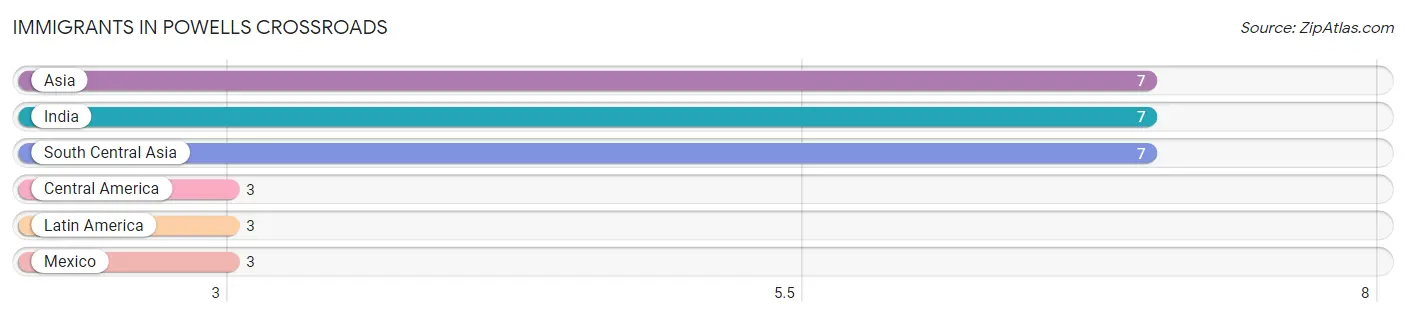
Immigrants in Powells Crossroads
The most numerous immigrant groups reported in Powells Crossroads came from Asia (7 | 0.4%), India (7 | 0.4%), South Central Asia (7 | 0.4%), Central America (3 | 0.2%), and Latin America (3 | 0.2%), together accounting for 1.6% of all Powells Crossroads residents.
| Immigration Origin | # Population | % Population |
| Asia | 7 | 0.4% |
| Central America | 3 | 0.2% |
| India | 7 | 0.4% |
| Latin America | 3 | 0.2% |
| Mexico | 3 | 0.2% |
| South Central Asia | 7 | 0.4% | View All 6 Rows |
Sex and Age in Powells Crossroads
Sex and Age in Powells Crossroads
The most populous age groups in Powells Crossroads are 15 to 19 Years (120 | 13.4%) for men and 20 to 24 Years (72 | 9.1%) for women.
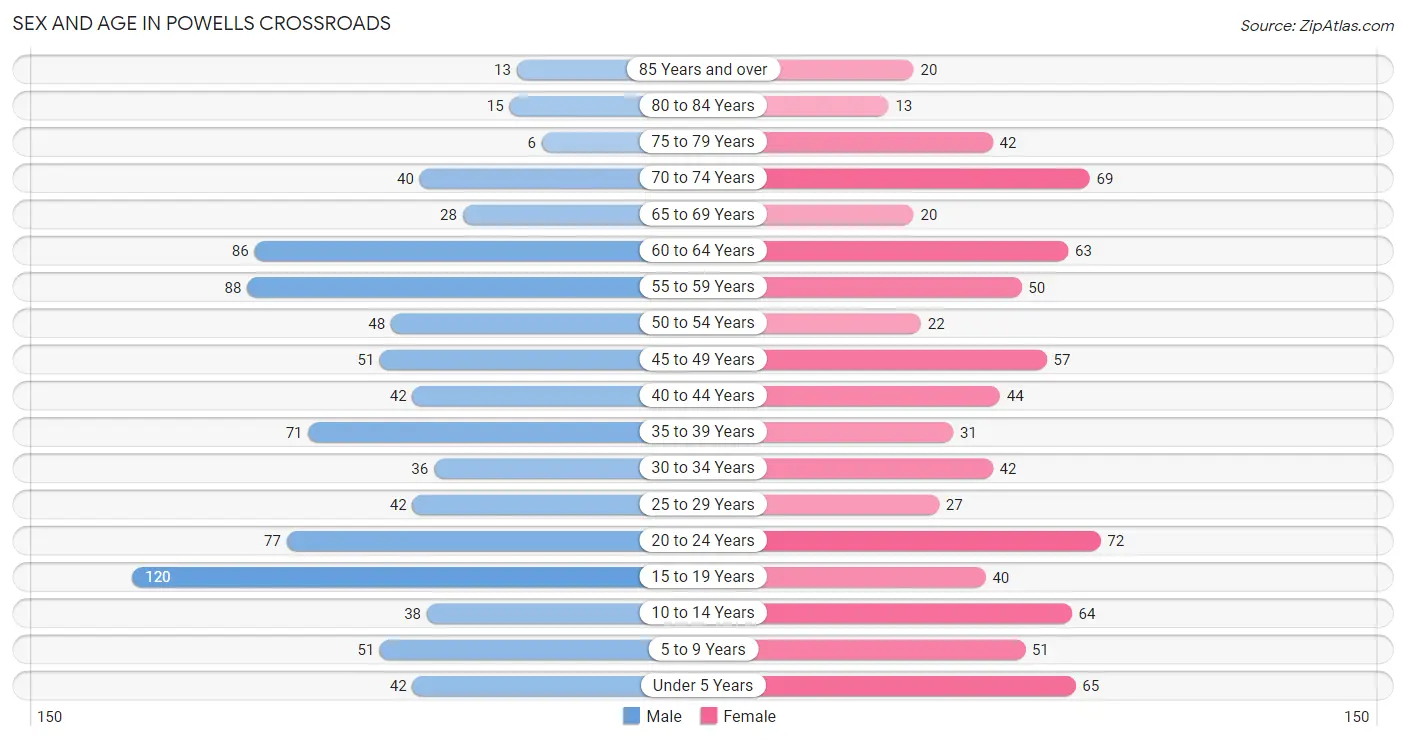
| Age Bracket | Male | Female |
| Under 5 Years | 42 (4.7%) | 65 (8.2%) |
| 5 to 9 Years | 51 (5.7%) | 51 (6.4%) |
| 10 to 14 Years | 38 (4.3%) | 64 (8.1%) |
| 15 to 19 Years | 120 (13.4%) | 40 (5.1%) |
| 20 to 24 Years | 77 (8.6%) | 72 (9.1%) |
| 25 to 29 Years | 42 (4.7%) | 27 (3.4%) |
| 30 to 34 Years | 36 (4.0%) | 42 (5.3%) |
| 35 to 39 Years | 71 (7.9%) | 31 (3.9%) |
| 40 to 44 Years | 42 (4.7%) | 44 (5.6%) |
| 45 to 49 Years | 51 (5.7%) | 57 (7.2%) |
| 50 to 54 Years | 48 (5.4%) | 22 (2.8%) |
| 55 to 59 Years | 88 (9.8%) | 50 (6.3%) |
| 60 to 64 Years | 86 (9.6%) | 63 (8.0%) |
| 65 to 69 Years | 28 (3.1%) | 20 (2.5%) |
| 70 to 74 Years | 40 (4.5%) | 69 (8.7%) |
| 75 to 79 Years | 6 (0.7%) | 42 (5.3%) |
| 80 to 84 Years | 15 (1.7%) | 13 (1.6%) |
| 85 Years and over | 13 (1.5%) | 20 (2.5%) |
| Total | 894 (100.0%) | 792 (100.0%) |
Families and Households in Powells Crossroads
Median Family Size in Powells Crossroads
The median family size in Powells Crossroads is 3.04 persons per family, with married-couple families (367 | 76.6%) accounting for the largest median family size of 3.26 persons per family. On the other hand, single male/father families (22 | 4.6%) represent the smallest median family size with 2.00 persons per family.
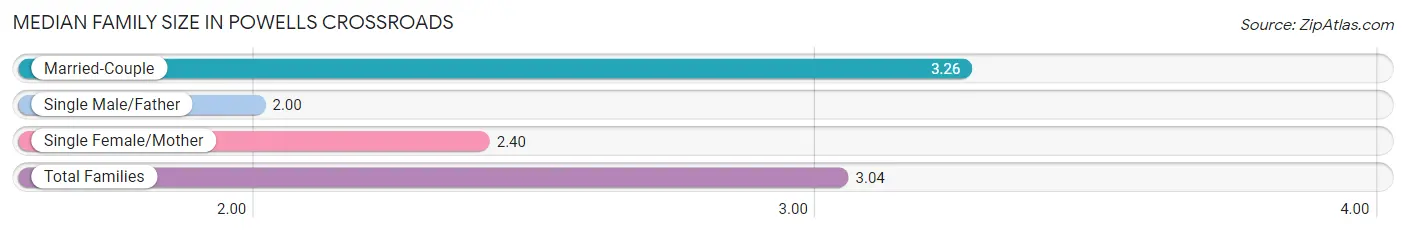
| Family Type | # Families | Family Size |
| Married-Couple | 367 (76.6%) | 3.26 |
| Single Male/Father | 22 (4.6%) | 2.00 |
| Single Female/Mother | 90 (18.8%) | 2.40 |
| Total Families | 479 (100.0%) | 3.04 |
Median Household Size in Powells Crossroads
The median household size in Powells Crossroads is 2.63 persons per household, with married-couple households (367 | 57.3%) accounting for the largest median household size of 3.26 persons per household. non-family households (161 | 25.2%) represent the smallest median household size with 1.14 persons per household.
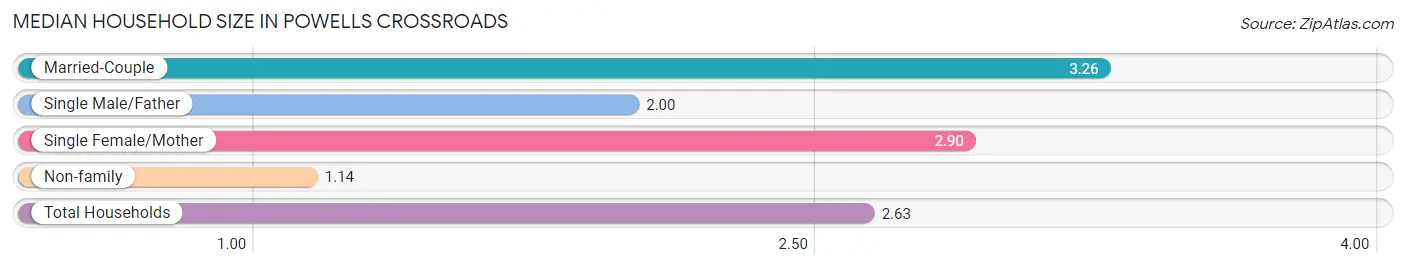
| Household Type | # Households | Household Size |
| Married-Couple | 367 (57.3%) | 3.26 |
| Single Male/Father | 22 (3.4%) | 2.00 |
| Single Female/Mother | 90 (14.1%) | 2.90 |
| Non-family | 161 (25.2%) | 1.14 |
| Total Households | 640 (100.0%) | 2.63 |
Household Size by Marriage Status in Powells Crossroads
Out of a total of 640 households in Powells Crossroads, 479 (74.8%) are family households, while 161 (25.2%) are nonfamily households. The most numerous type of family households are 2-person households, comprising 209, and the most common type of nonfamily households are 1-person households, comprising 141.
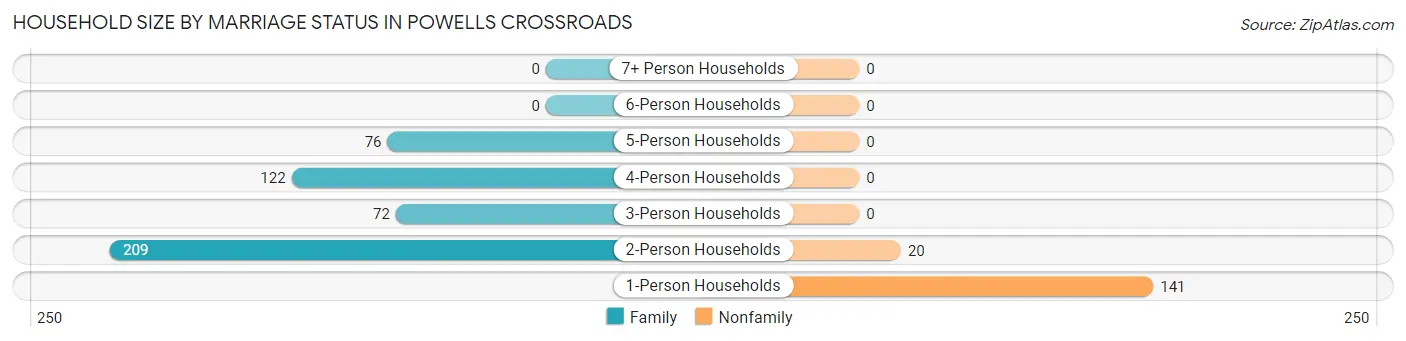
| Household Size | Family Households | Nonfamily Households |
| 1-Person Households | - | 141 (22.0%) |
| 2-Person Households | 209 (32.7%) | 20 (3.1%) |
| 3-Person Households | 72 (11.3%) | 0 (0.0%) |
| 4-Person Households | 122 (19.1%) | 0 (0.0%) |
| 5-Person Households | 76 (11.9%) | 0 (0.0%) |
| 6-Person Households | 0 (0.0%) | 0 (0.0%) |
| 7+ Person Households | 0 (0.0%) | 0 (0.0%) |
| Total | 479 (74.8%) | 161 (25.2%) |
Female Fertility in Powells Crossroads
Fertility by Age in Powells Crossroads
Average fertility rate in Powells Crossroads is 203.0 births per 1,000 women. Women in the age bracket of 20 to 34 years have the highest fertility rate with 454.0 births per 1,000 women. Women in the age bracket of 20 to 34 years acount for 100.0% of all women with births.
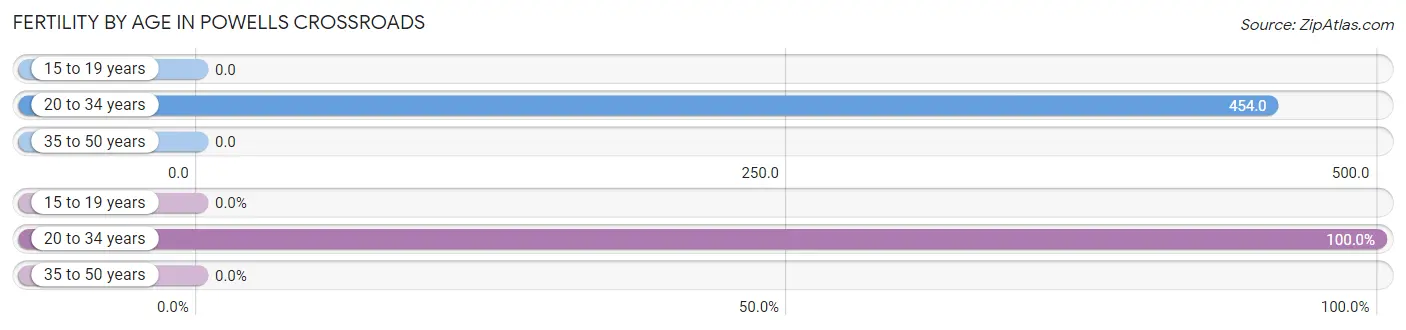
| Age Bracket | Women with Births | Births / 1,000 Women |
| 15 to 19 years | 0 (0.0%) | 0.0 |
| 20 to 34 years | 64 (100.0%) | 454.0 |
| 35 to 50 years | 0 (0.0%) | 0.0 |
| Total | 64 (100.0%) | 203.0 |
Fertility by Age by Marriage Status in Powells Crossroads
43.8% of women with births (64) in Powells Crossroads are married. The highest percentage of unmarried women with births falls into 20 to 34 years age bracket with 56.2% of them unmarried at the time of birth, while the lowest percentage of unmarried women with births belong to 20 to 34 years age bracket with 56.2% of them unmarried.
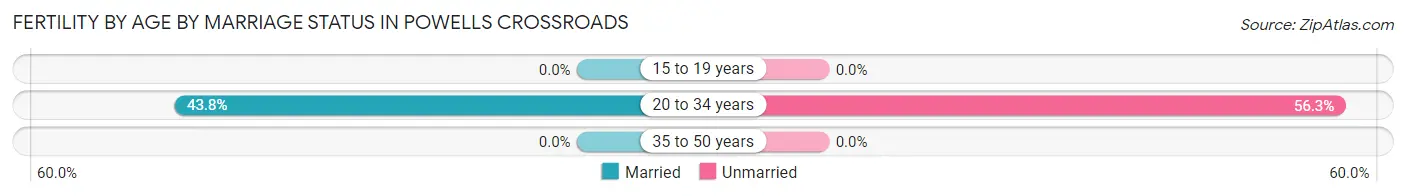
| Age Bracket | Married | Unmarried |
| 15 to 19 years | 0 (0.0%) | 0 (0.0%) |
| 20 to 34 years | 28 (43.8%) | 36 (56.2%) |
| 35 to 50 years | 0 (0.0%) | 0 (0.0%) |
| Total | 28 (43.8%) | 36 (56.2%) |
Fertility by Education in Powells Crossroads
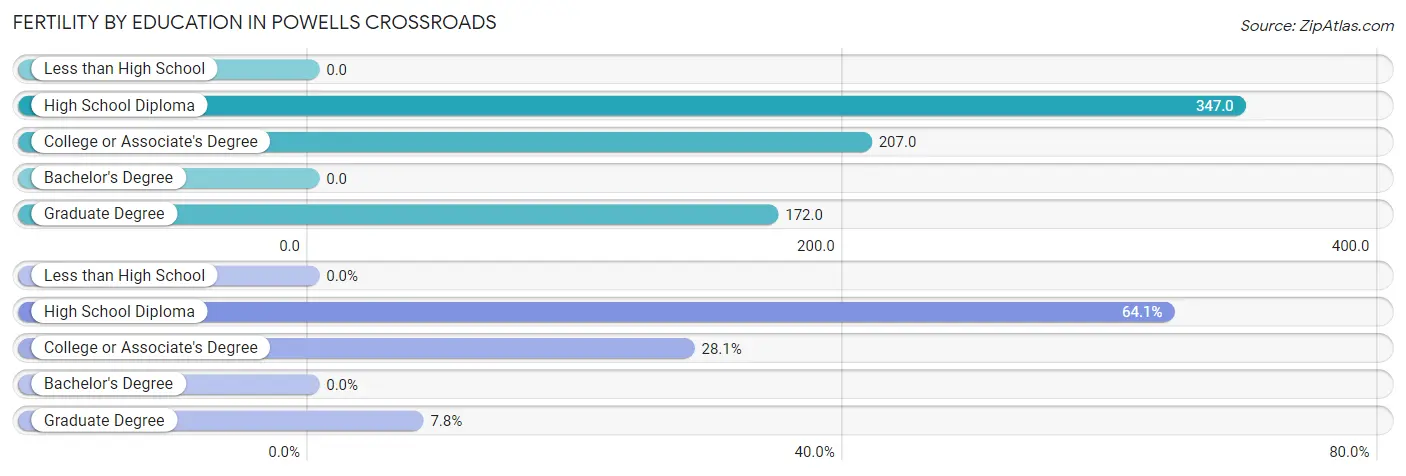
| Educational Attainment | Women with Births | Births / 1,000 Women |
| Less than High School | 0 (0.0%) | 0.0 |
| High School Diploma | 41 (64.1%) | 347.0 |
| College or Associate's Degree | 18 (28.1%) | 207.0 |
| Bachelor's Degree | 0 (0.0%) | 0.0 |
| Graduate Degree | 5 (7.8%) | 172.0 |
| Total | 64 (100.0%) | 203.0 |
Fertility by Education by Marriage Status in Powells Crossroads
56.2% of women with births in Powells Crossroads are unmarried. Women with the educational attainment of college or associate's degree are most likely to be married with 100.0% of them married at childbirth, while women with the educational attainment of high school diploma are least likely to be married with 87.8% of them unmarried at childbirth.
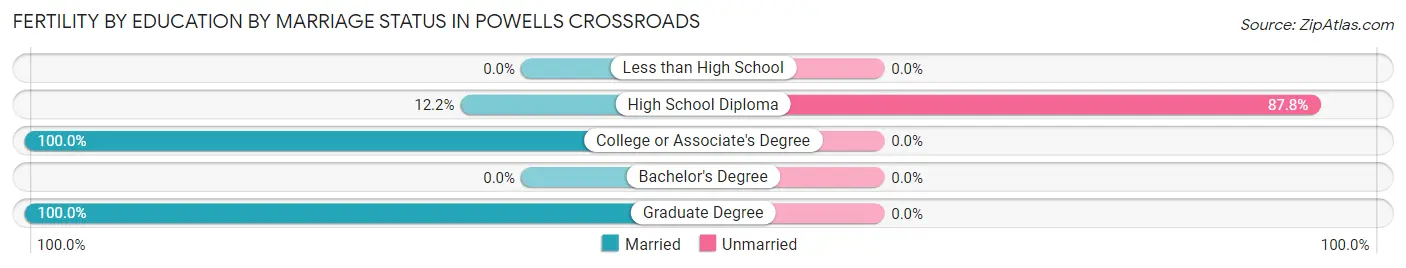
| Educational Attainment | Married | Unmarried |
| Less than High School | 0 (0.0%) | 0 (0.0%) |
| High School Diploma | 5 (12.2%) | 36 (87.8%) |
| College or Associate's Degree | 18 (100.0%) | 0 (0.0%) |
| Bachelor's Degree | 0 (0.0%) | 0 (0.0%) |
| Graduate Degree | 5 (100.0%) | 0 (0.0%) |
| Total | 28 (43.8%) | 36 (56.2%) |
Employment Characteristics in Powells Crossroads
Employment by Class of Employer in Powells Crossroads
Among the 717 employed individuals in Powells Crossroads, private company employees (529 | 73.8%), local government employees (72 | 10.0%), and not-for-profit organizations (49 | 6.8%) make up the most common classes of employment.
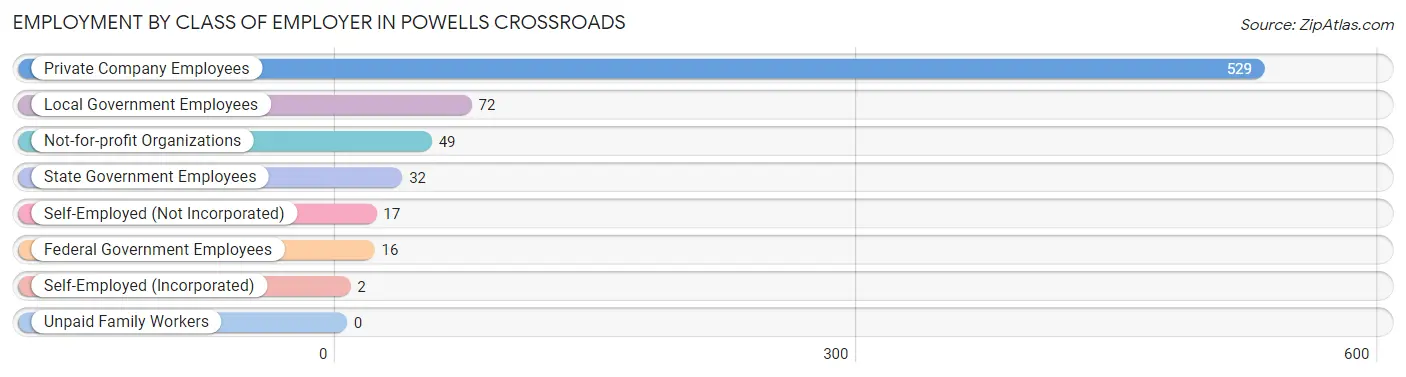
| Employer Class | # Employees | % Employees |
| Private Company Employees | 529 | 73.8% |
| Self-Employed (Incorporated) | 2 | 0.3% |
| Self-Employed (Not Incorporated) | 17 | 2.4% |
| Not-for-profit Organizations | 49 | 6.8% |
| Local Government Employees | 72 | 10.0% |
| State Government Employees | 32 | 4.5% |
| Federal Government Employees | 16 | 2.2% |
| Unpaid Family Workers | 0 | 0.0% |
| Total | 717 | 100.0% |
Employment Status by Age in Powells Crossroads
According to the labor force statistics for Powells Crossroads, out of the total population over 16 years of age (1,317), 61.8% or 814 individuals are in the labor force, with 5.2% or 42 of them unemployed. The age group with the highest labor force participation rate is 25 to 29 years, with 100.0% or 69 individuals in the labor force. Within the labor force, the 20 to 24 years age range has the highest percentage of unemployed individuals, with 21.1% or 31 of them being unemployed.
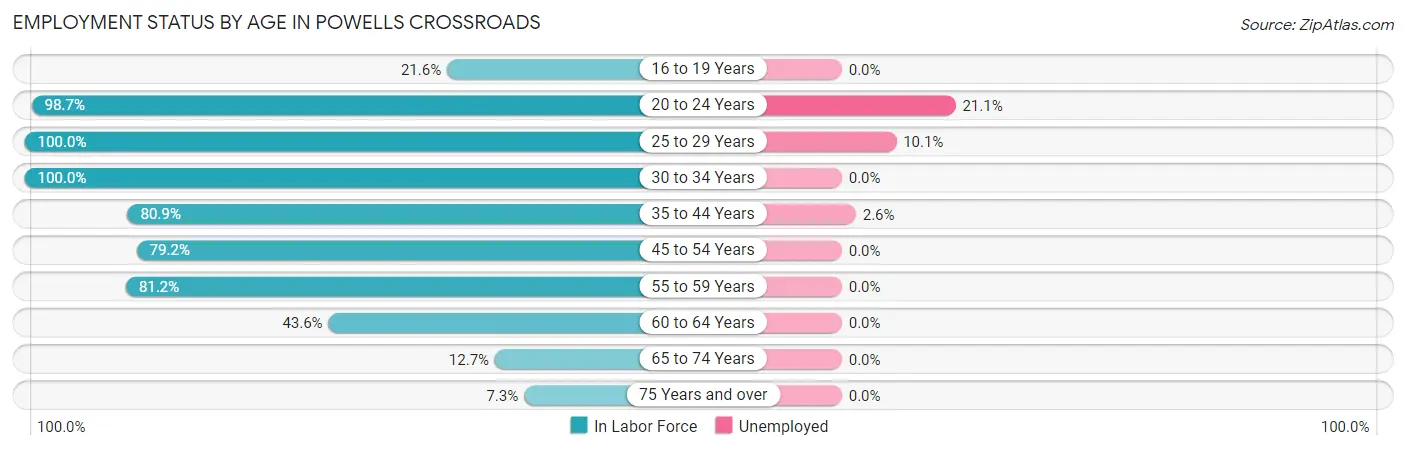
| Age Bracket | In Labor Force | Unemployed |
| 16 to 19 Years | 22 (21.6%) | 0 (0.0%) |
| 20 to 24 Years | 147 (98.7%) | 31 (21.1%) |
| 25 to 29 Years | 69 (100.0%) | 7 (10.1%) |
| 30 to 34 Years | 78 (100.0%) | 0 (0.0%) |
| 35 to 44 Years | 152 (80.9%) | 4 (2.6%) |
| 45 to 54 Years | 141 (79.2%) | 0 (0.0%) |
| 55 to 59 Years | 112 (81.2%) | 0 (0.0%) |
| 60 to 64 Years | 65 (43.6%) | 0 (0.0%) |
| 65 to 74 Years | 20 (12.7%) | 0 (0.0%) |
| 75 Years and over | 8 (7.3%) | 0 (0.0%) |
| Total | 814 (61.8%) | 42 (5.2%) |
Employment Status by Educational Attainment in Powells Crossroads
According to labor force statistics for Powells Crossroads, 77.1% of individuals (617) out of the total population between 25 and 64 years of age (800) are in the labor force, with 1.8% or 11 of them being unemployed. The group with the highest labor force participation rate are those with the educational attainment of bachelor's degree or higher, with 84.2% or 96 individuals in the labor force. Within the labor force, individuals with less than high school education have the highest percentage of unemployment, with 4.9% or 4 of them being unemployed.
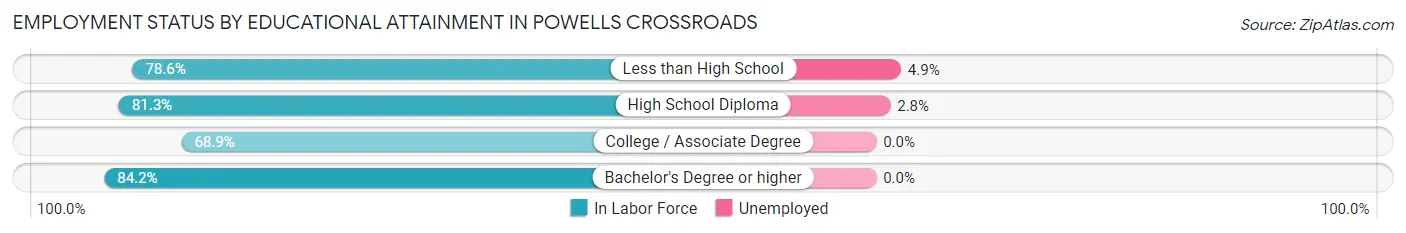
| Educational Attainment | In Labor Force | Unemployed |
| Less than High School | 81 (78.6%) | 5 (4.9%) |
| High School Diploma | 252 (81.3%) | 9 (2.8%) |
| College / Associate Degree | 188 (68.9%) | 0 (0.0%) |
| Bachelor's Degree or higher | 96 (84.2%) | 0 (0.0%) |
| Total | 617 (77.1%) | 14 (1.8%) |
Employment Occupations by Sex in Powells Crossroads
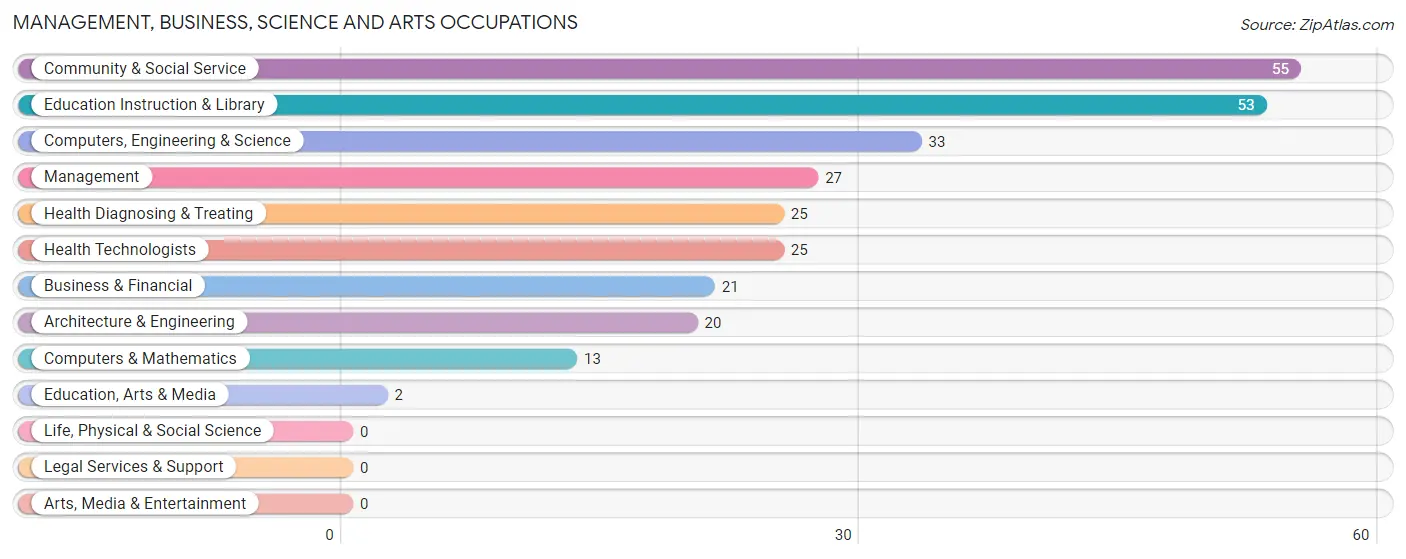
Management, Business, Science and Arts Occupations
The most common Management, Business, Science and Arts occupations in Powells Crossroads are Community & Social Service (55 | 7.1%), Education Instruction & Library (53 | 6.9%), Computers, Engineering & Science (33 | 4.3%), Management (27 | 3.5%), and Health Diagnosing & Treating (25 | 3.2%).
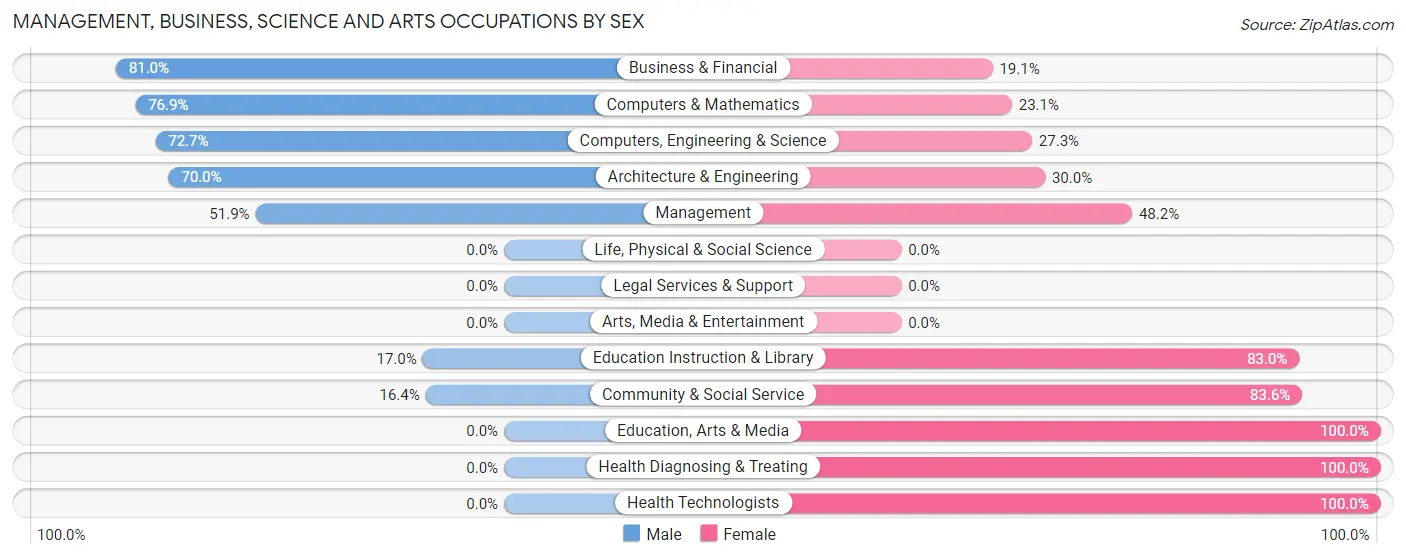
Management, Business, Science and Arts Occupations by Sex
Within the Management, Business, Science and Arts occupations in Powells Crossroads, the most male-oriented occupations are Business & Financial (80.9%), Computers & Mathematics (76.9%), and Computers, Engineering & Science (72.7%), while the most female-oriented occupations are Education, Arts & Media (100.0%), Health Diagnosing & Treating (100.0%), and Health Technologists (100.0%).
| Occupation | Male | Female |
| Management | 14 (51.8%) | 13 (48.1%) |
| Business & Financial | 17 (80.9%) | 4 (19.1%) |
| Computers, Engineering & Science | 24 (72.7%) | 9 (27.3%) |
| Computers & Mathematics | 10 (76.9%) | 3 (23.1%) |
| Architecture & Engineering | 14 (70.0%) | 6 (30.0%) |
| Life, Physical & Social Science | 0 (0.0%) | 0 (0.0%) |
| Community & Social Service | 9 (16.4%) | 46 (83.6%) |
| Education, Arts & Media | 0 (0.0%) | 2 (100.0%) |
| Legal Services & Support | 0 (0.0%) | 0 (0.0%) |
| Education Instruction & Library | 9 (17.0%) | 44 (83.0%) |
| Arts, Media & Entertainment | 0 (0.0%) | 0 (0.0%) |
| Health Diagnosing & Treating | 0 (0.0%) | 25 (100.0%) |
| Health Technologists | 0 (0.0%) | 25 (100.0%) |
| Total (Category) | 64 (39.8%) | 97 (60.3%) |
| Total (Overall) | 448 (58.0%) | 324 (42.0%) |
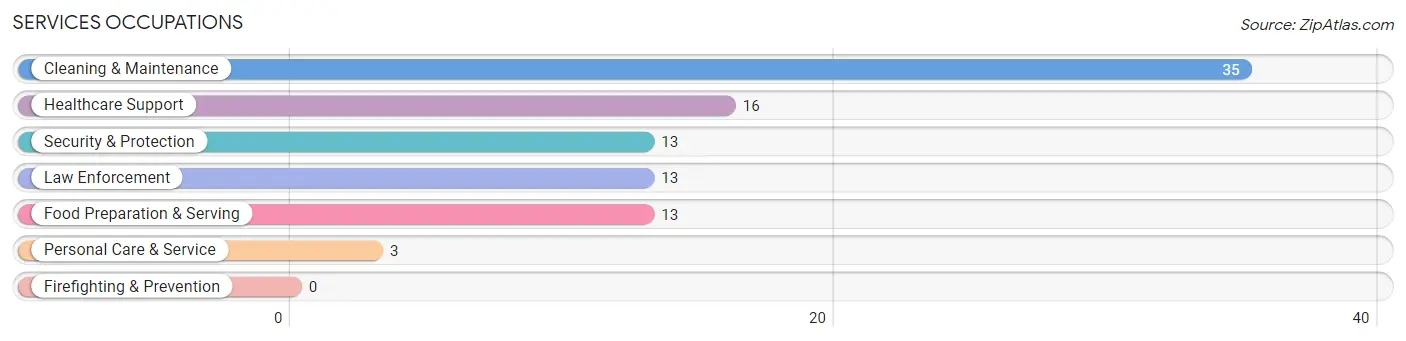
Services Occupations
The most common Services occupations in Powells Crossroads are Cleaning & Maintenance (35 | 4.5%), Healthcare Support (16 | 2.1%), Security & Protection (13 | 1.7%), Law Enforcement (13 | 1.7%), and Food Preparation & Serving (13 | 1.7%).
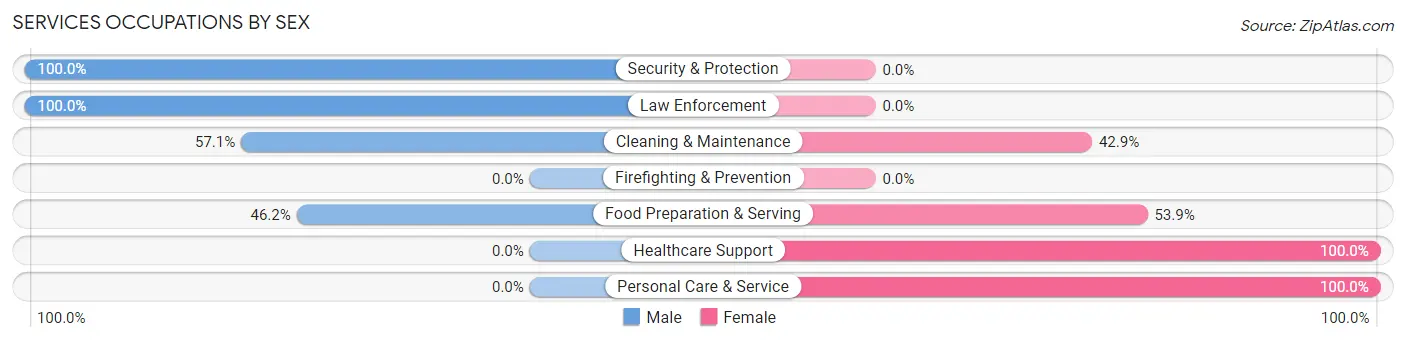
Services Occupations by Sex
Within the Services occupations in Powells Crossroads, the most male-oriented occupations are Security & Protection (100.0%), Law Enforcement (100.0%), and Cleaning & Maintenance (57.1%), while the most female-oriented occupations are Healthcare Support (100.0%), Personal Care & Service (100.0%), and Food Preparation & Serving (53.8%).
| Occupation | Male | Female |
| Healthcare Support | 0 (0.0%) | 16 (100.0%) |
| Security & Protection | 13 (100.0%) | 0 (0.0%) |
| Firefighting & Prevention | 0 (0.0%) | 0 (0.0%) |
| Law Enforcement | 13 (100.0%) | 0 (0.0%) |
| Food Preparation & Serving | 6 (46.2%) | 7 (53.8%) |
| Cleaning & Maintenance | 20 (57.1%) | 15 (42.9%) |
| Personal Care & Service | 0 (0.0%) | 3 (100.0%) |
| Total (Category) | 39 (48.7%) | 41 (51.2%) |
| Total (Overall) | 448 (58.0%) | 324 (42.0%) |
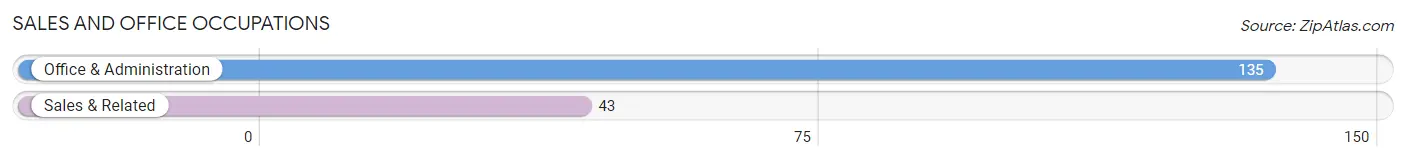
Sales and Office Occupations
The most common Sales and Office occupations in Powells Crossroads are Office & Administration (135 | 17.5%), and Sales & Related (43 | 5.6%).
Sales and Office Occupations by Sex
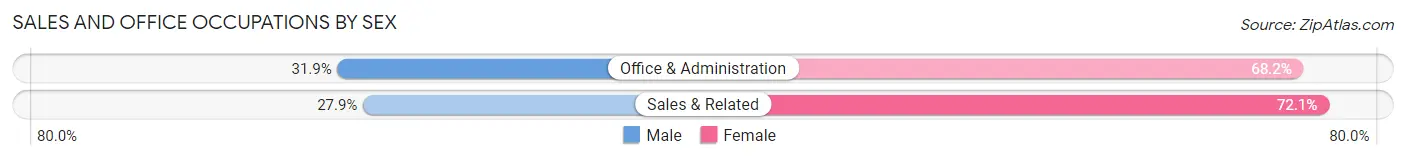
| Occupation | Male | Female |
| Sales & Related | 12 (27.9%) | 31 (72.1%) |
| Office & Administration | 43 (31.9%) | 92 (68.1%) |
| Total (Category) | 55 (30.9%) | 123 (69.1%) |
| Total (Overall) | 448 (58.0%) | 324 (42.0%) |
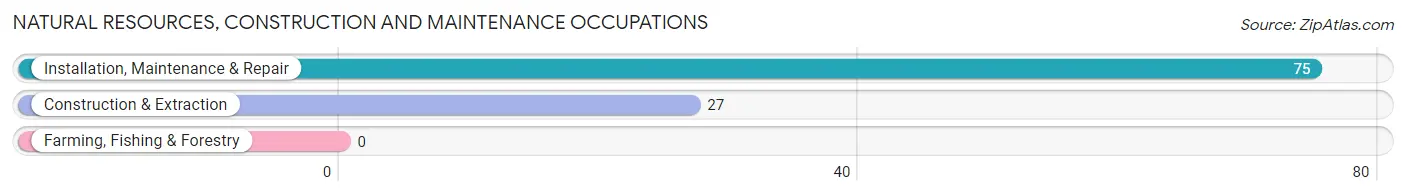
Natural Resources, Construction and Maintenance Occupations
The most common Natural Resources, Construction and Maintenance occupations in Powells Crossroads are Installation, Maintenance & Repair (75 | 9.7%), and Construction & Extraction (27 | 3.5%).
Natural Resources, Construction and Maintenance Occupations by Sex
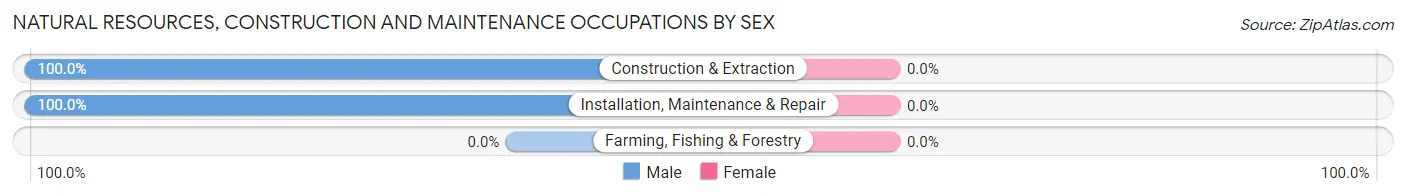
| Occupation | Male | Female |
| Farming, Fishing & Forestry | 0 (0.0%) | 0 (0.0%) |
| Construction & Extraction | 27 (100.0%) | 0 (0.0%) |
| Installation, Maintenance & Repair | 75 (100.0%) | 0 (0.0%) |
| Total (Category) | 102 (100.0%) | 0 (0.0%) |
| Total (Overall) | 448 (58.0%) | 324 (42.0%) |
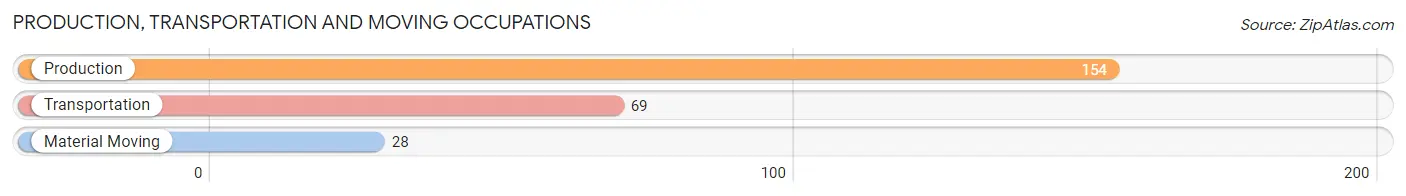
Production, Transportation and Moving Occupations
The most common Production, Transportation and Moving occupations in Powells Crossroads are Production (154 | 20.0%), Transportation (69 | 8.9%), and Material Moving (28 | 3.6%).
Production, Transportation and Moving Occupations by Sex
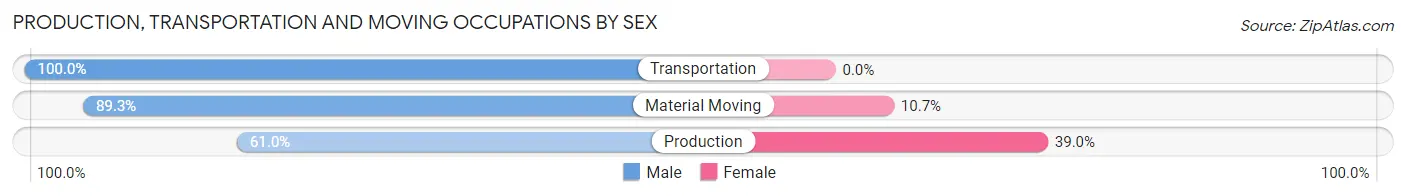
| Occupation | Male | Female |
| Production | 94 (61.0%) | 60 (39.0%) |
| Transportation | 69 (100.0%) | 0 (0.0%) |
| Material Moving | 25 (89.3%) | 3 (10.7%) |
| Total (Category) | 188 (74.9%) | 63 (25.1%) |
| Total (Overall) | 448 (58.0%) | 324 (42.0%) |
Employment Industries by Sex in Powells Crossroads
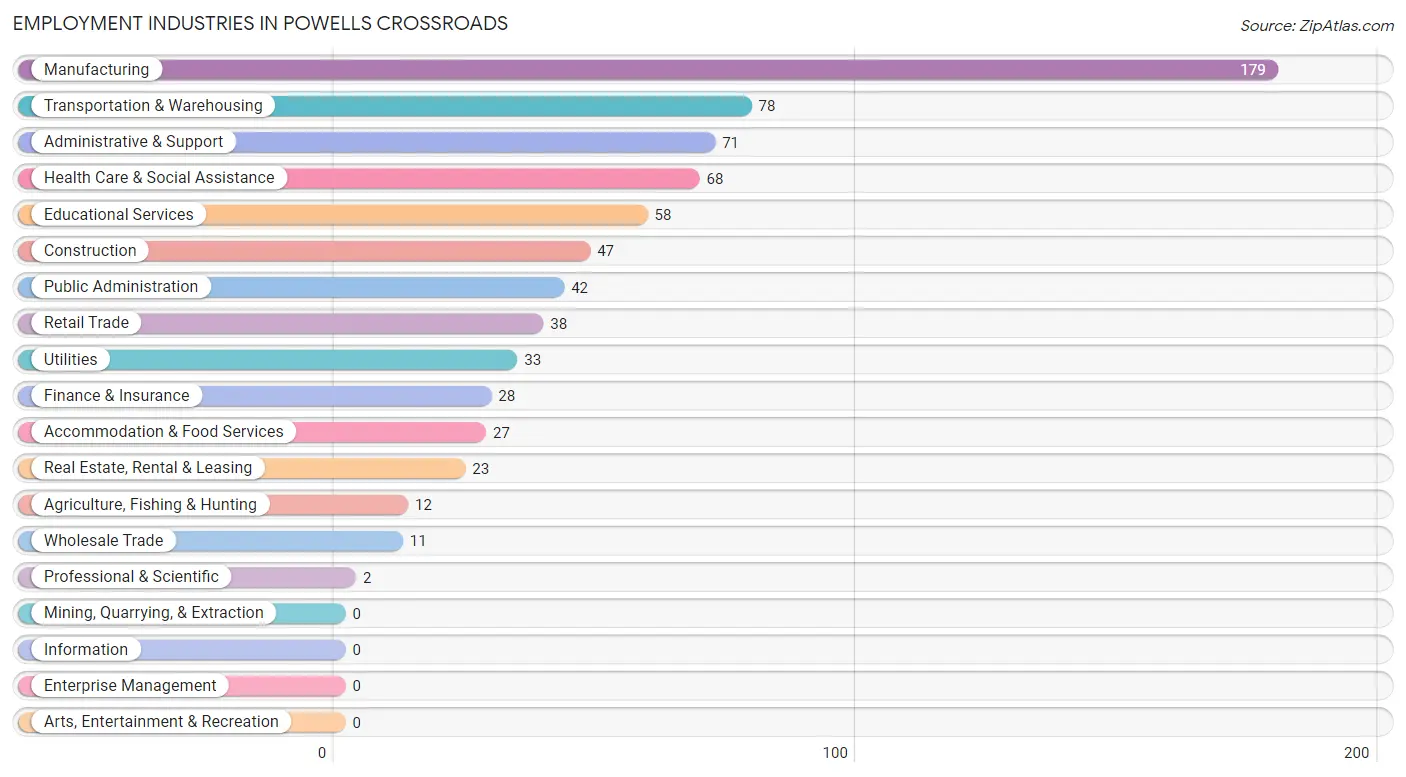
Employment Industries in Powells Crossroads
The major employment industries in Powells Crossroads include Manufacturing (179 | 23.2%), Transportation & Warehousing (78 | 10.1%), Administrative & Support (71 | 9.2%), Health Care & Social Assistance (68 | 8.8%), and Educational Services (58 | 7.5%).
Employment Industries by Sex in Powells Crossroads
The Powells Crossroads industries that see more men than women are Wholesale Trade (100.0%), Transportation & Warehousing (100.0%), and Professional & Scientific (100.0%), whereas the industries that tend to have a higher number of women are Real Estate, Rental & Leasing (100.0%), Health Care & Social Assistance (95.6%), and Finance & Insurance (92.9%).
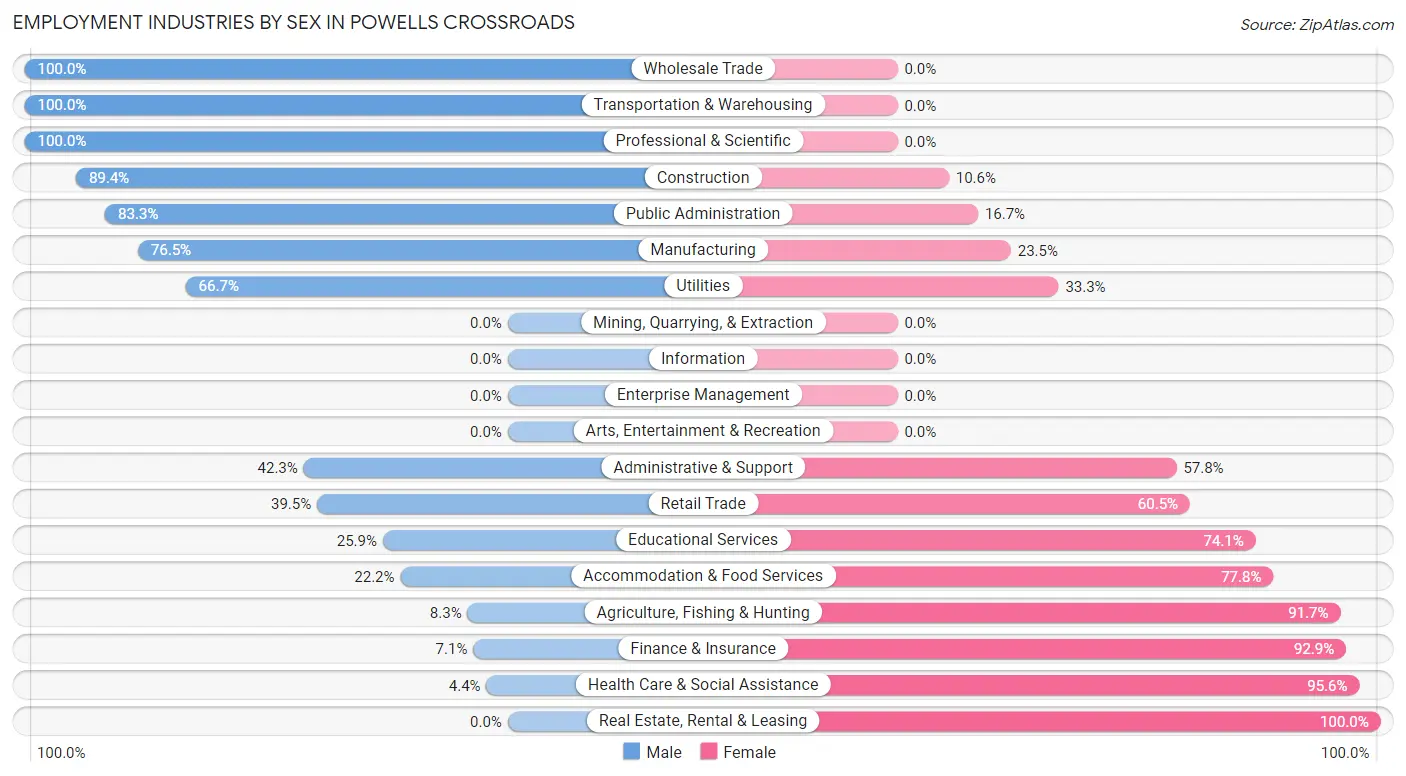
| Industry | Male | Female |
| Agriculture, Fishing & Hunting | 1 (8.3%) | 11 (91.7%) |
| Mining, Quarrying, & Extraction | 0 (0.0%) | 0 (0.0%) |
| Construction | 42 (89.4%) | 5 (10.6%) |
| Manufacturing | 137 (76.5%) | 42 (23.5%) |
| Wholesale Trade | 11 (100.0%) | 0 (0.0%) |
| Retail Trade | 15 (39.5%) | 23 (60.5%) |
| Transportation & Warehousing | 78 (100.0%) | 0 (0.0%) |
| Utilities | 22 (66.7%) | 11 (33.3%) |
| Information | 0 (0.0%) | 0 (0.0%) |
| Finance & Insurance | 2 (7.1%) | 26 (92.9%) |
| Real Estate, Rental & Leasing | 0 (0.0%) | 23 (100.0%) |
| Professional & Scientific | 2 (100.0%) | 0 (0.0%) |
| Enterprise Management | 0 (0.0%) | 0 (0.0%) |
| Administrative & Support | 30 (42.2%) | 41 (57.8%) |
| Educational Services | 15 (25.9%) | 43 (74.1%) |
| Health Care & Social Assistance | 3 (4.4%) | 65 (95.6%) |
| Arts, Entertainment & Recreation | 0 (0.0%) | 0 (0.0%) |
| Accommodation & Food Services | 6 (22.2%) | 21 (77.8%) |
| Public Administration | 35 (83.3%) | 7 (16.7%) |
| Total | 448 (58.0%) | 324 (42.0%) |
Education in Powells Crossroads
School Enrollment in Powells Crossroads
The most common levels of schooling among the 391 students in Powells Crossroads are high school (146 | 37.3%), elementary school (97 | 24.8%), and middle school (91 | 23.3%).
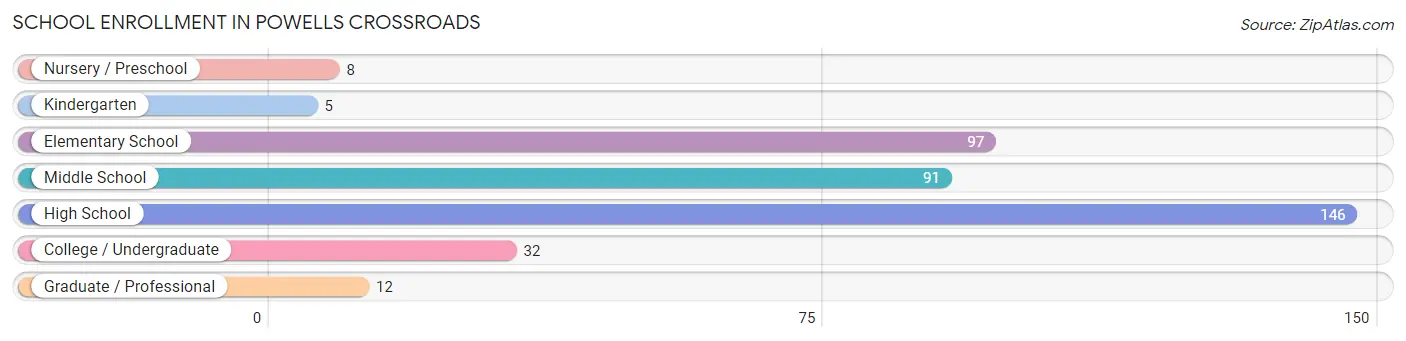
| School Level | # Students | % Students |
| Nursery / Preschool | 8 | 2.1% |
| Kindergarten | 5 | 1.3% |
| Elementary School | 97 | 24.8% |
| Middle School | 91 | 23.3% |
| High School | 146 | 37.3% |
| College / Undergraduate | 32 | 8.2% |
| Graduate / Professional | 12 | 3.1% |
| Total | 391 | 100.0% |
School Enrollment by Age by Funding Source in Powells Crossroads
Out of a total of 391 students who are enrolled in schools in Powells Crossroads, 60 (15.3%) attend a private institution, while the remaining 331 (84.7%) are enrolled in public schools. The age group of 18 to 19 year olds has the highest likelihood of being enrolled in private schools, with 52 (71.2% in the age bracket) enrolled. Conversely, the age group of 3 to 4 year olds has the lowest likelihood of being enrolled in a private school, with 8 (100.0% in the age bracket) attending a public institution.
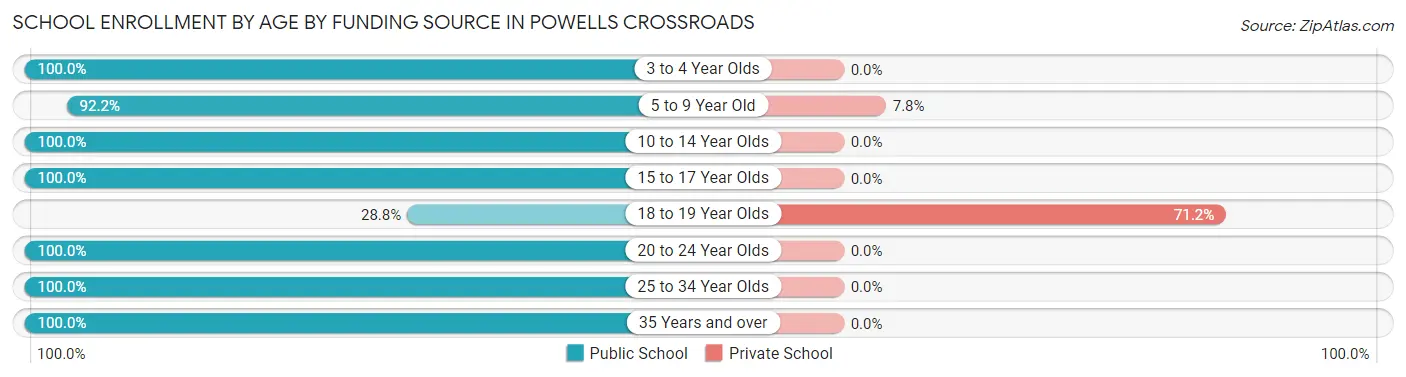
| Age Bracket | Public School | Private School |
| 3 to 4 Year Olds | 8 (100.0%) | 0 (0.0%) |
| 5 to 9 Year Old | 94 (92.2%) | 8 (7.8%) |
| 10 to 14 Year Olds | 102 (100.0%) | 0 (0.0%) |
| 15 to 17 Year Olds | 83 (100.0%) | 0 (0.0%) |
| 18 to 19 Year Olds | 21 (28.8%) | 52 (71.2%) |
| 20 to 24 Year Olds | 11 (100.0%) | 0 (0.0%) |
| 25 to 34 Year Olds | 9 (100.0%) | 0 (0.0%) |
| 35 Years and over | 3 (100.0%) | 0 (0.0%) |
| Total | 331 (84.7%) | 60 (15.3%) |
Educational Attainment by Field of Study in Powells Crossroads
Business (46 | 33.6%), education (37 | 27.0%), arts & humanities (14 | 10.2%), bio, nature & agricultural (9 | 6.6%), and engineering (9 | 6.6%) are the most common fields of study among 137 individuals in Powells Crossroads who have obtained a bachelor's degree or higher.
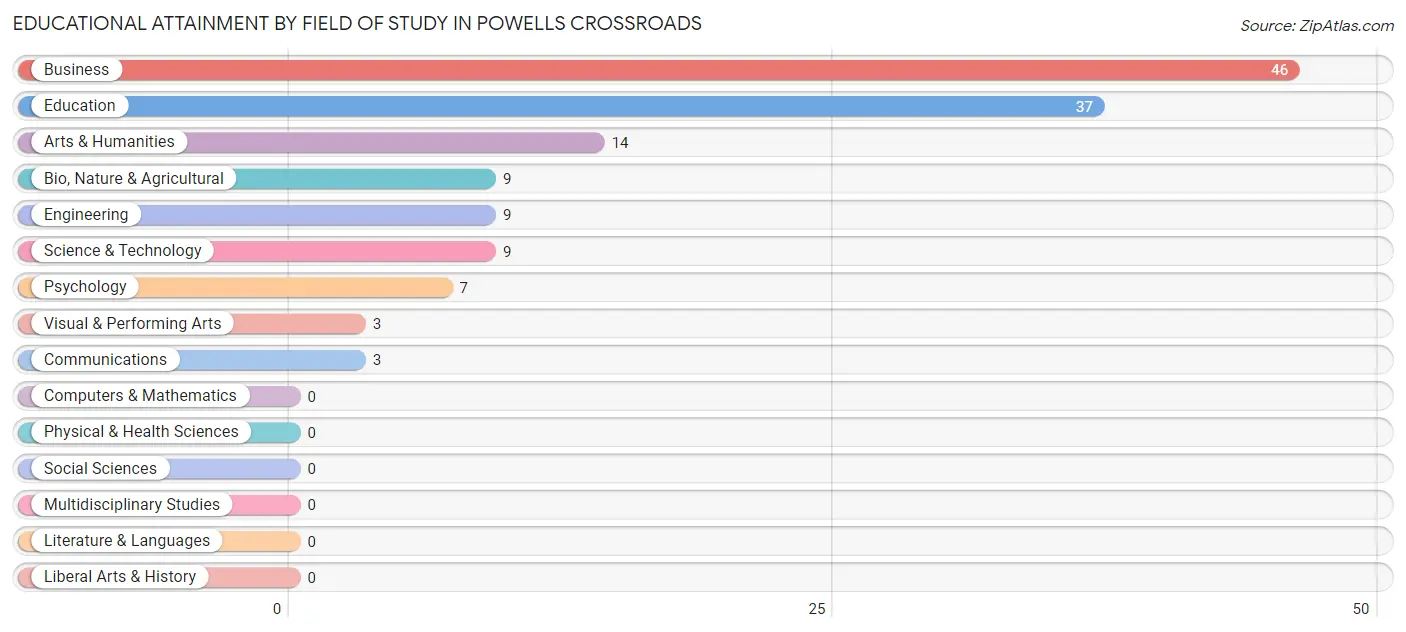
| Field of Study | # Graduates | % Graduates |
| Computers & Mathematics | 0 | 0.0% |
| Bio, Nature & Agricultural | 9 | 6.6% |
| Physical & Health Sciences | 0 | 0.0% |
| Psychology | 7 | 5.1% |
| Social Sciences | 0 | 0.0% |
| Engineering | 9 | 6.6% |
| Multidisciplinary Studies | 0 | 0.0% |
| Science & Technology | 9 | 6.6% |
| Business | 46 | 33.6% |
| Education | 37 | 27.0% |
| Literature & Languages | 0 | 0.0% |
| Liberal Arts & History | 0 | 0.0% |
| Visual & Performing Arts | 3 | 2.2% |
| Communications | 3 | 2.2% |
| Arts & Humanities | 14 | 10.2% |
| Total | 137 | 100.0% |
Transportation & Commute in Powells Crossroads
Vehicle Availability by Sex in Powells Crossroads
The most prevalent vehicle ownership categories in Powells Crossroads are males with 2 vehicles (164, accounting for 38.9%) and females with 2 vehicles (54, making up 55.6%).
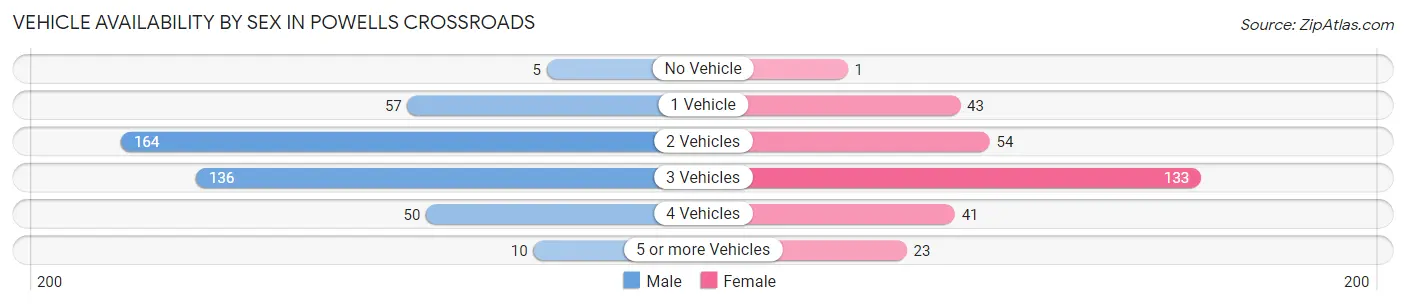
| Vehicles Available | Male | Female |
| No Vehicle | 5 (1.2%) | 1 (0.3%) |
| 1 Vehicle | 57 (13.5%) | 43 (14.6%) |
| 2 Vehicles | 164 (38.9%) | 54 (18.3%) |
| 3 Vehicles | 136 (32.2%) | 133 (45.1%) |
| 4 Vehicles | 50 (11.8%) | 41 (13.9%) |
| 5 or more Vehicles | 10 (2.4%) | 23 (7.8%) |
| Total | 422 (100.0%) | 295 (100.0%) |
Commute Time in Powells Crossroads
The most frequently occuring commute durations in Powells Crossroads are 45 to 59 minutes (249 commuters, 36.0%), 40 to 44 minutes (101 commuters, 14.6%), and 30 to 34 minutes (85 commuters, 12.3%).
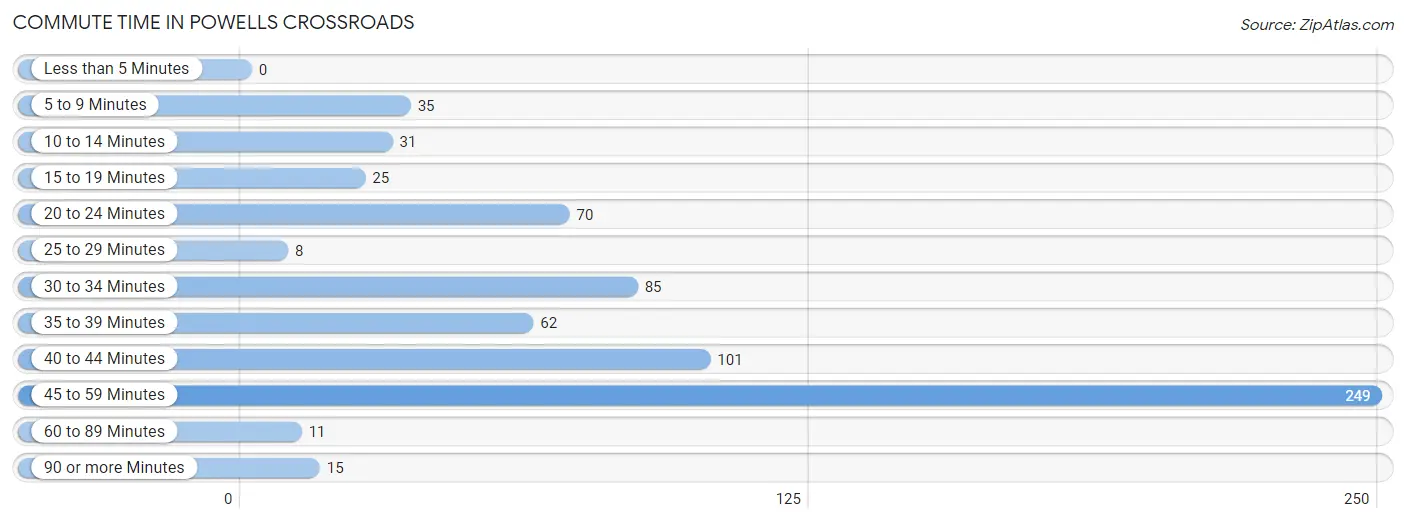
| Commute Time | # Commuters | % Commuters |
| Less than 5 Minutes | 0 | 0.0% |
| 5 to 9 Minutes | 35 | 5.1% |
| 10 to 14 Minutes | 31 | 4.5% |
| 15 to 19 Minutes | 25 | 3.6% |
| 20 to 24 Minutes | 70 | 10.1% |
| 25 to 29 Minutes | 8 | 1.2% |
| 30 to 34 Minutes | 85 | 12.3% |
| 35 to 39 Minutes | 62 | 9.0% |
| 40 to 44 Minutes | 101 | 14.6% |
| 45 to 59 Minutes | 249 | 36.0% |
| 60 to 89 Minutes | 11 | 1.6% |
| 90 or more Minutes | 15 | 2.2% |
Commute Time by Sex in Powells Crossroads
The most common commute times in Powells Crossroads are 45 to 59 minutes (157 commuters, 37.2%) for males and 45 to 59 minutes (92 commuters, 34.1%) for females.
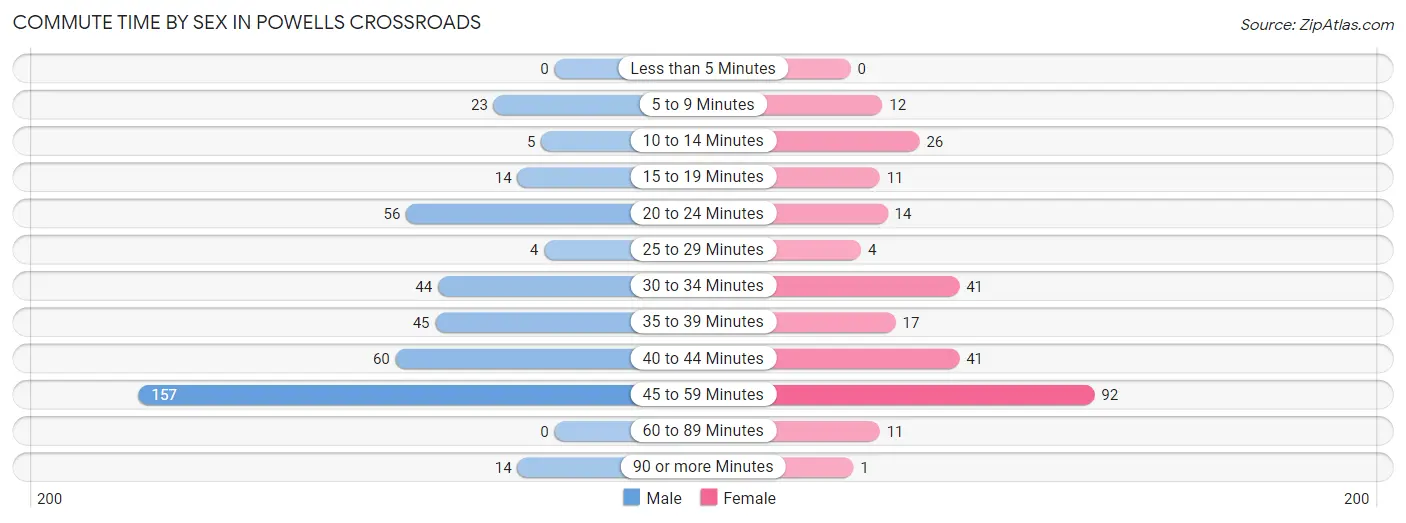
| Commute Time | Male | Female |
| Less than 5 Minutes | 0 (0.0%) | 0 (0.0%) |
| 5 to 9 Minutes | 23 (5.4%) | 12 (4.4%) |
| 10 to 14 Minutes | 5 (1.2%) | 26 (9.6%) |
| 15 to 19 Minutes | 14 (3.3%) | 11 (4.1%) |
| 20 to 24 Minutes | 56 (13.3%) | 14 (5.2%) |
| 25 to 29 Minutes | 4 (0.9%) | 4 (1.5%) |
| 30 to 34 Minutes | 44 (10.4%) | 41 (15.2%) |
| 35 to 39 Minutes | 45 (10.7%) | 17 (6.3%) |
| 40 to 44 Minutes | 60 (14.2%) | 41 (15.2%) |
| 45 to 59 Minutes | 157 (37.2%) | 92 (34.1%) |
| 60 to 89 Minutes | 0 (0.0%) | 11 (4.1%) |
| 90 or more Minutes | 14 (3.3%) | 1 (0.4%) |
Time of Departure to Work by Sex in Powells Crossroads
The most frequent times of departure to work in Powells Crossroads are 6:00 AM to 6:29 AM (87, 20.6%) for males and 7:00 AM to 7:29 AM (50, 18.5%) for females.
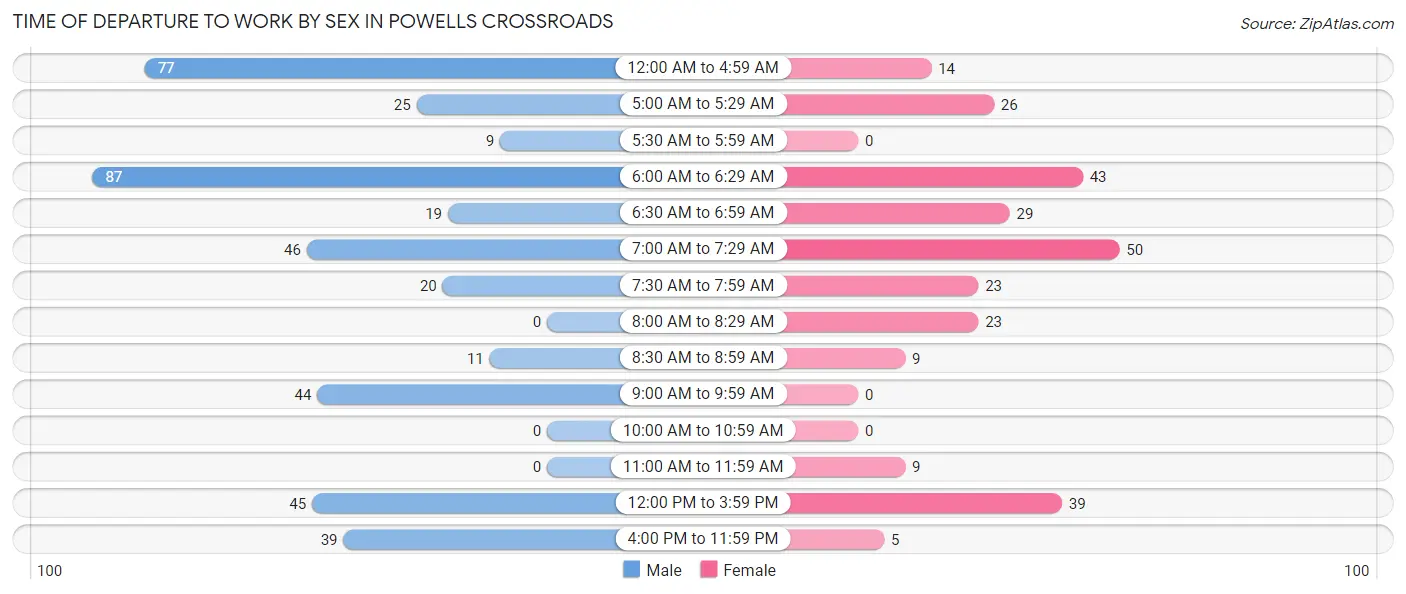
| Time of Departure | Male | Female |
| 12:00 AM to 4:59 AM | 77 (18.2%) | 14 (5.2%) |
| 5:00 AM to 5:29 AM | 25 (5.9%) | 26 (9.6%) |
| 5:30 AM to 5:59 AM | 9 (2.1%) | 0 (0.0%) |
| 6:00 AM to 6:29 AM | 87 (20.6%) | 43 (15.9%) |
| 6:30 AM to 6:59 AM | 19 (4.5%) | 29 (10.7%) |
| 7:00 AM to 7:29 AM | 46 (10.9%) | 50 (18.5%) |
| 7:30 AM to 7:59 AM | 20 (4.7%) | 23 (8.5%) |
| 8:00 AM to 8:29 AM | 0 (0.0%) | 23 (8.5%) |
| 8:30 AM to 8:59 AM | 11 (2.6%) | 9 (3.3%) |
| 9:00 AM to 9:59 AM | 44 (10.4%) | 0 (0.0%) |
| 10:00 AM to 10:59 AM | 0 (0.0%) | 0 (0.0%) |
| 11:00 AM to 11:59 AM | 0 (0.0%) | 9 (3.3%) |
| 12:00 PM to 3:59 PM | 45 (10.7%) | 39 (14.4%) |
| 4:00 PM to 11:59 PM | 39 (9.2%) | 5 (1.8%) |
| Total | 422 (100.0%) | 270 (100.0%) |
Housing Occupancy in Powells Crossroads
Occupancy by Ownership in Powells Crossroads
Of the total 640 dwellings in Powells Crossroads, owner-occupied units account for 547 (85.5%), while renter-occupied units make up 93 (14.5%).
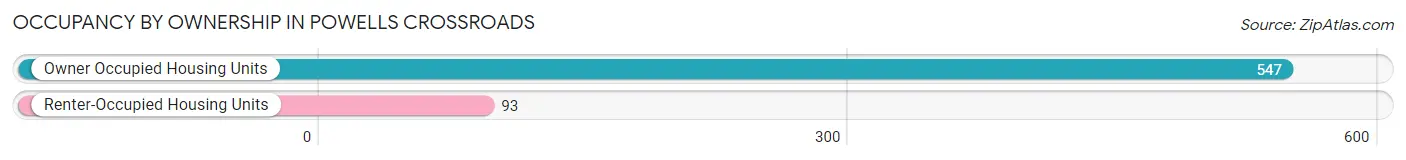
| Occupancy | # Housing Units | % Housing Units |
| Owner Occupied Housing Units | 547 | 85.5% |
| Renter-Occupied Housing Units | 93 | 14.5% |
| Total Occupied Housing Units | 640 | 100.0% |
Occupancy by Household Size in Powells Crossroads
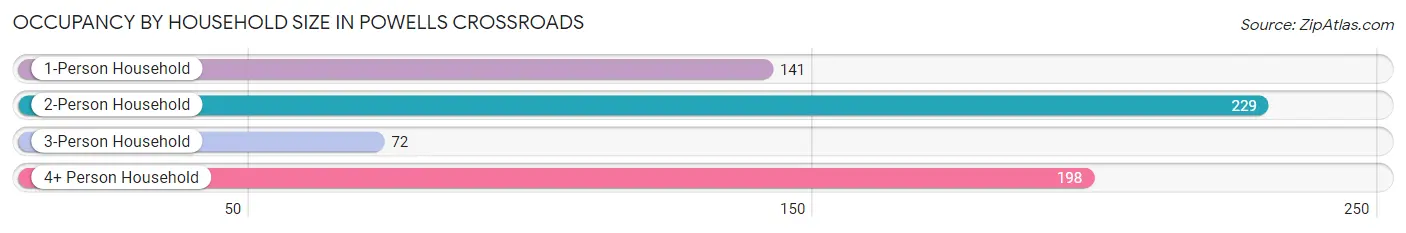
| Household Size | # Housing Units | % Housing Units |
| 1-Person Household | 141 | 22.0% |
| 2-Person Household | 229 | 35.8% |
| 3-Person Household | 72 | 11.3% |
| 4+ Person Household | 198 | 30.9% |
| Total Housing Units | 640 | 100.0% |
Occupancy by Ownership by Household Size in Powells Crossroads
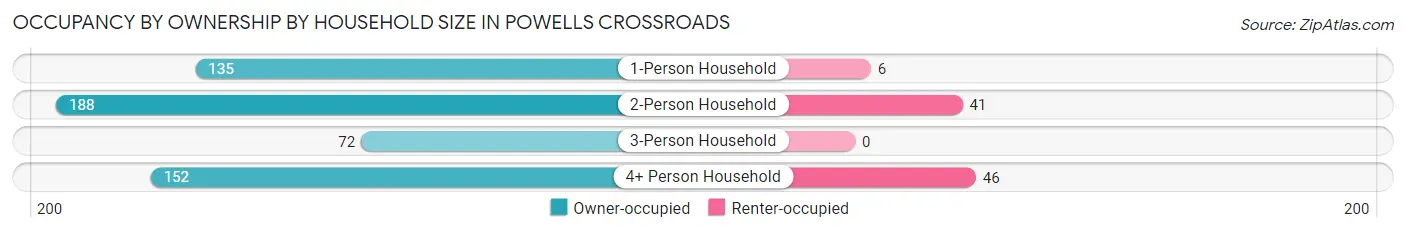
| Household Size | Owner-occupied | Renter-occupied |
| 1-Person Household | 135 (95.7%) | 6 (4.3%) |
| 2-Person Household | 188 (82.1%) | 41 (17.9%) |
| 3-Person Household | 72 (100.0%) | 0 (0.0%) |
| 4+ Person Household | 152 (76.8%) | 46 (23.2%) |
| Total Housing Units | 547 (85.5%) | 93 (14.5%) |
Occupancy by Educational Attainment in Powells Crossroads
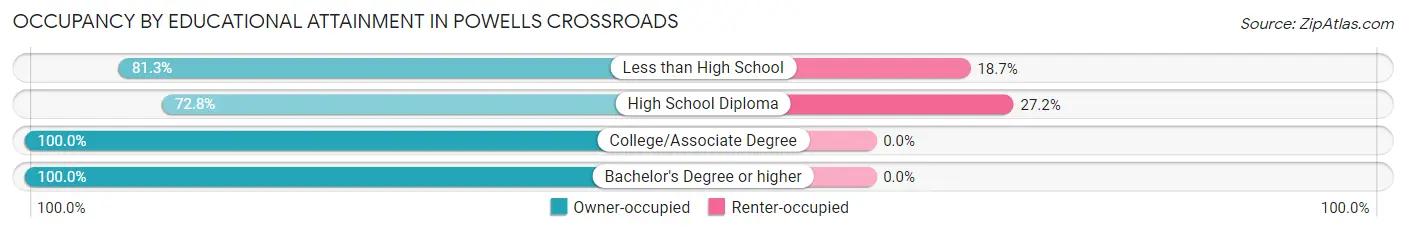
| Household Size | Owner-occupied | Renter-occupied |
| Less than High School | 100 (81.3%) | 23 (18.7%) |
| High School Diploma | 187 (72.8%) | 70 (27.2%) |
| College/Associate Degree | 178 (100.0%) | 0 (0.0%) |
| Bachelor's Degree or higher | 82 (100.0%) | 0 (0.0%) |
Occupancy by Age of Householder in Powells Crossroads
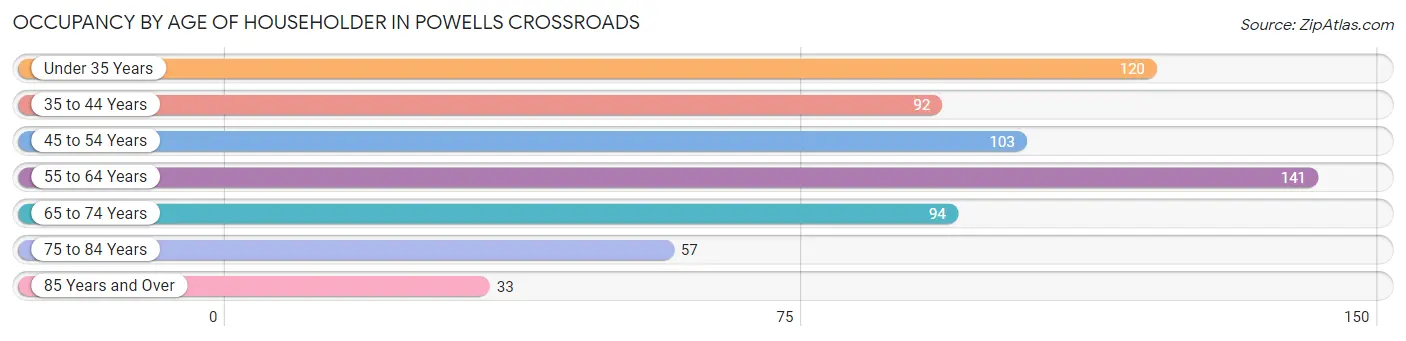
| Age Bracket | # Households | % Households |
| Under 35 Years | 120 | 18.8% |
| 35 to 44 Years | 92 | 14.4% |
| 45 to 54 Years | 103 | 16.1% |
| 55 to 64 Years | 141 | 22.0% |
| 65 to 74 Years | 94 | 14.7% |
| 75 to 84 Years | 57 | 8.9% |
| 85 Years and Over | 33 | 5.2% |
| Total | 640 | 100.0% |
Housing Finances in Powells Crossroads
Median Income by Occupancy in Powells Crossroads
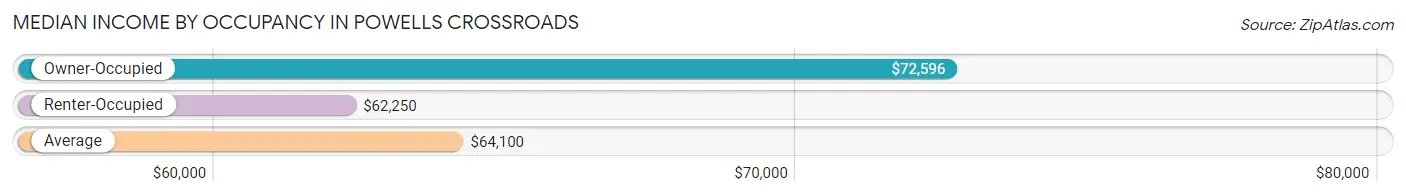
| Occupancy Type | # Households | Median Income |
| Owner-Occupied | 547 (85.5%) | $72,596 |
| Renter-Occupied | 93 (14.5%) | $62,250 |
| Average | 640 (100.0%) | $64,100 |
Occupancy by Householder Income Bracket in Powells Crossroads
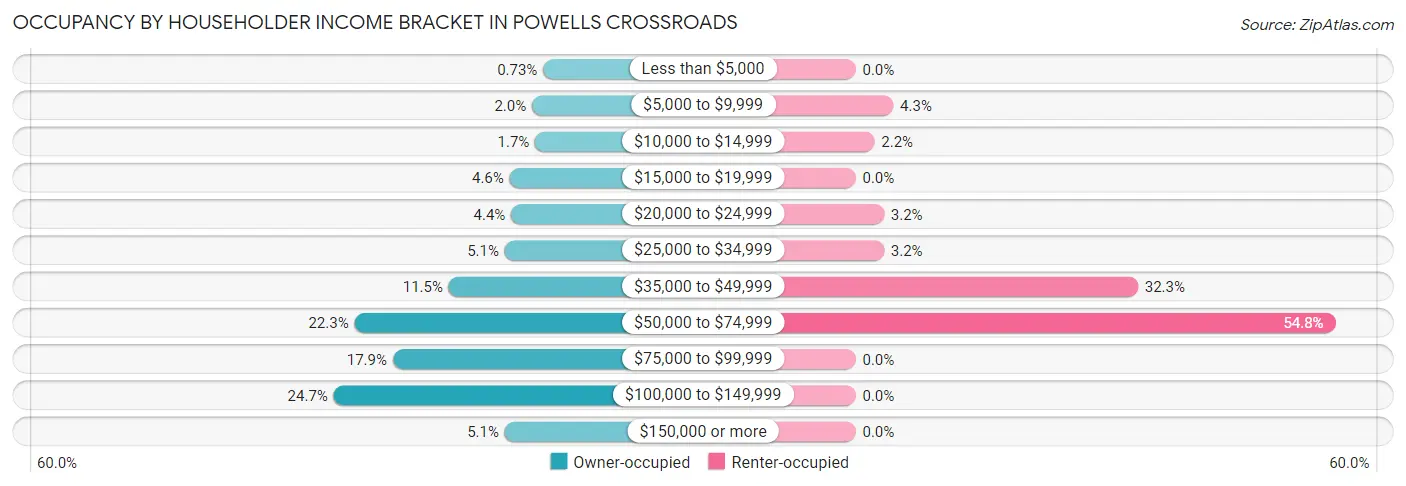
| Income Bracket | Owner-occupied | Renter-occupied |
| Less than $5,000 | 4 (0.7%) | 0 (0.0%) |
| $5,000 to $9,999 | 11 (2.0%) | 4 (4.3%) |
| $10,000 to $14,999 | 9 (1.7%) | 2 (2.1%) |
| $15,000 to $19,999 | 25 (4.6%) | 0 (0.0%) |
| $20,000 to $24,999 | 24 (4.4%) | 3 (3.2%) |
| $25,000 to $34,999 | 28 (5.1%) | 3 (3.2%) |
| $35,000 to $49,999 | 63 (11.5%) | 30 (32.3%) |
| $50,000 to $74,999 | 122 (22.3%) | 51 (54.8%) |
| $75,000 to $99,999 | 98 (17.9%) | 0 (0.0%) |
| $100,000 to $149,999 | 135 (24.7%) | 0 (0.0%) |
| $150,000 or more | 28 (5.1%) | 0 (0.0%) |
| Total | 547 (100.0%) | 93 (100.0%) |
Monthly Housing Cost Tiers in Powells Crossroads
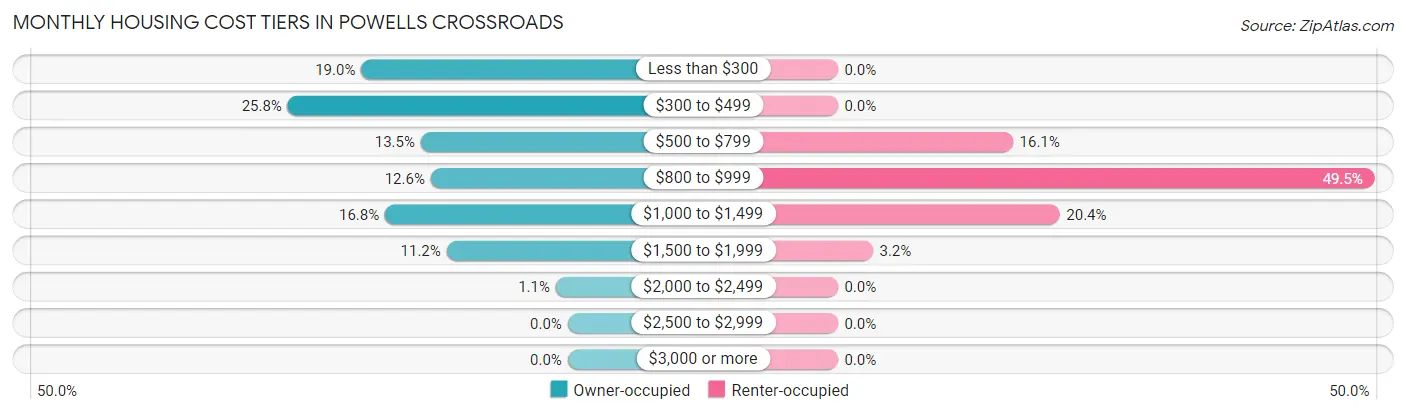
| Monthly Cost | Owner-occupied | Renter-occupied |
| Less than $300 | 104 (19.0%) | 0 (0.0%) |
| $300 to $499 | 141 (25.8%) | 0 (0.0%) |
| $500 to $799 | 74 (13.5%) | 15 (16.1%) |
| $800 to $999 | 69 (12.6%) | 46 (49.5%) |
| $1,000 to $1,499 | 92 (16.8%) | 19 (20.4%) |
| $1,500 to $1,999 | 61 (11.2%) | 3 (3.2%) |
| $2,000 to $2,499 | 6 (1.1%) | 0 (0.0%) |
| $2,500 to $2,999 | 0 (0.0%) | 0 (0.0%) |
| $3,000 or more | 0 (0.0%) | 0 (0.0%) |
| Total | 547 (100.0%) | 93 (100.0%) |
Physical Housing Characteristics in Powells Crossroads
Housing Structures in Powells Crossroads
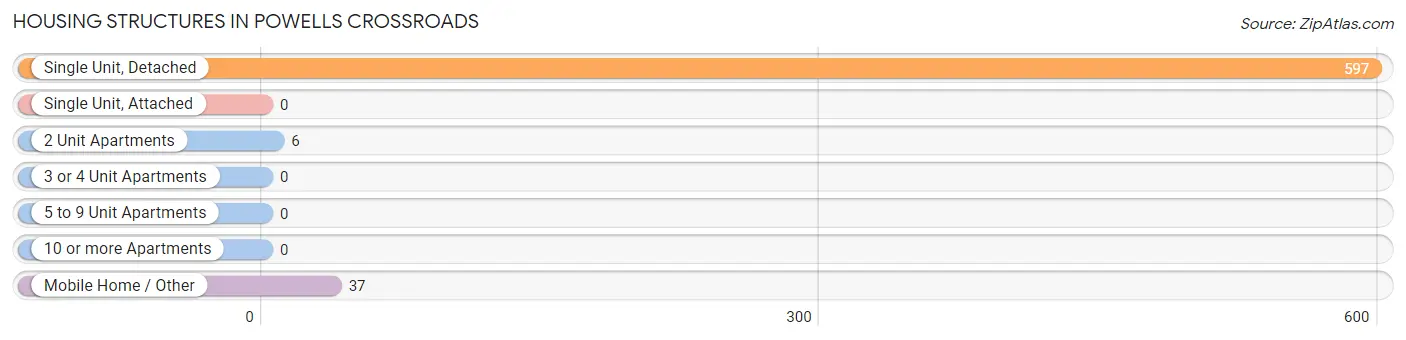
| Structure Type | # Housing Units | % Housing Units |
| Single Unit, Detached | 597 | 93.3% |
| Single Unit, Attached | 0 | 0.0% |
| 2 Unit Apartments | 6 | 0.9% |
| 3 or 4 Unit Apartments | 0 | 0.0% |
| 5 to 9 Unit Apartments | 0 | 0.0% |
| 10 or more Apartments | 0 | 0.0% |
| Mobile Home / Other | 37 | 5.8% |
| Total | 640 | 100.0% |
Housing Structures by Occupancy in Powells Crossroads
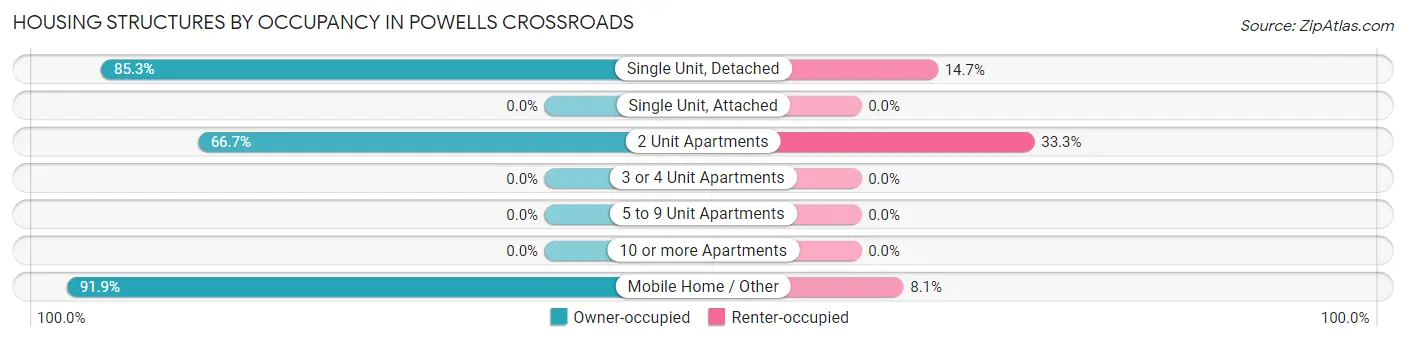
| Structure Type | Owner-occupied | Renter-occupied |
| Single Unit, Detached | 509 (85.3%) | 88 (14.7%) |
| Single Unit, Attached | 0 (0.0%) | 0 (0.0%) |
| 2 Unit Apartments | 4 (66.7%) | 2 (33.3%) |
| 3 or 4 Unit Apartments | 0 (0.0%) | 0 (0.0%) |
| 5 to 9 Unit Apartments | 0 (0.0%) | 0 (0.0%) |
| 10 or more Apartments | 0 (0.0%) | 0 (0.0%) |
| Mobile Home / Other | 34 (91.9%) | 3 (8.1%) |
| Total | 547 (85.5%) | 93 (14.5%) |
Housing Structures by Number of Rooms in Powells Crossroads
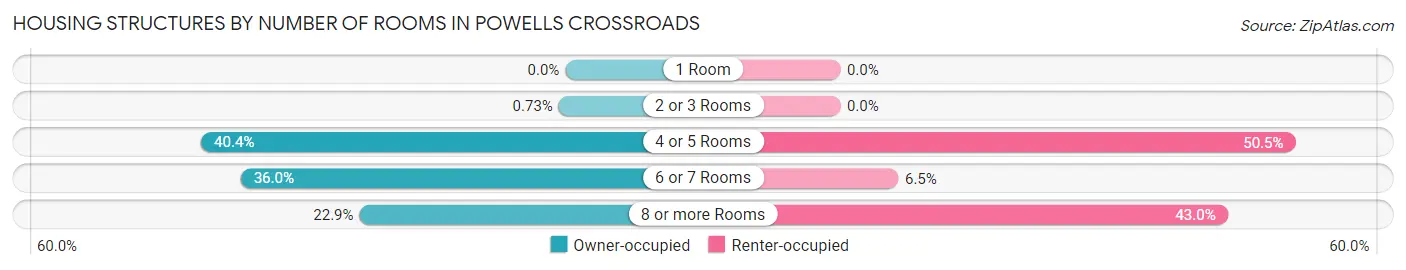
| Number of Rooms | Owner-occupied | Renter-occupied |
| 1 Room | 0 (0.0%) | 0 (0.0%) |
| 2 or 3 Rooms | 4 (0.7%) | 0 (0.0%) |
| 4 or 5 Rooms | 221 (40.4%) | 47 (50.5%) |
| 6 or 7 Rooms | 197 (36.0%) | 6 (6.5%) |
| 8 or more Rooms | 125 (22.9%) | 40 (43.0%) |
| Total | 547 (100.0%) | 93 (100.0%) |
Housing Structure by Heating Type in Powells Crossroads
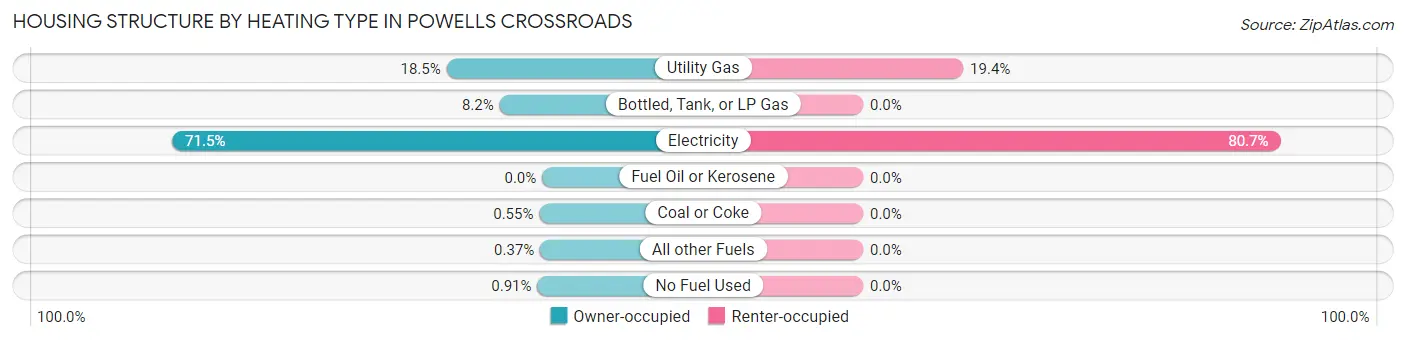
| Heating Type | Owner-occupied | Renter-occupied |
| Utility Gas | 101 (18.5%) | 18 (19.4%) |
| Bottled, Tank, or LP Gas | 45 (8.2%) | 0 (0.0%) |
| Electricity | 391 (71.5%) | 75 (80.6%) |
| Fuel Oil or Kerosene | 0 (0.0%) | 0 (0.0%) |
| Coal or Coke | 3 (0.5%) | 0 (0.0%) |
| All other Fuels | 2 (0.4%) | 0 (0.0%) |
| No Fuel Used | 5 (0.9%) | 0 (0.0%) |
| Total | 547 (100.0%) | 93 (100.0%) |
Household Vehicle Usage in Powells Crossroads
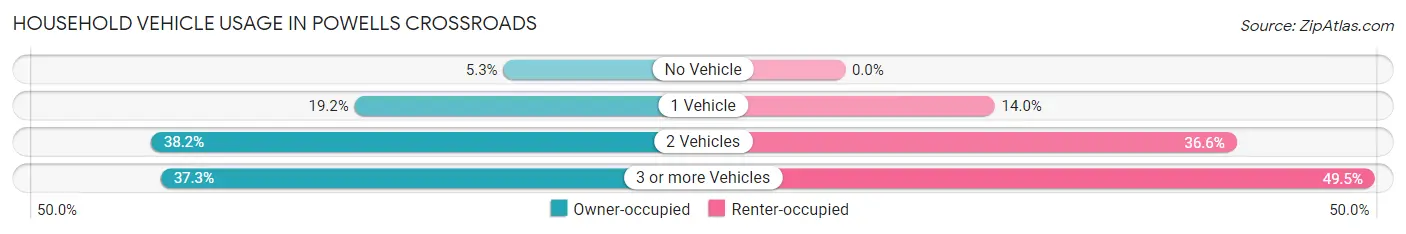
| Vehicles per Household | Owner-occupied | Renter-occupied |
| No Vehicle | 29 (5.3%) | 0 (0.0%) |
| 1 Vehicle | 105 (19.2%) | 13 (14.0%) |
| 2 Vehicles | 209 (38.2%) | 34 (36.6%) |
| 3 or more Vehicles | 204 (37.3%) | 46 (49.5%) |
| Total | 547 (100.0%) | 93 (100.0%) |
Real Estate & Mortgages in Powells Crossroads
Real Estate and Mortgage Overview in Powells Crossroads
| Characteristic | Without Mortgage | With Mortgage |
| Housing Units | 301 | 246 |
| Median Property Value | $160,900 | $138,200 |
| Median Household Income | $58,967 | $16 |
| Monthly Housing Costs | $368 | $0 |
| Real Estate Taxes | $491 | $18 |
Property Value by Mortgage Status in Powells Crossroads
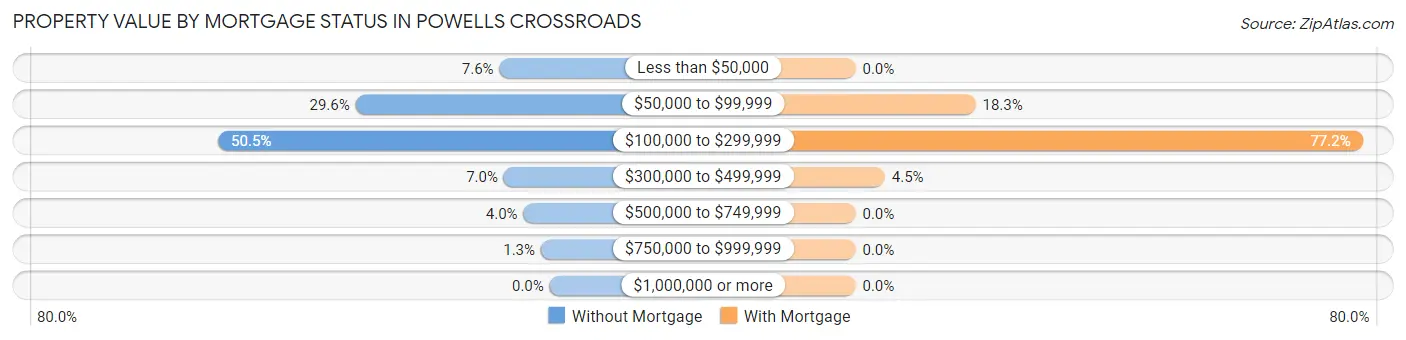
| Property Value | Without Mortgage | With Mortgage |
| Less than $50,000 | 23 (7.6%) | 0 (0.0%) |
| $50,000 to $99,999 | 89 (29.6%) | 45 (18.3%) |
| $100,000 to $299,999 | 152 (50.5%) | 190 (77.2%) |
| $300,000 to $499,999 | 21 (7.0%) | 11 (4.5%) |
| $500,000 to $749,999 | 12 (4.0%) | 0 (0.0%) |
| $750,000 to $999,999 | 4 (1.3%) | 0 (0.0%) |
| $1,000,000 or more | 0 (0.0%) | 0 (0.0%) |
| Total | 301 (100.0%) | 246 (100.0%) |
Household Income by Mortgage Status in Powells Crossroads
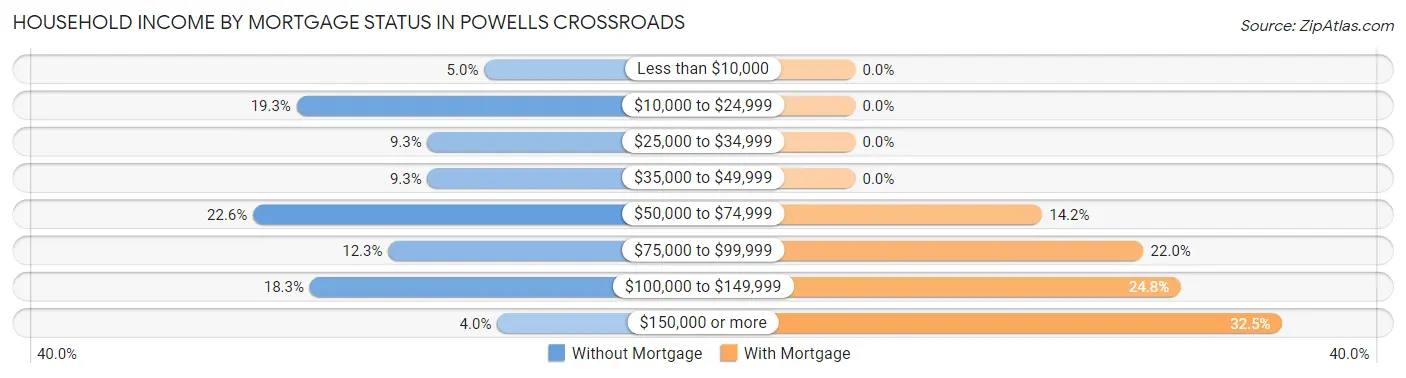
| Household Income | Without Mortgage | With Mortgage |
| Less than $10,000 | 15 (5.0%) | 0 (0.0%) |
| $10,000 to $24,999 | 58 (19.3%) | 0 (0.0%) |
| $25,000 to $34,999 | 28 (9.3%) | 0 (0.0%) |
| $35,000 to $49,999 | 28 (9.3%) | 0 (0.0%) |
| $50,000 to $74,999 | 68 (22.6%) | 35 (14.2%) |
| $75,000 to $99,999 | 37 (12.3%) | 54 (22.0%) |
| $100,000 to $149,999 | 55 (18.3%) | 61 (24.8%) |
| $150,000 or more | 12 (4.0%) | 80 (32.5%) |
| Total | 301 (100.0%) | 246 (100.0%) |
Property Value to Household Income Ratio in Powells Crossroads
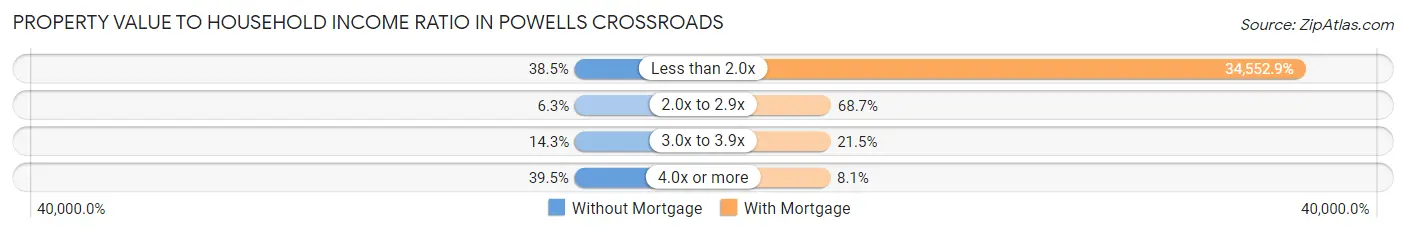
| Value-to-Income Ratio | Without Mortgage | With Mortgage |
| Less than 2.0x | 116 (38.5%) | 85,000 (34,552.9%) |
| 2.0x to 2.9x | 19 (6.3%) | 169 (68.7%) |
| 3.0x to 3.9x | 43 (14.3%) | 53 (21.5%) |
| 4.0x or more | 119 (39.5%) | 20 (8.1%) |
| Total | 301 (100.0%) | 246 (100.0%) |
Real Estate Taxes by Mortgage Status in Powells Crossroads
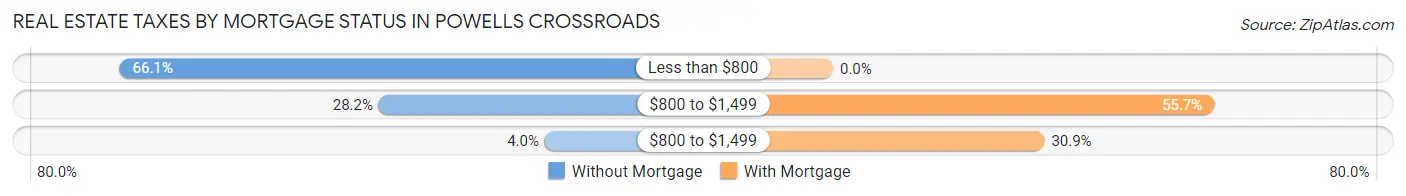
| Property Taxes | Without Mortgage | With Mortgage |
| Less than $800 | 199 (66.1%) | 0 (0.0%) |
| $800 to $1,499 | 85 (28.2%) | 137 (55.7%) |
| $800 to $1,499 | 12 (4.0%) | 76 (30.9%) |
| Total | 301 (100.0%) | 246 (100.0%) |
Health & Disability in Powells Crossroads
Health Insurance Coverage by Age in Powells Crossroads
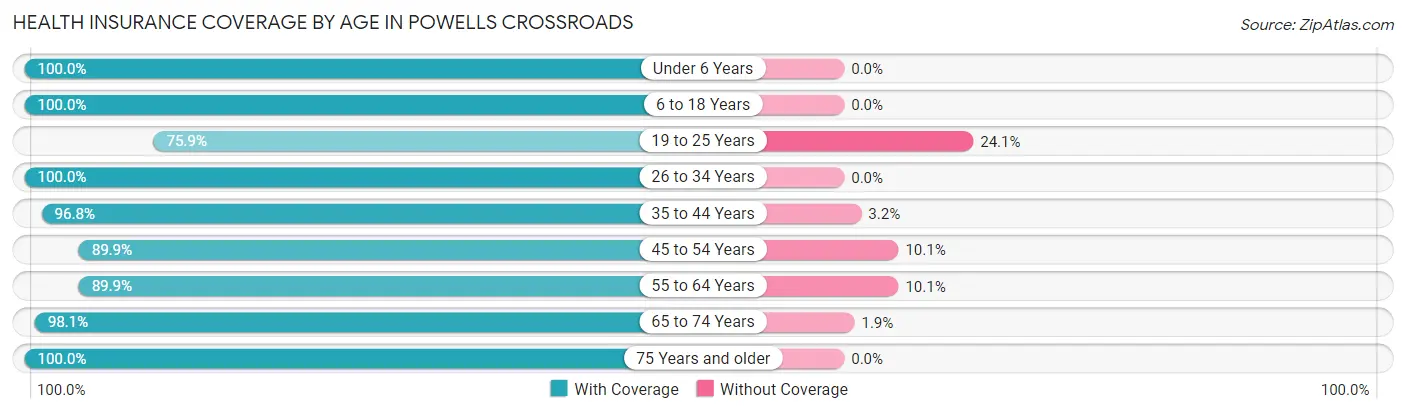
| Age Bracket | With Coverage | Without Coverage |
| Under 6 Years | 112 (100.0%) | 0 (0.0%) |
| 6 to 18 Years | 344 (100.0%) | 0 (0.0%) |
| 19 to 25 Years | 142 (75.9%) | 45 (24.1%) |
| 26 to 34 Years | 124 (100.0%) | 0 (0.0%) |
| 35 to 44 Years | 182 (96.8%) | 6 (3.2%) |
| 45 to 54 Years | 160 (89.9%) | 18 (10.1%) |
| 55 to 64 Years | 258 (89.9%) | 29 (10.1%) |
| 65 to 74 Years | 154 (98.1%) | 3 (1.9%) |
| 75 Years and older | 109 (100.0%) | 0 (0.0%) |
| Total | 1,585 (94.0%) | 101 (6.0%) |
Health Insurance Coverage by Citizenship Status in Powells Crossroads
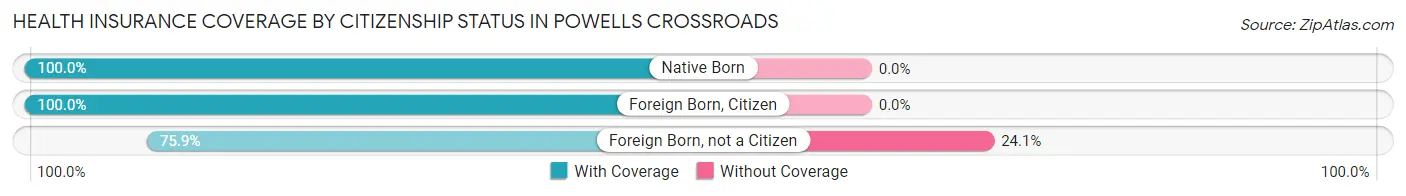
| Citizenship Status | With Coverage | Without Coverage |
| Native Born | 112 (100.0%) | 0 (0.0%) |
| Foreign Born, Citizen | 344 (100.0%) | 0 (0.0%) |
| Foreign Born, not a Citizen | 142 (75.9%) | 45 (24.1%) |
Health Insurance Coverage by Household Income in Powells Crossroads
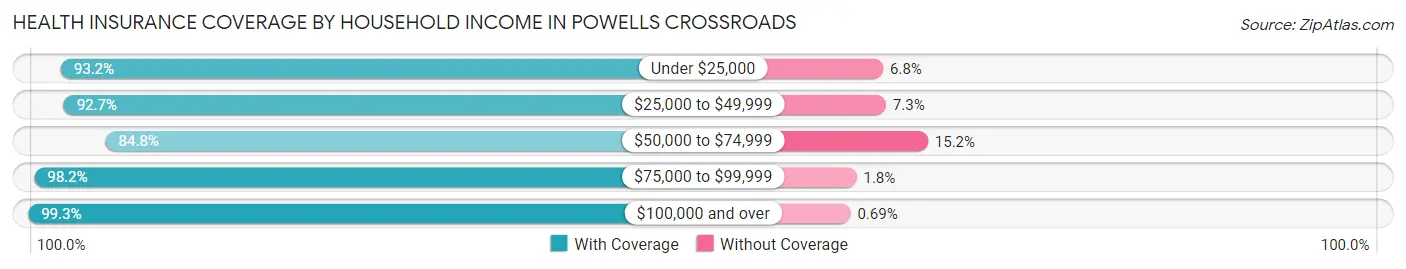
| Household Income | With Coverage | Without Coverage |
| Under $25,000 | 96 (93.2%) | 7 (6.8%) |
| $25,000 to $49,999 | 215 (92.7%) | 17 (7.3%) |
| $50,000 to $74,999 | 374 (84.8%) | 67 (15.2%) |
| $75,000 to $99,999 | 323 (98.2%) | 6 (1.8%) |
| $100,000 and over | 577 (99.3%) | 4 (0.7%) |
Public vs Private Health Insurance Coverage by Age in Powells Crossroads
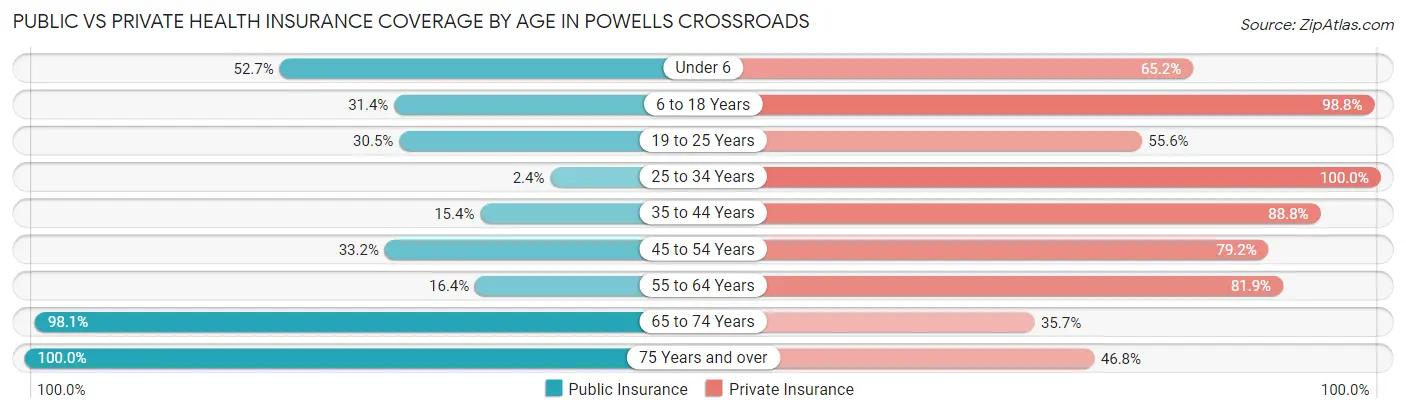
| Age Bracket | Public Insurance | Private Insurance |
| Under 6 | 59 (52.7%) | 73 (65.2%) |
| 6 to 18 Years | 108 (31.4%) | 340 (98.8%) |
| 19 to 25 Years | 57 (30.5%) | 104 (55.6%) |
| 25 to 34 Years | 3 (2.4%) | 124 (100.0%) |
| 35 to 44 Years | 29 (15.4%) | 167 (88.8%) |
| 45 to 54 Years | 59 (33.2%) | 141 (79.2%) |
| 55 to 64 Years | 47 (16.4%) | 235 (81.9%) |
| 65 to 74 Years | 154 (98.1%) | 56 (35.7%) |
| 75 Years and over | 109 (100.0%) | 51 (46.8%) |
| Total | 625 (37.1%) | 1,291 (76.6%) |
Disability Status by Sex by Age in Powells Crossroads
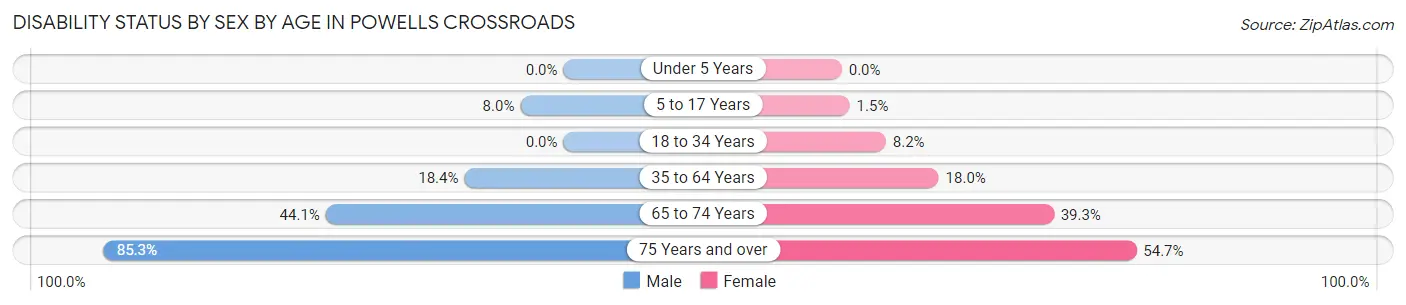
| Age Bracket | Male | Female |
| Under 5 Years | 0 (0.0%) | 0 (0.0%) |
| 5 to 17 Years | 12 (8.0%) | 2 (1.5%) |
| 18 to 34 Years | 0 (0.0%) | 13 (8.2%) |
| 35 to 64 Years | 71 (18.4%) | 48 (18.0%) |
| 65 to 74 Years | 30 (44.1%) | 35 (39.3%) |
| 75 Years and over | 29 (85.3%) | 41 (54.7%) |
Disability Class by Sex by Age in Powells Crossroads
Disability Class: Hearing Difficulty
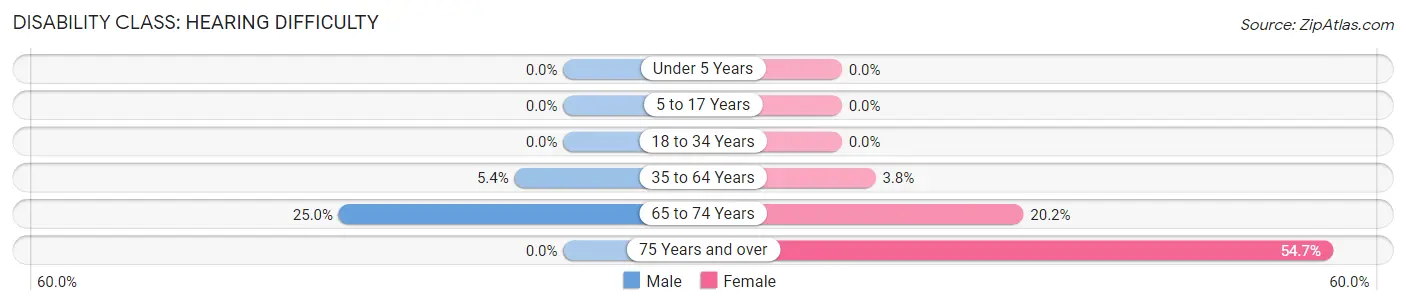
| Age Bracket | Male | Female |
| Under 5 Years | 0 (0.0%) | 0 (0.0%) |
| 5 to 17 Years | 0 (0.0%) | 0 (0.0%) |
| 18 to 34 Years | 0 (0.0%) | 0 (0.0%) |
| 35 to 64 Years | 21 (5.4%) | 10 (3.7%) |
| 65 to 74 Years | 17 (25.0%) | 18 (20.2%) |
| 75 Years and over | 0 (0.0%) | 41 (54.7%) |
Disability Class: Vision Difficulty
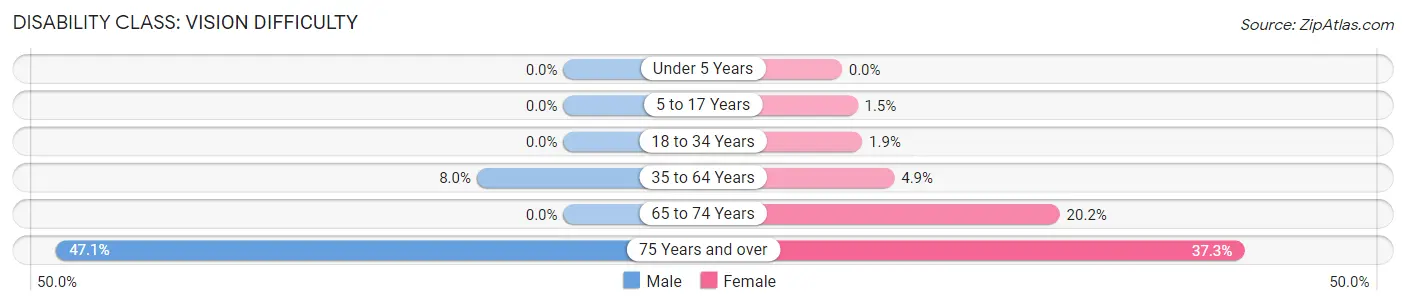
| Age Bracket | Male | Female |
| Under 5 Years | 0 (0.0%) | 0 (0.0%) |
| 5 to 17 Years | 0 (0.0%) | 2 (1.5%) |
| 18 to 34 Years | 0 (0.0%) | 3 (1.9%) |
| 35 to 64 Years | 31 (8.0%) | 13 (4.9%) |
| 65 to 74 Years | 0 (0.0%) | 18 (20.2%) |
| 75 Years and over | 16 (47.1%) | 28 (37.3%) |
Disability Class: Cognitive Difficulty
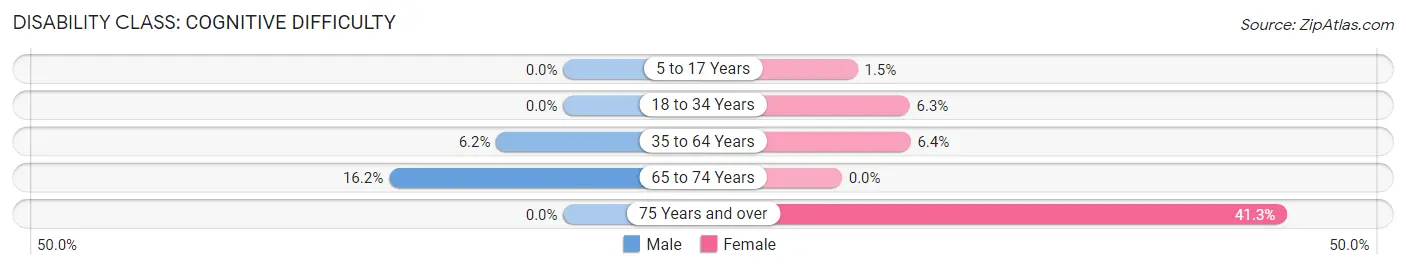
| Age Bracket | Male | Female |
| 5 to 17 Years | 0 (0.0%) | 2 (1.5%) |
| 18 to 34 Years | 0 (0.0%) | 10 (6.3%) |
| 35 to 64 Years | 24 (6.2%) | 17 (6.4%) |
| 65 to 74 Years | 11 (16.2%) | 0 (0.0%) |
| 75 Years and over | 0 (0.0%) | 31 (41.3%) |
Disability Class: Ambulatory Difficulty
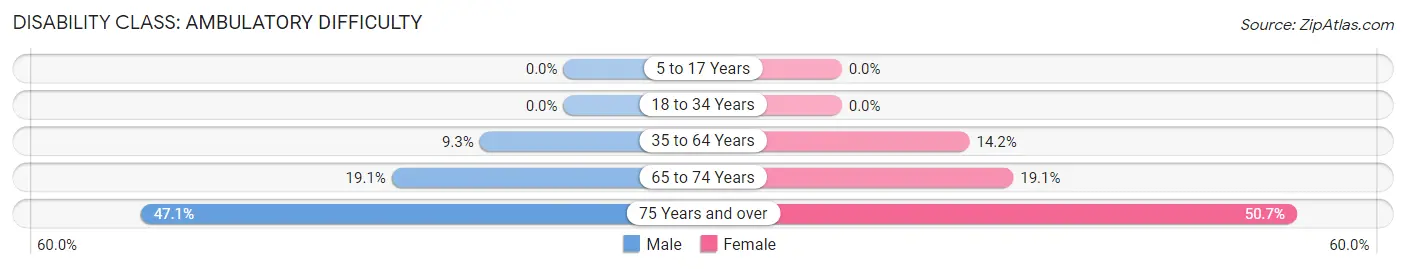
| Age Bracket | Male | Female |
| 5 to 17 Years | 0 (0.0%) | 0 (0.0%) |
| 18 to 34 Years | 0 (0.0%) | 0 (0.0%) |
| 35 to 64 Years | 36 (9.3%) | 38 (14.2%) |
| 65 to 74 Years | 13 (19.1%) | 17 (19.1%) |
| 75 Years and over | 16 (47.1%) | 38 (50.7%) |
Disability Class: Self-Care Difficulty
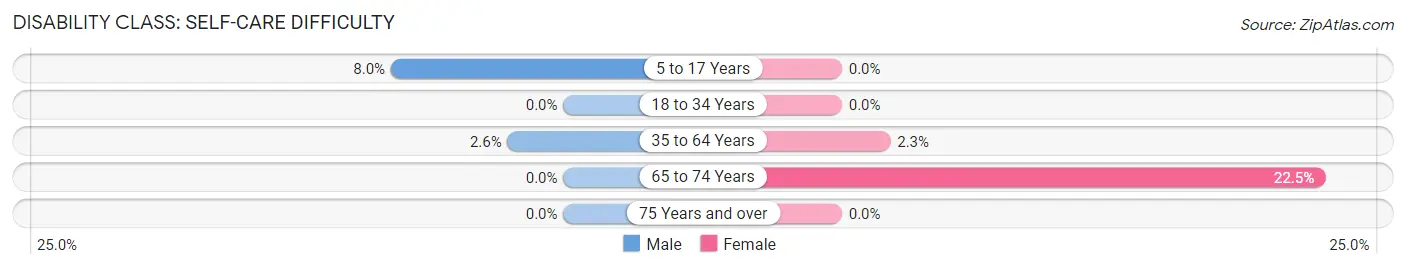
| Age Bracket | Male | Female |
| 5 to 17 Years | 12 (8.0%) | 0 (0.0%) |
| 18 to 34 Years | 0 (0.0%) | 0 (0.0%) |
| 35 to 64 Years | 10 (2.6%) | 6 (2.2%) |
| 65 to 74 Years | 0 (0.0%) | 20 (22.5%) |
| 75 Years and over | 0 (0.0%) | 0 (0.0%) |
Technology Access in Powells Crossroads
Computing Device Access in Powells Crossroads
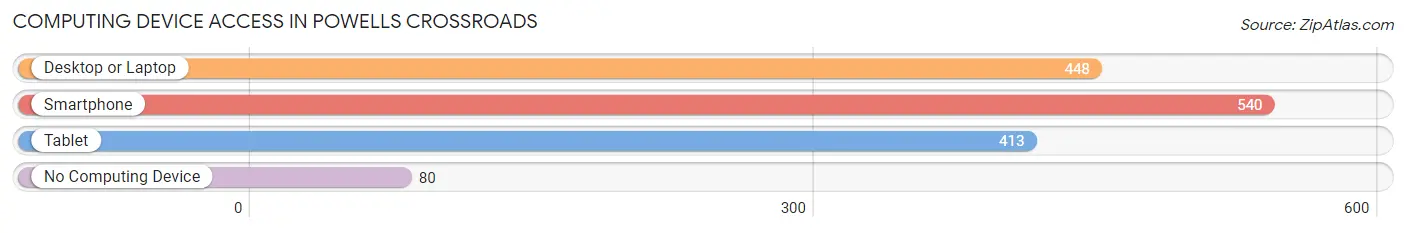
| Device Type | # Households | % Households |
| Desktop or Laptop | 448 | 70.0% |
| Smartphone | 540 | 84.4% |
| Tablet | 413 | 64.5% |
| No Computing Device | 80 | 12.5% |
| Total | 640 | 100.0% |
Internet Access in Powells Crossroads
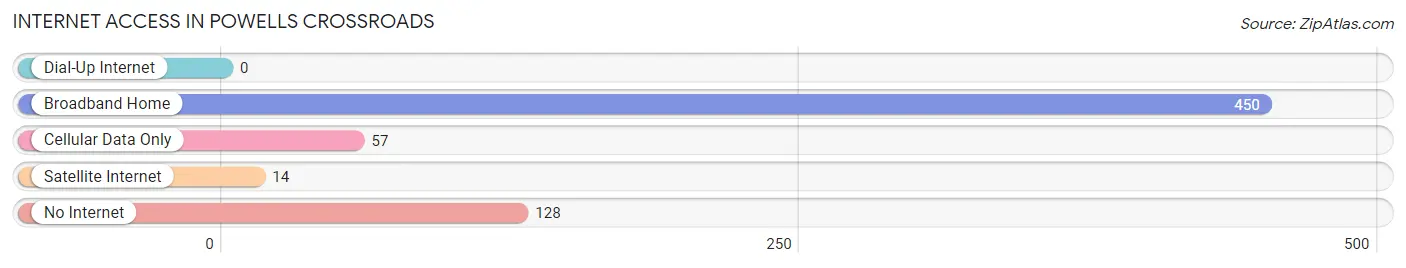
| Internet Type | # Households | % Households |
| Dial-Up Internet | 0 | 0.0% |
| Broadband Home | 450 | 70.3% |
| Cellular Data Only | 57 | 8.9% |
| Satellite Internet | 14 | 2.2% |
| No Internet | 128 | 20.0% |
| Total | 640 | 100.0% |
Powells Crossroads Summary
Powells Crossroads is an unincorporated community located in the state of Tennessee, in the United States. It is situated in the northern part of the state, in the county of Wilson. The community is located at the intersection of two major highways, U.S. Route 70 and State Route 840. It is approximately 20 miles east of Nashville and about 10 miles south of Lebanon.
History
The area that is now Powells Crossroads was first settled in the early 1800s by the Powells family. The family had migrated from North Carolina and settled in the area, which was then part of Rutherford County. The family established a small farm and built a log cabin. The area was known as Powells Crossroads because of the intersection of two major roads, U.S. Route 70 and State Route 840.
The area was primarily agricultural until the late 1800s when the railroad was built through the area. This allowed for the development of the community and the establishment of businesses. The first store was opened in 1891 and the first post office was established in 1892. The community was officially incorporated in 1895 and the name was changed to Powells Crossroads.
Geography
Powells Crossroads is located in the northern part of the state of Tennessee, in the county of Wilson. It is situated at the intersection of two major highways, U.S. Route 70 and State Route 840. The community is approximately 20 miles east of Nashville and about 10 miles south of Lebanon.
The area is mostly rural, with rolling hills and farmland. The terrain is mostly flat, with some areas of higher elevation. The climate is temperate, with hot summers and mild winters.
Economy
The economy of Powells Crossroads is primarily based on agriculture. The area is home to several farms, which produce a variety of crops, including corn, soybeans, wheat, and hay. The area is also home to several small businesses, including a gas station, a grocery store, and a hardware store.
The area is also home to several manufacturing companies, including a furniture factory and a plastics factory. The area is also home to several trucking companies, which provide transportation services to the surrounding area.
Demographics
As of the 2010 census, the population of Powells Crossroads was 1,845. The population is primarily white, with a small percentage of African Americans and Hispanics. The median household income is $45,000, and the median home value is $150,000. The unemployment rate is 5.2%, which is slightly lower than the national average.
Conclusion
Powells Crossroads is an unincorporated community located in the state of Tennessee, in the United States. It is situated in the northern part of the state, in the county of Wilson. The community is located at the intersection of two major highways, U.S. Route 70 and State Route 840. It is approximately 20 miles east of Nashville and about 10 miles south of Lebanon. The economy of Powells Crossroads is primarily based on agriculture, with several farms and small businesses in the area. The population of Powells Crossroads is 1,845, with a median household income of $45,000 and a median home value of $150,000.
Common Questions
What is Per Capita Income in Powells Crossroads?
Per Capita income in Powells Crossroads is $28,586.
What is the Median Family Income in Powells Crossroads?
Median Family Income in Powells Crossroads is $80,035.
What is the Median Household income in Powells Crossroads?
Median Household Income in Powells Crossroads is $64,100.
What is Income or Wage Gap in Powells Crossroads?
Income or Wage Gap in Powells Crossroads is 40.6%.
Women in Powells Crossroads earn 59.4 cents for every dollar earned by a man.
What is Inequality or Gini Index in Powells Crossroads?
Inequality or Gini Index in Powells Crossroads is 0.33.
What is the Total Population of Powells Crossroads?
Total Population of Powells Crossroads is 1,686.
What is the Total Male Population of Powells Crossroads?
Total Male Population of Powells Crossroads is 894.
What is the Total Female Population of Powells Crossroads?
Total Female Population of Powells Crossroads is 792.
What is the Ratio of Males per 100 Females in Powells Crossroads?
There are 112.88 Males per 100 Females in Powells Crossroads.
What is the Ratio of Females per 100 Males in Powells Crossroads?
There are 88.59 Females per 100 Males in Powells Crossroads.
What is the Median Population Age in Powells Crossroads?
Median Population Age in Powells Crossroads is 38.8 Years.
What is the Average Family Size in Powells Crossroads
Average Family Size in Powells Crossroads is 3.0 People.
What is the Average Household Size in Powells Crossroads
Average Household Size in Powells Crossroads is 2.6 People.
How Large is the Labor Force in Powells Crossroads?
There are 814 People in the Labor Forcein in Powells Crossroads.
What is the Percentage of People in the Labor Force in Powells Crossroads?
61.8% of People are in the Labor Force in Powells Crossroads.
What is the Unemployment Rate in Powells Crossroads?
Unemployment Rate in Powells Crossroads is 5.2%.