Zip Codes with the Highest Percentage of Population Employed in Architecture & Engineering in Crossville, TN
RELATED REPORTS & OPTIONS
Architecture & Engineering
Crossville
Compare Zip Codes
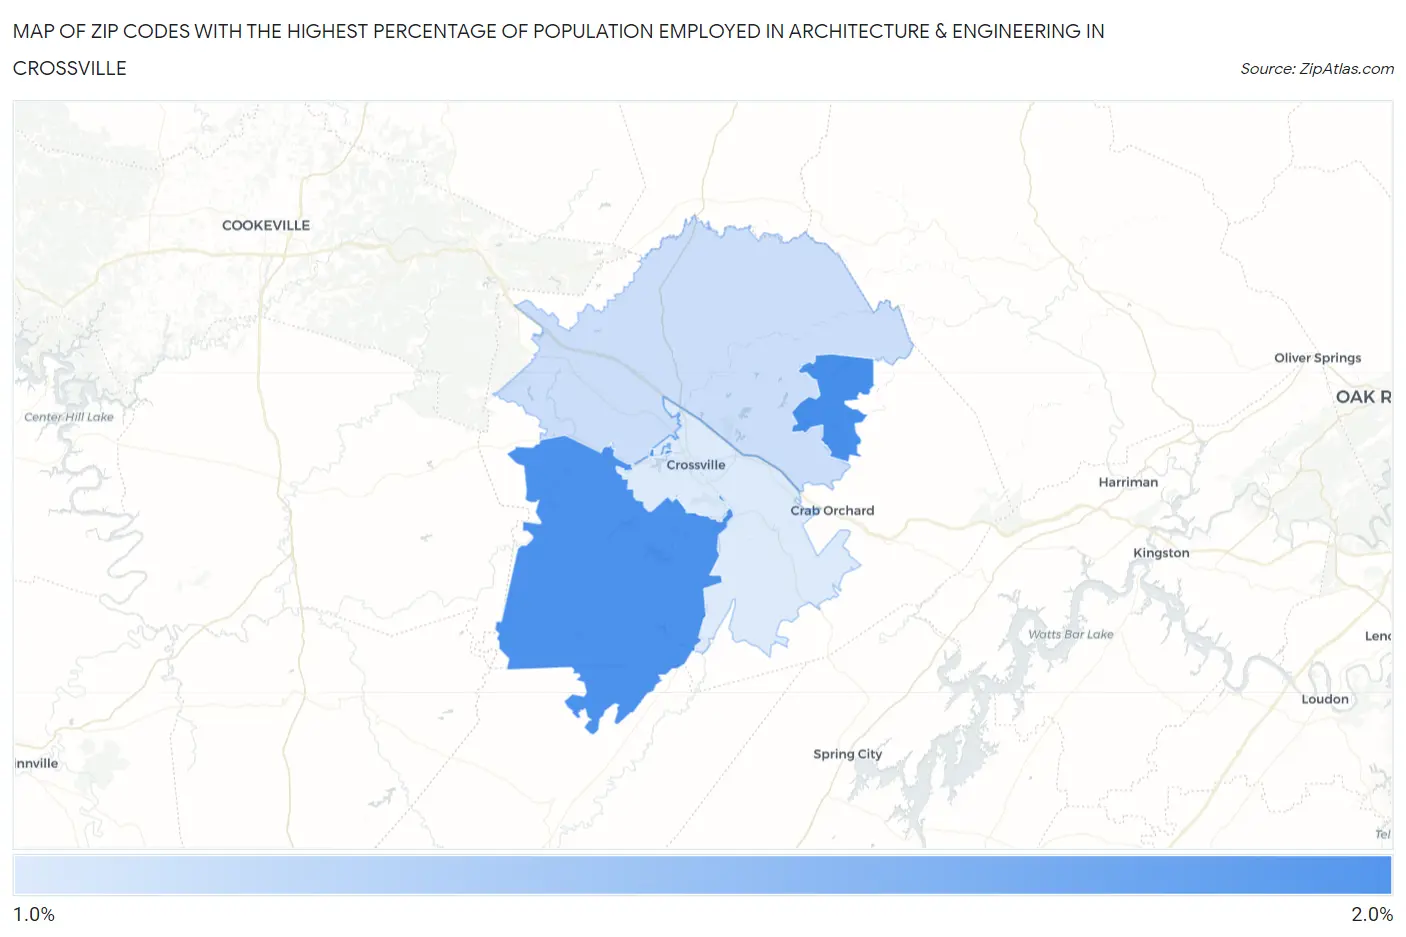
Map of Zip Codes with the Highest Percentage of Population Employed in Architecture & Engineering in Crossville
1.1%
1.9%
Zip Codes with the Highest Percentage of Population Employed in Architecture & Engineering in Crossville, TN
| Zip Code | % Employed | vs State | vs National | |
| 1. | 38558 | 1.9% | 1.7%(+0.241)#179 | 2.1%(-0.240)#10,175 |
| 2. | 38572 | 1.9% | 1.7%(+0.218)#184 | 2.1%(-0.263)#10,328 |
| 3. | 38571 | 1.2% | 1.7%(-0.499)#306 | 2.1%(-0.980)#15,334 |
| 4. | 38555 | 1.1% | 1.7%(-0.600)#317 | 2.1%(-1.08)#16,106 |
1
Common Questions
What are the Top 3 Zip Codes with the Highest Percentage of Population Employed in Architecture & Engineering in Crossville, TN?
Top 3 Zip Codes with the Highest Percentage of Population Employed in Architecture & Engineering in Crossville, TN are:
What zip code has the Highest Percentage of Population Employed in Architecture & Engineering in Crossville, TN?
38558 has the Highest Percentage of Population Employed in Architecture & Engineering in Crossville, TN with 1.9%.
What is the Percentage of Population Employed in Architecture & Engineering in Crossville, TN?
Percentage of Population Employed in Architecture & Engineering in Crossville is 0.82%.
What is the Percentage of Population Employed in Architecture & Engineering in Tennessee?
Percentage of Population Employed in Architecture & Engineering in Tennessee is 1.7%.
What is the Percentage of Population Employed in Architecture & Engineering in the United States?
Percentage of Population Employed in Architecture & Engineering in the United States is 2.1%.