Zip Codes with the Highest Percentage of Population Employed in Architecture & Engineering in Greeneville, TN
RELATED REPORTS & OPTIONS
Architecture & Engineering
Greeneville
Compare Zip Codes
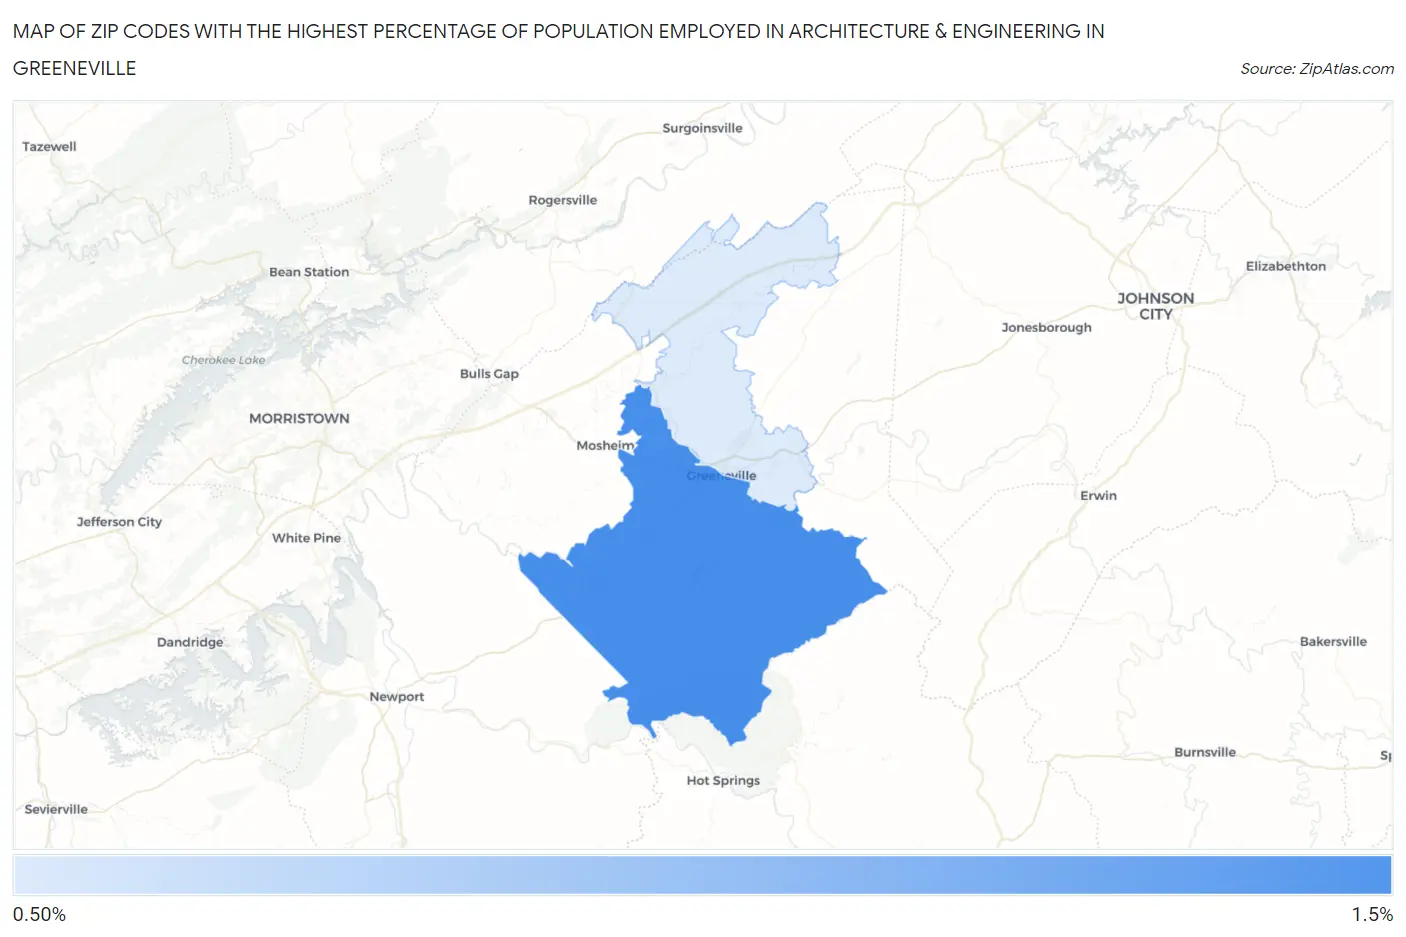
Map of Zip Codes with the Highest Percentage of Population Employed in Architecture & Engineering in Greeneville
0.99%
1.2%
Zip Codes with the Highest Percentage of Population Employed in Architecture & Engineering in Greeneville, TN
| Zip Code | % Employed | vs State | vs National | |
| 1. | 37743 | 1.2% | 1.7%(-0.492)#303 | 2.1%(-0.973)#15,272 |
| 2. | 37745 | 0.99% | 1.7%(-0.678)#337 | 2.1%(-1.16)#16,678 |
1
Common Questions
What are the Top Zip Codes with the Highest Percentage of Population Employed in Architecture & Engineering in Greeneville, TN?
Top Zip Codes with the Highest Percentage of Population Employed in Architecture & Engineering in Greeneville, TN are:
What zip code has the Highest Percentage of Population Employed in Architecture & Engineering in Greeneville, TN?
37743 has the Highest Percentage of Population Employed in Architecture & Engineering in Greeneville, TN with 1.2%.
What is the Percentage of Population Employed in Architecture & Engineering in Greeneville, TN?
Percentage of Population Employed in Architecture & Engineering in Greeneville is 0.61%.
What is the Percentage of Population Employed in Architecture & Engineering in Tennessee?
Percentage of Population Employed in Architecture & Engineering in Tennessee is 1.7%.
What is the Percentage of Population Employed in Architecture & Engineering in the United States?
Percentage of Population Employed in Architecture & Engineering in the United States is 2.1%.