Zip Codes with the Highest Percentage of Population Employed in Community & Social Service in Oklahoma City, OK

RELATED REPORTS & OPTIONS

Community & Social Service
Population
Families and Households
Female Fertility
Female Fertility (Unmarried)
Race (Community Size)
Race (Percentage)
Ancestry (Community Size)
AfricanAlaska NativeAlbanianAmericanApacheArabArapahoArgentineanArmenianAustralianAustrianBahamianBangladeshiBarbadianBasqueBelgianBhutaneseBlackfeetBolivianBrazilianBritishBritish West IndianBulgarianBurmeseCajunCambodianCanadianCelticCentral AmericanCentral American IndianCherokeeCheyenneChickasawChileanChippewaChoctawColombianComancheCreeCreekCroatianCubanCzechCzechoslovakianDanishDelawareDominicanDutchDutch West IndianEastern EuropeanEcuadorianEgyptianEnglishEstonianEthiopianEuropeanFijianFilipinoFinnishFrenchFrench American IndianFrench CanadianGermanGerman RussianGhanaianGreekGuamanian / ChamorroGuatemalanGuyaneseHaitianHonduranHopiHungarianIcelanderIndian (Asian)IndonesianInupiatIranianIraqiIrishIroquoisIsraeliItalianJamaicanJapaneseJordanianKenyanKiowaKoreanLaotianLatvianLebaneseLiberianLithuanianLuxembourgerMalaysianMexicanMexican American IndianMongolianMoroccanNative HawaiianNavajoNew ZealanderNicaraguanNigerianNorthern EuropeanNorwegianOkinawanOsagePakistaniPalestinianPanamanianPennsylvania GermanPeruvianPimaPolishPortuguesePotawatomiPuebloPuerto RicanRomanianRussianSalvadoranSamoanScandinavianScotch-IrishScottishSeminoleSerbianSiouxSlavicSlovakSloveneSouth AfricanSouth AmericanSouth American IndianSpaniardSpanishSpanish American IndianSri LankanSubsaharan AfricanSudaneseSwedishSwissSyrianThaiTlingit-HaidaTonganTrinidadian and TobagonianTurkishU.S. Virgin IslanderUkrainianUruguayanVenezuelanVietnameseWelshWest IndianYugoslavianZimbabwean
Ancestry (Percentage)
AfricanAlaska NativeAlbanianAmericanApacheArabArapahoArgentineanArmenianAustralianAustrianBahamianBangladeshiBarbadianBasqueBelgianBhutaneseBlackfeetBolivianBrazilianBritishBritish West IndianBulgarianBurmeseCajunCambodianCanadianCelticCentral AmericanCentral American IndianCherokeeCheyenneChickasawChileanChippewaChoctawColombianComancheCreeCreekCroatianCubanCzechCzechoslovakianDanishDelawareDominicanDutchDutch West IndianEastern EuropeanEcuadorianEgyptianEnglishEstonianEthiopianEuropeanFijianFilipinoFinnishFrenchFrench American IndianFrench CanadianGermanGerman RussianGhanaianGreekGuamanian / ChamorroGuatemalanGuyaneseHaitianHonduranHopiHungarianIcelanderIndian (Asian)IndonesianInupiatIranianIraqiIrishIroquoisIsraeliItalianJamaicanJapaneseJordanianKenyanKiowaKoreanLaotianLatvianLebaneseLiberianLithuanianLuxembourgerMalaysianMexicanMexican American IndianMongolianMoroccanNative HawaiianNavajoNew ZealanderNicaraguanNigerianNorthern EuropeanNorwegianOkinawanOsagePakistaniPalestinianPanamanianPennsylvania GermanPeruvianPimaPolishPortuguesePotawatomiPuebloPuerto RicanRomanianRussianSalvadoranSamoanScandinavianScotch-IrishScottishSeminoleSerbianSiouxSlavicSlovakSloveneSouth AfricanSouth AmericanSouth American IndianSpaniardSpanishSpanish American IndianSri LankanSubsaharan AfricanSudaneseSwedishSwissSyrianThaiTlingit-HaidaTonganTrinidadian and TobagonianTurkishU.S. Virgin IslanderUkrainianUruguayanVenezuelanVietnameseWelshWest IndianYugoslavianZimbabwean
Immigrant Origin (Total)
AfricaArgentinaAsiaAustraliaAustriaBahamasBangladeshBosnia and HerzegovinaBrazilBulgariaBurma / MyanmarCambodiaCameroonCanadaCaribbeanCentral AmericaChileChinaColombiaCubaDominican RepublicEastern AfricaEastern AsiaEastern EuropeEcuadorEgyptEl SalvadorEnglandEritreaEthiopiaEuropeFranceGermanyGhanaGreeceGuatemalaHondurasHong KongIndiaIndonesiaIranIraqIrelandItalyJamaicaJapanJordanKazakhstanKenyaKoreaKuwaitLaosLatin AmericaLebanonLiberiaMalaysiaMexicoMiddle AfricaMoroccoNepalNetherlandsNicaraguaNigeriaNorthern AfricaNorthern EuropeNorwayOceaniaPakistanPanamaPeruPhilippinesPolandPortugalRussiaSaudi ArabiaScotlandSingaporeSouth AfricaSouth AmericaSouth Central AsiaSouth Eastern AsiaSouthern EuropeSpainSudanSyriaTaiwanThailandTrinidad and TobagoTurkeyUkraineVenezuelaVietnamWestern AfricaWestern AsiaWestern EuropeZaireZimbabwe
Immigrant Origin (Percentage)
AfricaArgentinaAsiaAustraliaAustriaBahamasBangladeshBosnia and HerzegovinaBrazilBulgariaBurma / MyanmarCambodiaCameroonCanadaCaribbeanCentral AmericaChileChinaColombiaCubaDominican RepublicEastern AfricaEastern AsiaEastern EuropeEcuadorEgyptEl SalvadorEnglandEritreaEthiopiaEuropeFranceGermanyGhanaGreeceGuatemalaHondurasHong KongIndiaIndonesiaIranIraqIrelandItalyJamaicaJapanJordanKazakhstanKenyaKoreaKuwaitLaosLatin AmericaLebanonLiberiaMalaysiaMexicoMiddle AfricaMoroccoNepalNetherlandsNicaraguaNigeriaNorthern AfricaNorthern EuropeNorwayOceaniaPakistanPanamaPeruPhilippinesPolandPortugalRussiaSaudi ArabiaScotlandSingaporeSouth AfricaSouth AmericaSouth Central AsiaSouth Eastern AsiaSouthern EuropeSpainSudanSyriaTaiwanThailandTrinidad and TobagoTurkeyUkraineVenezuelaVietnamWestern AfricaWestern AsiaWestern EuropeZaireZimbabwe
Income
Income (Families)
Income (Households)
Poverty
Poverty (Families)
Unemployment
Employment Occupations
Employment Industries
Employer Class
Commute Time
Commute Means
School Enrollment
Education by Degree Field
Occupancy
Finances
Physical Characteristics
Oklahoma City
Compare Zip Codes
Comparison Subject

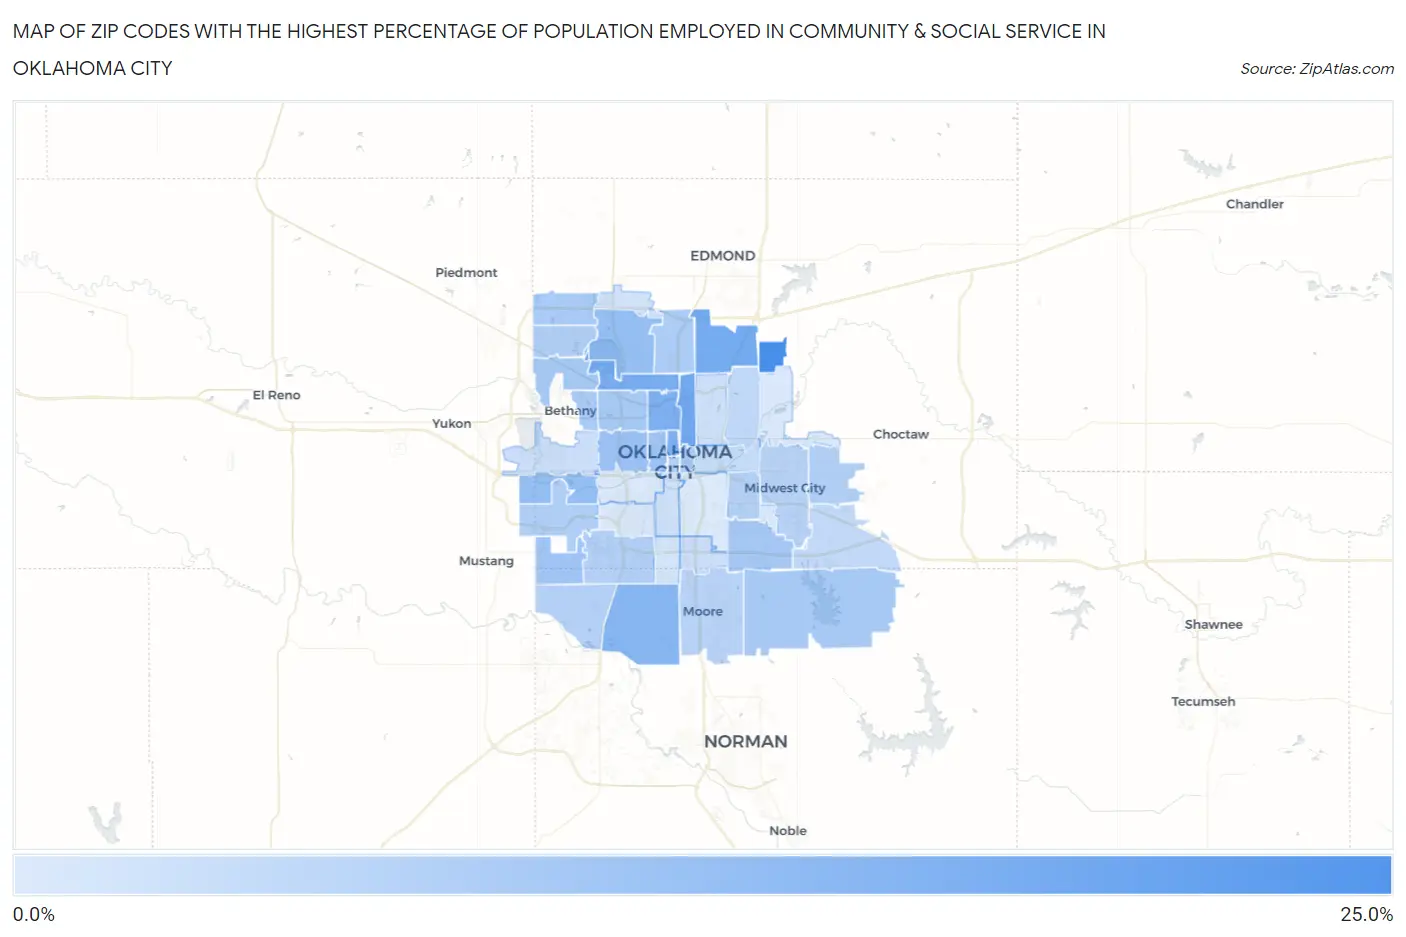
Map of Zip Codes with the Highest Percentage of Population Employed in Community & Social Service in Oklahoma City

0.0%
25.0%
Zip Codes with the Highest Percentage of Population Employed in Community & Social Service  in Oklahoma City Map

Zip Codes with the Highest Percentage of Population Employed in Community & Social Service in Oklahoma City, OK

Zip Code % Employed vs State vs National
1.7315123.4%10.6%(+12.8)#1611.2%(+12.2)#1,215
2.7310517.6%10.6%(+7.01)#4411.2%(+6.40)#3,012
3.7313116.9%10.6%(+6.29)#5311.2%(+5.68)#3,449
4.7311616.4%10.6%(+5.77)#6111.2%(+5.16)#3,783
5.7310316.0%10.6%(+5.41)#6311.2%(+4.80)#4,062
6.7311815.8%10.6%(+5.15)#6711.2%(+4.54)#4,288
7.7317014.3%10.6%(+3.68)#9911.2%(+3.07)#5,704
8.7312812.6%10.6%(+2.03)#14211.2%(+1.42)#8,183
9.7312012.6%10.6%(+2.00)#14311.2%(+1.39)#8,232
10.7310711.8%10.6%(+1.20)#16911.2%(+0.591)#9,756
11.7310611.5%10.6%(+0.916)#17911.2%(+0.307)#10,415
12.7316911.0%10.6%(+0.436)#19711.2%(-0.173)#11,533
13.7313510.4%10.6%(-0.243)#23711.2%(-0.853)#13,206
14.7316510.3%10.6%(-0.309)#24111.2%(-0.918)#13,369
15.7311210.3%10.6%(-0.340)#24311.2%(-0.949)#13,452
16.7313210.2%10.6%(-0.426)#24811.2%(-1.04)#13,658
17.7310410.1%10.6%(-0.477)#25411.2%(-1.09)#13,799
18.7312210.0%10.6%(-0.618)#26111.2%(-1.23)#14,160
19.731429.9%10.6%(-0.706)#26511.2%(-1.31)#14,395
20.731149.5%10.6%(-1.09)#28711.2%(-1.70)#15,389
21.731629.4%10.6%(-1.25)#29511.2%(-1.86)#15,815
22.731798.9%10.6%(-1.69)#32111.2%(-2.30)#17,051
23.731598.9%10.6%(-1.75)#32511.2%(-2.36)#17,205
24.731028.8%10.6%(-1.77)#32811.2%(-2.38)#17,262
25.731308.8%10.6%(-1.80)#32911.2%(-2.41)#17,330
26.731738.7%10.6%(-1.88)#33511.2%(-2.49)#17,564
27.731158.5%10.6%(-2.06)#34811.2%(-2.67)#18,059
28.731108.1%10.6%(-2.52)#37811.2%(-3.13)#19,333
29.731608.0%10.6%(-2.60)#38311.2%(-3.21)#19,537
30.731217.1%10.6%(-3.46)#43611.2%(-4.07)#21,767
31.731506.9%10.6%(-3.73)#45411.2%(-4.34)#22,436
32.731176.5%10.6%(-4.09)#47111.2%(-4.70)#23,242
33.731495.9%10.6%(-4.72)#49511.2%(-5.33)#24,584
34.731275.7%10.6%(-4.87)#50011.2%(-5.48)#24,904
35.731115.4%10.6%(-5.17)#51911.2%(-5.78)#25,471
36.731095.1%10.6%(-5.47)#52811.2%(-6.08)#25,974
37.731344.9%10.6%(-5.69)#53811.2%(-6.30)#26,327
38.731394.7%10.6%(-5.86)#54411.2%(-6.47)#26,591
39.731454.0%10.6%(-6.60)#55911.2%(-7.21)#27,547
40.731083.9%10.6%(-6.68)#56211.2%(-7.29)#27,638
41.731413.9%10.6%(-6.74)#56811.2%(-7.35)#27,717
42.731193.7%10.6%(-6.87)#57111.2%(-7.48)#27,878
43.731293.6%10.6%(-7.02)#58011.2%(-7.63)#28,018

Common Questions

What are the Top 10 Zip Codes with the Highest Percentage of Population Employed in Community & Social Service in Oklahoma City, OK?
Top 10 Zip Codes with the Highest Percentage of Population Employed in Community & Social Service in Oklahoma City, OK are:
#1
23.4%
#2
17.6%
#3
16.9%
#4
16.4%
#5
16.0%
#6
15.8%
#7
14.3%
#8
12.6%
#9
12.6%
#10
11.8%
What zip code has the Highest Percentage of Population Employed in Community & Social Service in Oklahoma City, OK?
73151 has the Highest Percentage of Population Employed in Community & Social Service in Oklahoma City, OK with 23.4%.
What is the Percentage of Population Employed in Community & Social Service in Oklahoma City, OK?
Percentage of Population Employed in Community & Social Service in Oklahoma City is 10.2%.
What is the Percentage of Population Employed in Community & Social Service in Oklahoma?
Percentage of Population Employed in Community & Social Service in Oklahoma is 10.6%.
What is the Percentage of Population Employed in Community & Social Service in the United States?
Percentage of Population Employed in Community & Social Service in the United States is 11.2%.