Zip Codes with the Highest Percentage of Population Employed in Community & Social Service in Oklahoma
RELATED REPORTS & OPTIONS
Community & Social Service
Oklahoma
Compare Zip Codes
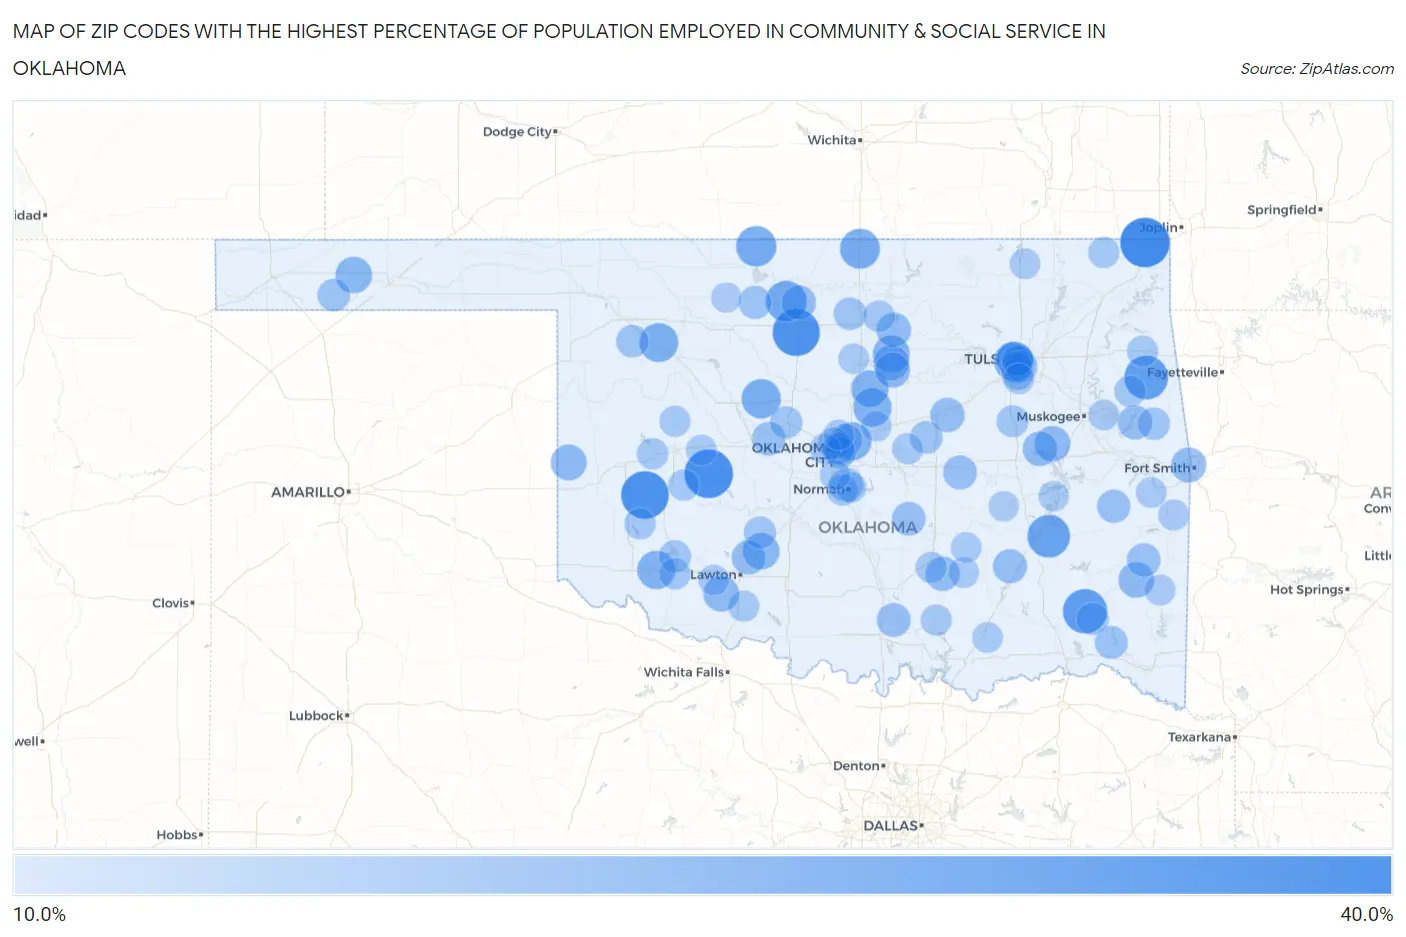
Map of Zip Codes with the Highest Percentage of Population Employed in Community & Social Service in Oklahoma
10.0%
40.0%
Zip Codes with the Highest Percentage of Population Employed in Community & Social Service in Oklahoma
| Zip Code | % Employed | vs State | vs National | |
| 1. | 74360 | 37.5% | 10.6%(+26.9)#1 | 11.2%(+26.3)#342 |
| 2. | 73021 | 36.2% | 10.6%(+25.6)#2 | 11.2%(+25.0)#370 |
| 3. | 73664 | 35.2% | 10.6%(+24.6)#3 | 11.2%(+24.0)#386 |
| 4. | 73705 | 34.6% | 10.6%(+24.0)#4 | 11.2%(+23.4)#401 |
| 5. | 74543 | 31.0% | 10.6%(+20.4)#5 | 11.2%(+19.8)#533 |
| 6. | 74457 | 30.3% | 10.6%(+19.7)#6 | 11.2%(+19.1)#571 |
| 7. | 74522 | 28.9% | 10.6%(+18.3)#7 | 11.2%(+17.7)#641 |
| 8. | 73743 | 27.0% | 10.6%(+16.4)#8 | 11.2%(+15.8)#772 |
| 9. | 73719 | 26.2% | 10.6%(+15.6)#9 | 11.2%(+15.0)#844 |
| 10. | 74632 | 25.8% | 10.6%(+15.2)#10 | 11.2%(+14.5)#890 |
| 11. | 73764 | 25.0% | 10.6%(+14.4)#11 | 11.2%(+13.8)#978 |
| 12. | 74119 | 24.9% | 10.6%(+14.3)#12 | 11.2%(+13.7)#991 |
| 13. | 73853 | 24.7% | 10.6%(+14.1)#13 | 11.2%(+13.5)#1,019 |
| 14. | 73058 | 23.7% | 10.6%(+13.1)#14 | 11.2%(+12.5)#1,156 |
| 15. | 73549 | 23.6% | 10.6%(+13.0)#15 | 11.2%(+12.4)#1,164 |
| 16. | 73151 | 23.4% | 10.6%(+12.8)#16 | 11.2%(+12.2)#1,215 |
| 17. | 73050 | 22.4% | 10.6%(+11.8)#17 | 11.2%(+11.2)#1,377 |
| 18. | 74075 | 22.2% | 10.6%(+11.6)#18 | 11.2%(+11.0)#1,413 |
| 19. | 73939 | 21.7% | 10.6%(+11.1)#19 | 11.2%(+10.5)#1,544 |
| 20. | 73541 | 21.6% | 10.6%(+11.0)#20 | 11.2%(+10.4)#1,558 |
| 21. | 74120 | 21.1% | 10.6%(+10.5)#21 | 11.2%(+9.93)#1,675 |
| 22. | 73666 | 20.9% | 10.6%(+10.3)#22 | 11.2%(+9.68)#1,744 |
| 23. | 73540 | 20.7% | 10.6%(+10.1)#23 | 11.2%(+9.50)#1,806 |
| 24. | 74549 | 20.6% | 10.6%(+10.0)#24 | 11.2%(+9.42)#1,830 |
| 25. | 74428 | 20.6% | 10.6%(+9.98)#25 | 11.2%(+9.37)#1,839 |
| 26. | 74077 | 20.4% | 10.6%(+9.79)#26 | 11.2%(+9.18)#1,908 |
| 27. | 74074 | 20.2% | 10.6%(+9.55)#27 | 11.2%(+8.94)#1,966 |
| 28. | 74946 | 20.0% | 10.6%(+9.40)#28 | 11.2%(+8.79)#2,028 |
| 29. | 74438 | 19.6% | 10.6%(+8.96)#29 | 11.2%(+8.35)#2,177 |
| 30. | 73061 | 19.3% | 10.6%(+8.72)#30 | 11.2%(+8.11)#2,262 |
| 31. | 74842 | 19.2% | 10.6%(+8.63)#31 | 11.2%(+8.02)#2,298 |
| 32. | 73753 | 19.2% | 10.6%(+8.60)#32 | 11.2%(+7.99)#2,308 |
| 33. | 74046 | 19.0% | 10.6%(+8.44)#33 | 11.2%(+7.83)#2,382 |
| 34. | 74427 | 19.0% | 10.6%(+8.42)#34 | 11.2%(+7.81)#2,391 |
| 35. | 73538 | 18.8% | 10.6%(+8.18)#35 | 11.2%(+7.57)#2,477 |
| 36. | 74576 | 18.8% | 10.6%(+8.15)#36 | 11.2%(+7.54)#2,495 |
| 37. | 73069 | 18.6% | 10.6%(+7.95)#37 | 11.2%(+7.34)#2,578 |
| 38. | 74837 | 18.5% | 10.6%(+7.91)#38 | 11.2%(+7.30)#2,591 |
| 39. | 73436 | 18.5% | 10.6%(+7.86)#39 | 11.2%(+7.25)#2,609 |
| 40. | 74826 | 18.3% | 10.6%(+7.65)#40 | 11.2%(+7.04)#2,691 |
| 41. | 73014 | 18.2% | 10.6%(+7.58)#41 | 11.2%(+6.97)#2,726 |
| 42. | 74577 | 18.2% | 10.6%(+7.58)#42 | 11.2%(+6.97)#2,731 |
| 43. | 74943 | 17.8% | 10.6%(+7.17)#43 | 11.2%(+6.56)#2,933 |
| 44. | 73105 | 17.6% | 10.6%(+7.01)#44 | 11.2%(+6.40)#3,012 |
| 45. | 73741 | 17.5% | 10.6%(+6.86)#45 | 11.2%(+6.26)#3,075 |
| 46. | 74755 | 17.4% | 10.6%(+6.79)#46 | 11.2%(+6.18)#3,126 |
| 47. | 74103 | 17.3% | 10.6%(+6.69)#47 | 11.2%(+6.08)#3,189 |
| 48. | 74869 | 17.2% | 10.6%(+6.55)#48 | 11.2%(+5.94)#3,277 |
| 49. | 73949 | 17.1% | 10.6%(+6.48)#49 | 11.2%(+5.87)#3,324 |
| 50. | 74630 | 17.0% | 10.6%(+6.38)#50 | 11.2%(+5.77)#3,387 |
| 51. | 73857 | 17.0% | 10.6%(+6.35)#51 | 11.2%(+5.74)#3,411 |
| 52. | 74114 | 16.9% | 10.6%(+6.30)#52 | 11.2%(+5.69)#3,443 |
| 53. | 73131 | 16.9% | 10.6%(+6.29)#53 | 11.2%(+5.68)#3,449 |
| 54. | 74931 | 16.8% | 10.6%(+6.16)#54 | 11.2%(+5.55)#3,534 |
| 55. | 73762 | 16.8% | 10.6%(+6.15)#55 | 11.2%(+5.54)#3,539 |
| 56. | 74562 | 16.6% | 10.6%(+5.99)#56 | 11.2%(+5.38)#3,642 |
| 57. | 73559 | 16.5% | 10.6%(+5.94)#57 | 11.2%(+5.33)#3,666 |
| 58. | 73029 | 16.5% | 10.6%(+5.91)#58 | 11.2%(+5.30)#3,685 |
| 59. | 74171 | 16.4% | 10.6%(+5.82)#59 | 11.2%(+5.21)#3,744 |
| 60. | 74135 | 16.4% | 10.6%(+5.79)#60 | 11.2%(+5.18)#3,769 |
| 61. | 73116 | 16.4% | 10.6%(+5.77)#61 | 11.2%(+5.16)#3,783 |
| 62. | 74456 | 16.3% | 10.6%(+5.67)#62 | 11.2%(+5.06)#3,855 |
| 63. | 73103 | 16.0% | 10.6%(+5.41)#63 | 11.2%(+4.80)#4,062 |
| 64. | 74105 | 15.9% | 10.6%(+5.32)#64 | 11.2%(+4.71)#4,128 |
| 65. | 74104 | 15.9% | 10.6%(+5.31)#65 | 11.2%(+4.70)#4,132 |
| 66. | 74651 | 15.9% | 10.6%(+5.29)#66 | 11.2%(+4.68)#4,150 |
| 67. | 73118 | 15.8% | 10.6%(+5.15)#67 | 11.2%(+4.54)#4,288 |
| 68. | 73566 | 15.7% | 10.6%(+5.09)#68 | 11.2%(+4.48)#4,339 |
| 69. | 73647 | 15.7% | 10.6%(+5.07)#69 | 11.2%(+4.46)#4,353 |
| 70. | 73072 | 15.5% | 10.6%(+4.92)#70 | 11.2%(+4.31)#4,479 |
| 71. | 73655 | 15.5% | 10.6%(+4.90)#71 | 11.2%(+4.29)#4,495 |
| 72. | 74464 | 15.5% | 10.6%(+4.89)#72 | 11.2%(+4.28)#4,506 |
| 73. | 73632 | 15.5% | 10.6%(+4.86)#73 | 11.2%(+4.25)#4,541 |
| 74. | 74368 | 15.4% | 10.6%(+4.78)#74 | 11.2%(+4.17)#4,624 |
| 75. | 74369 | 15.3% | 10.6%(+4.72)#75 | 11.2%(+4.11)#4,679 |
| 76. | 74843 | 15.3% | 10.6%(+4.72)#76 | 11.2%(+4.11)#4,683 |
| 77. | 74855 | 15.2% | 10.6%(+4.64)#77 | 11.2%(+4.03)#4,759 |
| 78. | 73572 | 15.2% | 10.6%(+4.64)#78 | 11.2%(+4.03)#4,763 |
| 79. | 73460 | 15.2% | 10.6%(+4.62)#79 | 11.2%(+4.02)#4,767 |
| 80. | 73639 | 15.1% | 10.6%(+4.49)#80 | 11.2%(+3.88)#4,877 |
| 81. | 74953 | 15.0% | 10.6%(+4.36)#81 | 11.2%(+3.75)#5,000 |
| 82. | 74957 | 14.9% | 10.6%(+4.30)#82 | 11.2%(+3.69)#5,054 |
| 83. | 74137 | 14.9% | 10.6%(+4.28)#83 | 11.2%(+3.67)#5,072 |
| 84. | 74572 | 14.9% | 10.6%(+4.28)#84 | 11.2%(+3.67)#5,078 |
| 85. | 74930 | 14.8% | 10.6%(+4.21)#85 | 11.2%(+3.60)#5,144 |
| 86. | 74729 | 14.8% | 10.6%(+4.20)#86 | 11.2%(+3.59)#5,152 |
| 87. | 73054 | 14.8% | 10.6%(+4.19)#87 | 11.2%(+3.58)#5,169 |
| 88. | 73008 | 14.8% | 10.6%(+4.17)#88 | 11.2%(+3.56)#5,180 |
| 89. | 74029 | 14.7% | 10.6%(+4.10)#89 | 11.2%(+3.49)#5,254 |
| 90. | 73096 | 14.7% | 10.6%(+4.08)#90 | 11.2%(+3.47)#5,274 |
| 91. | 74825 | 14.7% | 10.6%(+4.07)#91 | 11.2%(+3.46)#5,283 |
| 92. | 73073 | 14.6% | 10.6%(+4.01)#92 | 11.2%(+3.40)#5,350 |
| 93. | 73013 | 14.6% | 10.6%(+3.99)#93 | 11.2%(+3.38)#5,374 |
| 94. | 74434 | 14.6% | 10.6%(+3.96)#94 | 11.2%(+3.35)#5,407 |
| 95. | 73071 | 14.6% | 10.6%(+3.96)#95 | 11.2%(+3.35)#5,409 |
| 96. | 73527 | 14.5% | 10.6%(+3.92)#96 | 11.2%(+3.31)#5,447 |
| 97. | 74425 | 14.5% | 10.6%(+3.88)#97 | 11.2%(+3.27)#5,490 |
| 98. | 73726 | 14.4% | 10.6%(+3.77)#98 | 11.2%(+3.16)#5,613 |
| 99. | 73170 | 14.3% | 10.6%(+3.68)#99 | 11.2%(+3.07)#5,704 |
| 100. | 74850 | 14.3% | 10.6%(+3.68)#100 | 11.2%(+3.07)#5,721 |
Common Questions
What are the Top 10 Zip Codes with the Highest Percentage of Population Employed in Community & Social Service in Oklahoma?
Top 10 Zip Codes with the Highest Percentage of Population Employed in Community & Social Service in Oklahoma are:
What zip code has the Highest Percentage of Population Employed in Community & Social Service in Oklahoma?
74360 has the Highest Percentage of Population Employed in Community & Social Service in Oklahoma with 37.5%.
What is the Percentage of Population Employed in Community & Social Service in the State of Oklahoma?
Percentage of Population Employed in Community & Social Service in Oklahoma is 10.6%.
What is the Percentage of Population Employed in Community & Social Service in the United States?
Percentage of Population Employed in Community & Social Service in the United States is 11.2%.