Tatum, NM Map & Demographics
Tatum Map
Tatum Overview
$35,655
PER CAPITA INCOME
$40,750
AVG FAMILY INCOME
$46,477
AVG HOUSEHOLD INCOME
0.46
INEQUALITY / GINI INDEX
794
TOTAL POPULATION
389
MALE POPULATION
405
FEMALE POPULATION
96.05
MALES / 100 FEMALES
104.11
FEMALES / 100 MALES
34.1
MEDIAN AGE
2.7
AVG FAMILY SIZE
2.5
AVG HOUSEHOLD SIZE
389
LABOR FORCE [ PEOPLE ]
59.3%
PERCENT IN LABOR FORCE
Tatum Zip Codes
Income in Tatum
Income Overview in Tatum
Per Capita Income in Tatum is $35,655, while median incomes of families and households are $40,750 and $46,477 respectively.
| Characteristic | Number | Measure |
| Per Capita Income | 794 | $35,655 |
| Median Family Income | 215 | $40,750 |
| Mean Family Income | 215 | $48,131 |
| Median Household Income | 320 | $46,477 |
| Mean Household Income | 320 | $63,210 |
| Income Deficit | 215 | $0 |
| Wage / Income Gap (%) | 794 | 0.00% |
| Wage / Income Gap ($) | 794 | 100.00¢ per $1 |
| Gini / Inequality Index | 794 | 0.46 |
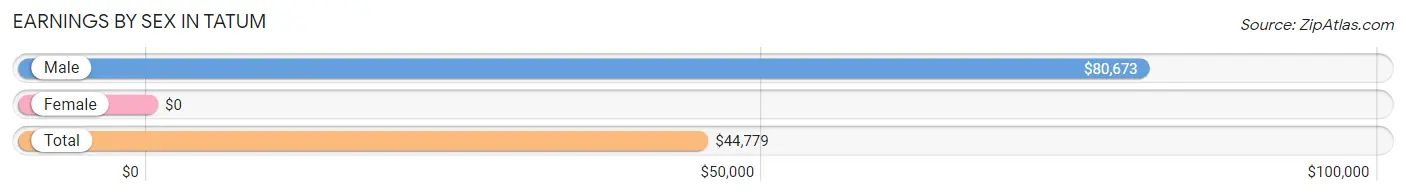
Earnings by Sex in Tatum
| Sex | Number | Average Earnings |
| Male | 249 (60.6%) | $80,673 |
| Female | 162 (39.4%) | $0 |
| Total | 411 (100.0%) | $44,779 |
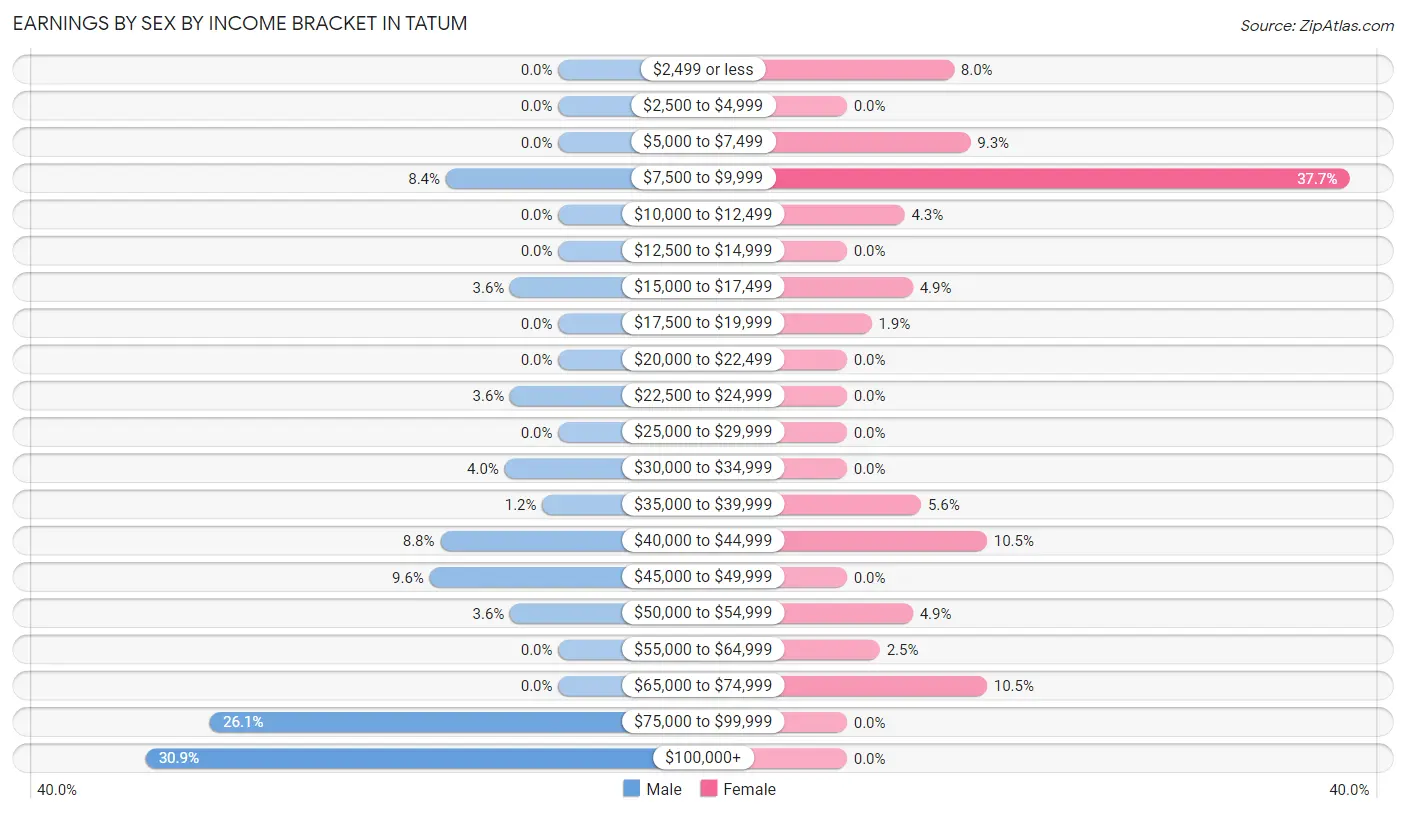
Earnings by Sex by Income Bracket in Tatum
The most common earnings brackets in Tatum are $100,000+ for men (77 | 30.9%) and $7,500 to $9,999 for women (61 | 37.7%).
| Income | Male | Female |
| $2,499 or less | 0 (0.0%) | 13 (8.0%) |
| $2,500 to $4,999 | 0 (0.0%) | 0 (0.0%) |
| $5,000 to $7,499 | 0 (0.0%) | 15 (9.3%) |
| $7,500 to $9,999 | 21 (8.4%) | 61 (37.7%) |
| $10,000 to $12,499 | 0 (0.0%) | 7 (4.3%) |
| $12,500 to $14,999 | 0 (0.0%) | 0 (0.0%) |
| $15,000 to $17,499 | 9 (3.6%) | 8 (4.9%) |
| $17,500 to $19,999 | 0 (0.0%) | 3 (1.8%) |
| $20,000 to $22,499 | 0 (0.0%) | 0 (0.0%) |
| $22,500 to $24,999 | 9 (3.6%) | 0 (0.0%) |
| $25,000 to $29,999 | 0 (0.0%) | 0 (0.0%) |
| $30,000 to $34,999 | 10 (4.0%) | 0 (0.0%) |
| $35,000 to $39,999 | 3 (1.2%) | 9 (5.6%) |
| $40,000 to $44,999 | 22 (8.8%) | 17 (10.5%) |
| $45,000 to $49,999 | 24 (9.6%) | 0 (0.0%) |
| $50,000 to $54,999 | 9 (3.6%) | 8 (4.9%) |
| $55,000 to $64,999 | 0 (0.0%) | 4 (2.5%) |
| $65,000 to $74,999 | 0 (0.0%) | 17 (10.5%) |
| $75,000 to $99,999 | 65 (26.1%) | 0 (0.0%) |
| $100,000+ | 77 (30.9%) | 0 (0.0%) |
| Total | 249 (100.0%) | 162 (100.0%) |
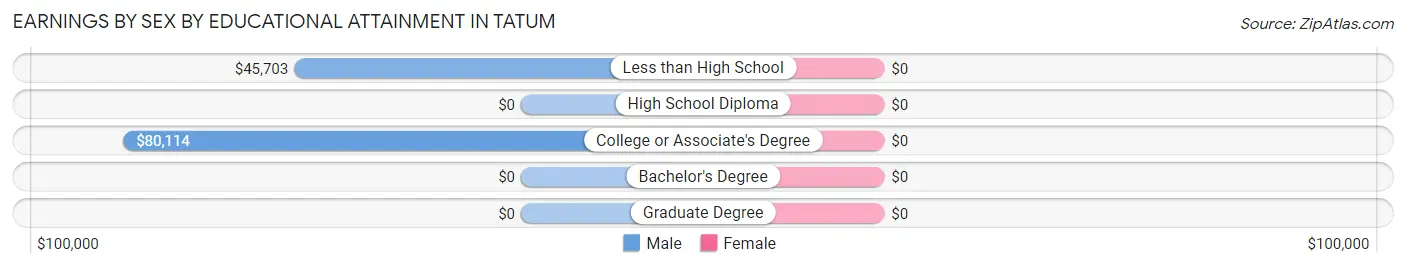
Earnings by Sex by Educational Attainment in Tatum
| Educational Attainment | Male Income | Female Income |
| Less than High School | $45,703 | $0 |
| High School Diploma | - | - |
| College or Associate's Degree | $80,114 | $0 |
| Bachelor's Degree | - | - |
| Graduate Degree | - | - |
| Total | $80,769 | $0 |
Family Income in Tatum
Family Income Brackets in Tatum
According to the Tatum family income data, there are 62 families falling into the less than $10,000 income range, which is the most common income bracket and makes up 28.8% of all families.
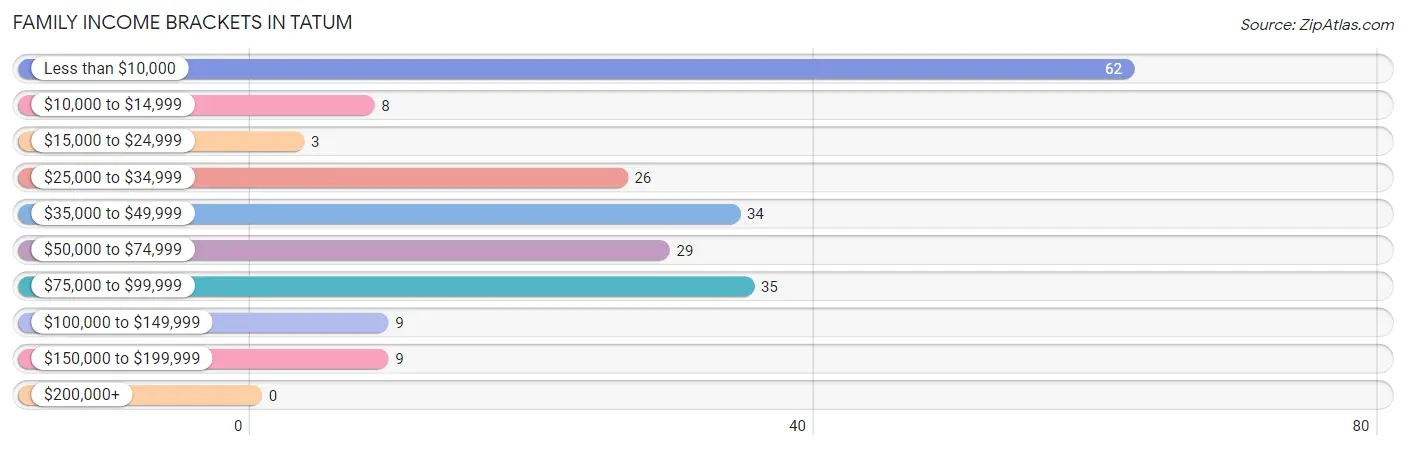
| Income Bracket | # Families | % Families |
| Less than $10,000 | 62 | 28.8% |
| $10,000 to $14,999 | 8 | 3.7% |
| $15,000 to $24,999 | 3 | 1.4% |
| $25,000 to $34,999 | 26 | 12.1% |
| $35,000 to $49,999 | 34 | 15.8% |
| $50,000 to $74,999 | 29 | 13.5% |
| $75,000 to $99,999 | 35 | 16.3% |
| $100,000 to $149,999 | 9 | 4.2% |
| $150,000 to $199,999 | 9 | 4.2% |
| $200,000+ | 0 | 0.0% |
Family Income by Famaliy Size in Tatum
4-person families (31 | 14.4%) account for the highest median family income in Tatum with $81,375 per family, while 4-person families (31 | 14.4%) have the highest median income of $20,344 per family member.
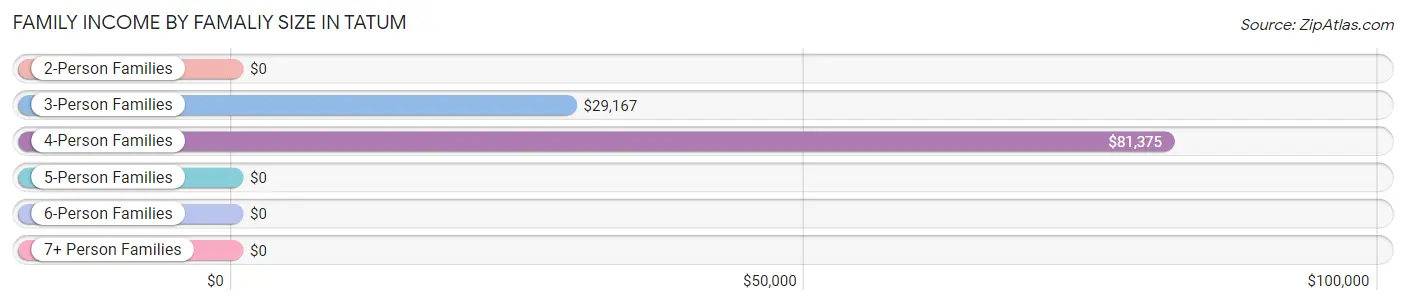
| Income Bracket | # Families | Median Income |
| 2-Person Families | 127 (59.1%) | $0 |
| 3-Person Families | 28 (13.0%) | $29,167 |
| 4-Person Families | 31 (14.4%) | $81,375 |
| 5-Person Families | 26 (12.1%) | $0 |
| 6-Person Families | 3 (1.4%) | $0 |
| 7+ Person Families | 0 (0.0%) | $0 |
| Total | 215 (100.0%) | $40,750 |
Family Income by Number of Earners in Tatum
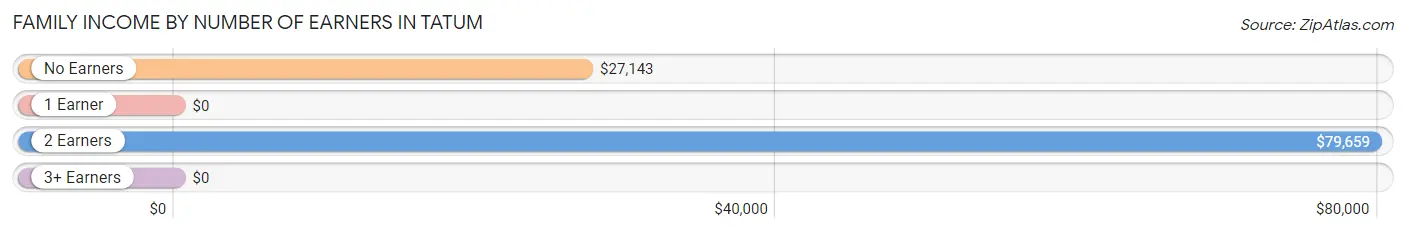
| Number of Earners | # Families | Median Income |
| No Earners | 30 (14.0%) | $27,143 |
| 1 Earner | 133 (61.9%) | $0 |
| 2 Earners | 43 (20.0%) | $79,659 |
| 3+ Earners | 9 (4.2%) | $0 |
| Total | 215 (100.0%) | $40,750 |
Household Income in Tatum
Household Income Brackets in Tatum
With 90 households falling in the category, the $75,000 to $99,999 income range is the most frequent in Tatum, accounting for 28.1% of all households. In contrast, only 9 households (2.8%) fall into the $100,000 to $149,999 income bracket, making it the least populous group.
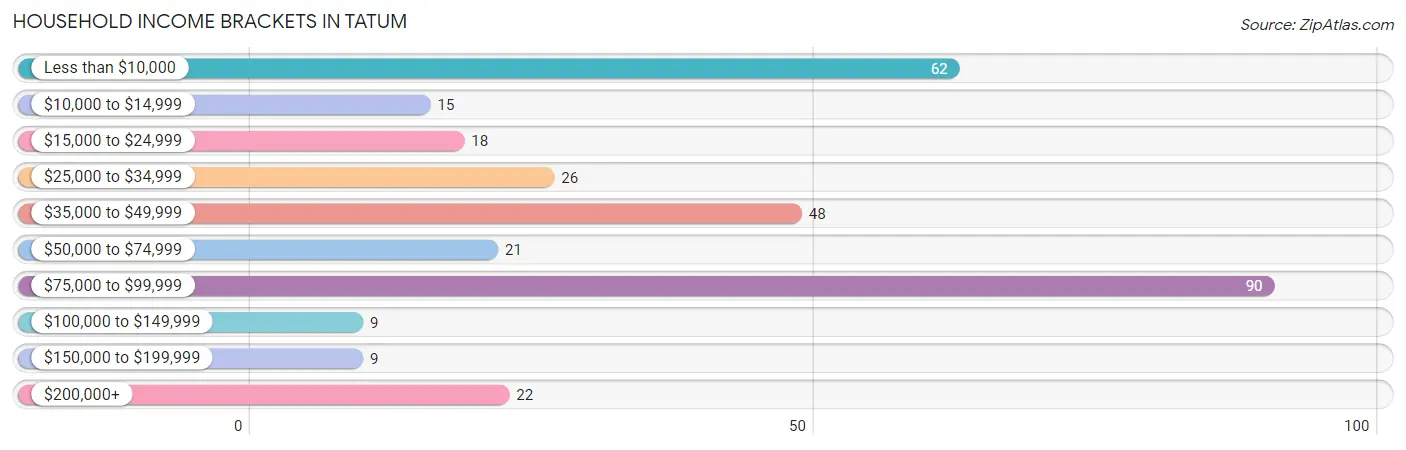
| Income Bracket | # Households | % Households |
| Less than $10,000 | 62 | 19.4% |
| $10,000 to $14,999 | 15 | 4.7% |
| $15,000 to $24,999 | 18 | 5.6% |
| $25,000 to $34,999 | 26 | 8.1% |
| $35,000 to $49,999 | 48 | 15.0% |
| $50,000 to $74,999 | 21 | 6.6% |
| $75,000 to $99,999 | 90 | 28.1% |
| $100,000 to $149,999 | 9 | 2.8% |
| $150,000 to $199,999 | 9 | 2.8% |
| $200,000+ | 22 | 6.9% |
Household Income by Householder Age in Tatum
The median household income in Tatum is $46,477, with the highest median household income of $52,361 found in the 45 to 64 years age bracket for the primary householder. A total of 69 households (21.6%) fall into this category.
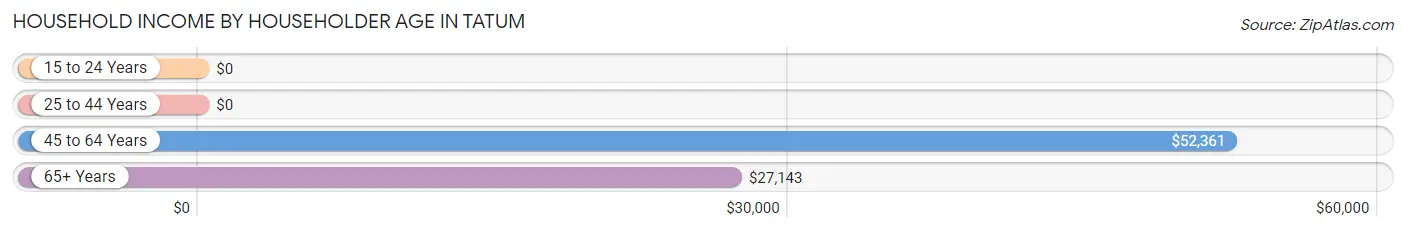
| Income Bracket | # Households | Median Income |
| 15 to 24 Years | 0 (0.0%) | $0 |
| 25 to 44 Years | 177 (55.3%) | $0 |
| 45 to 64 Years | 69 (21.6%) | $52,361 |
| 65+ Years | 74 (23.1%) | $27,143 |
| Total | 320 (100.0%) | $46,477 |
Poverty in Tatum
Income Below Poverty by Sex and Age in Tatum
With 12.9% poverty level for males and 33.8% for females among the residents of Tatum, 6 to 11 year old males and 15 year old females are the most vulnerable to poverty, with 9 males (100.0%) and 7 females (100.0%) in their respective age groups living below the poverty level.
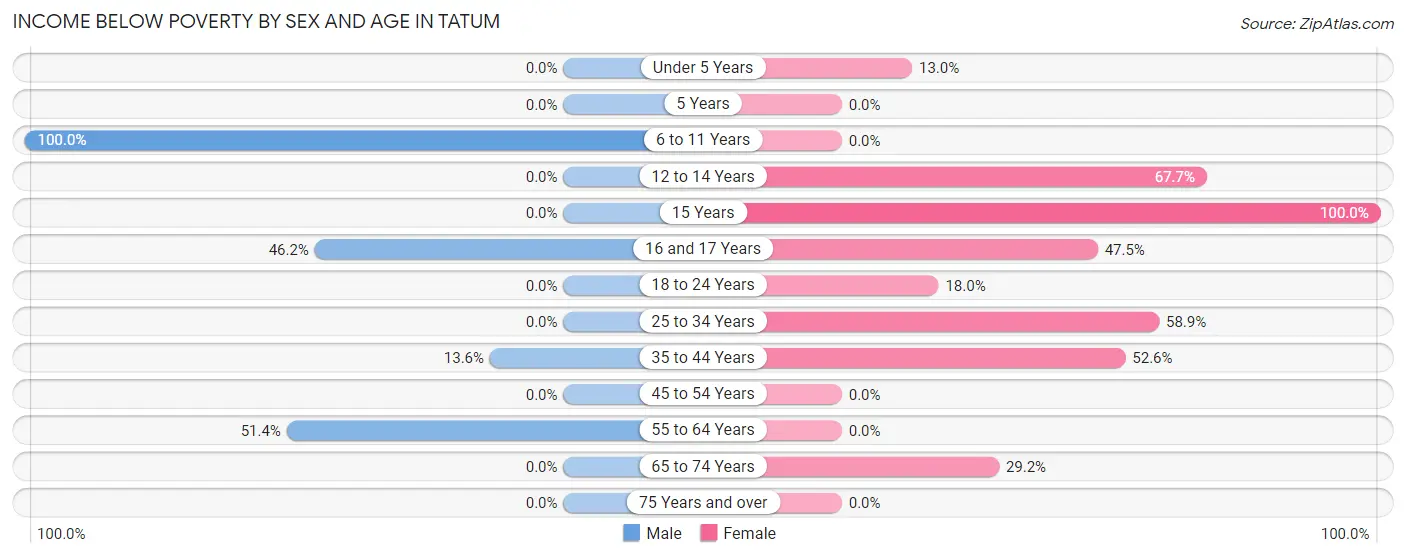
| Age Bracket | Male | Female |
| Under 5 Years | 0 (0.0%) | 3 (13.0%) |
| 5 Years | 0 (0.0%) | 0 (0.0%) |
| 6 to 11 Years | 9 (100.0%) | 0 (0.0%) |
| 12 to 14 Years | 0 (0.0%) | 21 (67.7%) |
| 15 Years | 0 (0.0%) | 7 (100.0%) |
| 16 and 17 Years | 12 (46.2%) | 19 (47.5%) |
| 18 to 24 Years | 0 (0.0%) | 7 (17.9%) |
| 25 to 34 Years | 0 (0.0%) | 53 (58.9%) |
| 35 to 44 Years | 9 (13.6%) | 20 (52.6%) |
| 45 to 54 Years | 0 (0.0%) | 0 (0.0%) |
| 55 to 64 Years | 19 (51.3%) | 0 (0.0%) |
| 65 to 74 Years | 0 (0.0%) | 7 (29.2%) |
| 75 Years and over | 0 (0.0%) | 0 (0.0%) |
| Total | 49 (12.9%) | 137 (33.8%) |
Income Above Poverty by Sex and Age in Tatum
According to the poverty statistics in Tatum, males aged under 5 years and females aged 6 to 11 years are the age groups that are most secure financially, with 100.0% of males and 100.0% of females in these age groups living above the poverty line.
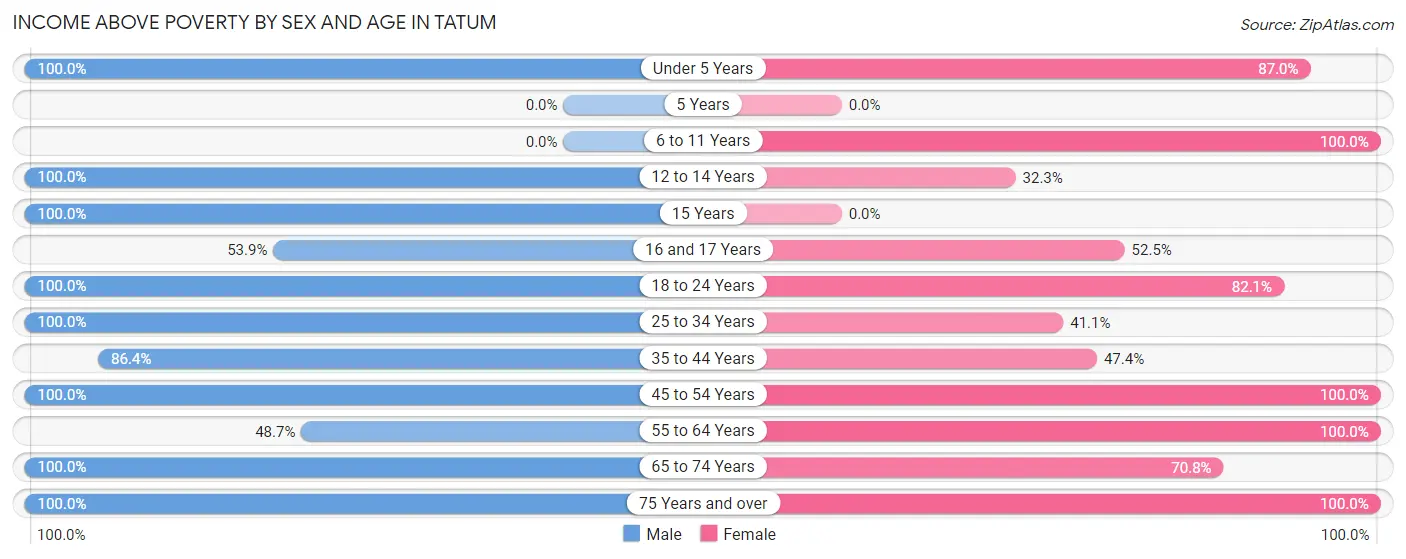
| Age Bracket | Male | Female |
| Under 5 Years | 26 (100.0%) | 20 (87.0%) |
| 5 Years | 0 (0.0%) | 0 (0.0%) |
| 6 to 11 Years | 0 (0.0%) | 28 (100.0%) |
| 12 to 14 Years | 4 (100.0%) | 10 (32.3%) |
| 15 Years | 2 (100.0%) | 0 (0.0%) |
| 16 and 17 Years | 14 (53.8%) | 21 (52.5%) |
| 18 to 24 Years | 9 (100.0%) | 32 (82.1%) |
| 25 to 34 Years | 104 (100.0%) | 37 (41.1%) |
| 35 to 44 Years | 57 (86.4%) | 18 (47.4%) |
| 45 to 54 Years | 48 (100.0%) | 36 (100.0%) |
| 55 to 64 Years | 18 (48.6%) | 15 (100.0%) |
| 65 to 74 Years | 28 (100.0%) | 17 (70.8%) |
| 75 Years and over | 22 (100.0%) | 34 (100.0%) |
| Total | 332 (87.1%) | 268 (66.2%) |
Income Below Poverty Among Married-Couple Families in Tatum
The poverty statistics for married-couple families in Tatum show that 7.4% or 9 of the total 122 families live below the poverty line. Families with 3 or 4 children have the highest poverty rate of 45.0%, comprising of 9 families. On the other hand, families with no children have the lowest poverty rate of 0.0%, which includes 0 families.
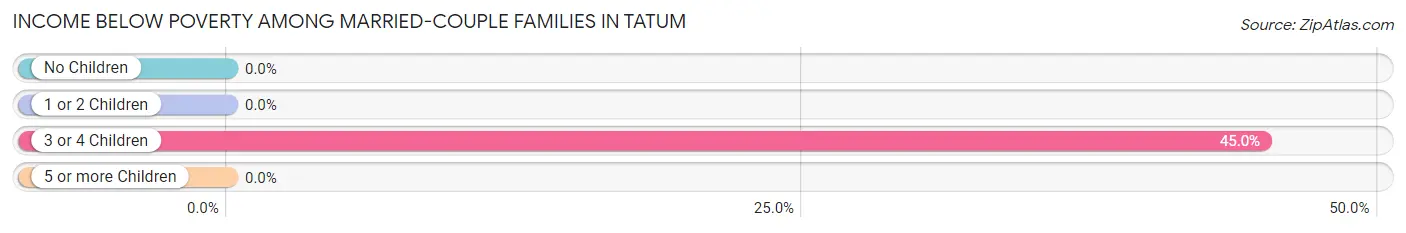
| Children | Above Poverty | Below Poverty |
| No Children | 56 (100.0%) | 0 (0.0%) |
| 1 or 2 Children | 46 (100.0%) | 0 (0.0%) |
| 3 or 4 Children | 11 (55.0%) | 9 (45.0%) |
| 5 or more Children | 0 (0.0%) | 0 (0.0%) |
| Total | 113 (92.6%) | 9 (7.4%) |
Income Below Poverty Among Single-Parent Households in Tatum
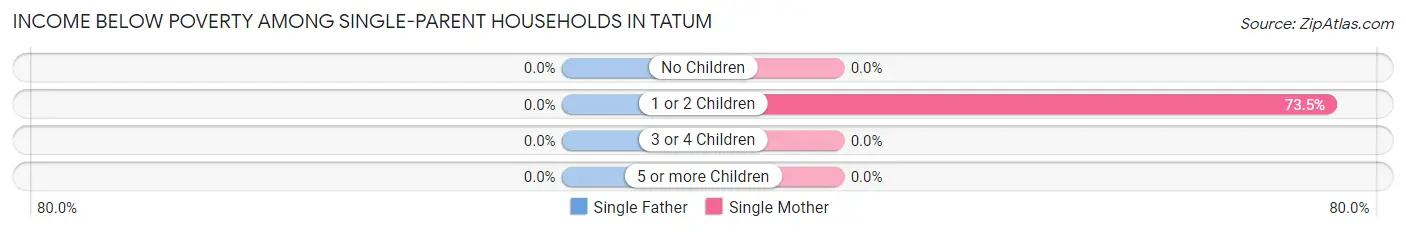
| Children | Single Father | Single Mother |
| No Children | 0 (0.0%) | 0 (0.0%) |
| 1 or 2 Children | 0 (0.0%) | 61 (73.5%) |
| 3 or 4 Children | 0 (0.0%) | 0 (0.0%) |
| 5 or more Children | 0 (0.0%) | 0 (0.0%) |
| Total | 0 (0.0%) | 61 (70.9%) |
Income Below Poverty Among Married-Couple vs Single-Parent Households in Tatum
The poverty data for Tatum shows that 9 of the married-couple family households (7.4%) and 61 of the single-parent households (65.6%) are living below the poverty level. Within the married-couple family households, those with 3 or 4 children have the highest poverty rate, with 9 households (45.0%) falling below the poverty line. Among the single-parent households, those with 1 or 2 children have the highest poverty rate, with 61 household (69.3%) living below poverty.
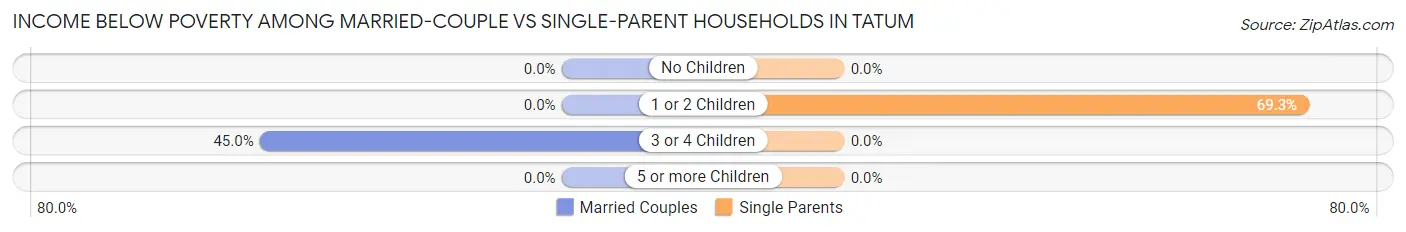
| Children | Married-Couple Families | Single-Parent Households |
| No Children | 0 (0.0%) | 0 (0.0%) |
| 1 or 2 Children | 0 (0.0%) | 61 (69.3%) |
| 3 or 4 Children | 9 (45.0%) | 0 (0.0%) |
| 5 or more Children | 0 (0.0%) | 0 (0.0%) |
| Total | 9 (7.4%) | 61 (65.6%) |
Race in Tatum
The most populous races in Tatum are White / Caucasian (443 | 55.8%), Hispanic or Latino (435 | 54.8%), and Two or more Races (231 | 29.1%).
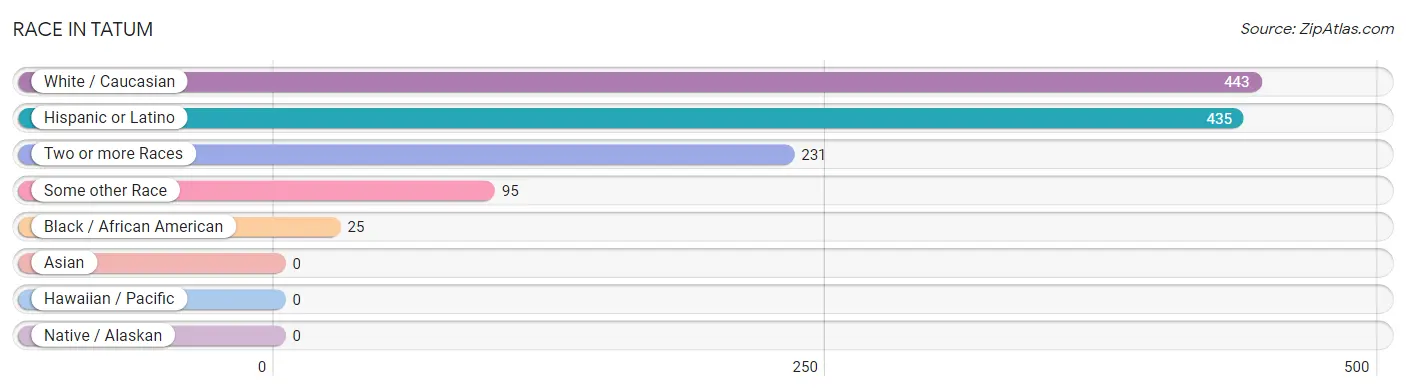
| Race | # Population | % Population |
| Asian | 0 | 0.0% |
| Black / African American | 25 | 3.2% |
| Hawaiian / Pacific | 0 | 0.0% |
| Hispanic or Latino | 435 | 54.8% |
| Native / Alaskan | 0 | 0.0% |
| White / Caucasian | 443 | 55.8% |
| Two or more Races | 231 | 29.1% |
| Some other Race | 95 | 12.0% |
| Total | 794 | 100.0% |
Ancestry in Tatum
The most populous ancestries reported in Tatum are Mexican (419 | 52.8%), Irish (96 | 12.1%), European (68 | 8.6%), English (59 | 7.4%), and German (47 | 5.9%), together accounting for 86.8% of all Tatum residents.
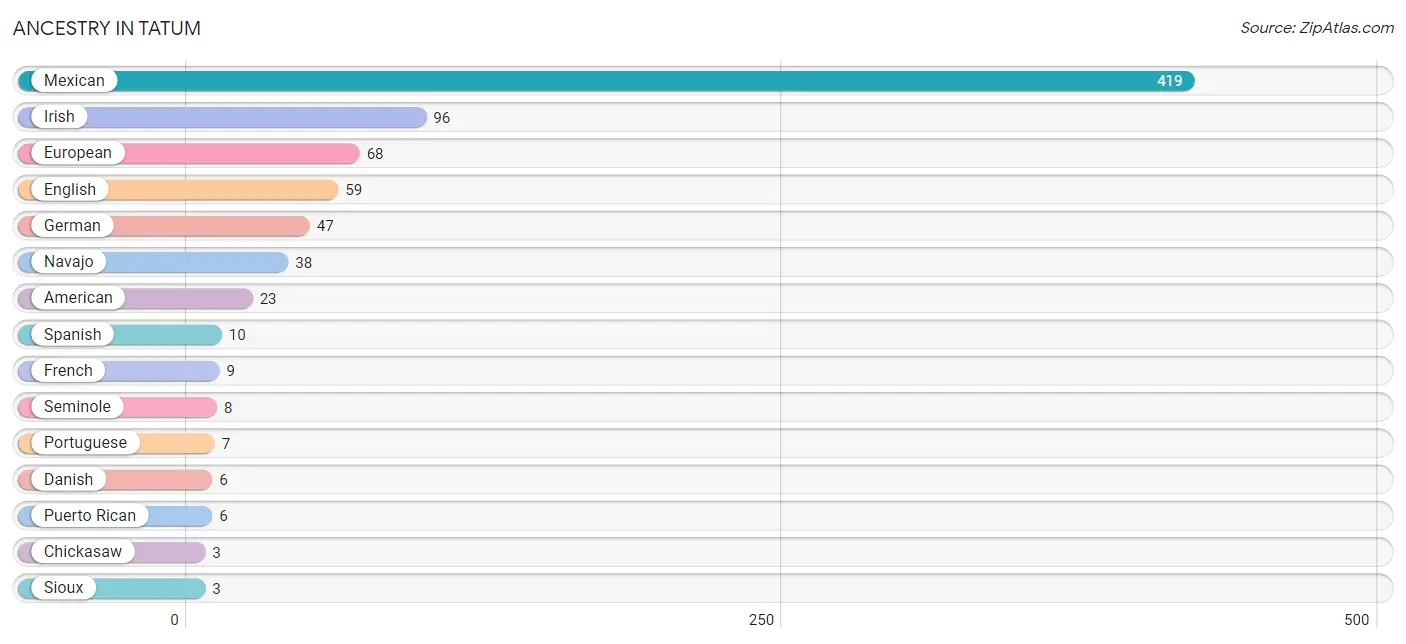
| Ancestry | # Population | % Population |
| American | 23 | 2.9% |
| Chickasaw | 3 | 0.4% |
| Danish | 6 | 0.8% |
| English | 59 | 7.4% |
| European | 68 | 8.6% |
| French | 9 | 1.1% |
| German | 47 | 5.9% |
| Irish | 96 | 12.1% |
| Mexican | 419 | 52.8% |
| Navajo | 38 | 4.8% |
| Portuguese | 7 | 0.9% |
| Puerto Rican | 6 | 0.8% |
| Seminole | 8 | 1.0% |
| Sioux | 3 | 0.4% |
| Spanish | 10 | 1.3% | View All 15 Rows |
Immigrants in Tatum
The most numerous immigrant groups reported in Tatum came from Central America (99 | 12.5%), Latin America (99 | 12.5%), and Mexico (99 | 12.5%), together accounting for 37.4% of all Tatum residents.
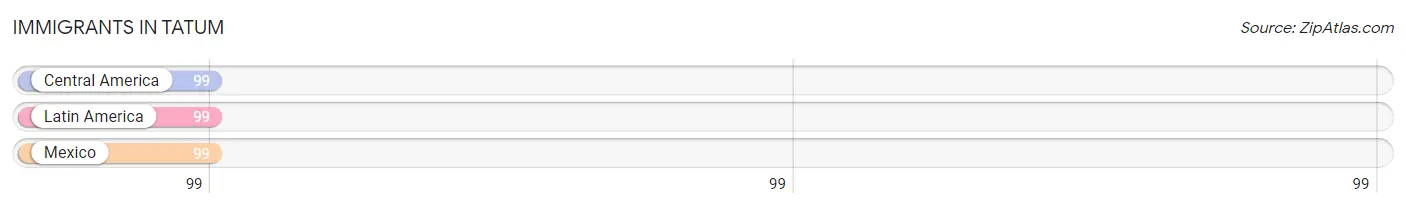
| Immigration Origin | # Population | % Population |
| Central America | 99 | 12.5% |
| Latin America | 99 | 12.5% |
| Mexico | 99 | 12.5% | View All 3 Rows |
Sex and Age in Tatum
Sex and Age in Tatum
The most populous age groups in Tatum are 30 to 34 Years (74 | 19.0%) for men and 30 to 34 Years (56 | 13.8%) for women.
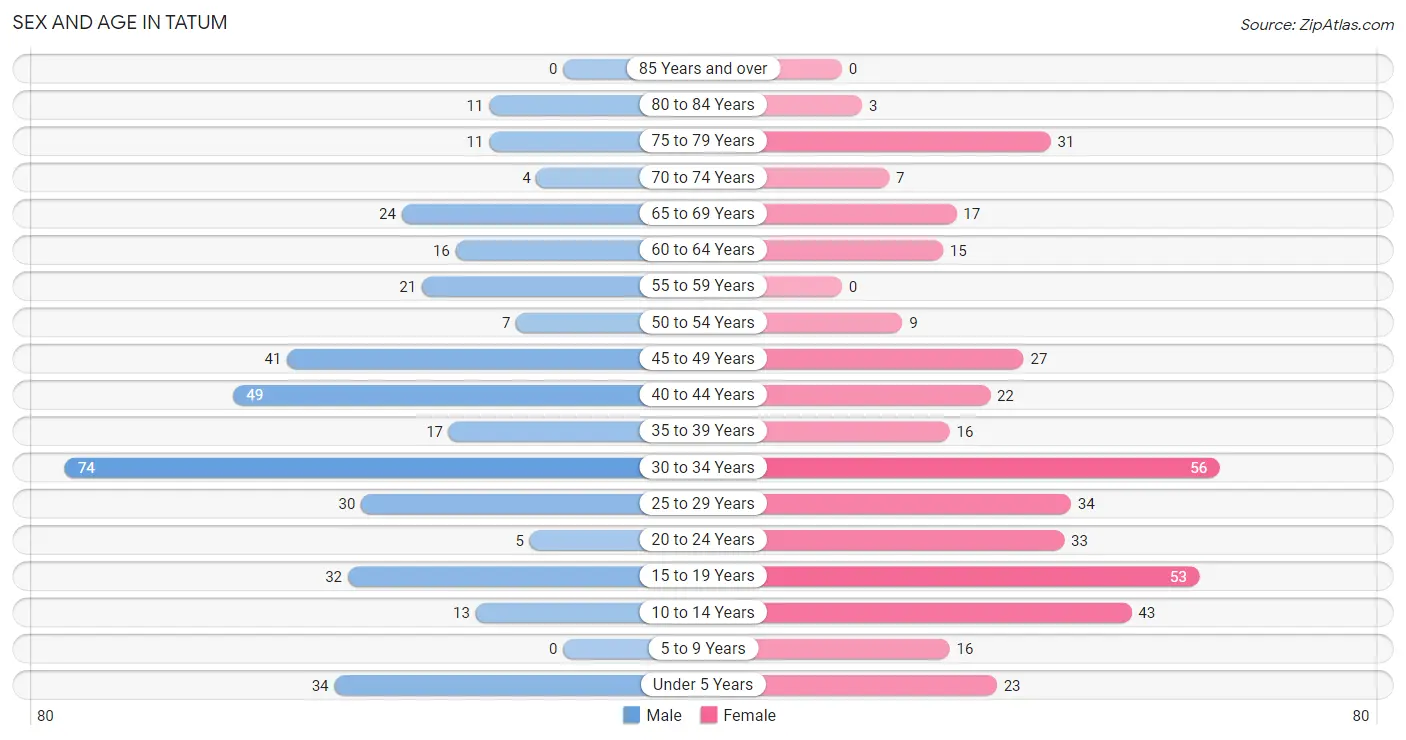
| Age Bracket | Male | Female |
| Under 5 Years | 34 (8.7%) | 23 (5.7%) |
| 5 to 9 Years | 0 (0.0%) | 16 (4.0%) |
| 10 to 14 Years | 13 (3.3%) | 43 (10.6%) |
| 15 to 19 Years | 32 (8.2%) | 53 (13.1%) |
| 20 to 24 Years | 5 (1.3%) | 33 (8.2%) |
| 25 to 29 Years | 30 (7.7%) | 34 (8.4%) |
| 30 to 34 Years | 74 (19.0%) | 56 (13.8%) |
| 35 to 39 Years | 17 (4.4%) | 16 (4.0%) |
| 40 to 44 Years | 49 (12.6%) | 22 (5.4%) |
| 45 to 49 Years | 41 (10.5%) | 27 (6.7%) |
| 50 to 54 Years | 7 (1.8%) | 9 (2.2%) |
| 55 to 59 Years | 21 (5.4%) | 0 (0.0%) |
| 60 to 64 Years | 16 (4.1%) | 15 (3.7%) |
| 65 to 69 Years | 24 (6.2%) | 17 (4.2%) |
| 70 to 74 Years | 4 (1.0%) | 7 (1.7%) |
| 75 to 79 Years | 11 (2.8%) | 31 (7.6%) |
| 80 to 84 Years | 11 (2.8%) | 3 (0.7%) |
| 85 Years and over | 0 (0.0%) | 0 (0.0%) |
| Total | 389 (100.0%) | 405 (100.0%) |
Families and Households in Tatum
Median Family Size in Tatum
The median family size in Tatum is 2.66 persons per family, with married-couple families (122 | 56.7%) accounting for the largest median family size of 3.48 persons per family. On the other hand, single female/mother families (86 | 40.0%) represent the smallest median family size with 1.49 persons per family.
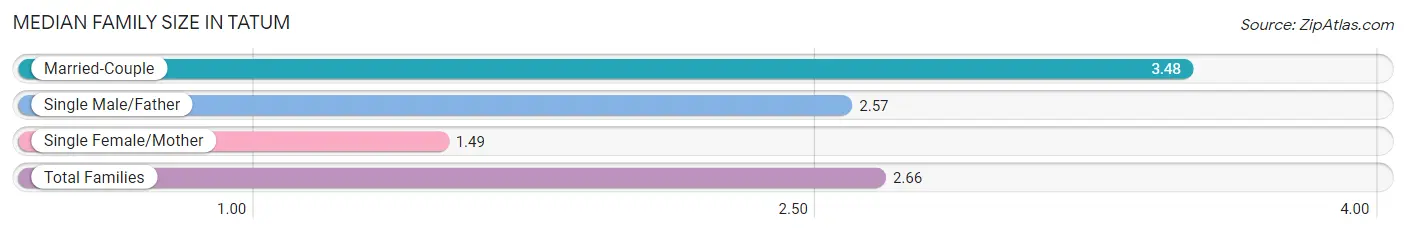
| Family Type | # Families | Family Size |
| Married-Couple | 122 (56.7%) | 3.48 |
| Single Male/Father | 7 (3.3%) | 2.57 |
| Single Female/Mother | 86 (40.0%) | 1.49 |
| Total Families | 215 (100.0%) | 2.66 |
Median Household Size in Tatum
The median household size in Tatum is 2.48 persons per household, with single male/father households (7 | 2.2%) accounting for the largest median household size of 3.57 persons per household. non-family households (105 | 32.8%) represent the smallest median household size with 1.18 persons per household.
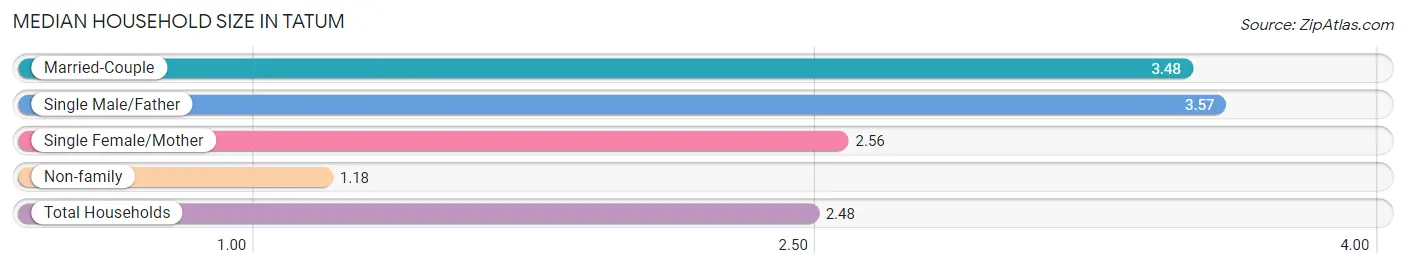
| Household Type | # Households | Household Size |
| Married-Couple | 122 (38.1%) | 3.48 |
| Single Male/Father | 7 (2.2%) | 3.57 |
| Single Female/Mother | 86 (26.9%) | 2.56 |
| Non-family | 105 (32.8%) | 1.18 |
| Total Households | 320 (100.0%) | 2.48 |
Household Size by Marriage Status in Tatum
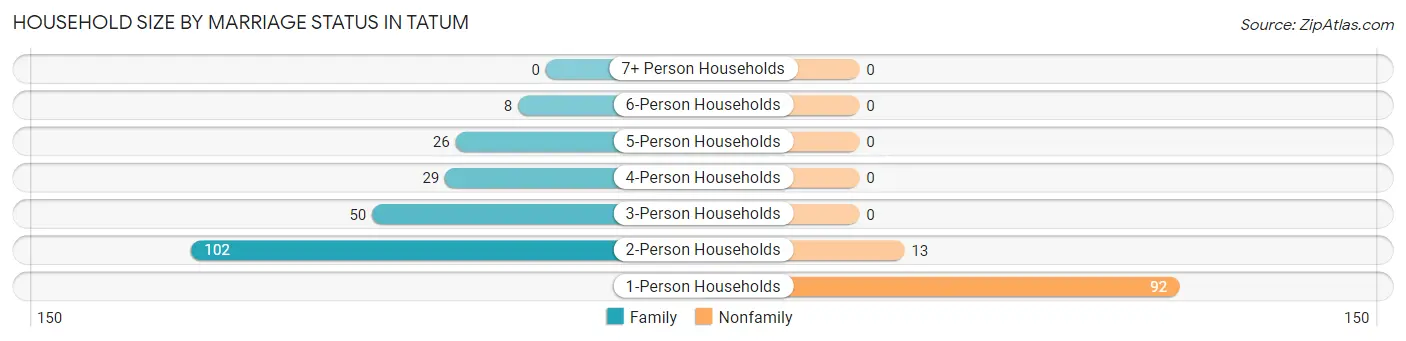
Out of a total of 320 households in Tatum, 215 (67.2%) are family households, while 105 (32.8%) are nonfamily households. The most numerous type of family households are 2-person households, comprising 102, and the most common type of nonfamily households are 1-person households, comprising 92.
| Household Size | Family Households | Nonfamily Households |
| 1-Person Households | - | 92 (28.7%) |
| 2-Person Households | 102 (31.9%) | 13 (4.1%) |
| 3-Person Households | 50 (15.6%) | 0 (0.0%) |
| 4-Person Households | 29 (9.1%) | 0 (0.0%) |
| 5-Person Households | 26 (8.1%) | 0 (0.0%) |
| 6-Person Households | 8 (2.5%) | 0 (0.0%) |
| 7+ Person Households | 0 (0.0%) | 0 (0.0%) |
| Total | 215 (67.2%) | 105 (32.8%) |
Female Fertility in Tatum
Fertility by Age in Tatum
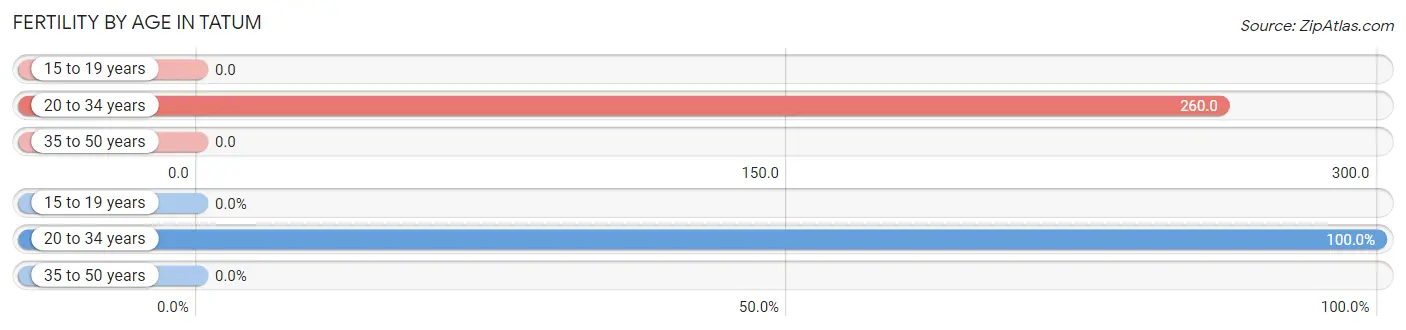
Average fertility rate in Tatum is 133.0 births per 1,000 women. Women in the age bracket of 20 to 34 years have the highest fertility rate with 260.0 births per 1,000 women. Women in the age bracket of 20 to 34 years acount for 100.0% of all women with births.
| Age Bracket | Women with Births | Births / 1,000 Women |
| 15 to 19 years | 0 (0.0%) | 0.0 |
| 20 to 34 years | 32 (100.0%) | 260.0 |
| 35 to 50 years | 0 (0.0%) | 0.0 |
| Total | 32 (100.0%) | 133.0 |
Fertility by Age by Marriage Status in Tatum
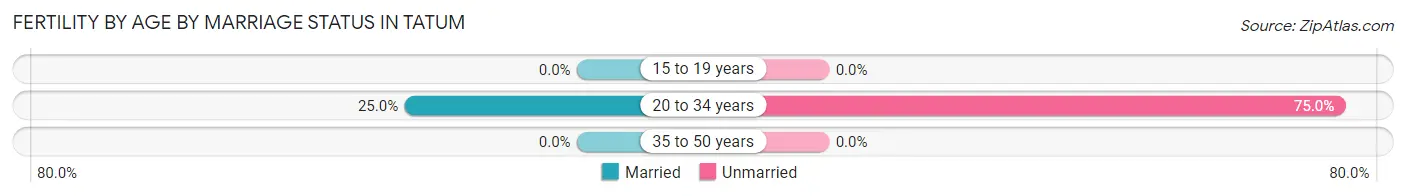
25.0% of women with births (32) in Tatum are married. The highest percentage of unmarried women with births falls into 20 to 34 years age bracket with 75.0% of them unmarried at the time of birth, while the lowest percentage of unmarried women with births belong to 20 to 34 years age bracket with 75.0% of them unmarried.
| Age Bracket | Married | Unmarried |
| 15 to 19 years | 0 (0.0%) | 0 (0.0%) |
| 20 to 34 years | 8 (25.0%) | 24 (75.0%) |
| 35 to 50 years | 0 (0.0%) | 0 (0.0%) |
| Total | 8 (25.0%) | 24 (75.0%) |
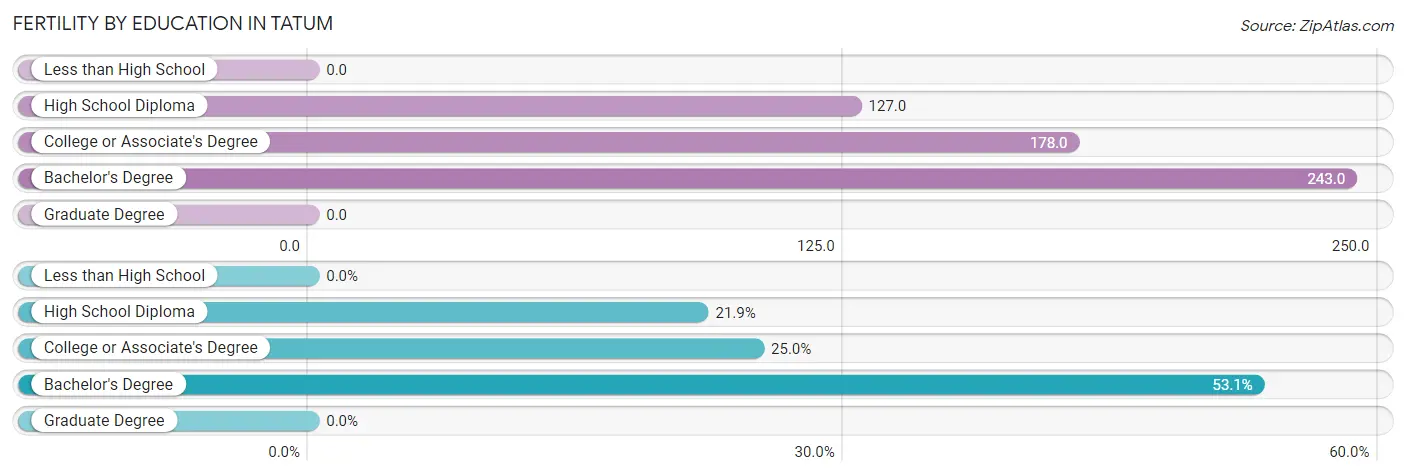
Fertility by Education in Tatum
| Educational Attainment | Women with Births | Births / 1,000 Women |
| Less than High School | 0 (0.0%) | 0.0 |
| High School Diploma | 7 (21.9%) | 127.0 |
| College or Associate's Degree | 8 (25.0%) | 178.0 |
| Bachelor's Degree | 17 (53.1%) | 243.0 |
| Graduate Degree | 0 (0.0%) | 0.0 |
| Total | 32 (100.0%) | 133.0 |
Fertility by Education by Marriage Status in Tatum
75.0% of women with births in Tatum are unmarried. Women with the educational attainment of college or associate's degree are most likely to be married with 100.0% of them married at childbirth, while women with the educational attainment of high school diploma are least likely to be married with 100.0% of them unmarried at childbirth.
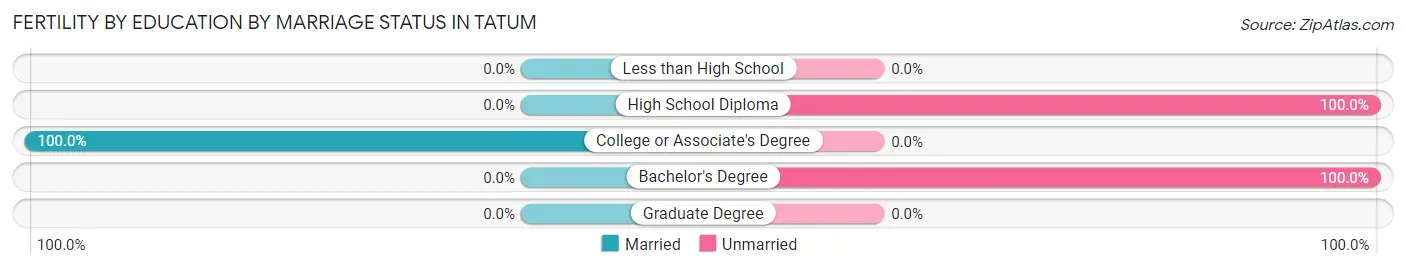
| Educational Attainment | Married | Unmarried |
| Less than High School | 0 (0.0%) | 0 (0.0%) |
| High School Diploma | 0 (0.0%) | 7 (100.0%) |
| College or Associate's Degree | 8 (100.0%) | 0 (0.0%) |
| Bachelor's Degree | 0 (0.0%) | 17 (100.0%) |
| Graduate Degree | 0 (0.0%) | 0 (0.0%) |
| Total | 8 (25.0%) | 24 (75.0%) |
Employment Characteristics in Tatum
Employment by Class of Employer in Tatum
Among the 389 employed individuals in Tatum, private company employees (296 | 76.1%), not-for-profit organizations (27 | 6.9%), and state government employees (24 | 6.2%) make up the most common classes of employment.
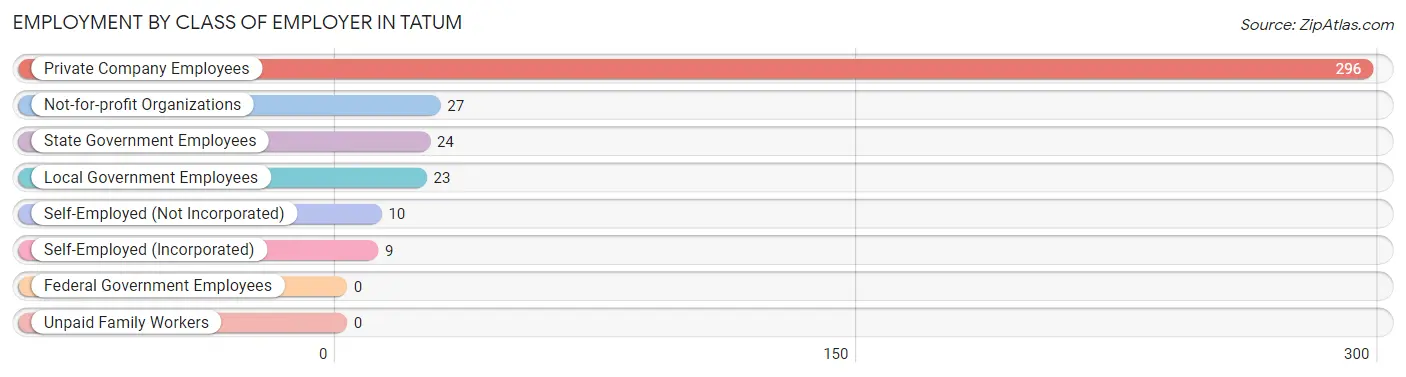
| Employer Class | # Employees | % Employees |
| Private Company Employees | 296 | 76.1% |
| Self-Employed (Incorporated) | 9 | 2.3% |
| Self-Employed (Not Incorporated) | 10 | 2.6% |
| Not-for-profit Organizations | 27 | 6.9% |
| Local Government Employees | 23 | 5.9% |
| State Government Employees | 24 | 6.2% |
| Federal Government Employees | 0 | 0.0% |
| Unpaid Family Workers | 0 | 0.0% |
| Total | 389 | 100.0% |
Employment Status by Age in Tatum
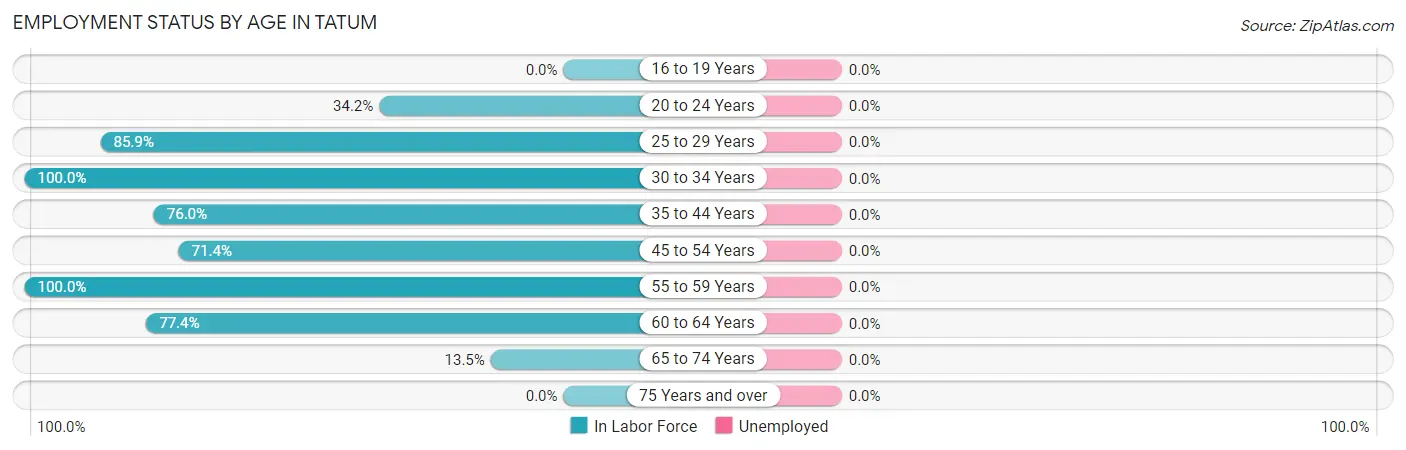
| Age Bracket | In Labor Force | Unemployed |
| 16 to 19 Years | 0 (0.0%) | 0 (0.0%) |
| 20 to 24 Years | 13 (34.2%) | 0 (0.0%) |
| 25 to 29 Years | 55 (85.9%) | 0 (0.0%) |
| 30 to 34 Years | 130 (100.0%) | 0 (0.0%) |
| 35 to 44 Years | 79 (76.0%) | 0 (0.0%) |
| 45 to 54 Years | 60 (71.4%) | 0 (0.0%) |
| 55 to 59 Years | 21 (100.0%) | 0 (0.0%) |
| 60 to 64 Years | 24 (77.4%) | 0 (0.0%) |
| 65 to 74 Years | 7 (13.5%) | 0 (0.0%) |
| 75 Years and over | 0 (0.0%) | 0 (0.0%) |
| Total | 389 (59.3%) | 0 (0.0%) |
Employment Status by Educational Attainment in Tatum
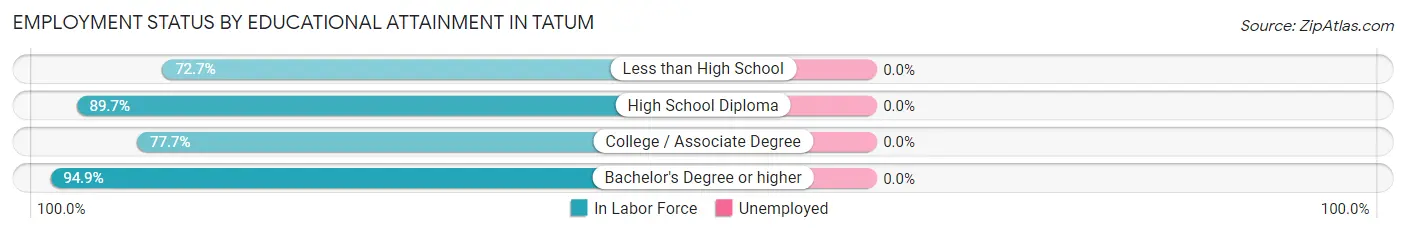
| Educational Attainment | In Labor Force | Unemployed |
| Less than High School | 56 (72.7%) | 0 (0.0%) |
| High School Diploma | 166 (89.7%) | 0 (0.0%) |
| College / Associate Degree | 73 (77.7%) | 0 (0.0%) |
| Bachelor's Degree or higher | 74 (94.9%) | 0 (0.0%) |
| Total | 369 (85.0%) | 0 (0.0%) |
Employment Occupations by Sex in Tatum
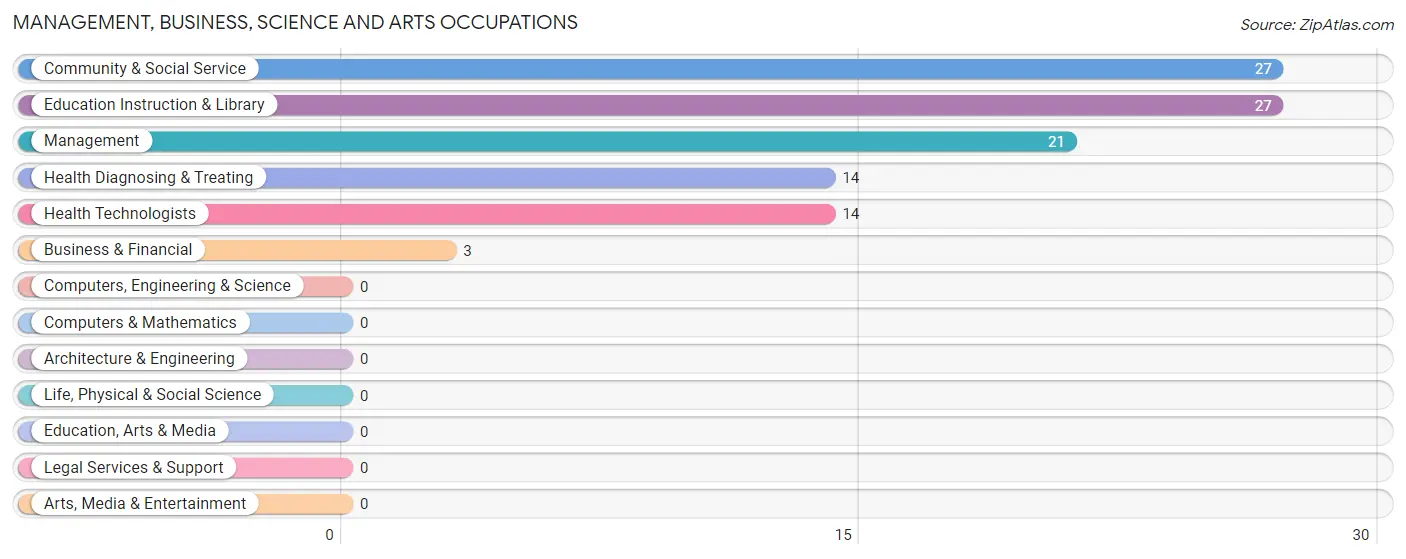
Management, Business, Science and Arts Occupations
The most common Management, Business, Science and Arts occupations in Tatum are Community & Social Service (27 | 6.9%), Education Instruction & Library (27 | 6.9%), Management (21 | 5.4%), Health Diagnosing & Treating (14 | 3.6%), and Health Technologists (14 | 3.6%).
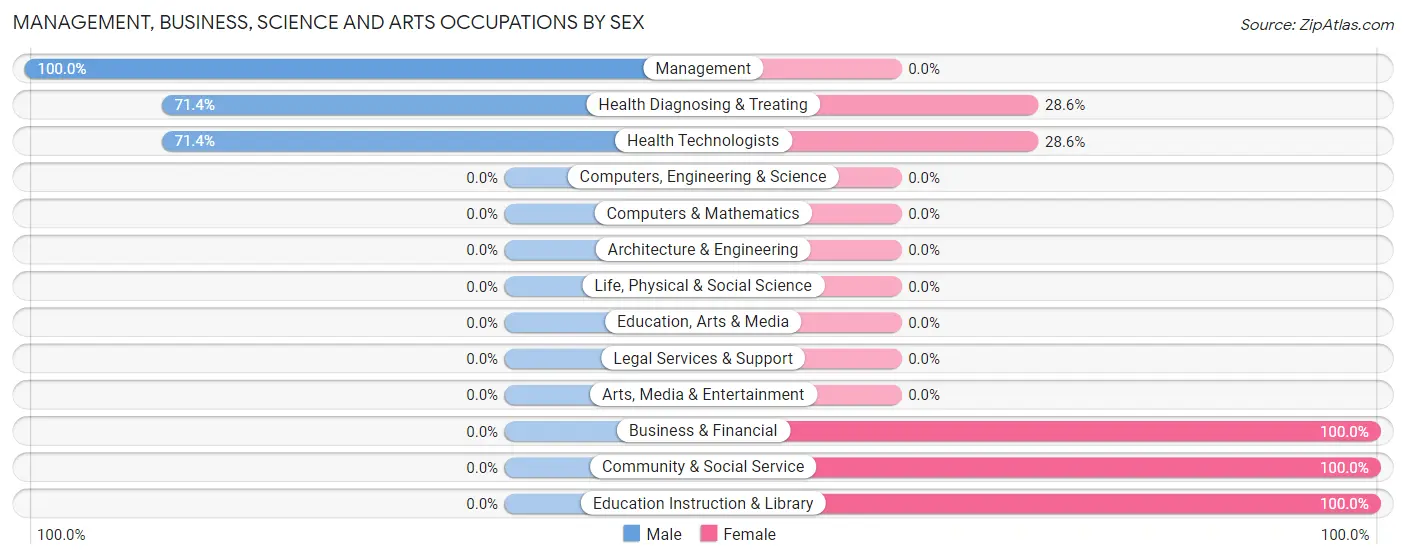
Management, Business, Science and Arts Occupations by Sex
Within the Management, Business, Science and Arts occupations in Tatum, the most male-oriented occupations are Management (100.0%), Health Diagnosing & Treating (71.4%), and Health Technologists (71.4%), while the most female-oriented occupations are Business & Financial (100.0%), Community & Social Service (100.0%), and Education Instruction & Library (100.0%).
| Occupation | Male | Female |
| Management | 21 (100.0%) | 0 (0.0%) |
| Business & Financial | 0 (0.0%) | 3 (100.0%) |
| Computers, Engineering & Science | 0 (0.0%) | 0 (0.0%) |
| Computers & Mathematics | 0 (0.0%) | 0 (0.0%) |
| Architecture & Engineering | 0 (0.0%) | 0 (0.0%) |
| Life, Physical & Social Science | 0 (0.0%) | 0 (0.0%) |
| Community & Social Service | 0 (0.0%) | 27 (100.0%) |
| Education, Arts & Media | 0 (0.0%) | 0 (0.0%) |
| Legal Services & Support | 0 (0.0%) | 0 (0.0%) |
| Education Instruction & Library | 0 (0.0%) | 27 (100.0%) |
| Arts, Media & Entertainment | 0 (0.0%) | 0 (0.0%) |
| Health Diagnosing & Treating | 10 (71.4%) | 4 (28.6%) |
| Health Technologists | 10 (71.4%) | 4 (28.6%) |
| Total (Category) | 31 (47.7%) | 34 (52.3%) |
| Total (Overall) | 249 (64.0%) | 140 (36.0%) |
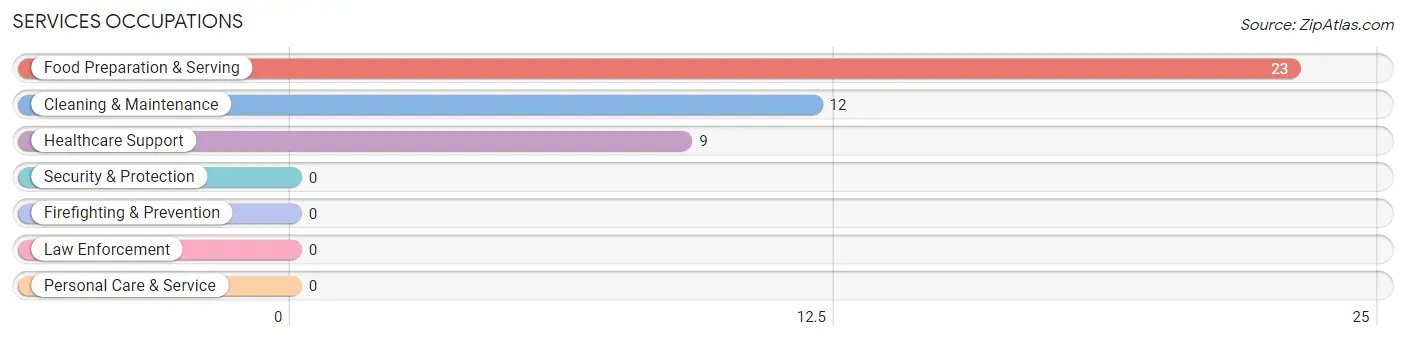
Services Occupations
The most common Services occupations in Tatum are Food Preparation & Serving (23 | 5.9%), Cleaning & Maintenance (12 | 3.1%), and Healthcare Support (9 | 2.3%).
Services Occupations by Sex
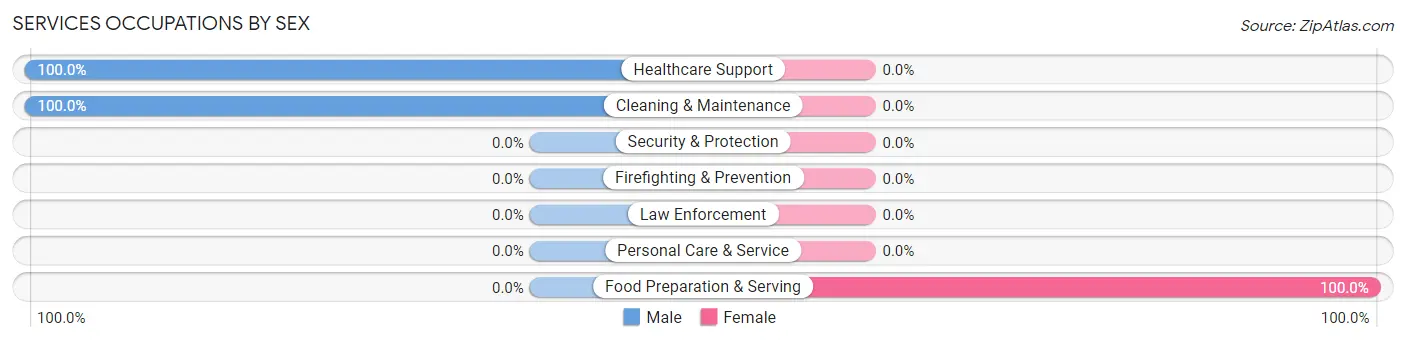
| Occupation | Male | Female |
| Healthcare Support | 9 (100.0%) | 0 (0.0%) |
| Security & Protection | 0 (0.0%) | 0 (0.0%) |
| Firefighting & Prevention | 0 (0.0%) | 0 (0.0%) |
| Law Enforcement | 0 (0.0%) | 0 (0.0%) |
| Food Preparation & Serving | 0 (0.0%) | 23 (100.0%) |
| Cleaning & Maintenance | 12 (100.0%) | 0 (0.0%) |
| Personal Care & Service | 0 (0.0%) | 0 (0.0%) |
| Total (Category) | 21 (47.7%) | 23 (52.3%) |
| Total (Overall) | 249 (64.0%) | 140 (36.0%) |
Sales and Office Occupations
The most common Sales and Office occupations in Tatum are Office & Administration (84 | 21.6%), and Sales & Related (10 | 2.6%).
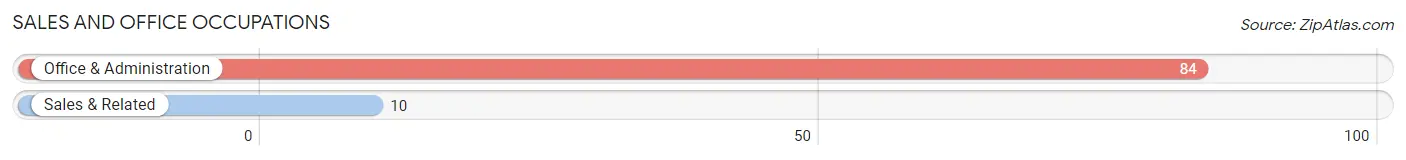
Sales and Office Occupations by Sex
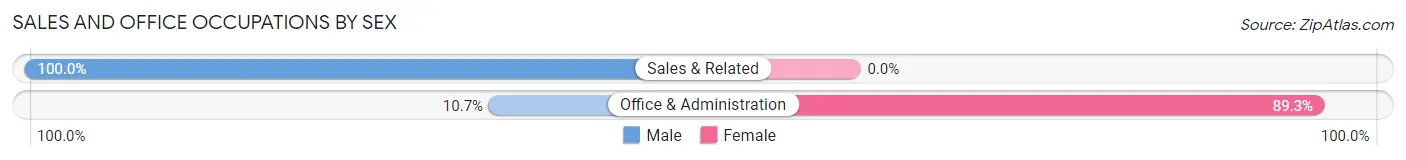
| Occupation | Male | Female |
| Sales & Related | 10 (100.0%) | 0 (0.0%) |
| Office & Administration | 9 (10.7%) | 75 (89.3%) |
| Total (Category) | 19 (20.2%) | 75 (79.8%) |
| Total (Overall) | 249 (64.0%) | 140 (36.0%) |
Natural Resources, Construction and Maintenance Occupations
The most common Natural Resources, Construction and Maintenance occupations in Tatum are Construction & Extraction (71 | 18.2%), and Installation, Maintenance & Repair (5 | 1.3%).
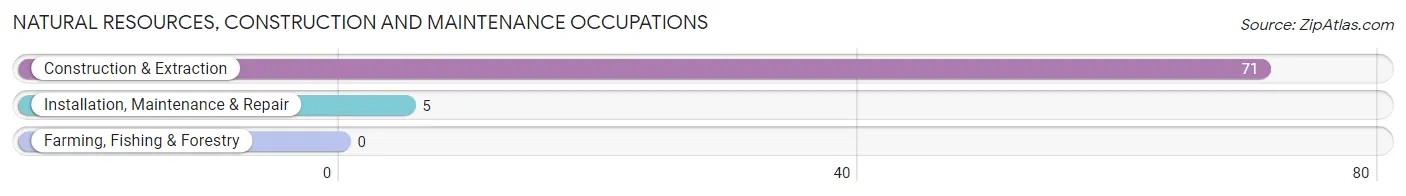
Natural Resources, Construction and Maintenance Occupations by Sex
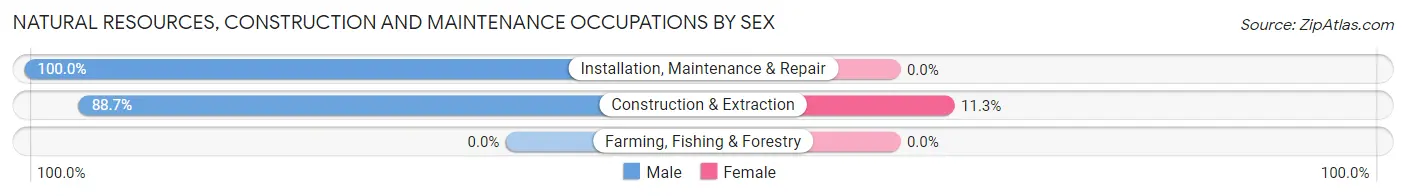
| Occupation | Male | Female |
| Farming, Fishing & Forestry | 0 (0.0%) | 0 (0.0%) |
| Construction & Extraction | 63 (88.7%) | 8 (11.3%) |
| Installation, Maintenance & Repair | 5 (100.0%) | 0 (0.0%) |
| Total (Category) | 68 (89.5%) | 8 (10.5%) |
| Total (Overall) | 249 (64.0%) | 140 (36.0%) |
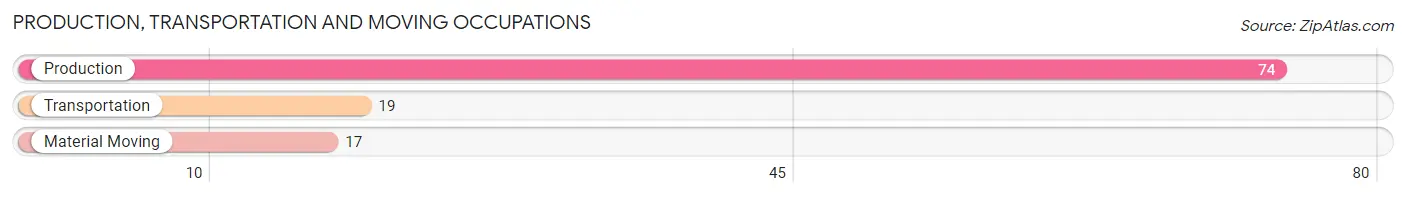
Production, Transportation and Moving Occupations
The most common Production, Transportation and Moving occupations in Tatum are Production (74 | 19.0%), Transportation (19 | 4.9%), and Material Moving (17 | 4.4%).
Production, Transportation and Moving Occupations by Sex
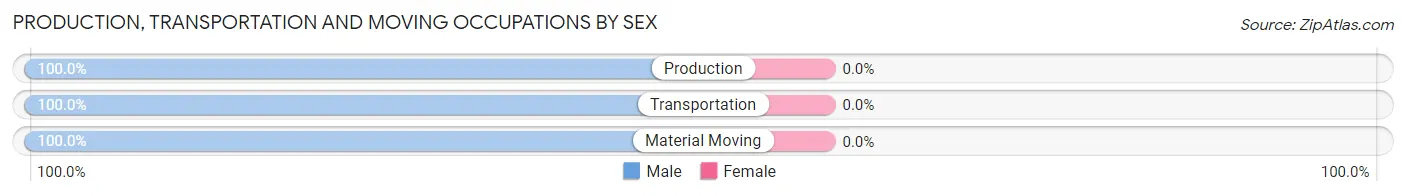
| Occupation | Male | Female |
| Production | 74 (100.0%) | 0 (0.0%) |
| Transportation | 19 (100.0%) | 0 (0.0%) |
| Material Moving | 17 (100.0%) | 0 (0.0%) |
| Total (Category) | 110 (100.0%) | 0 (0.0%) |
| Total (Overall) | 249 (64.0%) | 140 (36.0%) |
Employment Industries by Sex in Tatum
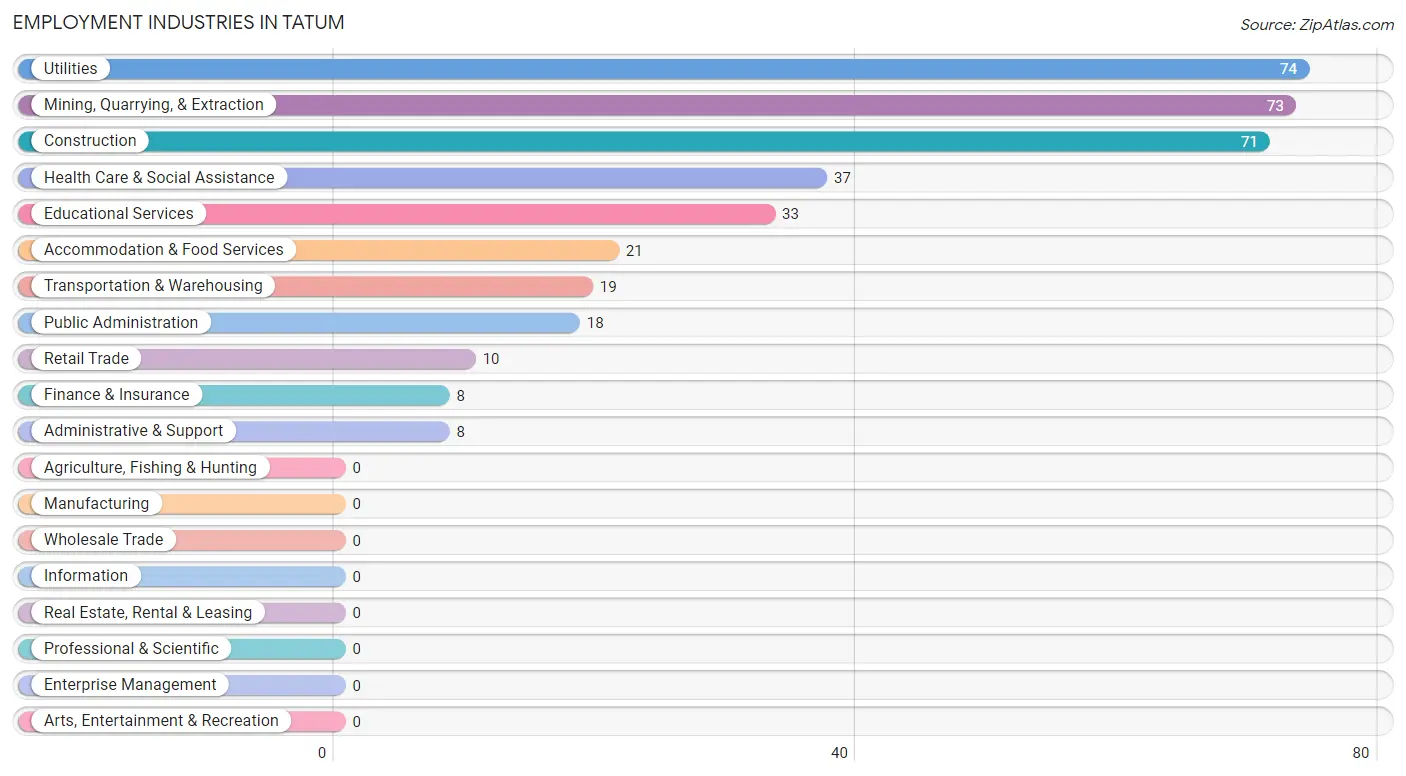
Employment Industries in Tatum
The major employment industries in Tatum include Utilities (74 | 19.0%), Mining, Quarrying, & Extraction (73 | 18.8%), Construction (71 | 18.2%), Health Care & Social Assistance (37 | 9.5%), and Educational Services (33 | 8.5%).
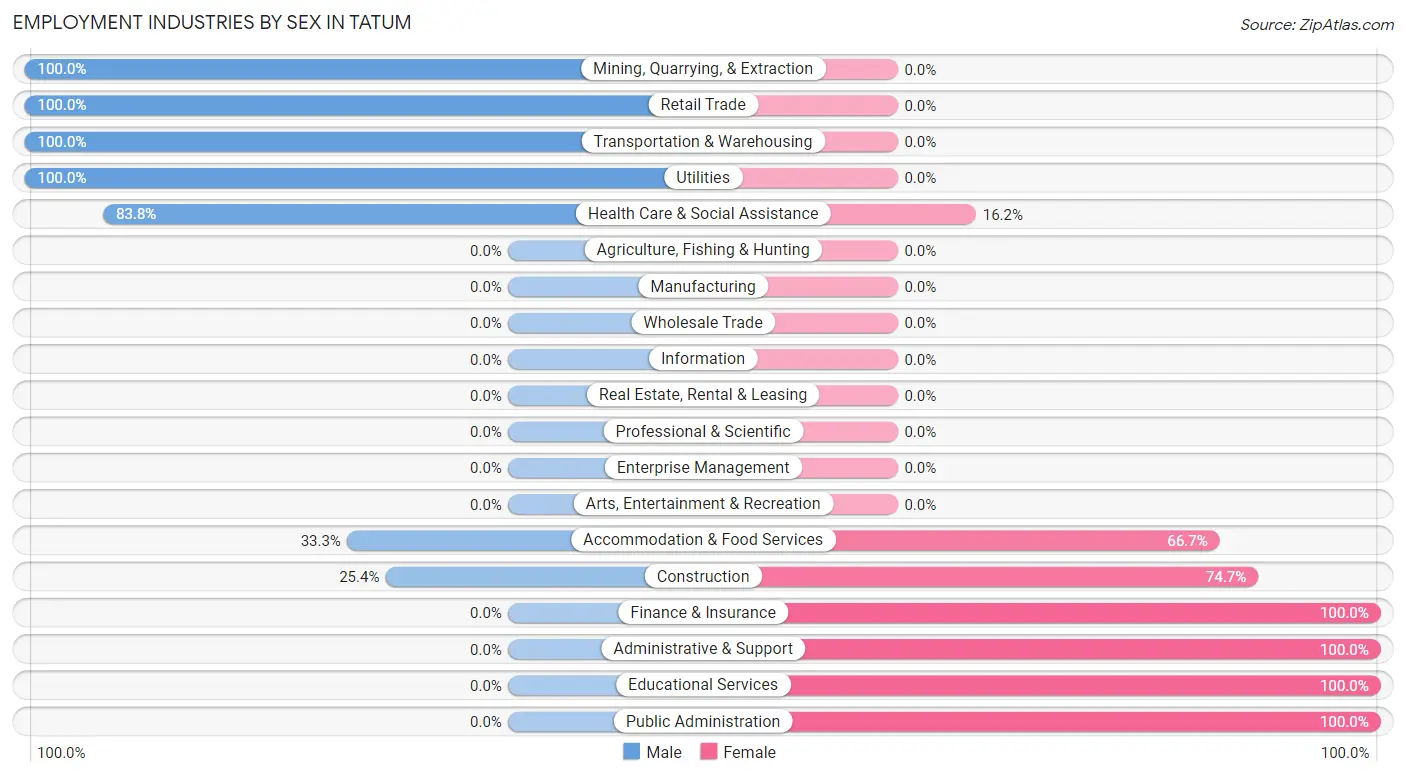
Employment Industries by Sex in Tatum
The Tatum industries that see more men than women are Mining, Quarrying, & Extraction (100.0%), Retail Trade (100.0%), and Transportation & Warehousing (100.0%), whereas the industries that tend to have a higher number of women are Finance & Insurance (100.0%), Administrative & Support (100.0%), and Educational Services (100.0%).
| Industry | Male | Female |
| Agriculture, Fishing & Hunting | 0 (0.0%) | 0 (0.0%) |
| Mining, Quarrying, & Extraction | 73 (100.0%) | 0 (0.0%) |
| Construction | 18 (25.4%) | 53 (74.7%) |
| Manufacturing | 0 (0.0%) | 0 (0.0%) |
| Wholesale Trade | 0 (0.0%) | 0 (0.0%) |
| Retail Trade | 10 (100.0%) | 0 (0.0%) |
| Transportation & Warehousing | 19 (100.0%) | 0 (0.0%) |
| Utilities | 74 (100.0%) | 0 (0.0%) |
| Information | 0 (0.0%) | 0 (0.0%) |
| Finance & Insurance | 0 (0.0%) | 8 (100.0%) |
| Real Estate, Rental & Leasing | 0 (0.0%) | 0 (0.0%) |
| Professional & Scientific | 0 (0.0%) | 0 (0.0%) |
| Enterprise Management | 0 (0.0%) | 0 (0.0%) |
| Administrative & Support | 0 (0.0%) | 8 (100.0%) |
| Educational Services | 0 (0.0%) | 33 (100.0%) |
| Health Care & Social Assistance | 31 (83.8%) | 6 (16.2%) |
| Arts, Entertainment & Recreation | 0 (0.0%) | 0 (0.0%) |
| Accommodation & Food Services | 7 (33.3%) | 14 (66.7%) |
| Public Administration | 0 (0.0%) | 18 (100.0%) |
| Total | 249 (64.0%) | 140 (36.0%) |
Education in Tatum
School Enrollment in Tatum
The most common levels of schooling among the 221 students in Tatum are high school (92 | 41.6%), college / undergraduate (47 | 21.3%), and middle school (42 | 19.0%).
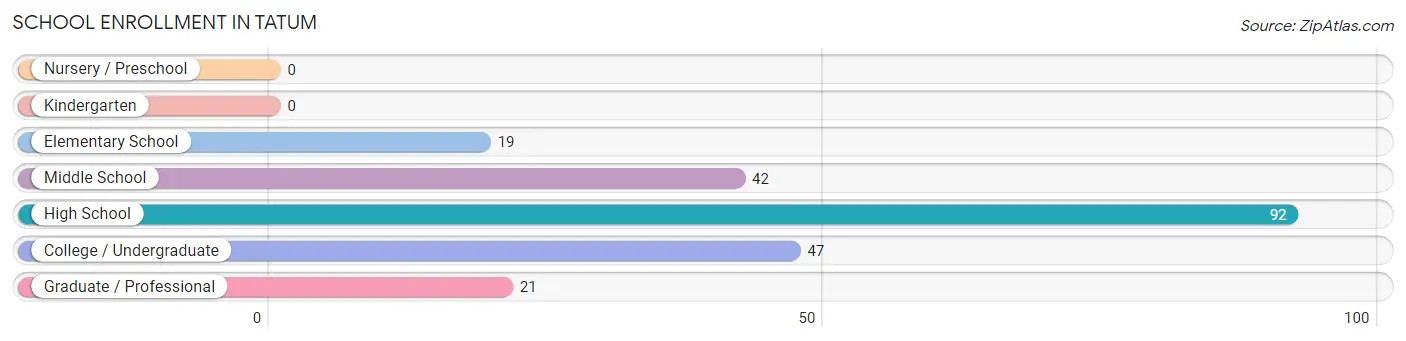
| School Level | # Students | % Students |
| Nursery / Preschool | 0 | 0.0% |
| Kindergarten | 0 | 0.0% |
| Elementary School | 19 | 8.6% |
| Middle School | 42 | 19.0% |
| High School | 92 | 41.6% |
| College / Undergraduate | 47 | 21.3% |
| Graduate / Professional | 21 | 9.5% |
| Total | 221 | 100.0% |
School Enrollment by Age by Funding Source in Tatum
Out of a total of 221 students who are enrolled in schools in Tatum, 17 (7.7%) attend a private institution, while the remaining 204 (92.3%) are enrolled in public schools. The age group of 25 to 34 year olds has the highest likelihood of being enrolled in private schools, with 17 (100.0% in the age bracket) enrolled. Conversely, the age group of 5 to 9 year old has the lowest likelihood of being enrolled in a private school, with 16 (100.0% in the age bracket) attending a public institution.
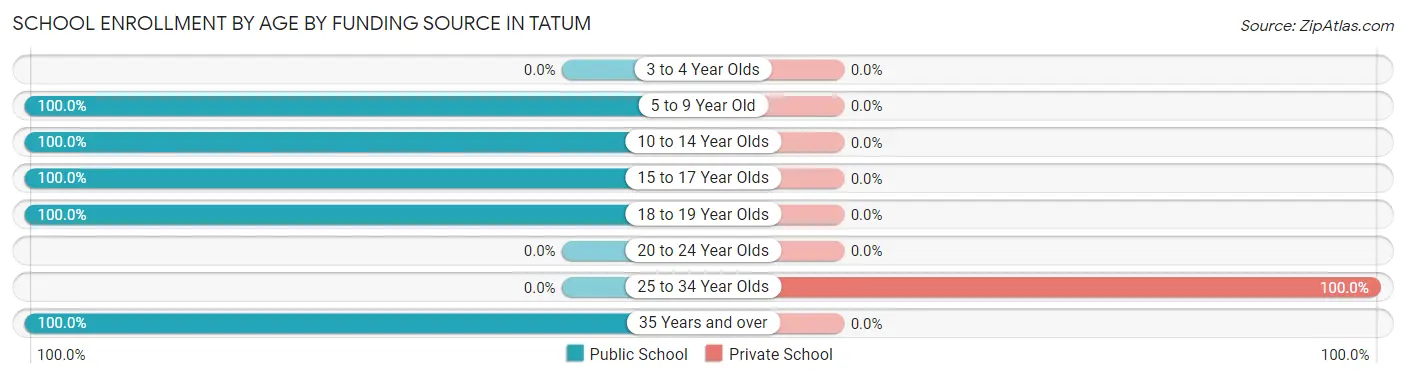
| Age Bracket | Public School | Private School |
| 3 to 4 Year Olds | 0 (0.0%) | 0 (0.0%) |
| 5 to 9 Year Old | 16 (100.0%) | 0 (0.0%) |
| 10 to 14 Year Olds | 56 (100.0%) | 0 (0.0%) |
| 15 to 17 Year Olds | 75 (100.0%) | 0 (0.0%) |
| 18 to 19 Year Olds | 10 (100.0%) | 0 (0.0%) |
| 20 to 24 Year Olds | 0 (0.0%) | 0 (0.0%) |
| 25 to 34 Year Olds | 0 (0.0%) | 17 (100.0%) |
| 35 Years and over | 47 (100.0%) | 0 (0.0%) |
| Total | 204 (92.3%) | 17 (7.7%) |
Educational Attainment by Field of Study in Tatum
Business (60 | 74.1%), psychology (17 | 21.0%), and science & technology (4 | 4.9%) are the most common fields of study among 81 individuals in Tatum who have obtained a bachelor's degree or higher.
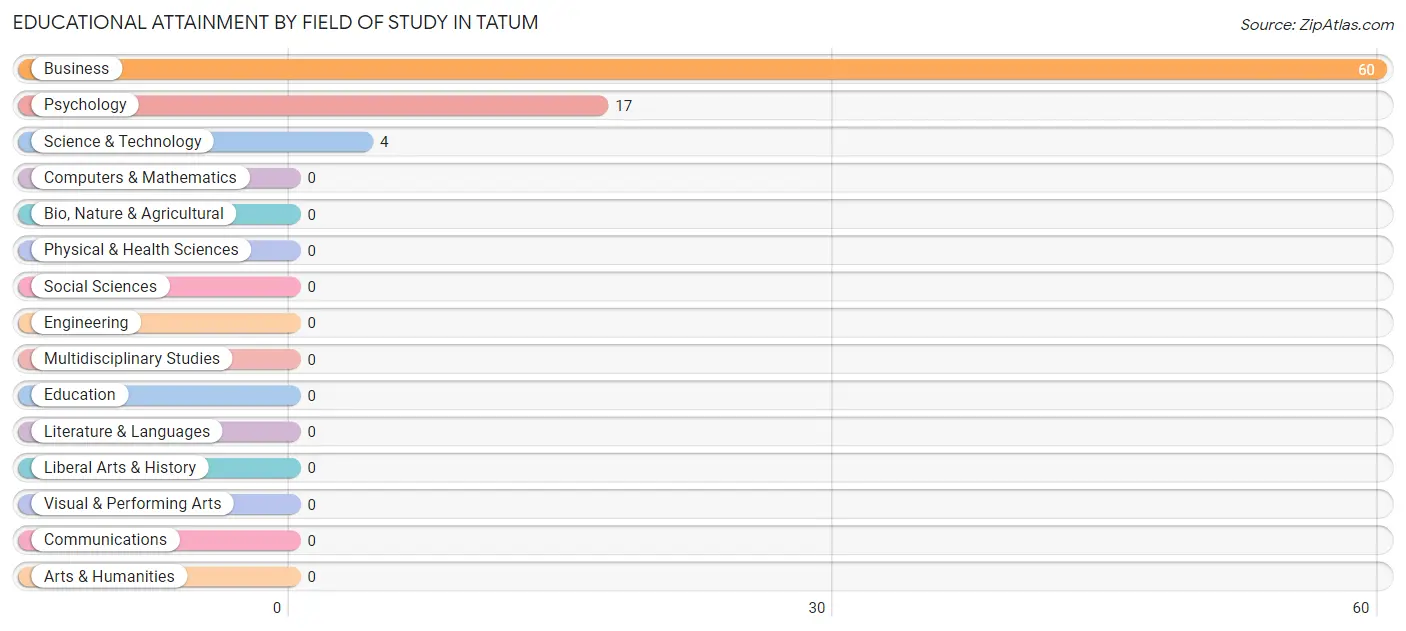
| Field of Study | # Graduates | % Graduates |
| Computers & Mathematics | 0 | 0.0% |
| Bio, Nature & Agricultural | 0 | 0.0% |
| Physical & Health Sciences | 0 | 0.0% |
| Psychology | 17 | 21.0% |
| Social Sciences | 0 | 0.0% |
| Engineering | 0 | 0.0% |
| Multidisciplinary Studies | 0 | 0.0% |
| Science & Technology | 4 | 4.9% |
| Business | 60 | 74.1% |
| Education | 0 | 0.0% |
| Literature & Languages | 0 | 0.0% |
| Liberal Arts & History | 0 | 0.0% |
| Visual & Performing Arts | 0 | 0.0% |
| Communications | 0 | 0.0% |
| Arts & Humanities | 0 | 0.0% |
| Total | 81 | 100.0% |
Transportation & Commute in Tatum
Vehicle Availability by Sex in Tatum
The most prevalent vehicle ownership categories in Tatum are males with 2 vehicles (115, accounting for 46.2%) and females with 2 vehicles (21, making up 82.1%).
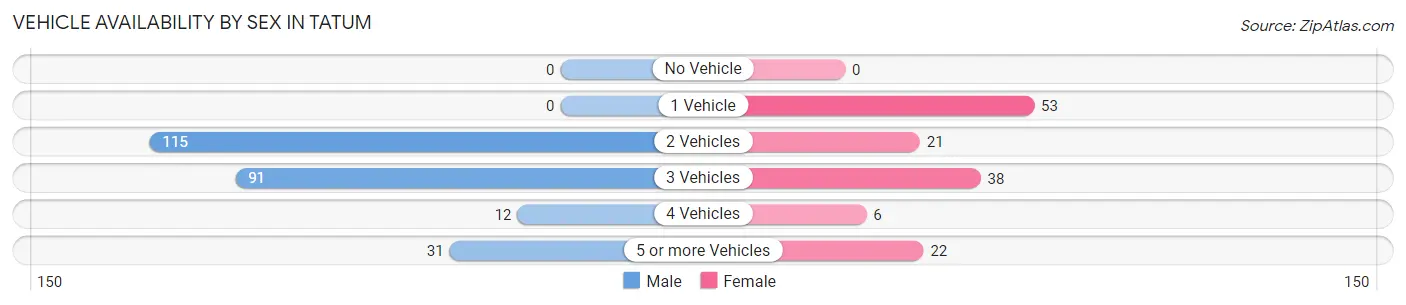
| Vehicles Available | Male | Female |
| No Vehicle | 0 (0.0%) | 0 (0.0%) |
| 1 Vehicle | 0 (0.0%) | 53 (37.9%) |
| 2 Vehicles | 115 (46.2%) | 21 (15.0%) |
| 3 Vehicles | 91 (36.5%) | 38 (27.1%) |
| 4 Vehicles | 12 (4.8%) | 6 (4.3%) |
| 5 or more Vehicles | 31 (12.4%) | 22 (15.7%) |
| Total | 249 (100.0%) | 140 (100.0%) |
Commute Time in Tatum
The most frequently occuring commute durations in Tatum are less than 5 minutes (102 commuters, 26.2%), 30 to 34 minutes (85 commuters, 21.8%), and 35 to 39 minutes (60 commuters, 15.4%).
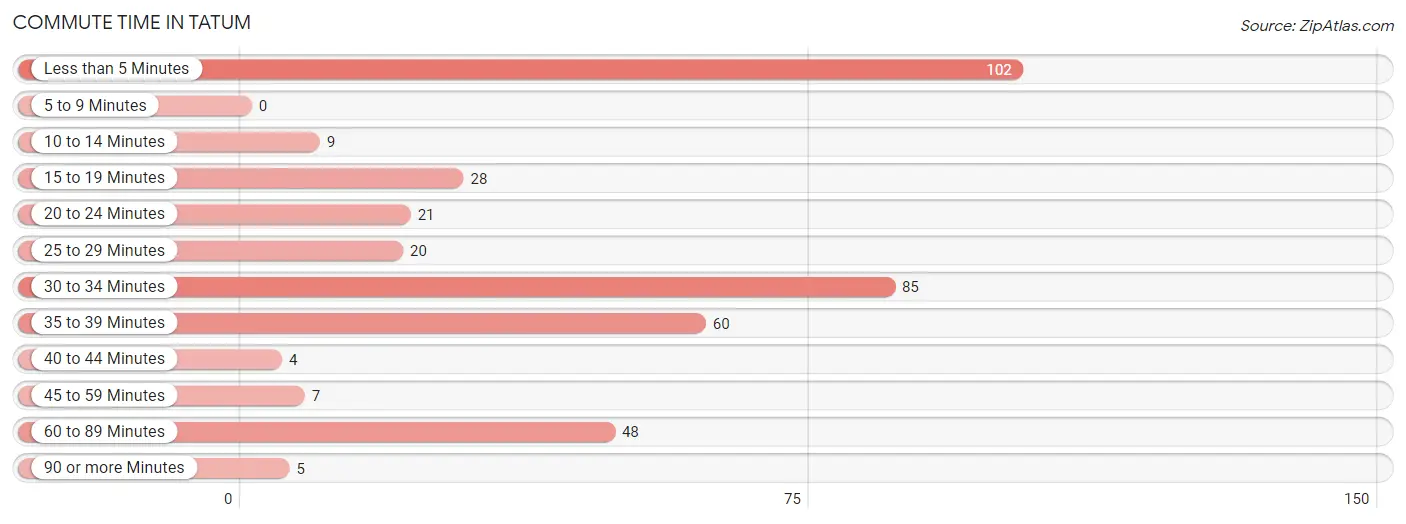
| Commute Time | # Commuters | % Commuters |
| Less than 5 Minutes | 102 | 26.2% |
| 5 to 9 Minutes | 0 | 0.0% |
| 10 to 14 Minutes | 9 | 2.3% |
| 15 to 19 Minutes | 28 | 7.2% |
| 20 to 24 Minutes | 21 | 5.4% |
| 25 to 29 Minutes | 20 | 5.1% |
| 30 to 34 Minutes | 85 | 21.8% |
| 35 to 39 Minutes | 60 | 15.4% |
| 40 to 44 Minutes | 4 | 1.0% |
| 45 to 59 Minutes | 7 | 1.8% |
| 60 to 89 Minutes | 48 | 12.3% |
| 90 or more Minutes | 5 | 1.3% |
Commute Time by Sex in Tatum
The most common commute times in Tatum are 30 to 34 minutes (85 commuters, 34.1%) for males and less than 5 minutes (87 commuters, 62.1%) for females.
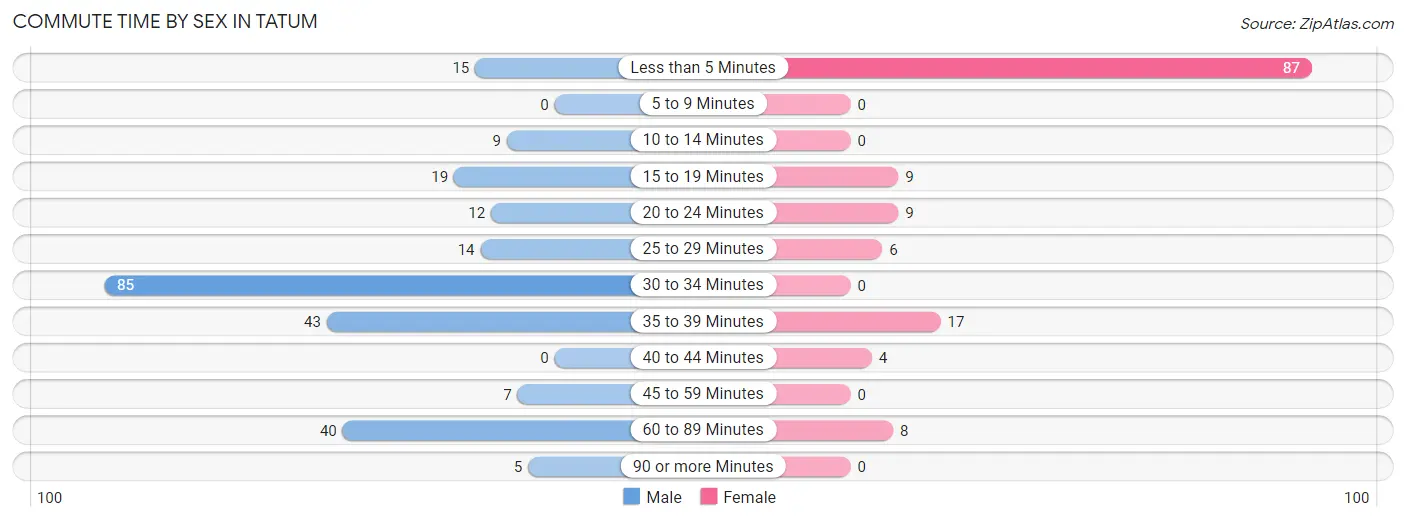
| Commute Time | Male | Female |
| Less than 5 Minutes | 15 (6.0%) | 87 (62.1%) |
| 5 to 9 Minutes | 0 (0.0%) | 0 (0.0%) |
| 10 to 14 Minutes | 9 (3.6%) | 0 (0.0%) |
| 15 to 19 Minutes | 19 (7.6%) | 9 (6.4%) |
| 20 to 24 Minutes | 12 (4.8%) | 9 (6.4%) |
| 25 to 29 Minutes | 14 (5.6%) | 6 (4.3%) |
| 30 to 34 Minutes | 85 (34.1%) | 0 (0.0%) |
| 35 to 39 Minutes | 43 (17.3%) | 17 (12.1%) |
| 40 to 44 Minutes | 0 (0.0%) | 4 (2.9%) |
| 45 to 59 Minutes | 7 (2.8%) | 0 (0.0%) |
| 60 to 89 Minutes | 40 (16.1%) | 8 (5.7%) |
| 90 or more Minutes | 5 (2.0%) | 0 (0.0%) |
Time of Departure to Work by Sex in Tatum
The most frequent times of departure to work in Tatum are 12:00 AM to 4:59 AM (88, 35.3%) for males and 12:00 PM to 3:59 PM (53, 37.9%) for females.
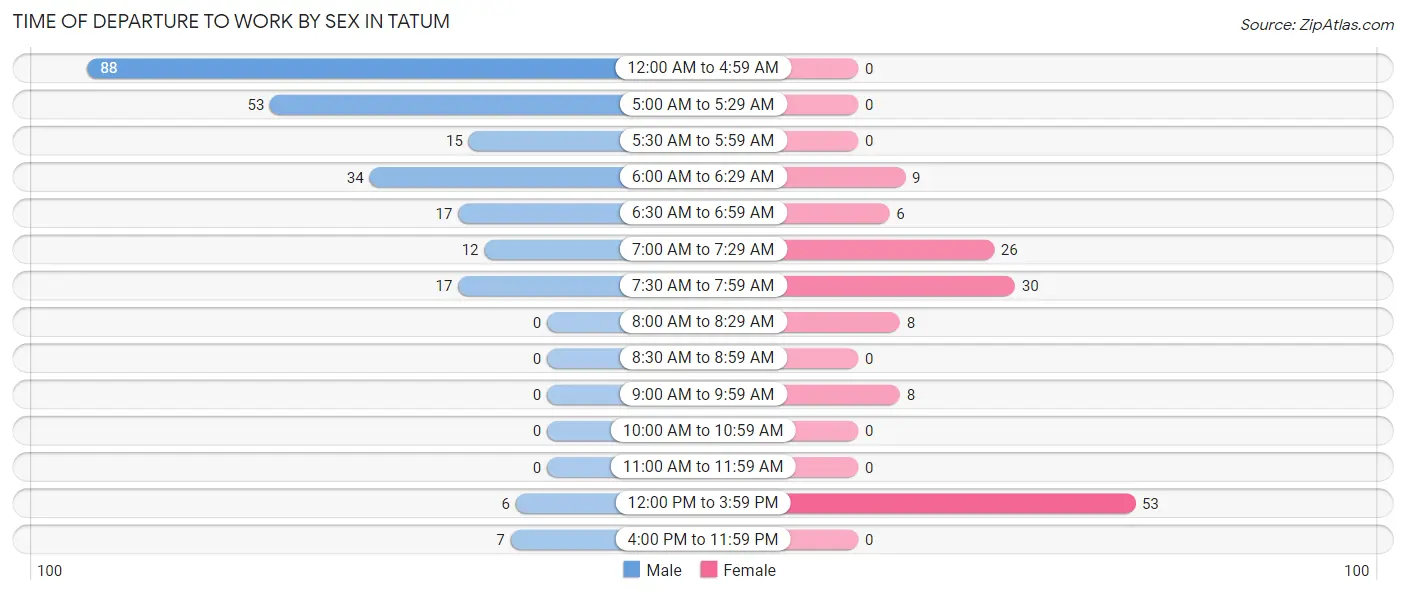
| Time of Departure | Male | Female |
| 12:00 AM to 4:59 AM | 88 (35.3%) | 0 (0.0%) |
| 5:00 AM to 5:29 AM | 53 (21.3%) | 0 (0.0%) |
| 5:30 AM to 5:59 AM | 15 (6.0%) | 0 (0.0%) |
| 6:00 AM to 6:29 AM | 34 (13.7%) | 9 (6.4%) |
| 6:30 AM to 6:59 AM | 17 (6.8%) | 6 (4.3%) |
| 7:00 AM to 7:29 AM | 12 (4.8%) | 26 (18.6%) |
| 7:30 AM to 7:59 AM | 17 (6.8%) | 30 (21.4%) |
| 8:00 AM to 8:29 AM | 0 (0.0%) | 8 (5.7%) |
| 8:30 AM to 8:59 AM | 0 (0.0%) | 0 (0.0%) |
| 9:00 AM to 9:59 AM | 0 (0.0%) | 8 (5.7%) |
| 10:00 AM to 10:59 AM | 0 (0.0%) | 0 (0.0%) |
| 11:00 AM to 11:59 AM | 0 (0.0%) | 0 (0.0%) |
| 12:00 PM to 3:59 PM | 6 (2.4%) | 53 (37.9%) |
| 4:00 PM to 11:59 PM | 7 (2.8%) | 0 (0.0%) |
| Total | 249 (100.0%) | 140 (100.0%) |
Housing Occupancy in Tatum
Occupancy by Ownership in Tatum
Of the total 320 dwellings in Tatum, owner-occupied units account for 243 (75.9%), while renter-occupied units make up 77 (24.1%).
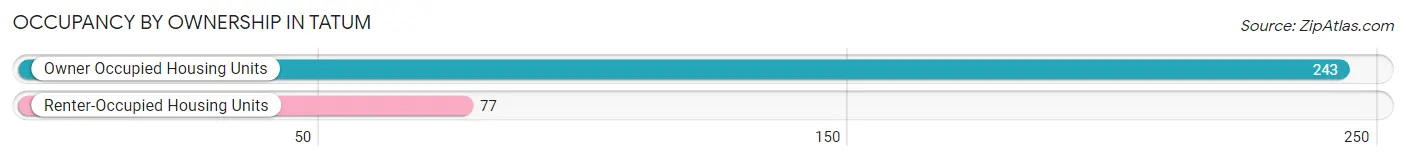
| Occupancy | # Housing Units | % Housing Units |
| Owner Occupied Housing Units | 243 | 75.9% |
| Renter-Occupied Housing Units | 77 | 24.1% |
| Total Occupied Housing Units | 320 | 100.0% |
Occupancy by Household Size in Tatum
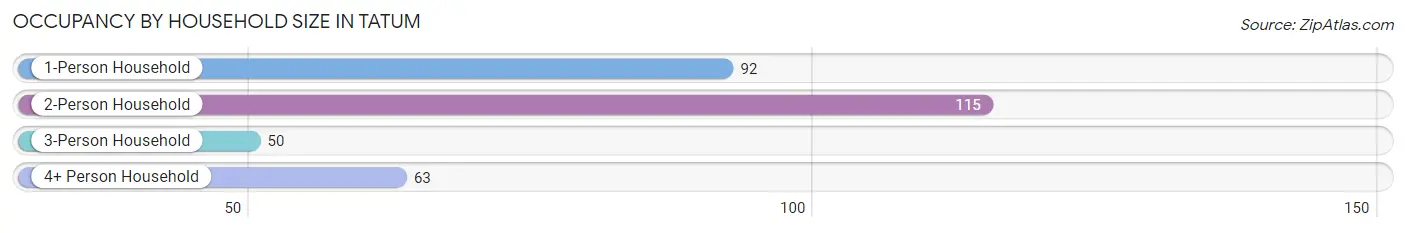
| Household Size | # Housing Units | % Housing Units |
| 1-Person Household | 92 | 28.7% |
| 2-Person Household | 115 | 35.9% |
| 3-Person Household | 50 | 15.6% |
| 4+ Person Household | 63 | 19.7% |
| Total Housing Units | 320 | 100.0% |
Occupancy by Ownership by Household Size in Tatum
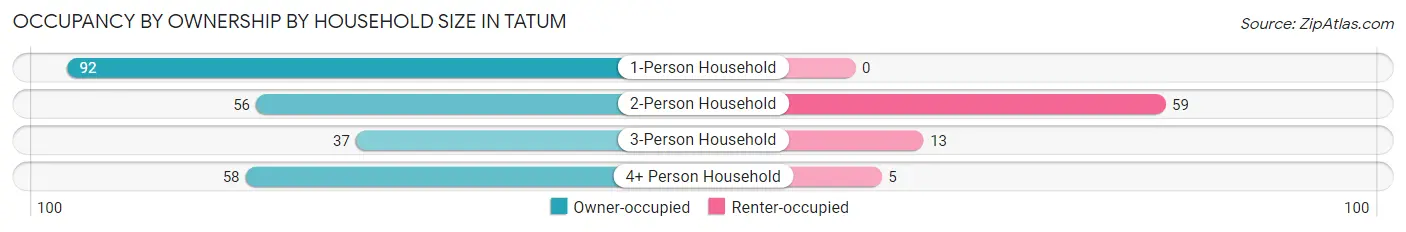
| Household Size | Owner-occupied | Renter-occupied |
| 1-Person Household | 92 (100.0%) | 0 (0.0%) |
| 2-Person Household | 56 (48.7%) | 59 (51.3%) |
| 3-Person Household | 37 (74.0%) | 13 (26.0%) |
| 4+ Person Household | 58 (92.1%) | 5 (7.9%) |
| Total Housing Units | 243 (75.9%) | 77 (24.1%) |
Occupancy by Educational Attainment in Tatum
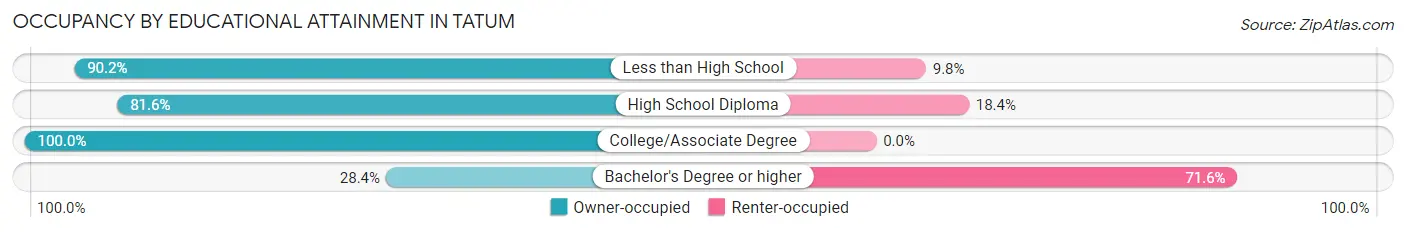
| Household Size | Owner-occupied | Renter-occupied |
| Less than High School | 55 (90.2%) | 6 (9.8%) |
| High School Diploma | 80 (81.6%) | 18 (18.4%) |
| College/Associate Degree | 87 (100.0%) | 0 (0.0%) |
| Bachelor's Degree or higher | 21 (28.4%) | 53 (71.6%) |
Occupancy by Age of Householder in Tatum
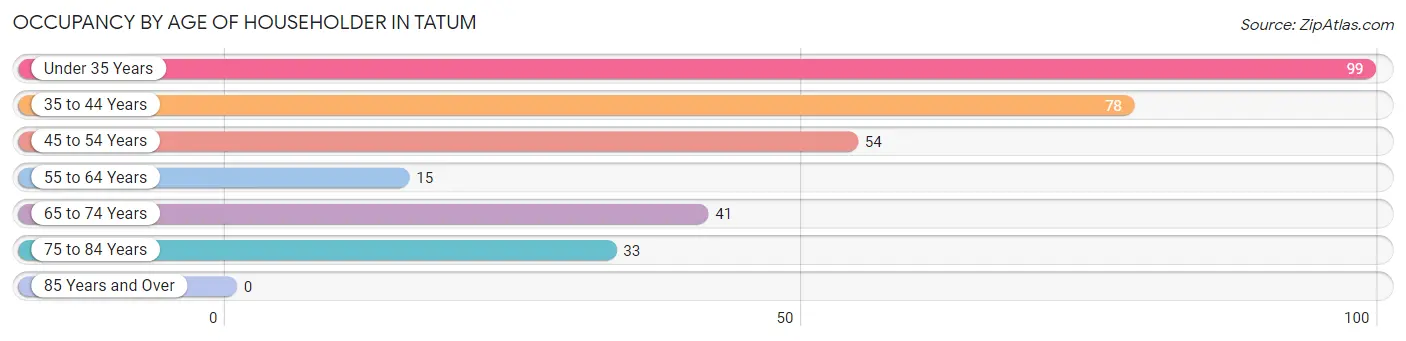
| Age Bracket | # Households | % Households |
| Under 35 Years | 99 | 30.9% |
| 35 to 44 Years | 78 | 24.4% |
| 45 to 54 Years | 54 | 16.9% |
| 55 to 64 Years | 15 | 4.7% |
| 65 to 74 Years | 41 | 12.8% |
| 75 to 84 Years | 33 | 10.3% |
| 85 Years and Over | 0 | 0.0% |
| Total | 320 | 100.0% |
Housing Finances in Tatum
Median Income by Occupancy in Tatum
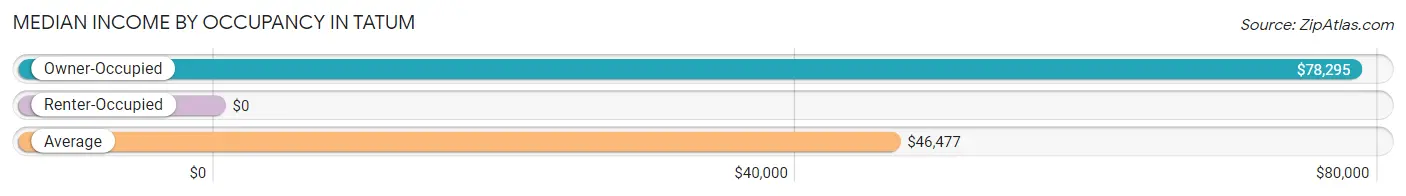
| Occupancy Type | # Households | Median Income |
| Owner-Occupied | 243 (75.9%) | $78,295 |
| Renter-Occupied | 77 (24.1%) | $0 |
| Average | 320 (100.0%) | $46,477 |
Occupancy by Householder Income Bracket in Tatum
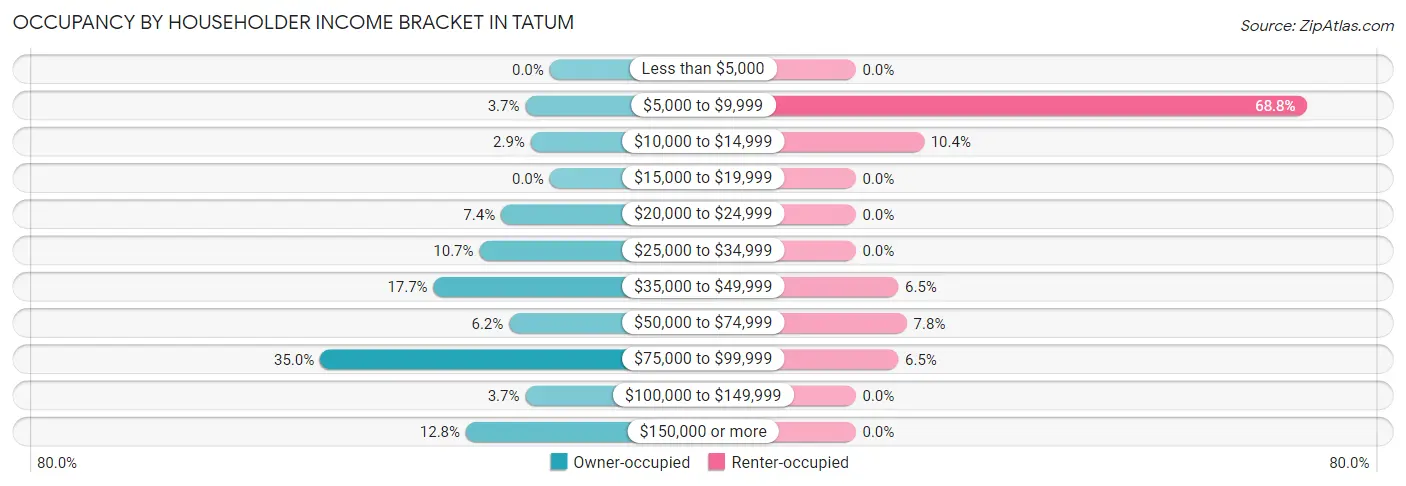
| Income Bracket | Owner-occupied | Renter-occupied |
| Less than $5,000 | 0 (0.0%) | 0 (0.0%) |
| $5,000 to $9,999 | 9 (3.7%) | 53 (68.8%) |
| $10,000 to $14,999 | 7 (2.9%) | 8 (10.4%) |
| $15,000 to $19,999 | 0 (0.0%) | 0 (0.0%) |
| $20,000 to $24,999 | 18 (7.4%) | 0 (0.0%) |
| $25,000 to $34,999 | 26 (10.7%) | 0 (0.0%) |
| $35,000 to $49,999 | 43 (17.7%) | 5 (6.5%) |
| $50,000 to $74,999 | 15 (6.2%) | 6 (7.8%) |
| $75,000 to $99,999 | 85 (35.0%) | 5 (6.5%) |
| $100,000 to $149,999 | 9 (3.7%) | 0 (0.0%) |
| $150,000 or more | 31 (12.8%) | 0 (0.0%) |
| Total | 243 (100.0%) | 77 (100.0%) |
Monthly Housing Cost Tiers in Tatum
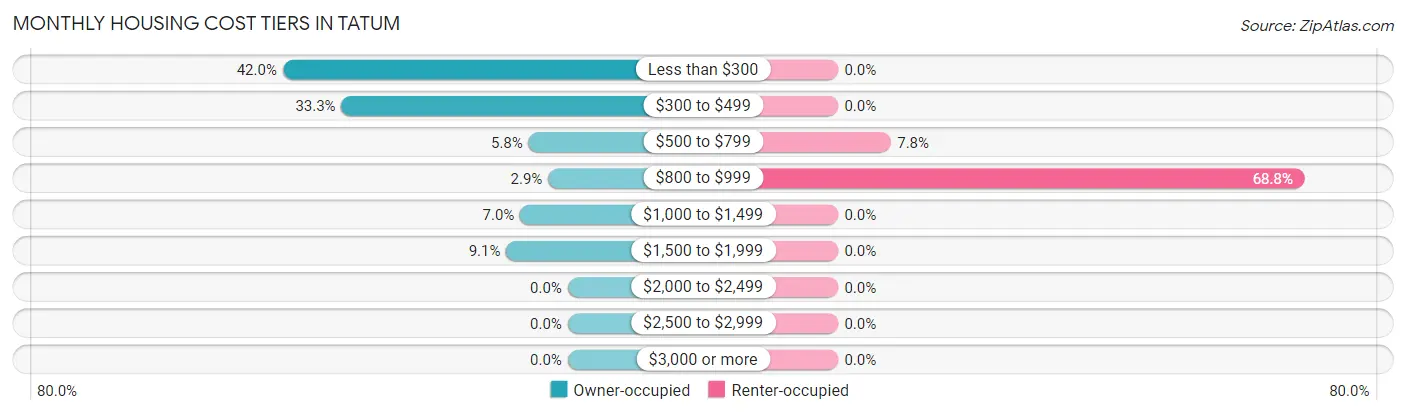
| Monthly Cost | Owner-occupied | Renter-occupied |
| Less than $300 | 102 (42.0%) | 0 (0.0%) |
| $300 to $499 | 81 (33.3%) | 0 (0.0%) |
| $500 to $799 | 14 (5.8%) | 6 (7.8%) |
| $800 to $999 | 7 (2.9%) | 53 (68.8%) |
| $1,000 to $1,499 | 17 (7.0%) | 0 (0.0%) |
| $1,500 to $1,999 | 22 (9.0%) | 0 (0.0%) |
| $2,000 to $2,499 | 0 (0.0%) | 0 (0.0%) |
| $2,500 to $2,999 | 0 (0.0%) | 0 (0.0%) |
| $3,000 or more | 0 (0.0%) | 0 (0.0%) |
| Total | 243 (100.0%) | 77 (100.0%) |
Physical Housing Characteristics in Tatum
Housing Structures in Tatum
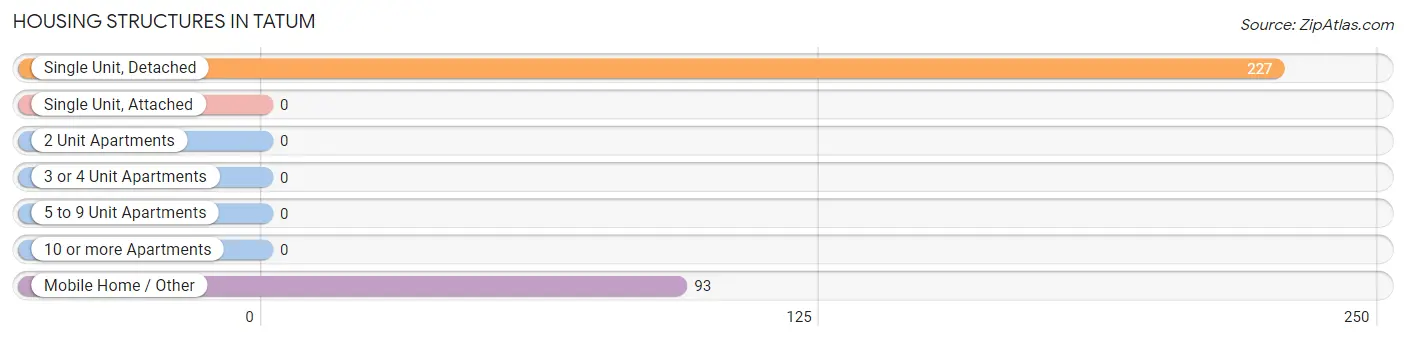
| Structure Type | # Housing Units | % Housing Units |
| Single Unit, Detached | 227 | 70.9% |
| Single Unit, Attached | 0 | 0.0% |
| 2 Unit Apartments | 0 | 0.0% |
| 3 or 4 Unit Apartments | 0 | 0.0% |
| 5 to 9 Unit Apartments | 0 | 0.0% |
| 10 or more Apartments | 0 | 0.0% |
| Mobile Home / Other | 93 | 29.1% |
| Total | 320 | 100.0% |
Housing Structures by Occupancy in Tatum
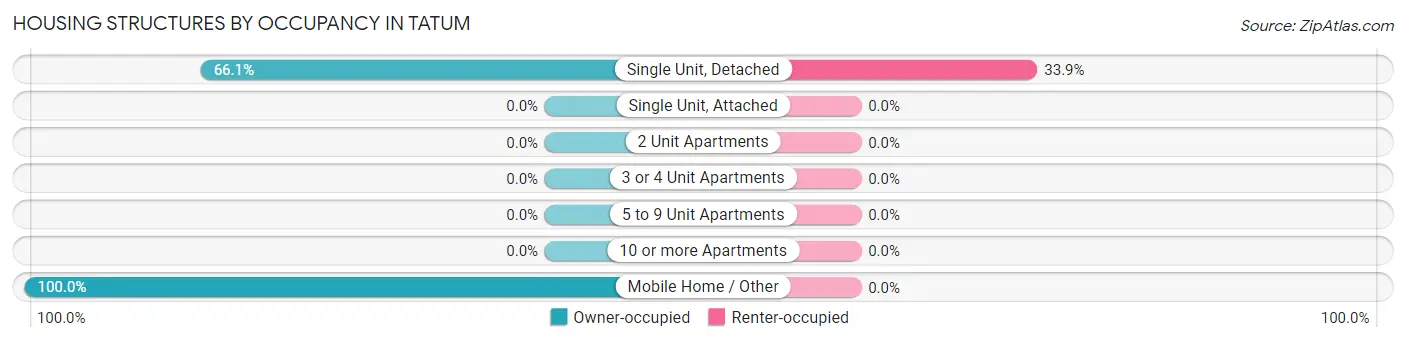
| Structure Type | Owner-occupied | Renter-occupied |
| Single Unit, Detached | 150 (66.1%) | 77 (33.9%) |
| Single Unit, Attached | 0 (0.0%) | 0 (0.0%) |
| 2 Unit Apartments | 0 (0.0%) | 0 (0.0%) |
| 3 or 4 Unit Apartments | 0 (0.0%) | 0 (0.0%) |
| 5 to 9 Unit Apartments | 0 (0.0%) | 0 (0.0%) |
| 10 or more Apartments | 0 (0.0%) | 0 (0.0%) |
| Mobile Home / Other | 93 (100.0%) | 0 (0.0%) |
| Total | 243 (75.9%) | 77 (24.1%) |
Housing Structures by Number of Rooms in Tatum
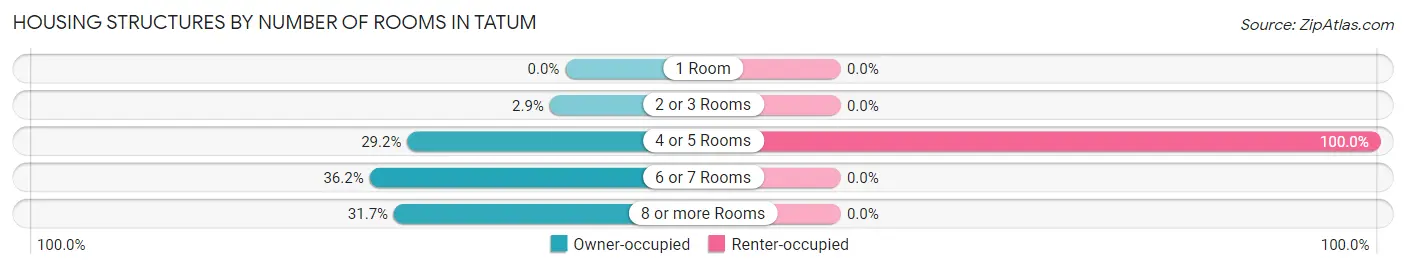
| Number of Rooms | Owner-occupied | Renter-occupied |
| 1 Room | 0 (0.0%) | 0 (0.0%) |
| 2 or 3 Rooms | 7 (2.9%) | 0 (0.0%) |
| 4 or 5 Rooms | 71 (29.2%) | 77 (100.0%) |
| 6 or 7 Rooms | 88 (36.2%) | 0 (0.0%) |
| 8 or more Rooms | 77 (31.7%) | 0 (0.0%) |
| Total | 243 (100.0%) | 77 (100.0%) |
Housing Structure by Heating Type in Tatum
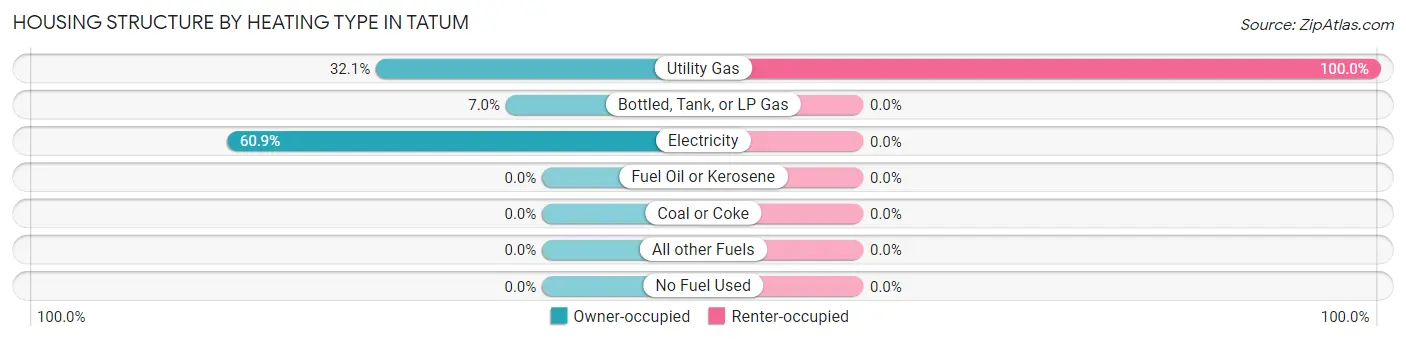
| Heating Type | Owner-occupied | Renter-occupied |
| Utility Gas | 78 (32.1%) | 77 (100.0%) |
| Bottled, Tank, or LP Gas | 17 (7.0%) | 0 (0.0%) |
| Electricity | 148 (60.9%) | 0 (0.0%) |
| Fuel Oil or Kerosene | 0 (0.0%) | 0 (0.0%) |
| Coal or Coke | 0 (0.0%) | 0 (0.0%) |
| All other Fuels | 0 (0.0%) | 0 (0.0%) |
| No Fuel Used | 0 (0.0%) | 0 (0.0%) |
| Total | 243 (100.0%) | 77 (100.0%) |
Household Vehicle Usage in Tatum
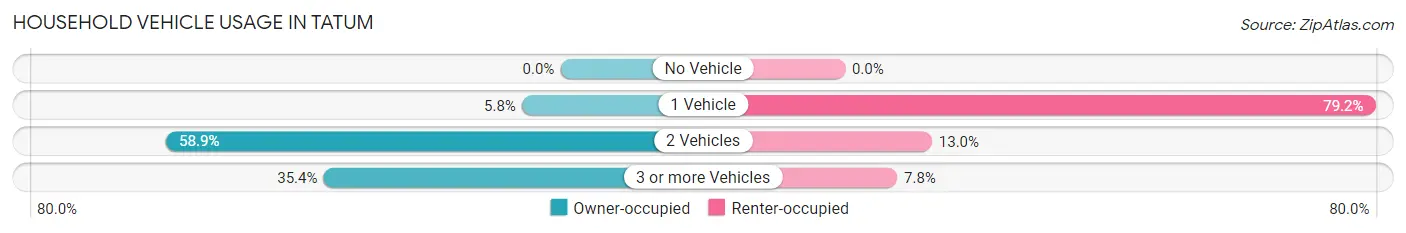
| Vehicles per Household | Owner-occupied | Renter-occupied |
| No Vehicle | 0 (0.0%) | 0 (0.0%) |
| 1 Vehicle | 14 (5.8%) | 61 (79.2%) |
| 2 Vehicles | 143 (58.9%) | 10 (13.0%) |
| 3 or more Vehicles | 86 (35.4%) | 6 (7.8%) |
| Total | 243 (100.0%) | 77 (100.0%) |
Real Estate & Mortgages in Tatum
Real Estate and Mortgage Overview in Tatum
| Characteristic | Without Mortgage | With Mortgage |
| Housing Units | 191 | 52 |
| Median Property Value | $71,800 | $126,700 |
| Median Household Income | $56,875 | $22 |
| Monthly Housing Costs | $295 | $0 |
| Real Estate Taxes | $396 | $0 |
Property Value by Mortgage Status in Tatum
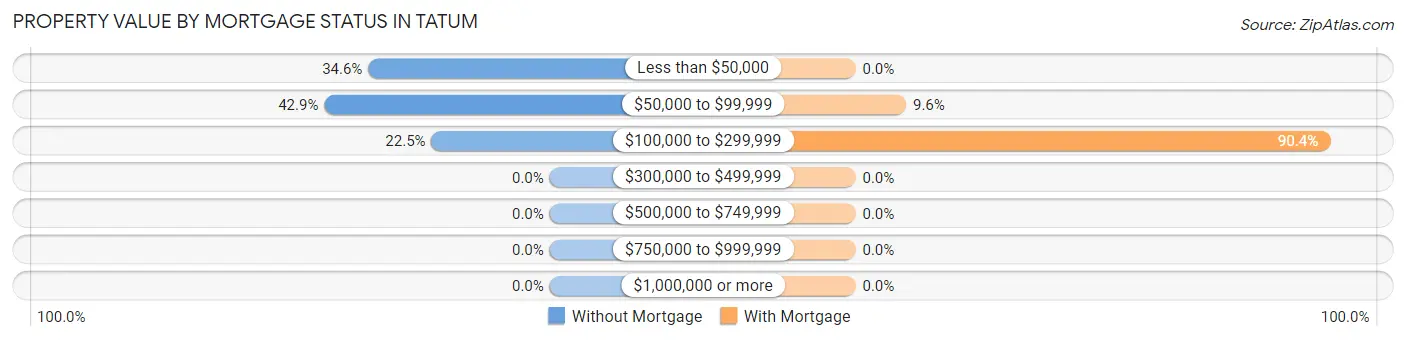
| Property Value | Without Mortgage | With Mortgage |
| Less than $50,000 | 66 (34.5%) | 0 (0.0%) |
| $50,000 to $99,999 | 82 (42.9%) | 5 (9.6%) |
| $100,000 to $299,999 | 43 (22.5%) | 47 (90.4%) |
| $300,000 to $499,999 | 0 (0.0%) | 0 (0.0%) |
| $500,000 to $749,999 | 0 (0.0%) | 0 (0.0%) |
| $750,000 to $999,999 | 0 (0.0%) | 0 (0.0%) |
| $1,000,000 or more | 0 (0.0%) | 0 (0.0%) |
| Total | 191 (100.0%) | 52 (100.0%) |
Household Income by Mortgage Status in Tatum
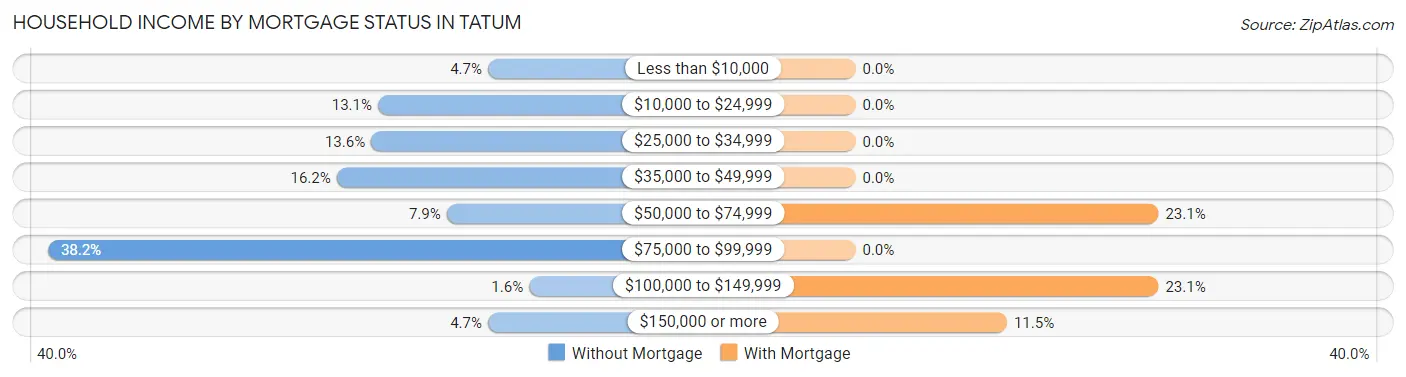
| Household Income | Without Mortgage | With Mortgage |
| Less than $10,000 | 9 (4.7%) | 0 (0.0%) |
| $10,000 to $24,999 | 25 (13.1%) | 0 (0.0%) |
| $25,000 to $34,999 | 26 (13.6%) | 0 (0.0%) |
| $35,000 to $49,999 | 31 (16.2%) | 0 (0.0%) |
| $50,000 to $74,999 | 15 (7.9%) | 12 (23.1%) |
| $75,000 to $99,999 | 73 (38.2%) | 0 (0.0%) |
| $100,000 to $149,999 | 3 (1.6%) | 12 (23.1%) |
| $150,000 or more | 9 (4.7%) | 6 (11.5%) |
| Total | 191 (100.0%) | 52 (100.0%) |
Property Value to Household Income Ratio in Tatum
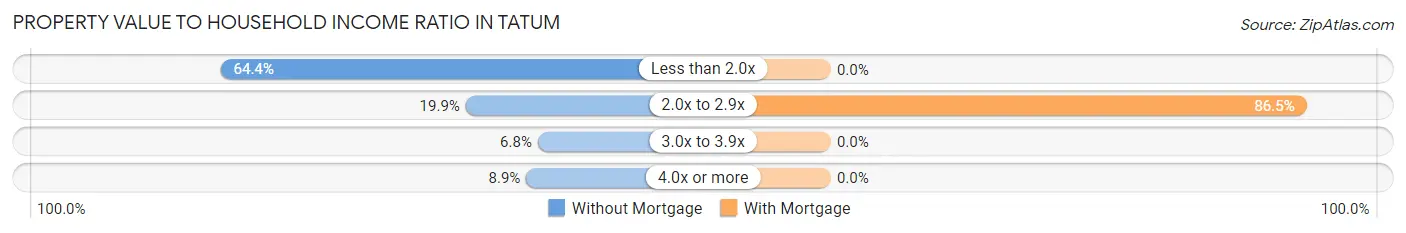
| Value-to-Income Ratio | Without Mortgage | With Mortgage |
| Less than 2.0x | 123 (64.4%) | 0 (0.0%) |
| 2.0x to 2.9x | 38 (19.9%) | 45 (86.5%) |
| 3.0x to 3.9x | 13 (6.8%) | 0 (0.0%) |
| 4.0x or more | 17 (8.9%) | 0 (0.0%) |
| Total | 191 (100.0%) | 52 (100.0%) |
Real Estate Taxes by Mortgage Status in Tatum
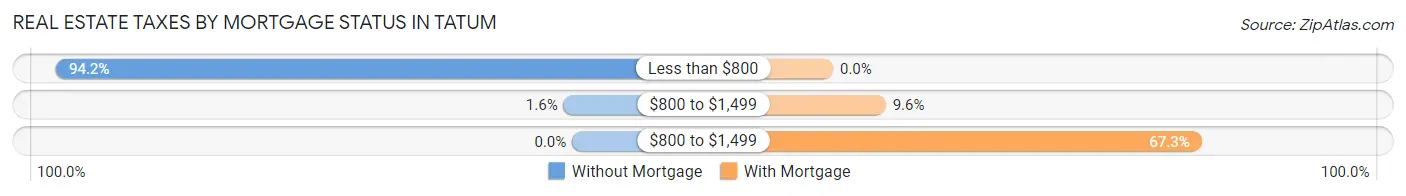
| Property Taxes | Without Mortgage | With Mortgage |
| Less than $800 | 180 (94.2%) | 0 (0.0%) |
| $800 to $1,499 | 3 (1.6%) | 5 (9.6%) |
| $800 to $1,499 | 0 (0.0%) | 35 (67.3%) |
| Total | 191 (100.0%) | 52 (100.0%) |
Health & Disability in Tatum
Health Insurance Coverage by Age in Tatum
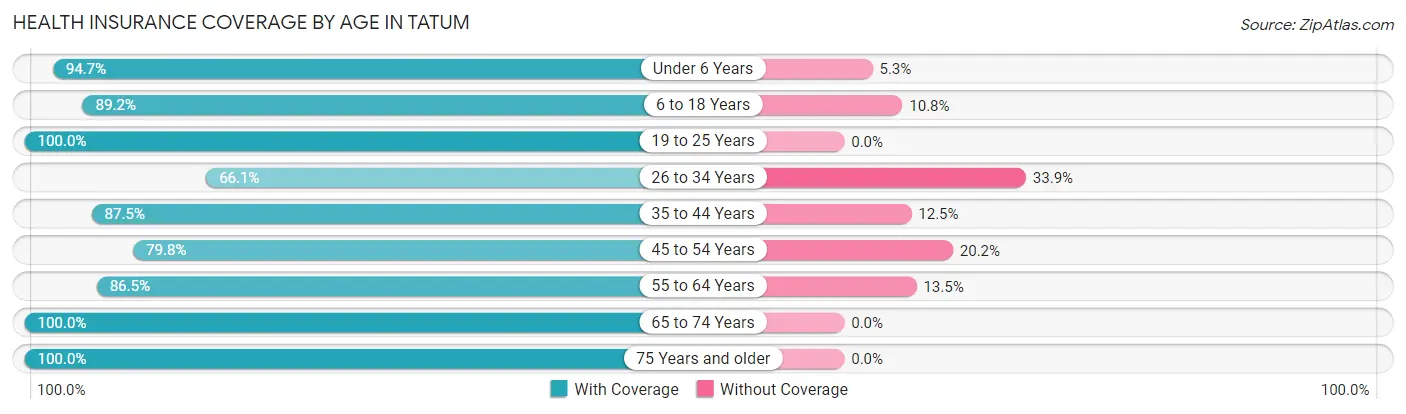
| Age Bracket | With Coverage | Without Coverage |
| Under 6 Years | 54 (94.7%) | 3 (5.3%) |
| 6 to 18 Years | 140 (89.2%) | 17 (10.8%) |
| 19 to 25 Years | 46 (100.0%) | 0 (0.0%) |
| 26 to 34 Years | 123 (66.1%) | 63 (33.9%) |
| 35 to 44 Years | 91 (87.5%) | 13 (12.5%) |
| 45 to 54 Years | 67 (79.8%) | 17 (20.2%) |
| 55 to 64 Years | 45 (86.5%) | 7 (13.5%) |
| 65 to 74 Years | 52 (100.0%) | 0 (0.0%) |
| 75 Years and older | 56 (100.0%) | 0 (0.0%) |
| Total | 674 (84.9%) | 120 (15.1%) |
Health Insurance Coverage by Citizenship Status in Tatum
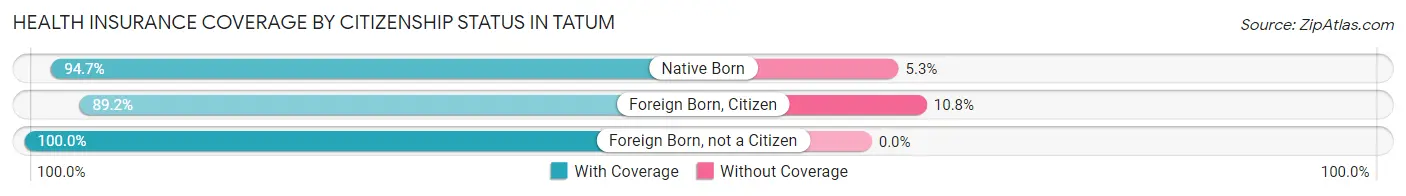
| Citizenship Status | With Coverage | Without Coverage |
| Native Born | 54 (94.7%) | 3 (5.3%) |
| Foreign Born, Citizen | 140 (89.2%) | 17 (10.8%) |
| Foreign Born, not a Citizen | 46 (100.0%) | 0 (0.0%) |
Health Insurance Coverage by Household Income in Tatum
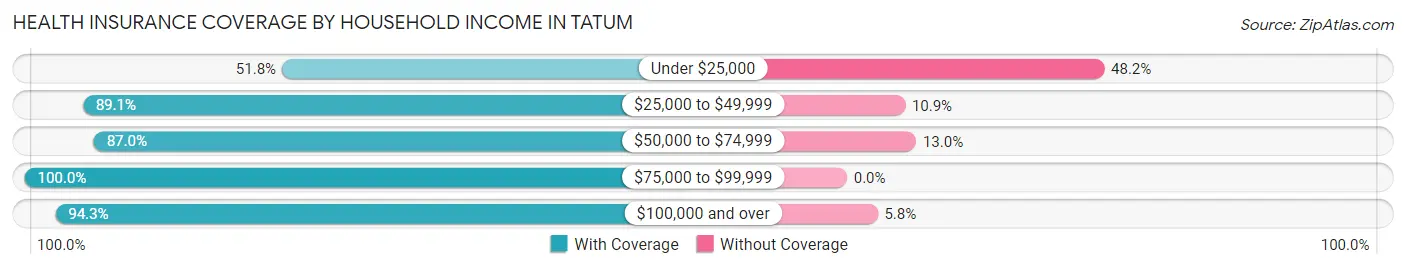
| Household Income | With Coverage | Without Coverage |
| Under $25,000 | 87 (51.8%) | 81 (48.2%) |
| $25,000 to $49,999 | 180 (89.1%) | 22 (10.9%) |
| $50,000 to $74,999 | 47 (87.0%) | 7 (13.0%) |
| $75,000 to $99,999 | 196 (100.0%) | 0 (0.0%) |
| $100,000 and over | 164 (94.3%) | 10 (5.8%) |
Public vs Private Health Insurance Coverage by Age in Tatum
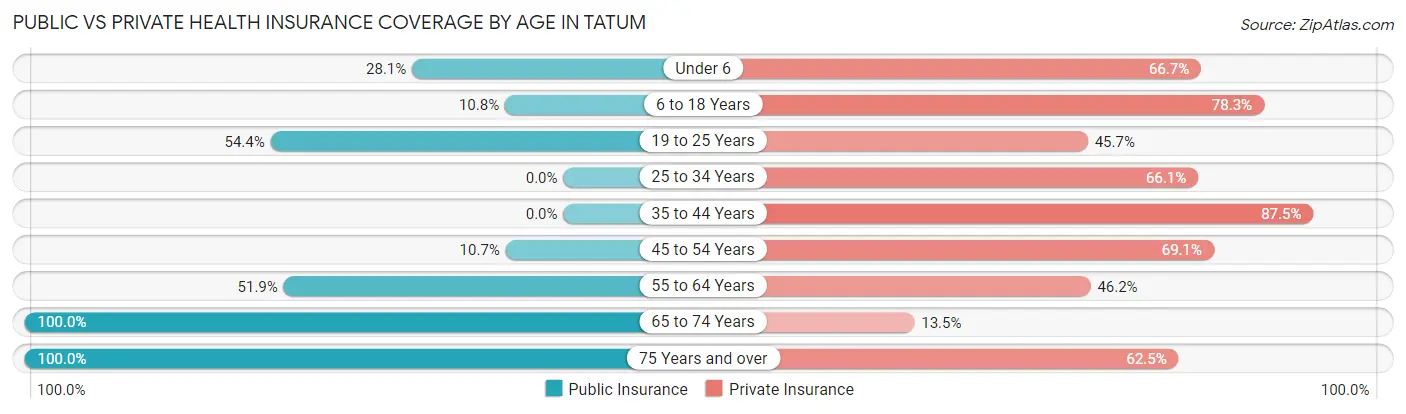
| Age Bracket | Public Insurance | Private Insurance |
| Under 6 | 16 (28.1%) | 38 (66.7%) |
| 6 to 18 Years | 17 (10.8%) | 123 (78.3%) |
| 19 to 25 Years | 25 (54.3%) | 21 (45.7%) |
| 25 to 34 Years | 0 (0.0%) | 123 (66.1%) |
| 35 to 44 Years | 0 (0.0%) | 91 (87.5%) |
| 45 to 54 Years | 9 (10.7%) | 58 (69.1%) |
| 55 to 64 Years | 27 (51.9%) | 24 (46.2%) |
| 65 to 74 Years | 52 (100.0%) | 7 (13.5%) |
| 75 Years and over | 56 (100.0%) | 35 (62.5%) |
| Total | 202 (25.4%) | 520 (65.5%) |
Disability Status by Sex by Age in Tatum
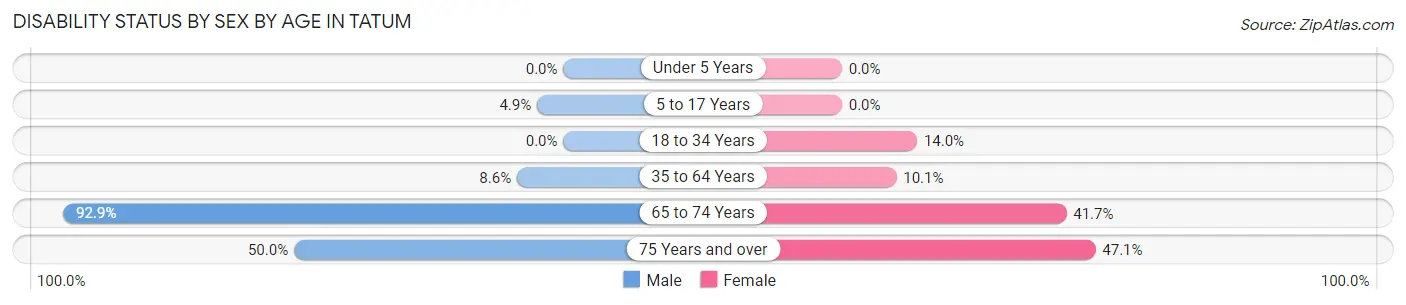
| Age Bracket | Male | Female |
| Under 5 Years | 0 (0.0%) | 0 (0.0%) |
| 5 to 17 Years | 2 (4.9%) | 0 (0.0%) |
| 18 to 34 Years | 0 (0.0%) | 18 (14.0%) |
| 35 to 64 Years | 13 (8.6%) | 9 (10.1%) |
| 65 to 74 Years | 26 (92.9%) | 10 (41.7%) |
| 75 Years and over | 11 (50.0%) | 16 (47.1%) |
Disability Class by Sex by Age in Tatum
Disability Class: Hearing Difficulty
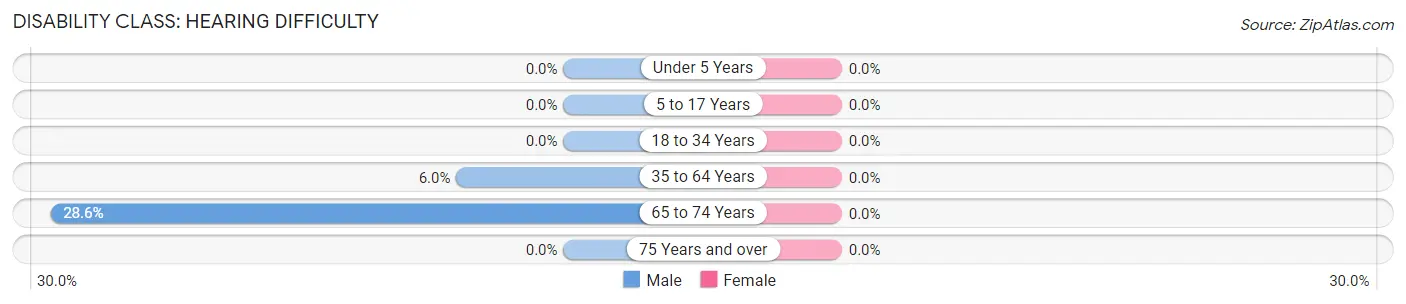
| Age Bracket | Male | Female |
| Under 5 Years | 0 (0.0%) | 0 (0.0%) |
| 5 to 17 Years | 0 (0.0%) | 0 (0.0%) |
| 18 to 34 Years | 0 (0.0%) | 0 (0.0%) |
| 35 to 64 Years | 9 (6.0%) | 0 (0.0%) |
| 65 to 74 Years | 8 (28.6%) | 0 (0.0%) |
| 75 Years and over | 0 (0.0%) | 0 (0.0%) |
Disability Class: Vision Difficulty
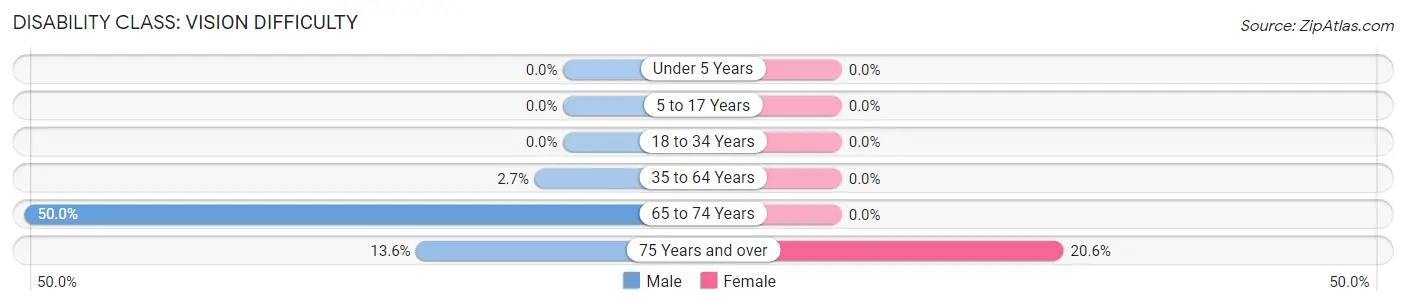
| Age Bracket | Male | Female |
| Under 5 Years | 0 (0.0%) | 0 (0.0%) |
| 5 to 17 Years | 0 (0.0%) | 0 (0.0%) |
| 18 to 34 Years | 0 (0.0%) | 0 (0.0%) |
| 35 to 64 Years | 4 (2.6%) | 0 (0.0%) |
| 65 to 74 Years | 14 (50.0%) | 0 (0.0%) |
| 75 Years and over | 3 (13.6%) | 7 (20.6%) |
Disability Class: Cognitive Difficulty
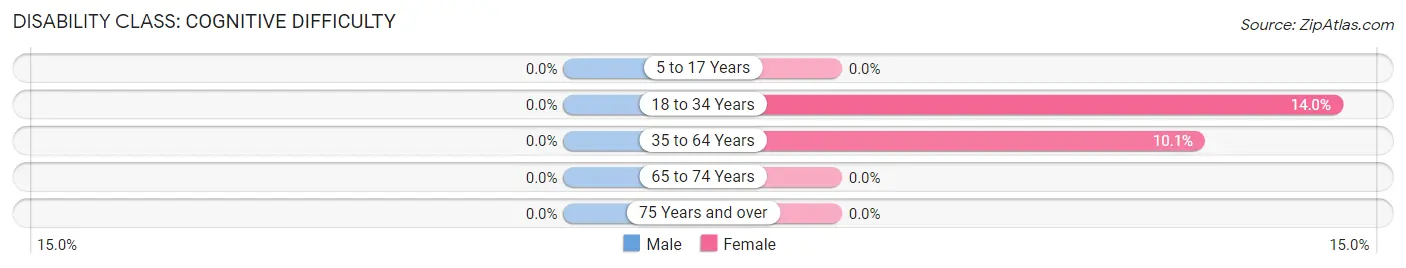
| Age Bracket | Male | Female |
| 5 to 17 Years | 0 (0.0%) | 0 (0.0%) |
| 18 to 34 Years | 0 (0.0%) | 18 (14.0%) |
| 35 to 64 Years | 0 (0.0%) | 9 (10.1%) |
| 65 to 74 Years | 0 (0.0%) | 0 (0.0%) |
| 75 Years and over | 0 (0.0%) | 0 (0.0%) |
Disability Class: Ambulatory Difficulty
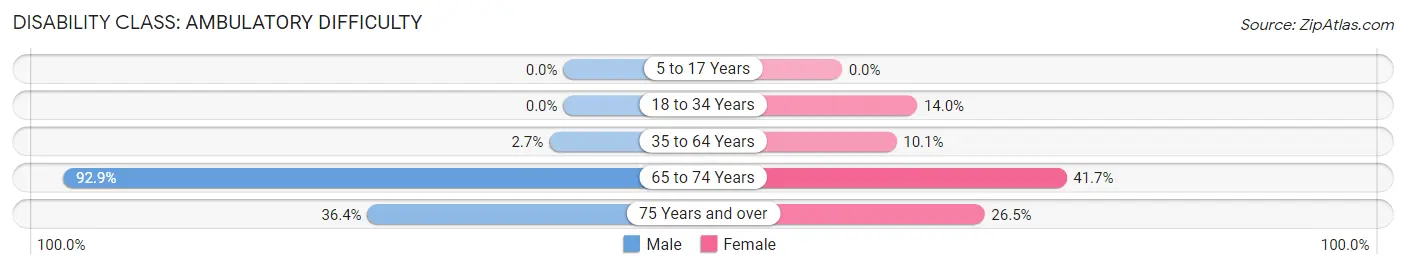
| Age Bracket | Male | Female |
| 5 to 17 Years | 0 (0.0%) | 0 (0.0%) |
| 18 to 34 Years | 0 (0.0%) | 18 (14.0%) |
| 35 to 64 Years | 4 (2.6%) | 9 (10.1%) |
| 65 to 74 Years | 26 (92.9%) | 10 (41.7%) |
| 75 Years and over | 8 (36.4%) | 9 (26.5%) |
Disability Class: Self-Care Difficulty
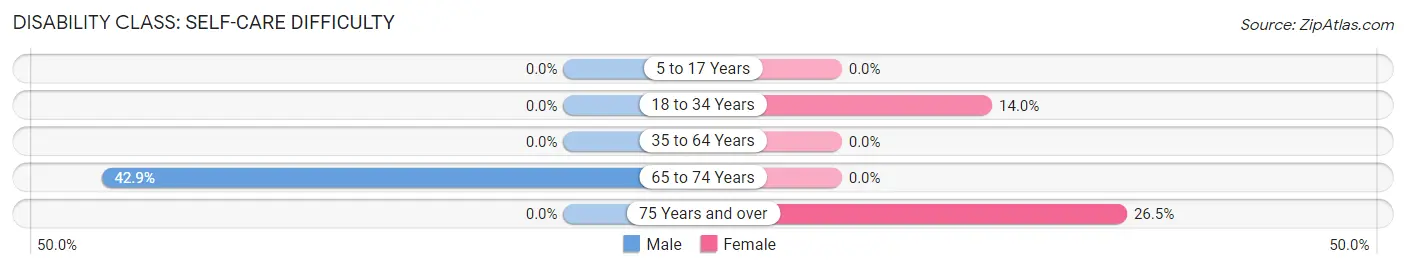
| Age Bracket | Male | Female |
| 5 to 17 Years | 0 (0.0%) | 0 (0.0%) |
| 18 to 34 Years | 0 (0.0%) | 18 (14.0%) |
| 35 to 64 Years | 0 (0.0%) | 0 (0.0%) |
| 65 to 74 Years | 12 (42.9%) | 0 (0.0%) |
| 75 Years and over | 0 (0.0%) | 9 (26.5%) |
Technology Access in Tatum
Computing Device Access in Tatum
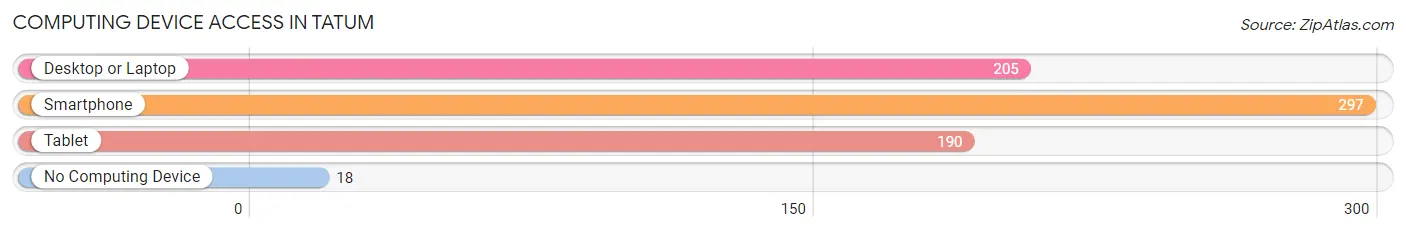
| Device Type | # Households | % Households |
| Desktop or Laptop | 205 | 64.1% |
| Smartphone | 297 | 92.8% |
| Tablet | 190 | 59.4% |
| No Computing Device | 18 | 5.6% |
| Total | 320 | 100.0% |
Internet Access in Tatum
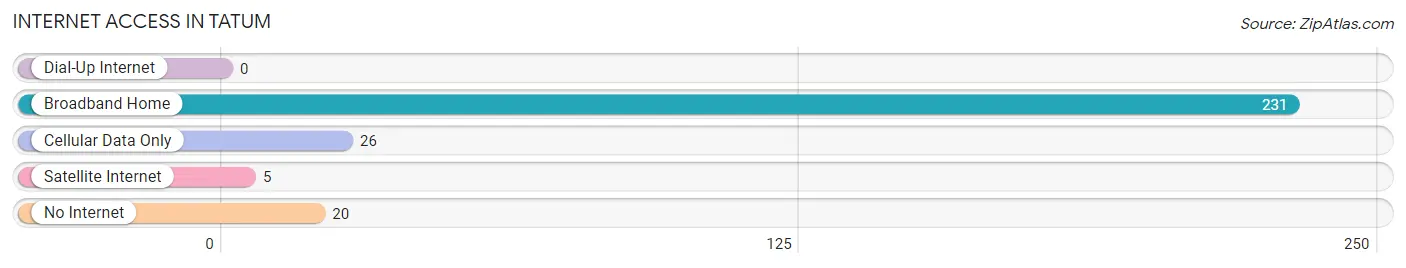
| Internet Type | # Households | % Households |
| Dial-Up Internet | 0 | 0.0% |
| Broadband Home | 231 | 72.2% |
| Cellular Data Only | 26 | 8.1% |
| Satellite Internet | 5 | 1.6% |
| No Internet | 20 | 6.2% |
| Total | 320 | 100.0% |
Tatum Summary
Tatum is a small town located in the northeastern corner of New Mexico, in the county of Lea. It is situated at the intersection of U.S. Highway 82 and State Highway 18, about 25 miles east of Hobbs. The town was founded in 1906 and was named after the Tatum family, who were early settlers in the area.
Geography
Tatum is located in the High Plains region of New Mexico, at an elevation of 3,845 feet. The town is situated in a semi-arid climate, with hot summers and cold winters. The average annual precipitation is about 15 inches, with most of it falling in the summer months. The town is surrounded by flat, open plains, with some rolling hills to the east. The nearest major city is Hobbs, located about 25 miles to the west.
Economy
Tatum’s economy is largely based on agriculture and oil and gas production. The town is home to several large farms, which produce a variety of crops, including cotton, corn, wheat, and alfalfa. The oil and gas industry is also a major employer in the area, with several large companies operating in the region. In addition, the town is home to several small businesses, including restaurants, convenience stores, and auto repair shops.
Demographics
As of the 2010 census, Tatum had a population of 1,093. The racial makeup of the town was 75.3% White, 0.7% African American, 0.9% Native American, 0.2% Asian, 0.1% Pacific Islander, and 22.8% from other races. Hispanic or Latino of any race were 44.2% of the population. The median household income was $30,938, and the median family income was $35,625.
Tatum is a small, rural town with a close-knit community. The town is home to several churches, a library, and a museum. The town also hosts several annual events, including the Tatum Rodeo and the Tatum Harvest Festival. The town is served by the Tatum Independent School District, which includes an elementary school, a middle school, and a high school.
Tatum is a small town with a rich history and a strong sense of community. The town is home to a diverse population and a vibrant economy. With its close proximity to larger cities and its rural charm, Tatum is an ideal place to live and work.
Common Questions
What is Per Capita Income in Tatum?
Per Capita income in Tatum is $35,655.
What is the Median Family Income in Tatum?
Median Family Income in Tatum is $40,750.
What is the Median Household income in Tatum?
Median Household Income in Tatum is $46,477.
What is Inequality or Gini Index in Tatum?
Inequality or Gini Index in Tatum is 0.46.
What is the Total Population of Tatum?
Total Population of Tatum is 794.
What is the Total Male Population of Tatum?
Total Male Population of Tatum is 389.
What is the Total Female Population of Tatum?
Total Female Population of Tatum is 405.
What is the Ratio of Males per 100 Females in Tatum?
There are 96.05 Males per 100 Females in Tatum.
What is the Ratio of Females per 100 Males in Tatum?
There are 104.11 Females per 100 Males in Tatum.
What is the Median Population Age in Tatum?
Median Population Age in Tatum is 34.1 Years.
What is the Average Family Size in Tatum
Average Family Size in Tatum is 2.7 People.
What is the Average Household Size in Tatum
Average Household Size in Tatum is 2.5 People.
How Large is the Labor Force in Tatum?
There are 389 People in the Labor Forcein in Tatum.
What is the Percentage of People in the Labor Force in Tatum?
59.3% of People are in the Labor Force in Tatum.