Zip Codes with the Lowest Poverty Level Among Children Under the Age of 5 in New Mexico
RELATED REPORTS & OPTIONS
Lowest Poverty | Child 0-5
New Mexico
Compare Zip Codes
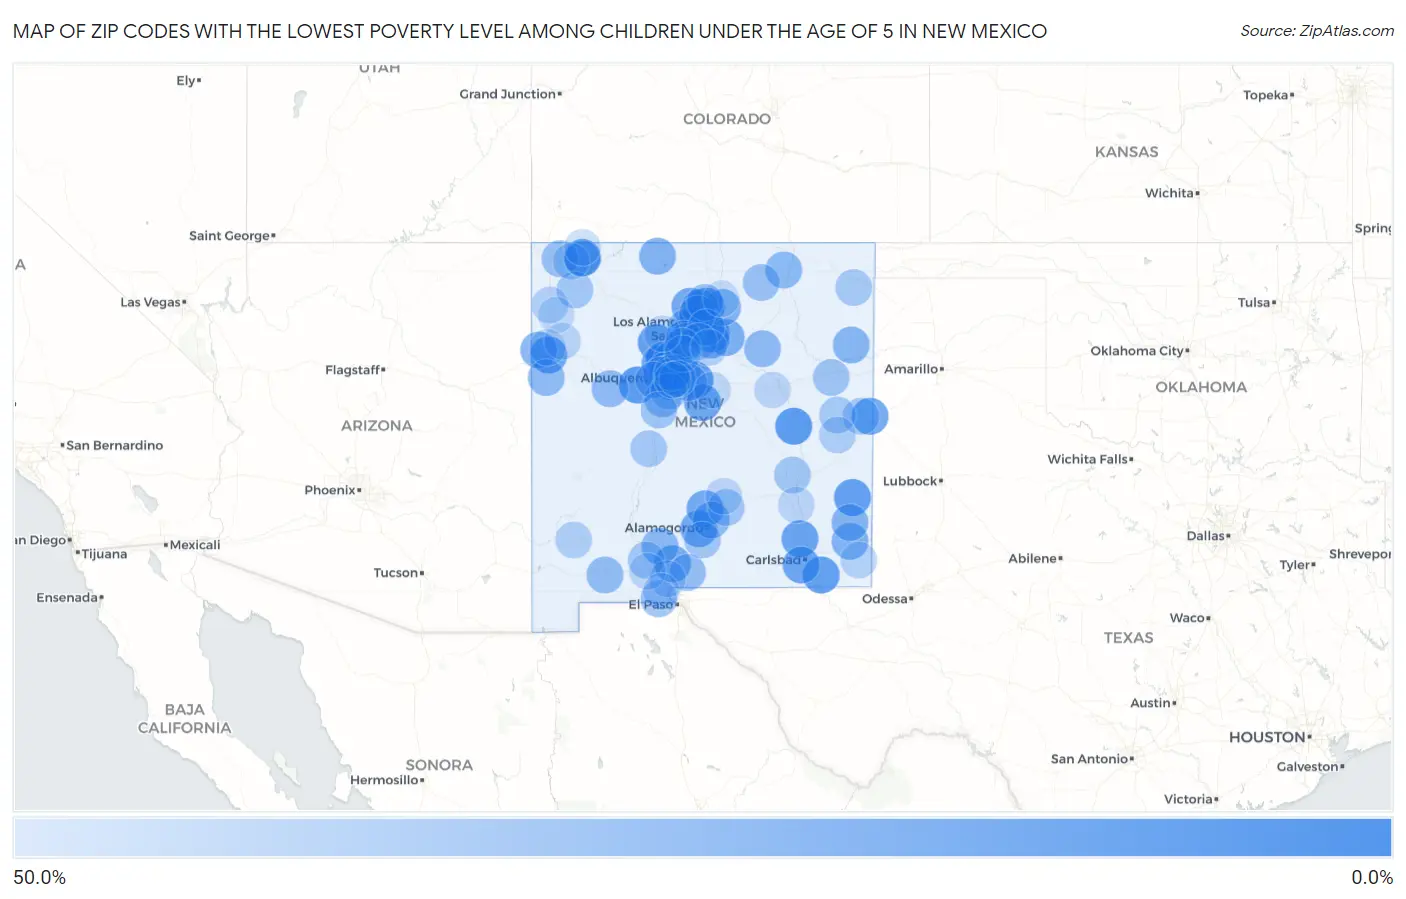
Map of Zip Codes with the Lowest Poverty Level Among Children Under the Age of 5 in New Mexico
50.0%
0.0%
Zip Codes with the Lowest Poverty Level Among Children Under the Age of 5 in New Mexico
| Zip Code | Child Poverty | vs State | vs National | |
| 1. | 87402 | 1.8% | 27.4%(-25.6)#1 | 18.1%(-16.3)#704 |
| 2. | 87104 | 1.9% | 27.4%(-25.5)#2 | 18.1%(-16.1)#777 |
| 3. | 87547 | 2.6% | 27.4%(-24.8)#3 | 18.1%(-15.5)#1,220 |
| 4. | 87026 | 3.5% | 27.4%(-23.8)#4 | 18.1%(-14.5)#1,841 |
| 5. | 88119 | 3.6% | 27.4%(-23.7)#5 | 18.1%(-14.4)#1,909 |
| 6. | 87015 | 4.9% | 27.4%(-22.5)#6 | 18.1%(-13.1)#2,854 |
| 7. | 87113 | 5.5% | 27.4%(-21.9)#7 | 18.1%(-12.6)#3,230 |
| 8. | 87511 | 5.6% | 27.4%(-21.8)#8 | 18.1%(-12.5)#3,281 |
| 9. | 87501 | 6.1% | 27.4%(-21.3)#9 | 18.1%(-12.0)#3,630 |
| 10. | 88267 | 6.1% | 27.4%(-21.3)#10 | 18.1%(-11.9)#3,683 |
| 11. | 88256 | 6.2% | 27.4%(-21.2)#11 | 18.1%(-11.8)#3,744 |
| 12. | 87048 | 6.8% | 27.4%(-20.6)#12 | 18.1%(-11.2)#4,165 |
| 13. | 87053 | 7.1% | 27.4%(-20.3)#13 | 18.1%(-11.0)#4,331 |
| 14. | 87112 | 7.7% | 27.4%(-19.7)#14 | 18.1%(-10.4)#4,712 |
| 15. | 87124 | 7.7% | 27.4%(-19.7)#15 | 18.1%(-10.4)#4,718 |
| 16. | 87305 | 7.9% | 27.4%(-19.4)#16 | 18.1%(-10.1)#4,875 |
| 17. | 88210 | 8.5% | 27.4%(-18.8)#17 | 18.1%(-9.53)#5,276 |
| 18. | 87144 | 9.0% | 27.4%(-18.4)#18 | 18.1%(-9.05)#5,624 |
| 19. | 88220 | 9.5% | 27.4%(-17.9)#19 | 18.1%(-8.60)#5,919 |
| 20. | 88135 | 9.8% | 27.4%(-17.6)#20 | 18.1%(-8.24)#6,148 |
| 21. | 87016 | 10.1% | 27.4%(-17.3)#21 | 18.1%(-7.99)#6,309 |
| 22. | 87537 | 11.5% | 27.4%(-15.9)#22 | 18.1%(-6.59)#7,131 |
| 23. | 88330 | 11.5% | 27.4%(-15.9)#23 | 18.1%(-6.54)#7,159 |
| 24. | 88352 | 12.2% | 27.4%(-15.2)#24 | 18.1%(-5.88)#7,562 |
| 25. | 87004 | 12.9% | 27.4%(-14.5)#25 | 18.1%(-5.21)#7,955 |
| 26. | 88011 | 13.0% | 27.4%(-14.4)#26 | 18.1%(-5.11)#8,010 |
| 27. | 87114 | 14.0% | 27.4%(-13.4)#27 | 18.1%(-4.05)#8,645 |
| 28. | 87106 | 14.3% | 27.4%(-13.0)#28 | 18.1%(-3.73)#8,867 |
| 29. | 87552 | 14.6% | 27.4%(-12.7)#29 | 18.1%(-3.43)#9,008 |
| 30. | 87505 | 15.7% | 27.4%(-11.7)#30 | 18.1%(-2.35)#9,600 |
| 31. | 87111 | 16.3% | 27.4%(-11.1)#31 | 18.1%(-1.77)#9,911 |
| 32. | 87528 | 16.9% | 27.4%(-10.5)#32 | 18.1%(-1.17)#10,201 |
| 33. | 87008 | 16.9% | 27.4%(-10.5)#33 | 18.1%(-1.14)#10,214 |
| 34. | 87544 | 17.7% | 27.4%(-9.64)#34 | 18.1%(-0.321)#10,587 |
| 35. | 87319 | 17.8% | 27.4%(-9.55)#35 | 18.1%(-0.233)#10,630 |
| 36. | 87521 | 18.2% | 27.4%(-9.20)#36 | 18.1%(+0.119)#10,808 |
| 37. | 88240 | 18.2% | 27.4%(-9.17)#37 | 18.1%(+0.147)#10,829 |
| 38. | 88260 | 18.3% | 27.4%(-9.04)#38 | 18.1%(+0.274)#10,874 |
| 39. | 87566 | 18.9% | 27.4%(-8.53)#39 | 18.1%(+0.790)#11,102 |
| 40. | 88426 | 19.2% | 27.4%(-8.15)#40 | 18.1%(+1.17)#11,280 |
| 41. | 88337 | 20.0% | 27.4%(-7.38)#41 | 18.1%(+1.94)#11,607 |
| 42. | 88012 | 20.2% | 27.4%(-7.17)#42 | 18.1%(+2.14)#11,737 |
| 43. | 87728 | 20.8% | 27.4%(-6.55)#43 | 18.1%(+2.77)#12,010 |
| 44. | 87059 | 20.9% | 27.4%(-6.50)#44 | 18.1%(+2.82)#12,031 |
| 45. | 87107 | 21.2% | 27.4%(-6.17)#45 | 18.1%(+3.15)#12,147 |
| 46. | 87532 | 21.5% | 27.4%(-5.88)#46 | 18.1%(+3.44)#12,286 |
| 47. | 87701 | 21.5% | 27.4%(-5.85)#47 | 18.1%(+3.47)#12,299 |
| 48. | 87034 | 22.3% | 27.4%(-5.09)#48 | 18.1%(+4.23)#12,620 |
| 49. | 87327 | 22.4% | 27.4%(-4.98)#49 | 18.1%(+4.34)#12,666 |
| 50. | 87120 | 22.5% | 27.4%(-4.89)#50 | 18.1%(+4.43)#12,706 |
| 51. | 87031 | 23.0% | 27.4%(-4.36)#51 | 18.1%(+4.96)#12,912 |
| 52. | 88030 | 23.2% | 27.4%(-4.19)#52 | 18.1%(+5.13)#12,985 |
| 53. | 87110 | 24.6% | 27.4%(-2.79)#53 | 18.1%(+6.53)#13,526 |
| 54. | 88081 | 24.7% | 27.4%(-2.63)#54 | 18.1%(+6.69)#13,571 |
| 55. | 87041 | 25.0% | 27.4%(-2.38)#55 | 18.1%(+6.94)#13,667 |
| 56. | 87121 | 25.2% | 27.4%(-2.18)#56 | 18.1%(+7.14)#13,750 |
| 57. | 88008 | 25.6% | 27.4%(-1.74)#57 | 18.1%(+7.58)#13,920 |
| 58. | 87421 | 25.7% | 27.4%(-1.66)#58 | 18.1%(+7.65)#13,934 |
| 59. | 87714 | 25.9% | 27.4%(-1.52)#59 | 18.1%(+7.80)#13,982 |
| 60. | 87582 | 25.9% | 27.4%(-1.48)#60 | 18.1%(+7.84)#13,999 |
| 61. | 87083 | 27.8% | 27.4%(+0.399)#61 | 18.1%(+9.71)#14,644 |
| 62. | 88401 | 28.0% | 27.4%(+0.603)#62 | 18.1%(+9.92)#14,703 |
| 63. | 87068 | 28.4% | 27.4%(+0.976)#63 | 18.1%(+10.3)#14,803 |
| 64. | 87002 | 28.6% | 27.4%(+1.24)#64 | 18.1%(+10.6)#14,912 |
| 65. | 87506 | 28.9% | 27.4%(+1.56)#65 | 18.1%(+10.9)#15,001 |
| 66. | 88310 | 29.0% | 27.4%(+1.67)#66 | 18.1%(+11.0)#15,043 |
| 67. | 88340 | 29.3% | 27.4%(+1.97)#67 | 18.1%(+11.3)#15,118 |
| 68. | 87109 | 29.4% | 27.4%(+1.99)#68 | 18.1%(+11.3)#15,125 |
| 69. | 87499 | 29.4% | 27.4%(+2.03)#69 | 18.1%(+11.3)#15,145 |
| 70. | 88007 | 29.8% | 27.4%(+2.39)#70 | 18.1%(+11.7)#15,249 |
| 71. | 88201 | 29.8% | 27.4%(+2.41)#71 | 18.1%(+11.7)#15,261 |
| 72. | 88101 | 29.8% | 27.4%(+2.45)#72 | 18.1%(+11.8)#15,280 |
| 73. | 87801 | 30.3% | 27.4%(+2.88)#73 | 18.1%(+12.2)#15,395 |
| 74. | 87507 | 30.4% | 27.4%(+3.01)#74 | 18.1%(+12.3)#15,428 |
| 75. | 88124 | 30.9% | 27.4%(+3.53)#75 | 18.1%(+12.8)#15,553 |
| 76. | 88415 | 30.9% | 27.4%(+3.54)#76 | 18.1%(+12.9)#15,556 |
| 77. | 87052 | 32.3% | 27.4%(+4.90)#77 | 18.1%(+14.2)#15,899 |
| 78. | 87417 | 32.3% | 27.4%(+4.93)#78 | 18.1%(+14.2)#15,906 |
| 79. | 87001 | 32.7% | 27.4%(+5.36)#79 | 18.1%(+14.7)#16,015 |
| 80. | 87123 | 33.1% | 27.4%(+5.69)#80 | 18.1%(+15.0)#16,096 |
| 81. | 88065 | 33.1% | 27.4%(+5.69)#81 | 18.1%(+15.0)#16,098 |
| 82. | 88118 | 33.3% | 27.4%(+5.95)#82 | 18.1%(+15.3)#16,233 |
| 83. | 88048 | 34.3% | 27.4%(+6.91)#83 | 18.1%(+16.2)#16,440 |
| 84. | 87508 | 34.6% | 27.4%(+7.21)#84 | 18.1%(+16.5)#16,510 |
| 85. | 87364 | 34.9% | 27.4%(+7.54)#85 | 18.1%(+16.9)#16,584 |
| 86. | 88231 | 35.5% | 27.4%(+8.09)#86 | 18.1%(+17.4)#16,713 |
| 87. | 87311 | 37.2% | 27.4%(+9.86)#87 | 18.1%(+19.2)#17,124 |
| 88. | 88345 | 37.9% | 27.4%(+10.6)#88 | 18.1%(+19.9)#17,251 |
| 89. | 88005 | 38.0% | 27.4%(+10.6)#89 | 18.1%(+19.9)#17,261 |
| 90. | 88230 | 38.1% | 27.4%(+10.7)#90 | 18.1%(+20.0)#17,287 |
| 91. | 88435 | 38.2% | 27.4%(+10.8)#91 | 18.1%(+20.2)#17,308 |
| 92. | 87116 | 38.6% | 27.4%(+11.3)#92 | 18.1%(+20.6)#17,400 |
| 93. | 88021 | 38.7% | 27.4%(+11.3)#93 | 18.1%(+20.6)#17,401 |
| 94. | 87401 | 39.0% | 27.4%(+11.6)#94 | 18.1%(+21.0)#17,461 |
| 95. | 87418 | 39.1% | 27.4%(+11.8)#95 | 18.1%(+21.1)#17,489 |
| 96. | 87035 | 39.3% | 27.4%(+11.9)#96 | 18.1%(+21.2)#17,522 |
| 97. | 87024 | 39.8% | 27.4%(+12.4)#97 | 18.1%(+21.7)#17,594 |
| 98. | 87325 | 40.0% | 27.4%(+12.6)#98 | 18.1%(+21.9)#17,637 |
| 99. | 87553 | 40.0% | 27.4%(+12.6)#99 | 18.1%(+21.9)#17,640 |
| 100. | 87301 | 40.2% | 27.4%(+12.8)#100 | 18.1%(+22.1)#17,685 |
Common Questions
What are the Top 10 Zip Codes with the Lowest Poverty Level Among Children Under the Age of 5 in New Mexico?
Top 10 Zip Codes with the Lowest Poverty Level Among Children Under the Age of 5 in New Mexico are:
What zip code has the Lowest Poverty Level Among Children Under the Age of 5 in New Mexico?
87402 has the Lowest Poverty Level Among Children Under the Age of 5 in New Mexico with 1.8%.
What is the Poverty Level Among Children Under the Age of 5 in the State of New Mexico?
Poverty Level Among Children Under the Age of 5 in New Mexico is 27.4%.
What is the Poverty Level Among Children Under the Age of 5 in the United States?
Poverty Level Among Children Under the Age of 5 in the United States is 18.1%.