Zip Codes with the Lowest Poverty Level Among Children Under the Age of 5 in Albuquerque, NM

RELATED REPORTS & OPTIONS

Lowest Poverty | Child 0-5
Population
Families and Households
Female Fertility
Female Fertility (Unmarried)
Race (Community Size)
Race (Percentage)
Ancestry (Community Size)
AfghanAfricanAlaskan AthabascanAmericanApacheArabArgentineanArmenianAustralianAustrianBasqueBelgianBhutaneseBlackfeetBolivianBrazilianBritishBulgarianBurmeseCajunCambodianCanadianCelticCentral AmericanCentral American IndianCherokeeCheyenneChickasawChileanChippewaChoctawColombianComancheCosta RicanCreeCreekCroatianCubanCzechCzechoslovakianDanishDominicanDutchEastern EuropeanEcuadorianEgyptianEnglishEstonianEthiopianEuropeanFilipinoFinnishFrenchFrench CanadianGermanGhanaianGreekGuamanian / ChamorroGuatemalanGuyaneseHaitianHonduranHopiHungarianIcelanderIndian (Asian)InupiatIranianIraqiIrishIroquoisIsraeliItalianJamaicanJapaneseJordanianKenyanKiowaKoreanLaotianLatvianLebaneseLiberianLithuanianLumbeeLuxembourgerMalaysianMalteseMexicanMexican American IndianMoroccanNative HawaiianNavajoNew ZealanderNicaraguanNigerianNorthern EuropeanNorwegianOsagePaiutePakistaniPalestinianPanamanianPennsylvania GermanPeruvianPimaPolishPortuguesePotawatomiPuebloPuerto RicanRomanianRussianSalvadoranSamoanScandinavianScotch-IrishScottishSeminoleSerbianShoshoneSiouxSlavicSlovakSloveneSouth AfricanSouth AmericanSouth American IndianSpaniardSpanishSpanish AmericanSpanish American IndianSri LankanSubsaharan AfricanSwedishSwissSyrianThaiTlingit-HaidaTohono O'OdhamTrinidadian and TobagonianTurkishUgandanUkrainianUteVenezuelanVietnameseWelshWest IndianYaquiYugoslavianYuman
Ancestry (Percentage)
AfghanAfricanAlaskan AthabascanAmericanApacheArabArgentineanArmenianAustralianAustrianBasqueBelgianBhutaneseBlackfeetBolivianBrazilianBritishBulgarianBurmeseCajunCambodianCanadianCelticCentral AmericanCentral American IndianCherokeeCheyenneChickasawChileanChippewaChoctawColombianComancheCosta RicanCreeCreekCroatianCubanCzechCzechoslovakianDanishDominicanDutchEastern EuropeanEcuadorianEgyptianEnglishEstonianEthiopianEuropeanFilipinoFinnishFrenchFrench CanadianGermanGhanaianGreekGuamanian / ChamorroGuatemalanGuyaneseHaitianHonduranHopiHungarianIcelanderIndian (Asian)InupiatIranianIraqiIrishIroquoisIsraeliItalianJamaicanJapaneseJordanianKenyanKiowaKoreanLaotianLatvianLebaneseLiberianLithuanianLumbeeLuxembourgerMalaysianMalteseMexicanMexican American IndianMoroccanNative HawaiianNavajoNew ZealanderNicaraguanNigerianNorthern EuropeanNorwegianOsagePaiutePakistaniPalestinianPanamanianPennsylvania GermanPeruvianPimaPolishPortuguesePotawatomiPuebloPuerto RicanRomanianRussianSalvadoranSamoanScandinavianScotch-IrishScottishSeminoleSerbianShoshoneSiouxSlavicSlovakSloveneSouth AfricanSouth AmericanSouth American IndianSpaniardSpanishSpanish AmericanSpanish American IndianSri LankanSubsaharan AfricanSwedishSwissSyrianThaiTlingit-HaidaTohono O'OdhamTrinidadian and TobagonianTurkishUgandanUkrainianUteVenezuelanVietnameseWelshWest IndianYaquiYugoslavianYuman
Immigrant Origin (Total)
AfghanistanAfricaArgentinaArmeniaAsiaAustraliaAustriaBangladeshBelgiumBoliviaBrazilBulgariaCambodiaCameroonCanadaCaribbeanCentral AmericaChileChinaColombiaCubaCzechoslovakiaDominican RepublicEastern AfricaEastern AsiaEastern EuropeEcuadorEgyptEl SalvadorEnglandEthiopiaEuropeFranceGermanyGhanaGreeceGuatemalaHaitiHondurasHong KongHungaryIndiaIndonesiaIranIraqIrelandIsraelItalyJamaicaJapanJordanKazakhstanKenyaKoreaLaosLatin AmericaLebanonLiberiaMalaysiaMexicoMiddle AfricaMoroccoNepalNetherlandsNicaraguaNigeriaNorthern AfricaNorthern EuropeNorwayOceaniaPakistanPanamaPeruPhilippinesPolandPortugalRomaniaRussiaSaudi ArabiaScotlandSerbiaSouth AfricaSouth AmericaSouth Central AsiaSouth Eastern AsiaSouthern EuropeSpainSri LankaSwedenSwitzerlandSyriaTaiwanThailandTrinidad and TobagoTurkeyUgandaUkraineUzbekistanVenezuelaVietnamWest IndiesWestern AfricaWestern AsiaWestern EuropeZaireZimbabwe
Immigrant Origin (Percentage)
AfghanistanAfricaArgentinaArmeniaAsiaAustraliaAustriaBangladeshBelgiumBoliviaBrazilBulgariaCambodiaCameroonCanadaCaribbeanCentral AmericaChileChinaColombiaCubaCzechoslovakiaDominican RepublicEastern AfricaEastern AsiaEastern EuropeEcuadorEgyptEl SalvadorEnglandEthiopiaEuropeFranceGermanyGhanaGreeceGuatemalaHaitiHondurasHong KongHungaryIndiaIndonesiaIranIraqIrelandIsraelItalyJamaicaJapanJordanKazakhstanKenyaKoreaLaosLatin AmericaLebanonLiberiaMalaysiaMexicoMiddle AfricaMoroccoNepalNetherlandsNicaraguaNigeriaNorthern AfricaNorthern EuropeNorwayOceaniaPakistanPanamaPeruPhilippinesPolandPortugalRomaniaRussiaSaudi ArabiaScotlandSerbiaSouth AfricaSouth AmericaSouth Central AsiaSouth Eastern AsiaSouthern EuropeSpainSri LankaSwedenSwitzerlandSyriaTaiwanThailandTrinidad and TobagoTurkeyUgandaUkraineUzbekistanVenezuelaVietnamWest IndiesWestern AfricaWestern AsiaWestern EuropeZaireZimbabwe
Income
Income (Families)
Income (Households)
Poverty
Poverty (Families)
Unemployment
Employment Occupations
Employment Industries
Employer Class
Commute Time
Commute Means
School Enrollment
Education by Degree Field
Occupancy
Finances
Physical Characteristics
Albuquerque
Compare Zip Codes
Comparison Subject

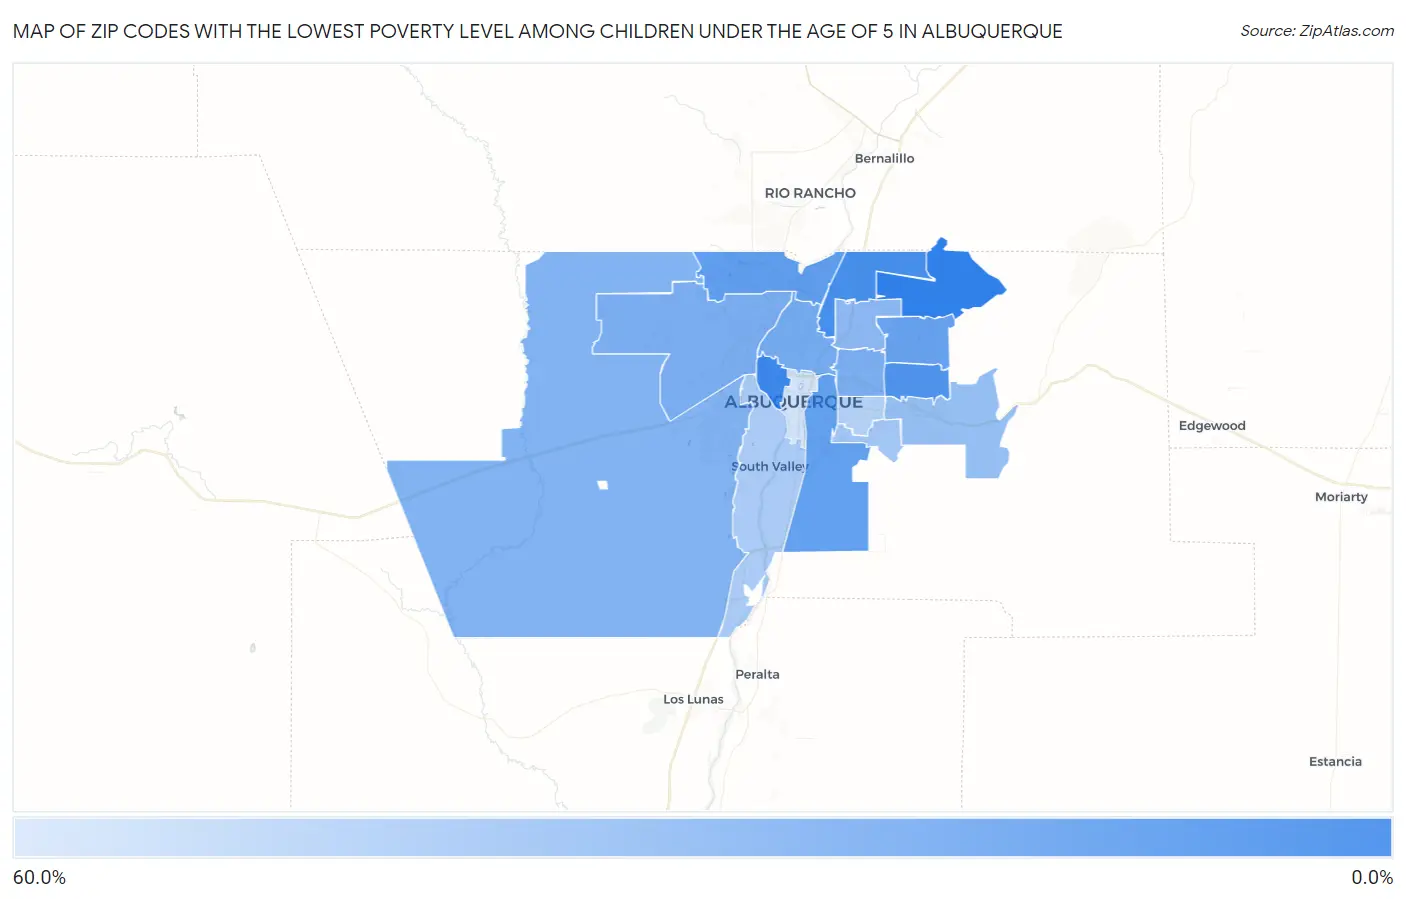
Map of Zip Codes with the Lowest Poverty Level Among Children Under the Age of 5 in Albuquerque

60.0%
0.0%
Zip Codes with the Lowest Poverty Level Among Children Under the Age of 5 in Albuquerque Map

Zip Codes with the Lowest Poverty Level Among Children Under the Age of 5 in Albuquerque, NM

Zip Code Child Poverty vs State vs National
1.871041.9%27.4%(-25.5)#218.1%(-16.1)#777
2.871135.5%27.4%(-21.9)#718.1%(-12.6)#3,230
3.871127.7%27.4%(-19.7)#1418.1%(-10.4)#4,712
4.8711414.0%27.4%(-13.4)#2718.1%(-4.05)#8,645
5.8710614.3%27.4%(-13.0)#2818.1%(-3.73)#8,867
6.8711116.3%27.4%(-11.1)#3118.1%(-1.77)#9,911
7.8710721.2%27.4%(-6.17)#4518.1%(+3.15)#12,147
8.8712022.5%27.4%(-4.89)#5018.1%(+4.43)#12,706
9.8711024.6%27.4%(-2.79)#5318.1%(+6.53)#13,526
10.8712125.2%27.4%(-2.18)#5618.1%(+7.14)#13,750
11.8710929.4%27.4%(+1.99)#6818.1%(+11.3)#15,125
12.8712333.1%27.4%(+5.69)#8018.1%(+15.0)#16,096
13.8711638.6%27.4%(+11.3)#9218.1%(+20.6)#17,400
14.8710541.7%27.4%(+14.3)#10818.1%(+23.6)#17,974
15.8710845.9%27.4%(+18.5)#11818.1%(+27.9)#18,614
16.8710258.8%27.4%(+31.4)#13018.1%(+40.7)#19,887

Common Questions

What are the Top 10 Zip Codes with the Lowest Poverty Level Among Children Under the Age of 5 in Albuquerque, NM?
Top 10 Zip Codes with the Lowest Poverty Level Among Children Under the Age of 5 in Albuquerque, NM are:
#1
0.0%
#2
1.9%
#3
5.5%
#4
7.7%
#5
14.0%
#6
14.3%
#7
16.3%
#8
21.2%
#9
22.5%
#10
24.6%
What zip code has the Lowest Poverty Level Among Children Under the Age of 5 in Albuquerque, NM?
87104 has the Lowest Poverty Level Among Children Under the Age of 5 in Albuquerque, NM with 1.9%.
What is the Poverty Level Among Children Under the Age of 5 in Albuquerque, NM?
Poverty Level Among Children Under the Age of 5 in Albuquerque is 24.7%.
What is the Poverty Level Among Children Under the Age of 5 in New Mexico?
Poverty Level Among Children Under the Age of 5 in New Mexico is 27.4%.
What is the Poverty Level Among Children Under the Age of 5 in the United States?
Poverty Level Among Children Under the Age of 5 in the United States is 18.1%.