Zip Codes with the Highest Percentage of Population Employed in Life, Physical & Social Science in North Carolina
RELATED REPORTS & OPTIONS
Life, Physical & Social Science
North Carolina
Compare Zip Codes
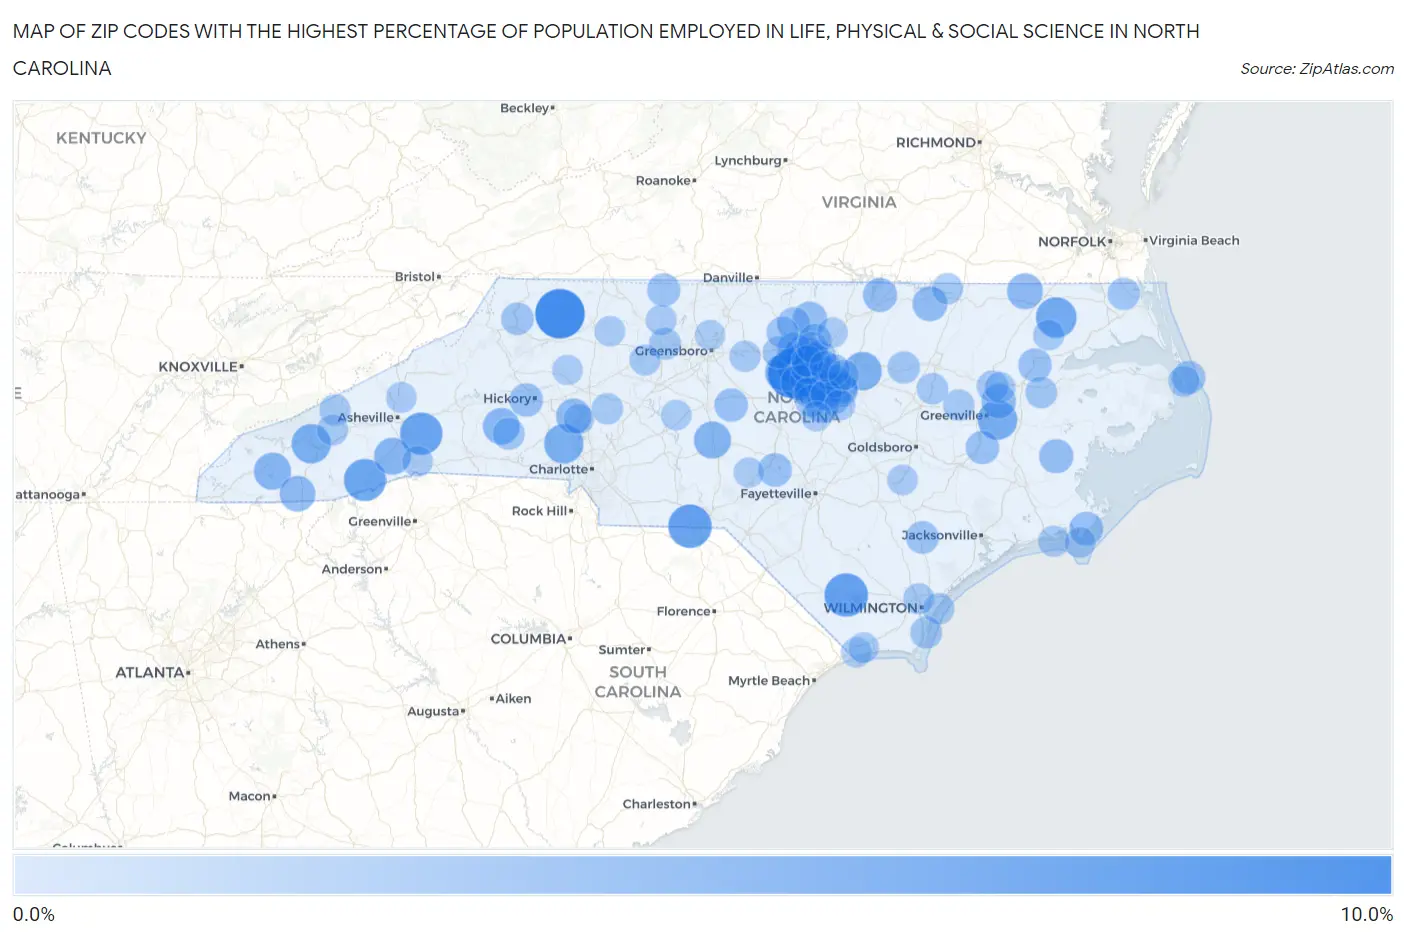
Map of Zip Codes with the Highest Percentage of Population Employed in Life, Physical & Social Science in North Carolina
0.0%
10.0%
Zip Codes with the Highest Percentage of Population Employed in Life, Physical & Social Science in North Carolina
| Zip Code | % Employed | vs State | vs National | |
| 1. | 28635 | 9.4% | 1.1%(+8.38)#1 | 1.1%(+8.35)#232 |
| 2. | 27510 | 9.2% | 1.1%(+8.16)#2 | 1.1%(+8.14)#243 |
| 3. | 28442 | 7.0% | 1.1%(+5.95)#3 | 1.1%(+5.93)#403 |
| 4. | 28102 | 7.0% | 1.1%(+5.91)#4 | 1.1%(+5.89)#412 |
| 5. | 28735 | 6.6% | 1.1%(+5.53)#5 | 1.1%(+5.50)#458 |
| 6. | 27514 | 6.5% | 1.1%(+5.44)#6 | 1.1%(+5.41)#473 |
| 7. | 28772 | 6.5% | 1.1%(+5.40)#7 | 1.1%(+5.37)#480 |
| 8. | 27942 | 5.9% | 1.1%(+4.82)#8 | 1.1%(+4.79)#559 |
| 9. | 27879 | 5.4% | 1.1%(+4.37)#9 | 1.1%(+4.34)#644 |
| 10. | 28006 | 5.3% | 1.1%(+4.28)#10 | 1.1%(+4.26)#668 |
| 11. | 28789 | 5.3% | 1.1%(+4.27)#11 | 1.1%(+4.24)#672 |
| 12. | 27705 | 5.3% | 1.1%(+4.24)#12 | 1.1%(+4.22)#684 |
| 13. | 27571 | 5.0% | 1.1%(+3.99)#13 | 1.1%(+3.96)#749 |
| 14. | 27519 | 5.0% | 1.1%(+3.91)#14 | 1.1%(+3.88)#770 |
| 15. | 27516 | 4.6% | 1.1%(+3.49)#15 | 1.1%(+3.47)#904 |
| 16. | 27356 | 4.5% | 1.1%(+3.44)#16 | 1.1%(+3.41)#927 |
| 17. | 28781 | 4.4% | 1.1%(+3.38)#17 | 1.1%(+3.35)#947 |
| 18. | 28729 | 4.4% | 1.1%(+3.38)#18 | 1.1%(+3.35)#949 |
| 19. | 28020 | 4.3% | 1.1%(+3.24)#19 | 1.1%(+3.22)#1,001 |
| 20. | 27713 | 4.3% | 1.1%(+3.20)#20 | 1.1%(+3.17)#1,021 |
| 21. | 27701 | 4.2% | 1.1%(+3.16)#21 | 1.1%(+3.13)#1,040 |
| 22. | 27818 | 4.0% | 1.1%(+2.94)#22 | 1.1%(+2.91)#1,152 |
| 23. | 27517 | 4.0% | 1.1%(+2.92)#23 | 1.1%(+2.89)#1,163 |
| 24. | 28763 | 3.9% | 1.1%(+2.87)#24 | 1.1%(+2.84)#1,197 |
| 25. | 28673 | 3.8% | 1.1%(+2.73)#25 | 1.1%(+2.70)#1,267 |
| 26. | 27850 | 3.6% | 1.1%(+2.54)#26 | 1.1%(+2.51)#1,366 |
| 27. | 27884 | 3.5% | 1.1%(+2.39)#27 | 1.1%(+2.37)#1,453 |
| 28. | 27583 | 3.4% | 1.1%(+2.34)#28 | 1.1%(+2.31)#1,499 |
| 29. | 27806 | 3.3% | 1.1%(+2.28)#29 | 1.1%(+2.26)#1,536 |
| 30. | 27553 | 3.3% | 1.1%(+2.25)#30 | 1.1%(+2.22)#1,567 |
| 31. | 27560 | 3.3% | 1.1%(+2.23)#31 | 1.1%(+2.21)#1,579 |
| 32. | 27513 | 3.3% | 1.1%(+2.21)#32 | 1.1%(+2.18)#1,609 |
| 33. | 28579 | 3.2% | 1.1%(+2.16)#33 | 1.1%(+2.13)#1,648 |
| 34. | 28394 | 3.1% | 1.1%(+2.06)#34 | 1.1%(+2.03)#1,733 |
| 35. | 28637 | 3.1% | 1.1%(+2.04)#35 | 1.1%(+2.01)#1,754 |
| 36. | 27605 | 3.1% | 1.1%(+2.00)#36 | 1.1%(+1.97)#1,799 |
| 37. | 28530 | 3.0% | 1.1%(+1.98)#37 | 1.1%(+1.95)#1,831 |
| 38. | 27983 | 3.0% | 1.1%(+1.97)#38 | 1.1%(+1.94)#1,836 |
| 39. | 27316 | 3.0% | 1.1%(+1.96)#39 | 1.1%(+1.93)#1,849 |
| 40. | 27707 | 3.0% | 1.1%(+1.90)#40 | 1.1%(+1.87)#1,922 |
| 41. | 27959 | 3.0% | 1.1%(+1.89)#41 | 1.1%(+1.86)#1,929 |
| 42. | 27541 | 3.0% | 1.1%(+1.89)#42 | 1.1%(+1.86)#1,932 |
| 43. | 27022 | 2.9% | 1.1%(+1.88)#43 | 1.1%(+1.86)#1,939 |
| 44. | 27278 | 2.9% | 1.1%(+1.85)#44 | 1.1%(+1.83)#1,979 |
| 45. | 27606 | 2.9% | 1.1%(+1.84)#45 | 1.1%(+1.81)#1,992 |
| 46. | 27539 | 2.9% | 1.1%(+1.83)#46 | 1.1%(+1.81)#1,998 |
| 47. | 27503 | 2.8% | 1.1%(+1.75)#47 | 1.1%(+1.73)#2,094 |
| 48. | 28466 | 2.8% | 1.1%(+1.73)#48 | 1.1%(+1.70)#2,123 |
| 49. | 27608 | 2.7% | 1.1%(+1.68)#49 | 1.1%(+1.65)#2,183 |
| 50. | 28626 | 2.7% | 1.1%(+1.63)#50 | 1.1%(+1.61)#2,252 |
| 51. | 27617 | 2.7% | 1.1%(+1.62)#51 | 1.1%(+1.59)#2,264 |
| 52. | 27882 | 2.7% | 1.1%(+1.59)#52 | 1.1%(+1.56)#2,311 |
| 53. | 27958 | 2.6% | 1.1%(+1.54)#53 | 1.1%(+1.51)#2,392 |
| 54. | 27704 | 2.6% | 1.1%(+1.54)#54 | 1.1%(+1.51)#2,396 |
| 55. | 27612 | 2.6% | 1.1%(+1.52)#55 | 1.1%(+1.49)#2,431 |
| 56. | 27243 | 2.6% | 1.1%(+1.50)#56 | 1.1%(+1.48)#2,450 |
| 57. | 27502 | 2.5% | 1.1%(+1.45)#57 | 1.1%(+1.42)#2,554 |
| 58. | 28090 | 2.5% | 1.1%(+1.43)#58 | 1.1%(+1.40)#2,585 |
| 59. | 27231 | 2.5% | 1.1%(+1.42)#59 | 1.1%(+1.39)#2,603 |
| 60. | 27523 | 2.5% | 1.1%(+1.41)#60 | 1.1%(+1.38)#2,618 |
| 61. | 27101 | 2.5% | 1.1%(+1.40)#61 | 1.1%(+1.38)#2,634 |
| 62. | 28428 | 2.5% | 1.1%(+1.40)#62 | 1.1%(+1.37)#2,640 |
| 63. | 27613 | 2.5% | 1.1%(+1.39)#63 | 1.1%(+1.36)#2,652 |
| 64. | 27708 | 2.4% | 1.1%(+1.35)#64 | 1.1%(+1.32)#2,738 |
| 65. | 27846 | 2.4% | 1.1%(+1.32)#65 | 1.1%(+1.29)#2,794 |
| 66. | 27861 | 2.3% | 1.1%(+1.26)#66 | 1.1%(+1.23)#2,896 |
| 67. | 27511 | 2.3% | 1.1%(+1.21)#67 | 1.1%(+1.19)#3,006 |
| 68. | 27822 | 2.3% | 1.1%(+1.20)#68 | 1.1%(+1.17)#3,037 |
| 69. | 28480 | 2.2% | 1.1%(+1.17)#69 | 1.1%(+1.14)#3,113 |
| 70. | 28125 | 2.2% | 1.1%(+1.15)#70 | 1.1%(+1.12)#3,142 |
| 71. | 27215 | 2.2% | 1.1%(+1.15)#71 | 1.1%(+1.12)#3,154 |
| 72. | 27712 | 2.2% | 1.1%(+1.14)#72 | 1.1%(+1.12)#3,162 |
| 73. | 28512 | 2.2% | 1.1%(+1.13)#73 | 1.1%(+1.11)#3,187 |
| 74. | 27832 | 2.2% | 1.1%(+1.13)#74 | 1.1%(+1.10)#3,203 |
| 75. | 27829 | 2.2% | 1.1%(+1.10)#75 | 1.1%(+1.07)#3,265 |
| 76. | 28785 | 2.1% | 1.1%(+1.08)#76 | 1.1%(+1.05)#3,315 |
| 77. | 27012 | 2.1% | 1.1%(+1.08)#77 | 1.1%(+1.05)#3,317 |
| 78. | 28751 | 2.1% | 1.1%(+1.05)#78 | 1.1%(+1.03)#3,381 |
| 79. | 27981 | 2.1% | 1.1%(+1.05)#79 | 1.1%(+1.02)#3,389 |
| 80. | 28401 | 2.1% | 1.1%(+1.05)#80 | 1.1%(+1.02)#3,392 |
| 81. | 27924 | 2.1% | 1.1%(+1.01)#81 | 1.1%(+0.985)#3,477 |
| 82. | 28531 | 2.1% | 1.1%(+1.01)#82 | 1.1%(+0.983)#3,483 |
| 83. | 27871 | 2.1% | 1.1%(+1.01)#83 | 1.1%(+0.983)#3,484 |
| 84. | 27019 | 2.1% | 1.1%(+1.00)#84 | 1.1%(+0.973)#3,504 |
| 85. | 27703 | 2.1% | 1.1%(+0.987)#85 | 1.1%(+0.960)#3,540 |
| 86. | 27603 | 2.0% | 1.1%(+0.972)#86 | 1.1%(+0.944)#3,586 |
| 87. | 28731 | 2.0% | 1.1%(+0.966)#87 | 1.1%(+0.938)#3,600 |
| 88. | 28787 | 2.0% | 1.1%(+0.961)#88 | 1.1%(+0.933)#3,615 |
| 89. | 28325 | 2.0% | 1.1%(+0.929)#89 | 1.1%(+0.901)#3,706 |
| 90. | 27615 | 1.9% | 1.1%(+0.846)#90 | 1.1%(+0.819)#3,944 |
| 91. | 27239 | 1.9% | 1.1%(+0.844)#91 | 1.1%(+0.817)#3,949 |
| 92. | 28468 | 1.9% | 1.1%(+0.842)#92 | 1.1%(+0.815)#3,957 |
| 93. | 27581 | 1.9% | 1.1%(+0.818)#93 | 1.1%(+0.790)#4,037 |
| 94. | 27011 | 1.9% | 1.1%(+0.816)#94 | 1.1%(+0.789)#4,041 |
| 95. | 28374 | 1.9% | 1.1%(+0.806)#95 | 1.1%(+0.779)#4,070 |
| 96. | 28682 | 1.9% | 1.1%(+0.806)#96 | 1.1%(+0.778)#4,071 |
| 97. | 28469 | 1.9% | 1.1%(+0.802)#97 | 1.1%(+0.775)#4,089 |
| 98. | 28636 | 1.9% | 1.1%(+0.796)#98 | 1.1%(+0.768)#4,113 |
| 99. | 27455 | 1.8% | 1.1%(+0.782)#99 | 1.1%(+0.754)#4,153 |
| 100. | 27540 | 1.8% | 1.1%(+0.773)#100 | 1.1%(+0.746)#4,188 |
Common Questions
What are the Top 10 Zip Codes with the Highest Percentage of Population Employed in Life, Physical & Social Science in North Carolina?
Top 10 Zip Codes with the Highest Percentage of Population Employed in Life, Physical & Social Science in North Carolina are:
What zip code has the Highest Percentage of Population Employed in Life, Physical & Social Science in North Carolina?
28635 has the Highest Percentage of Population Employed in Life, Physical & Social Science in North Carolina with 9.4%.
What is the Percentage of Population Employed in Life, Physical & Social Science in the State of North Carolina?
Percentage of Population Employed in Life, Physical & Social Science in North Carolina is 1.1%.
What is the Percentage of Population Employed in Life, Physical & Social Science in the United States?
Percentage of Population Employed in Life, Physical & Social Science in the United States is 1.1%.