Simpson, NC Map & Demographics
Simpson Map
Simpson Overview
$36,408
PER CAPITA INCOME
$66,250
AVG FAMILY INCOME
$57,500
AVG HOUSEHOLD INCOME
35.1%
WAGE / INCOME GAP [ % ]
64.9¢/ $1
WAGE / INCOME GAP [ $ ]
0.54
INEQUALITY / GINI INDEX
386
TOTAL POPULATION
187
MALE POPULATION
199
FEMALE POPULATION
93.97
MALES / 100 FEMALES
106.42
FEMALES / 100 MALES
48.2
MEDIAN AGE
2.6
AVG FAMILY SIZE
2.2
AVG HOUSEHOLD SIZE
175
LABOR FORCE [ PEOPLE ]
53.8%
PERCENT IN LABOR FORCE
10.3%
UNEMPLOYMENT RATE
Simpson Zip Codes
Simpson Area Codes
Income in Simpson
Income Overview in Simpson
Per Capita Income in Simpson is $36,408, while median incomes of families and households are $66,250 and $57,500 respectively.
| Characteristic | Number | Measure |
| Per Capita Income | 386 | $36,408 |
| Median Family Income | 120 | $66,250 |
| Mean Family Income | 120 | $80,826 |
| Median Household Income | 172 | $57,500 |
| Mean Household Income | 172 | $81,760 |
| Income Deficit | 120 | $0 |
| Wage / Income Gap (%) | 386 | 35.06% |
| Wage / Income Gap ($) | 386 | 64.94¢ per $1 |
| Gini / Inequality Index | 386 | 0.54 |
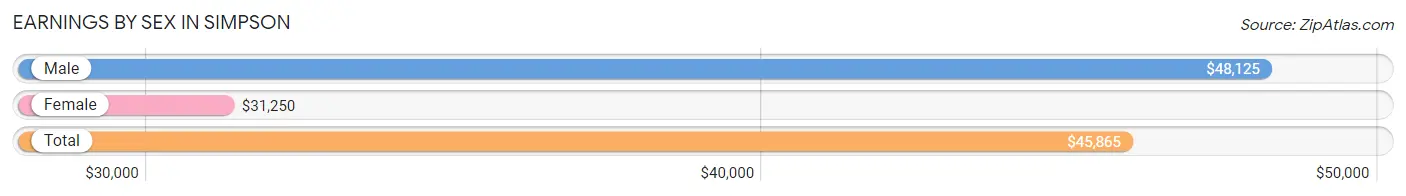
Earnings by Sex in Simpson
Average Earnings in Simpson are $45,865, $48,125 for men and $31,250 for women, a difference of 35.1%.
| Sex | Number | Average Earnings |
| Male | 95 (53.1%) | $48,125 |
| Female | 84 (46.9%) | $31,250 |
| Total | 179 (100.0%) | $45,865 |
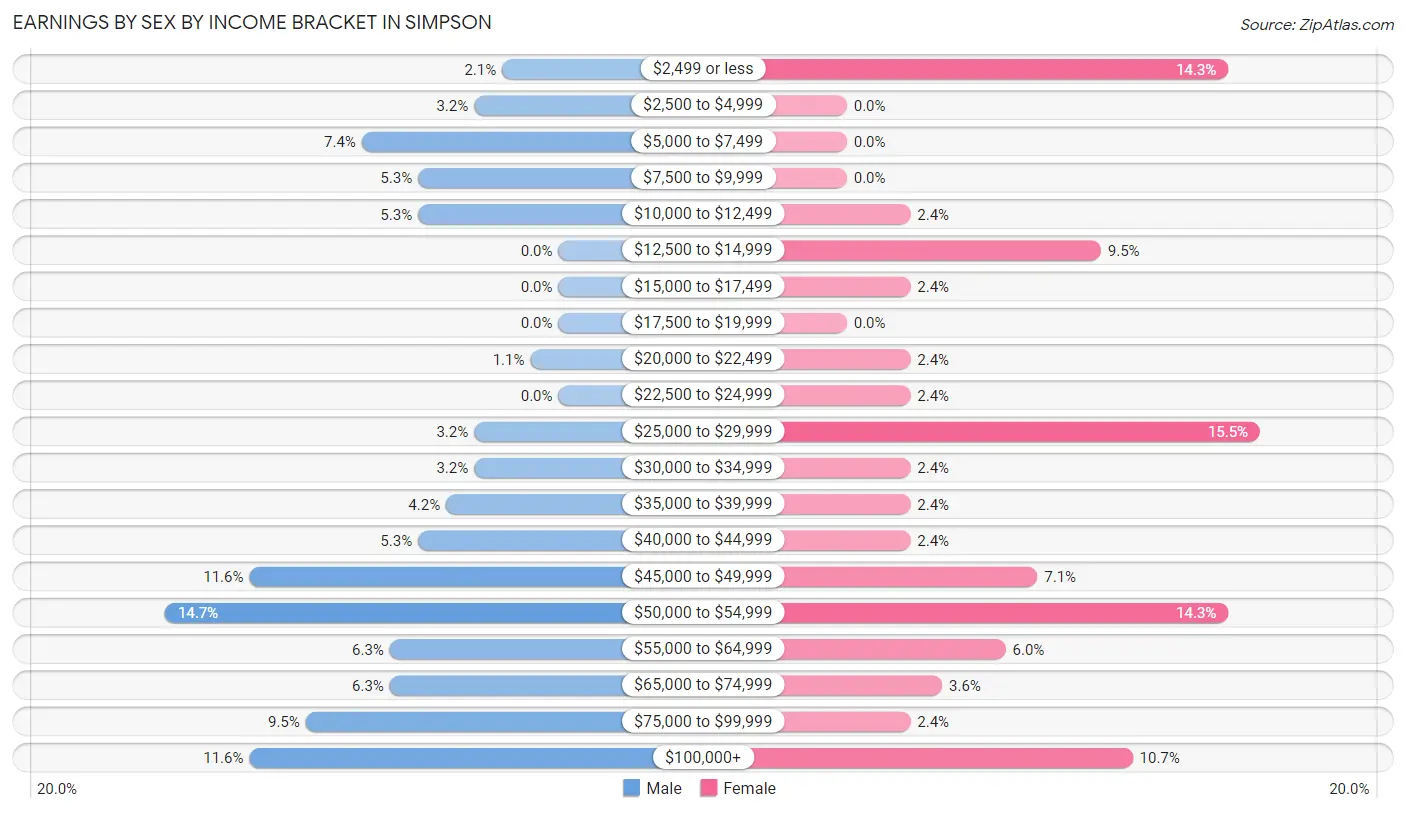
Earnings by Sex by Income Bracket in Simpson
The most common earnings brackets in Simpson are $50,000 to $54,999 for men (14 | 14.7%) and $25,000 to $29,999 for women (13 | 15.5%).
| Income | Male | Female |
| $2,499 or less | 2 (2.1%) | 12 (14.3%) |
| $2,500 to $4,999 | 3 (3.2%) | 0 (0.0%) |
| $5,000 to $7,499 | 7 (7.4%) | 0 (0.0%) |
| $7,500 to $9,999 | 5 (5.3%) | 0 (0.0%) |
| $10,000 to $12,499 | 5 (5.3%) | 2 (2.4%) |
| $12,500 to $14,999 | 0 (0.0%) | 8 (9.5%) |
| $15,000 to $17,499 | 0 (0.0%) | 2 (2.4%) |
| $17,500 to $19,999 | 0 (0.0%) | 0 (0.0%) |
| $20,000 to $22,499 | 1 (1.1%) | 2 (2.4%) |
| $22,500 to $24,999 | 0 (0.0%) | 2 (2.4%) |
| $25,000 to $29,999 | 3 (3.2%) | 13 (15.5%) |
| $30,000 to $34,999 | 3 (3.2%) | 2 (2.4%) |
| $35,000 to $39,999 | 4 (4.2%) | 2 (2.4%) |
| $40,000 to $44,999 | 5 (5.3%) | 2 (2.4%) |
| $45,000 to $49,999 | 11 (11.6%) | 6 (7.1%) |
| $50,000 to $54,999 | 14 (14.7%) | 12 (14.3%) |
| $55,000 to $64,999 | 6 (6.3%) | 5 (5.9%) |
| $65,000 to $74,999 | 6 (6.3%) | 3 (3.6%) |
| $75,000 to $99,999 | 9 (9.5%) | 2 (2.4%) |
| $100,000+ | 11 (11.6%) | 9 (10.7%) |
| Total | 95 (100.0%) | 84 (100.0%) |
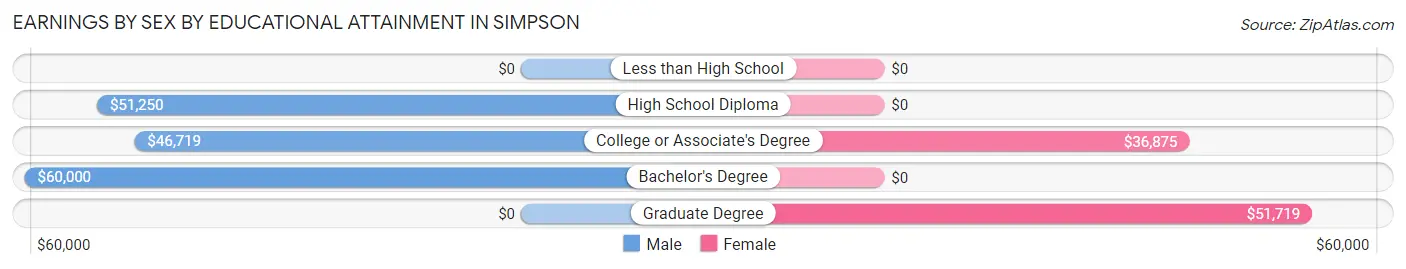
Earnings by Sex by Educational Attainment in Simpson
Average earnings in Simpson are $50,481 for men and $43,125 for women, a difference of 14.6%. Men with an educational attainment of bachelor's degree enjoy the highest average annual earnings of $60,000, while those with college or associate's degree education earn the least with $46,719. Women with an educational attainment of graduate degree earn the most with the average annual earnings of $51,719, while those with college or associate's degree education have the smallest earnings of $36,875.
| Educational Attainment | Male Income | Female Income |
| Less than High School | - | - |
| High School Diploma | $51,250 | $0 |
| College or Associate's Degree | $46,719 | $36,875 |
| Bachelor's Degree | $60,000 | $0 |
| Graduate Degree | - | - |
| Total | $50,481 | $43,125 |
Family Income in Simpson
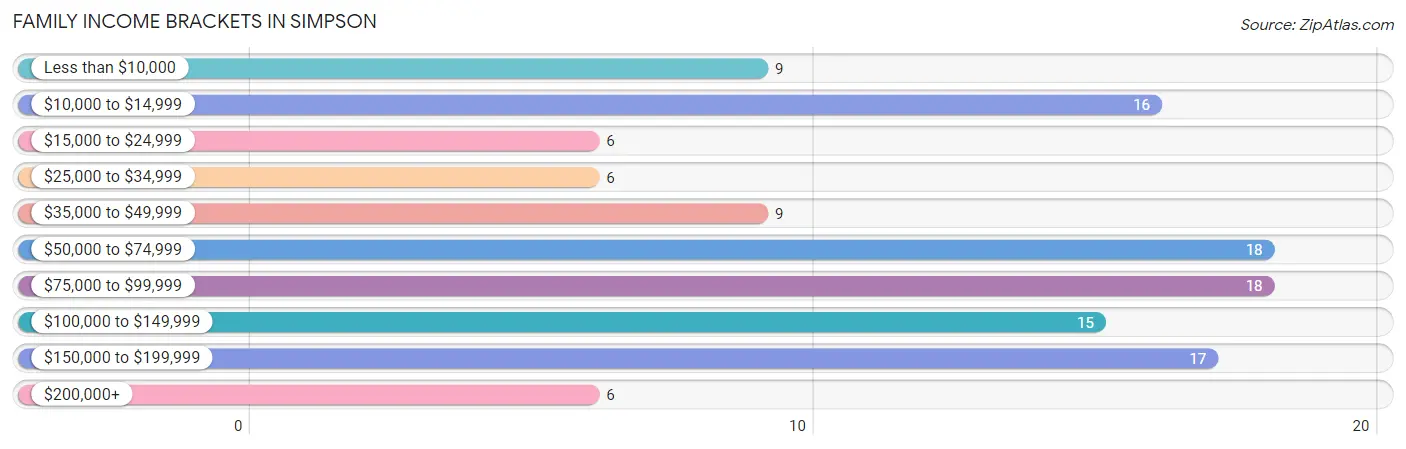
Family Income Brackets in Simpson
According to the Simpson family income data, there are 18 families falling into the $50,000 to $74,999 income range, which is the most common income bracket and makes up 15.0% of all families. Conversely, the $15,000 to $24,999 income bracket is the least frequent group with only 6 families (5.0%) belonging to this category.
| Income Bracket | # Families | % Families |
| Less than $10,000 | 9 | 7.5% |
| $10,000 to $14,999 | 16 | 13.3% |
| $15,000 to $24,999 | 6 | 5.0% |
| $25,000 to $34,999 | 6 | 5.0% |
| $35,000 to $49,999 | 9 | 7.5% |
| $50,000 to $74,999 | 18 | 15.0% |
| $75,000 to $99,999 | 18 | 15.0% |
| $100,000 to $149,999 | 15 | 12.5% |
| $150,000 to $199,999 | 17 | 14.2% |
| $200,000+ | 6 | 5.0% |
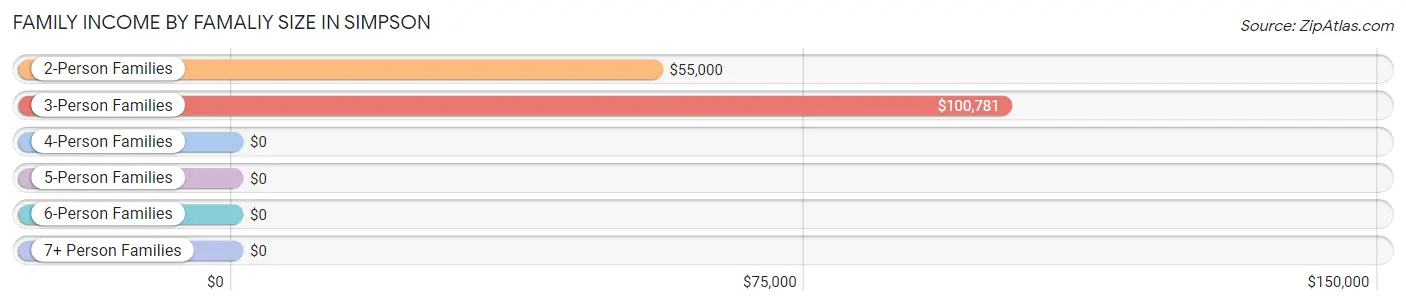
Family Income by Famaliy Size in Simpson
3-person families (27 | 22.5%) account for the highest median family income in Simpson with $100,781 per family, while 3-person families (27 | 22.5%) have the highest median income of $33,594 per family member.
| Income Bracket | # Families | Median Income |
| 2-Person Families | 66 (55.0%) | $55,000 |
| 3-Person Families | 27 (22.5%) | $100,781 |
| 4-Person Families | 15 (12.5%) | $0 |
| 5-Person Families | 12 (10.0%) | $0 |
| 6-Person Families | 0 (0.0%) | $0 |
| 7+ Person Families | 0 (0.0%) | $0 |
| Total | 120 (100.0%) | $66,250 |
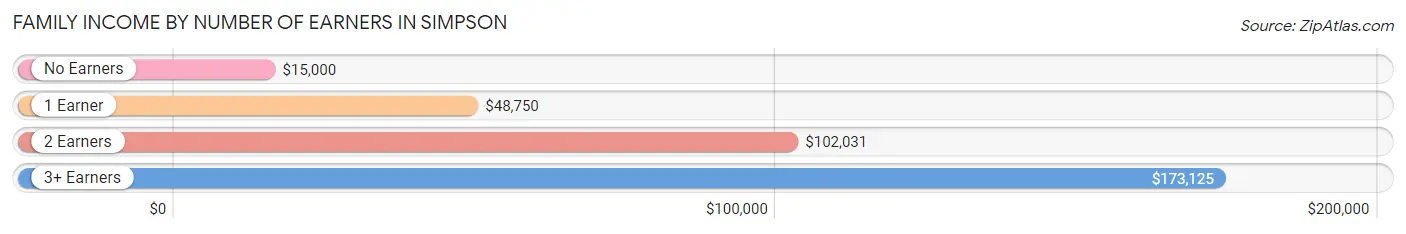
Family Income by Number of Earners in Simpson
The median family income in Simpson is $66,250, with families comprising 3+ earners (5) having the highest median family income of $173,125, while families with no earners (40) have the lowest median family income of $15,000, accounting for 4.2% and 33.3% of families, respectively.
| Number of Earners | # Families | Median Income |
| No Earners | 40 (33.3%) | $15,000 |
| 1 Earner | 28 (23.3%) | $48,750 |
| 2 Earners | 47 (39.2%) | $102,031 |
| 3+ Earners | 5 (4.2%) | $173,125 |
| Total | 120 (100.0%) | $66,250 |
Household Income in Simpson
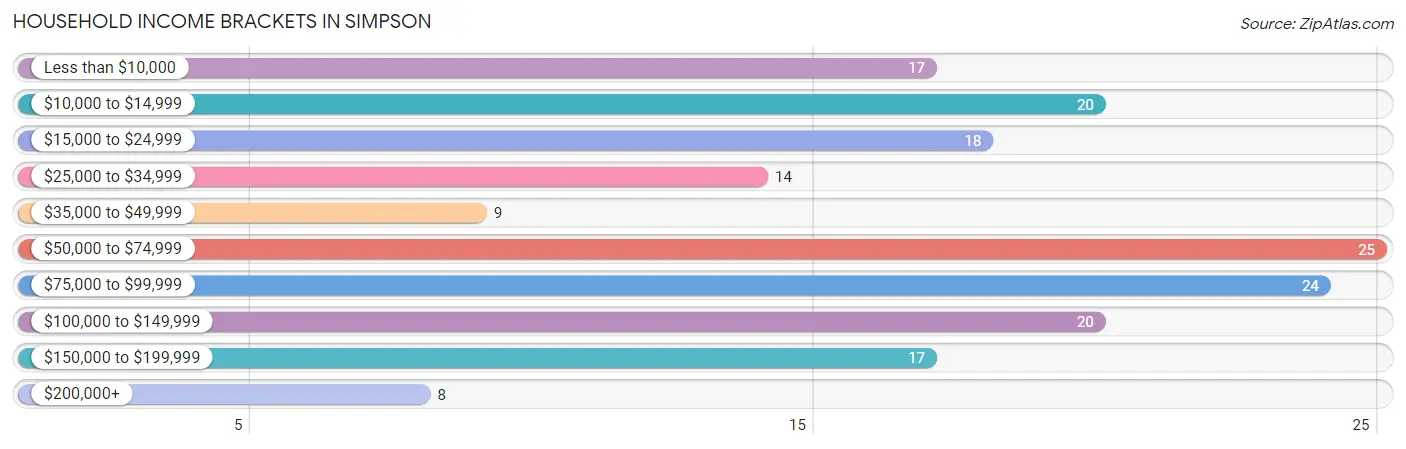
Household Income Brackets in Simpson
With 25 households falling in the category, the $50,000 to $74,999 income range is the most frequent in Simpson, accounting for 14.5% of all households. In contrast, only 8 households (4.6%) fall into the $200,000+ income bracket, making it the least populous group.
| Income Bracket | # Households | % Households |
| Less than $10,000 | 17 | 9.9% |
| $10,000 to $14,999 | 20 | 11.6% |
| $15,000 to $24,999 | 18 | 10.5% |
| $25,000 to $34,999 | 14 | 8.1% |
| $35,000 to $49,999 | 9 | 5.2% |
| $50,000 to $74,999 | 25 | 14.5% |
| $75,000 to $99,999 | 24 | 14.0% |
| $100,000 to $149,999 | 20 | 11.6% |
| $150,000 to $199,999 | 17 | 9.9% |
| $200,000+ | 8 | 4.7% |
Household Income by Householder Age in Simpson
The median household income in Simpson is $57,500, with the highest median household income of $102,500 found in the 45 to 64 years age bracket for the primary householder. A total of 46 households (26.7%) fall into this category. Meanwhile, the 15 to 24 years age bracket for the primary householder has the lowest median household income of $0, with 5 households (2.9%) in this group.
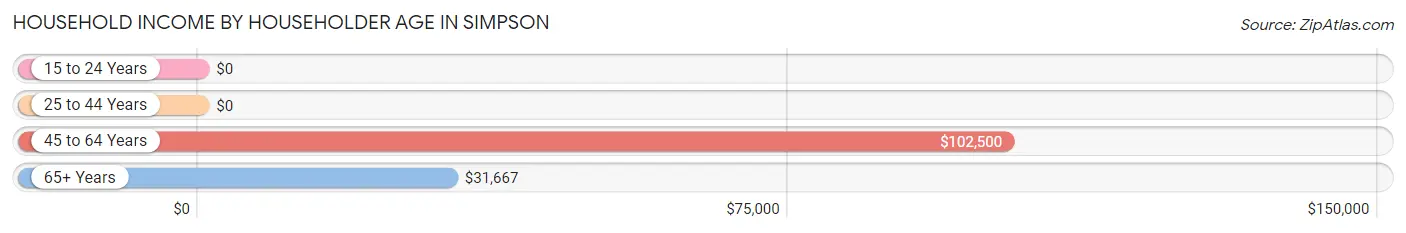
| Income Bracket | # Households | Median Income |
| 15 to 24 Years | 5 (2.9%) | $0 |
| 25 to 44 Years | 47 (27.3%) | $0 |
| 45 to 64 Years | 46 (26.7%) | $102,500 |
| 65+ Years | 74 (43.0%) | $31,667 |
| Total | 172 (100.0%) | $57,500 |
Poverty in Simpson
Income Below Poverty by Sex and Age in Simpson
With 24.6% poverty level for males and 28.9% for females among the residents of Simpson, 12 to 14 year old males and 12 to 14 year old females are the most vulnerable to poverty, with 2 males (100.0%) and 8 females (100.0%) in their respective age groups living below the poverty level.
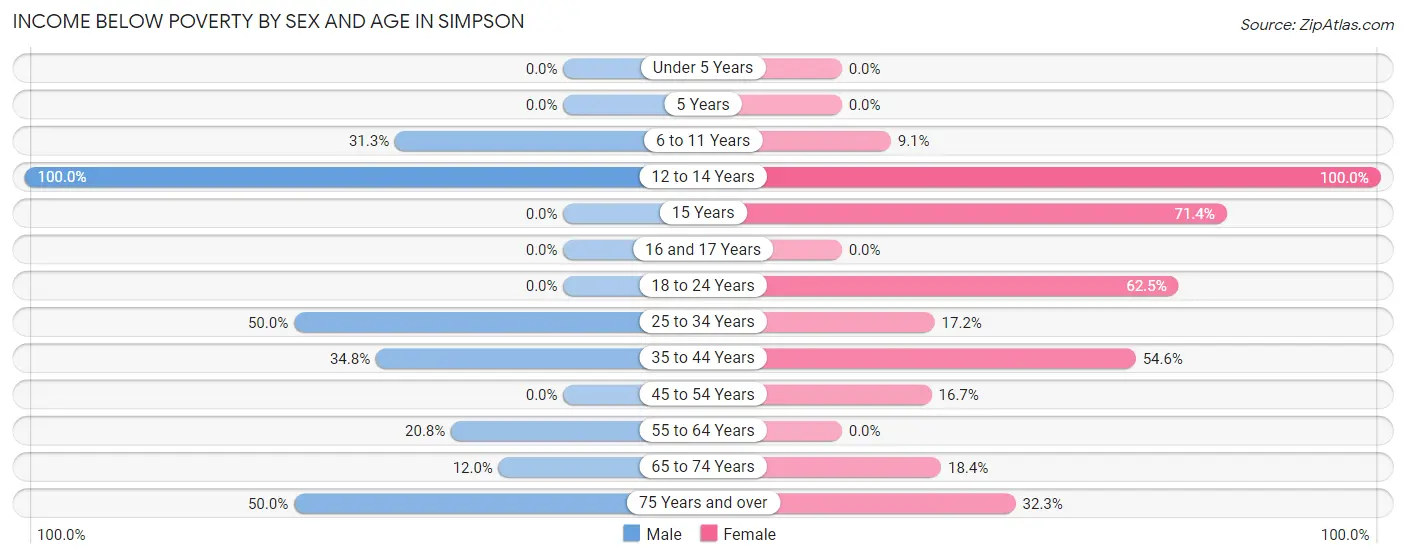
| Age Bracket | Male | Female |
| Under 5 Years | 0 (0.0%) | 0 (0.0%) |
| 5 Years | 0 (0.0%) | 0 (0.0%) |
| 6 to 11 Years | 5 (31.2%) | 1 (9.1%) |
| 12 to 14 Years | 2 (100.0%) | 8 (100.0%) |
| 15 Years | 0 (0.0%) | 5 (71.4%) |
| 16 and 17 Years | 0 (0.0%) | 0 (0.0%) |
| 18 to 24 Years | 0 (0.0%) | 5 (62.5%) |
| 25 to 34 Years | 11 (50.0%) | 5 (17.2%) |
| 35 to 44 Years | 8 (34.8%) | 12 (54.5%) |
| 45 to 54 Years | 0 (0.0%) | 4 (16.7%) |
| 55 to 64 Years | 5 (20.8%) | 0 (0.0%) |
| 65 to 74 Years | 3 (12.0%) | 7 (18.4%) |
| 75 Years and over | 12 (50.0%) | 10 (32.3%) |
| Total | 46 (24.6%) | 57 (28.9%) |
Income Above Poverty by Sex and Age in Simpson
According to the poverty statistics in Simpson, males aged under 5 years and females aged under 5 years are the age groups that are most secure financially, with 100.0% of males and 100.0% of females in these age groups living above the poverty line.
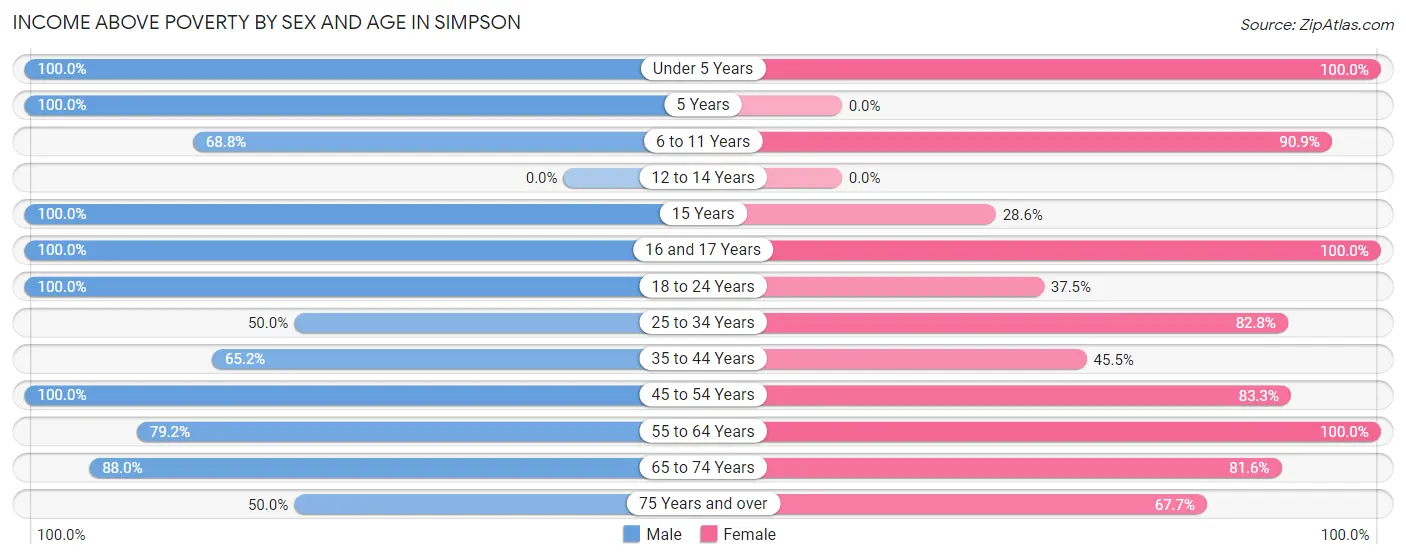
| Age Bracket | Male | Female |
| Under 5 Years | 7 (100.0%) | 3 (100.0%) |
| 5 Years | 3 (100.0%) | 0 (0.0%) |
| 6 to 11 Years | 11 (68.8%) | 10 (90.9%) |
| 12 to 14 Years | 0 (0.0%) | 0 (0.0%) |
| 15 Years | 2 (100.0%) | 2 (28.6%) |
| 16 and 17 Years | 6 (100.0%) | 2 (100.0%) |
| 18 to 24 Years | 11 (100.0%) | 3 (37.5%) |
| 25 to 34 Years | 11 (50.0%) | 24 (82.8%) |
| 35 to 44 Years | 15 (65.2%) | 10 (45.5%) |
| 45 to 54 Years | 22 (100.0%) | 20 (83.3%) |
| 55 to 64 Years | 19 (79.2%) | 14 (100.0%) |
| 65 to 74 Years | 22 (88.0%) | 31 (81.6%) |
| 75 Years and over | 12 (50.0%) | 21 (67.7%) |
| Total | 141 (75.4%) | 140 (71.1%) |
Income Below Poverty Among Married-Couple Families in Simpson
The poverty statistics for married-couple families in Simpson show that 24.5% or 26 of the total 106 families live below the poverty line. Families with 3 or 4 children have the highest poverty rate of 62.5%, comprising of 5 families. On the other hand, families with 1 or 2 children have the lowest poverty rate of 4.0%, which includes 1 families.
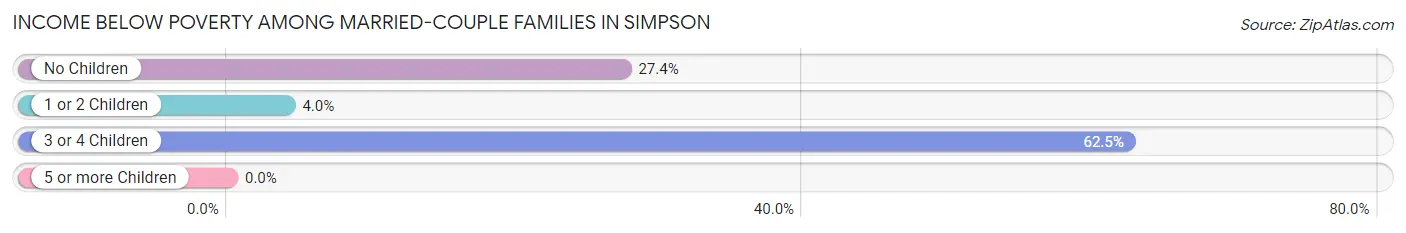
| Children | Above Poverty | Below Poverty |
| No Children | 53 (72.6%) | 20 (27.4%) |
| 1 or 2 Children | 24 (96.0%) | 1 (4.0%) |
| 3 or 4 Children | 3 (37.5%) | 5 (62.5%) |
| 5 or more Children | 0 (0.0%) | 0 (0.0%) |
| Total | 80 (75.5%) | 26 (24.5%) |
Income Below Poverty Among Single-Parent Households in Simpson
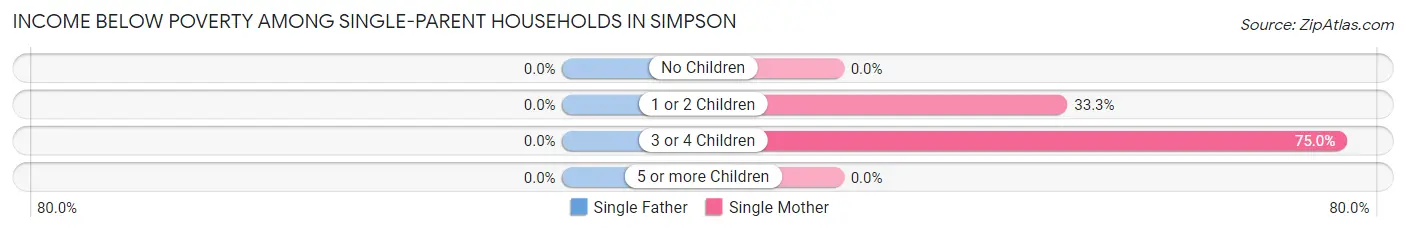
| Children | Single Father | Single Mother |
| No Children | 0 (0.0%) | 0 (0.0%) |
| 1 or 2 Children | 0 (0.0%) | 2 (33.3%) |
| 3 or 4 Children | 0 (0.0%) | 3 (75.0%) |
| 5 or more Children | 0 (0.0%) | 0 (0.0%) |
| Total | 0 (0.0%) | 5 (41.7%) |
Income Below Poverty Among Married-Couple vs Single-Parent Households in Simpson
The poverty data for Simpson shows that 26 of the married-couple family households (24.5%) and 5 of the single-parent households (35.7%) are living below the poverty level. Within the married-couple family households, those with 3 or 4 children have the highest poverty rate, with 5 households (62.5%) falling below the poverty line. Among the single-parent households, those with 3 or 4 children have the highest poverty rate, with 3 household (75.0%) living below poverty.
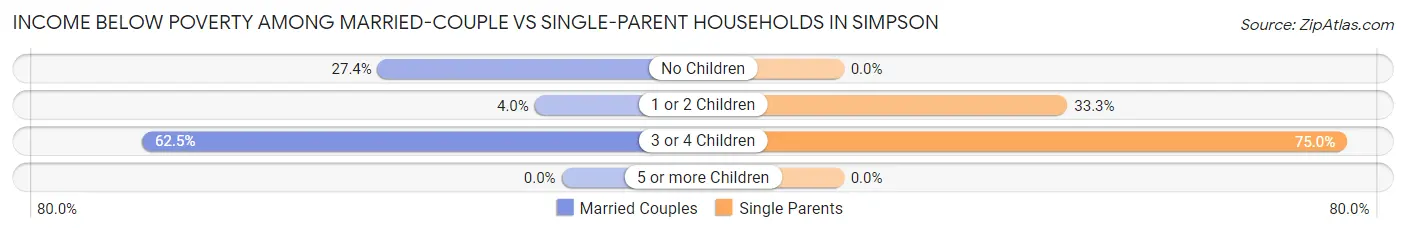
| Children | Married-Couple Families | Single-Parent Households |
| No Children | 20 (27.4%) | 0 (0.0%) |
| 1 or 2 Children | 1 (4.0%) | 2 (33.3%) |
| 3 or 4 Children | 5 (62.5%) | 3 (75.0%) |
| 5 or more Children | 0 (0.0%) | 0 (0.0%) |
| Total | 26 (24.5%) | 5 (35.7%) |
Race in Simpson
The most populous races in Simpson are White / Caucasian (239 | 61.9%), Black / African American (115 | 29.8%), and Two or more Races (23 | 6.0%).
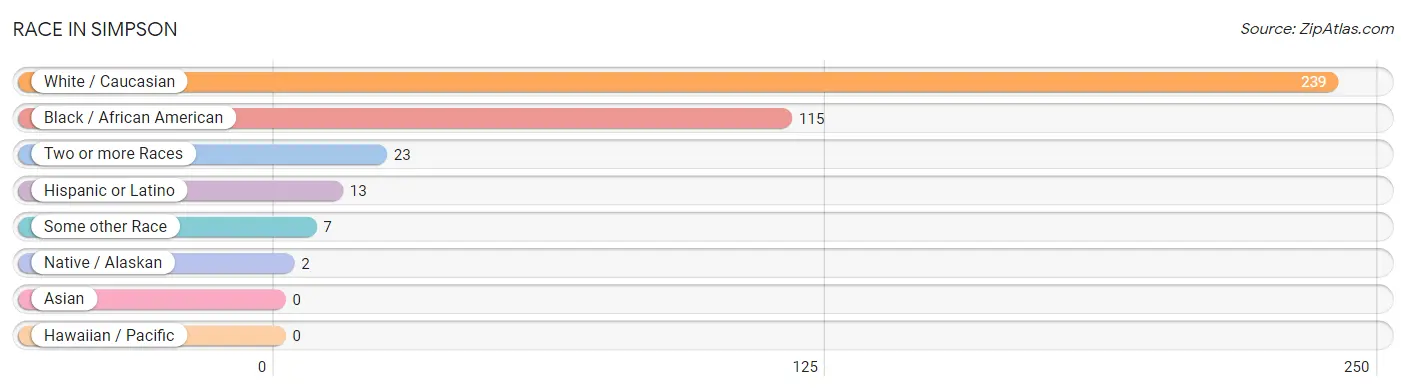
| Race | # Population | % Population |
| Asian | 0 | 0.0% |
| Black / African American | 115 | 29.8% |
| Hawaiian / Pacific | 0 | 0.0% |
| Hispanic or Latino | 13 | 3.4% |
| Native / Alaskan | 2 | 0.5% |
| White / Caucasian | 239 | 61.9% |
| Two or more Races | 23 | 6.0% |
| Some other Race | 7 | 1.8% |
| Total | 386 | 100.0% |
Ancestry in Simpson
The most populous ancestries reported in Simpson are Irish (49 | 12.7%), English (46 | 11.9%), German (31 | 8.0%), American (29 | 7.5%), and European (11 | 2.9%), together accounting for 43.0% of all Simpson residents.
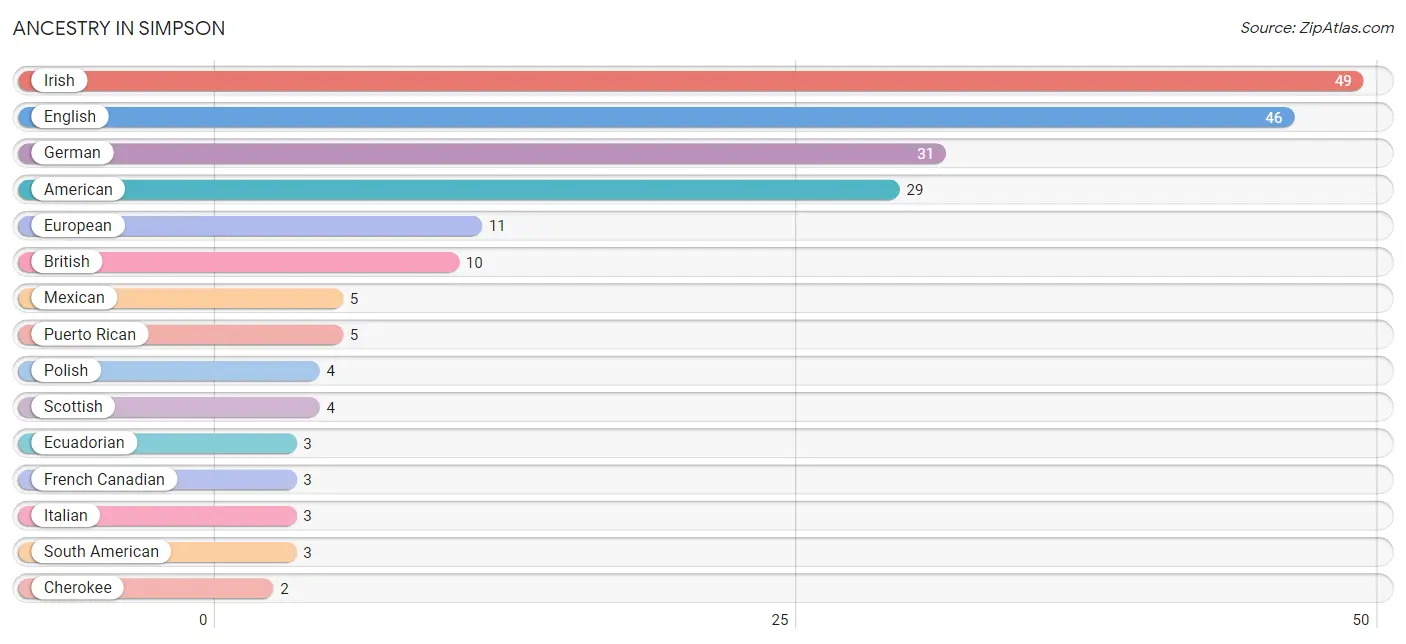
| Ancestry | # Population | % Population |
| American | 29 | 7.5% |
| British | 10 | 2.6% |
| Cherokee | 2 | 0.5% |
| Eastern European | 1 | 0.3% |
| Ecuadorian | 3 | 0.8% |
| English | 46 | 11.9% |
| European | 11 | 2.9% |
| Finnish | 1 | 0.3% |
| French | 1 | 0.3% |
| French Canadian | 3 | 0.8% |
| German | 31 | 8.0% |
| Hungarian | 2 | 0.5% |
| Irish | 49 | 12.7% |
| Italian | 3 | 0.8% |
| Mexican | 5 | 1.3% |
| Polish | 4 | 1.0% |
| Puerto Rican | 5 | 1.3% |
| Scotch-Irish | 2 | 0.5% |
| Scottish | 4 | 1.0% |
| South American | 3 | 0.8% | View All 20 Rows |
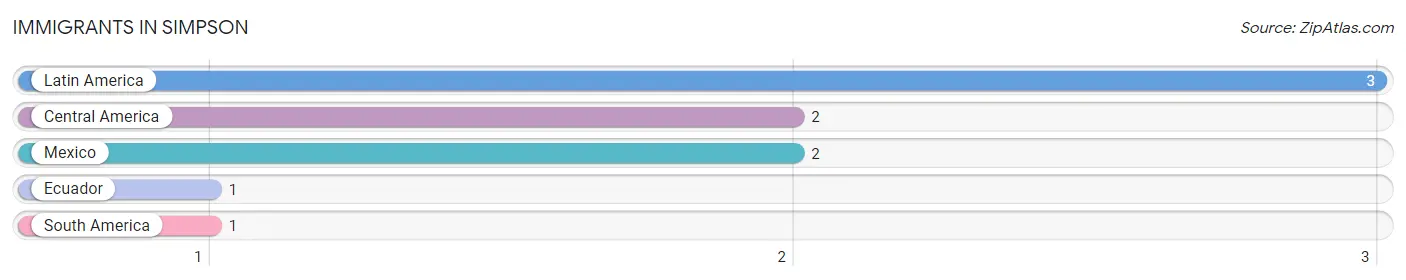
Immigrants in Simpson
The most numerous immigrant groups reported in Simpson came from Latin America (3 | 0.8%), Central America (2 | 0.5%), Mexico (2 | 0.5%), Ecuador (1 | 0.3%), and South America (1 | 0.3%), together accounting for 2.3% of all Simpson residents.
| Immigration Origin | # Population | % Population |
| Central America | 2 | 0.5% |
| Ecuador | 1 | 0.3% |
| Latin America | 3 | 0.8% |
| Mexico | 2 | 0.5% |
| South America | 1 | 0.3% | View All 5 Rows |
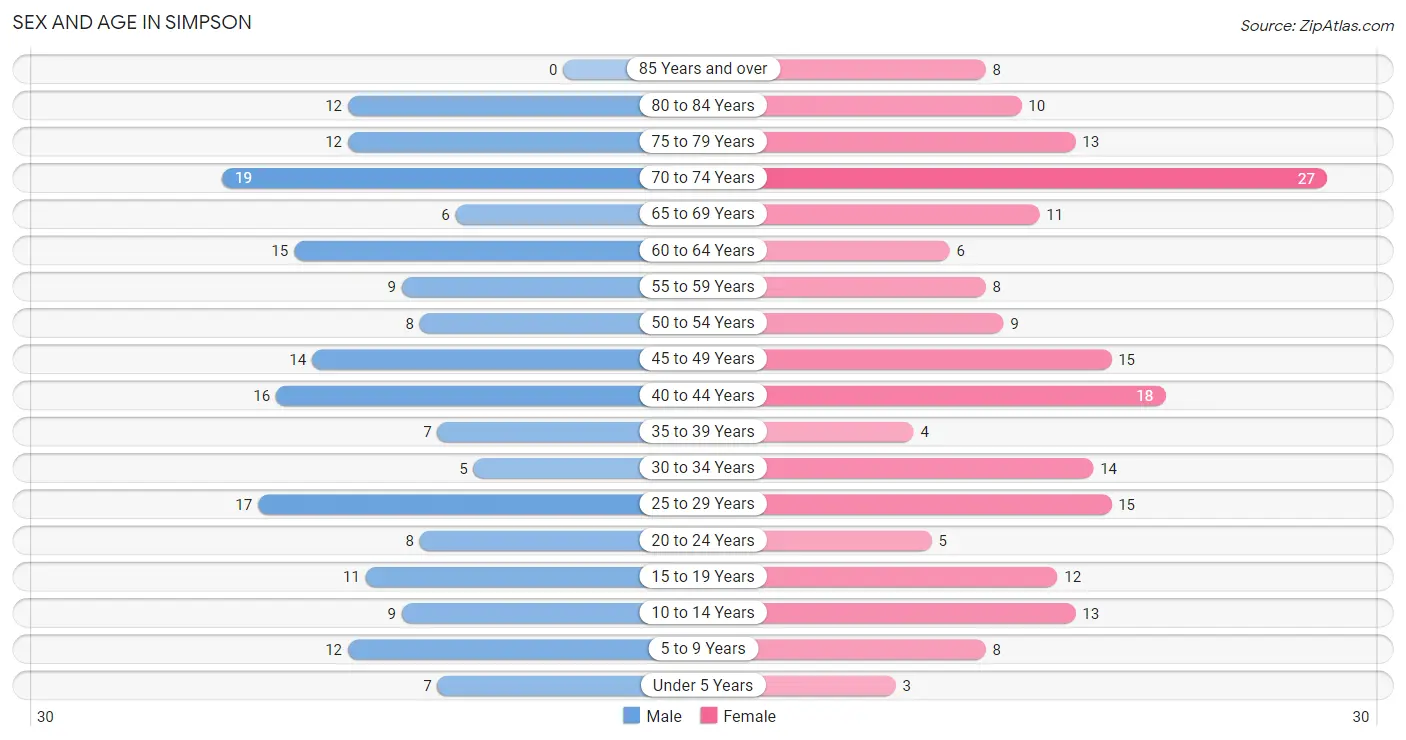
Sex and Age in Simpson
Sex and Age in Simpson
The most populous age groups in Simpson are 70 to 74 Years (19 | 10.2%) for men and 70 to 74 Years (27 | 13.6%) for women.
| Age Bracket | Male | Female |
| Under 5 Years | 7 (3.7%) | 3 (1.5%) |
| 5 to 9 Years | 12 (6.4%) | 8 (4.0%) |
| 10 to 14 Years | 9 (4.8%) | 13 (6.5%) |
| 15 to 19 Years | 11 (5.9%) | 12 (6.0%) |
| 20 to 24 Years | 8 (4.3%) | 5 (2.5%) |
| 25 to 29 Years | 17 (9.1%) | 15 (7.5%) |
| 30 to 34 Years | 5 (2.7%) | 14 (7.0%) |
| 35 to 39 Years | 7 (3.7%) | 4 (2.0%) |
| 40 to 44 Years | 16 (8.6%) | 18 (9.0%) |
| 45 to 49 Years | 14 (7.5%) | 15 (7.5%) |
| 50 to 54 Years | 8 (4.3%) | 9 (4.5%) |
| 55 to 59 Years | 9 (4.8%) | 8 (4.0%) |
| 60 to 64 Years | 15 (8.0%) | 6 (3.0%) |
| 65 to 69 Years | 6 (3.2%) | 11 (5.5%) |
| 70 to 74 Years | 19 (10.2%) | 27 (13.6%) |
| 75 to 79 Years | 12 (6.4%) | 13 (6.5%) |
| 80 to 84 Years | 12 (6.4%) | 10 (5.0%) |
| 85 Years and over | 0 (0.0%) | 8 (4.0%) |
| Total | 187 (100.0%) | 199 (100.0%) |
Families and Households in Simpson
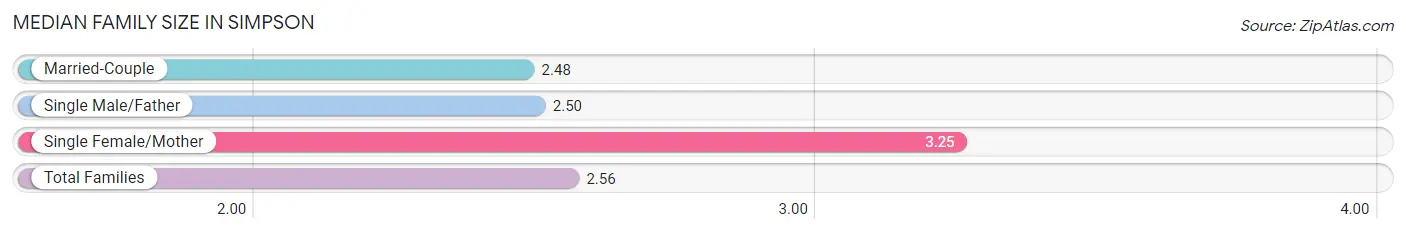
Median Family Size in Simpson
The median family size in Simpson is 2.56 persons per family, with single female/mother families (12 | 10.0%) accounting for the largest median family size of 3.25 persons per family. On the other hand, married-couple families (106 | 88.3%) represent the smallest median family size with 2.48 persons per family.
| Family Type | # Families | Family Size |
| Married-Couple | 106 (88.3%) | 2.48 |
| Single Male/Father | 2 (1.7%) | 2.50 |
| Single Female/Mother | 12 (10.0%) | 3.25 |
| Total Families | 120 (100.0%) | 2.56 |
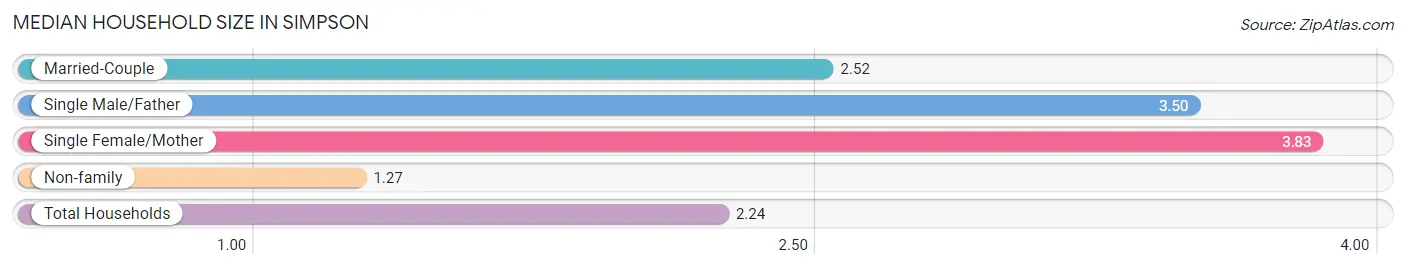
Median Household Size in Simpson
The median household size in Simpson is 2.24 persons per household, with single female/mother households (12 | 7.0%) accounting for the largest median household size of 3.83 persons per household. non-family households (52 | 30.2%) represent the smallest median household size with 1.27 persons per household.
| Household Type | # Households | Household Size |
| Married-Couple | 106 (61.6%) | 2.52 |
| Single Male/Father | 2 (1.2%) | 3.50 |
| Single Female/Mother | 12 (7.0%) | 3.83 |
| Non-family | 52 (30.2%) | 1.27 |
| Total Households | 172 (100.0%) | 2.24 |
Household Size by Marriage Status in Simpson
Out of a total of 172 households in Simpson, 120 (69.8%) are family households, while 52 (30.2%) are nonfamily households. The most numerous type of family households are 2-person households, comprising 62, and the most common type of nonfamily households are 1-person households, comprising 40.
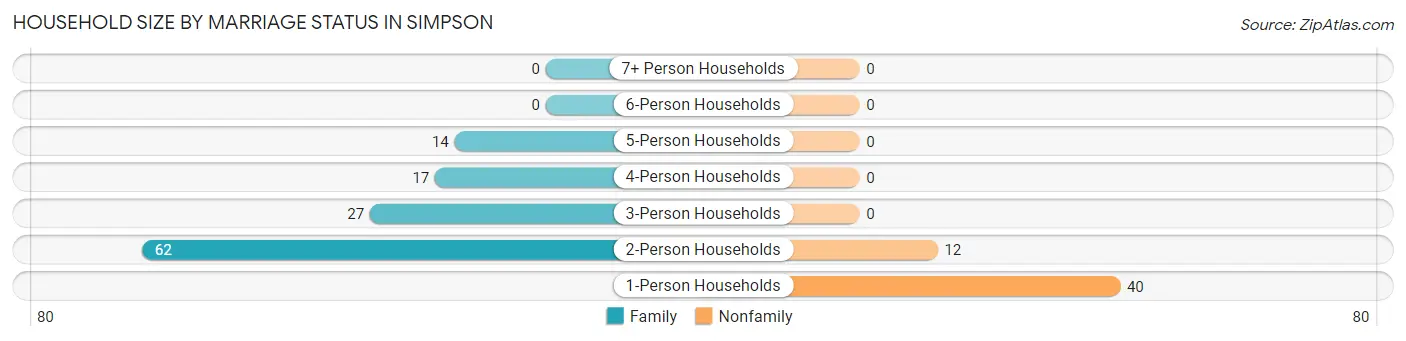
| Household Size | Family Households | Nonfamily Households |
| 1-Person Households | - | 40 (23.3%) |
| 2-Person Households | 62 (36.0%) | 12 (7.0%) |
| 3-Person Households | 27 (15.7%) | 0 (0.0%) |
| 4-Person Households | 17 (9.9%) | 0 (0.0%) |
| 5-Person Households | 14 (8.1%) | 0 (0.0%) |
| 6-Person Households | 0 (0.0%) | 0 (0.0%) |
| 7+ Person Households | 0 (0.0%) | 0 (0.0%) |
| Total | 120 (69.8%) | 52 (30.2%) |
Female Fertility in Simpson
Fertility by Age in Simpson
Average fertility rate in Simpson is 80.0 births per 1,000 women. Women in the age bracket of 20 to 34 years have the highest fertility rate with 206.0 births per 1,000 women. Women in the age bracket of 20 to 34 years acount for 100.0% of all women with births.
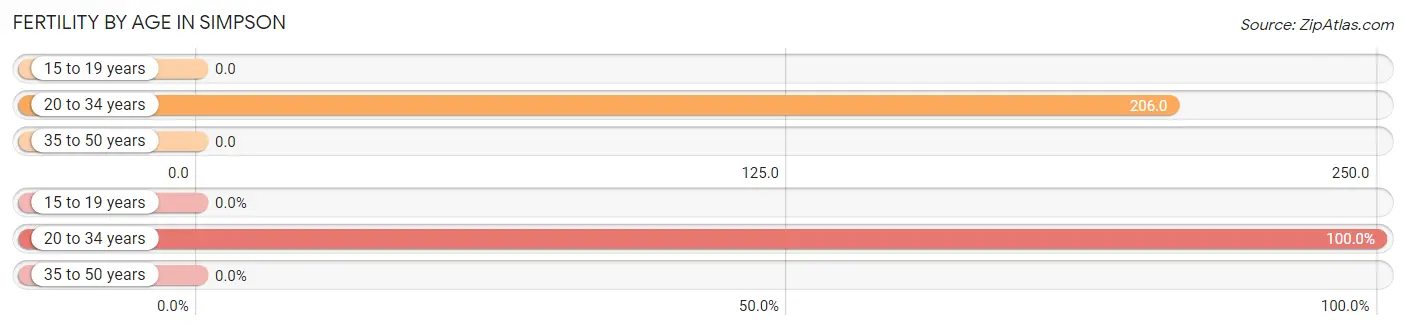
| Age Bracket | Women with Births | Births / 1,000 Women |
| 15 to 19 years | 0 (0.0%) | 0.0 |
| 20 to 34 years | 7 (100.0%) | 206.0 |
| 35 to 50 years | 0 (0.0%) | 0.0 |
| Total | 7 (100.0%) | 80.0 |
Fertility by Age by Marriage Status in Simpson
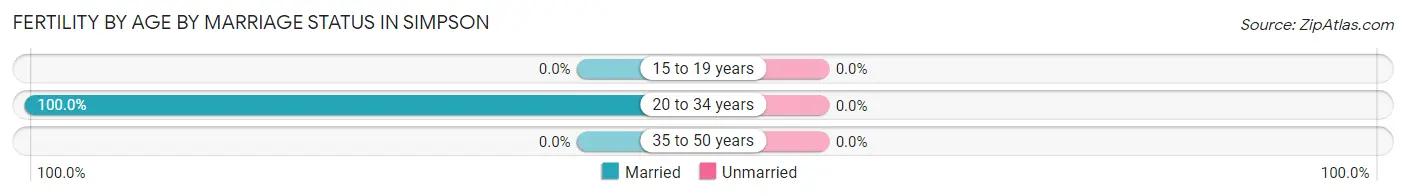
| Age Bracket | Married | Unmarried |
| 15 to 19 years | 0 (0.0%) | 0 (0.0%) |
| 20 to 34 years | 7 (100.0%) | 0 (0.0%) |
| 35 to 50 years | 0 (0.0%) | 0 (0.0%) |
| Total | 7 (100.0%) | 0 (0.0%) |
Fertility by Education in Simpson
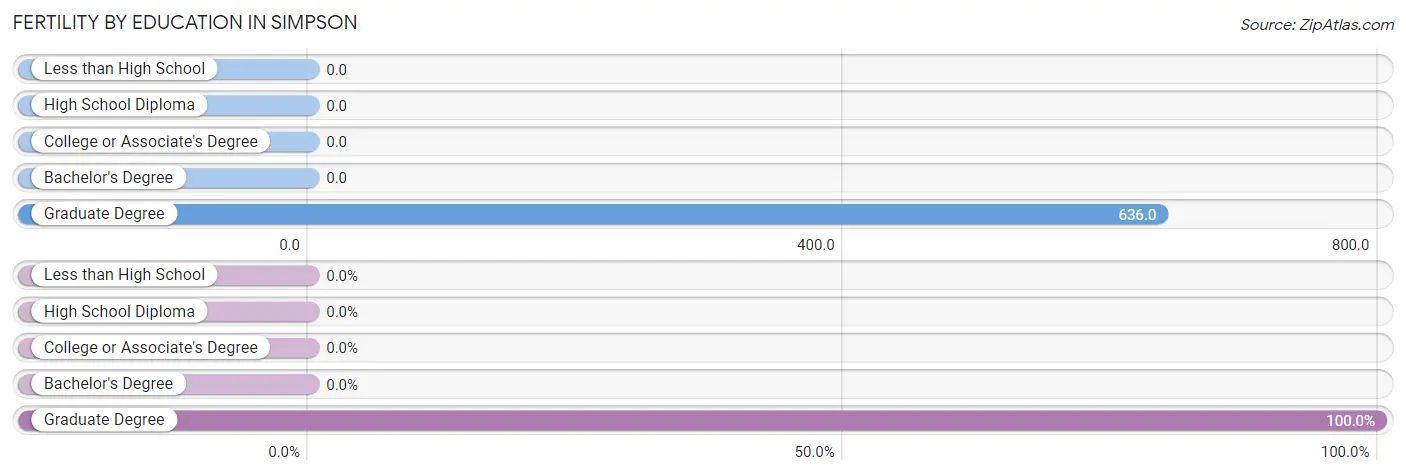
| Educational Attainment | Women with Births | Births / 1,000 Women |
| Less than High School | 0 (0.0%) | 0.0 |
| High School Diploma | 0 (0.0%) | 0.0 |
| College or Associate's Degree | 0 (0.0%) | 0.0 |
| Bachelor's Degree | 0 (0.0%) | 0.0 |
| Graduate Degree | 7 (100.0%) | 636.0 |
| Total | 7 (100.0%) | 80.0 |
Fertility by Education by Marriage Status in Simpson
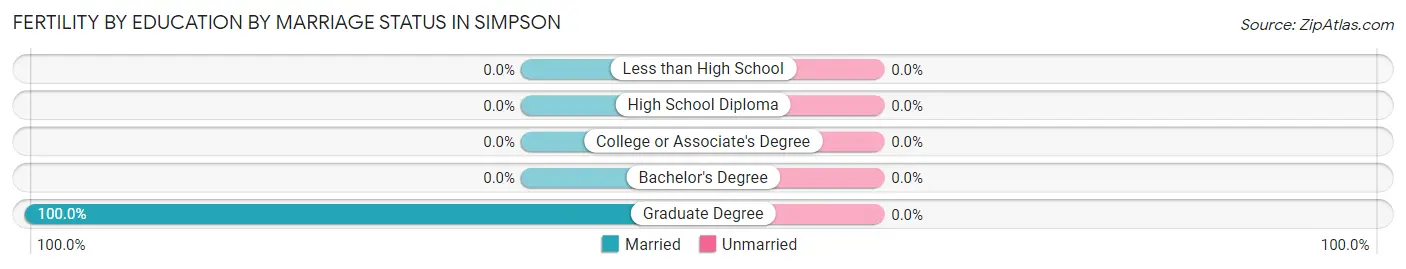
| Educational Attainment | Married | Unmarried |
| Less than High School | 0 (0.0%) | 0 (0.0%) |
| High School Diploma | 0 (0.0%) | 0 (0.0%) |
| College or Associate's Degree | 0 (0.0%) | 0 (0.0%) |
| Bachelor's Degree | 0 (0.0%) | 0 (0.0%) |
| Graduate Degree | 7 (100.0%) | 0 (0.0%) |
| Total | 7 (100.0%) | 0 (0.0%) |
Employment Characteristics in Simpson
Employment by Class of Employer in Simpson
Among the 156 employed individuals in Simpson, private company employees (88 | 56.4%), state government employees (43 | 27.6%), and local government employees (13 | 8.3%) make up the most common classes of employment.
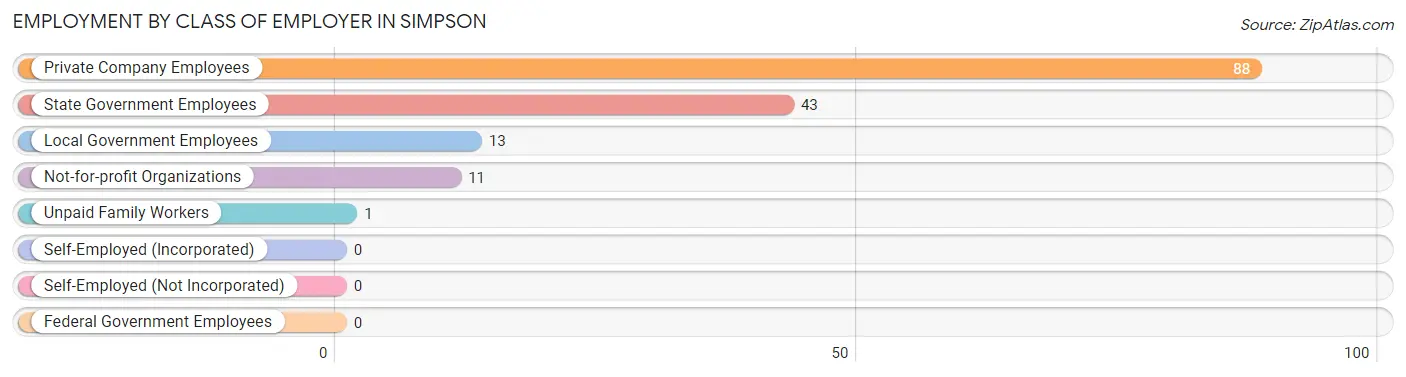
| Employer Class | # Employees | % Employees |
| Private Company Employees | 88 | 56.4% |
| Self-Employed (Incorporated) | 0 | 0.0% |
| Self-Employed (Not Incorporated) | 0 | 0.0% |
| Not-for-profit Organizations | 11 | 7.0% |
| Local Government Employees | 13 | 8.3% |
| State Government Employees | 43 | 27.6% |
| Federal Government Employees | 0 | 0.0% |
| Unpaid Family Workers | 1 | 0.6% |
| Total | 156 | 100.0% |
Employment Status by Age in Simpson
According to the labor force statistics for Simpson, out of the total population over 16 years of age (325), 53.8% or 175 individuals are in the labor force, with 10.3% or 18 of them unemployed. The age group with the highest labor force participation rate is 25 to 29 years, with 100.0% or 32 individuals in the labor force. Within the labor force, the 20 to 24 years age range has the highest percentage of unemployed individuals, with 50.0% or 3 of them being unemployed.
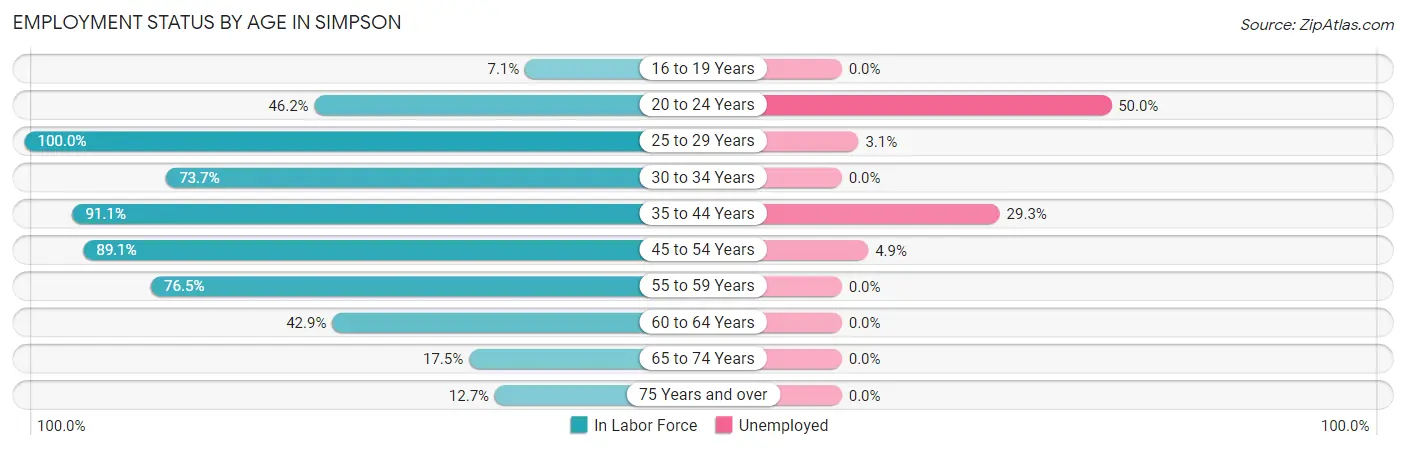
| Age Bracket | In Labor Force | Unemployed |
| 16 to 19 Years | 1 (7.1%) | 0 (0.0%) |
| 20 to 24 Years | 6 (46.2%) | 3 (50.0%) |
| 25 to 29 Years | 32 (100.0%) | 1 (3.1%) |
| 30 to 34 Years | 14 (73.7%) | 0 (0.0%) |
| 35 to 44 Years | 41 (91.1%) | 12 (29.3%) |
| 45 to 54 Years | 41 (89.1%) | 2 (4.9%) |
| 55 to 59 Years | 13 (76.5%) | 0 (0.0%) |
| 60 to 64 Years | 9 (42.9%) | 0 (0.0%) |
| 65 to 74 Years | 11 (17.5%) | 0 (0.0%) |
| 75 Years and over | 7 (12.7%) | 0 (0.0%) |
| Total | 175 (53.8%) | 18 (10.3%) |
Employment Status by Educational Attainment in Simpson
According to labor force statistics for Simpson, 83.3% of individuals (150) out of the total population between 25 and 64 years of age (180) are in the labor force, with 10.0% or 15 of them being unemployed. The group with the highest labor force participation rate are those with the educational attainment of bachelor's degree or higher, with 96.7% or 59 individuals in the labor force. Within the labor force, individuals with high school diploma education have the highest percentage of unemployment, with 25.0% or 7 of them being unemployed.
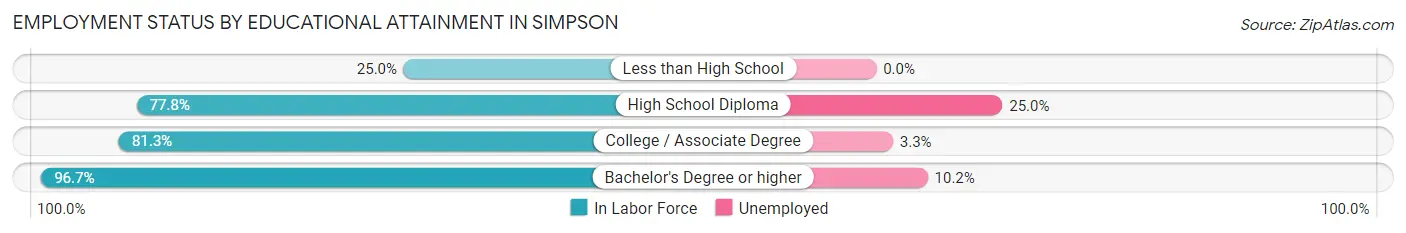
| Educational Attainment | In Labor Force | Unemployed |
| Less than High School | 2 (25.0%) | 0 (0.0%) |
| High School Diploma | 28 (77.8%) | 9 (25.0%) |
| College / Associate Degree | 61 (81.3%) | 2 (3.3%) |
| Bachelor's Degree or higher | 59 (96.7%) | 6 (10.2%) |
| Total | 150 (83.3%) | 18 (10.0%) |
Employment Occupations by Sex in Simpson
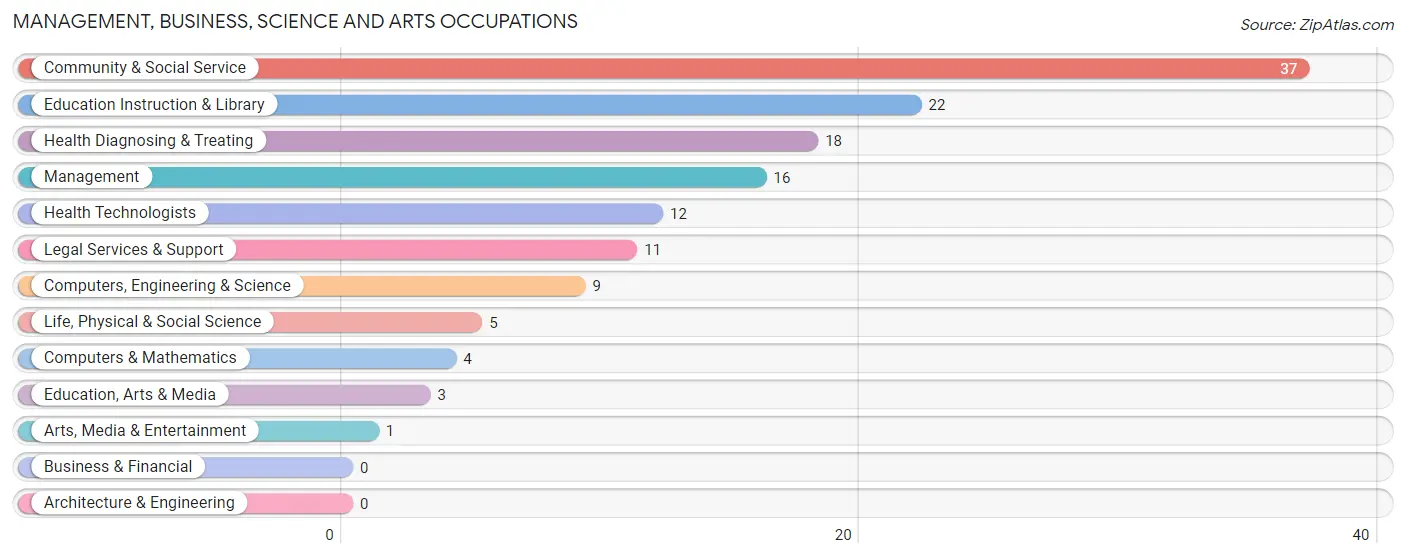
Management, Business, Science and Arts Occupations
The most common Management, Business, Science and Arts occupations in Simpson are Community & Social Service (37 | 23.6%), Education Instruction & Library (22 | 14.0%), Health Diagnosing & Treating (18 | 11.5%), Management (16 | 10.2%), and Health Technologists (12 | 7.6%).
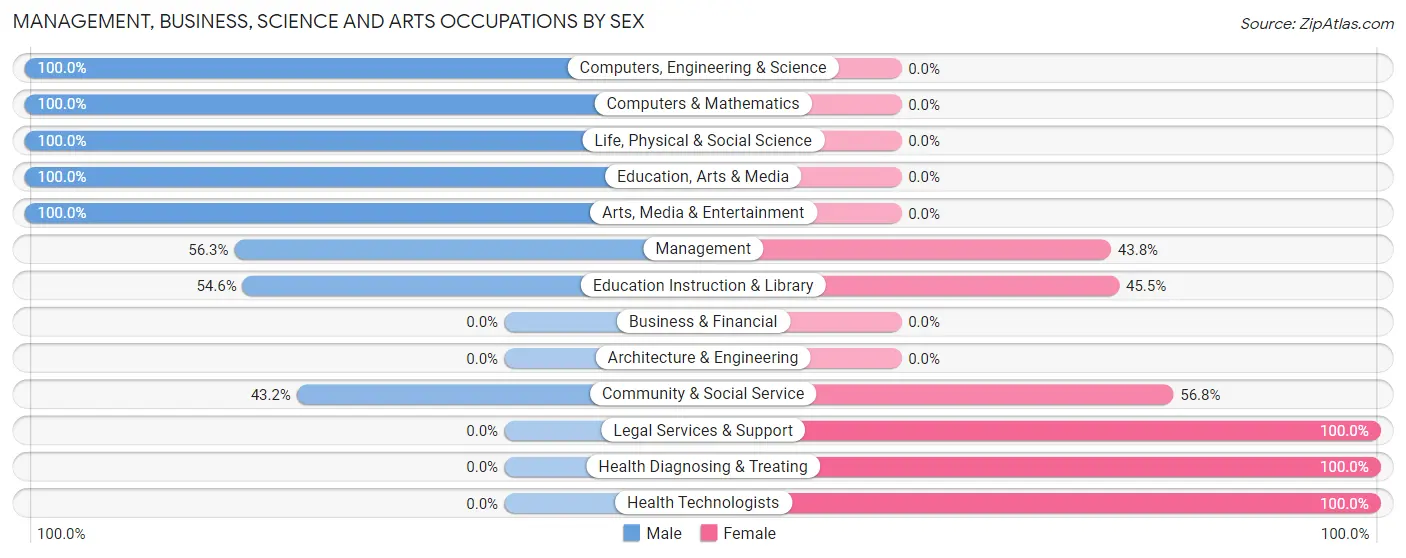
Management, Business, Science and Arts Occupations by Sex
Within the Management, Business, Science and Arts occupations in Simpson, the most male-oriented occupations are Computers, Engineering & Science (100.0%), Computers & Mathematics (100.0%), and Life, Physical & Social Science (100.0%), while the most female-oriented occupations are Legal Services & Support (100.0%), Health Diagnosing & Treating (100.0%), and Health Technologists (100.0%).
| Occupation | Male | Female |
| Management | 9 (56.2%) | 7 (43.8%) |
| Business & Financial | 0 (0.0%) | 0 (0.0%) |
| Computers, Engineering & Science | 9 (100.0%) | 0 (0.0%) |
| Computers & Mathematics | 4 (100.0%) | 0 (0.0%) |
| Architecture & Engineering | 0 (0.0%) | 0 (0.0%) |
| Life, Physical & Social Science | 5 (100.0%) | 0 (0.0%) |
| Community & Social Service | 16 (43.2%) | 21 (56.8%) |
| Education, Arts & Media | 3 (100.0%) | 0 (0.0%) |
| Legal Services & Support | 0 (0.0%) | 11 (100.0%) |
| Education Instruction & Library | 12 (54.5%) | 10 (45.5%) |
| Arts, Media & Entertainment | 1 (100.0%) | 0 (0.0%) |
| Health Diagnosing & Treating | 0 (0.0%) | 18 (100.0%) |
| Health Technologists | 0 (0.0%) | 12 (100.0%) |
| Total (Category) | 34 (42.5%) | 46 (57.5%) |
| Total (Overall) | 79 (50.3%) | 78 (49.7%) |
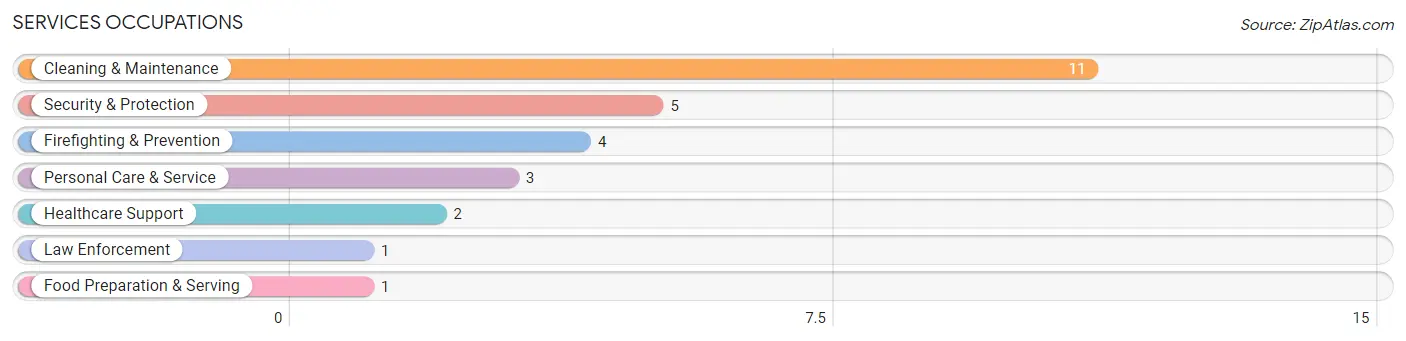
Services Occupations
The most common Services occupations in Simpson are Cleaning & Maintenance (11 | 7.0%), Security & Protection (5 | 3.2%), Firefighting & Prevention (4 | 2.5%), Personal Care & Service (3 | 1.9%), and Healthcare Support (2 | 1.3%).
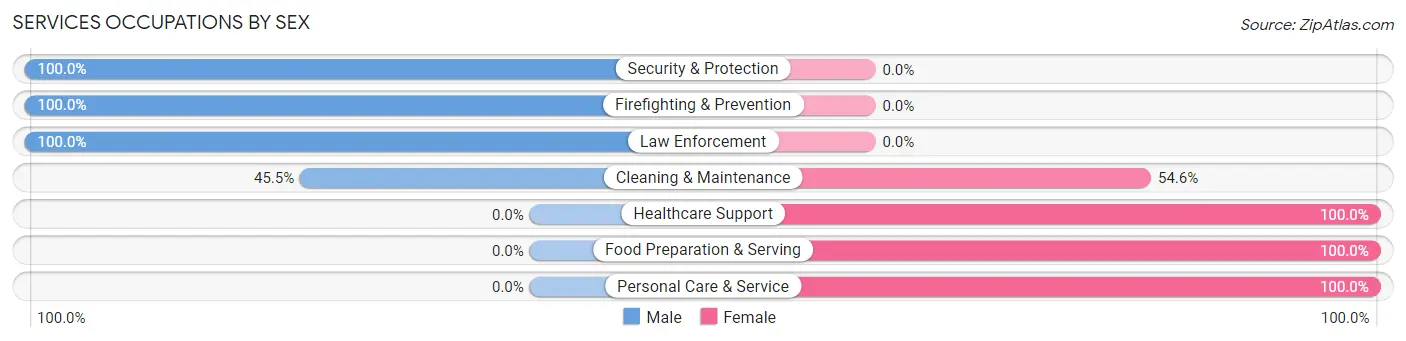
Services Occupations by Sex
Within the Services occupations in Simpson, the most male-oriented occupations are Security & Protection (100.0%), Firefighting & Prevention (100.0%), and Law Enforcement (100.0%), while the most female-oriented occupations are Healthcare Support (100.0%), Food Preparation & Serving (100.0%), and Personal Care & Service (100.0%).
| Occupation | Male | Female |
| Healthcare Support | 0 (0.0%) | 2 (100.0%) |
| Security & Protection | 5 (100.0%) | 0 (0.0%) |
| Firefighting & Prevention | 4 (100.0%) | 0 (0.0%) |
| Law Enforcement | 1 (100.0%) | 0 (0.0%) |
| Food Preparation & Serving | 0 (0.0%) | 1 (100.0%) |
| Cleaning & Maintenance | 5 (45.5%) | 6 (54.5%) |
| Personal Care & Service | 0 (0.0%) | 3 (100.0%) |
| Total (Category) | 10 (45.5%) | 12 (54.5%) |
| Total (Overall) | 79 (50.3%) | 78 (49.7%) |
Sales and Office Occupations
The most common Sales and Office occupations in Simpson are Office & Administration (14 | 8.9%), and Sales & Related (8 | 5.1%).
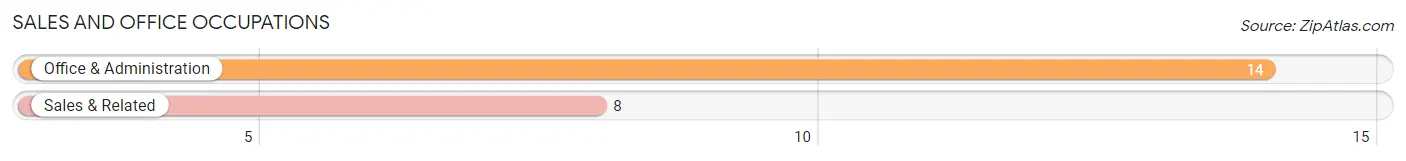
Sales and Office Occupations by Sex
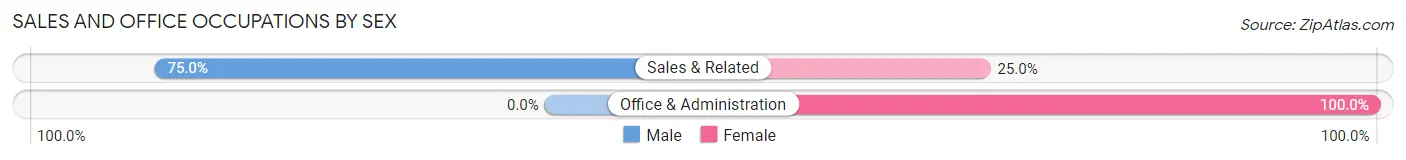
| Occupation | Male | Female |
| Sales & Related | 6 (75.0%) | 2 (25.0%) |
| Office & Administration | 0 (0.0%) | 14 (100.0%) |
| Total (Category) | 6 (27.3%) | 16 (72.7%) |
| Total (Overall) | 79 (50.3%) | 78 (49.7%) |
Natural Resources, Construction and Maintenance Occupations
The most common Natural Resources, Construction and Maintenance occupations in Simpson are Construction & Extraction (7 | 4.5%), and Installation, Maintenance & Repair (7 | 4.5%).
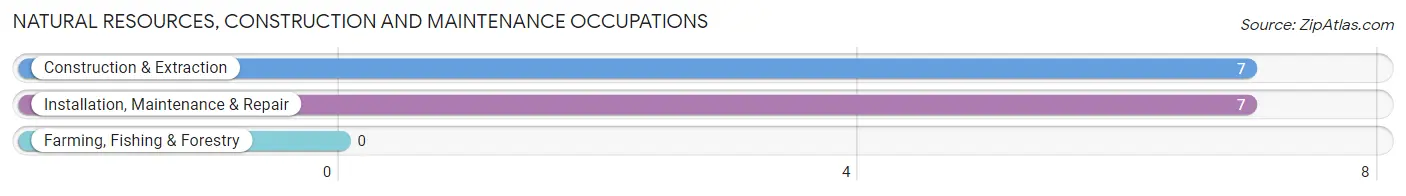
Natural Resources, Construction and Maintenance Occupations by Sex
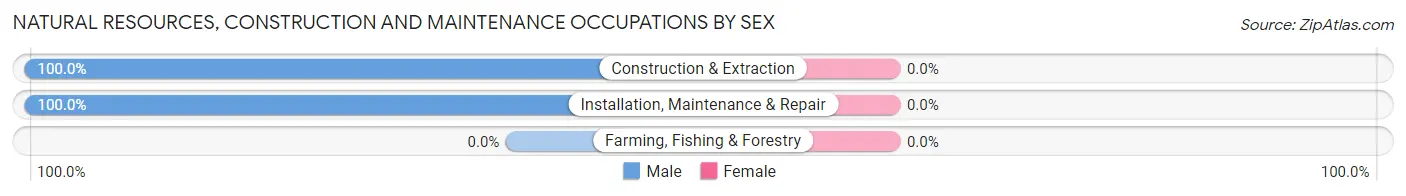
| Occupation | Male | Female |
| Farming, Fishing & Forestry | 0 (0.0%) | 0 (0.0%) |
| Construction & Extraction | 7 (100.0%) | 0 (0.0%) |
| Installation, Maintenance & Repair | 7 (100.0%) | 0 (0.0%) |
| Total (Category) | 14 (100.0%) | 0 (0.0%) |
| Total (Overall) | 79 (50.3%) | 78 (49.7%) |
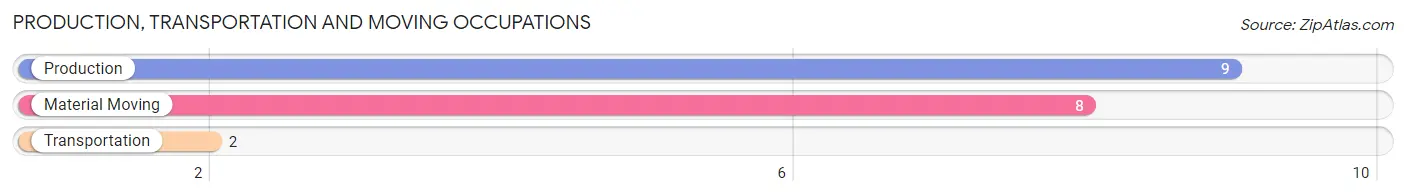
Production, Transportation and Moving Occupations
The most common Production, Transportation and Moving occupations in Simpson are Production (9 | 5.7%), Material Moving (8 | 5.1%), and Transportation (2 | 1.3%).
Production, Transportation and Moving Occupations by Sex
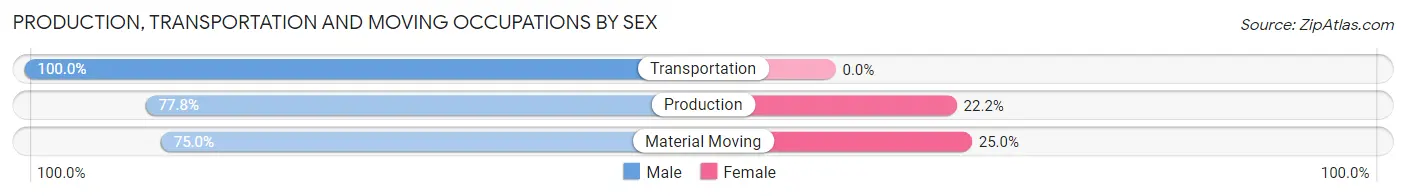
| Occupation | Male | Female |
| Production | 7 (77.8%) | 2 (22.2%) |
| Transportation | 2 (100.0%) | 0 (0.0%) |
| Material Moving | 6 (75.0%) | 2 (25.0%) |
| Total (Category) | 15 (78.9%) | 4 (21.0%) |
| Total (Overall) | 79 (50.3%) | 78 (49.7%) |
Employment Industries by Sex in Simpson
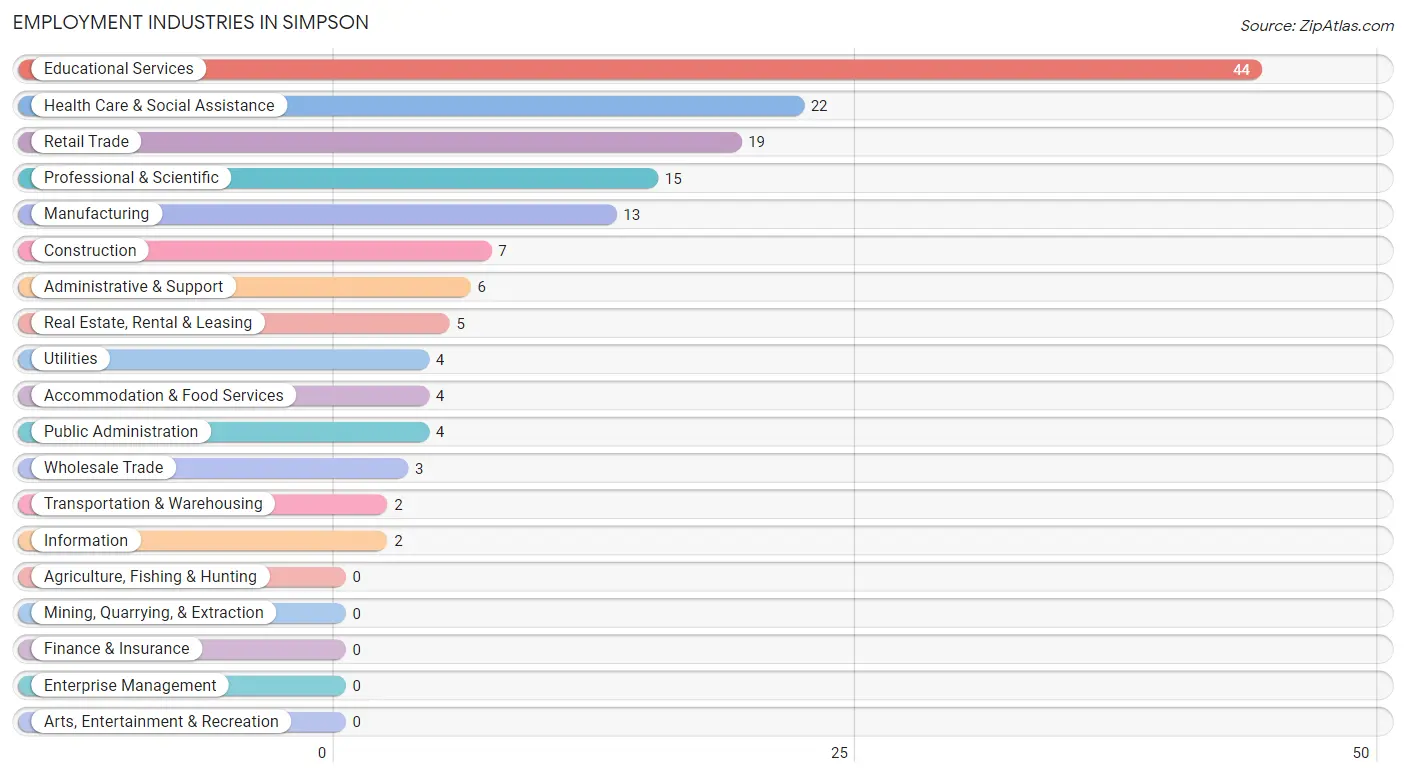
Employment Industries in Simpson
The major employment industries in Simpson include Educational Services (44 | 28.0%), Health Care & Social Assistance (22 | 14.0%), Retail Trade (19 | 12.1%), Professional & Scientific (15 | 9.6%), and Manufacturing (13 | 8.3%).
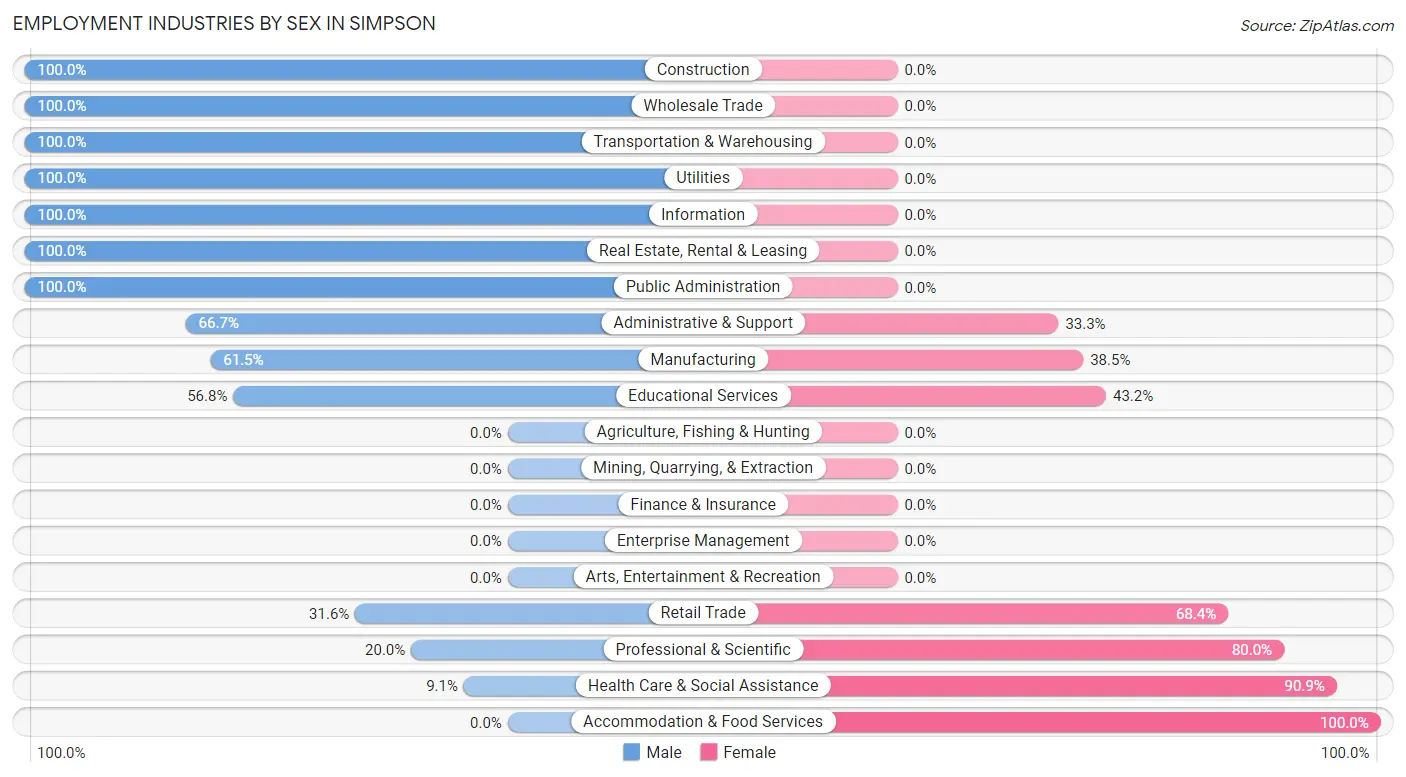
Employment Industries by Sex in Simpson
The Simpson industries that see more men than women are Construction (100.0%), Wholesale Trade (100.0%), and Transportation & Warehousing (100.0%), whereas the industries that tend to have a higher number of women are Accommodation & Food Services (100.0%), Health Care & Social Assistance (90.9%), and Professional & Scientific (80.0%).
| Industry | Male | Female |
| Agriculture, Fishing & Hunting | 0 (0.0%) | 0 (0.0%) |
| Mining, Quarrying, & Extraction | 0 (0.0%) | 0 (0.0%) |
| Construction | 7 (100.0%) | 0 (0.0%) |
| Manufacturing | 8 (61.5%) | 5 (38.5%) |
| Wholesale Trade | 3 (100.0%) | 0 (0.0%) |
| Retail Trade | 6 (31.6%) | 13 (68.4%) |
| Transportation & Warehousing | 2 (100.0%) | 0 (0.0%) |
| Utilities | 4 (100.0%) | 0 (0.0%) |
| Information | 2 (100.0%) | 0 (0.0%) |
| Finance & Insurance | 0 (0.0%) | 0 (0.0%) |
| Real Estate, Rental & Leasing | 5 (100.0%) | 0 (0.0%) |
| Professional & Scientific | 3 (20.0%) | 12 (80.0%) |
| Enterprise Management | 0 (0.0%) | 0 (0.0%) |
| Administrative & Support | 4 (66.7%) | 2 (33.3%) |
| Educational Services | 25 (56.8%) | 19 (43.2%) |
| Health Care & Social Assistance | 2 (9.1%) | 20 (90.9%) |
| Arts, Entertainment & Recreation | 0 (0.0%) | 0 (0.0%) |
| Accommodation & Food Services | 0 (0.0%) | 4 (100.0%) |
| Public Administration | 4 (100.0%) | 0 (0.0%) |
| Total | 79 (50.3%) | 78 (49.7%) |
Education in Simpson
School Enrollment in Simpson
The most common levels of schooling among the 76 students in Simpson are middle school (20 | 26.3%), high school (19 | 25.0%), and elementary school (18 | 23.7%).
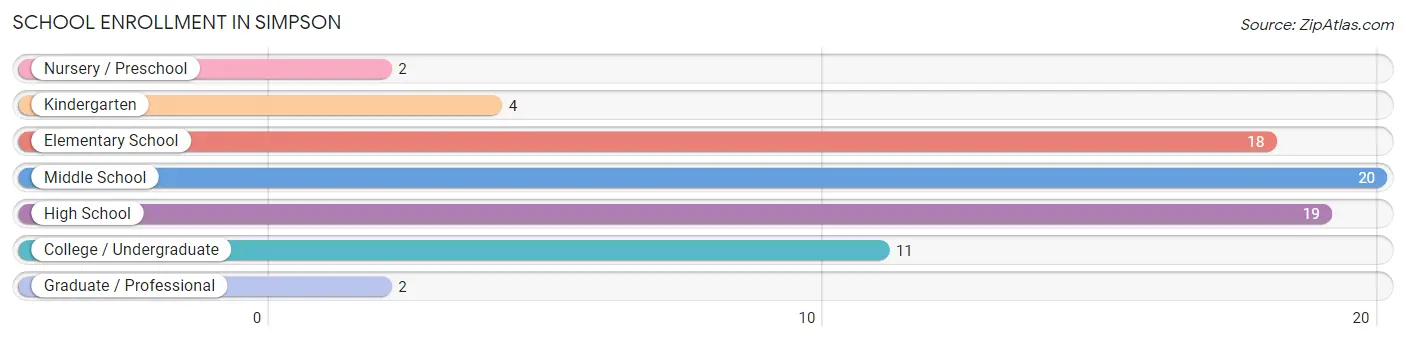
| School Level | # Students | % Students |
| Nursery / Preschool | 2 | 2.6% |
| Kindergarten | 4 | 5.3% |
| Elementary School | 18 | 23.7% |
| Middle School | 20 | 26.3% |
| High School | 19 | 25.0% |
| College / Undergraduate | 11 | 14.5% |
| Graduate / Professional | 2 | 2.6% |
| Total | 76 | 100.0% |
School Enrollment by Age by Funding Source in Simpson
Out of a total of 76 students who are enrolled in schools in Simpson, 8 (10.5%) attend a private institution, while the remaining 68 (89.5%) are enrolled in public schools. The age group of 3 to 4 year olds has the highest likelihood of being enrolled in private schools, with 2 (100.0% in the age bracket) enrolled. Conversely, the age group of 10 to 14 year olds has the lowest likelihood of being enrolled in a private school, with 22 (100.0% in the age bracket) attending a public institution.
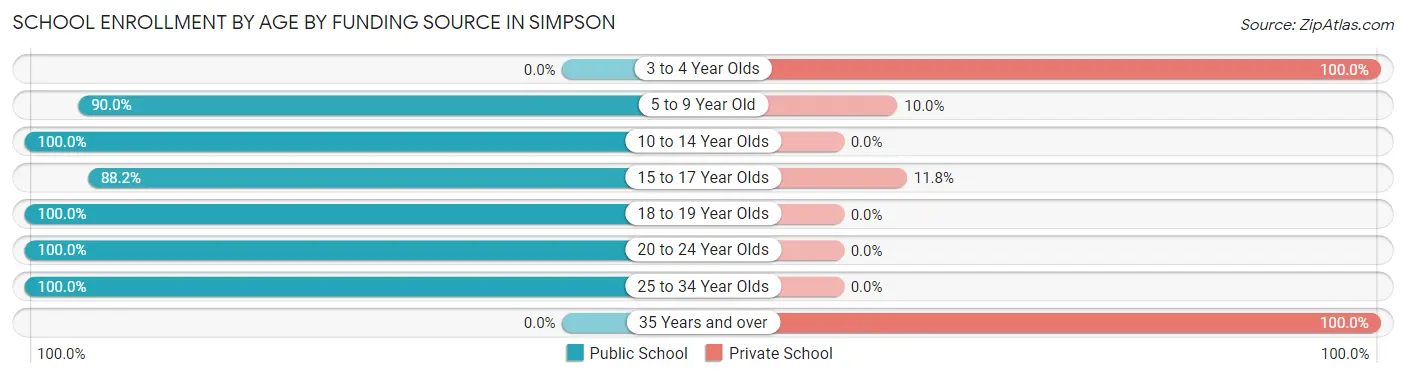
| Age Bracket | Public School | Private School |
| 3 to 4 Year Olds | 0 (0.0%) | 2 (100.0%) |
| 5 to 9 Year Old | 18 (90.0%) | 2 (10.0%) |
| 10 to 14 Year Olds | 22 (100.0%) | 0 (0.0%) |
| 15 to 17 Year Olds | 15 (88.2%) | 2 (11.8%) |
| 18 to 19 Year Olds | 6 (100.0%) | 0 (0.0%) |
| 20 to 24 Year Olds | 2 (100.0%) | 0 (0.0%) |
| 25 to 34 Year Olds | 5 (100.0%) | 0 (0.0%) |
| 35 Years and over | 0 (0.0%) | 2 (100.0%) |
| Total | 68 (89.5%) | 8 (10.5%) |
Educational Attainment by Field of Study in Simpson
Education (15 | 18.3%), science & technology (13 | 15.9%), social sciences (10 | 12.2%), computers & mathematics (8 | 9.8%), and arts & humanities (7 | 8.5%) are the most common fields of study among 82 individuals in Simpson who have obtained a bachelor's degree or higher.
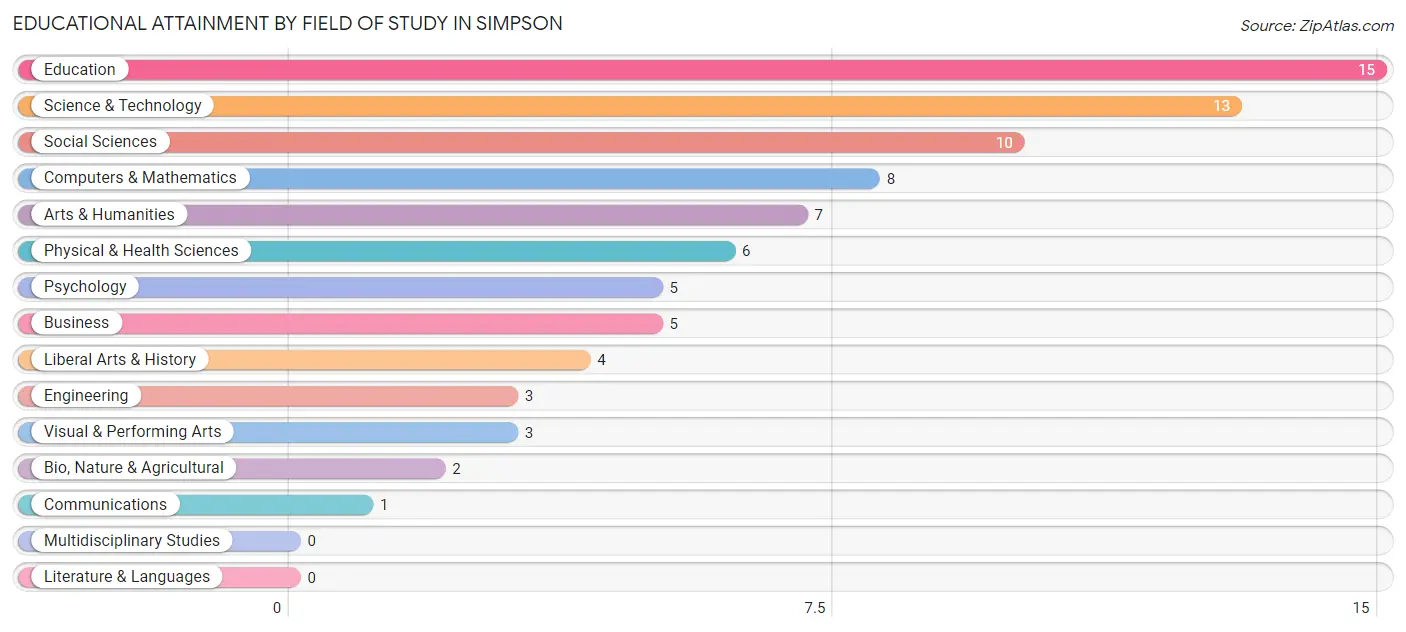
| Field of Study | # Graduates | % Graduates |
| Computers & Mathematics | 8 | 9.8% |
| Bio, Nature & Agricultural | 2 | 2.4% |
| Physical & Health Sciences | 6 | 7.3% |
| Psychology | 5 | 6.1% |
| Social Sciences | 10 | 12.2% |
| Engineering | 3 | 3.7% |
| Multidisciplinary Studies | 0 | 0.0% |
| Science & Technology | 13 | 15.9% |
| Business | 5 | 6.1% |
| Education | 15 | 18.3% |
| Literature & Languages | 0 | 0.0% |
| Liberal Arts & History | 4 | 4.9% |
| Visual & Performing Arts | 3 | 3.7% |
| Communications | 1 | 1.2% |
| Arts & Humanities | 7 | 8.5% |
| Total | 82 | 100.0% |
Transportation & Commute in Simpson
Vehicle Availability by Sex in Simpson
The most prevalent vehicle ownership categories in Simpson are males with 2 vehicles (43, accounting for 54.4%) and females with 2 vehicles (42, making up 55.8%).
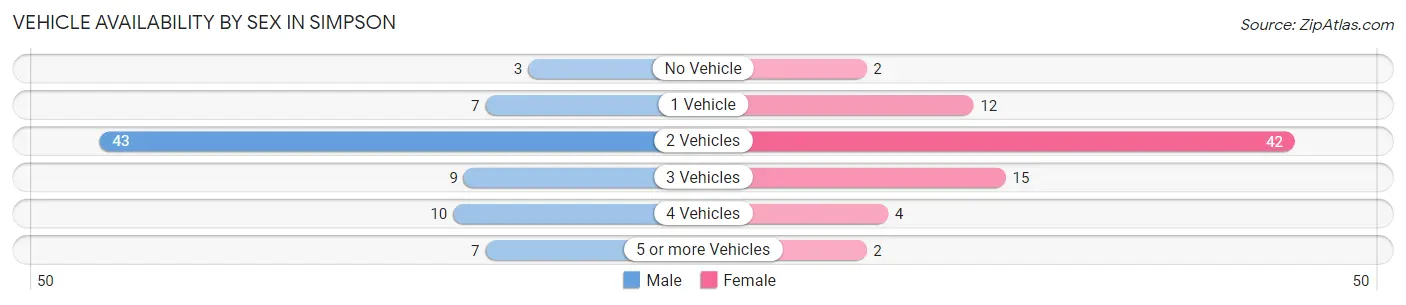
| Vehicles Available | Male | Female |
| No Vehicle | 3 (3.8%) | 2 (2.6%) |
| 1 Vehicle | 7 (8.9%) | 12 (15.6%) |
| 2 Vehicles | 43 (54.4%) | 42 (54.5%) |
| 3 Vehicles | 9 (11.4%) | 15 (19.5%) |
| 4 Vehicles | 10 (12.7%) | 4 (5.2%) |
| 5 or more Vehicles | 7 (8.9%) | 2 (2.6%) |
| Total | 79 (100.0%) | 77 (100.0%) |
Commute Time in Simpson
The most frequently occuring commute durations in Simpson are 30 to 34 minutes (28 commuters, 18.5%), 15 to 19 minutes (27 commuters, 17.9%), and 20 to 24 minutes (25 commuters, 16.6%).
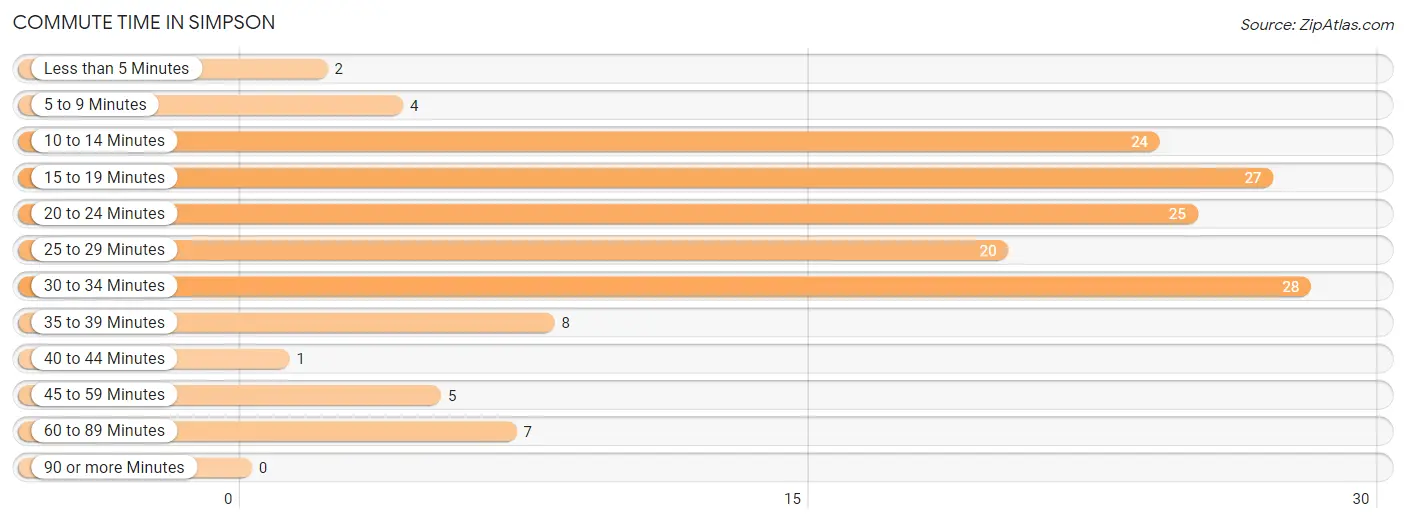
| Commute Time | # Commuters | % Commuters |
| Less than 5 Minutes | 2 | 1.3% |
| 5 to 9 Minutes | 4 | 2.6% |
| 10 to 14 Minutes | 24 | 15.9% |
| 15 to 19 Minutes | 27 | 17.9% |
| 20 to 24 Minutes | 25 | 16.6% |
| 25 to 29 Minutes | 20 | 13.3% |
| 30 to 34 Minutes | 28 | 18.5% |
| 35 to 39 Minutes | 8 | 5.3% |
| 40 to 44 Minutes | 1 | 0.7% |
| 45 to 59 Minutes | 5 | 3.3% |
| 60 to 89 Minutes | 7 | 4.6% |
| 90 or more Minutes | 0 | 0.0% |
Commute Time by Sex in Simpson
The most common commute times in Simpson are 10 to 14 minutes (24 commuters, 31.6%) for males and 30 to 34 minutes (28 commuters, 37.3%) for females.
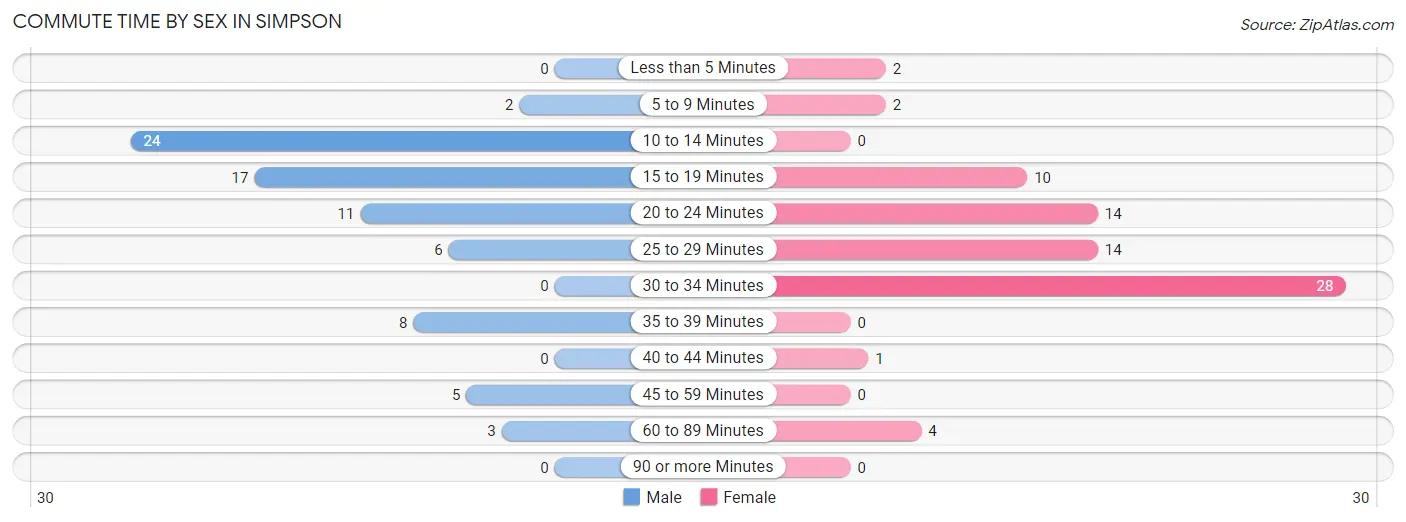
| Commute Time | Male | Female |
| Less than 5 Minutes | 0 (0.0%) | 2 (2.7%) |
| 5 to 9 Minutes | 2 (2.6%) | 2 (2.7%) |
| 10 to 14 Minutes | 24 (31.6%) | 0 (0.0%) |
| 15 to 19 Minutes | 17 (22.4%) | 10 (13.3%) |
| 20 to 24 Minutes | 11 (14.5%) | 14 (18.7%) |
| 25 to 29 Minutes | 6 (7.9%) | 14 (18.7%) |
| 30 to 34 Minutes | 0 (0.0%) | 28 (37.3%) |
| 35 to 39 Minutes | 8 (10.5%) | 0 (0.0%) |
| 40 to 44 Minutes | 0 (0.0%) | 1 (1.3%) |
| 45 to 59 Minutes | 5 (6.6%) | 0 (0.0%) |
| 60 to 89 Minutes | 3 (4.0%) | 4 (5.3%) |
| 90 or more Minutes | 0 (0.0%) | 0 (0.0%) |
Time of Departure to Work by Sex in Simpson
The most frequent times of departure to work in Simpson are 6:30 AM to 6:59 AM (23, 30.3%) for males and 7:00 AM to 7:29 AM (17, 22.7%) for females.
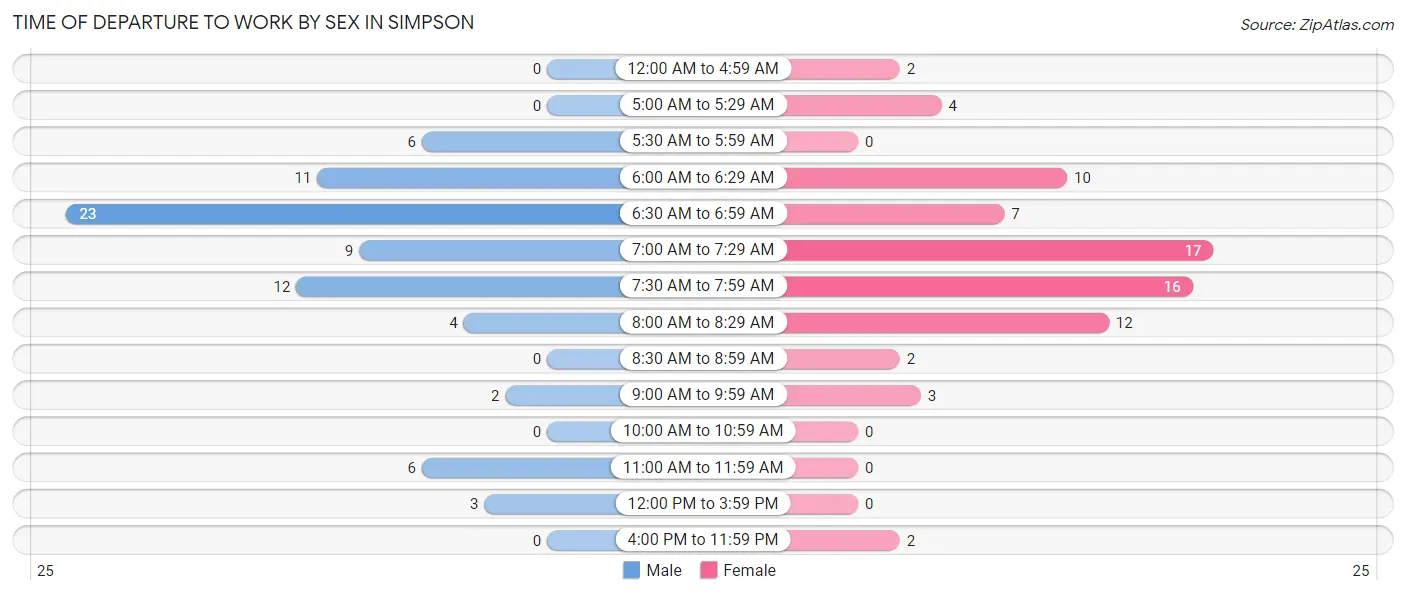
| Time of Departure | Male | Female |
| 12:00 AM to 4:59 AM | 0 (0.0%) | 2 (2.7%) |
| 5:00 AM to 5:29 AM | 0 (0.0%) | 4 (5.3%) |
| 5:30 AM to 5:59 AM | 6 (7.9%) | 0 (0.0%) |
| 6:00 AM to 6:29 AM | 11 (14.5%) | 10 (13.3%) |
| 6:30 AM to 6:59 AM | 23 (30.3%) | 7 (9.3%) |
| 7:00 AM to 7:29 AM | 9 (11.8%) | 17 (22.7%) |
| 7:30 AM to 7:59 AM | 12 (15.8%) | 16 (21.3%) |
| 8:00 AM to 8:29 AM | 4 (5.3%) | 12 (16.0%) |
| 8:30 AM to 8:59 AM | 0 (0.0%) | 2 (2.7%) |
| 9:00 AM to 9:59 AM | 2 (2.6%) | 3 (4.0%) |
| 10:00 AM to 10:59 AM | 0 (0.0%) | 0 (0.0%) |
| 11:00 AM to 11:59 AM | 6 (7.9%) | 0 (0.0%) |
| 12:00 PM to 3:59 PM | 3 (4.0%) | 0 (0.0%) |
| 4:00 PM to 11:59 PM | 0 (0.0%) | 2 (2.7%) |
| Total | 76 (100.0%) | 75 (100.0%) |
Housing Occupancy in Simpson
Occupancy by Ownership in Simpson
Of the total 172 dwellings in Simpson, owner-occupied units account for 152 (88.4%), while renter-occupied units make up 20 (11.6%).
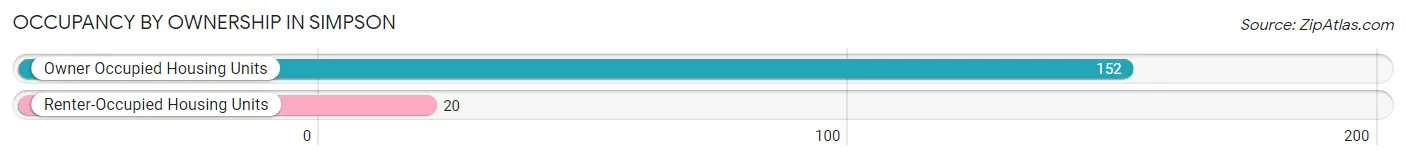
| Occupancy | # Housing Units | % Housing Units |
| Owner Occupied Housing Units | 152 | 88.4% |
| Renter-Occupied Housing Units | 20 | 11.6% |
| Total Occupied Housing Units | 172 | 100.0% |
Occupancy by Household Size in Simpson
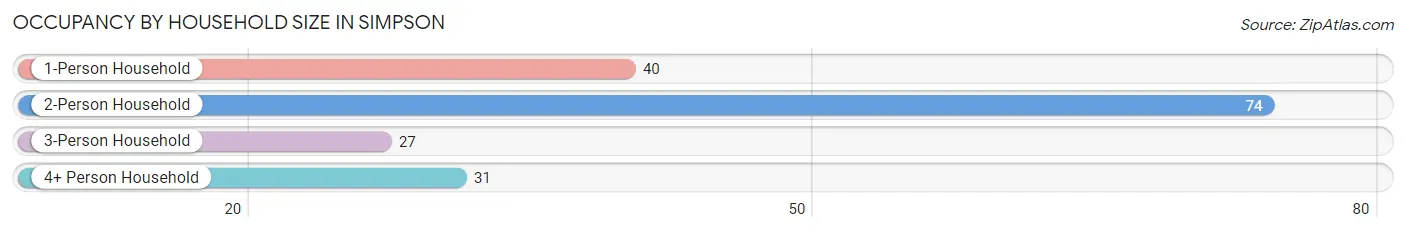
| Household Size | # Housing Units | % Housing Units |
| 1-Person Household | 40 | 23.3% |
| 2-Person Household | 74 | 43.0% |
| 3-Person Household | 27 | 15.7% |
| 4+ Person Household | 31 | 18.0% |
| Total Housing Units | 172 | 100.0% |
Occupancy by Ownership by Household Size in Simpson
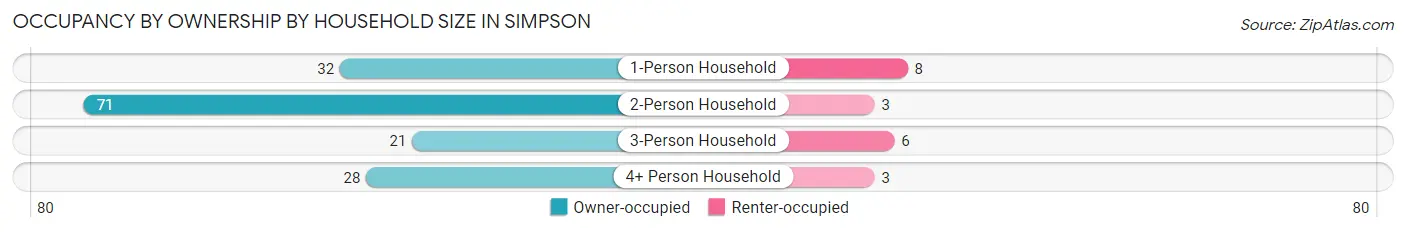
| Household Size | Owner-occupied | Renter-occupied |
| 1-Person Household | 32 (80.0%) | 8 (20.0%) |
| 2-Person Household | 71 (96.0%) | 3 (4.1%) |
| 3-Person Household | 21 (77.8%) | 6 (22.2%) |
| 4+ Person Household | 28 (90.3%) | 3 (9.7%) |
| Total Housing Units | 152 (88.4%) | 20 (11.6%) |
Occupancy by Educational Attainment in Simpson
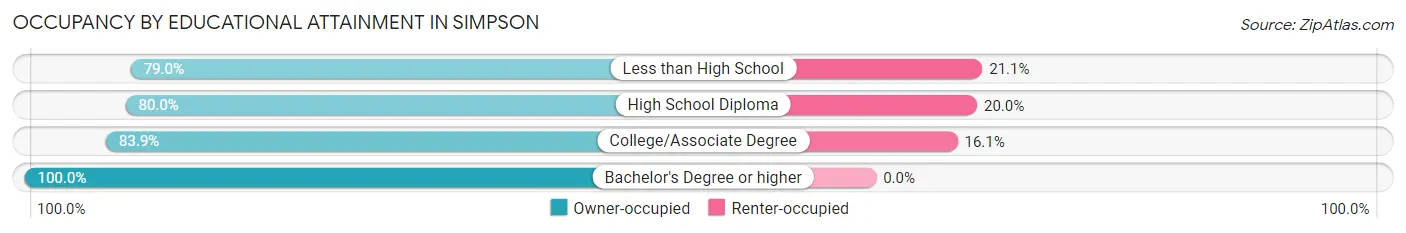
| Household Size | Owner-occupied | Renter-occupied |
| Less than High School | 15 (78.9%) | 4 (21.0%) |
| High School Diploma | 24 (80.0%) | 6 (20.0%) |
| College/Associate Degree | 52 (83.9%) | 10 (16.1%) |
| Bachelor's Degree or higher | 61 (100.0%) | 0 (0.0%) |
Occupancy by Age of Householder in Simpson
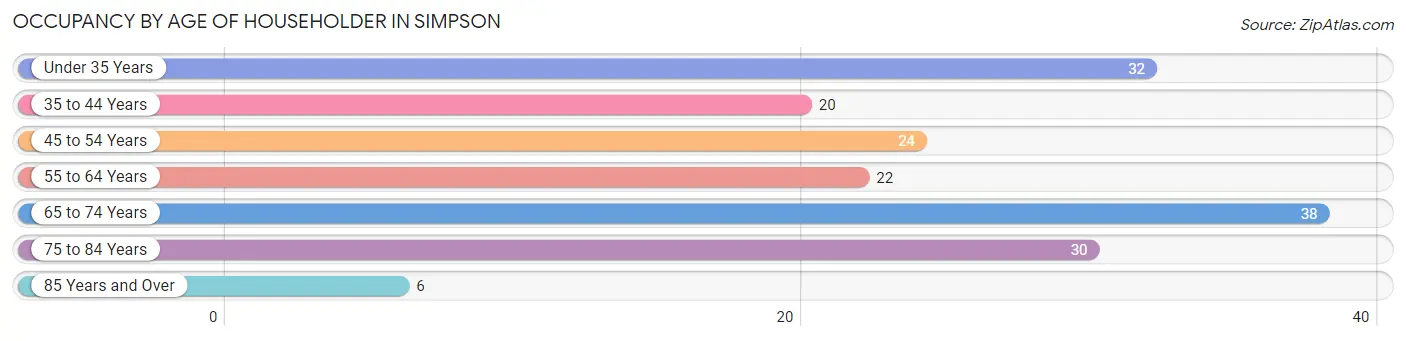
| Age Bracket | # Households | % Households |
| Under 35 Years | 32 | 18.6% |
| 35 to 44 Years | 20 | 11.6% |
| 45 to 54 Years | 24 | 14.0% |
| 55 to 64 Years | 22 | 12.8% |
| 65 to 74 Years | 38 | 22.1% |
| 75 to 84 Years | 30 | 17.4% |
| 85 Years and Over | 6 | 3.5% |
| Total | 172 | 100.0% |
Housing Finances in Simpson
Median Income by Occupancy in Simpson
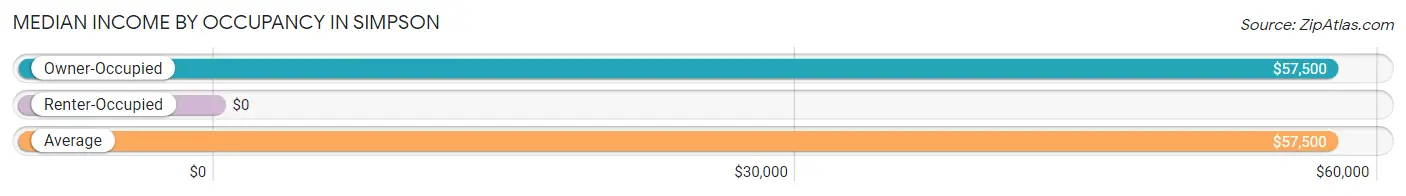
| Occupancy Type | # Households | Median Income |
| Owner-Occupied | 152 (88.4%) | $57,500 |
| Renter-Occupied | 20 (11.6%) | $0 |
| Average | 172 (100.0%) | $57,500 |
Occupancy by Householder Income Bracket in Simpson
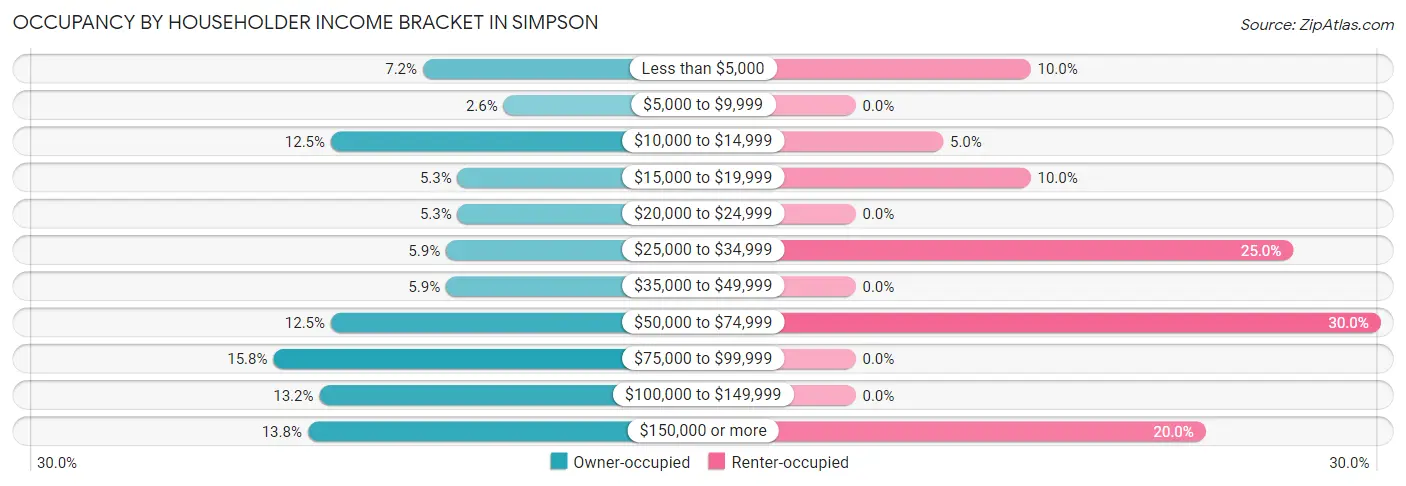
| Income Bracket | Owner-occupied | Renter-occupied |
| Less than $5,000 | 11 (7.2%) | 2 (10.0%) |
| $5,000 to $9,999 | 4 (2.6%) | 0 (0.0%) |
| $10,000 to $14,999 | 19 (12.5%) | 1 (5.0%) |
| $15,000 to $19,999 | 8 (5.3%) | 2 (10.0%) |
| $20,000 to $24,999 | 8 (5.3%) | 0 (0.0%) |
| $25,000 to $34,999 | 9 (5.9%) | 5 (25.0%) |
| $35,000 to $49,999 | 9 (5.9%) | 0 (0.0%) |
| $50,000 to $74,999 | 19 (12.5%) | 6 (30.0%) |
| $75,000 to $99,999 | 24 (15.8%) | 0 (0.0%) |
| $100,000 to $149,999 | 20 (13.2%) | 0 (0.0%) |
| $150,000 or more | 21 (13.8%) | 4 (20.0%) |
| Total | 152 (100.0%) | 20 (100.0%) |
Monthly Housing Cost Tiers in Simpson
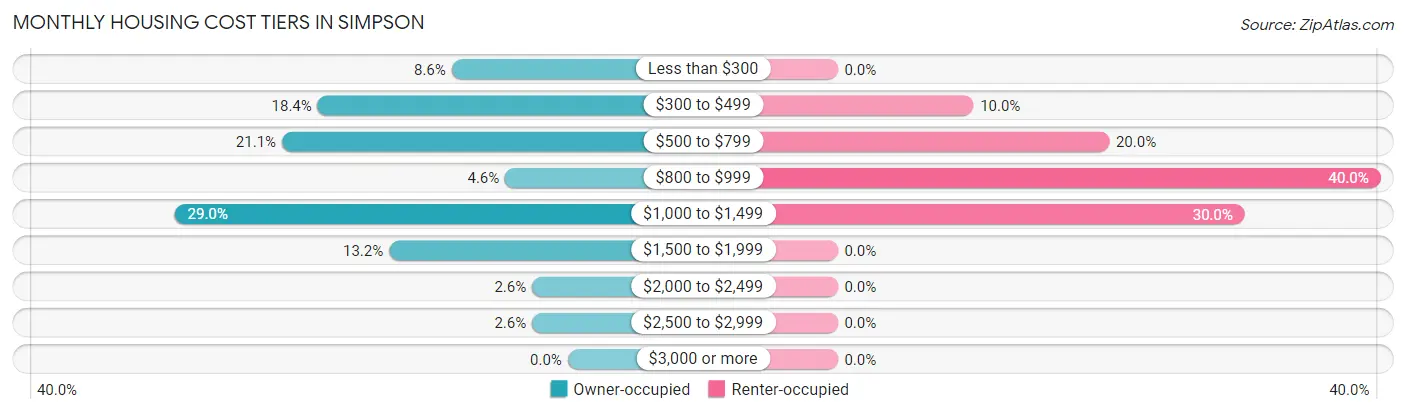
| Monthly Cost | Owner-occupied | Renter-occupied |
| Less than $300 | 13 (8.6%) | 0 (0.0%) |
| $300 to $499 | 28 (18.4%) | 2 (10.0%) |
| $500 to $799 | 32 (21.0%) | 4 (20.0%) |
| $800 to $999 | 7 (4.6%) | 8 (40.0%) |
| $1,000 to $1,499 | 44 (28.9%) | 6 (30.0%) |
| $1,500 to $1,999 | 20 (13.2%) | 0 (0.0%) |
| $2,000 to $2,499 | 4 (2.6%) | 0 (0.0%) |
| $2,500 to $2,999 | 4 (2.6%) | 0 (0.0%) |
| $3,000 or more | 0 (0.0%) | 0 (0.0%) |
| Total | 152 (100.0%) | 20 (100.0%) |
Physical Housing Characteristics in Simpson
Housing Structures in Simpson
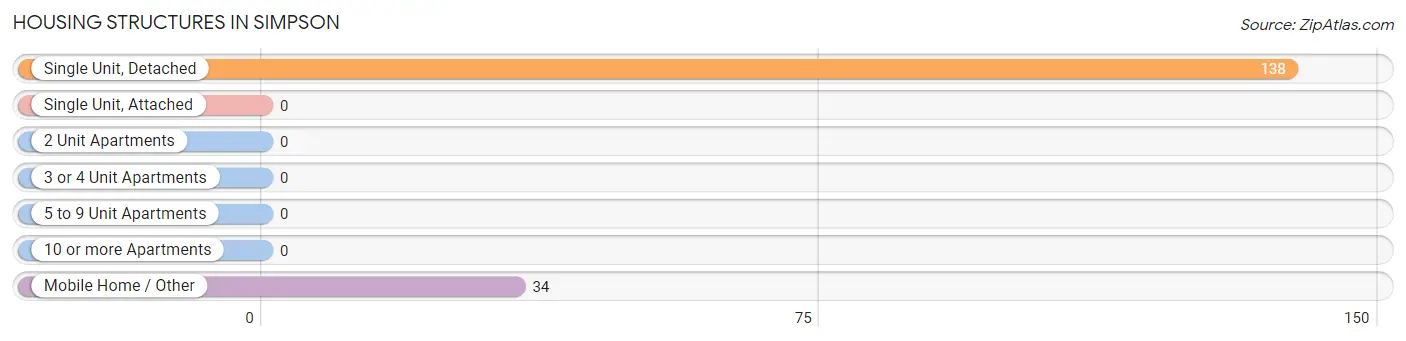
| Structure Type | # Housing Units | % Housing Units |
| Single Unit, Detached | 138 | 80.2% |
| Single Unit, Attached | 0 | 0.0% |
| 2 Unit Apartments | 0 | 0.0% |
| 3 or 4 Unit Apartments | 0 | 0.0% |
| 5 to 9 Unit Apartments | 0 | 0.0% |
| 10 or more Apartments | 0 | 0.0% |
| Mobile Home / Other | 34 | 19.8% |
| Total | 172 | 100.0% |
Housing Structures by Occupancy in Simpson
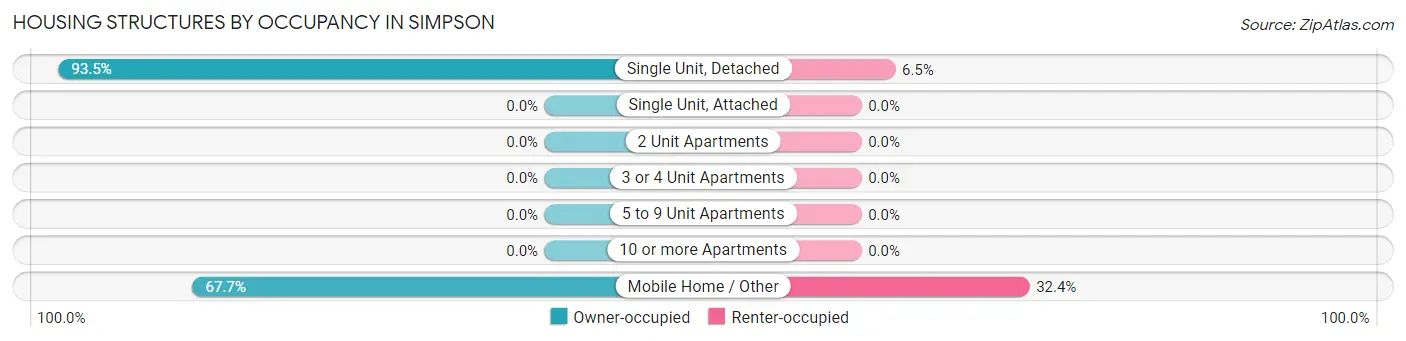
| Structure Type | Owner-occupied | Renter-occupied |
| Single Unit, Detached | 129 (93.5%) | 9 (6.5%) |
| Single Unit, Attached | 0 (0.0%) | 0 (0.0%) |
| 2 Unit Apartments | 0 (0.0%) | 0 (0.0%) |
| 3 or 4 Unit Apartments | 0 (0.0%) | 0 (0.0%) |
| 5 to 9 Unit Apartments | 0 (0.0%) | 0 (0.0%) |
| 10 or more Apartments | 0 (0.0%) | 0 (0.0%) |
| Mobile Home / Other | 23 (67.6%) | 11 (32.4%) |
| Total | 152 (88.4%) | 20 (11.6%) |
Housing Structures by Number of Rooms in Simpson
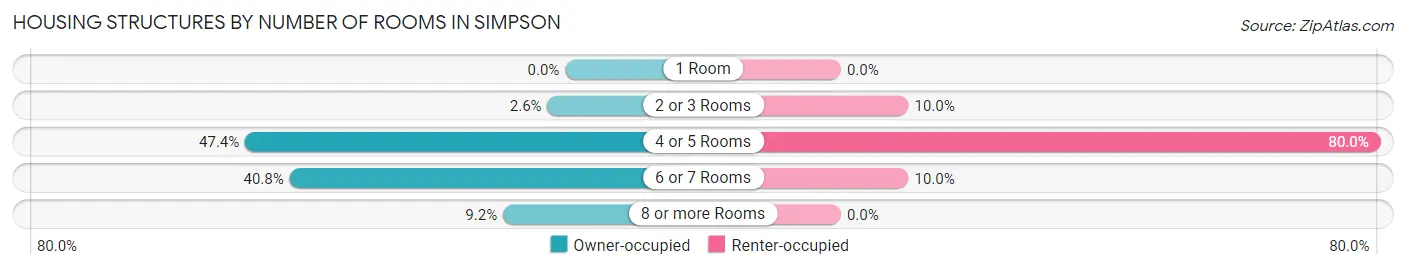
| Number of Rooms | Owner-occupied | Renter-occupied |
| 1 Room | 0 (0.0%) | 0 (0.0%) |
| 2 or 3 Rooms | 4 (2.6%) | 2 (10.0%) |
| 4 or 5 Rooms | 72 (47.4%) | 16 (80.0%) |
| 6 or 7 Rooms | 62 (40.8%) | 2 (10.0%) |
| 8 or more Rooms | 14 (9.2%) | 0 (0.0%) |
| Total | 152 (100.0%) | 20 (100.0%) |
Housing Structure by Heating Type in Simpson
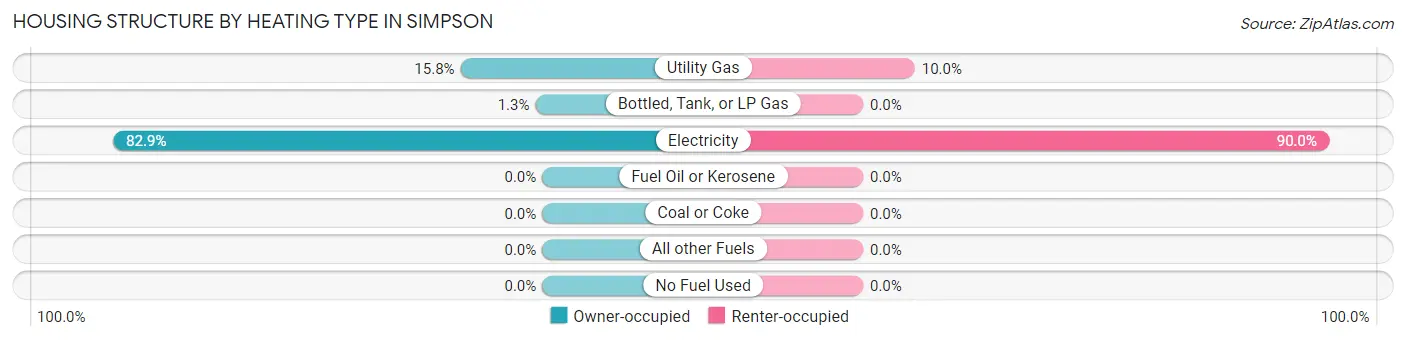
| Heating Type | Owner-occupied | Renter-occupied |
| Utility Gas | 24 (15.8%) | 2 (10.0%) |
| Bottled, Tank, or LP Gas | 2 (1.3%) | 0 (0.0%) |
| Electricity | 126 (82.9%) | 18 (90.0%) |
| Fuel Oil or Kerosene | 0 (0.0%) | 0 (0.0%) |
| Coal or Coke | 0 (0.0%) | 0 (0.0%) |
| All other Fuels | 0 (0.0%) | 0 (0.0%) |
| No Fuel Used | 0 (0.0%) | 0 (0.0%) |
| Total | 152 (100.0%) | 20 (100.0%) |
Household Vehicle Usage in Simpson
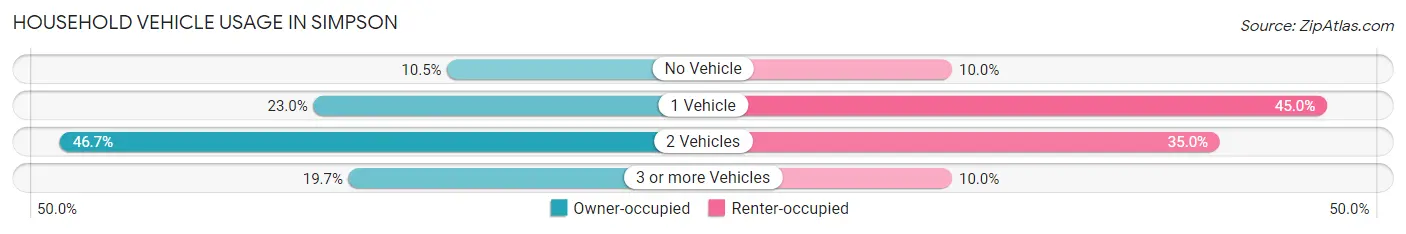
| Vehicles per Household | Owner-occupied | Renter-occupied |
| No Vehicle | 16 (10.5%) | 2 (10.0%) |
| 1 Vehicle | 35 (23.0%) | 9 (45.0%) |
| 2 Vehicles | 71 (46.7%) | 7 (35.0%) |
| 3 or more Vehicles | 30 (19.7%) | 2 (10.0%) |
| Total | 152 (100.0%) | 20 (100.0%) |
Real Estate & Mortgages in Simpson
Real Estate and Mortgage Overview in Simpson
| Characteristic | Without Mortgage | With Mortgage |
| Housing Units | 66 | 86 |
| Median Property Value | $135,000 | $184,500 |
| Median Household Income | $36,250 | $15 |
| Monthly Housing Costs | $457 | $0 |
| Real Estate Taxes | $925 | $5 |
Property Value by Mortgage Status in Simpson
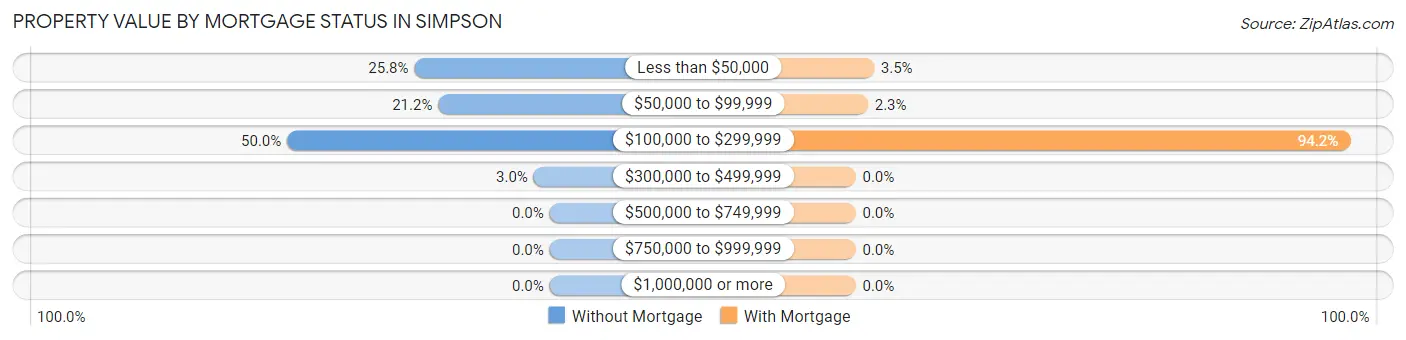
| Property Value | Without Mortgage | With Mortgage |
| Less than $50,000 | 17 (25.8%) | 3 (3.5%) |
| $50,000 to $99,999 | 14 (21.2%) | 2 (2.3%) |
| $100,000 to $299,999 | 33 (50.0%) | 81 (94.2%) |
| $300,000 to $499,999 | 2 (3.0%) | 0 (0.0%) |
| $500,000 to $749,999 | 0 (0.0%) | 0 (0.0%) |
| $750,000 to $999,999 | 0 (0.0%) | 0 (0.0%) |
| $1,000,000 or more | 0 (0.0%) | 0 (0.0%) |
| Total | 66 (100.0%) | 86 (100.0%) |
Household Income by Mortgage Status in Simpson
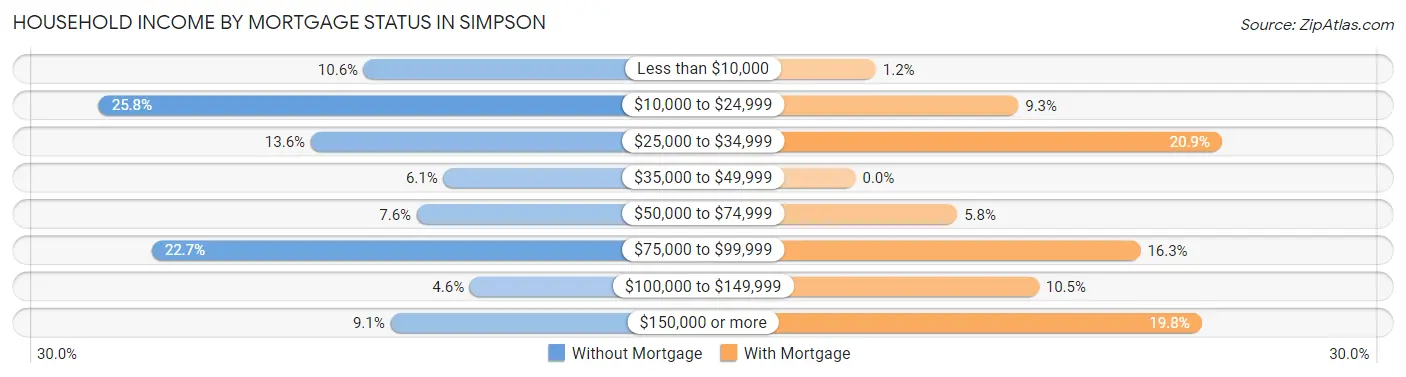
| Household Income | Without Mortgage | With Mortgage |
| Less than $10,000 | 7 (10.6%) | 1 (1.2%) |
| $10,000 to $24,999 | 17 (25.8%) | 8 (9.3%) |
| $25,000 to $34,999 | 9 (13.6%) | 18 (20.9%) |
| $35,000 to $49,999 | 4 (6.1%) | 0 (0.0%) |
| $50,000 to $74,999 | 5 (7.6%) | 5 (5.8%) |
| $75,000 to $99,999 | 15 (22.7%) | 14 (16.3%) |
| $100,000 to $149,999 | 3 (4.5%) | 9 (10.5%) |
| $150,000 or more | 6 (9.1%) | 17 (19.8%) |
| Total | 66 (100.0%) | 86 (100.0%) |
Property Value to Household Income Ratio in Simpson
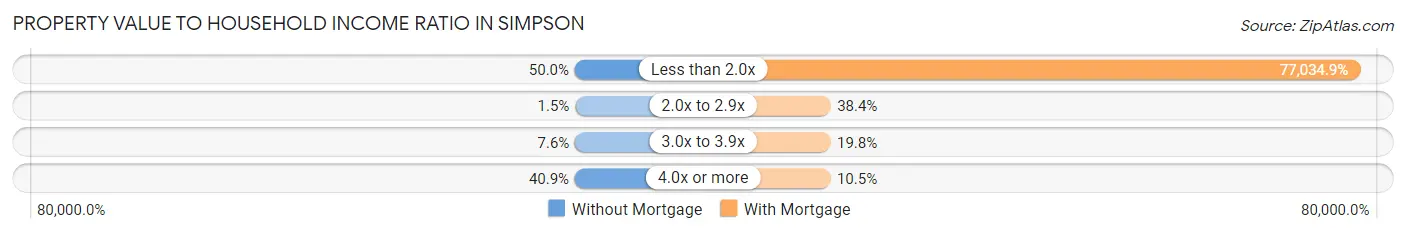
| Value-to-Income Ratio | Without Mortgage | With Mortgage |
| Less than 2.0x | 33 (50.0%) | 66,250 (77,034.9%) |
| 2.0x to 2.9x | 1 (1.5%) | 33 (38.4%) |
| 3.0x to 3.9x | 5 (7.6%) | 17 (19.8%) |
| 4.0x or more | 27 (40.9%) | 9 (10.5%) |
| Total | 66 (100.0%) | 86 (100.0%) |
Real Estate Taxes by Mortgage Status in Simpson
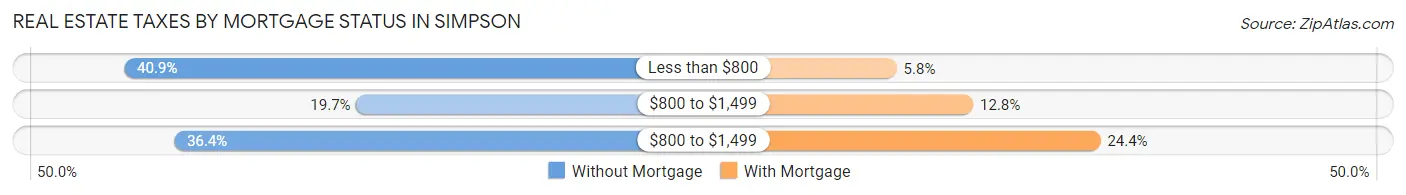
| Property Taxes | Without Mortgage | With Mortgage |
| Less than $800 | 27 (40.9%) | 5 (5.8%) |
| $800 to $1,499 | 13 (19.7%) | 11 (12.8%) |
| $800 to $1,499 | 24 (36.4%) | 21 (24.4%) |
| Total | 66 (100.0%) | 86 (100.0%) |
Health & Disability in Simpson
Health Insurance Coverage by Age in Simpson
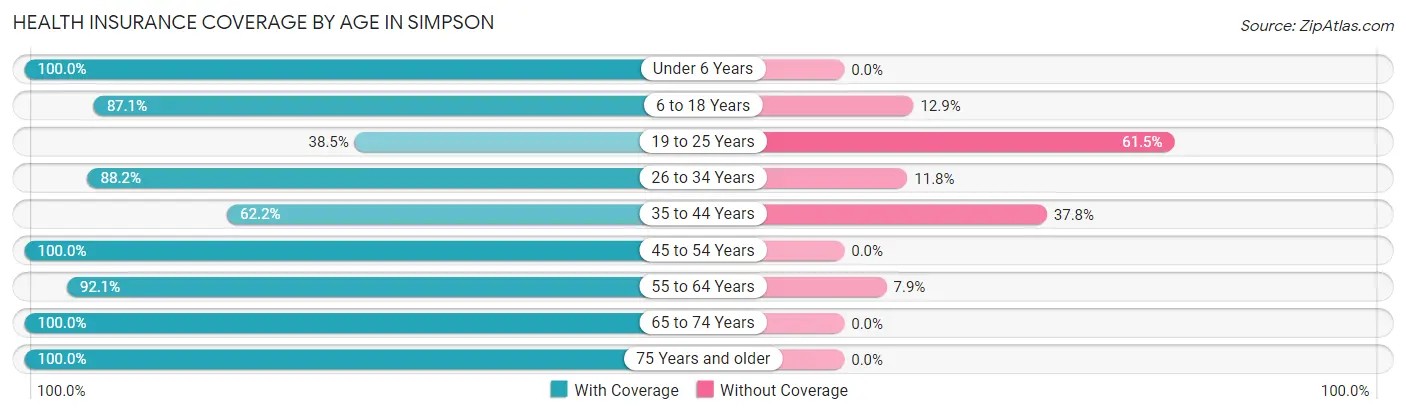
| Age Bracket | With Coverage | Without Coverage |
| Under 6 Years | 13 (100.0%) | 0 (0.0%) |
| 6 to 18 Years | 54 (87.1%) | 8 (12.9%) |
| 19 to 25 Years | 5 (38.5%) | 8 (61.5%) |
| 26 to 34 Years | 45 (88.2%) | 6 (11.8%) |
| 35 to 44 Years | 28 (62.2%) | 17 (37.8%) |
| 45 to 54 Years | 46 (100.0%) | 0 (0.0%) |
| 55 to 64 Years | 35 (92.1%) | 3 (7.9%) |
| 65 to 74 Years | 63 (100.0%) | 0 (0.0%) |
| 75 Years and older | 55 (100.0%) | 0 (0.0%) |
| Total | 344 (89.1%) | 42 (10.9%) |
Health Insurance Coverage by Citizenship Status in Simpson
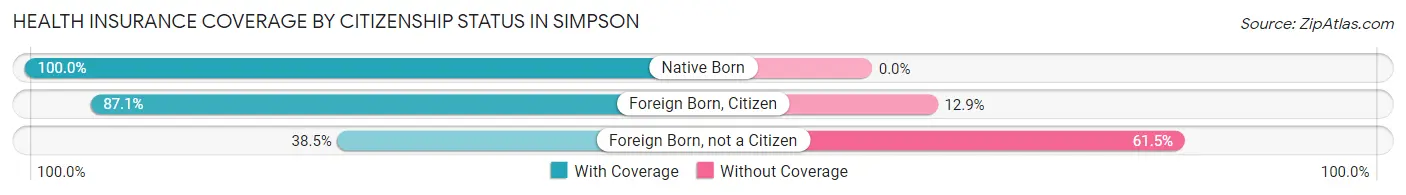
| Citizenship Status | With Coverage | Without Coverage |
| Native Born | 13 (100.0%) | 0 (0.0%) |
| Foreign Born, Citizen | 54 (87.1%) | 8 (12.9%) |
| Foreign Born, not a Citizen | 5 (38.5%) | 8 (61.5%) |
Health Insurance Coverage by Household Income in Simpson
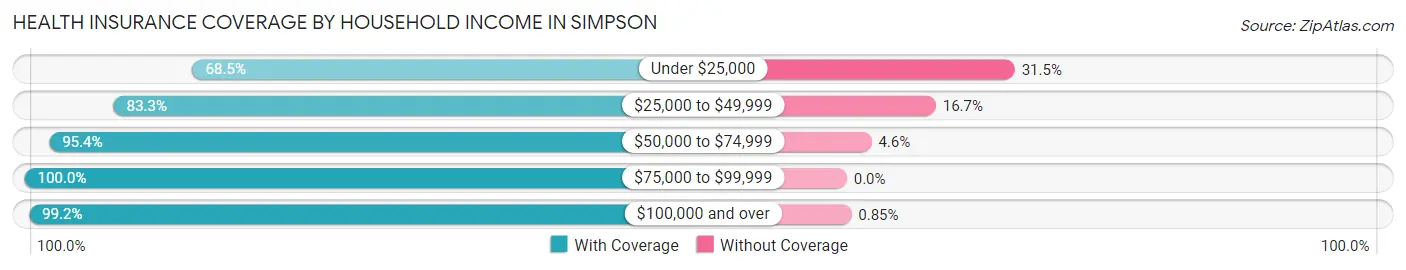
| Household Income | With Coverage | Without Coverage |
| Under $25,000 | 61 (68.5%) | 28 (31.5%) |
| $25,000 to $49,999 | 50 (83.3%) | 10 (16.7%) |
| $50,000 to $74,999 | 62 (95.4%) | 3 (4.6%) |
| $75,000 to $99,999 | 54 (100.0%) | 0 (0.0%) |
| $100,000 and over | 117 (99.2%) | 1 (0.9%) |
Public vs Private Health Insurance Coverage by Age in Simpson
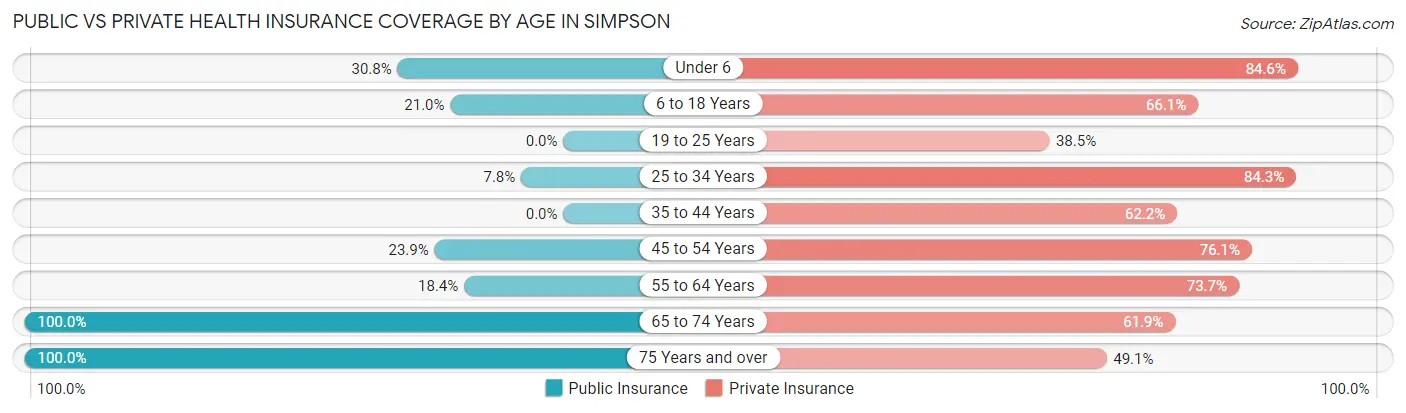
| Age Bracket | Public Insurance | Private Insurance |
| Under 6 | 4 (30.8%) | 11 (84.6%) |
| 6 to 18 Years | 13 (21.0%) | 41 (66.1%) |
| 19 to 25 Years | 0 (0.0%) | 5 (38.5%) |
| 25 to 34 Years | 4 (7.8%) | 43 (84.3%) |
| 35 to 44 Years | 0 (0.0%) | 28 (62.2%) |
| 45 to 54 Years | 11 (23.9%) | 35 (76.1%) |
| 55 to 64 Years | 7 (18.4%) | 28 (73.7%) |
| 65 to 74 Years | 63 (100.0%) | 39 (61.9%) |
| 75 Years and over | 55 (100.0%) | 27 (49.1%) |
| Total | 157 (40.7%) | 257 (66.6%) |
Disability Status by Sex by Age in Simpson
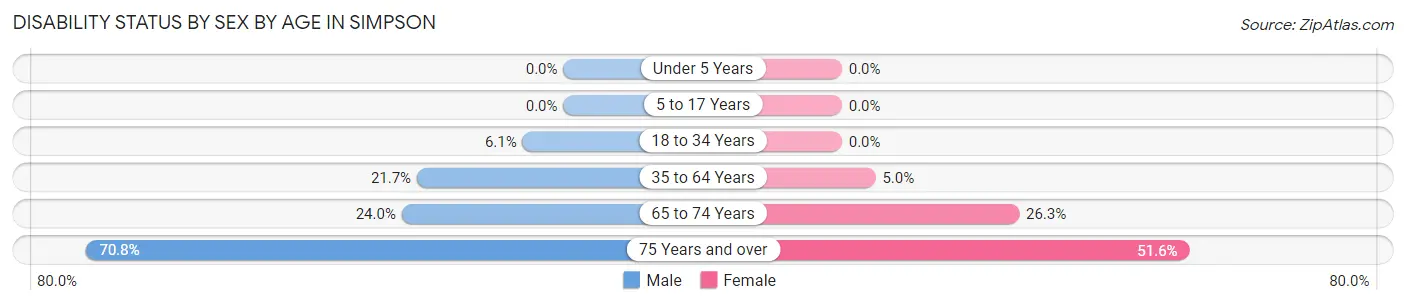
| Age Bracket | Male | Female |
| Under 5 Years | 0 (0.0%) | 0 (0.0%) |
| 5 to 17 Years | 0 (0.0%) | 0 (0.0%) |
| 18 to 34 Years | 2 (6.1%) | 0 (0.0%) |
| 35 to 64 Years | 15 (21.7%) | 3 (5.0%) |
| 65 to 74 Years | 6 (24.0%) | 10 (26.3%) |
| 75 Years and over | 17 (70.8%) | 16 (51.6%) |
Disability Class by Sex by Age in Simpson
Disability Class: Hearing Difficulty
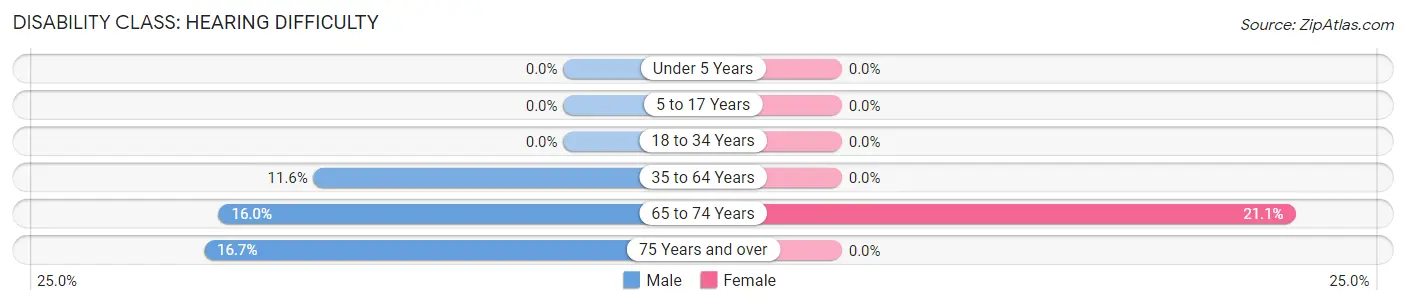
| Age Bracket | Male | Female |
| Under 5 Years | 0 (0.0%) | 0 (0.0%) |
| 5 to 17 Years | 0 (0.0%) | 0 (0.0%) |
| 18 to 34 Years | 0 (0.0%) | 0 (0.0%) |
| 35 to 64 Years | 8 (11.6%) | 0 (0.0%) |
| 65 to 74 Years | 4 (16.0%) | 8 (21.0%) |
| 75 Years and over | 4 (16.7%) | 0 (0.0%) |
Disability Class: Vision Difficulty
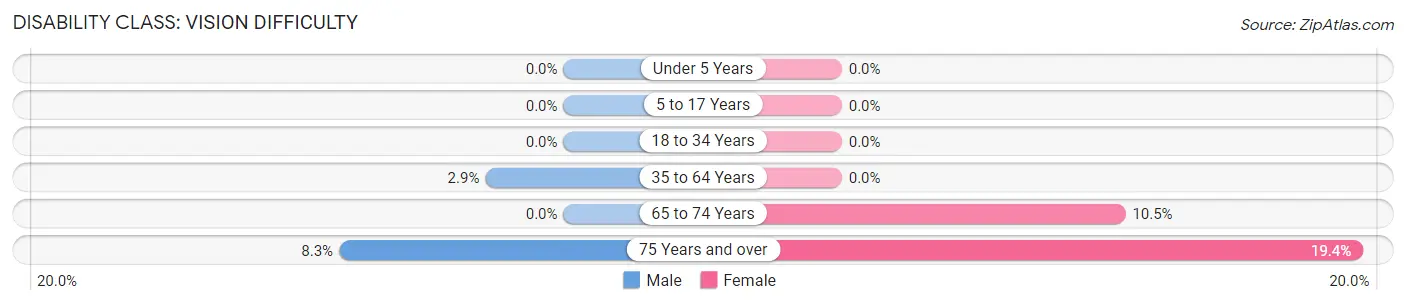
| Age Bracket | Male | Female |
| Under 5 Years | 0 (0.0%) | 0 (0.0%) |
| 5 to 17 Years | 0 (0.0%) | 0 (0.0%) |
| 18 to 34 Years | 0 (0.0%) | 0 (0.0%) |
| 35 to 64 Years | 2 (2.9%) | 0 (0.0%) |
| 65 to 74 Years | 0 (0.0%) | 4 (10.5%) |
| 75 Years and over | 2 (8.3%) | 6 (19.4%) |
Disability Class: Cognitive Difficulty
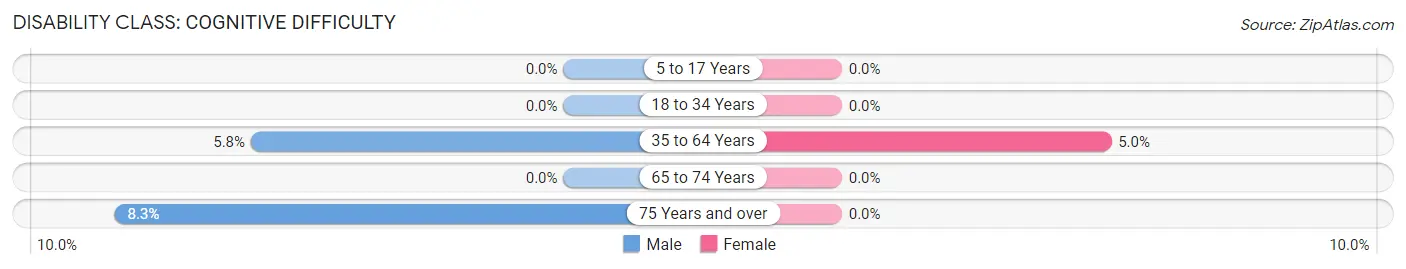
| Age Bracket | Male | Female |
| 5 to 17 Years | 0 (0.0%) | 0 (0.0%) |
| 18 to 34 Years | 0 (0.0%) | 0 (0.0%) |
| 35 to 64 Years | 4 (5.8%) | 3 (5.0%) |
| 65 to 74 Years | 0 (0.0%) | 0 (0.0%) |
| 75 Years and over | 2 (8.3%) | 0 (0.0%) |
Disability Class: Ambulatory Difficulty
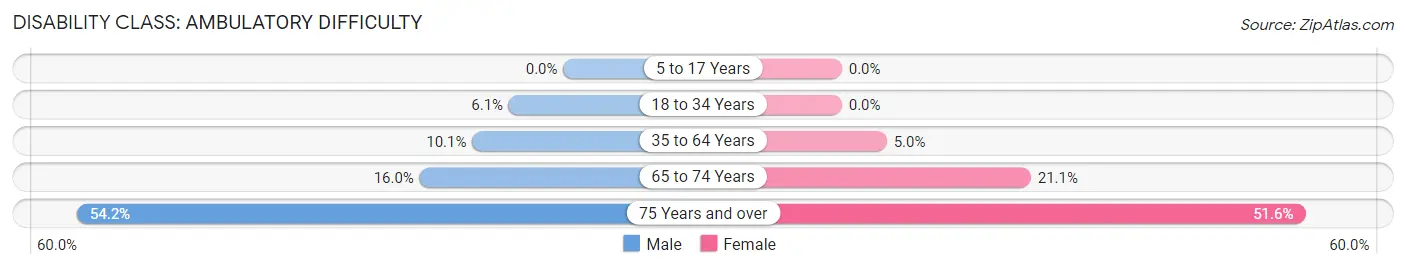
| Age Bracket | Male | Female |
| 5 to 17 Years | 0 (0.0%) | 0 (0.0%) |
| 18 to 34 Years | 2 (6.1%) | 0 (0.0%) |
| 35 to 64 Years | 7 (10.1%) | 3 (5.0%) |
| 65 to 74 Years | 4 (16.0%) | 8 (21.0%) |
| 75 Years and over | 13 (54.2%) | 16 (51.6%) |
Disability Class: Self-Care Difficulty
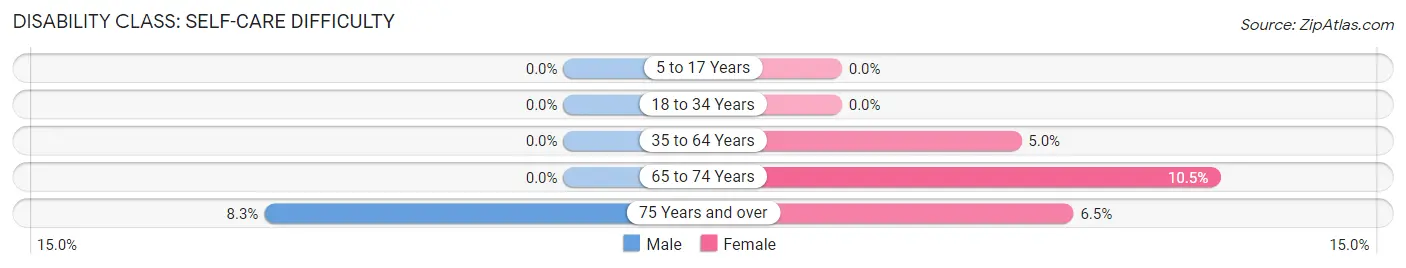
| Age Bracket | Male | Female |
| 5 to 17 Years | 0 (0.0%) | 0 (0.0%) |
| 18 to 34 Years | 0 (0.0%) | 0 (0.0%) |
| 35 to 64 Years | 0 (0.0%) | 3 (5.0%) |
| 65 to 74 Years | 0 (0.0%) | 4 (10.5%) |
| 75 Years and over | 2 (8.3%) | 2 (6.5%) |
Technology Access in Simpson
Computing Device Access in Simpson
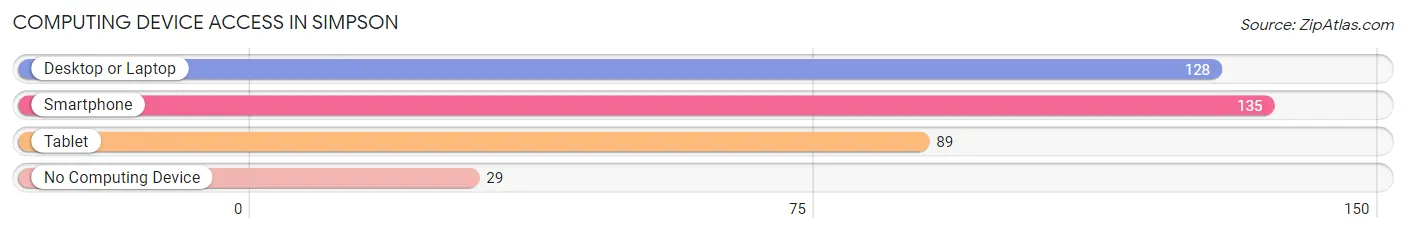
| Device Type | # Households | % Households |
| Desktop or Laptop | 128 | 74.4% |
| Smartphone | 135 | 78.5% |
| Tablet | 89 | 51.7% |
| No Computing Device | 29 | 16.9% |
| Total | 172 | 100.0% |
Internet Access in Simpson
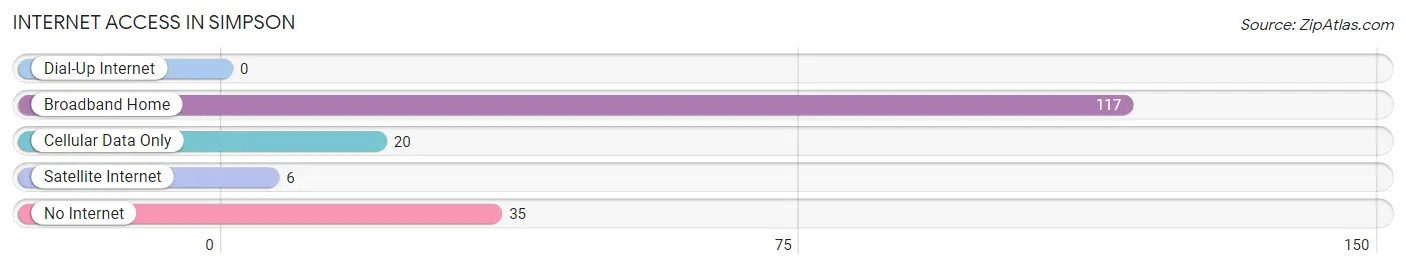
| Internet Type | # Households | % Households |
| Dial-Up Internet | 0 | 0.0% |
| Broadband Home | 117 | 68.0% |
| Cellular Data Only | 20 | 11.6% |
| Satellite Internet | 6 | 3.5% |
| No Internet | 35 | 20.3% |
| Total | 172 | 100.0% |
Simpson Summary
NC History
North Carolina is one of the original 13 colonies and was the first state to ratify the U.S. Constitution in 1789. The state was originally inhabited by Native American tribes, including the Cherokee, Catawba, and Tuscarora. The first European settlers arrived in the late 1500s, and the state was officially established in 1712. North Carolina was a major player in the American Revolution, and the state was the site of several major battles, including the Battle of Moore’s Creek Bridge and the Battle of Guilford Courthouse.
North Carolina was also a major player in the Civil War. The state was the site of several major battles, including the Battle of Bentonville and the Battle of Fort Fisher. After the war, the state was divided into two parts, with the western part becoming the state of Tennessee.
Geography
North Carolina is located in the southeastern United States, bordered by South Carolina, Georgia, Tennessee, and Virginia. The state is divided into three distinct regions: the Coastal Plain, the Piedmont, and the Appalachian Mountains. The Coastal Plain is a flat, low-lying area that is home to many of the state’s beaches and coastal towns. The Piedmont is a hilly region that is home to many of the state’s cities and towns. The Appalachian Mountains are the highest mountains in the eastern United States and are home to some of the state’s most beautiful scenery.
Economy
North Carolina’s economy is largely based on agriculture, manufacturing, and tourism. The state is the leading producer of tobacco in the United States and is also a major producer of cotton, soybeans, and peanuts. The state is also home to a number of major manufacturing companies, including Dell, IBM, and Goodyear. Tourism is also a major industry in the state, with visitors coming to enjoy the state’s beaches, mountains, and other attractions.
Demographics
As of the 2010 census, North Carolina had a population of 9.5 million people. The state is home to a diverse population, with the largest ethnic groups being African American (22%), White (68%), and Hispanic (7%). The state’s largest cities are Charlotte, Raleigh, Greensboro, and Winston-Salem. The state’s capital is Raleigh.
North Carolina is a diverse and vibrant state with a rich history and culture. The state is home to a variety of industries, from agriculture to manufacturing to tourism, and its population is diverse and growing. North Carolina is a great place to live, work, and visit.
Common Questions
What is Per Capita Income in Simpson?
Per Capita income in Simpson is $36,408.
What is the Median Family Income in Simpson?
Median Family Income in Simpson is $66,250.
What is the Median Household income in Simpson?
Median Household Income in Simpson is $57,500.
What is Income or Wage Gap in Simpson?
Income or Wage Gap in Simpson is 35.1%.
Women in Simpson earn 64.9 cents for every dollar earned by a man.
What is Inequality or Gini Index in Simpson?
Inequality or Gini Index in Simpson is 0.54.
What is the Total Population of Simpson?
Total Population of Simpson is 386.
What is the Total Male Population of Simpson?
Total Male Population of Simpson is 187.
What is the Total Female Population of Simpson?
Total Female Population of Simpson is 199.
What is the Ratio of Males per 100 Females in Simpson?
There are 93.97 Males per 100 Females in Simpson.
What is the Ratio of Females per 100 Males in Simpson?
There are 106.42 Females per 100 Males in Simpson.
What is the Median Population Age in Simpson?
Median Population Age in Simpson is 48.2 Years.
What is the Average Family Size in Simpson
Average Family Size in Simpson is 2.6 People.
What is the Average Household Size in Simpson
Average Household Size in Simpson is 2.2 People.
How Large is the Labor Force in Simpson?
There are 175 People in the Labor Forcein in Simpson.
What is the Percentage of People in the Labor Force in Simpson?
53.8% of People are in the Labor Force in Simpson.
What is the Unemployment Rate in Simpson?
Unemployment Rate in Simpson is 10.3%.