Hamlet, NC Map & Demographics
Hamlet Map
Hamlet Overview
$22,107
PER CAPITA INCOME
$55,442
AVG FAMILY INCOME
$34,798
AVG HOUSEHOLD INCOME
30.8%
WAGE / INCOME GAP [ % ]
69.2¢/ $1
WAGE / INCOME GAP [ $ ]
0.51
INEQUALITY / GINI INDEX
6,043
TOTAL POPULATION
2,859
MALE POPULATION
3,184
FEMALE POPULATION
89.79
MALES / 100 FEMALES
111.37
FEMALES / 100 MALES
37.3
MEDIAN AGE
3.5
AVG FAMILY SIZE
2.6
AVG HOUSEHOLD SIZE
2,414
LABOR FORCE [ PEOPLE ]
51.6%
PERCENT IN LABOR FORCE
10.6%
UNEMPLOYMENT RATE
Hamlet Zip Codes
Hamlet Area Codes
Income in Hamlet
Income Overview in Hamlet
Per Capita Income in Hamlet is $22,107, while median incomes of families and households are $55,442 and $34,798 respectively.
| Characteristic | Number | Measure |
| Per Capita Income | 6,043 | $22,107 |
| Median Family Income | 1,357 | $55,442 |
| Mean Family Income | 1,357 | $55,616 |
| Median Household Income | 2,291 | $34,798 |
| Mean Household Income | 2,291 | $54,336 |
| Income Deficit | 1,357 | $0 |
| Wage / Income Gap (%) | 6,043 | 30.79% |
| Wage / Income Gap ($) | 6,043 | 69.21¢ per $1 |
| Gini / Inequality Index | 6,043 | 0.51 |
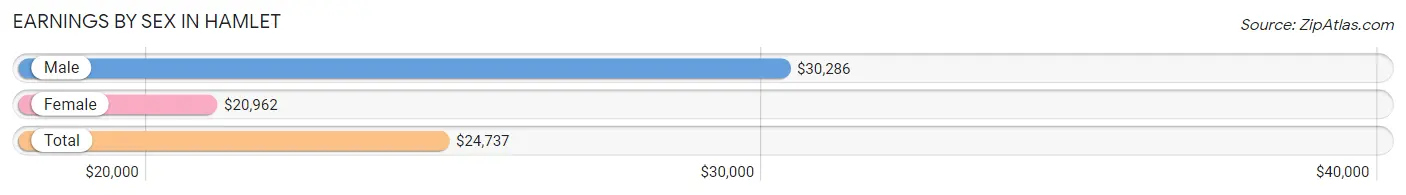
Earnings by Sex in Hamlet
Average Earnings in Hamlet are $24,737, $30,286 for men and $20,962 for women, a difference of 30.8%.
| Sex | Number | Average Earnings |
| Male | 1,211 (48.6%) | $30,286 |
| Female | 1,282 (51.4%) | $20,962 |
| Total | 2,493 (100.0%) | $24,737 |
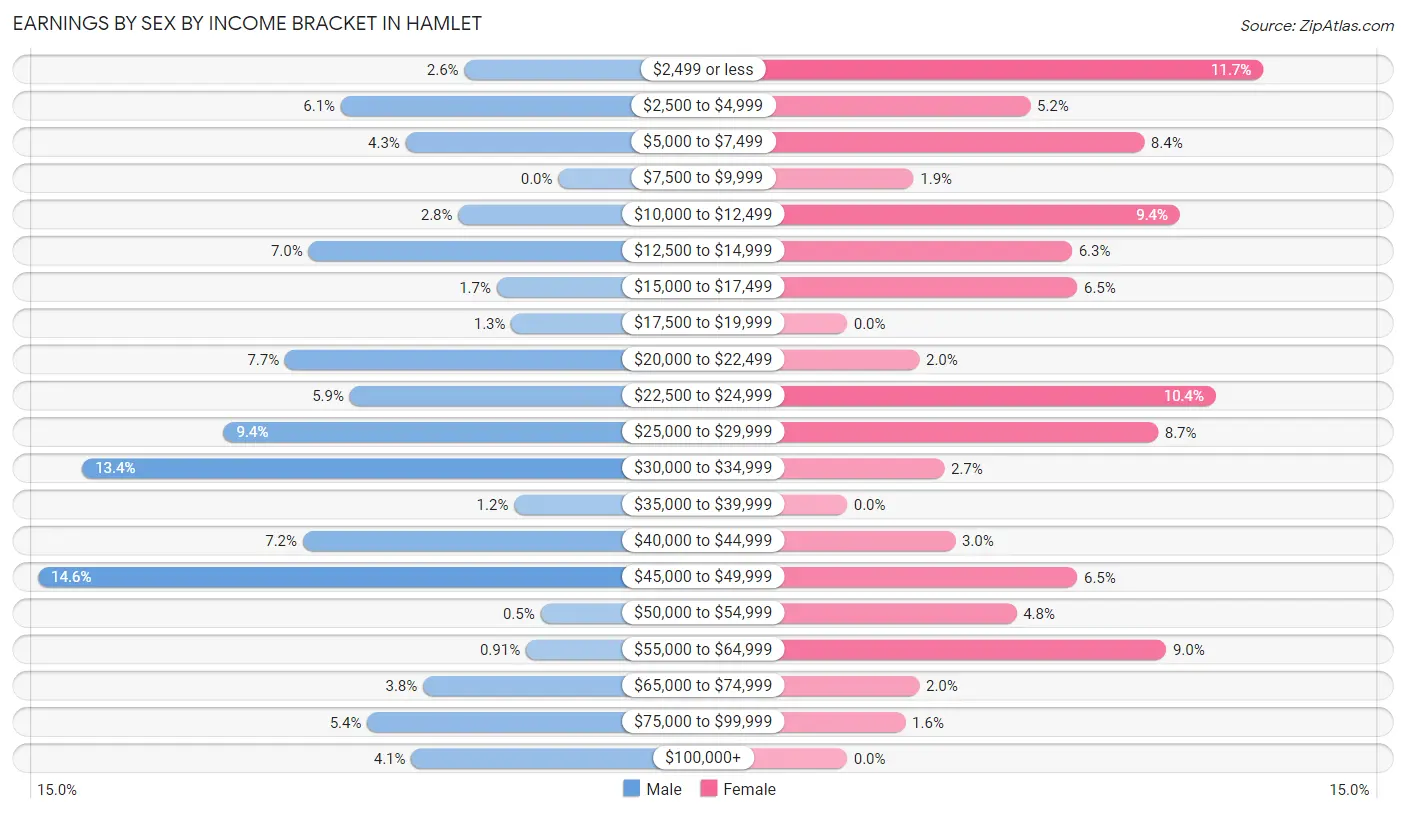
Earnings by Sex by Income Bracket in Hamlet
The most common earnings brackets in Hamlet are $45,000 to $49,999 for men (177 | 14.6%) and $2,499 or less for women (150 | 11.7%).
| Income | Male | Female |
| $2,499 or less | 32 (2.6%) | 150 (11.7%) |
| $2,500 to $4,999 | 74 (6.1%) | 66 (5.1%) |
| $5,000 to $7,499 | 52 (4.3%) | 107 (8.4%) |
| $7,500 to $9,999 | 0 (0.0%) | 24 (1.9%) |
| $10,000 to $12,499 | 34 (2.8%) | 120 (9.4%) |
| $12,500 to $14,999 | 85 (7.0%) | 81 (6.3%) |
| $15,000 to $17,499 | 21 (1.7%) | 83 (6.5%) |
| $17,500 to $19,999 | 16 (1.3%) | 0 (0.0%) |
| $20,000 to $22,499 | 93 (7.7%) | 26 (2.0%) |
| $22,500 to $24,999 | 71 (5.9%) | 133 (10.4%) |
| $25,000 to $29,999 | 114 (9.4%) | 112 (8.7%) |
| $30,000 to $34,999 | 162 (13.4%) | 35 (2.7%) |
| $35,000 to $39,999 | 15 (1.2%) | 0 (0.0%) |
| $40,000 to $44,999 | 87 (7.2%) | 39 (3.0%) |
| $45,000 to $49,999 | 177 (14.6%) | 83 (6.5%) |
| $50,000 to $54,999 | 6 (0.5%) | 61 (4.8%) |
| $55,000 to $64,999 | 11 (0.9%) | 115 (9.0%) |
| $65,000 to $74,999 | 46 (3.8%) | 26 (2.0%) |
| $75,000 to $99,999 | 65 (5.4%) | 21 (1.6%) |
| $100,000+ | 50 (4.1%) | 0 (0.0%) |
| Total | 1,211 (100.0%) | 1,282 (100.0%) |
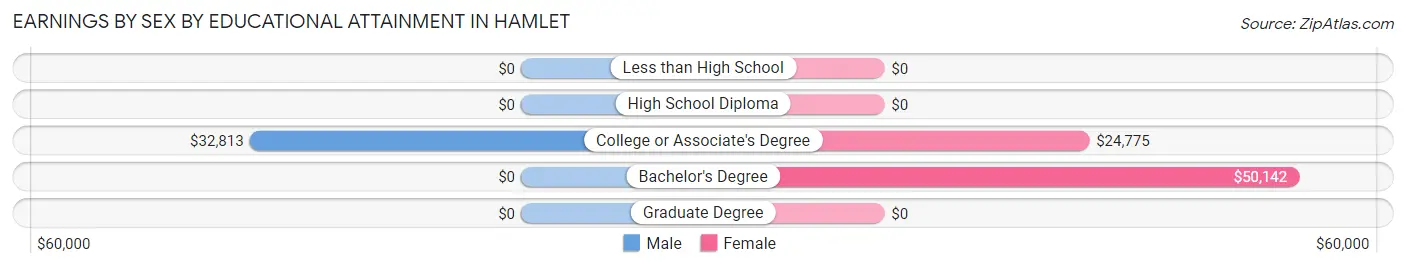
Earnings by Sex by Educational Attainment in Hamlet
Average earnings in Hamlet are $31,235 for men and $27,846 for women, a difference of 10.8%. Men with an educational attainment of college or associate's degree enjoy the highest average annual earnings of $32,813, while those with college or associate's degree education earn the least with $32,813. Women with an educational attainment of bachelor's degree earn the most with the average annual earnings of $50,142, while those with college or associate's degree education have the smallest earnings of $24,775.
| Educational Attainment | Male Income | Female Income |
| Less than High School | - | - |
| High School Diploma | - | - |
| College or Associate's Degree | $32,813 | $24,775 |
| Bachelor's Degree | - | - |
| Graduate Degree | - | - |
| Total | $31,235 | $27,846 |
Family Income in Hamlet
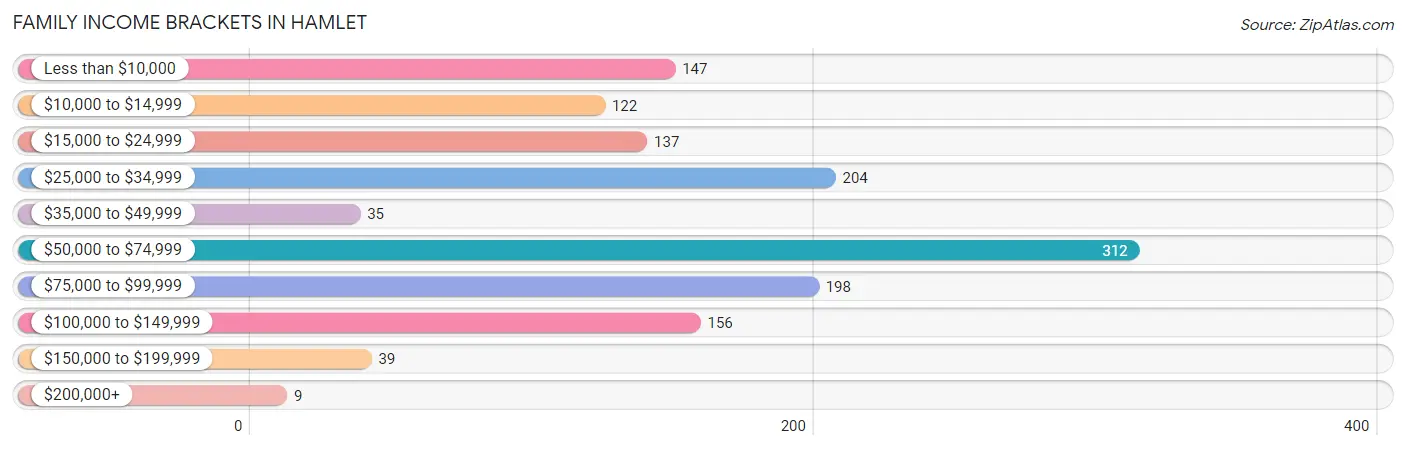
Family Income Brackets in Hamlet
According to the Hamlet family income data, there are 312 families falling into the $50,000 to $74,999 income range, which is the most common income bracket and makes up 23.0% of all families. Conversely, the $200,000+ income bracket is the least frequent group with only 9 families (0.7%) belonging to this category.
| Income Bracket | # Families | % Families |
| Less than $10,000 | 147 | 10.8% |
| $10,000 to $14,999 | 122 | 9.0% |
| $15,000 to $24,999 | 137 | 10.1% |
| $25,000 to $34,999 | 204 | 15.0% |
| $35,000 to $49,999 | 35 | 2.6% |
| $50,000 to $74,999 | 312 | 23.0% |
| $75,000 to $99,999 | 198 | 14.6% |
| $100,000 to $149,999 | 156 | 11.5% |
| $150,000 to $199,999 | 39 | 2.9% |
| $200,000+ | 9 | 0.7% |
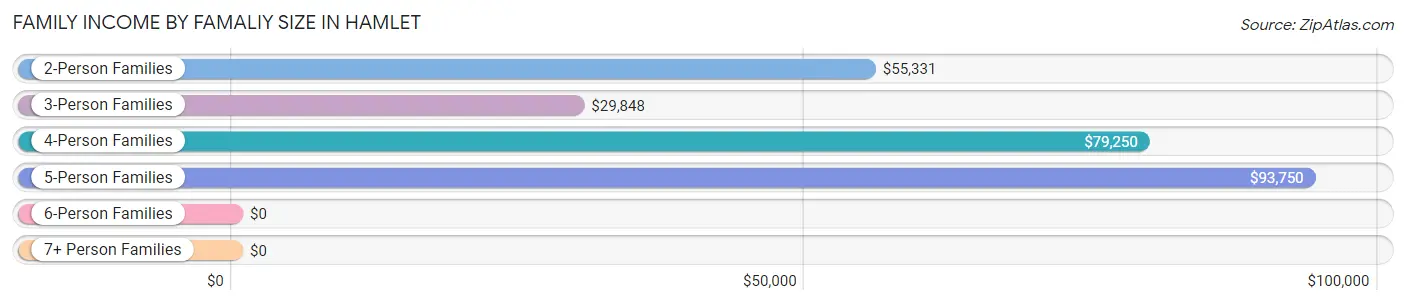
Family Income by Famaliy Size in Hamlet
5-person families (138 | 10.2%) account for the highest median family income in Hamlet with $93,750 per family, while 2-person families (646 | 47.6%) have the highest median income of $27,666 per family member.
| Income Bracket | # Families | Median Income |
| 2-Person Families | 646 (47.6%) | $55,331 |
| 3-Person Families | 312 (23.0%) | $29,848 |
| 4-Person Families | 261 (19.2%) | $79,250 |
| 5-Person Families | 138 (10.2%) | $93,750 |
| 6-Person Families | 0 (0.0%) | $0 |
| 7+ Person Families | 0 (0.0%) | $0 |
| Total | 1,357 (100.0%) | $55,442 |
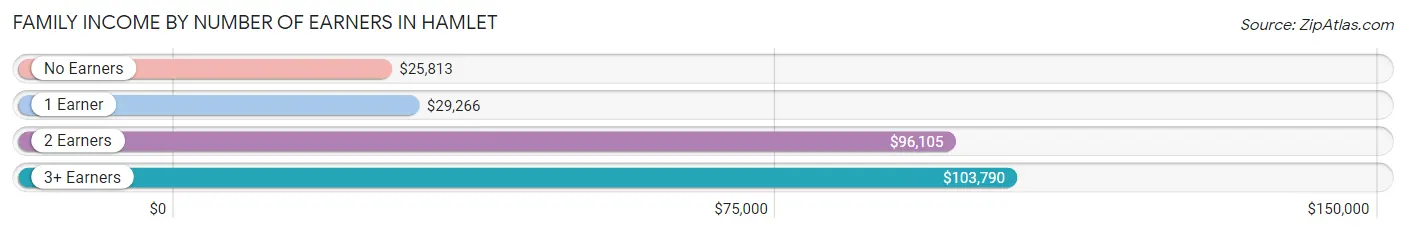
Family Income by Number of Earners in Hamlet
The median family income in Hamlet is $55,442, with families comprising 3+ earners (142) having the highest median family income of $103,790, while families with no earners (403) have the lowest median family income of $25,813, accounting for 10.5% and 29.7% of families, respectively.
| Number of Earners | # Families | Median Income |
| No Earners | 403 (29.7%) | $25,813 |
| 1 Earner | 533 (39.3%) | $29,266 |
| 2 Earners | 279 (20.6%) | $96,105 |
| 3+ Earners | 142 (10.5%) | $103,790 |
| Total | 1,357 (100.0%) | $55,442 |
Household Income in Hamlet
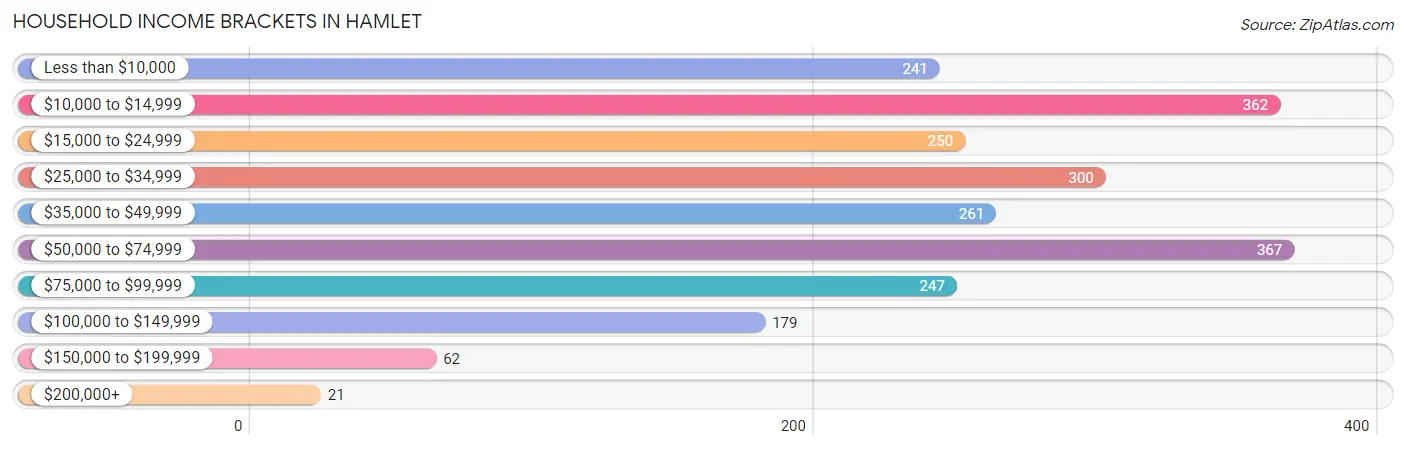
Household Income Brackets in Hamlet
With 367 households falling in the category, the $50,000 to $74,999 income range is the most frequent in Hamlet, accounting for 16.0% of all households. In contrast, only 21 households (0.9%) fall into the $200,000+ income bracket, making it the least populous group.
| Income Bracket | # Households | % Households |
| Less than $10,000 | 241 | 10.5% |
| $10,000 to $14,999 | 362 | 15.8% |
| $15,000 to $24,999 | 250 | 10.9% |
| $25,000 to $34,999 | 300 | 13.1% |
| $35,000 to $49,999 | 261 | 11.4% |
| $50,000 to $74,999 | 367 | 16.0% |
| $75,000 to $99,999 | 247 | 10.8% |
| $100,000 to $149,999 | 179 | 7.8% |
| $150,000 to $199,999 | 62 | 2.7% |
| $200,000+ | 21 | 0.9% |
Household Income by Householder Age in Hamlet
The median household income in Hamlet is $34,798, with the highest median household income of $38,969 found in the 65+ years age bracket for the primary householder. A total of 697 households (30.4%) fall into this category. Meanwhile, the 15 to 24 years age bracket for the primary householder has the lowest median household income of $0, with 66 households (2.9%) in this group.
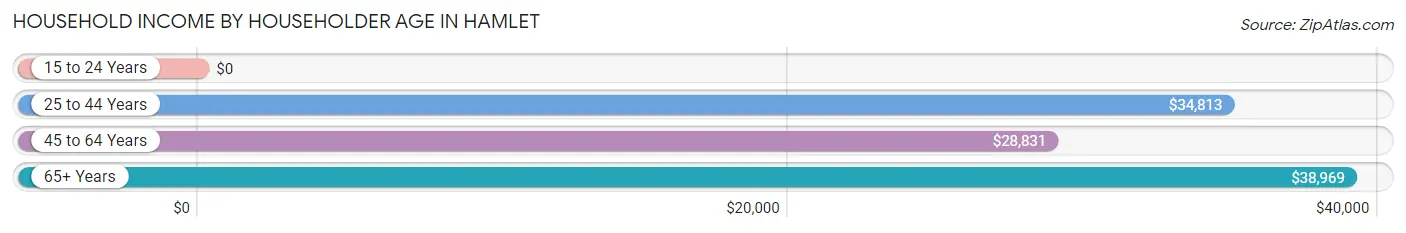
| Income Bracket | # Households | Median Income |
| 15 to 24 Years | 66 (2.9%) | $0 |
| 25 to 44 Years | 793 (34.6%) | $34,813 |
| 45 to 64 Years | 735 (32.1%) | $28,831 |
| 65+ Years | 697 (30.4%) | $38,969 |
| Total | 2,291 (100.0%) | $34,798 |
Poverty in Hamlet
Income Below Poverty by Sex and Age in Hamlet
With 26.7% poverty level for males and 23.7% for females among the residents of Hamlet, 5 year old males and 25 to 34 year old females are the most vulnerable to poverty, with 13 males (100.0%) and 185 females (56.6%) in their respective age groups living below the poverty level.
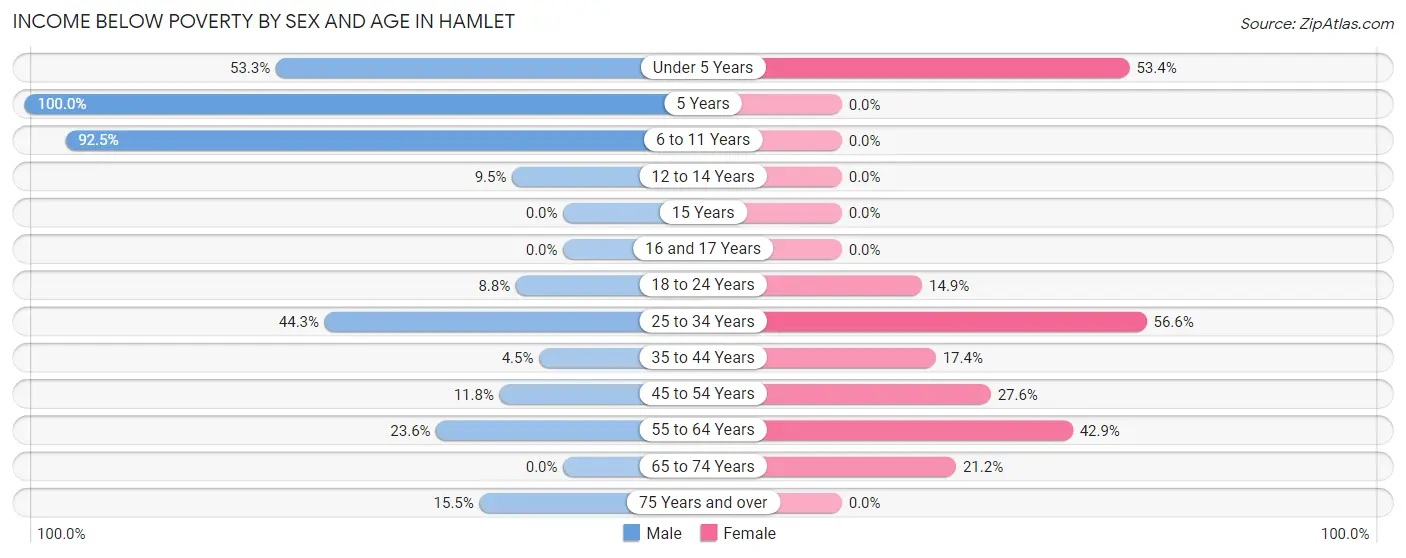
| Age Bracket | Male | Female |
| Under 5 Years | 24 (53.3%) | 102 (53.4%) |
| 5 Years | 13 (100.0%) | 0 (0.0%) |
| 6 to 11 Years | 392 (92.4%) | 0 (0.0%) |
| 12 to 14 Years | 34 (9.5%) | 0 (0.0%) |
| 15 Years | 0 (0.0%) | 0 (0.0%) |
| 16 and 17 Years | 0 (0.0%) | 0 (0.0%) |
| 18 to 24 Years | 38 (8.8%) | 41 (14.9%) |
| 25 to 34 Years | 112 (44.3%) | 185 (56.6%) |
| 35 to 44 Years | 12 (4.5%) | 83 (17.4%) |
| 45 to 54 Years | 58 (11.8%) | 97 (27.6%) |
| 55 to 64 Years | 53 (23.6%) | 126 (42.9%) |
| 65 to 74 Years | 0 (0.0%) | 96 (21.2%) |
| 75 Years and over | 23 (15.5%) | 0 (0.0%) |
| Total | 759 (26.7%) | 730 (23.7%) |
Income Above Poverty by Sex and Age in Hamlet
According to the poverty statistics in Hamlet, males aged 15 years and females aged 6 to 11 years are the age groups that are most secure financially, with 100.0% of males and 100.0% of females in these age groups living above the poverty line.
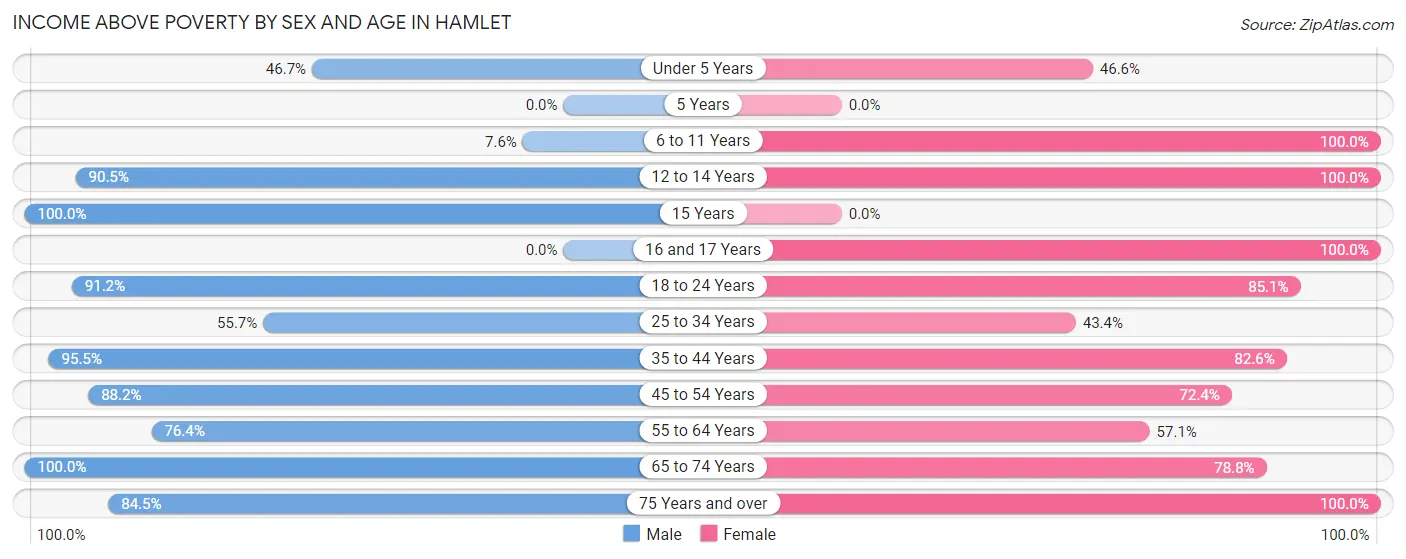
| Age Bracket | Male | Female |
| Under 5 Years | 21 (46.7%) | 89 (46.6%) |
| 5 Years | 0 (0.0%) | 0 (0.0%) |
| 6 to 11 Years | 32 (7.5%) | 110 (100.0%) |
| 12 to 14 Years | 325 (90.5%) | 147 (100.0%) |
| 15 Years | 76 (100.0%) | 0 (0.0%) |
| 16 and 17 Years | 0 (0.0%) | 204 (100.0%) |
| 18 to 24 Years | 395 (91.2%) | 234 (85.1%) |
| 25 to 34 Years | 141 (55.7%) | 142 (43.4%) |
| 35 to 44 Years | 257 (95.5%) | 393 (82.6%) |
| 45 to 54 Years | 433 (88.2%) | 254 (72.4%) |
| 55 to 64 Years | 172 (76.4%) | 168 (57.1%) |
| 65 to 74 Years | 111 (100.0%) | 357 (78.8%) |
| 75 Years and over | 125 (84.5%) | 255 (100.0%) |
| Total | 2,088 (73.3%) | 2,353 (76.3%) |
Income Below Poverty Among Married-Couple Families in Hamlet
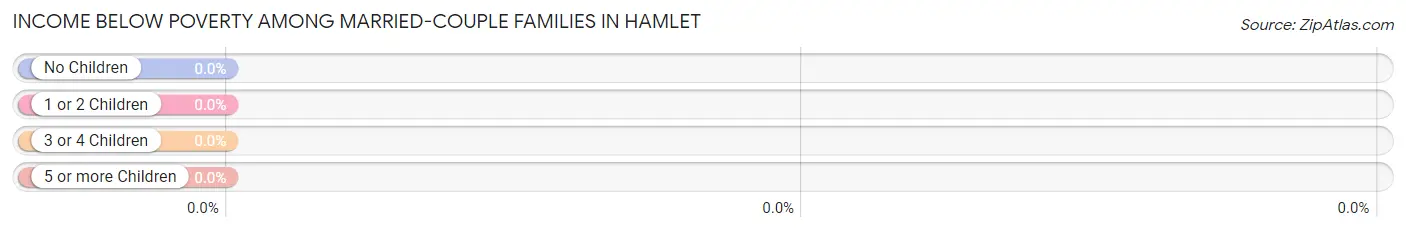
| Children | Above Poverty | Below Poverty |
| No Children | 295 (100.0%) | 0 (0.0%) |
| 1 or 2 Children | 345 (100.0%) | 0 (0.0%) |
| 3 or 4 Children | 69 (100.0%) | 0 (0.0%) |
| 5 or more Children | 0 (0.0%) | 0 (0.0%) |
| Total | 709 (100.0%) | 0 (0.0%) |
Income Below Poverty Among Single-Parent Households in Hamlet
According to the poverty data in Hamlet, 23.7% or 38 single-father households and 72.1% or 352 single-mother households are living below the poverty line. Among single-father households, those with 1 or 2 children have the highest poverty rate, with 38 households (65.5%) experiencing poverty. Likewise, among single-mother households, those with 3 or 4 children have the highest poverty rate, with 70 households (100.0%) falling below the poverty line.
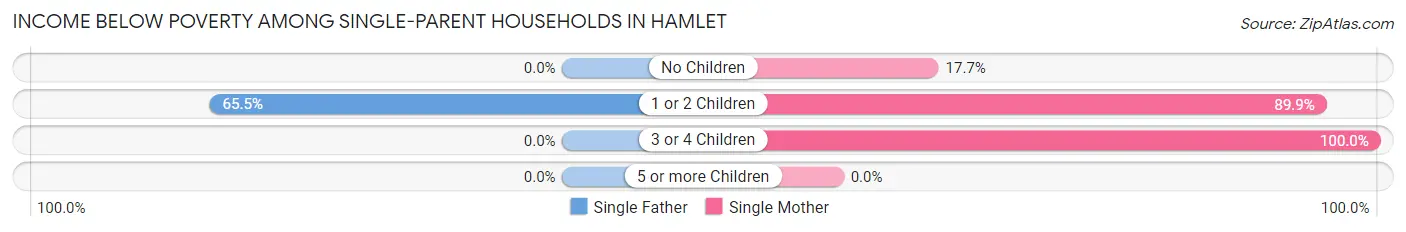
| Children | Single Father | Single Mother |
| No Children | 0 (0.0%) | 23 (17.7%) |
| 1 or 2 Children | 38 (65.5%) | 259 (89.9%) |
| 3 or 4 Children | 0 (0.0%) | 70 (100.0%) |
| 5 or more Children | 0 (0.0%) | 0 (0.0%) |
| Total | 38 (23.7%) | 352 (72.1%) |
Income Below Poverty Among Married-Couple vs Single-Parent Households in Hamlet
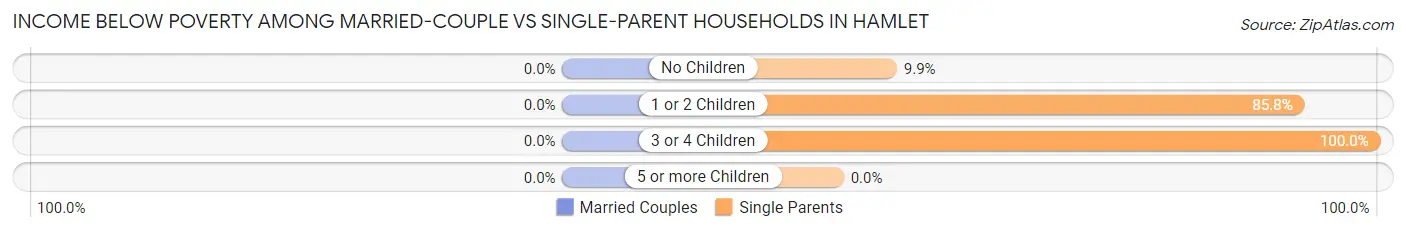
| Children | Married-Couple Families | Single-Parent Households |
| No Children | 0 (0.0%) | 23 (9.9%) |
| 1 or 2 Children | 0 (0.0%) | 297 (85.8%) |
| 3 or 4 Children | 0 (0.0%) | 70 (100.0%) |
| 5 or more Children | 0 (0.0%) | 0 (0.0%) |
| Total | 0 (0.0%) | 390 (60.2%) |
Race in Hamlet
The most populous races in Hamlet are White / Caucasian (3,160 | 52.3%), Black / African American (2,729 | 45.2%), and Hispanic or Latino (79 | 1.3%).
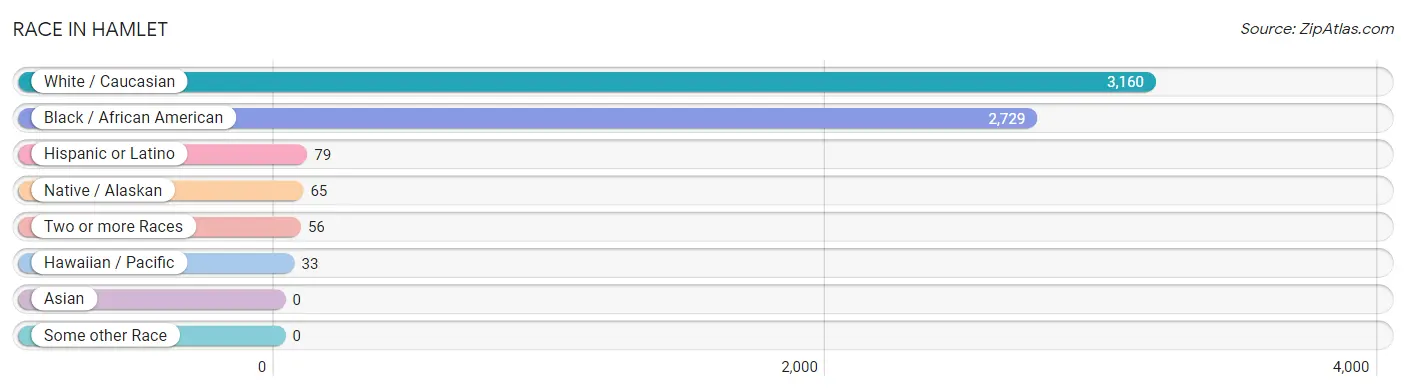
| Race | # Population | % Population |
| Asian | 0 | 0.0% |
| Black / African American | 2,729 | 45.2% |
| Hawaiian / Pacific | 33 | 0.5% |
| Hispanic or Latino | 79 | 1.3% |
| Native / Alaskan | 65 | 1.1% |
| White / Caucasian | 3,160 | 52.3% |
| Two or more Races | 56 | 0.9% |
| Some other Race | 0 | 0.0% |
| Total | 6,043 | 100.0% |
Ancestry in Hamlet
The most populous ancestries reported in Hamlet are English (465 | 7.7%), American (248 | 4.1%), German (165 | 2.7%), Scotch-Irish (135 | 2.2%), and Irish (122 | 2.0%), together accounting for 18.8% of all Hamlet residents.
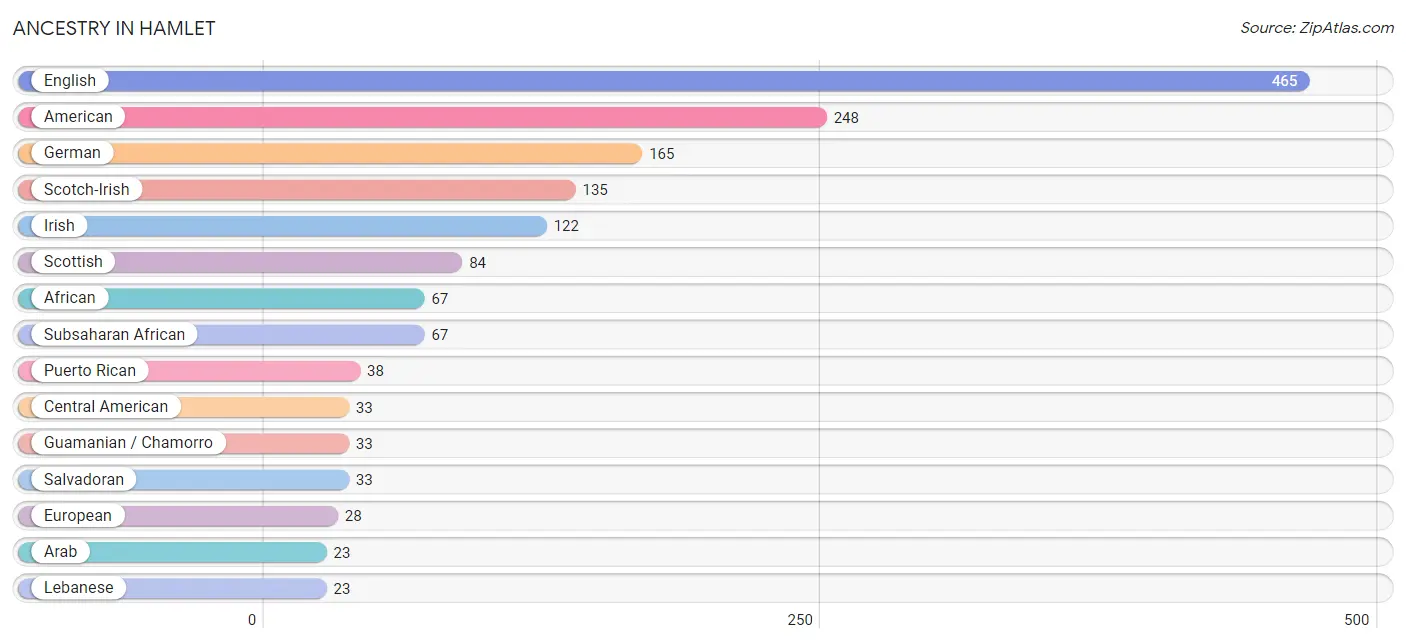
| Ancestry | # Population | % Population |
| African | 67 | 1.1% |
| American | 248 | 4.1% |
| Arab | 23 | 0.4% |
| Central American | 33 | 0.5% |
| Dutch | 18 | 0.3% |
| English | 465 | 7.7% |
| European | 28 | 0.5% |
| French | 8 | 0.1% |
| German | 165 | 2.7% |
| Guamanian / Chamorro | 33 | 0.5% |
| Irish | 122 | 2.0% |
| Lebanese | 23 | 0.4% |
| Lithuanian | 12 | 0.2% |
| Lumbee | 14 | 0.2% |
| Mexican | 8 | 0.1% |
| Puerto Rican | 38 | 0.6% |
| Salvadoran | 33 | 0.5% |
| Scotch-Irish | 135 | 2.2% |
| Scottish | 84 | 1.4% |
| Sioux | 8 | 0.1% |
| Subsaharan African | 67 | 1.1% |
| Swedish | 14 | 0.2% | View All 22 Rows |
Immigrants in Hamlet
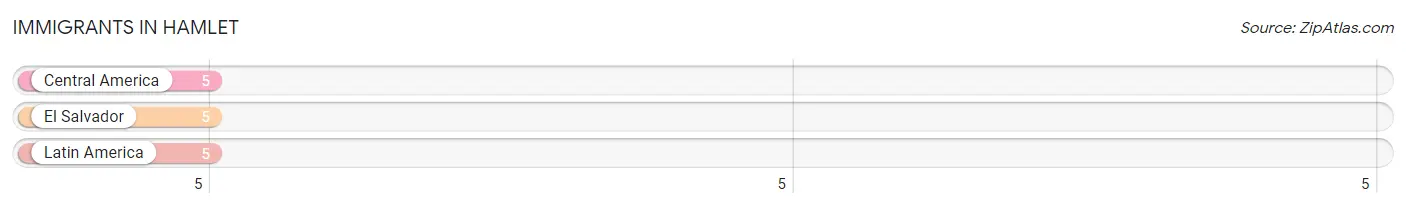
The most numerous immigrant groups reported in Hamlet came from Central America (5 | 0.1%), El Salvador (5 | 0.1%), and Latin America (5 | 0.1%), together accounting for 0.2% of all Hamlet residents.
| Immigration Origin | # Population | % Population |
| Central America | 5 | 0.1% |
| El Salvador | 5 | 0.1% |
| Latin America | 5 | 0.1% | View All 3 Rows |
Sex and Age in Hamlet
Sex and Age in Hamlet
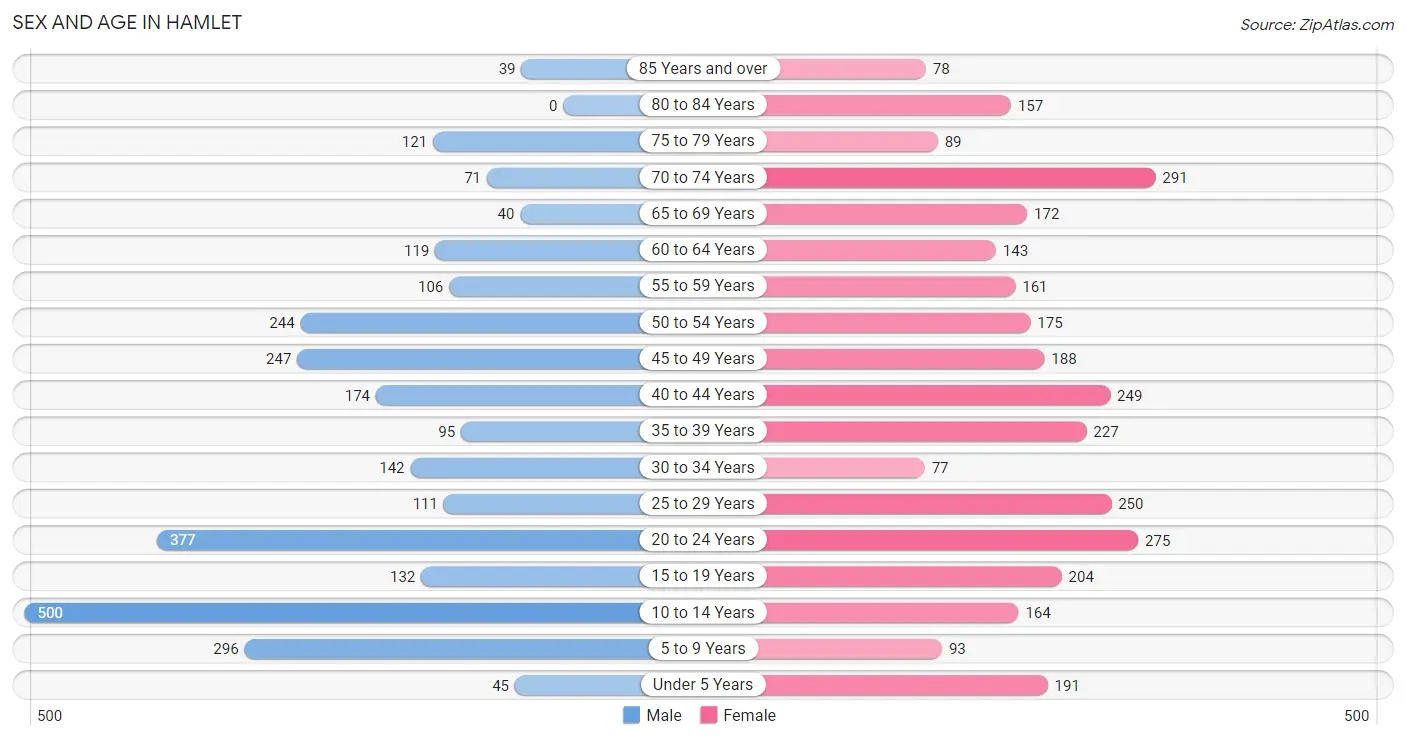
The most populous age groups in Hamlet are 10 to 14 Years (500 | 17.5%) for men and 70 to 74 Years (291 | 9.1%) for women.
| Age Bracket | Male | Female |
| Under 5 Years | 45 (1.6%) | 191 (6.0%) |
| 5 to 9 Years | 296 (10.3%) | 93 (2.9%) |
| 10 to 14 Years | 500 (17.5%) | 164 (5.1%) |
| 15 to 19 Years | 132 (4.6%) | 204 (6.4%) |
| 20 to 24 Years | 377 (13.2%) | 275 (8.6%) |
| 25 to 29 Years | 111 (3.9%) | 250 (7.9%) |
| 30 to 34 Years | 142 (5.0%) | 77 (2.4%) |
| 35 to 39 Years | 95 (3.3%) | 227 (7.1%) |
| 40 to 44 Years | 174 (6.1%) | 249 (7.8%) |
| 45 to 49 Years | 247 (8.6%) | 188 (5.9%) |
| 50 to 54 Years | 244 (8.5%) | 175 (5.5%) |
| 55 to 59 Years | 106 (3.7%) | 161 (5.1%) |
| 60 to 64 Years | 119 (4.2%) | 143 (4.5%) |
| 65 to 69 Years | 40 (1.4%) | 172 (5.4%) |
| 70 to 74 Years | 71 (2.5%) | 291 (9.1%) |
| 75 to 79 Years | 121 (4.2%) | 89 (2.8%) |
| 80 to 84 Years | 0 (0.0%) | 157 (4.9%) |
| 85 Years and over | 39 (1.4%) | 78 (2.5%) |
| Total | 2,859 (100.0%) | 3,184 (100.0%) |
Families and Households in Hamlet
Median Family Size in Hamlet
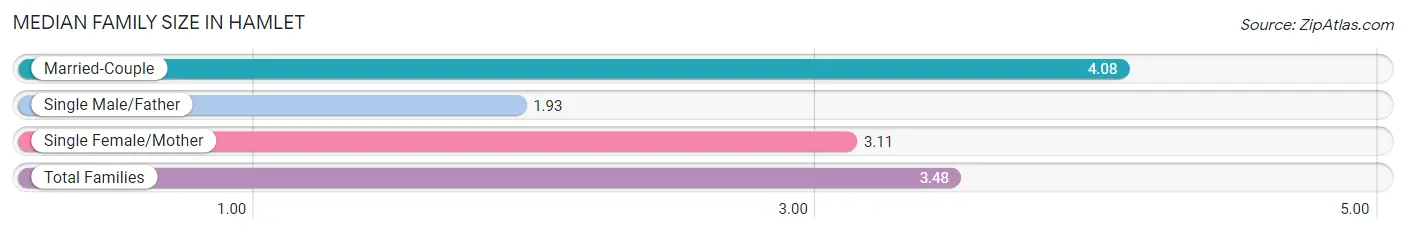
The median family size in Hamlet is 3.48 persons per family, with married-couple families (709 | 52.2%) accounting for the largest median family size of 4.08 persons per family. On the other hand, single male/father families (160 | 11.8%) represent the smallest median family size with 1.93 persons per family.
| Family Type | # Families | Family Size |
| Married-Couple | 709 (52.2%) | 4.08 |
| Single Male/Father | 160 (11.8%) | 1.93 |
| Single Female/Mother | 488 (36.0%) | 3.11 |
| Total Families | 1,357 (100.0%) | 3.48 |
Median Household Size in Hamlet
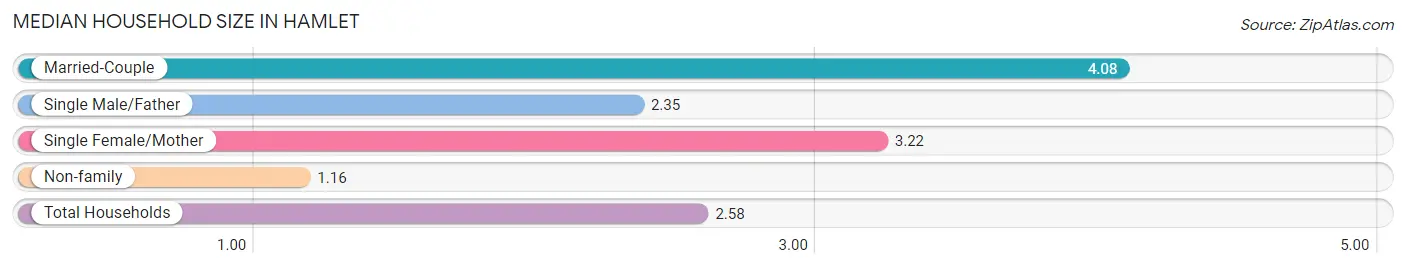
The median household size in Hamlet is 2.58 persons per household, with married-couple households (709 | 30.9%) accounting for the largest median household size of 4.08 persons per household. non-family households (934 | 40.8%) represent the smallest median household size with 1.16 persons per household.
| Household Type | # Households | Household Size |
| Married-Couple | 709 (30.9%) | 4.08 |
| Single Male/Father | 160 (7.0%) | 2.35 |
| Single Female/Mother | 488 (21.3%) | 3.22 |
| Non-family | 934 (40.8%) | 1.16 |
| Total Households | 2,291 (100.0%) | 2.58 |
Household Size by Marriage Status in Hamlet
Out of a total of 2,291 households in Hamlet, 1,357 (59.2%) are family households, while 934 (40.8%) are nonfamily households. The most numerous type of family households are 2-person households, comprising 554, and the most common type of nonfamily households are 1-person households, comprising 843.
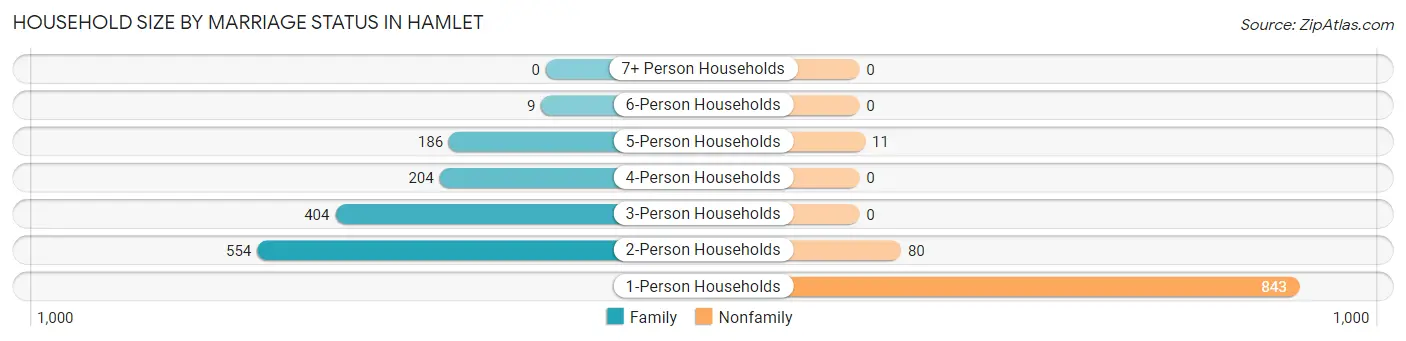
| Household Size | Family Households | Nonfamily Households |
| 1-Person Households | - | 843 (36.8%) |
| 2-Person Households | 554 (24.2%) | 80 (3.5%) |
| 3-Person Households | 404 (17.6%) | 0 (0.0%) |
| 4-Person Households | 204 (8.9%) | 0 (0.0%) |
| 5-Person Households | 186 (8.1%) | 11 (0.5%) |
| 6-Person Households | 9 (0.4%) | 0 (0.0%) |
| 7+ Person Households | 0 (0.0%) | 0 (0.0%) |
| Total | 1,357 (59.2%) | 934 (40.8%) |
Female Fertility in Hamlet
Fertility by Age in Hamlet
Average fertility rate in Hamlet is 156.0 births per 1,000 women. Women in the age bracket of 35 to 50 years have the highest fertility rate with 188.0 births per 1,000 women. Women in the age bracket of 35 to 50 years acount for 55.2% of all women with births.
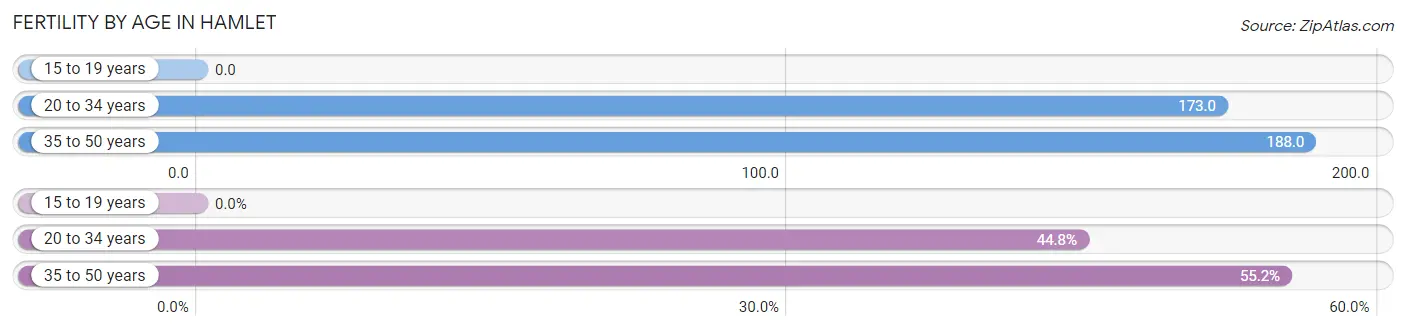
| Age Bracket | Women with Births | Births / 1,000 Women |
| 15 to 19 years | 0 (0.0%) | 0.0 |
| 20 to 34 years | 104 (44.8%) | 173.0 |
| 35 to 50 years | 128 (55.2%) | 188.0 |
| Total | 232 (100.0%) | 156.0 |
Fertility by Age by Marriage Status in Hamlet
55.2% of women with births (232) in Hamlet are married. The highest percentage of unmarried women with births falls into 20 to 34 years age bracket with 100.0% of them unmarried at the time of birth, while the lowest percentage of unmarried women with births belong to 35 to 50 years age bracket with 0.0% of them unmarried.
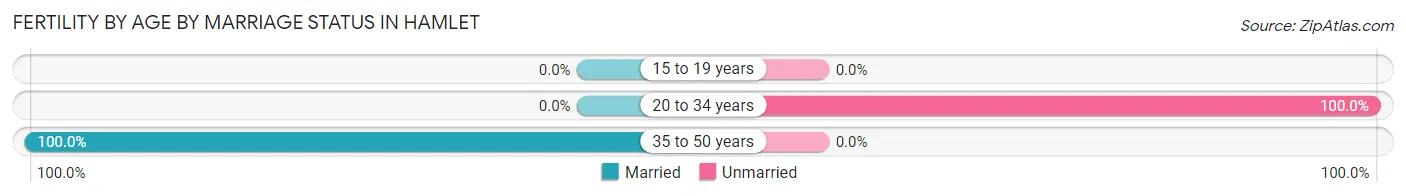
| Age Bracket | Married | Unmarried |
| 15 to 19 years | 0 (0.0%) | 0 (0.0%) |
| 20 to 34 years | 0 (0.0%) | 104 (100.0%) |
| 35 to 50 years | 128 (100.0%) | 0 (0.0%) |
| Total | 128 (55.2%) | 104 (44.8%) |
Fertility by Education in Hamlet
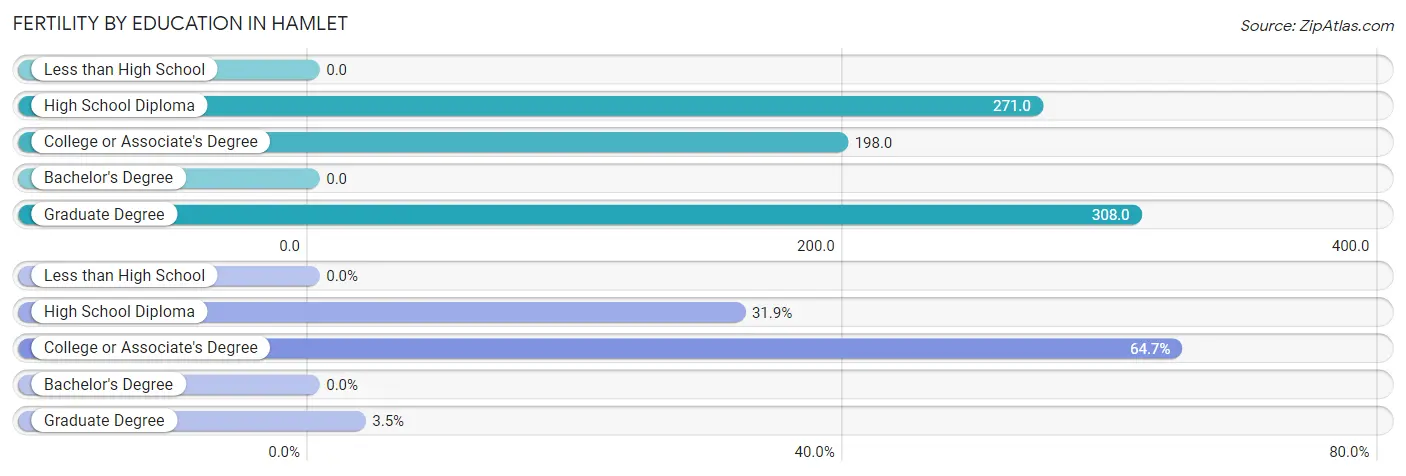
| Educational Attainment | Women with Births | Births / 1,000 Women |
| Less than High School | 0 (0.0%) | 0.0 |
| High School Diploma | 74 (31.9%) | 271.0 |
| College or Associate's Degree | 150 (64.7%) | 198.0 |
| Bachelor's Degree | 0 (0.0%) | 0.0 |
| Graduate Degree | 8 (3.5%) | 308.0 |
| Total | 232 (100.0%) | 156.0 |
Fertility by Education by Marriage Status in Hamlet
44.8% of women with births in Hamlet are unmarried. Women with the educational attainment of graduate degree are most likely to be married with 100.0% of them married at childbirth, while women with the educational attainment of college or associate's degree are least likely to be married with 54.0% of them unmarried at childbirth.
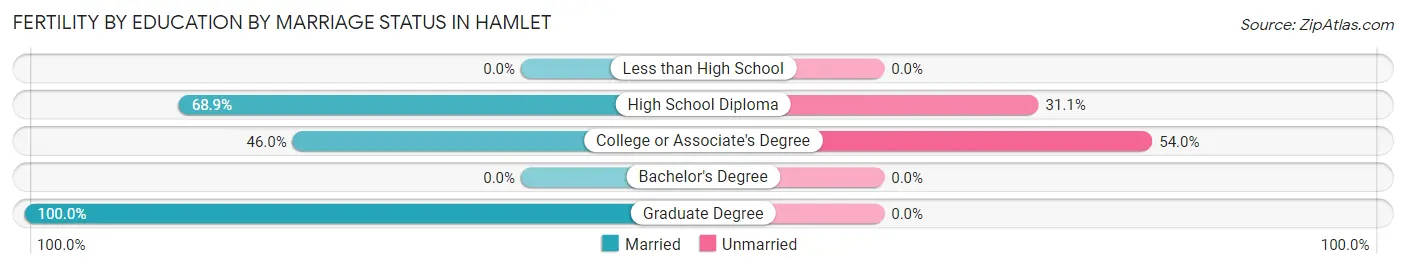
| Educational Attainment | Married | Unmarried |
| Less than High School | 0 (0.0%) | 0 (0.0%) |
| High School Diploma | 51 (68.9%) | 23 (31.1%) |
| College or Associate's Degree | 69 (46.0%) | 81 (54.0%) |
| Bachelor's Degree | 0 (0.0%) | 0 (0.0%) |
| Graduate Degree | 8 (100.0%) | 0 (0.0%) |
| Total | 128 (55.2%) | 104 (44.8%) |
Employment Characteristics in Hamlet
Employment by Class of Employer in Hamlet
Among the 2,109 employed individuals in Hamlet, private company employees (1,433 | 67.9%), state government employees (208 | 9.9%), and local government employees (191 | 9.1%) make up the most common classes of employment.
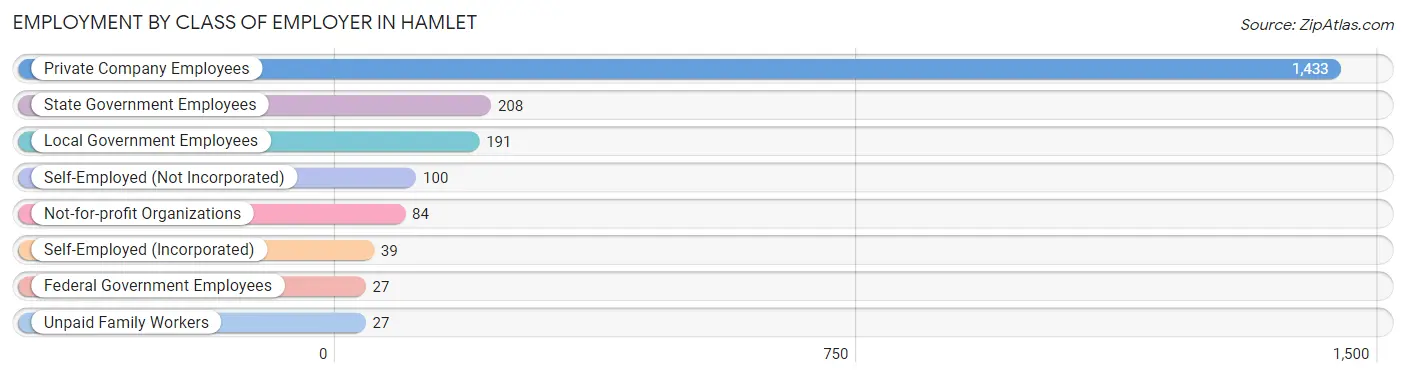
| Employer Class | # Employees | % Employees |
| Private Company Employees | 1,433 | 67.9% |
| Self-Employed (Incorporated) | 39 | 1.8% |
| Self-Employed (Not Incorporated) | 100 | 4.7% |
| Not-for-profit Organizations | 84 | 4.0% |
| Local Government Employees | 191 | 9.1% |
| State Government Employees | 208 | 9.9% |
| Federal Government Employees | 27 | 1.3% |
| Unpaid Family Workers | 27 | 1.3% |
| Total | 2,109 | 100.0% |
Employment Status by Age in Hamlet
According to the labor force statistics for Hamlet, out of the total population over 16 years of age (4,678), 51.6% or 2,414 individuals are in the labor force, with 10.6% or 256 of them unemployed. The age group with the highest labor force participation rate is 25 to 29 years, with 100.0% or 361 individuals in the labor force. Within the labor force, the 16 to 19 years age range has the highest percentage of unemployed individuals, with 100.0% or 137 of them being unemployed.
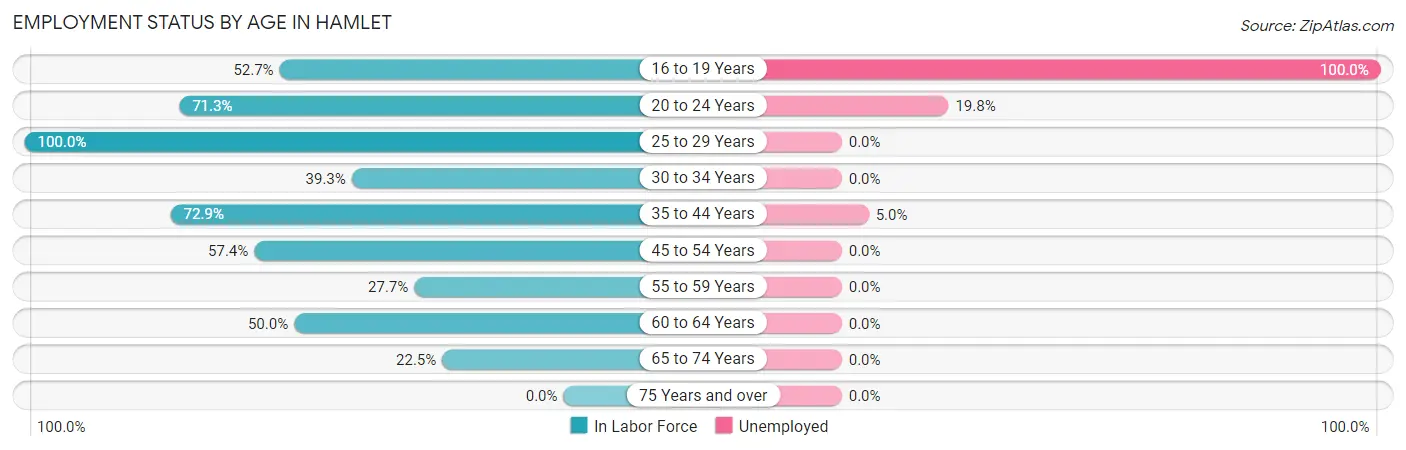
| Age Bracket | In Labor Force | Unemployed |
| 16 to 19 Years | 137 (52.7%) | 137 (100.0%) |
| 20 to 24 Years | 465 (71.3%) | 92 (19.8%) |
| 25 to 29 Years | 361 (100.0%) | 0 (0.0%) |
| 30 to 34 Years | 86 (39.3%) | 0 (0.0%) |
| 35 to 44 Years | 543 (72.9%) | 27 (5.0%) |
| 45 to 54 Years | 490 (57.4%) | 0 (0.0%) |
| 55 to 59 Years | 74 (27.7%) | 0 (0.0%) |
| 60 to 64 Years | 131 (50.0%) | 0 (0.0%) |
| 65 to 74 Years | 129 (22.5%) | 0 (0.0%) |
| 75 Years and over | 0 (0.0%) | 0 (0.0%) |
| Total | 2,414 (51.6%) | 256 (10.6%) |
Employment Status by Educational Attainment in Hamlet
According to labor force statistics for Hamlet, 62.2% of individuals (1,684) out of the total population between 25 and 64 years of age (2,708) are in the labor force, with 1.6% or 27 of them being unemployed. The group with the highest labor force participation rate are those with the educational attainment of bachelor's degree or higher, with 92.3% or 217 individuals in the labor force. Within the labor force, individuals with bachelor's degree or higher education have the highest percentage of unemployment, with 4.6% or 10 of them being unemployed.
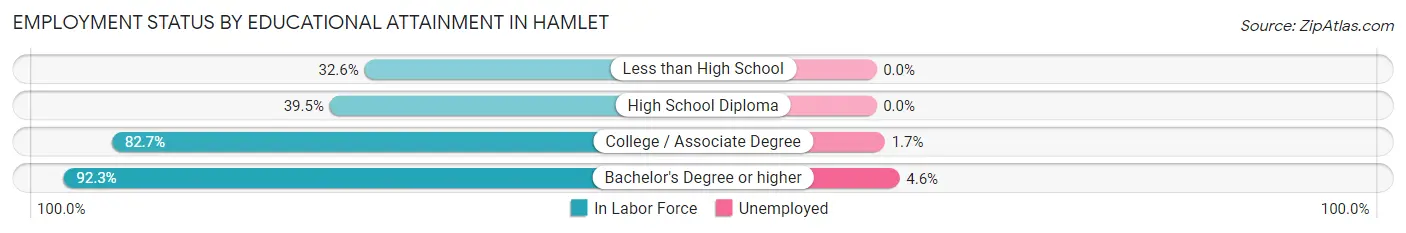
| Educational Attainment | In Labor Force | Unemployed |
| Less than High School | 108 (32.6%) | 0 (0.0%) |
| High School Diploma | 377 (39.5%) | 0 (0.0%) |
| College / Associate Degree | 982 (82.7%) | 20 (1.7%) |
| Bachelor's Degree or higher | 217 (92.3%) | 11 (4.6%) |
| Total | 1,684 (62.2%) | 43 (1.6%) |
Employment Occupations by Sex in Hamlet
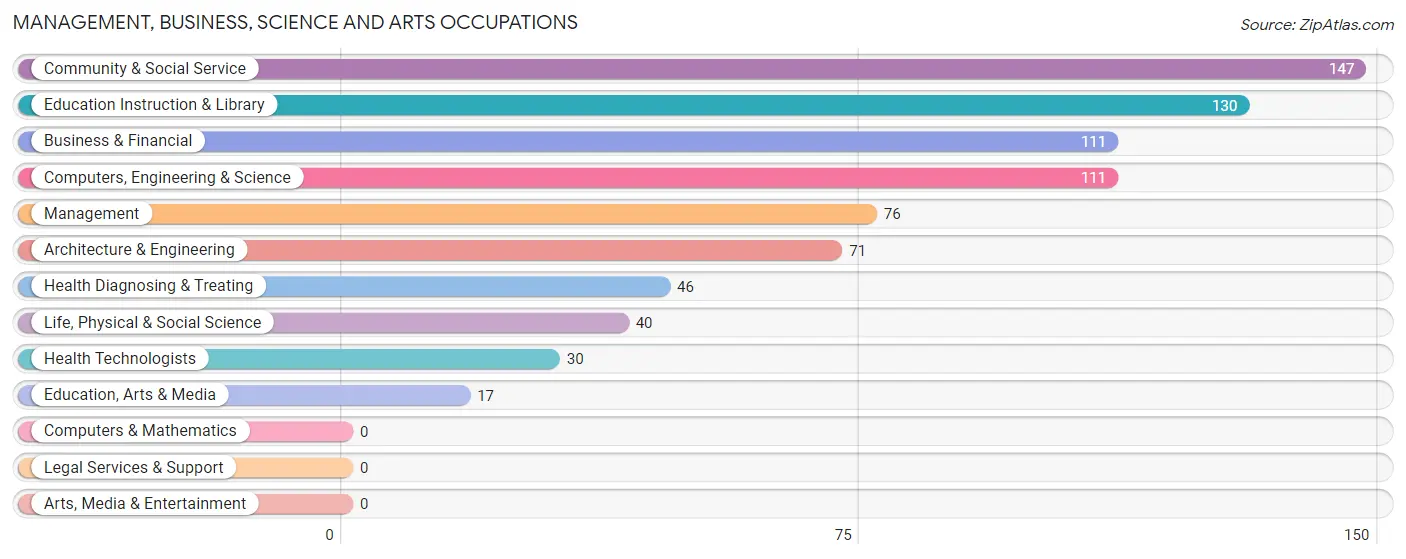
Management, Business, Science and Arts Occupations
The most common Management, Business, Science and Arts occupations in Hamlet are Community & Social Service (147 | 6.8%), Education Instruction & Library (130 | 6.0%), Business & Financial (111 | 5.1%), Computers, Engineering & Science (111 | 5.1%), and Management (76 | 3.5%).
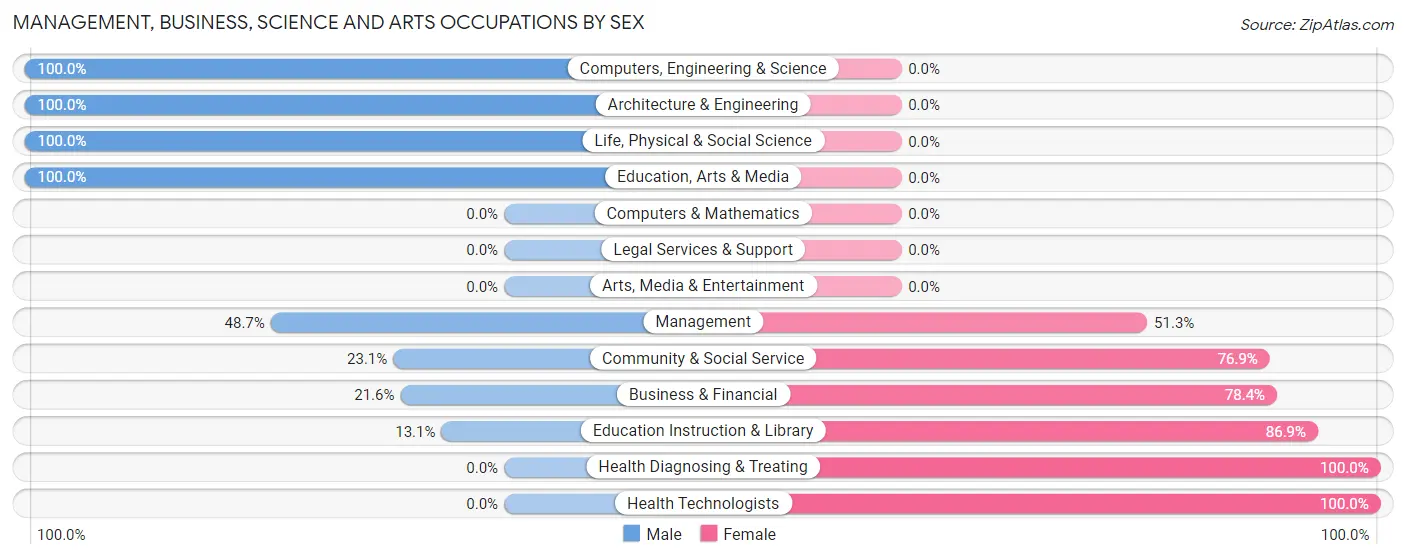
Management, Business, Science and Arts Occupations by Sex
Within the Management, Business, Science and Arts occupations in Hamlet, the most male-oriented occupations are Computers, Engineering & Science (100.0%), Architecture & Engineering (100.0%), and Life, Physical & Social Science (100.0%), while the most female-oriented occupations are Health Diagnosing & Treating (100.0%), Health Technologists (100.0%), and Education Instruction & Library (86.9%).
| Occupation | Male | Female |
| Management | 37 (48.7%) | 39 (51.3%) |
| Business & Financial | 24 (21.6%) | 87 (78.4%) |
| Computers, Engineering & Science | 111 (100.0%) | 0 (0.0%) |
| Computers & Mathematics | 0 (0.0%) | 0 (0.0%) |
| Architecture & Engineering | 71 (100.0%) | 0 (0.0%) |
| Life, Physical & Social Science | 40 (100.0%) | 0 (0.0%) |
| Community & Social Service | 34 (23.1%) | 113 (76.9%) |
| Education, Arts & Media | 17 (100.0%) | 0 (0.0%) |
| Legal Services & Support | 0 (0.0%) | 0 (0.0%) |
| Education Instruction & Library | 17 (13.1%) | 113 (86.9%) |
| Arts, Media & Entertainment | 0 (0.0%) | 0 (0.0%) |
| Health Diagnosing & Treating | 0 (0.0%) | 46 (100.0%) |
| Health Technologists | 0 (0.0%) | 30 (100.0%) |
| Total (Category) | 206 (42.0%) | 285 (58.0%) |
| Total (Overall) | 1,092 (50.6%) | 1,068 (49.4%) |
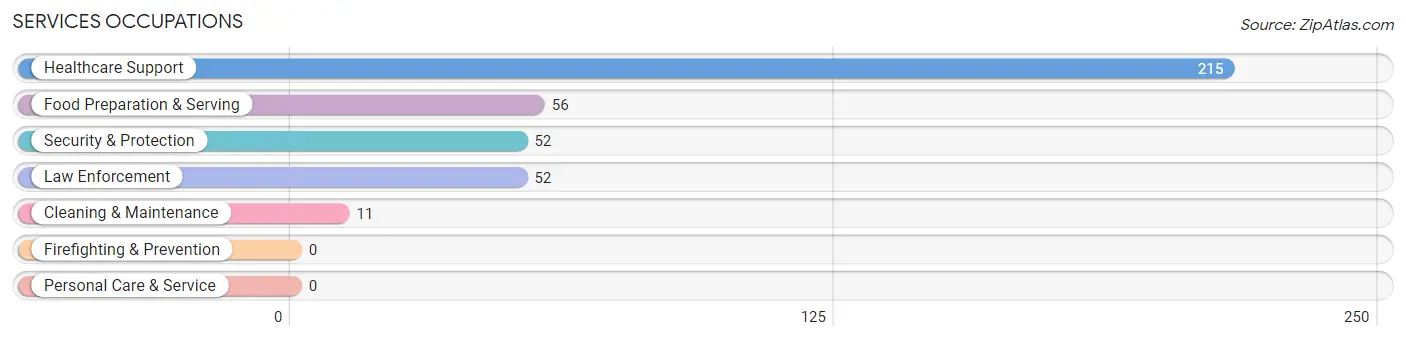
Services Occupations
The most common Services occupations in Hamlet are Healthcare Support (215 | 10.0%), Food Preparation & Serving (56 | 2.6%), Security & Protection (52 | 2.4%), Law Enforcement (52 | 2.4%), and Cleaning & Maintenance (11 | 0.5%).
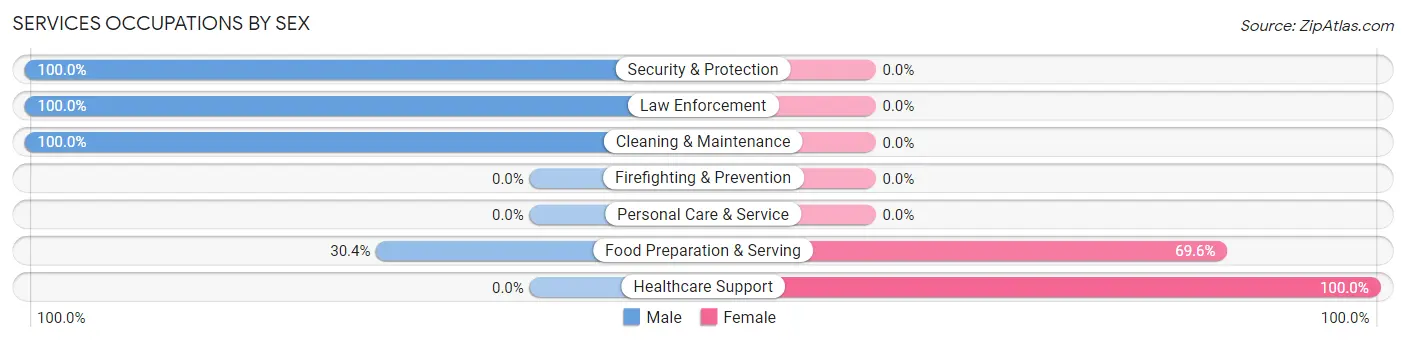
Services Occupations by Sex
Within the Services occupations in Hamlet, the most male-oriented occupations are Security & Protection (100.0%), Law Enforcement (100.0%), and Cleaning & Maintenance (100.0%), while the most female-oriented occupations are Healthcare Support (100.0%), and Food Preparation & Serving (69.6%).
| Occupation | Male | Female |
| Healthcare Support | 0 (0.0%) | 215 (100.0%) |
| Security & Protection | 52 (100.0%) | 0 (0.0%) |
| Firefighting & Prevention | 0 (0.0%) | 0 (0.0%) |
| Law Enforcement | 52 (100.0%) | 0 (0.0%) |
| Food Preparation & Serving | 17 (30.4%) | 39 (69.6%) |
| Cleaning & Maintenance | 11 (100.0%) | 0 (0.0%) |
| Personal Care & Service | 0 (0.0%) | 0 (0.0%) |
| Total (Category) | 80 (23.9%) | 254 (76.0%) |
| Total (Overall) | 1,092 (50.6%) | 1,068 (49.4%) |
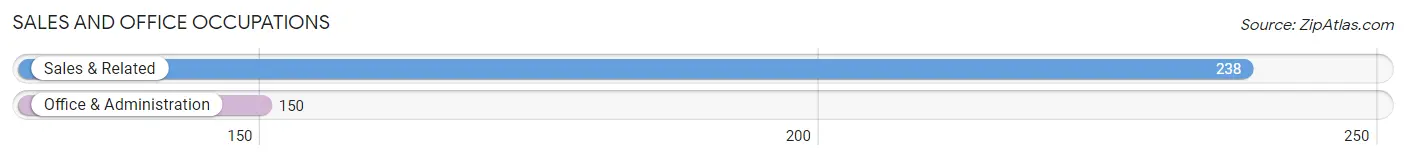
Sales and Office Occupations
The most common Sales and Office occupations in Hamlet are Sales & Related (238 | 11.0%), and Office & Administration (150 | 6.9%).
Sales and Office Occupations by Sex
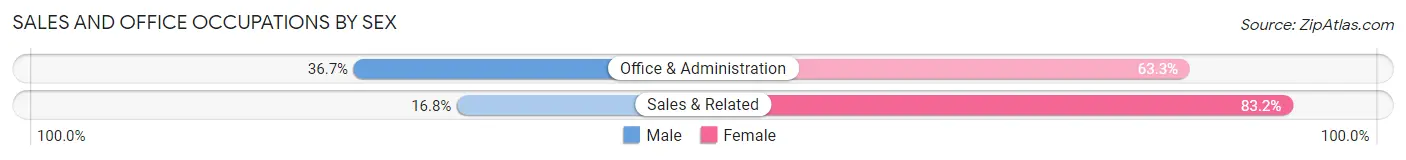
| Occupation | Male | Female |
| Sales & Related | 40 (16.8%) | 198 (83.2%) |
| Office & Administration | 55 (36.7%) | 95 (63.3%) |
| Total (Category) | 95 (24.5%) | 293 (75.5%) |
| Total (Overall) | 1,092 (50.6%) | 1,068 (49.4%) |
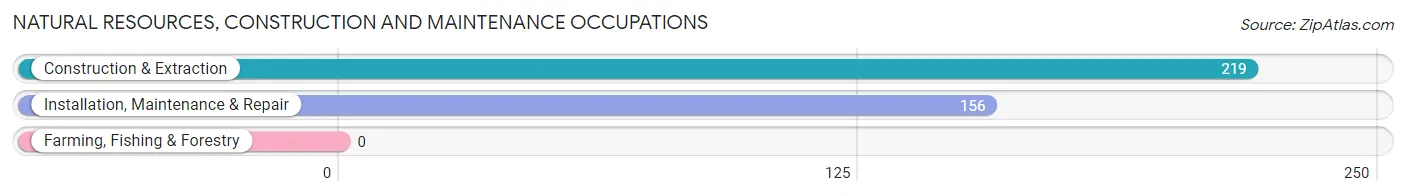
Natural Resources, Construction and Maintenance Occupations
The most common Natural Resources, Construction and Maintenance occupations in Hamlet are Construction & Extraction (219 | 10.1%), and Installation, Maintenance & Repair (156 | 7.2%).
Natural Resources, Construction and Maintenance Occupations by Sex
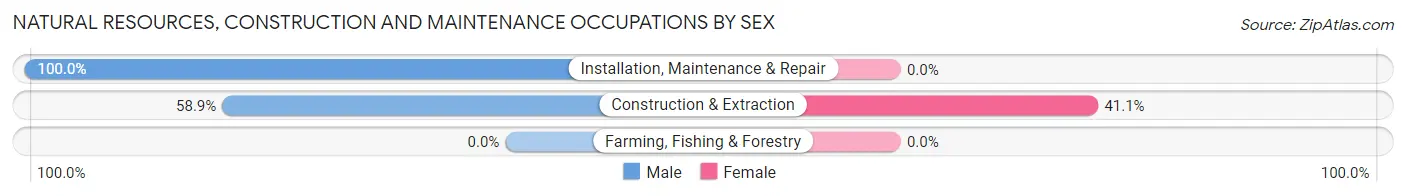
| Occupation | Male | Female |
| Farming, Fishing & Forestry | 0 (0.0%) | 0 (0.0%) |
| Construction & Extraction | 129 (58.9%) | 90 (41.1%) |
| Installation, Maintenance & Repair | 156 (100.0%) | 0 (0.0%) |
| Total (Category) | 285 (76.0%) | 90 (24.0%) |
| Total (Overall) | 1,092 (50.6%) | 1,068 (49.4%) |
Production, Transportation and Moving Occupations
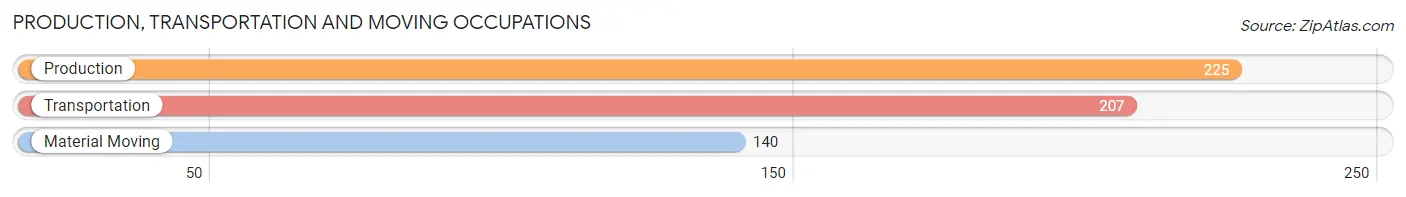
The most common Production, Transportation and Moving occupations in Hamlet are Production (225 | 10.4%), Transportation (207 | 9.6%), and Material Moving (140 | 6.5%).
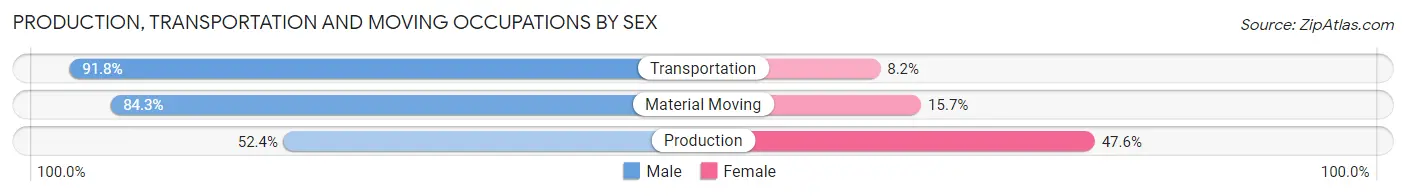
Production, Transportation and Moving Occupations by Sex
| Occupation | Male | Female |
| Production | 118 (52.4%) | 107 (47.6%) |
| Transportation | 190 (91.8%) | 17 (8.2%) |
| Material Moving | 118 (84.3%) | 22 (15.7%) |
| Total (Category) | 426 (74.5%) | 146 (25.5%) |
| Total (Overall) | 1,092 (50.6%) | 1,068 (49.4%) |
Employment Industries by Sex in Hamlet
Employment Industries in Hamlet
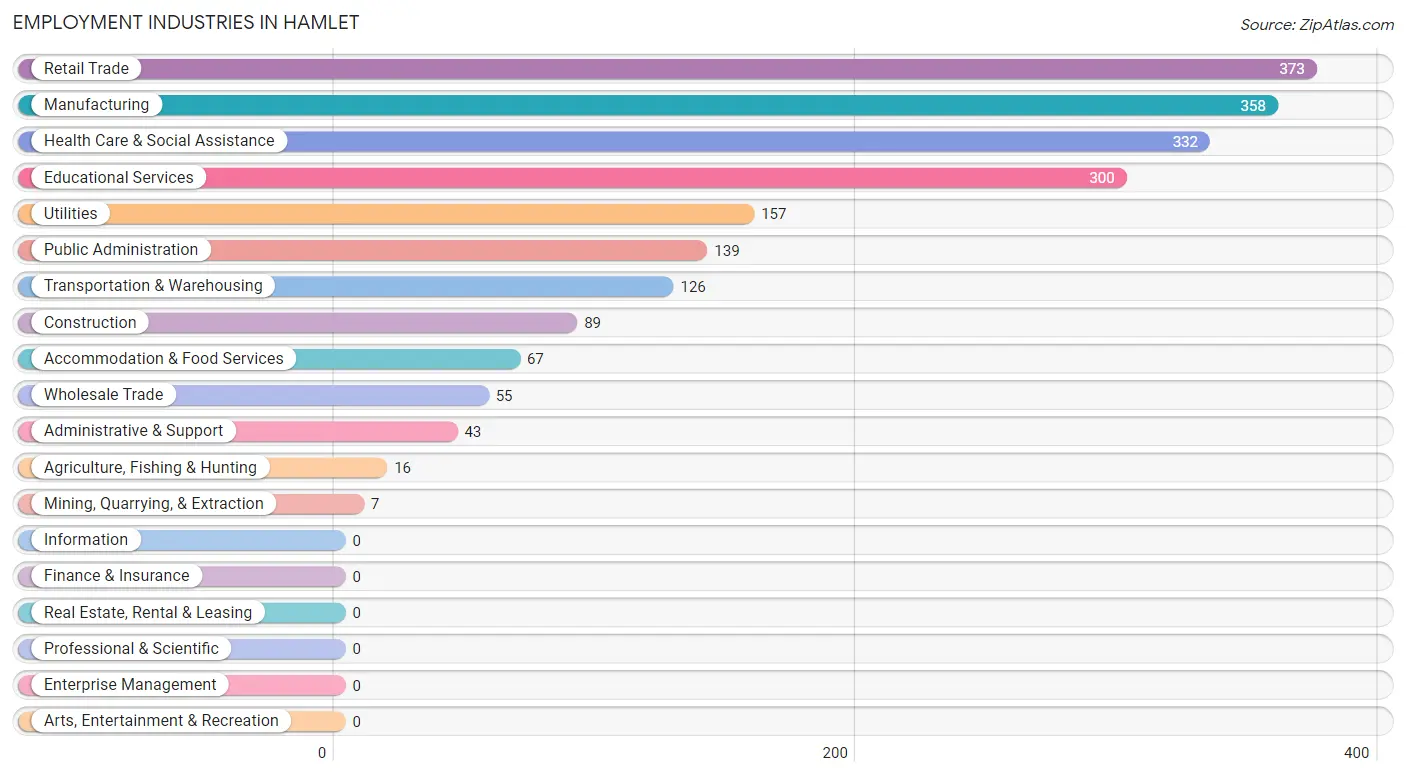
The major employment industries in Hamlet include Retail Trade (373 | 17.3%), Manufacturing (358 | 16.6%), Health Care & Social Assistance (332 | 15.4%), Educational Services (300 | 13.9%), and Utilities (157 | 7.3%).
Employment Industries by Sex in Hamlet
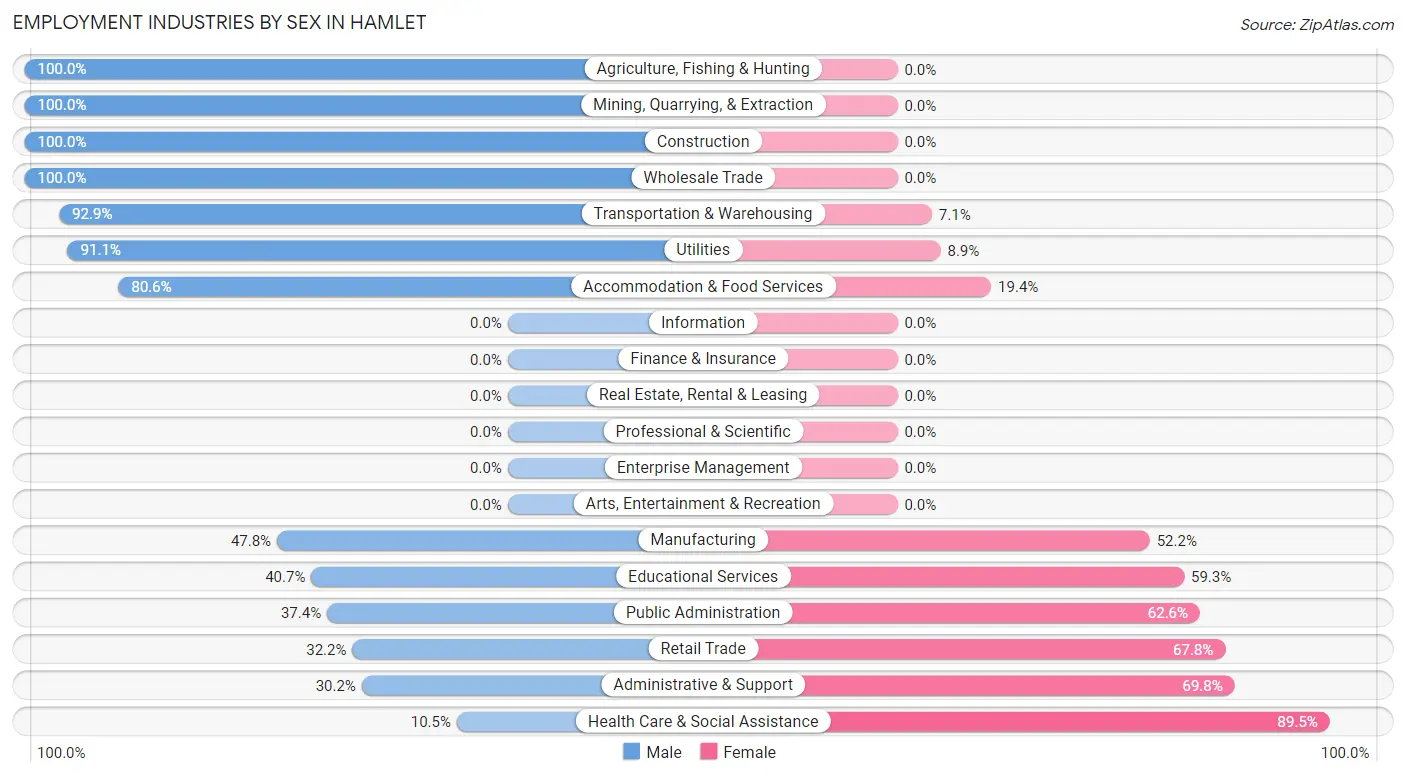
The Hamlet industries that see more men than women are Agriculture, Fishing & Hunting (100.0%), Mining, Quarrying, & Extraction (100.0%), and Construction (100.0%), whereas the industries that tend to have a higher number of women are Health Care & Social Assistance (89.5%), Administrative & Support (69.8%), and Retail Trade (67.8%).
| Industry | Male | Female |
| Agriculture, Fishing & Hunting | 16 (100.0%) | 0 (0.0%) |
| Mining, Quarrying, & Extraction | 7 (100.0%) | 0 (0.0%) |
| Construction | 89 (100.0%) | 0 (0.0%) |
| Manufacturing | 171 (47.8%) | 187 (52.2%) |
| Wholesale Trade | 55 (100.0%) | 0 (0.0%) |
| Retail Trade | 120 (32.2%) | 253 (67.8%) |
| Transportation & Warehousing | 117 (92.9%) | 9 (7.1%) |
| Utilities | 143 (91.1%) | 14 (8.9%) |
| Information | 0 (0.0%) | 0 (0.0%) |
| Finance & Insurance | 0 (0.0%) | 0 (0.0%) |
| Real Estate, Rental & Leasing | 0 (0.0%) | 0 (0.0%) |
| Professional & Scientific | 0 (0.0%) | 0 (0.0%) |
| Enterprise Management | 0 (0.0%) | 0 (0.0%) |
| Administrative & Support | 13 (30.2%) | 30 (69.8%) |
| Educational Services | 122 (40.7%) | 178 (59.3%) |
| Health Care & Social Assistance | 35 (10.5%) | 297 (89.5%) |
| Arts, Entertainment & Recreation | 0 (0.0%) | 0 (0.0%) |
| Accommodation & Food Services | 54 (80.6%) | 13 (19.4%) |
| Public Administration | 52 (37.4%) | 87 (62.6%) |
| Total | 1,092 (50.6%) | 1,068 (49.4%) |
Education in Hamlet
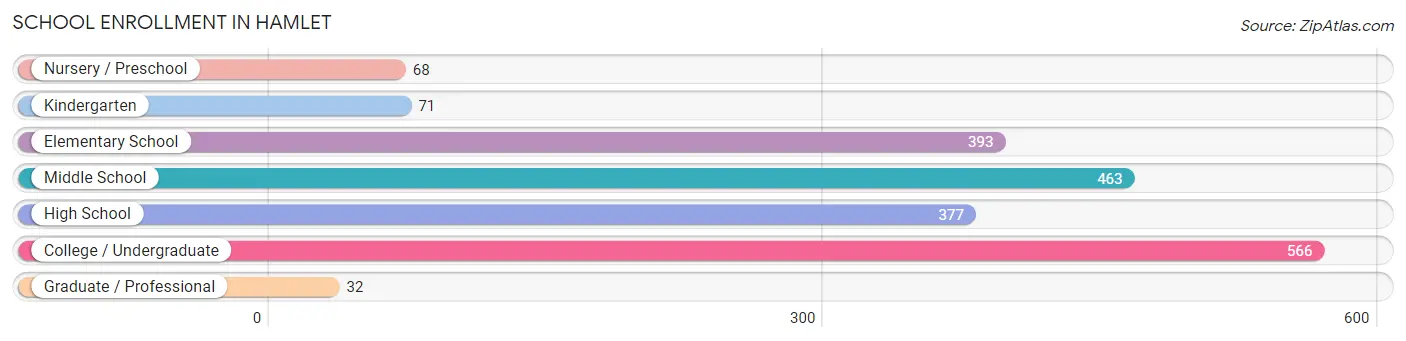
School Enrollment in Hamlet
The most common levels of schooling among the 1,970 students in Hamlet are college / undergraduate (566 | 28.7%), middle school (463 | 23.5%), and elementary school (393 | 20.0%).
| School Level | # Students | % Students |
| Nursery / Preschool | 68 | 3.5% |
| Kindergarten | 71 | 3.6% |
| Elementary School | 393 | 20.0% |
| Middle School | 463 | 23.5% |
| High School | 377 | 19.1% |
| College / Undergraduate | 566 | 28.7% |
| Graduate / Professional | 32 | 1.6% |
| Total | 1,970 | 100.0% |
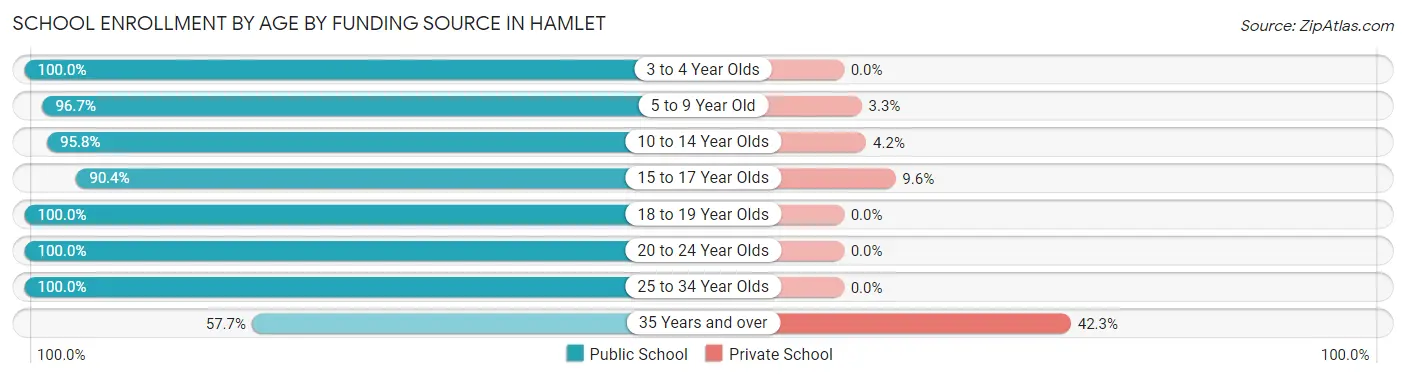
School Enrollment by Age by Funding Source in Hamlet
Out of a total of 1,970 students who are enrolled in schools in Hamlet, 142 (7.2%) attend a private institution, while the remaining 1,828 (92.8%) are enrolled in public schools. The age group of 35 years and over has the highest likelihood of being enrolled in private schools, with 77 (42.3% in the age bracket) enrolled. Conversely, the age group of 3 to 4 year olds has the lowest likelihood of being enrolled in a private school, with 68 (100.0% in the age bracket) attending a public institution.
| Age Bracket | Public School | Private School |
| 3 to 4 Year Olds | 68 (100.0%) | 0 (0.0%) |
| 5 to 9 Year Old | 376 (96.7%) | 13 (3.3%) |
| 10 to 14 Year Olds | 571 (95.8%) | 25 (4.2%) |
| 15 to 17 Year Olds | 253 (90.4%) | 27 (9.6%) |
| 18 to 19 Year Olds | 34 (100.0%) | 0 (0.0%) |
| 20 to 24 Year Olds | 256 (100.0%) | 0 (0.0%) |
| 25 to 34 Year Olds | 165 (100.0%) | 0 (0.0%) |
| 35 Years and over | 105 (57.7%) | 77 (42.3%) |
| Total | 1,828 (92.8%) | 142 (7.2%) |
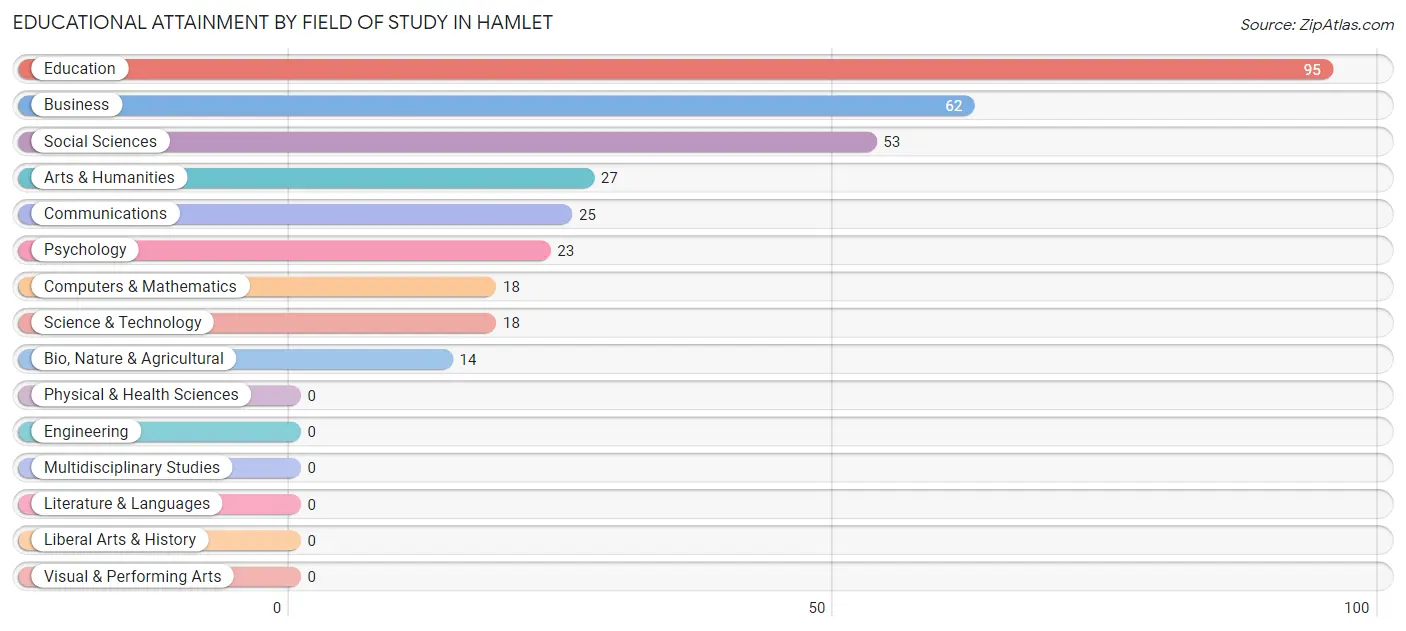
Educational Attainment by Field of Study in Hamlet
Education (95 | 28.4%), business (62 | 18.5%), social sciences (53 | 15.8%), arts & humanities (27 | 8.1%), and communications (25 | 7.5%) are the most common fields of study among 335 individuals in Hamlet who have obtained a bachelor's degree or higher.
| Field of Study | # Graduates | % Graduates |
| Computers & Mathematics | 18 | 5.4% |
| Bio, Nature & Agricultural | 14 | 4.2% |
| Physical & Health Sciences | 0 | 0.0% |
| Psychology | 23 | 6.9% |
| Social Sciences | 53 | 15.8% |
| Engineering | 0 | 0.0% |
| Multidisciplinary Studies | 0 | 0.0% |
| Science & Technology | 18 | 5.4% |
| Business | 62 | 18.5% |
| Education | 95 | 28.4% |
| Literature & Languages | 0 | 0.0% |
| Liberal Arts & History | 0 | 0.0% |
| Visual & Performing Arts | 0 | 0.0% |
| Communications | 25 | 7.5% |
| Arts & Humanities | 27 | 8.1% |
| Total | 335 | 100.0% |
Transportation & Commute in Hamlet
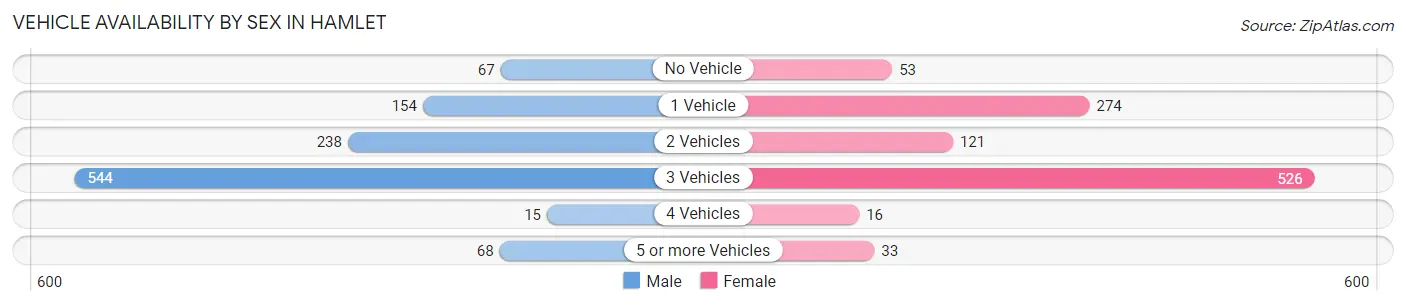
Vehicle Availability by Sex in Hamlet
The most prevalent vehicle ownership categories in Hamlet are males with 3 vehicles (544, accounting for 50.1%) and females with 3 vehicles (526, making up 53.2%).
| Vehicles Available | Male | Female |
| No Vehicle | 67 (6.2%) | 53 (5.2%) |
| 1 Vehicle | 154 (14.2%) | 274 (26.8%) |
| 2 Vehicles | 238 (21.9%) | 121 (11.8%) |
| 3 Vehicles | 544 (50.1%) | 526 (51.4%) |
| 4 Vehicles | 15 (1.4%) | 16 (1.6%) |
| 5 or more Vehicles | 68 (6.3%) | 33 (3.2%) |
| Total | 1,086 (100.0%) | 1,023 (100.0%) |
Commute Time in Hamlet
The most frequently occuring commute durations in Hamlet are 15 to 19 minutes (516 commuters, 25.7%), 10 to 14 minutes (464 commuters, 23.1%), and 30 to 34 minutes (306 commuters, 15.2%).
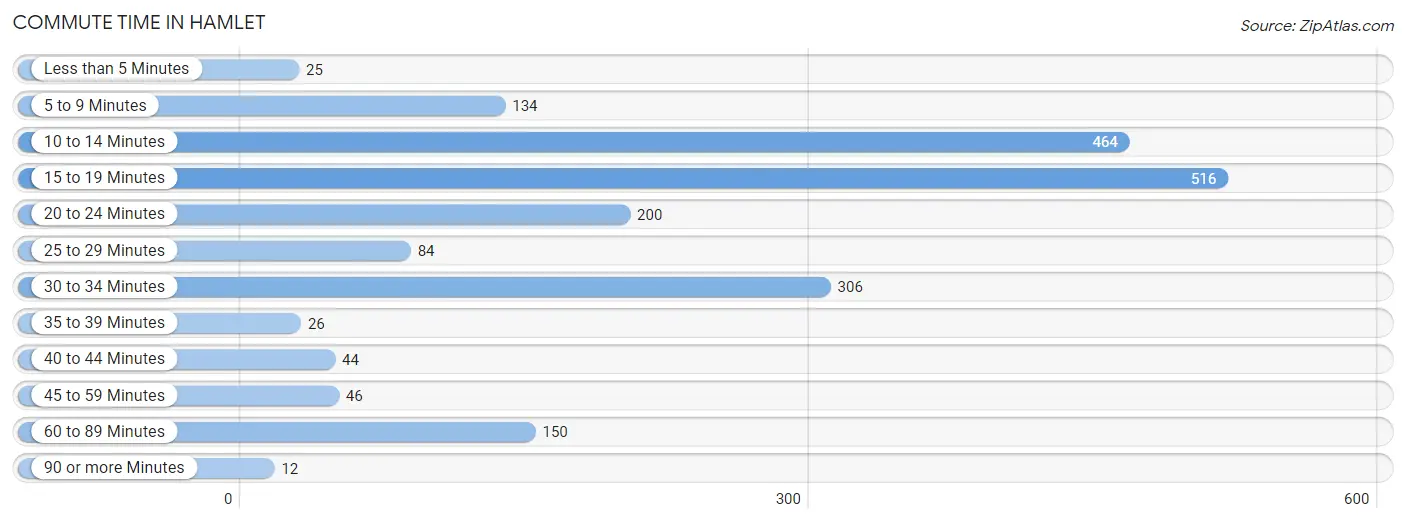
| Commute Time | # Commuters | % Commuters |
| Less than 5 Minutes | 25 | 1.3% |
| 5 to 9 Minutes | 134 | 6.7% |
| 10 to 14 Minutes | 464 | 23.1% |
| 15 to 19 Minutes | 516 | 25.7% |
| 20 to 24 Minutes | 200 | 10.0% |
| 25 to 29 Minutes | 84 | 4.2% |
| 30 to 34 Minutes | 306 | 15.2% |
| 35 to 39 Minutes | 26 | 1.3% |
| 40 to 44 Minutes | 44 | 2.2% |
| 45 to 59 Minutes | 46 | 2.3% |
| 60 to 89 Minutes | 150 | 7.5% |
| 90 or more Minutes | 12 | 0.6% |
Commute Time by Sex in Hamlet
The most common commute times in Hamlet are 15 to 19 minutes (278 commuters, 25.9%) for males and 10 to 14 minutes (280 commuters, 30.0%) for females.
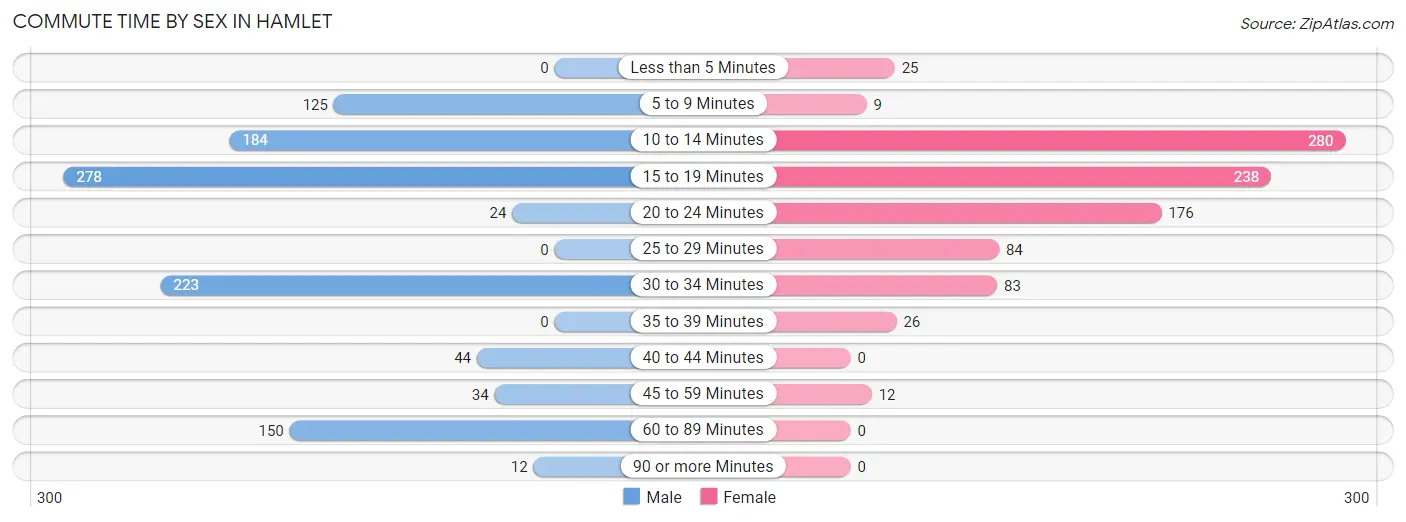
| Commute Time | Male | Female |
| Less than 5 Minutes | 0 (0.0%) | 25 (2.7%) |
| 5 to 9 Minutes | 125 (11.6%) | 9 (1.0%) |
| 10 to 14 Minutes | 184 (17.1%) | 280 (30.0%) |
| 15 to 19 Minutes | 278 (25.9%) | 238 (25.5%) |
| 20 to 24 Minutes | 24 (2.2%) | 176 (18.9%) |
| 25 to 29 Minutes | 0 (0.0%) | 84 (9.0%) |
| 30 to 34 Minutes | 223 (20.8%) | 83 (8.9%) |
| 35 to 39 Minutes | 0 (0.0%) | 26 (2.8%) |
| 40 to 44 Minutes | 44 (4.1%) | 0 (0.0%) |
| 45 to 59 Minutes | 34 (3.2%) | 12 (1.3%) |
| 60 to 89 Minutes | 150 (14.0%) | 0 (0.0%) |
| 90 or more Minutes | 12 (1.1%) | 0 (0.0%) |
Time of Departure to Work by Sex in Hamlet
The most frequent times of departure to work in Hamlet are 7:00 AM to 7:29 AM (198, 18.4%) for males and 7:30 AM to 7:59 AM (220, 23.6%) for females.
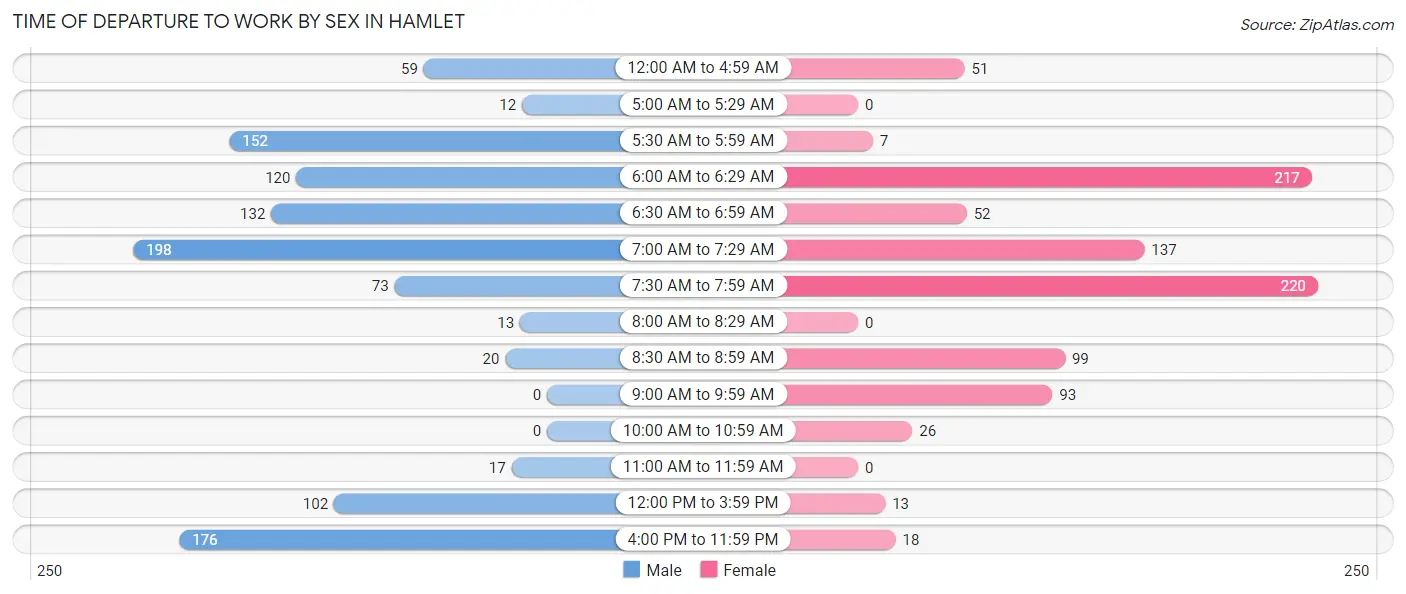
| Time of Departure | Male | Female |
| 12:00 AM to 4:59 AM | 59 (5.5%) | 51 (5.5%) |
| 5:00 AM to 5:29 AM | 12 (1.1%) | 0 (0.0%) |
| 5:30 AM to 5:59 AM | 152 (14.1%) | 7 (0.7%) |
| 6:00 AM to 6:29 AM | 120 (11.2%) | 217 (23.3%) |
| 6:30 AM to 6:59 AM | 132 (12.3%) | 52 (5.6%) |
| 7:00 AM to 7:29 AM | 198 (18.4%) | 137 (14.7%) |
| 7:30 AM to 7:59 AM | 73 (6.8%) | 220 (23.6%) |
| 8:00 AM to 8:29 AM | 13 (1.2%) | 0 (0.0%) |
| 8:30 AM to 8:59 AM | 20 (1.9%) | 99 (10.6%) |
| 9:00 AM to 9:59 AM | 0 (0.0%) | 93 (10.0%) |
| 10:00 AM to 10:59 AM | 0 (0.0%) | 26 (2.8%) |
| 11:00 AM to 11:59 AM | 17 (1.6%) | 0 (0.0%) |
| 12:00 PM to 3:59 PM | 102 (9.5%) | 13 (1.4%) |
| 4:00 PM to 11:59 PM | 176 (16.4%) | 18 (1.9%) |
| Total | 1,074 (100.0%) | 933 (100.0%) |
Housing Occupancy in Hamlet
Occupancy by Ownership in Hamlet
Of the total 2,291 dwellings in Hamlet, owner-occupied units account for 1,284 (56.0%), while renter-occupied units make up 1,007 (44.0%).
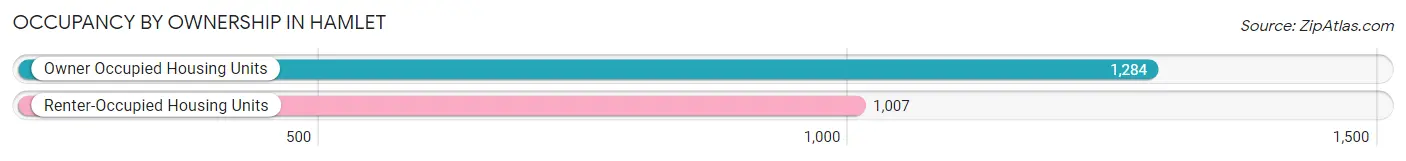
| Occupancy | # Housing Units | % Housing Units |
| Owner Occupied Housing Units | 1,284 | 56.0% |
| Renter-Occupied Housing Units | 1,007 | 44.0% |
| Total Occupied Housing Units | 2,291 | 100.0% |
Occupancy by Household Size in Hamlet
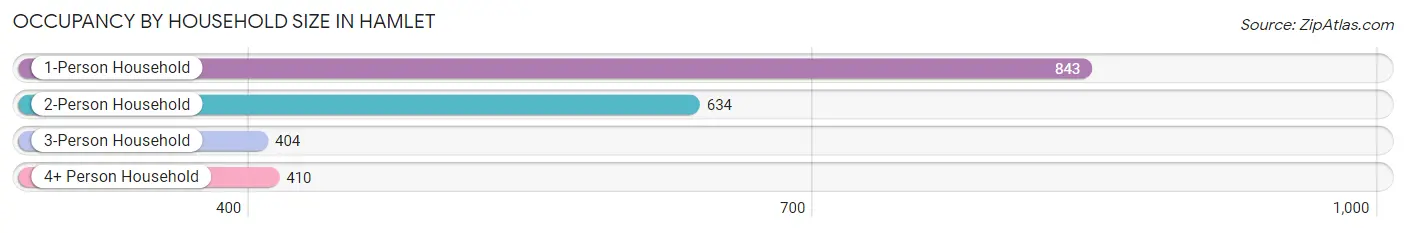
| Household Size | # Housing Units | % Housing Units |
| 1-Person Household | 843 | 36.8% |
| 2-Person Household | 634 | 27.7% |
| 3-Person Household | 404 | 17.6% |
| 4+ Person Household | 410 | 17.9% |
| Total Housing Units | 2,291 | 100.0% |
Occupancy by Ownership by Household Size in Hamlet
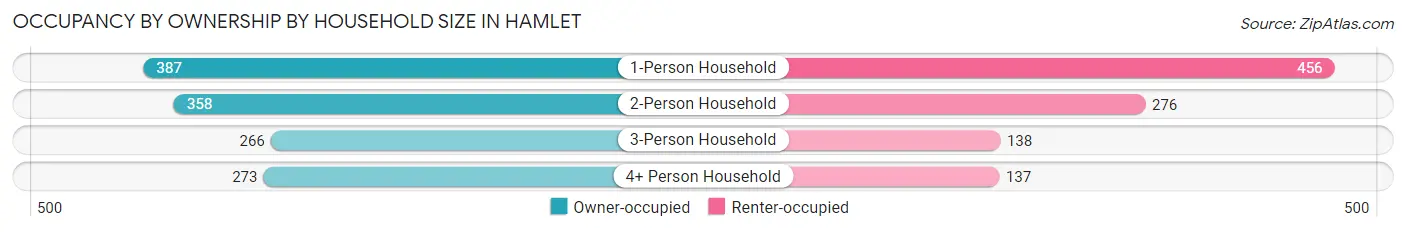
| Household Size | Owner-occupied | Renter-occupied |
| 1-Person Household | 387 (45.9%) | 456 (54.1%) |
| 2-Person Household | 358 (56.5%) | 276 (43.5%) |
| 3-Person Household | 266 (65.8%) | 138 (34.2%) |
| 4+ Person Household | 273 (66.6%) | 137 (33.4%) |
| Total Housing Units | 1,284 (56.0%) | 1,007 (44.0%) |
Occupancy by Educational Attainment in Hamlet
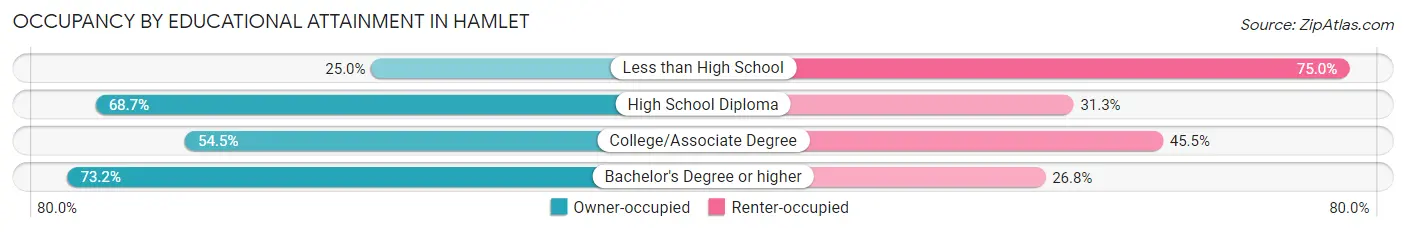
| Household Size | Owner-occupied | Renter-occupied |
| Less than High School | 88 (25.0%) | 264 (75.0%) |
| High School Diploma | 459 (68.7%) | 209 (31.3%) |
| College/Associate Degree | 565 (54.5%) | 471 (45.5%) |
| Bachelor's Degree or higher | 172 (73.2%) | 63 (26.8%) |
Occupancy by Age of Householder in Hamlet
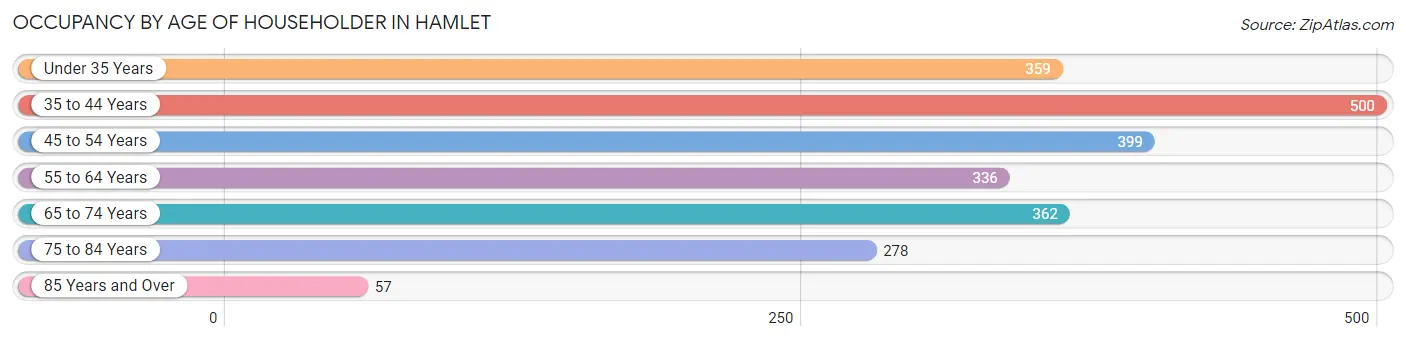
| Age Bracket | # Households | % Households |
| Under 35 Years | 359 | 15.7% |
| 35 to 44 Years | 500 | 21.8% |
| 45 to 54 Years | 399 | 17.4% |
| 55 to 64 Years | 336 | 14.7% |
| 65 to 74 Years | 362 | 15.8% |
| 75 to 84 Years | 278 | 12.1% |
| 85 Years and Over | 57 | 2.5% |
| Total | 2,291 | 100.0% |
Housing Finances in Hamlet
Median Income by Occupancy in Hamlet
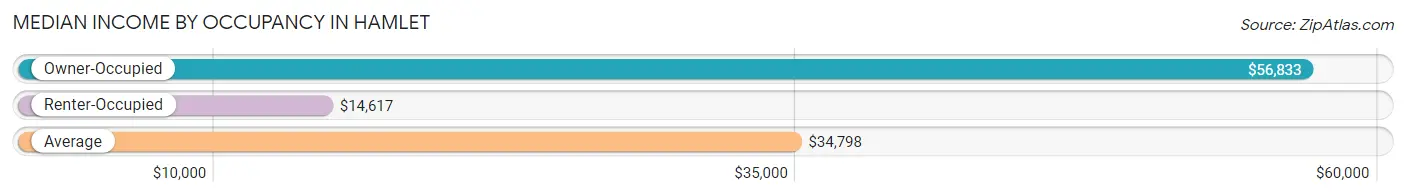
| Occupancy Type | # Households | Median Income |
| Owner-Occupied | 1,284 (56.0%) | $56,833 |
| Renter-Occupied | 1,007 (44.0%) | $14,617 |
| Average | 2,291 (100.0%) | $34,798 |
Occupancy by Householder Income Bracket in Hamlet
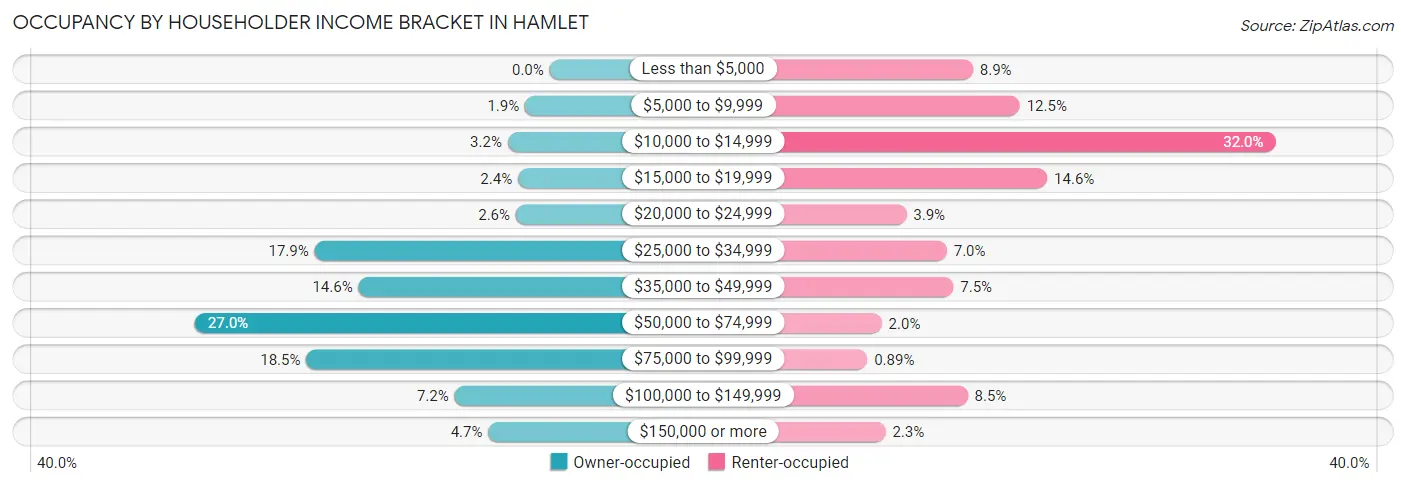
| Income Bracket | Owner-occupied | Renter-occupied |
| Less than $5,000 | 0 (0.0%) | 90 (8.9%) |
| $5,000 to $9,999 | 24 (1.9%) | 126 (12.5%) |
| $10,000 to $14,999 | 41 (3.2%) | 322 (32.0%) |
| $15,000 to $19,999 | 31 (2.4%) | 147 (14.6%) |
| $20,000 to $24,999 | 33 (2.6%) | 39 (3.9%) |
| $25,000 to $34,999 | 230 (17.9%) | 70 (7.0%) |
| $35,000 to $49,999 | 187 (14.6%) | 75 (7.4%) |
| $50,000 to $74,999 | 347 (27.0%) | 20 (2.0%) |
| $75,000 to $99,999 | 238 (18.5%) | 9 (0.9%) |
| $100,000 to $149,999 | 93 (7.2%) | 86 (8.5%) |
| $150,000 or more | 60 (4.7%) | 23 (2.3%) |
| Total | 1,284 (100.0%) | 1,007 (100.0%) |
Monthly Housing Cost Tiers in Hamlet
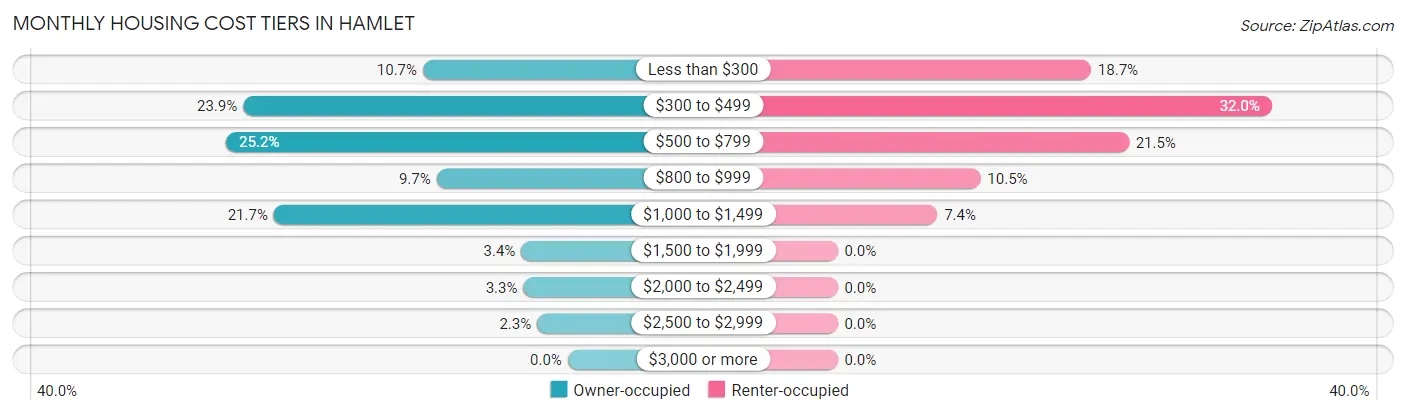
| Monthly Cost | Owner-occupied | Renter-occupied |
| Less than $300 | 137 (10.7%) | 188 (18.7%) |
| $300 to $499 | 307 (23.9%) | 322 (32.0%) |
| $500 to $799 | 323 (25.2%) | 216 (21.4%) |
| $800 to $999 | 124 (9.7%) | 106 (10.5%) |
| $1,000 to $1,499 | 278 (21.6%) | 74 (7.3%) |
| $1,500 to $1,999 | 44 (3.4%) | 0 (0.0%) |
| $2,000 to $2,499 | 42 (3.3%) | 0 (0.0%) |
| $2,500 to $2,999 | 29 (2.3%) | 0 (0.0%) |
| $3,000 or more | 0 (0.0%) | 0 (0.0%) |
| Total | 1,284 (100.0%) | 1,007 (100.0%) |
Physical Housing Characteristics in Hamlet
Housing Structures in Hamlet
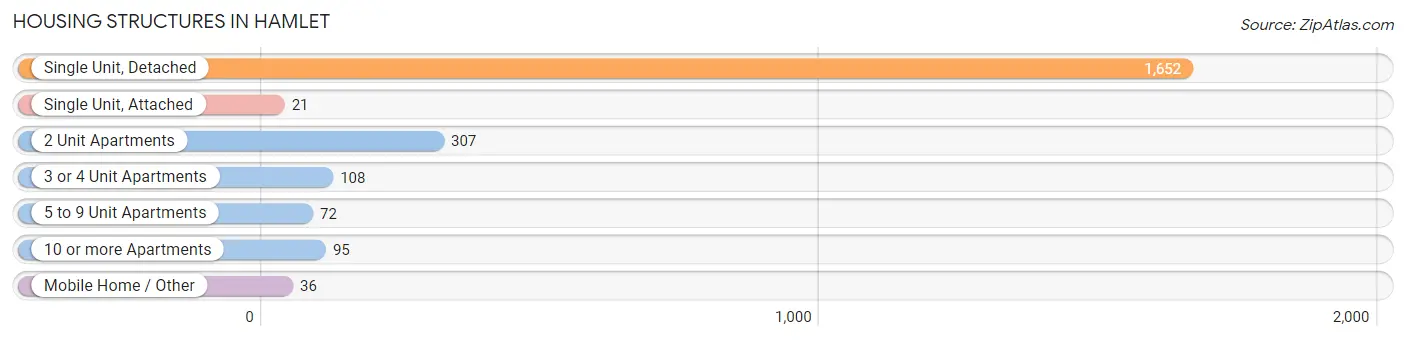
| Structure Type | # Housing Units | % Housing Units |
| Single Unit, Detached | 1,652 | 72.1% |
| Single Unit, Attached | 21 | 0.9% |
| 2 Unit Apartments | 307 | 13.4% |
| 3 or 4 Unit Apartments | 108 | 4.7% |
| 5 to 9 Unit Apartments | 72 | 3.1% |
| 10 or more Apartments | 95 | 4.2% |
| Mobile Home / Other | 36 | 1.6% |
| Total | 2,291 | 100.0% |
Housing Structures by Occupancy in Hamlet
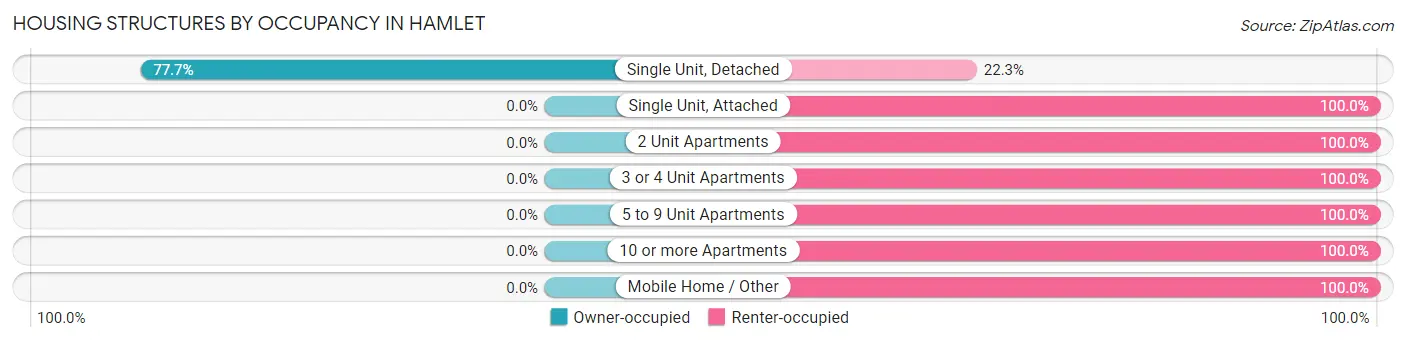
| Structure Type | Owner-occupied | Renter-occupied |
| Single Unit, Detached | 1,284 (77.7%) | 368 (22.3%) |
| Single Unit, Attached | 0 (0.0%) | 21 (100.0%) |
| 2 Unit Apartments | 0 (0.0%) | 307 (100.0%) |
| 3 or 4 Unit Apartments | 0 (0.0%) | 108 (100.0%) |
| 5 to 9 Unit Apartments | 0 (0.0%) | 72 (100.0%) |
| 10 or more Apartments | 0 (0.0%) | 95 (100.0%) |
| Mobile Home / Other | 0 (0.0%) | 36 (100.0%) |
| Total | 1,284 (56.0%) | 1,007 (44.0%) |
Housing Structures by Number of Rooms in Hamlet
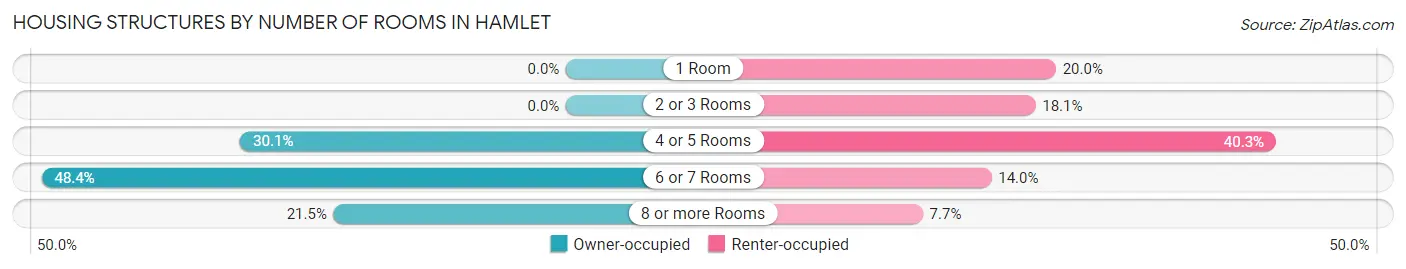
| Number of Rooms | Owner-occupied | Renter-occupied |
| 1 Room | 0 (0.0%) | 201 (20.0%) |
| 2 or 3 Rooms | 0 (0.0%) | 182 (18.1%) |
| 4 or 5 Rooms | 386 (30.1%) | 406 (40.3%) |
| 6 or 7 Rooms | 622 (48.4%) | 141 (14.0%) |
| 8 or more Rooms | 276 (21.5%) | 77 (7.6%) |
| Total | 1,284 (100.0%) | 1,007 (100.0%) |
Housing Structure by Heating Type in Hamlet
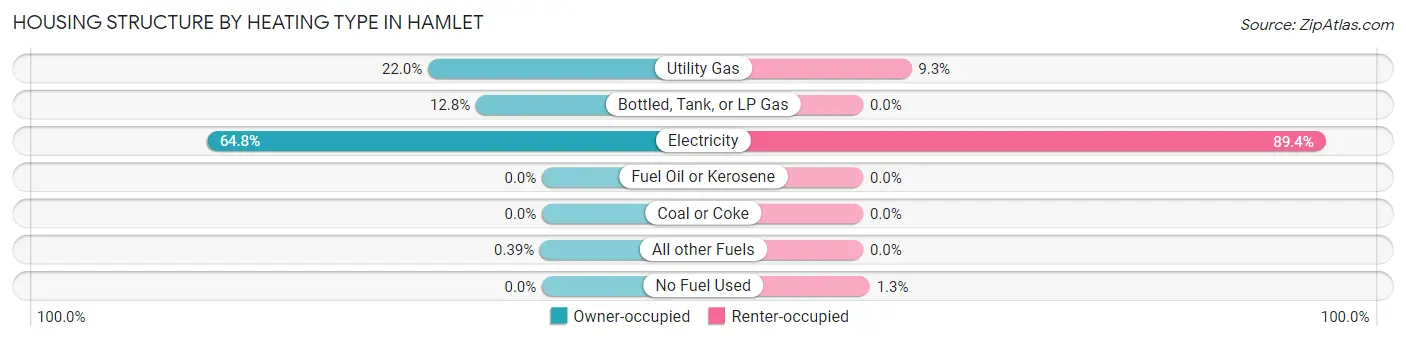
| Heating Type | Owner-occupied | Renter-occupied |
| Utility Gas | 283 (22.0%) | 94 (9.3%) |
| Bottled, Tank, or LP Gas | 164 (12.8%) | 0 (0.0%) |
| Electricity | 832 (64.8%) | 900 (89.4%) |
| Fuel Oil or Kerosene | 0 (0.0%) | 0 (0.0%) |
| Coal or Coke | 0 (0.0%) | 0 (0.0%) |
| All other Fuels | 5 (0.4%) | 0 (0.0%) |
| No Fuel Used | 0 (0.0%) | 13 (1.3%) |
| Total | 1,284 (100.0%) | 1,007 (100.0%) |
Household Vehicle Usage in Hamlet
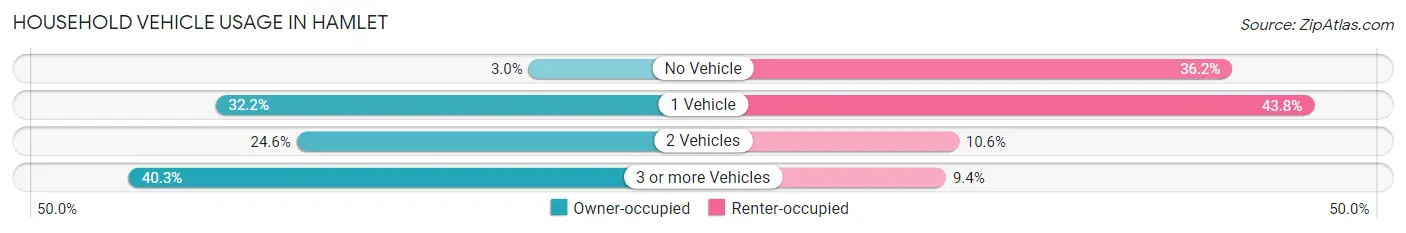
| Vehicles per Household | Owner-occupied | Renter-occupied |
| No Vehicle | 38 (3.0%) | 364 (36.1%) |
| 1 Vehicle | 413 (32.2%) | 441 (43.8%) |
| 2 Vehicles | 316 (24.6%) | 107 (10.6%) |
| 3 or more Vehicles | 517 (40.3%) | 95 (9.4%) |
| Total | 1,284 (100.0%) | 1,007 (100.0%) |
Real Estate & Mortgages in Hamlet
Real Estate and Mortgage Overview in Hamlet
| Characteristic | Without Mortgage | With Mortgage |
| Housing Units | 593 | 691 |
| Median Property Value | $90,900 | $111,100 |
| Median Household Income | $40,347 | $43 |
| Monthly Housing Costs | $390 | $0 |
| Real Estate Taxes | $768 | $8 |
Property Value by Mortgage Status in Hamlet
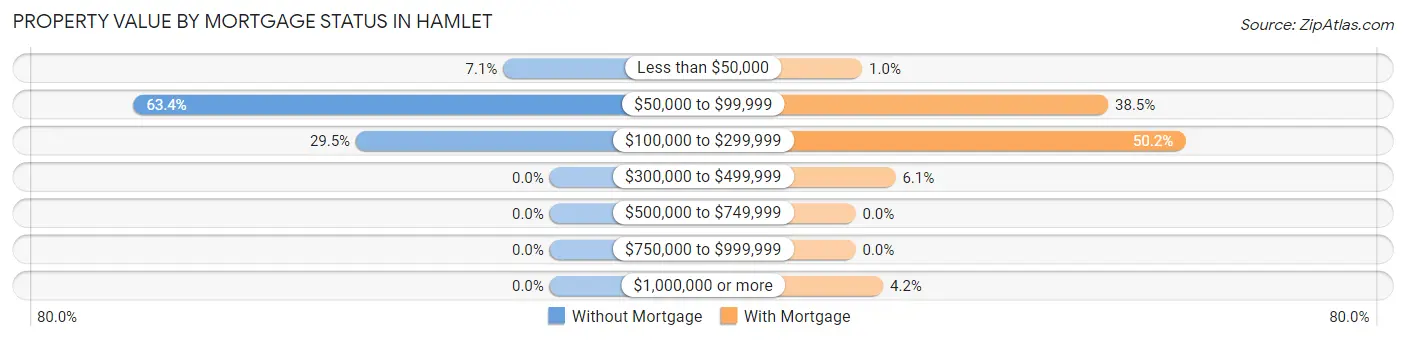
| Property Value | Without Mortgage | With Mortgage |
| Less than $50,000 | 42 (7.1%) | 7 (1.0%) |
| $50,000 to $99,999 | 376 (63.4%) | 266 (38.5%) |
| $100,000 to $299,999 | 175 (29.5%) | 347 (50.2%) |
| $300,000 to $499,999 | 0 (0.0%) | 42 (6.1%) |
| $500,000 to $749,999 | 0 (0.0%) | 0 (0.0%) |
| $750,000 to $999,999 | 0 (0.0%) | 0 (0.0%) |
| $1,000,000 or more | 0 (0.0%) | 29 (4.2%) |
| Total | 593 (100.0%) | 691 (100.0%) |
Household Income by Mortgage Status in Hamlet
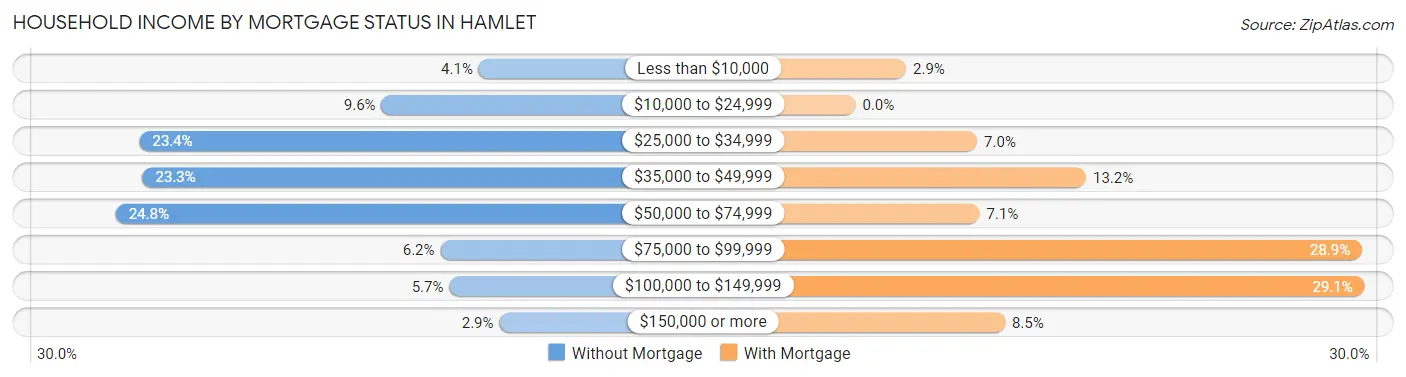
| Household Income | Without Mortgage | With Mortgage |
| Less than $10,000 | 24 (4.1%) | 20 (2.9%) |
| $10,000 to $24,999 | 57 (9.6%) | 0 (0.0%) |
| $25,000 to $34,999 | 139 (23.4%) | 48 (7.0%) |
| $35,000 to $49,999 | 138 (23.3%) | 91 (13.2%) |
| $50,000 to $74,999 | 147 (24.8%) | 49 (7.1%) |
| $75,000 to $99,999 | 37 (6.2%) | 200 (28.9%) |
| $100,000 to $149,999 | 34 (5.7%) | 201 (29.1%) |
| $150,000 or more | 17 (2.9%) | 59 (8.5%) |
| Total | 593 (100.0%) | 691 (100.0%) |
Property Value to Household Income Ratio in Hamlet
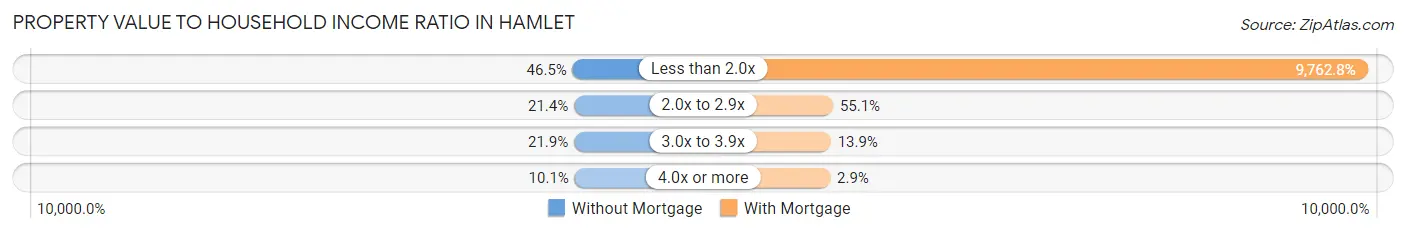
| Value-to-Income Ratio | Without Mortgage | With Mortgage |
| Less than 2.0x | 276 (46.5%) | 67,461 (9,762.8%) |
| 2.0x to 2.9x | 127 (21.4%) | 381 (55.1%) |
| 3.0x to 3.9x | 130 (21.9%) | 96 (13.9%) |
| 4.0x or more | 60 (10.1%) | 20 (2.9%) |
| Total | 593 (100.0%) | 691 (100.0%) |
Real Estate Taxes by Mortgage Status in Hamlet
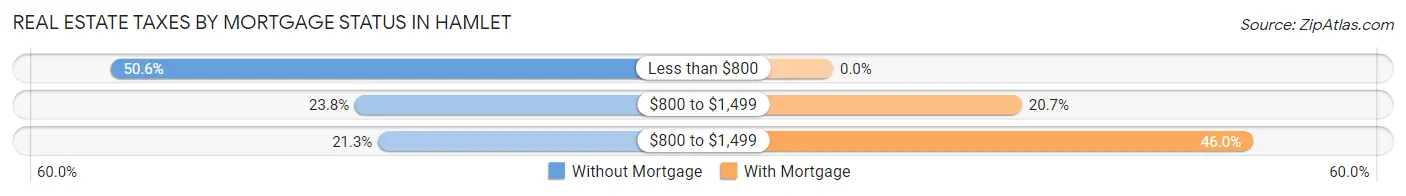
| Property Taxes | Without Mortgage | With Mortgage |
| Less than $800 | 300 (50.6%) | 0 (0.0%) |
| $800 to $1,499 | 141 (23.8%) | 143 (20.7%) |
| $800 to $1,499 | 126 (21.2%) | 318 (46.0%) |
| Total | 593 (100.0%) | 691 (100.0%) |
Health & Disability in Hamlet
Health Insurance Coverage by Age in Hamlet
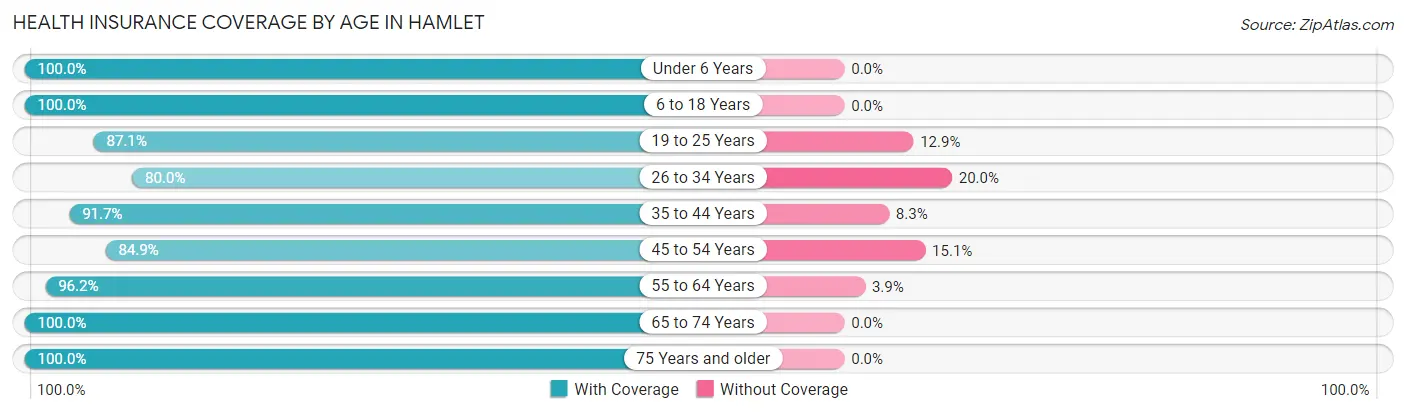
| Age Bracket | With Coverage | Without Coverage |
| Under 6 Years | 249 (100.0%) | 0 (0.0%) |
| 6 to 18 Years | 1,354 (100.0%) | 0 (0.0%) |
| 19 to 25 Years | 610 (87.1%) | 90 (12.9%) |
| 26 to 34 Years | 443 (80.0%) | 111 (20.0%) |
| 35 to 44 Years | 683 (91.7%) | 62 (8.3%) |
| 45 to 54 Years | 715 (84.9%) | 127 (15.1%) |
| 55 to 64 Years | 499 (96.2%) | 20 (3.8%) |
| 65 to 74 Years | 564 (100.0%) | 0 (0.0%) |
| 75 Years and older | 403 (100.0%) | 0 (0.0%) |
| Total | 5,520 (93.1%) | 410 (6.9%) |
Health Insurance Coverage by Citizenship Status in Hamlet
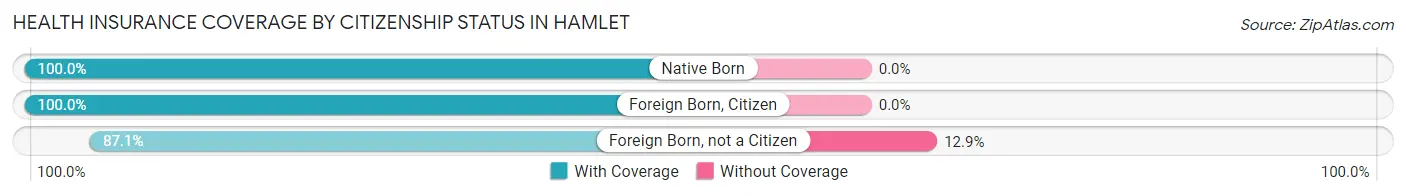
| Citizenship Status | With Coverage | Without Coverage |
| Native Born | 249 (100.0%) | 0 (0.0%) |
| Foreign Born, Citizen | 1,354 (100.0%) | 0 (0.0%) |
| Foreign Born, not a Citizen | 610 (87.1%) | 90 (12.9%) |
Health Insurance Coverage by Household Income in Hamlet
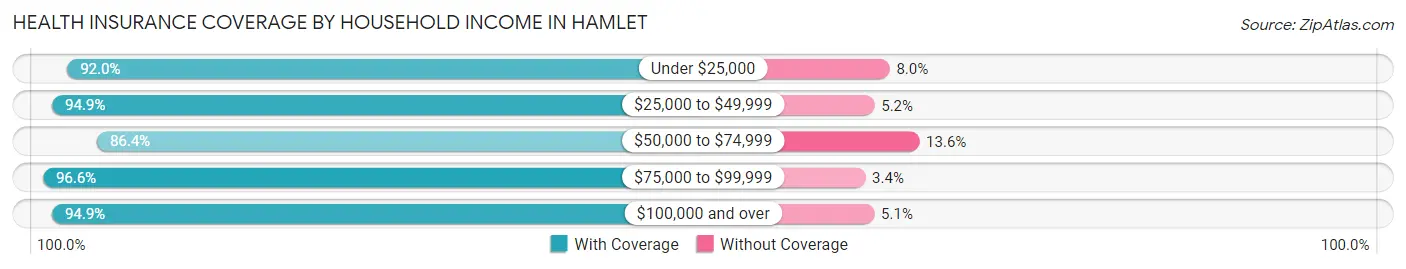
| Household Income | With Coverage | Without Coverage |
| Under $25,000 | 1,289 (92.0%) | 112 (8.0%) |
| $25,000 to $49,999 | 1,253 (94.9%) | 68 (5.1%) |
| $50,000 to $74,999 | 854 (86.4%) | 134 (13.6%) |
| $75,000 to $99,999 | 981 (96.6%) | 35 (3.4%) |
| $100,000 and over | 1,129 (94.9%) | 61 (5.1%) |
Public vs Private Health Insurance Coverage by Age in Hamlet
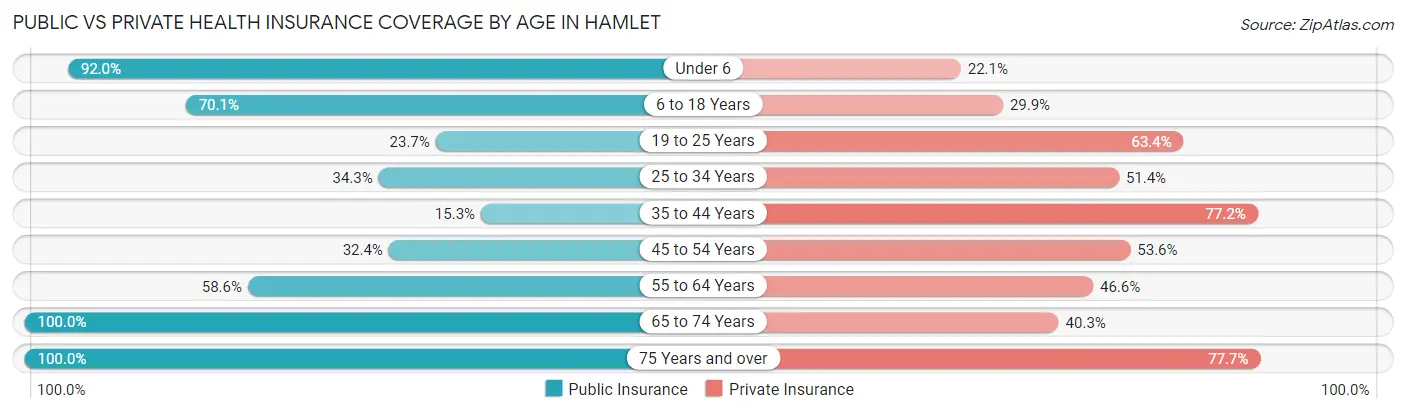
| Age Bracket | Public Insurance | Private Insurance |
| Under 6 | 229 (92.0%) | 55 (22.1%) |
| 6 to 18 Years | 949 (70.1%) | 405 (29.9%) |
| 19 to 25 Years | 166 (23.7%) | 444 (63.4%) |
| 25 to 34 Years | 190 (34.3%) | 285 (51.4%) |
| 35 to 44 Years | 114 (15.3%) | 575 (77.2%) |
| 45 to 54 Years | 273 (32.4%) | 451 (53.6%) |
| 55 to 64 Years | 304 (58.6%) | 242 (46.6%) |
| 65 to 74 Years | 564 (100.0%) | 227 (40.3%) |
| 75 Years and over | 403 (100.0%) | 313 (77.7%) |
| Total | 3,192 (53.8%) | 2,997 (50.5%) |
Disability Status by Sex by Age in Hamlet
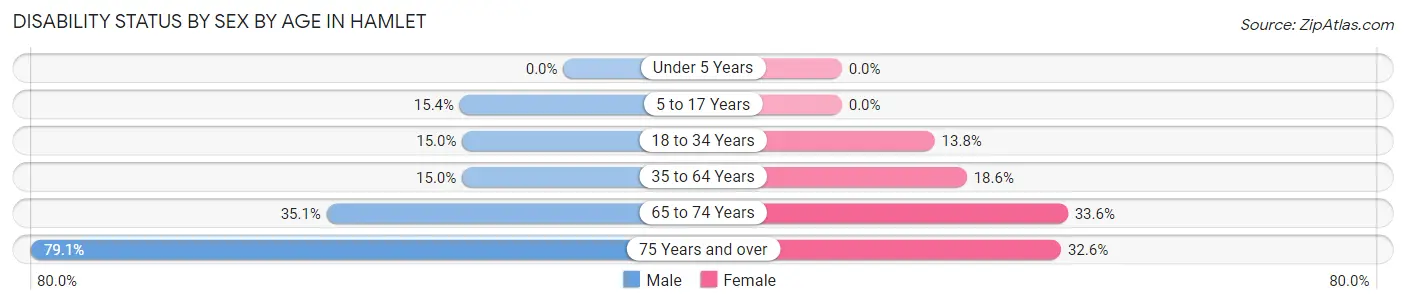
| Age Bracket | Male | Female |
| Under 5 Years | 0 (0.0%) | 0 (0.0%) |
| 5 to 17 Years | 134 (15.4%) | 0 (0.0%) |
| 18 to 34 Years | 103 (15.0%) | 83 (13.8%) |
| 35 to 64 Years | 148 (15.0%) | 208 (18.5%) |
| 65 to 74 Years | 39 (35.1%) | 152 (33.6%) |
| 75 Years and over | 117 (79.0%) | 83 (32.6%) |
Disability Class by Sex by Age in Hamlet
Disability Class: Hearing Difficulty
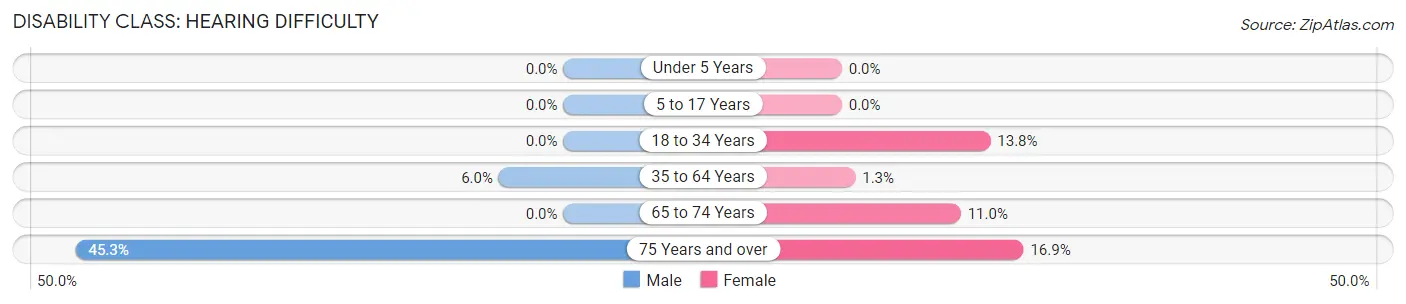
| Age Bracket | Male | Female |
| Under 5 Years | 0 (0.0%) | 0 (0.0%) |
| 5 to 17 Years | 0 (0.0%) | 0 (0.0%) |
| 18 to 34 Years | 0 (0.0%) | 83 (13.8%) |
| 35 to 64 Years | 59 (6.0%) | 14 (1.3%) |
| 65 to 74 Years | 0 (0.0%) | 50 (11.0%) |
| 75 Years and over | 67 (45.3%) | 43 (16.9%) |
Disability Class: Vision Difficulty
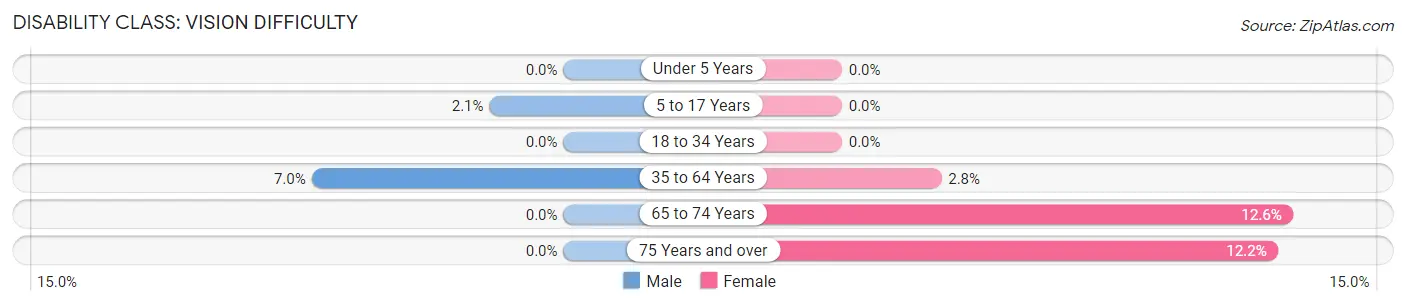
| Age Bracket | Male | Female |
| Under 5 Years | 0 (0.0%) | 0 (0.0%) |
| 5 to 17 Years | 18 (2.1%) | 0 (0.0%) |
| 18 to 34 Years | 0 (0.0%) | 0 (0.0%) |
| 35 to 64 Years | 69 (7.0%) | 31 (2.8%) |
| 65 to 74 Years | 0 (0.0%) | 57 (12.6%) |
| 75 Years and over | 0 (0.0%) | 31 (12.2%) |
Disability Class: Cognitive Difficulty
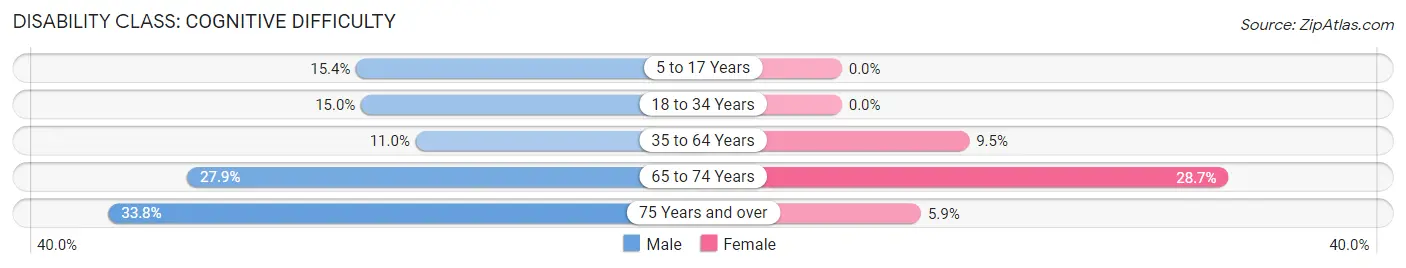
| Age Bracket | Male | Female |
| 5 to 17 Years | 134 (15.4%) | 0 (0.0%) |
| 18 to 34 Years | 103 (15.0%) | 0 (0.0%) |
| 35 to 64 Years | 108 (11.0%) | 106 (9.5%) |
| 65 to 74 Years | 31 (27.9%) | 130 (28.7%) |
| 75 Years and over | 50 (33.8%) | 15 (5.9%) |
Disability Class: Ambulatory Difficulty
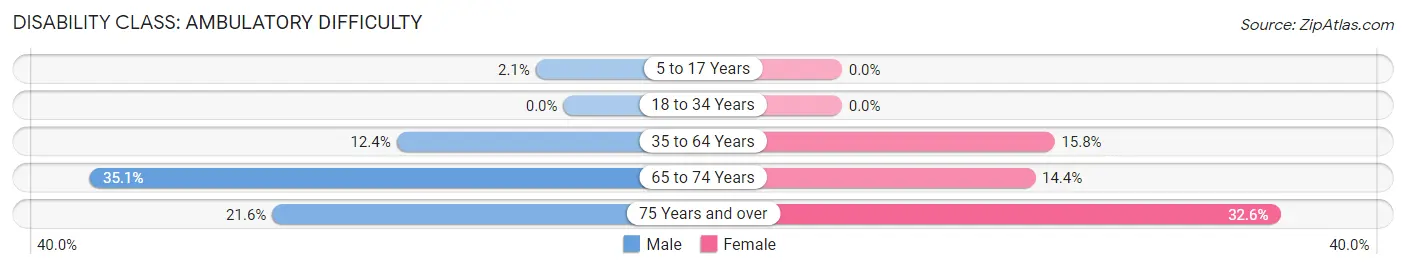
| Age Bracket | Male | Female |
| 5 to 17 Years | 18 (2.1%) | 0 (0.0%) |
| 18 to 34 Years | 0 (0.0%) | 0 (0.0%) |
| 35 to 64 Years | 122 (12.4%) | 177 (15.8%) |
| 65 to 74 Years | 39 (35.1%) | 65 (14.3%) |
| 75 Years and over | 32 (21.6%) | 83 (32.6%) |
Disability Class: Self-Care Difficulty
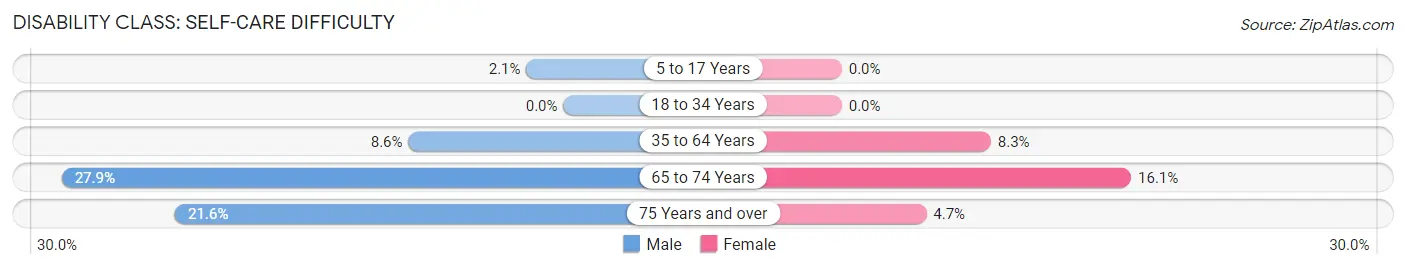
| Age Bracket | Male | Female |
| 5 to 17 Years | 18 (2.1%) | 0 (0.0%) |
| 18 to 34 Years | 0 (0.0%) | 0 (0.0%) |
| 35 to 64 Years | 85 (8.6%) | 93 (8.3%) |
| 65 to 74 Years | 31 (27.9%) | 73 (16.1%) |
| 75 Years and over | 32 (21.6%) | 12 (4.7%) |
Technology Access in Hamlet
Computing Device Access in Hamlet
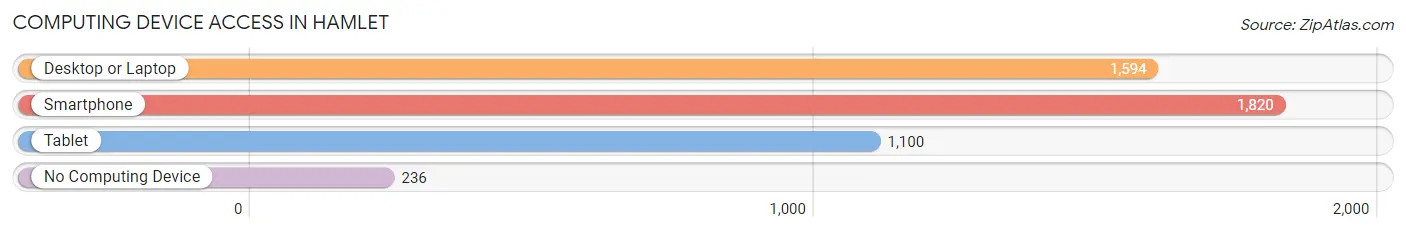
| Device Type | # Households | % Households |
| Desktop or Laptop | 1,594 | 69.6% |
| Smartphone | 1,820 | 79.4% |
| Tablet | 1,100 | 48.0% |
| No Computing Device | 236 | 10.3% |
| Total | 2,291 | 100.0% |
Internet Access in Hamlet
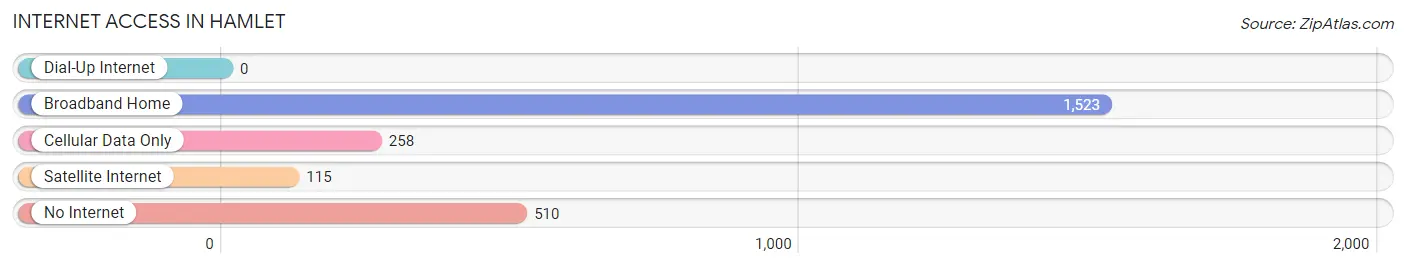
| Internet Type | # Households | % Households |
| Dial-Up Internet | 0 | 0.0% |
| Broadband Home | 1,523 | 66.5% |
| Cellular Data Only | 258 | 11.3% |
| Satellite Internet | 115 | 5.0% |
| No Internet | 510 | 22.3% |
| Total | 2,291 | 100.0% |
Hamlet Summary
Hamlet, North Carolina is a small town located in Richmond County, in the southeastern part of the state. It is situated along the banks of the Great Pee Dee River, and is approximately halfway between Charlotte and Fayetteville. The town was founded in 1881 and was named after the Shakespearean character, Hamlet.
History
The area that is now Hamlet was originally inhabited by the Catawba Indians. In the late 1700s, the area was settled by European settlers, mostly of Scottish and Irish descent. The town was officially incorporated in 1881 and was named after the Shakespearean character, Hamlet.
The town was originally a railroad town, and the railroad was the main source of employment for the town’s residents. The railroad was also the main source of transportation for the town’s residents. In the early 1900s, the town began to grow and develop, and by the mid-1900s, it had become a thriving community.
In the late 1900s, the town began to decline due to the decline of the railroad industry. The town’s population began to decline as well, and by the 2000s, the town had become a small, rural community.
Geography
Hamlet is located in Richmond County, in the southeastern part of the state. It is situated along the banks of the Great Pee Dee River, and is approximately halfway between Charlotte and Fayetteville. The town is located in a rural area, and is surrounded by farmland and forests.
The town has a total area of 2.2 square miles, all of which is land. The town has a humid subtropical climate, with hot, humid summers and mild winters.
Economy
The economy of Hamlet is largely based on agriculture and manufacturing. The town is home to several small businesses, including a furniture factory, a lumber mill, and a textile mill. The town is also home to a number of small retail stores and restaurants.
The town is also home to a number of small farms, which produce a variety of crops, including corn, soybeans, and cotton. The town is also home to a number of small manufacturing companies, which produce a variety of products, including furniture, clothing, and textiles.
Demographics
As of the 2010 census, the population of Hamlet was 5,844. The population is largely white (83.3%), with African Americans making up the largest minority group (14.2%). The median household income in the town is $30,945, and the median age is 39.
The town is home to a number of churches, including Baptist, Methodist, and Presbyterian. The town is also home to a number of schools, including a public elementary school, a middle school, and a high school.
Conclusion
Hamlet, North Carolina is a small town located in Richmond County, in the southeastern part of the state. It is situated along the banks of the Great Pee Dee River, and is approximately halfway between Charlotte and Fayetteville. The town was founded in 1881 and was named after the Shakespearean character, Hamlet. The town’s economy is largely based on agriculture and manufacturing, and the town is home to a number of small businesses, farms, and manufacturing companies. The population of Hamlet is largely white, with African Americans making up the largest minority group. The town is home to a number of churches and schools, and is a small, rural community.
Common Questions
What is Per Capita Income in Hamlet?
Per Capita income in Hamlet is $22,107.
What is the Median Family Income in Hamlet?
Median Family Income in Hamlet is $55,442.
What is the Median Household income in Hamlet?
Median Household Income in Hamlet is $34,798.
What is Income or Wage Gap in Hamlet?
Income or Wage Gap in Hamlet is 30.8%.
Women in Hamlet earn 69.2 cents for every dollar earned by a man.
What is Inequality or Gini Index in Hamlet?
Inequality or Gini Index in Hamlet is 0.51.
What is the Total Population of Hamlet?
Total Population of Hamlet is 6,043.
What is the Total Male Population of Hamlet?
Total Male Population of Hamlet is 2,859.
What is the Total Female Population of Hamlet?
Total Female Population of Hamlet is 3,184.
What is the Ratio of Males per 100 Females in Hamlet?
There are 89.79 Males per 100 Females in Hamlet.
What is the Ratio of Females per 100 Males in Hamlet?
There are 111.37 Females per 100 Males in Hamlet.
What is the Median Population Age in Hamlet?
Median Population Age in Hamlet is 37.3 Years.
What is the Average Family Size in Hamlet
Average Family Size in Hamlet is 3.5 People.
What is the Average Household Size in Hamlet
Average Household Size in Hamlet is 2.6 People.
How Large is the Labor Force in Hamlet?
There are 2,414 People in the Labor Forcein in Hamlet.
What is the Percentage of People in the Labor Force in Hamlet?
51.6% of People are in the Labor Force in Hamlet.
What is the Unemployment Rate in Hamlet?
Unemployment Rate in Hamlet is 10.6%.