Washington Park, NC Map & Demographics
Washington Park Map
Washington Park Overview
$45,534
PER CAPITA INCOME
$104,236
AVG FAMILY INCOME
$82,250
AVG HOUSEHOLD INCOME
11.0%
WAGE / INCOME GAP [ % ]
89.0¢/ $1
WAGE / INCOME GAP [ $ ]
0.41
INEQUALITY / GINI INDEX
475
TOTAL POPULATION
196
MALE POPULATION
279
FEMALE POPULATION
70.25
MALES / 100 FEMALES
142.35
FEMALES / 100 MALES
55.4
MEDIAN AGE
2.6
AVG FAMILY SIZE
2.0
AVG HOUSEHOLD SIZE
207
LABOR FORCE [ PEOPLE ]
51.1%
PERCENT IN LABOR FORCE
12.6%
UNEMPLOYMENT RATE
Income in Washington Park
Income Overview in Washington Park
Per Capita Income in Washington Park is $45,534, while median incomes of families and households are $104,236 and $82,250 respectively.
| Characteristic | Number | Measure |
| Per Capita Income | 475 | $45,534 |
| Median Family Income | 141 | $104,236 |
| Mean Family Income | 141 | $120,001 |
| Median Household Income | 235 | $82,250 |
| Mean Household Income | 235 | $94,608 |
| Income Deficit | 141 | $0 |
| Wage / Income Gap (%) | 475 | 11.00% |
| Wage / Income Gap ($) | 475 | 89.00¢ per $1 |
| Gini / Inequality Index | 475 | 0.41 |
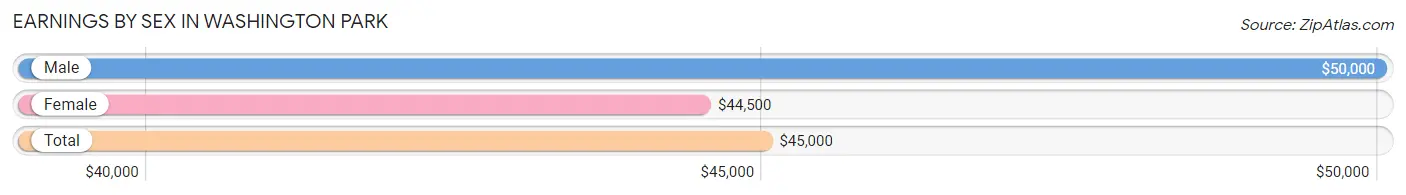
Earnings by Sex in Washington Park
Average Earnings in Washington Park are $45,000, $50,000 for men and $44,500 for women, a difference of 11.0%.
| Sex | Number | Average Earnings |
| Male | 78 (39.0%) | $50,000 |
| Female | 122 (61.0%) | $44,500 |
| Total | 200 (100.0%) | $45,000 |
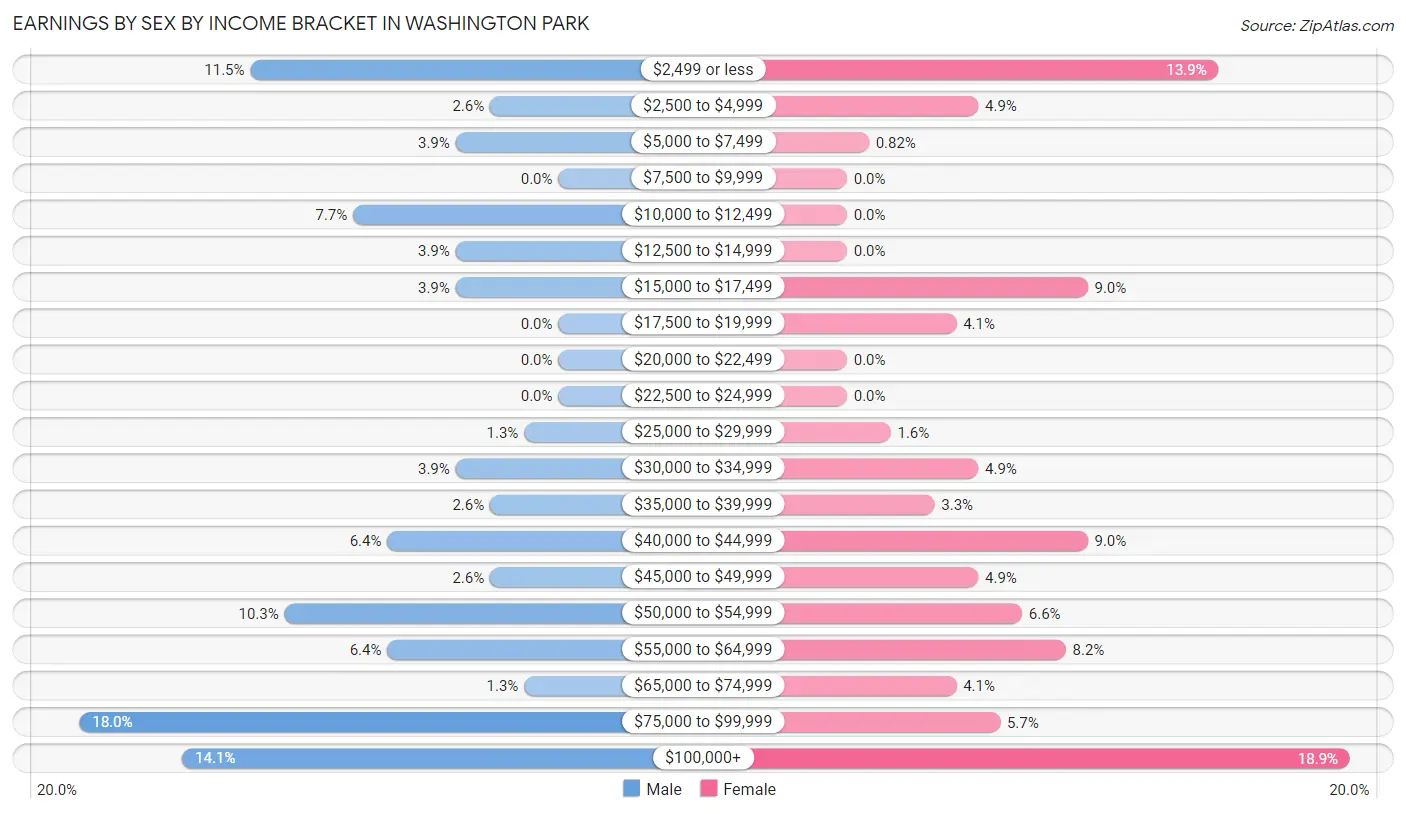
Earnings by Sex by Income Bracket in Washington Park
The most common earnings brackets in Washington Park are $75,000 to $99,999 for men (14 | 17.9%) and $100,000+ for women (23 | 18.9%).
| Income | Male | Female |
| $2,499 or less | 9 (11.5%) | 17 (13.9%) |
| $2,500 to $4,999 | 2 (2.6%) | 6 (4.9%) |
| $5,000 to $7,499 | 3 (3.8%) | 1 (0.8%) |
| $7,500 to $9,999 | 0 (0.0%) | 0 (0.0%) |
| $10,000 to $12,499 | 6 (7.7%) | 0 (0.0%) |
| $12,500 to $14,999 | 3 (3.8%) | 0 (0.0%) |
| $15,000 to $17,499 | 3 (3.8%) | 11 (9.0%) |
| $17,500 to $19,999 | 0 (0.0%) | 5 (4.1%) |
| $20,000 to $22,499 | 0 (0.0%) | 0 (0.0%) |
| $22,500 to $24,999 | 0 (0.0%) | 0 (0.0%) |
| $25,000 to $29,999 | 1 (1.3%) | 2 (1.6%) |
| $30,000 to $34,999 | 3 (3.8%) | 6 (4.9%) |
| $35,000 to $39,999 | 2 (2.6%) | 4 (3.3%) |
| $40,000 to $44,999 | 5 (6.4%) | 11 (9.0%) |
| $45,000 to $49,999 | 2 (2.6%) | 6 (4.9%) |
| $50,000 to $54,999 | 8 (10.3%) | 8 (6.6%) |
| $55,000 to $64,999 | 5 (6.4%) | 10 (8.2%) |
| $65,000 to $74,999 | 1 (1.3%) | 5 (4.1%) |
| $75,000 to $99,999 | 14 (17.9%) | 7 (5.7%) |
| $100,000+ | 11 (14.1%) | 23 (18.9%) |
| Total | 78 (100.0%) | 122 (100.0%) |
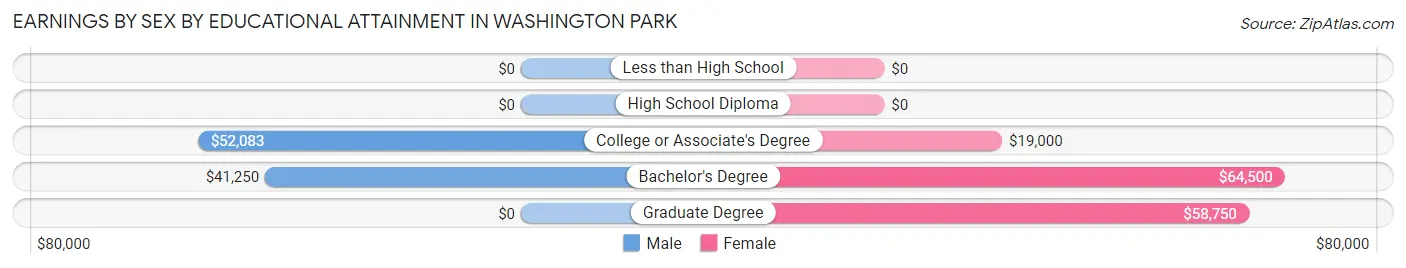
Earnings by Sex by Educational Attainment in Washington Park
Average earnings in Washington Park are $50,250 for men and $49,500 for women, a difference of 1.5%. Men with an educational attainment of college or associate's degree enjoy the highest average annual earnings of $52,083, while those with bachelor's degree education earn the least with $41,250. Women with an educational attainment of bachelor's degree earn the most with the average annual earnings of $64,500, while those with college or associate's degree education have the smallest earnings of $19,000.
| Educational Attainment | Male Income | Female Income |
| Less than High School | - | - |
| High School Diploma | - | - |
| College or Associate's Degree | $52,083 | $19,000 |
| Bachelor's Degree | $41,250 | $64,500 |
| Graduate Degree | - | - |
| Total | $50,250 | $49,500 |
Family Income in Washington Park
Family Income Brackets in Washington Park
According to the Washington Park family income data, there are 55 families falling into the $100,000 to $149,999 income range, which is the most common income bracket and makes up 39.0% of all families.
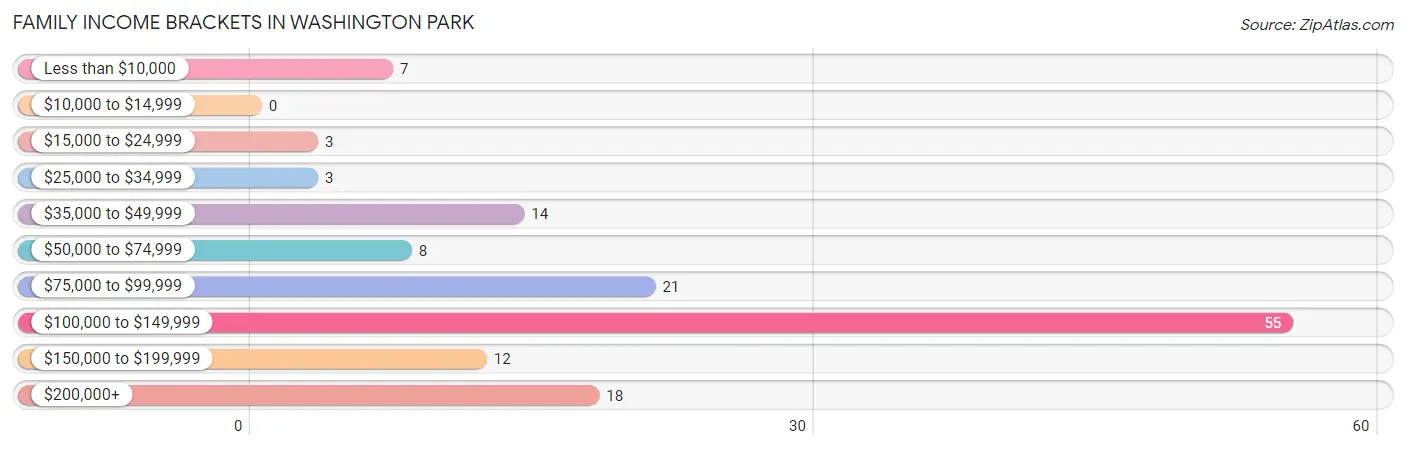
| Income Bracket | # Families | % Families |
| Less than $10,000 | 7 | 5.0% |
| $10,000 to $14,999 | 0 | 0.0% |
| $15,000 to $24,999 | 3 | 2.1% |
| $25,000 to $34,999 | 3 | 2.1% |
| $35,000 to $49,999 | 14 | 9.9% |
| $50,000 to $74,999 | 8 | 5.7% |
| $75,000 to $99,999 | 21 | 14.9% |
| $100,000 to $149,999 | 55 | 39.0% |
| $150,000 to $199,999 | 12 | 8.5% |
| $200,000+ | 18 | 12.8% |
Family Income by Famaliy Size in Washington Park
4-person families (10 | 7.1%) account for the highest median family income in Washington Park with $179,167 per family, while 2-person families (88 | 62.4%) have the highest median income of $51,597 per family member.
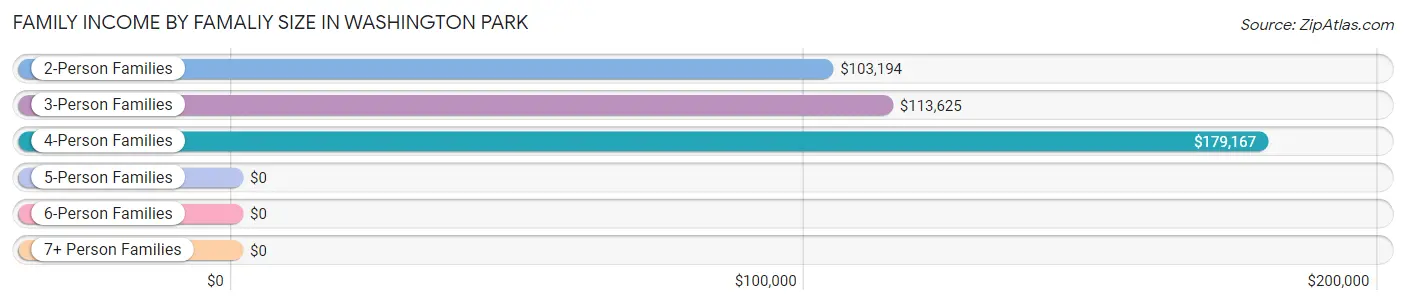
| Income Bracket | # Families | Median Income |
| 2-Person Families | 88 (62.4%) | $103,194 |
| 3-Person Families | 41 (29.1%) | $113,625 |
| 4-Person Families | 10 (7.1%) | $179,167 |
| 5-Person Families | 2 (1.4%) | $0 |
| 6-Person Families | 0 (0.0%) | $0 |
| 7+ Person Families | 0 (0.0%) | $0 |
| Total | 141 (100.0%) | $104,236 |
Family Income by Number of Earners in Washington Park
The median family income in Washington Park is $104,236, with families comprising 3+ earners (10) having the highest median family income of $155,500, while families with no earners (46) have the lowest median family income of $103,056, accounting for 7.1% and 32.6% of families, respectively.
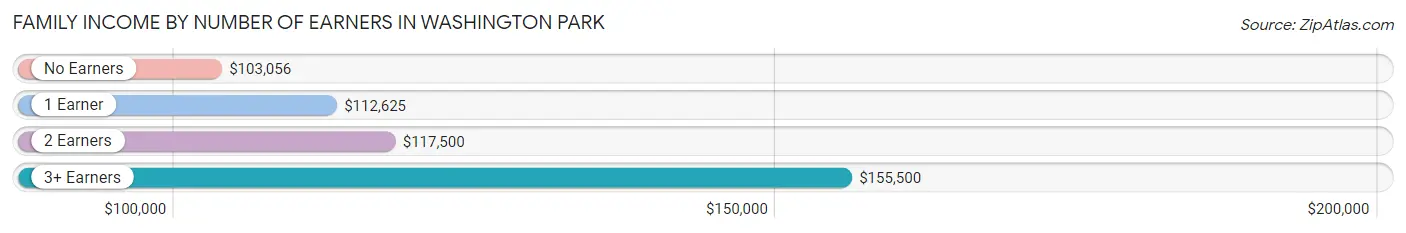
| Number of Earners | # Families | Median Income |
| No Earners | 46 (32.6%) | $103,056 |
| 1 Earner | 45 (31.9%) | $112,625 |
| 2 Earners | 40 (28.4%) | $117,500 |
| 3+ Earners | 10 (7.1%) | $155,500 |
| Total | 141 (100.0%) | $104,236 |
Household Income in Washington Park
Household Income Brackets in Washington Park
With 66 households falling in the category, the $100,000 to $149,999 income range is the most frequent in Washington Park, accounting for 28.1% of all households. In contrast, only 2 households (0.9%) fall into the $10,000 to $14,999 income bracket, making it the least populous group.
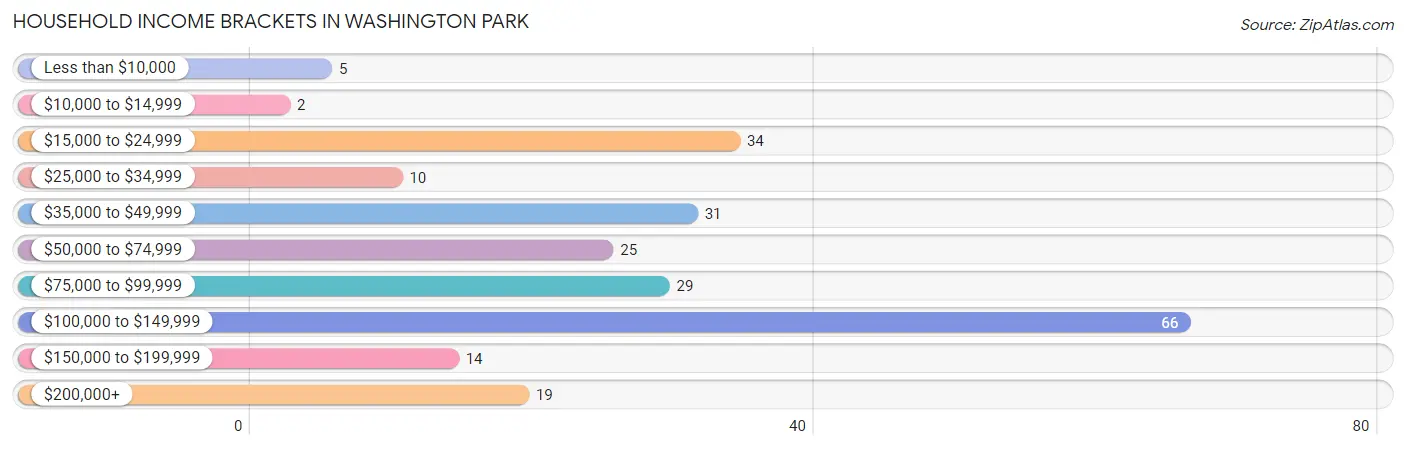
| Income Bracket | # Households | % Households |
| Less than $10,000 | 5 | 2.1% |
| $10,000 to $14,999 | 2 | 0.9% |
| $15,000 to $24,999 | 34 | 14.5% |
| $25,000 to $34,999 | 10 | 4.3% |
| $35,000 to $49,999 | 31 | 13.2% |
| $50,000 to $74,999 | 25 | 10.6% |
| $75,000 to $99,999 | 29 | 12.3% |
| $100,000 to $149,999 | 66 | 28.1% |
| $150,000 to $199,999 | 14 | 6.0% |
| $200,000+ | 19 | 8.1% |
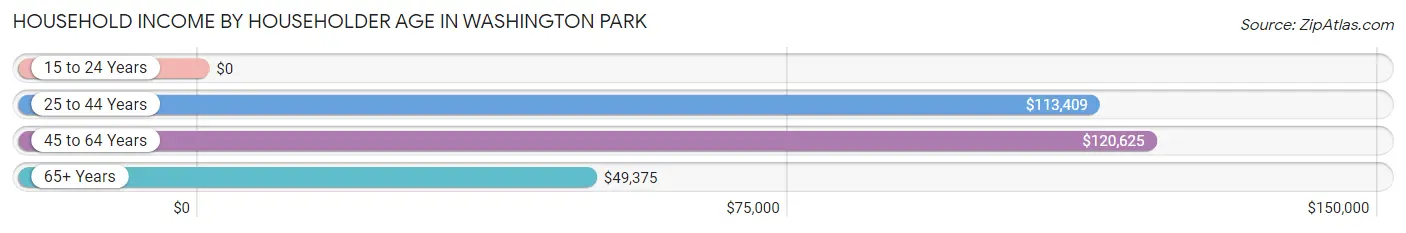
Household Income by Householder Age in Washington Park
The median household income in Washington Park is $82,250, with the highest median household income of $120,625 found in the 45 to 64 years age bracket for the primary householder. A total of 67 households (28.5%) fall into this category. Meanwhile, the 15 to 24 years age bracket for the primary householder has the lowest median household income of $0, with 1 households (0.4%) in this group.
| Income Bracket | # Households | Median Income |
| 15 to 24 Years | 1 (0.4%) | $0 |
| 25 to 44 Years | 30 (12.8%) | $113,409 |
| 45 to 64 Years | 67 (28.5%) | $120,625 |
| 65+ Years | 137 (58.3%) | $49,375 |
| Total | 235 (100.0%) | $82,250 |
Poverty in Washington Park
Income Below Poverty by Sex and Age in Washington Park
With 5.6% poverty level for males and 9.0% for females among the residents of Washington Park, 75 year old and over males and 5 year old females are the most vulnerable to poverty, with 7 males (15.6%) and 4 females (100.0%) in their respective age groups living below the poverty level.
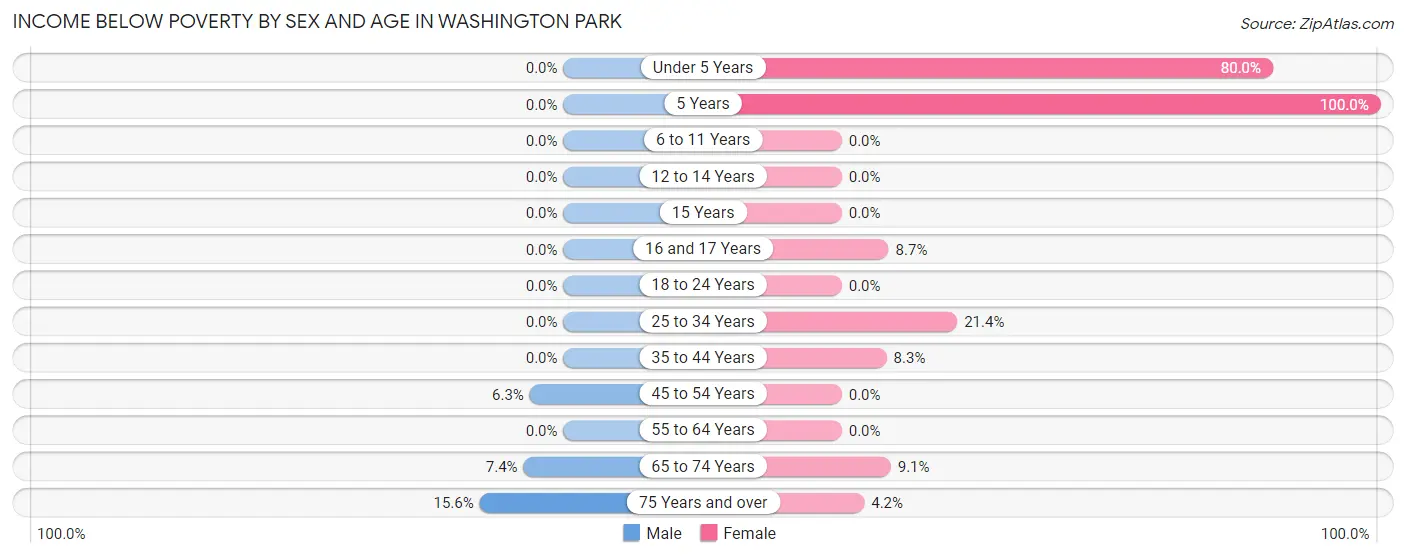
| Age Bracket | Male | Female |
| Under 5 Years | 0 (0.0%) | 8 (80.0%) |
| 5 Years | 0 (0.0%) | 4 (100.0%) |
| 6 to 11 Years | 0 (0.0%) | 0 (0.0%) |
| 12 to 14 Years | 0 (0.0%) | 0 (0.0%) |
| 15 Years | 0 (0.0%) | 0 (0.0%) |
| 16 and 17 Years | 0 (0.0%) | 2 (8.7%) |
| 18 to 24 Years | 0 (0.0%) | 0 (0.0%) |
| 25 to 34 Years | 0 (0.0%) | 3 (21.4%) |
| 35 to 44 Years | 0 (0.0%) | 2 (8.3%) |
| 45 to 54 Years | 2 (6.2%) | 0 (0.0%) |
| 55 to 64 Years | 0 (0.0%) | 0 (0.0%) |
| 65 to 74 Years | 2 (7.4%) | 3 (9.1%) |
| 75 Years and over | 7 (15.6%) | 3 (4.2%) |
| Total | 11 (5.6%) | 25 (9.0%) |
Income Above Poverty by Sex and Age in Washington Park
According to the poverty statistics in Washington Park, males aged under 5 years and females aged 6 to 11 years are the age groups that are most secure financially, with 100.0% of males and 100.0% of females in these age groups living above the poverty line.
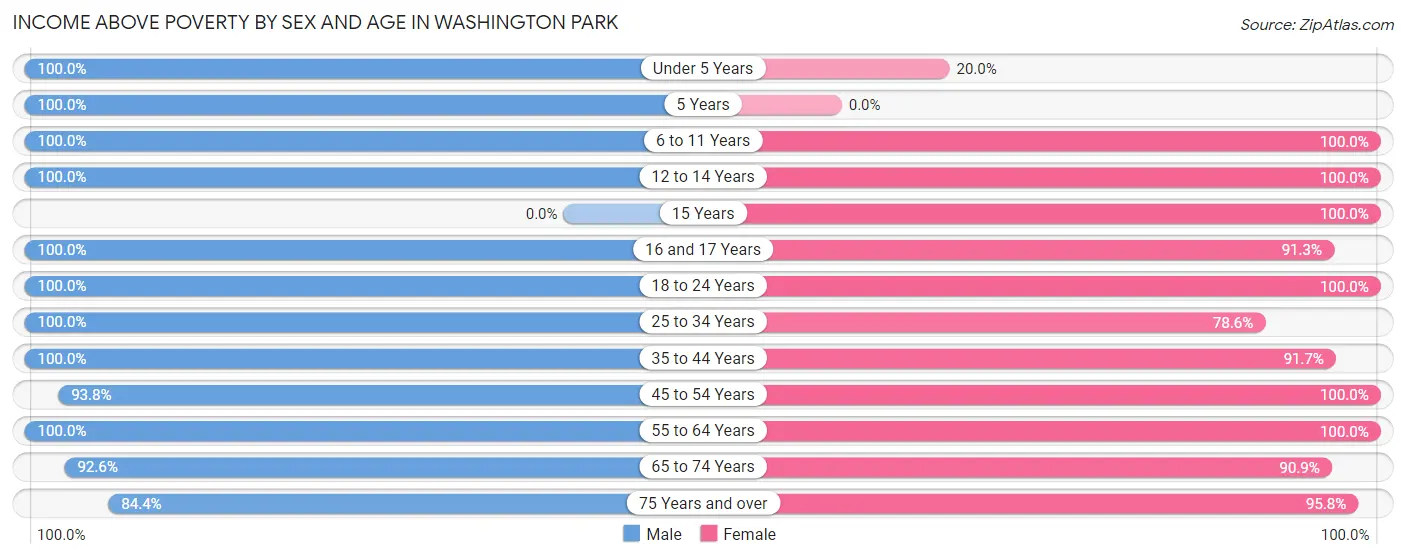
| Age Bracket | Male | Female |
| Under 5 Years | 19 (100.0%) | 2 (20.0%) |
| 5 Years | 2 (100.0%) | 0 (0.0%) |
| 6 to 11 Years | 6 (100.0%) | 11 (100.0%) |
| 12 to 14 Years | 7 (100.0%) | 3 (100.0%) |
| 15 Years | 0 (0.0%) | 8 (100.0%) |
| 16 and 17 Years | 2 (100.0%) | 21 (91.3%) |
| 18 to 24 Years | 1 (100.0%) | 2 (100.0%) |
| 25 to 34 Years | 11 (100.0%) | 11 (78.6%) |
| 35 to 44 Years | 20 (100.0%) | 22 (91.7%) |
| 45 to 54 Years | 30 (93.8%) | 37 (100.0%) |
| 55 to 64 Years | 24 (100.0%) | 38 (100.0%) |
| 65 to 74 Years | 25 (92.6%) | 30 (90.9%) |
| 75 Years and over | 38 (84.4%) | 69 (95.8%) |
| Total | 185 (94.4%) | 254 (91.0%) |
Income Below Poverty Among Married-Couple Families in Washington Park
The poverty statistics for married-couple families in Washington Park show that 3.0% or 4 of the total 134 families live below the poverty line. Families with no children have the highest poverty rate of 4.2%, comprising of 4 families. On the other hand, families with 1 or 2 children have the lowest poverty rate of 0.0%, which includes 0 families.
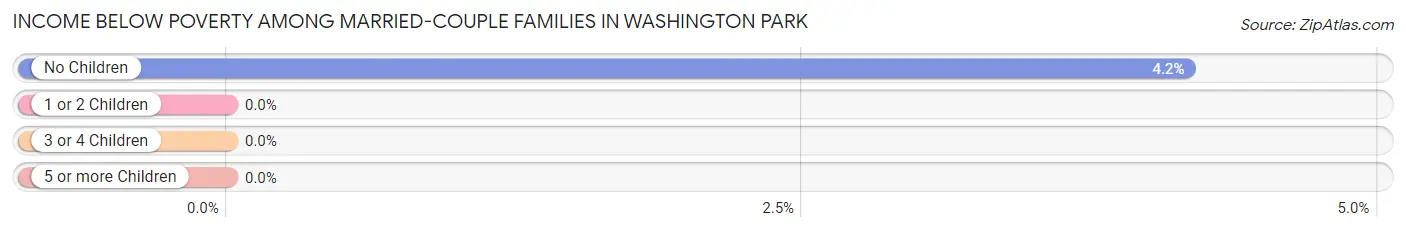
| Children | Above Poverty | Below Poverty |
| No Children | 92 (95.8%) | 4 (4.2%) |
| 1 or 2 Children | 36 (100.0%) | 0 (0.0%) |
| 3 or 4 Children | 2 (100.0%) | 0 (0.0%) |
| 5 or more Children | 0 (0.0%) | 0 (0.0%) |
| Total | 130 (97.0%) | 4 (3.0%) |
Income Below Poverty Among Single-Parent Households in Washington Park
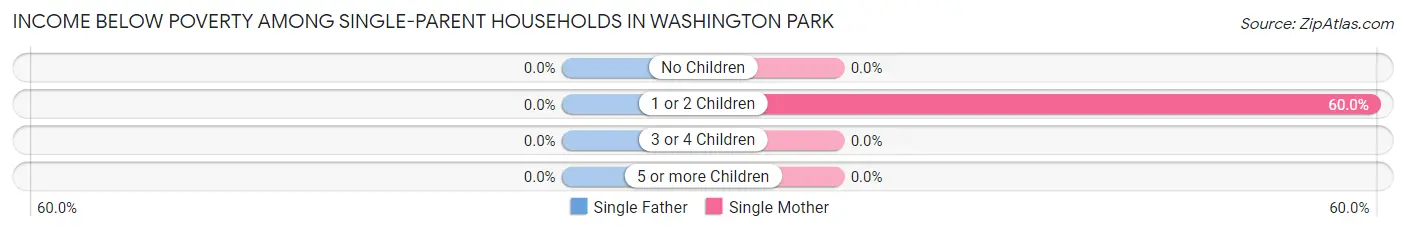
| Children | Single Father | Single Mother |
| No Children | 0 (0.0%) | 0 (0.0%) |
| 1 or 2 Children | 0 (0.0%) | 3 (60.0%) |
| 3 or 4 Children | 0 (0.0%) | 0 (0.0%) |
| 5 or more Children | 0 (0.0%) | 0 (0.0%) |
| Total | 0 (0.0%) | 3 (60.0%) |
Income Below Poverty Among Married-Couple vs Single-Parent Households in Washington Park
The poverty data for Washington Park shows that 4 of the married-couple family households (3.0%) and 3 of the single-parent households (42.9%) are living below the poverty level. Within the married-couple family households, those with no children have the highest poverty rate, with 4 households (4.2%) falling below the poverty line. Among the single-parent households, those with 1 or 2 children have the highest poverty rate, with 3 household (42.9%) living below poverty.
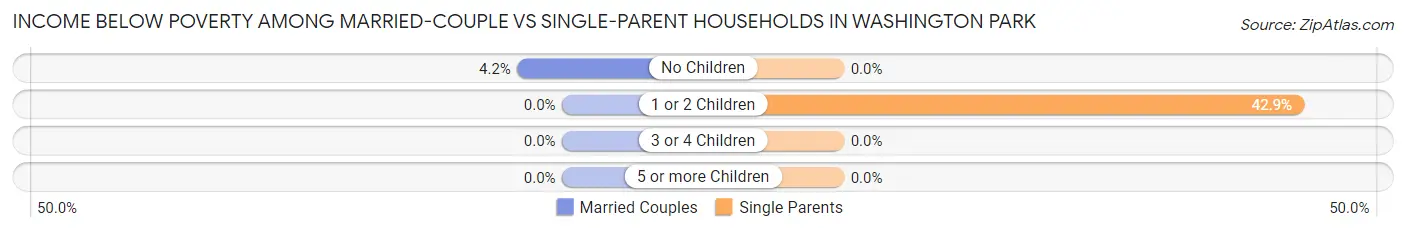
| Children | Married-Couple Families | Single-Parent Households |
| No Children | 4 (4.2%) | 0 (0.0%) |
| 1 or 2 Children | 0 (0.0%) | 3 (42.9%) |
| 3 or 4 Children | 0 (0.0%) | 0 (0.0%) |
| 5 or more Children | 0 (0.0%) | 0 (0.0%) |
| Total | 4 (3.0%) | 3 (42.9%) |
Race in Washington Park
The most populous races in Washington Park are White / Caucasian (451 | 95.0%), Two or more Races (16 | 3.4%), and Black / African American (4 | 0.8%).
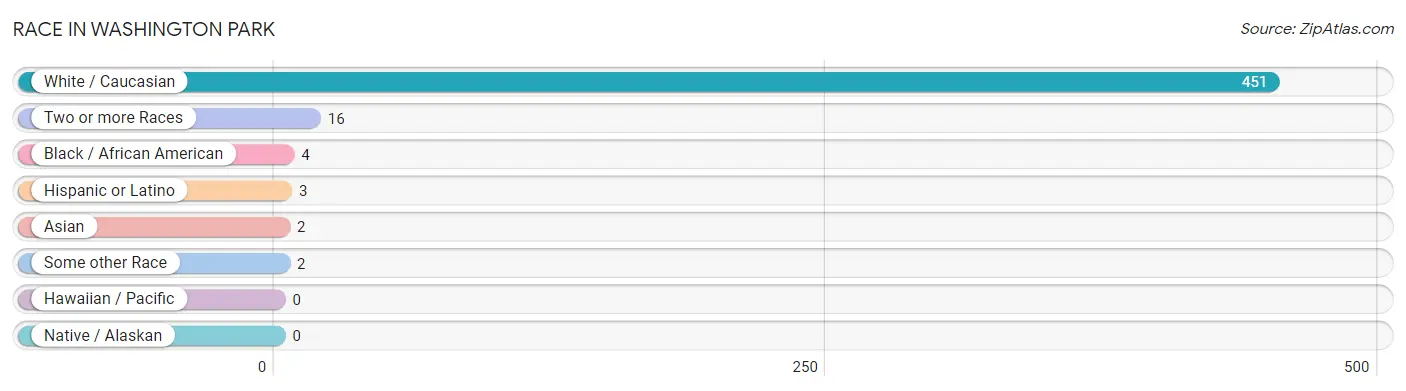
| Race | # Population | % Population |
| Asian | 2 | 0.4% |
| Black / African American | 4 | 0.8% |
| Hawaiian / Pacific | 0 | 0.0% |
| Hispanic or Latino | 3 | 0.6% |
| Native / Alaskan | 0 | 0.0% |
| White / Caucasian | 451 | 95.0% |
| Two or more Races | 16 | 3.4% |
| Some other Race | 2 | 0.4% |
| Total | 475 | 100.0% |
Ancestry in Washington Park
The most populous ancestries reported in Washington Park are English (123 | 25.9%), German (45 | 9.5%), Irish (38 | 8.0%), American (35 | 7.4%), and Scotch-Irish (17 | 3.6%), together accounting for 54.3% of all Washington Park residents.
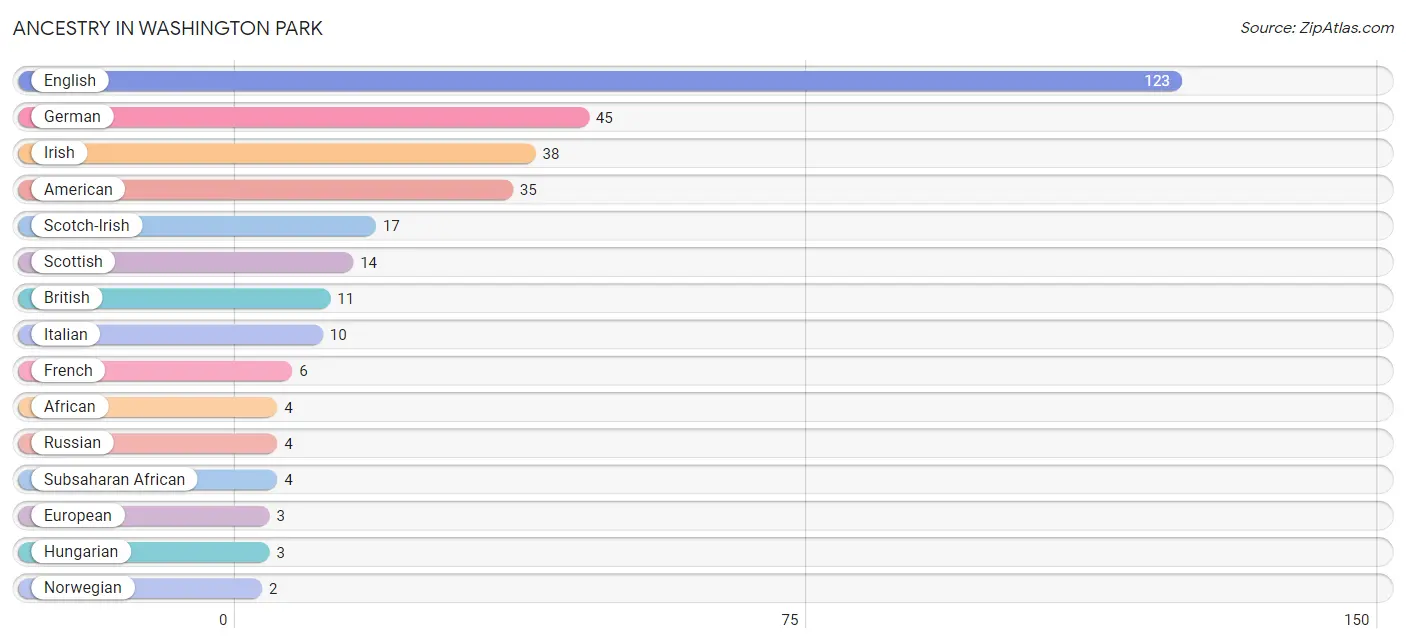
| Ancestry | # Population | % Population |
| African | 4 | 0.8% |
| American | 35 | 7.4% |
| Austrian | 1 | 0.2% |
| British | 11 | 2.3% |
| Danish | 1 | 0.2% |
| English | 123 | 25.9% |
| European | 3 | 0.6% |
| French | 6 | 1.3% |
| German | 45 | 9.5% |
| Greek | 1 | 0.2% |
| Hungarian | 3 | 0.6% |
| Irish | 38 | 8.0% |
| Italian | 10 | 2.1% |
| Mexican | 1 | 0.2% |
| Norwegian | 2 | 0.4% |
| Russian | 4 | 0.8% |
| Scandinavian | 2 | 0.4% |
| Scotch-Irish | 17 | 3.6% |
| Scottish | 14 | 2.9% |
| Slovene | 2 | 0.4% |
| Sri Lankan | 2 | 0.4% |
| Subsaharan African | 4 | 0.8% |
| Swedish | 1 | 0.2% |
| Ukrainian | 2 | 0.4% |
| Welsh | 2 | 0.4% | View All 25 Rows |
Immigrants in Washington Park
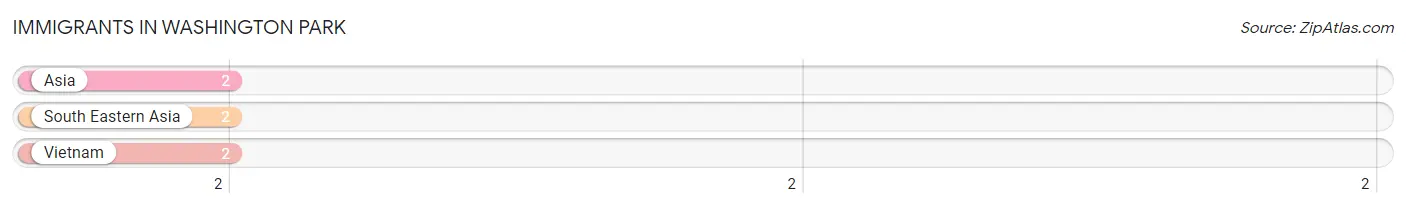
The most numerous immigrant groups reported in Washington Park came from Asia (2 | 0.4%), South Eastern Asia (2 | 0.4%), and Vietnam (2 | 0.4%), together accounting for 1.3% of all Washington Park residents.
| Immigration Origin | # Population | % Population |
| Asia | 2 | 0.4% |
| South Eastern Asia | 2 | 0.4% |
| Vietnam | 2 | 0.4% | View All 3 Rows |
Sex and Age in Washington Park
Sex and Age in Washington Park
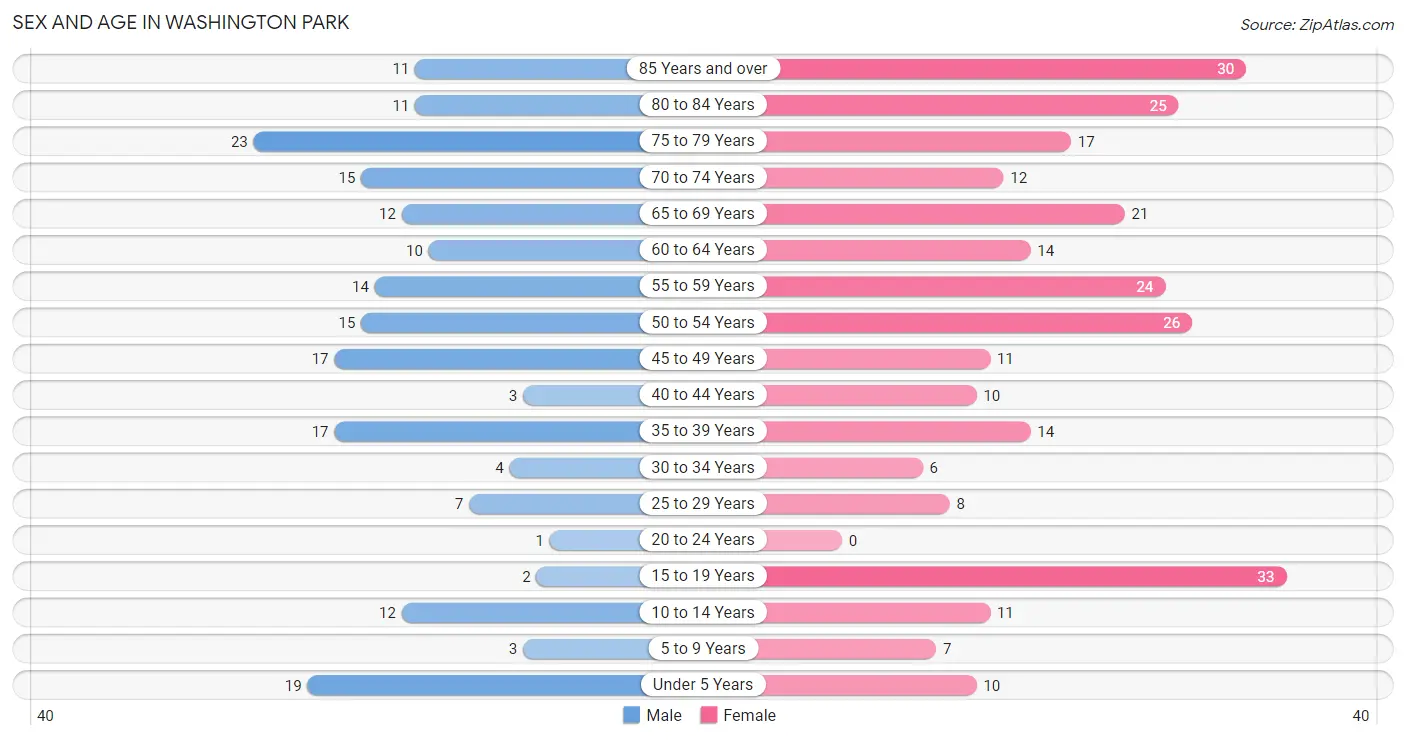
The most populous age groups in Washington Park are 75 to 79 Years (23 | 11.7%) for men and 15 to 19 Years (33 | 11.8%) for women.
| Age Bracket | Male | Female |
| Under 5 Years | 19 (9.7%) | 10 (3.6%) |
| 5 to 9 Years | 3 (1.5%) | 7 (2.5%) |
| 10 to 14 Years | 12 (6.1%) | 11 (3.9%) |
| 15 to 19 Years | 2 (1.0%) | 33 (11.8%) |
| 20 to 24 Years | 1 (0.5%) | 0 (0.0%) |
| 25 to 29 Years | 7 (3.6%) | 8 (2.9%) |
| 30 to 34 Years | 4 (2.0%) | 6 (2.1%) |
| 35 to 39 Years | 17 (8.7%) | 14 (5.0%) |
| 40 to 44 Years | 3 (1.5%) | 10 (3.6%) |
| 45 to 49 Years | 17 (8.7%) | 11 (3.9%) |
| 50 to 54 Years | 15 (7.6%) | 26 (9.3%) |
| 55 to 59 Years | 14 (7.1%) | 24 (8.6%) |
| 60 to 64 Years | 10 (5.1%) | 14 (5.0%) |
| 65 to 69 Years | 12 (6.1%) | 21 (7.5%) |
| 70 to 74 Years | 15 (7.6%) | 12 (4.3%) |
| 75 to 79 Years | 23 (11.7%) | 17 (6.1%) |
| 80 to 84 Years | 11 (5.6%) | 25 (9.0%) |
| 85 Years and over | 11 (5.6%) | 30 (10.7%) |
| Total | 196 (100.0%) | 279 (100.0%) |
Families and Households in Washington Park
Median Family Size in Washington Park
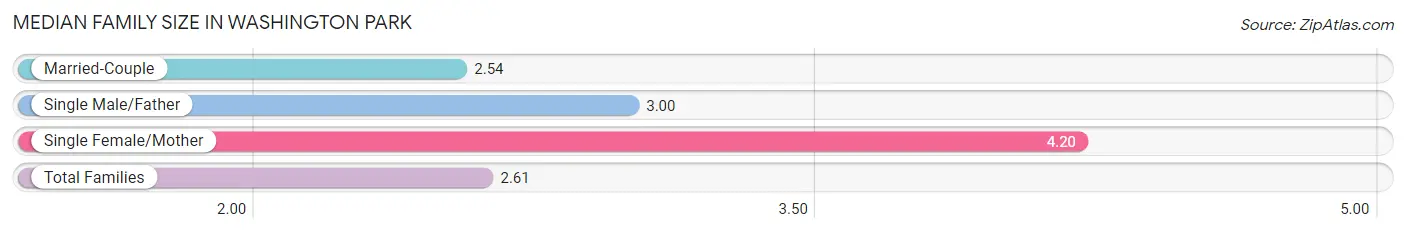
The median family size in Washington Park is 2.61 persons per family, with single female/mother families (5 | 3.5%) accounting for the largest median family size of 4.2 persons per family. On the other hand, married-couple families (134 | 95.0%) represent the smallest median family size with 2.54 persons per family.
| Family Type | # Families | Family Size |
| Married-Couple | 134 (95.0%) | 2.54 |
| Single Male/Father | 2 (1.4%) | 3.00 |
| Single Female/Mother | 5 (3.5%) | 4.20 |
| Total Families | 141 (100.0%) | 2.61 |
Median Household Size in Washington Park
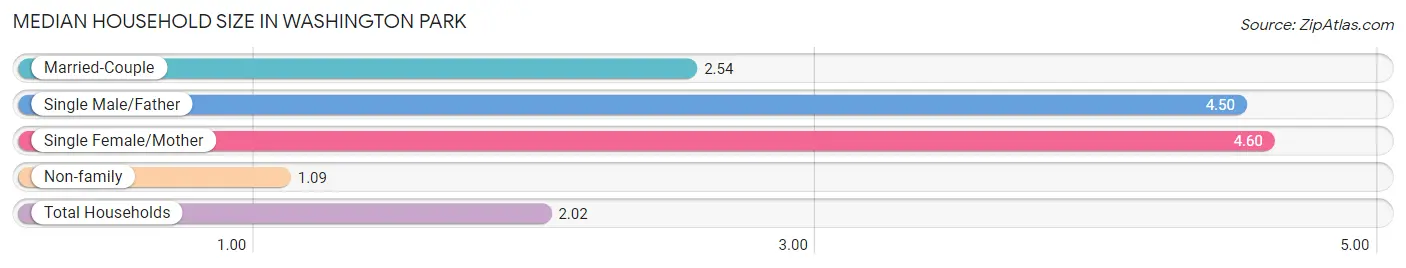
The median household size in Washington Park is 2.02 persons per household, with single female/mother households (5 | 2.1%) accounting for the largest median household size of 4.6 persons per household. non-family households (94 | 40.0%) represent the smallest median household size with 1.09 persons per household.
| Household Type | # Households | Household Size |
| Married-Couple | 134 (57.0%) | 2.54 |
| Single Male/Father | 2 (0.9%) | 4.50 |
| Single Female/Mother | 5 (2.1%) | 4.60 |
| Non-family | 94 (40.0%) | 1.09 |
| Total Households | 235 (100.0%) | 2.02 |
Household Size by Marriage Status in Washington Park
Out of a total of 235 households in Washington Park, 141 (60.0%) are family households, while 94 (40.0%) are nonfamily households. The most numerous type of family households are 2-person households, comprising 86, and the most common type of nonfamily households are 1-person households, comprising 88.
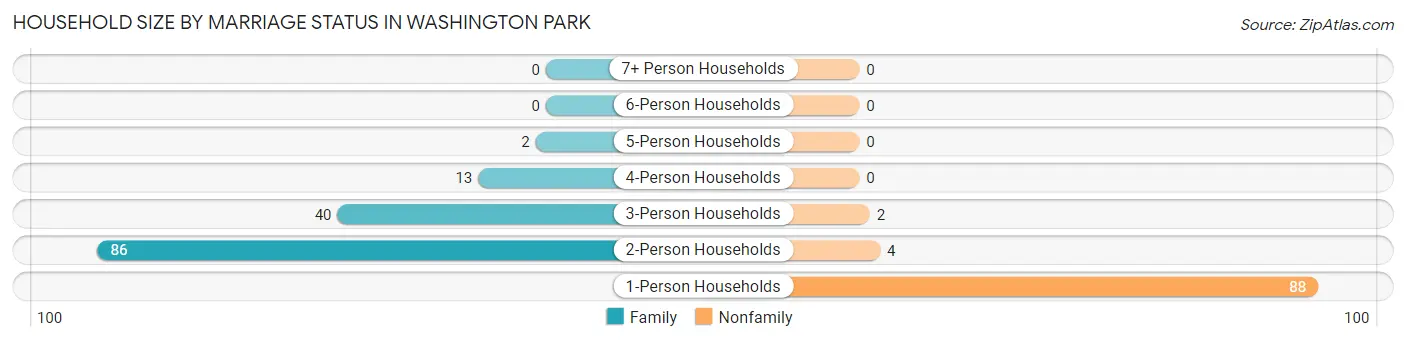
| Household Size | Family Households | Nonfamily Households |
| 1-Person Households | - | 88 (37.4%) |
| 2-Person Households | 86 (36.6%) | 4 (1.7%) |
| 3-Person Households | 40 (17.0%) | 2 (0.9%) |
| 4-Person Households | 13 (5.5%) | 0 (0.0%) |
| 5-Person Households | 2 (0.9%) | 0 (0.0%) |
| 6-Person Households | 0 (0.0%) | 0 (0.0%) |
| 7+ Person Households | 0 (0.0%) | 0 (0.0%) |
| Total | 141 (60.0%) | 94 (40.0%) |
Female Fertility in Washington Park
Fertility by Age in Washington Park
Average fertility rate in Washington Park is 24.0 births per 1,000 women. Women in the age bracket of 35 to 50 years have the highest fertility rate with 54.0 births per 1,000 women. Women in the age bracket of 35 to 50 years acount for 100.0% of all women with births.
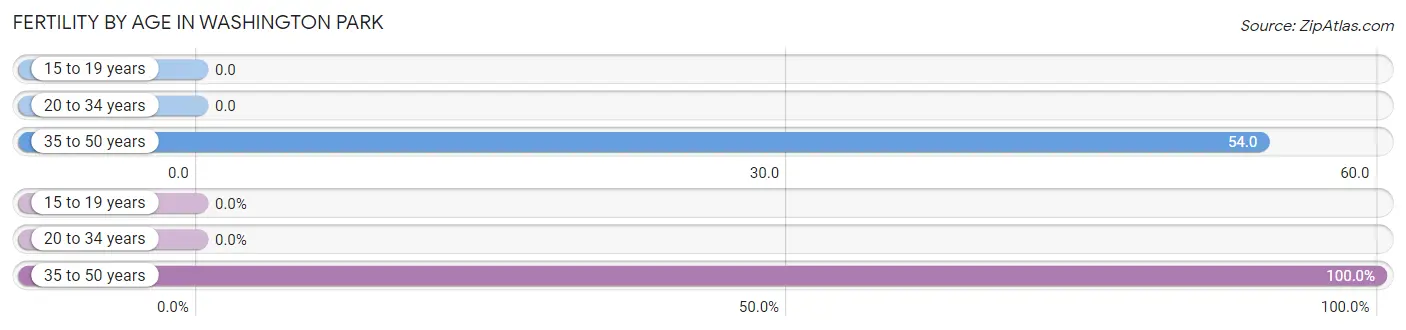
| Age Bracket | Women with Births | Births / 1,000 Women |
| 15 to 19 years | 0 (0.0%) | 0.0 |
| 20 to 34 years | 0 (0.0%) | 0.0 |
| 35 to 50 years | 2 (100.0%) | 54.0 |
| Total | 2 (100.0%) | 24.0 |
Fertility by Age by Marriage Status in Washington Park

| Age Bracket | Married | Unmarried |
| 15 to 19 years | 0 (0.0%) | 0 (0.0%) |
| 20 to 34 years | 0 (0.0%) | 0 (0.0%) |
| 35 to 50 years | 2 (100.0%) | 0 (0.0%) |
| Total | 2 (100.0%) | 0 (0.0%) |
Fertility by Education in Washington Park
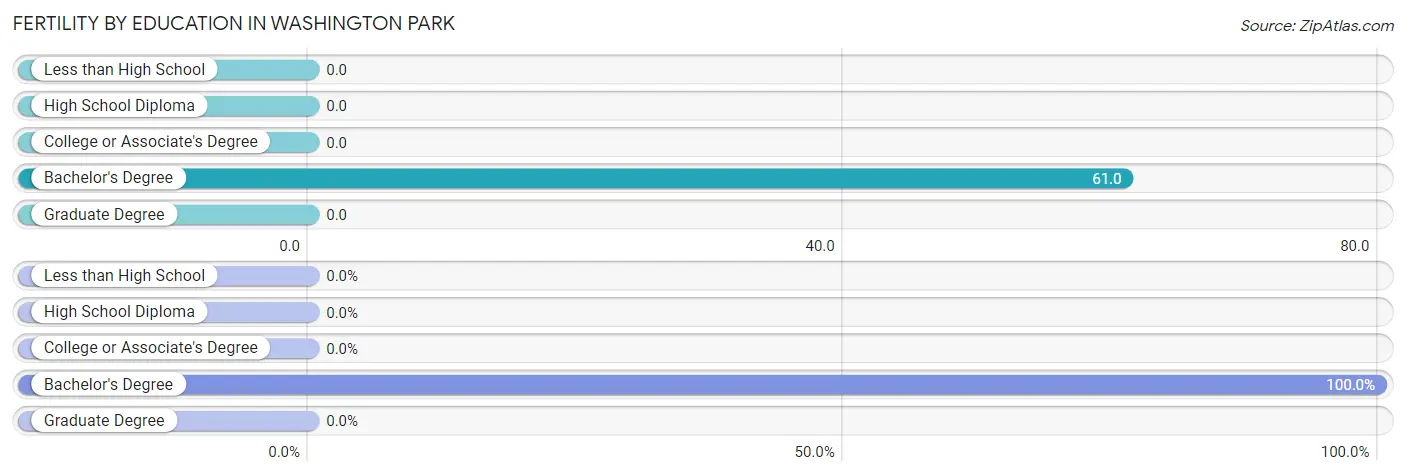
| Educational Attainment | Women with Births | Births / 1,000 Women |
| Less than High School | 0 (0.0%) | 0.0 |
| High School Diploma | 0 (0.0%) | 0.0 |
| College or Associate's Degree | 0 (0.0%) | 0.0 |
| Bachelor's Degree | 2 (100.0%) | 61.0 |
| Graduate Degree | 0 (0.0%) | 0.0 |
| Total | 2 (100.0%) | 24.0 |
Fertility by Education by Marriage Status in Washington Park
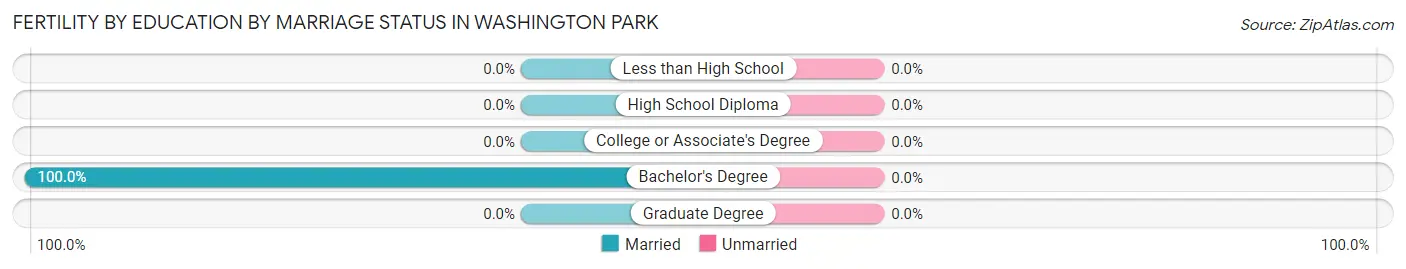
| Educational Attainment | Married | Unmarried |
| Less than High School | 0 (0.0%) | 0 (0.0%) |
| High School Diploma | 0 (0.0%) | 0 (0.0%) |
| College or Associate's Degree | 0 (0.0%) | 0 (0.0%) |
| Bachelor's Degree | 2 (100.0%) | 0 (0.0%) |
| Graduate Degree | 0 (0.0%) | 0 (0.0%) |
| Total | 2 (100.0%) | 0 (0.0%) |
Employment Characteristics in Washington Park
Employment by Class of Employer in Washington Park
Among the 180 employed individuals in Washington Park, private company employees (90 | 50.0%), local government employees (28 | 15.6%), and not-for-profit organizations (18 | 10.0%) make up the most common classes of employment.
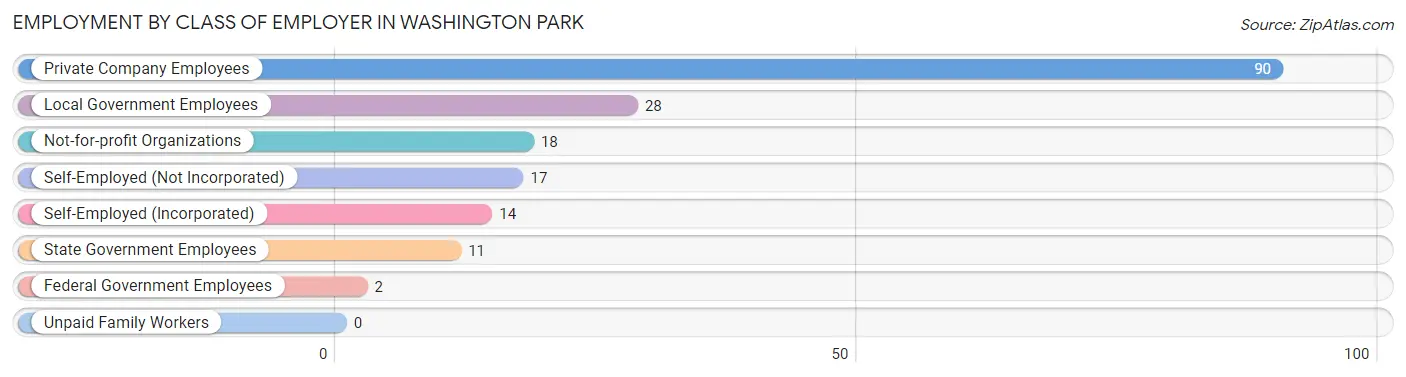
| Employer Class | # Employees | % Employees |
| Private Company Employees | 90 | 50.0% |
| Self-Employed (Incorporated) | 14 | 7.8% |
| Self-Employed (Not Incorporated) | 17 | 9.4% |
| Not-for-profit Organizations | 18 | 10.0% |
| Local Government Employees | 28 | 15.6% |
| State Government Employees | 11 | 6.1% |
| Federal Government Employees | 2 | 1.1% |
| Unpaid Family Workers | 0 | 0.0% |
| Total | 180 | 100.0% |
Employment Status by Age in Washington Park
According to the labor force statistics for Washington Park, out of the total population over 16 years of age (405), 51.1% or 207 individuals are in the labor force, with 12.6% or 26 of them unemployed. The age group with the highest labor force participation rate is 20 to 24 years, with 100.0% or 1 individuals in the labor force. Within the labor force, the 35 to 44 years age range has the highest percentage of unemployed individuals, with 41.9% or 18 of them being unemployed.
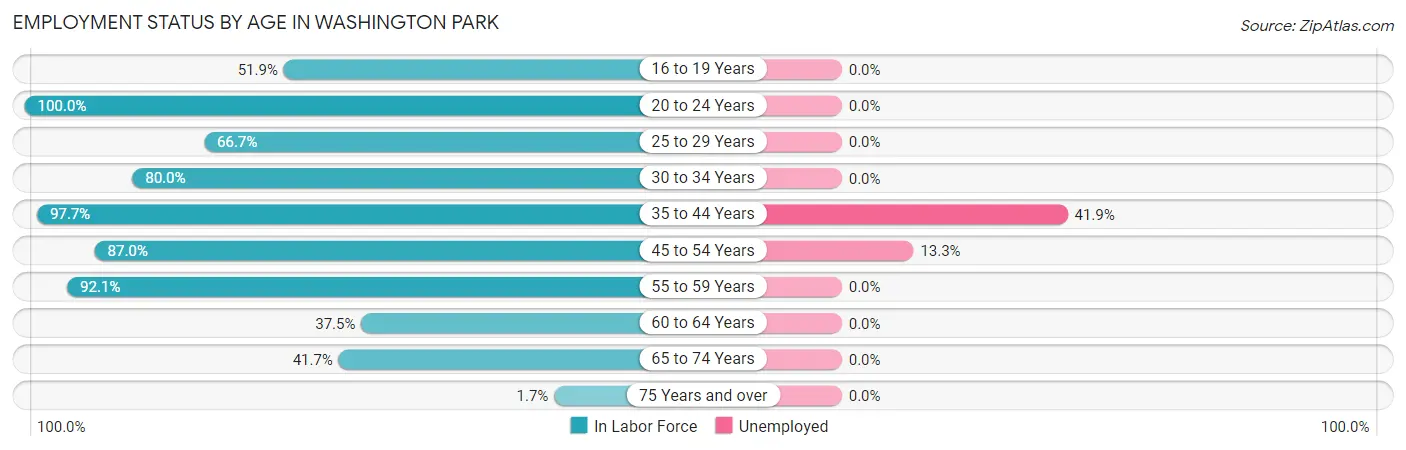
| Age Bracket | In Labor Force | Unemployed |
| 16 to 19 Years | 14 (51.9%) | 0 (0.0%) |
| 20 to 24 Years | 1 (100.0%) | 0 (0.0%) |
| 25 to 29 Years | 10 (66.7%) | 0 (0.0%) |
| 30 to 34 Years | 8 (80.0%) | 0 (0.0%) |
| 35 to 44 Years | 43 (97.7%) | 18 (41.9%) |
| 45 to 54 Years | 60 (87.0%) | 8 (13.3%) |
| 55 to 59 Years | 35 (92.1%) | 0 (0.0%) |
| 60 to 64 Years | 9 (37.5%) | 0 (0.0%) |
| 65 to 74 Years | 25 (41.7%) | 0 (0.0%) |
| 75 Years and over | 2 (1.7%) | 0 (0.0%) |
| Total | 207 (51.1%) | 26 (12.6%) |
Employment Status by Educational Attainment in Washington Park
According to labor force statistics for Washington Park, 82.5% of individuals (165) out of the total population between 25 and 64 years of age (200) are in the labor force, with 15.8% or 26 of them being unemployed. The group with the highest labor force participation rate are those with the educational attainment of less than high school, with 100.0% or 2 individuals in the labor force. Within the labor force, individuals with high school diploma education have the highest percentage of unemployment, with 50.0% or 10 of them being unemployed.
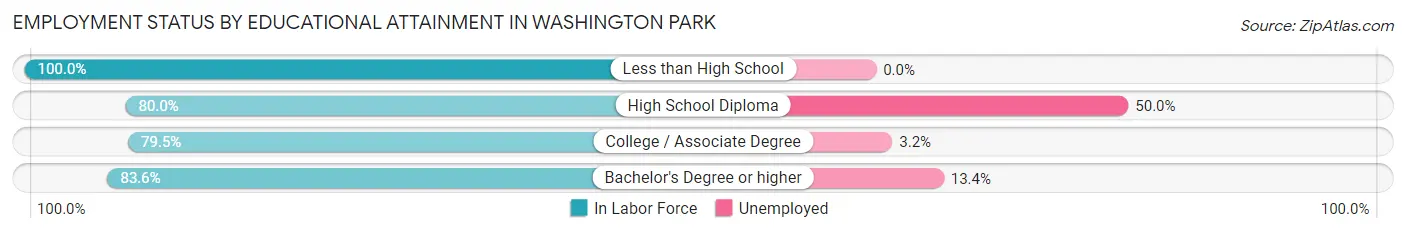
| Educational Attainment | In Labor Force | Unemployed |
| Less than High School | 2 (100.0%) | 0 (0.0%) |
| High School Diploma | 20 (80.0%) | 12 (50.0%) |
| College / Associate Degree | 31 (79.5%) | 1 (3.2%) |
| Bachelor's Degree or higher | 112 (83.6%) | 18 (13.4%) |
| Total | 165 (82.5%) | 32 (15.8%) |
Employment Occupations by Sex in Washington Park
Management, Business, Science and Arts Occupations
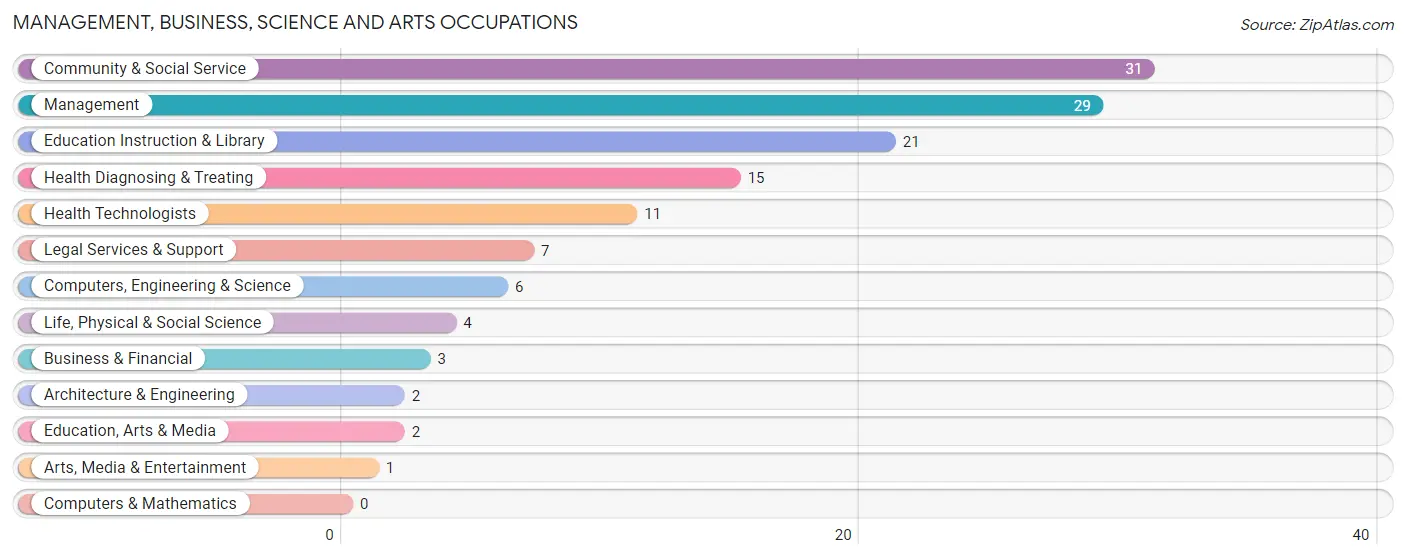
The most common Management, Business, Science and Arts occupations in Washington Park are Community & Social Service (31 | 17.1%), Management (29 | 16.0%), Education Instruction & Library (21 | 11.6%), Health Diagnosing & Treating (15 | 8.3%), and Health Technologists (11 | 6.1%).
Management, Business, Science and Arts Occupations by Sex
Within the Management, Business, Science and Arts occupations in Washington Park, the most male-oriented occupations are Architecture & Engineering (100.0%), Computers, Engineering & Science (83.3%), and Life, Physical & Social Science (75.0%), while the most female-oriented occupations are Education, Arts & Media (100.0%), Arts, Media & Entertainment (100.0%), and Health Diagnosing & Treating (93.3%).
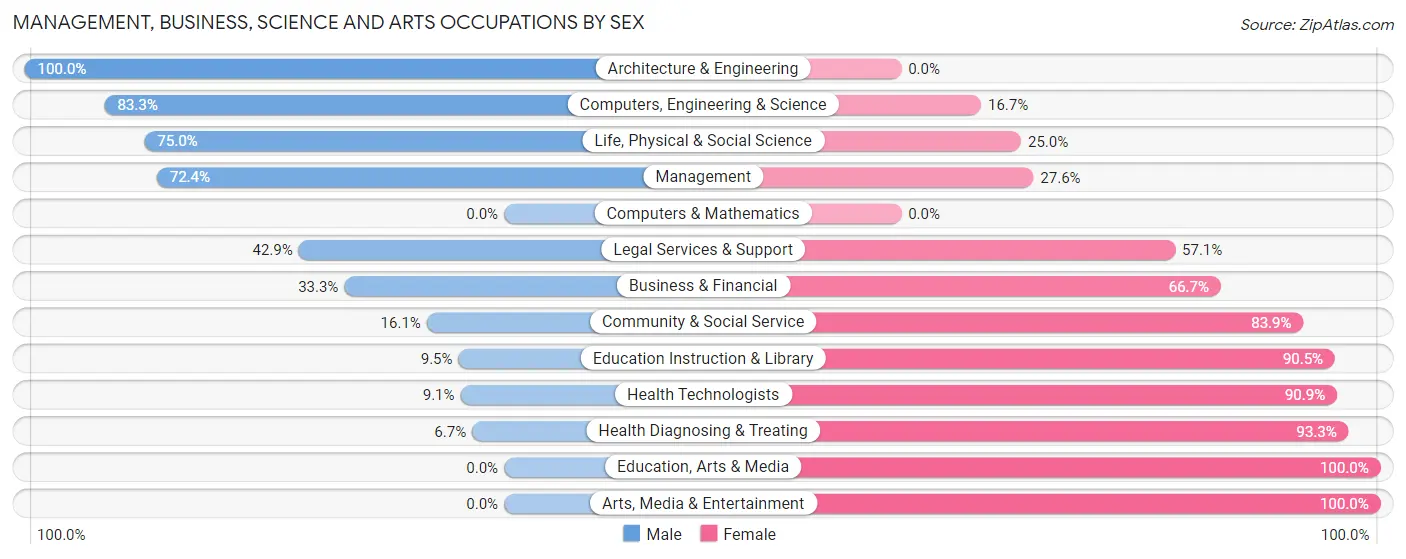
| Occupation | Male | Female |
| Management | 21 (72.4%) | 8 (27.6%) |
| Business & Financial | 1 (33.3%) | 2 (66.7%) |
| Computers, Engineering & Science | 5 (83.3%) | 1 (16.7%) |
| Computers & Mathematics | 0 (0.0%) | 0 (0.0%) |
| Architecture & Engineering | 2 (100.0%) | 0 (0.0%) |
| Life, Physical & Social Science | 3 (75.0%) | 1 (25.0%) |
| Community & Social Service | 5 (16.1%) | 26 (83.9%) |
| Education, Arts & Media | 0 (0.0%) | 2 (100.0%) |
| Legal Services & Support | 3 (42.9%) | 4 (57.1%) |
| Education Instruction & Library | 2 (9.5%) | 19 (90.5%) |
| Arts, Media & Entertainment | 0 (0.0%) | 1 (100.0%) |
| Health Diagnosing & Treating | 1 (6.7%) | 14 (93.3%) |
| Health Technologists | 1 (9.1%) | 10 (90.9%) |
| Total (Category) | 33 (39.3%) | 51 (60.7%) |
| Total (Overall) | 68 (37.6%) | 113 (62.4%) |
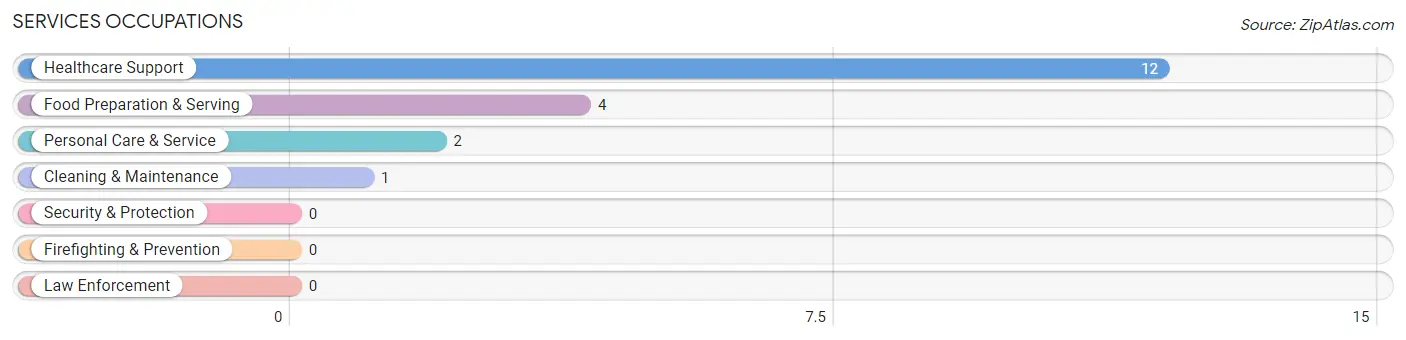
Services Occupations
The most common Services occupations in Washington Park are Healthcare Support (12 | 6.6%), Food Preparation & Serving (4 | 2.2%), Personal Care & Service (2 | 1.1%), and Cleaning & Maintenance (1 | 0.5%).
Services Occupations by Sex
Within the Services occupations in Washington Park, the most male-oriented occupations are Cleaning & Maintenance (100.0%), and Food Preparation & Serving (50.0%), while the most female-oriented occupations are Healthcare Support (100.0%), Personal Care & Service (100.0%), and Food Preparation & Serving (50.0%).
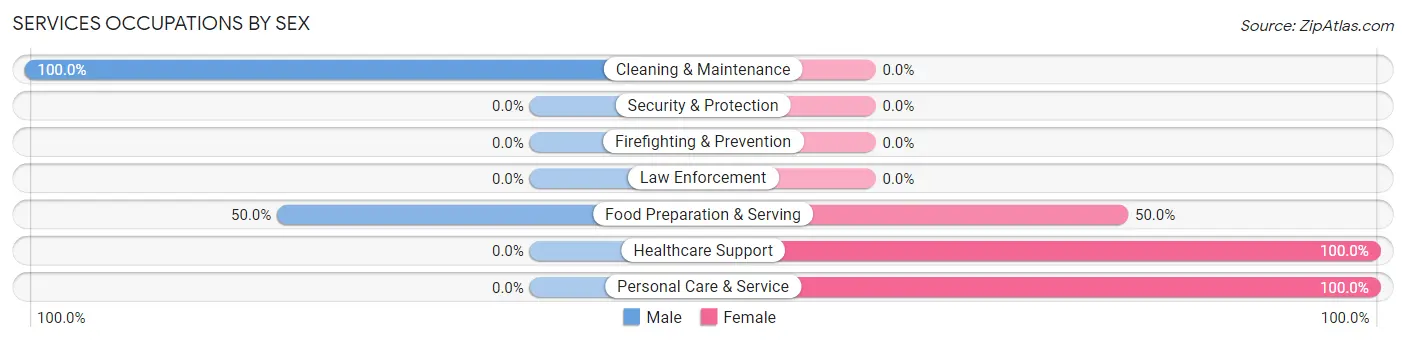
| Occupation | Male | Female |
| Healthcare Support | 0 (0.0%) | 12 (100.0%) |
| Security & Protection | 0 (0.0%) | 0 (0.0%) |
| Firefighting & Prevention | 0 (0.0%) | 0 (0.0%) |
| Law Enforcement | 0 (0.0%) | 0 (0.0%) |
| Food Preparation & Serving | 2 (50.0%) | 2 (50.0%) |
| Cleaning & Maintenance | 1 (100.0%) | 0 (0.0%) |
| Personal Care & Service | 0 (0.0%) | 2 (100.0%) |
| Total (Category) | 3 (15.8%) | 16 (84.2%) |
| Total (Overall) | 68 (37.6%) | 113 (62.4%) |
Sales and Office Occupations
The most common Sales and Office occupations in Washington Park are Sales & Related (52 | 28.7%), and Office & Administration (12 | 6.6%).
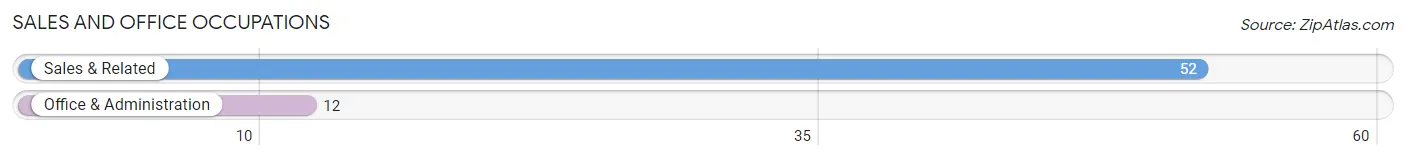
Sales and Office Occupations by Sex
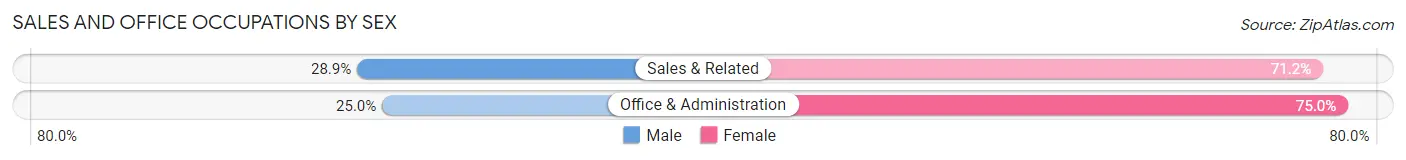
| Occupation | Male | Female |
| Sales & Related | 15 (28.8%) | 37 (71.2%) |
| Office & Administration | 3 (25.0%) | 9 (75.0%) |
| Total (Category) | 18 (28.1%) | 46 (71.9%) |
| Total (Overall) | 68 (37.6%) | 113 (62.4%) |
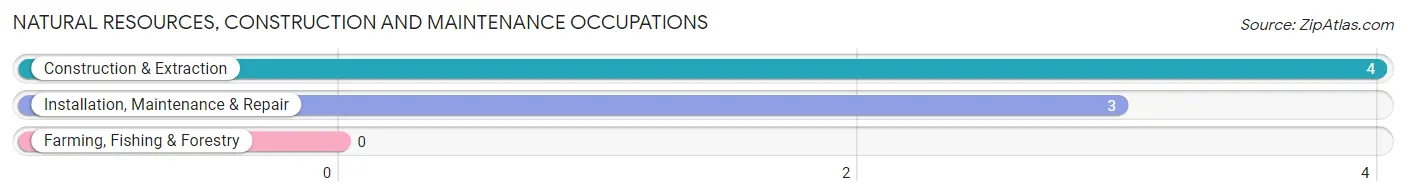
Natural Resources, Construction and Maintenance Occupations
The most common Natural Resources, Construction and Maintenance occupations in Washington Park are Construction & Extraction (4 | 2.2%), and Installation, Maintenance & Repair (3 | 1.7%).
Natural Resources, Construction and Maintenance Occupations by Sex
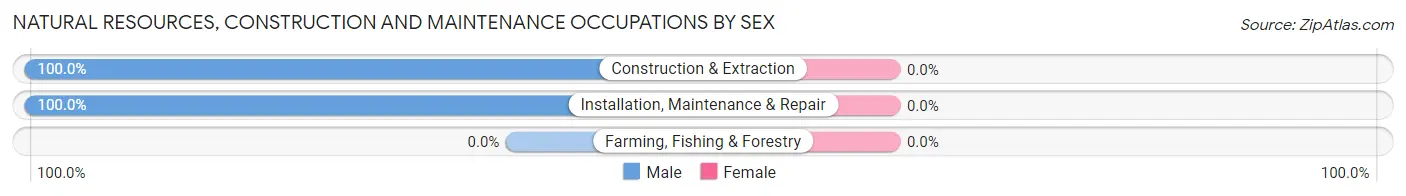
| Occupation | Male | Female |
| Farming, Fishing & Forestry | 0 (0.0%) | 0 (0.0%) |
| Construction & Extraction | 4 (100.0%) | 0 (0.0%) |
| Installation, Maintenance & Repair | 3 (100.0%) | 0 (0.0%) |
| Total (Category) | 7 (100.0%) | 0 (0.0%) |
| Total (Overall) | 68 (37.6%) | 113 (62.4%) |
Production, Transportation and Moving Occupations
The most common Production, Transportation and Moving occupations in Washington Park are Material Moving (4 | 2.2%), and Production (3 | 1.7%).
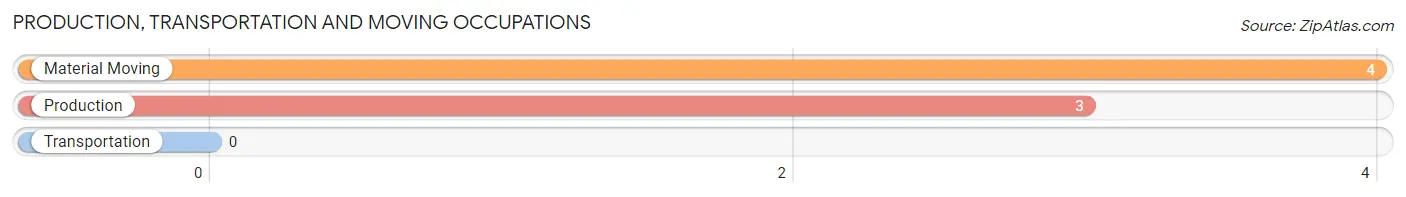
Production, Transportation and Moving Occupations by Sex
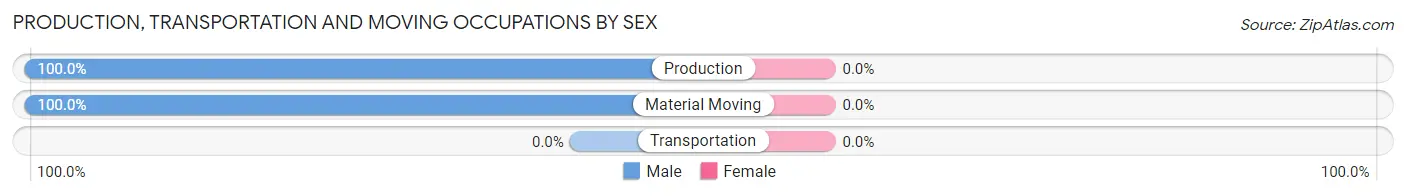
| Occupation | Male | Female |
| Production | 3 (100.0%) | 0 (0.0%) |
| Transportation | 0 (0.0%) | 0 (0.0%) |
| Material Moving | 4 (100.0%) | 0 (0.0%) |
| Total (Category) | 7 (100.0%) | 0 (0.0%) |
| Total (Overall) | 68 (37.6%) | 113 (62.4%) |
Employment Industries by Sex in Washington Park
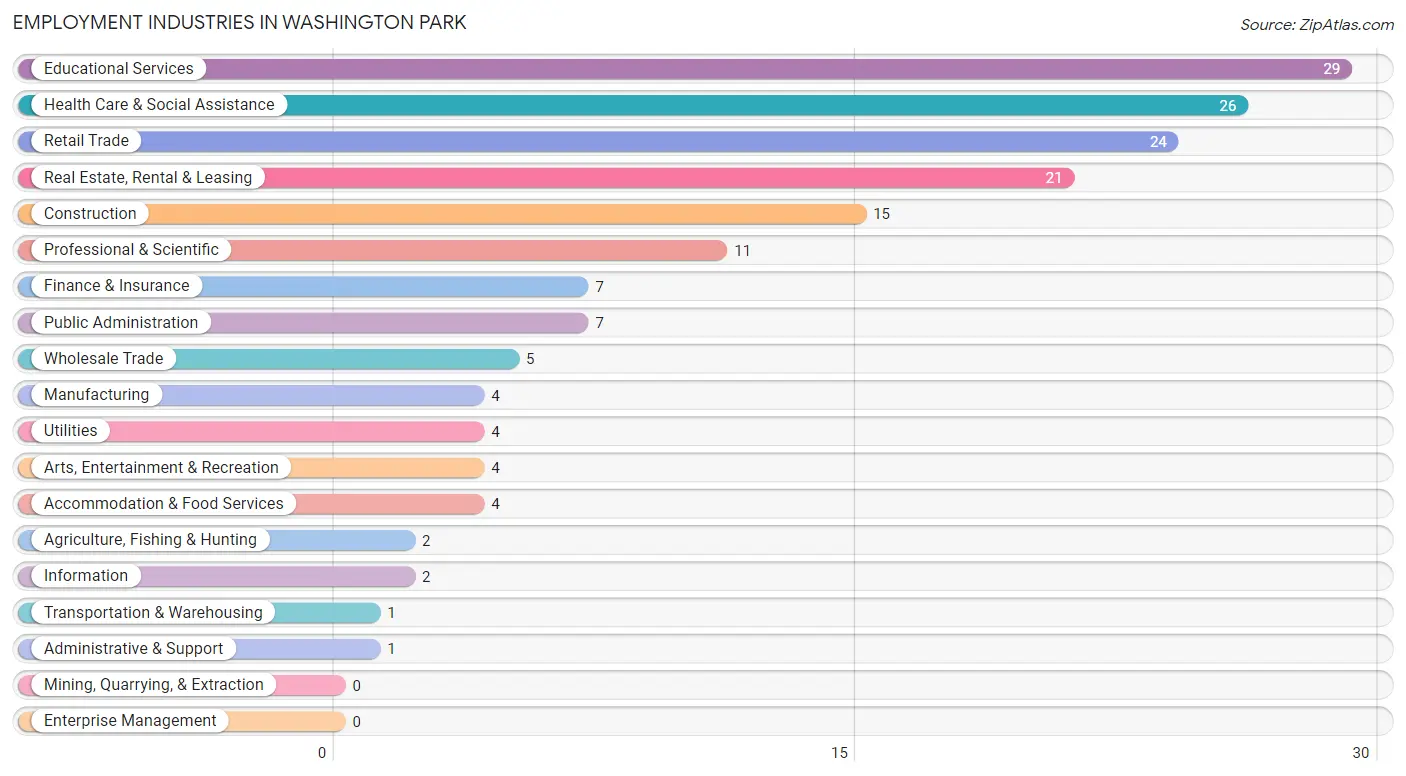
Employment Industries in Washington Park
The major employment industries in Washington Park include Educational Services (29 | 16.0%), Health Care & Social Assistance (26 | 14.4%), Retail Trade (24 | 13.3%), Real Estate, Rental & Leasing (21 | 11.6%), and Construction (15 | 8.3%).
Employment Industries by Sex in Washington Park
The Washington Park industries that see more men than women are Agriculture, Fishing & Hunting (100.0%), Manufacturing (100.0%), and Wholesale Trade (100.0%), whereas the industries that tend to have a higher number of women are Utilities (100.0%), Health Care & Social Assistance (92.3%), and Educational Services (89.7%).
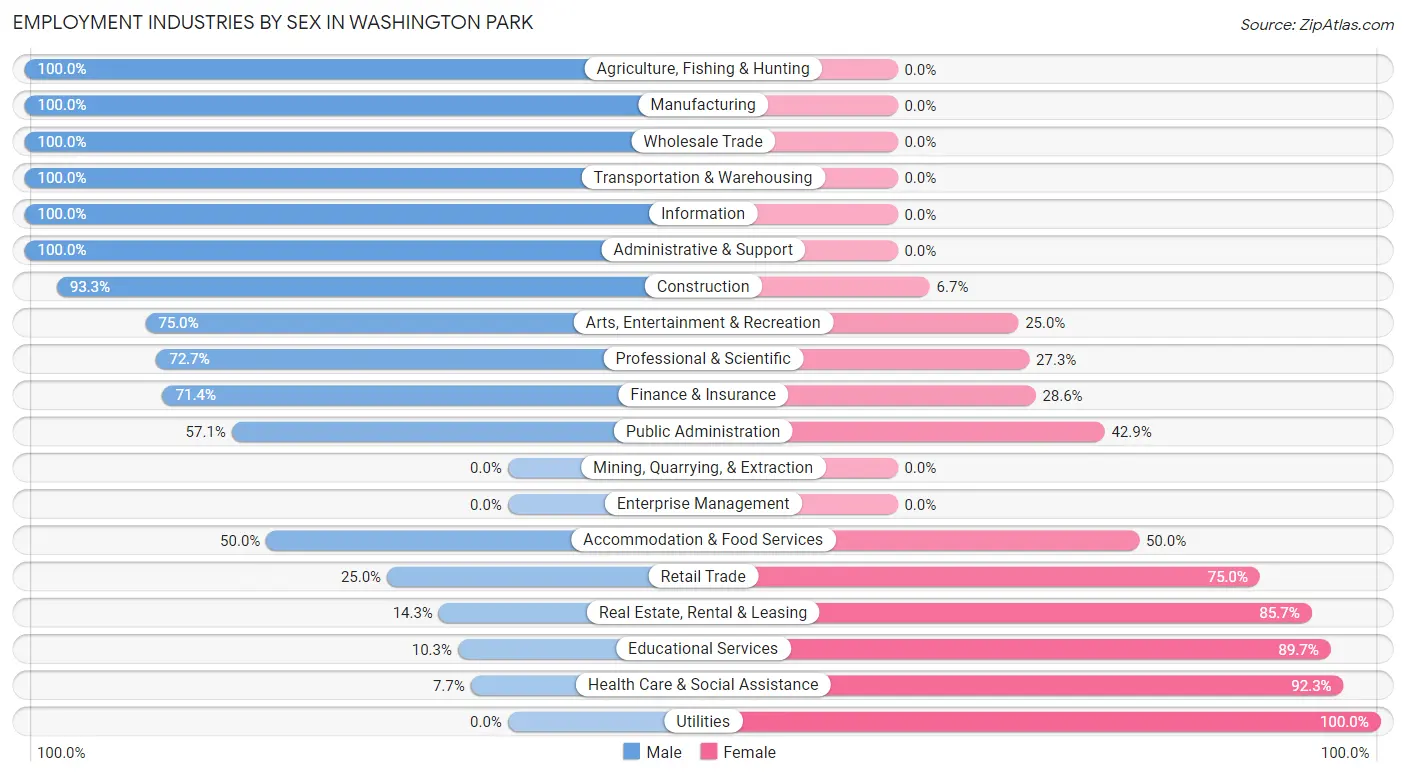
| Industry | Male | Female |
| Agriculture, Fishing & Hunting | 2 (100.0%) | 0 (0.0%) |
| Mining, Quarrying, & Extraction | 0 (0.0%) | 0 (0.0%) |
| Construction | 14 (93.3%) | 1 (6.7%) |
| Manufacturing | 4 (100.0%) | 0 (0.0%) |
| Wholesale Trade | 5 (100.0%) | 0 (0.0%) |
| Retail Trade | 6 (25.0%) | 18 (75.0%) |
| Transportation & Warehousing | 1 (100.0%) | 0 (0.0%) |
| Utilities | 0 (0.0%) | 4 (100.0%) |
| Information | 2 (100.0%) | 0 (0.0%) |
| Finance & Insurance | 5 (71.4%) | 2 (28.6%) |
| Real Estate, Rental & Leasing | 3 (14.3%) | 18 (85.7%) |
| Professional & Scientific | 8 (72.7%) | 3 (27.3%) |
| Enterprise Management | 0 (0.0%) | 0 (0.0%) |
| Administrative & Support | 1 (100.0%) | 0 (0.0%) |
| Educational Services | 3 (10.3%) | 26 (89.7%) |
| Health Care & Social Assistance | 2 (7.7%) | 24 (92.3%) |
| Arts, Entertainment & Recreation | 3 (75.0%) | 1 (25.0%) |
| Accommodation & Food Services | 2 (50.0%) | 2 (50.0%) |
| Public Administration | 4 (57.1%) | 3 (42.9%) |
| Total | 68 (37.6%) | 113 (62.4%) |
Education in Washington Park
School Enrollment in Washington Park
The most common levels of schooling among the 72 students in Washington Park are high school (36 | 50.0%), middle school (21 | 29.2%), and nursery / preschool (8 | 11.1%).
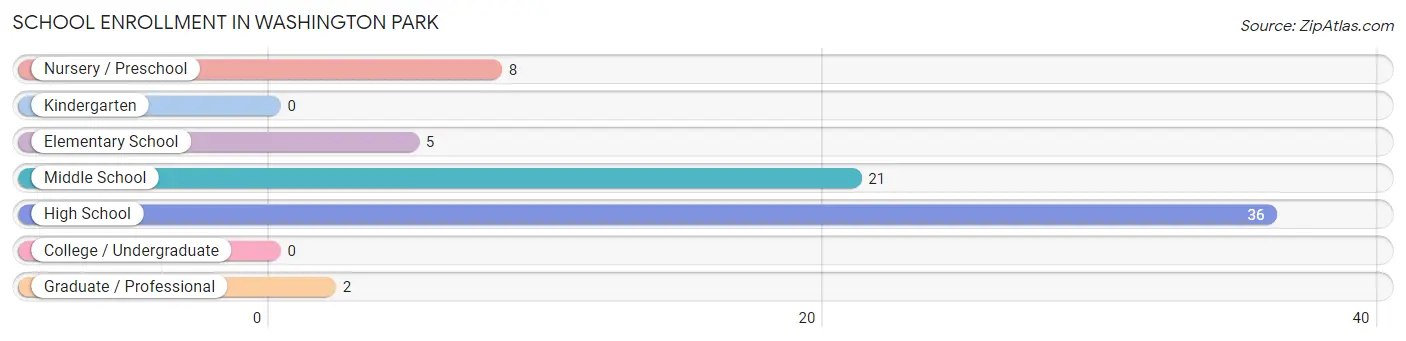
| School Level | # Students | % Students |
| Nursery / Preschool | 8 | 11.1% |
| Kindergarten | 0 | 0.0% |
| Elementary School | 5 | 6.9% |
| Middle School | 21 | 29.2% |
| High School | 36 | 50.0% |
| College / Undergraduate | 0 | 0.0% |
| Graduate / Professional | 2 | 2.8% |
| Total | 72 | 100.0% |
School Enrollment by Age by Funding Source in Washington Park
Out of a total of 72 students who are enrolled in schools in Washington Park, 24 (33.3%) attend a private institution, while the remaining 48 (66.7%) are enrolled in public schools. The age group of 25 to 34 year olds has the highest likelihood of being enrolled in private schools, with 2 (100.0% in the age bracket) enrolled. Conversely, the age group of 3 to 4 year olds has the lowest likelihood of being enrolled in a private school, with 2 (100.0% in the age bracket) attending a public institution.
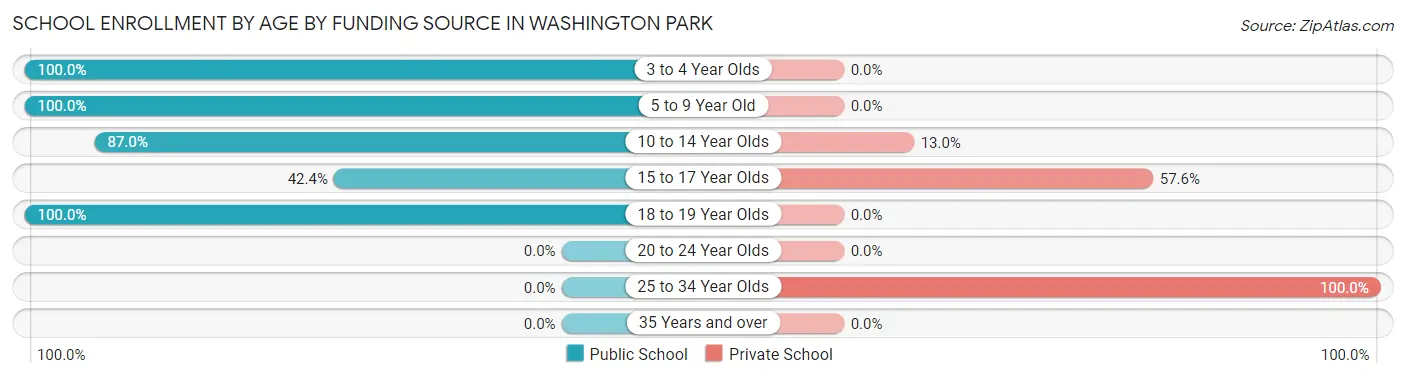
| Age Bracket | Public School | Private School |
| 3 to 4 Year Olds | 2 (100.0%) | 0 (0.0%) |
| 5 to 9 Year Old | 10 (100.0%) | 0 (0.0%) |
| 10 to 14 Year Olds | 20 (87.0%) | 3 (13.0%) |
| 15 to 17 Year Olds | 14 (42.4%) | 19 (57.6%) |
| 18 to 19 Year Olds | 2 (100.0%) | 0 (0.0%) |
| 20 to 24 Year Olds | 0 (0.0%) | 0 (0.0%) |
| 25 to 34 Year Olds | 0 (0.0%) | 2 (100.0%) |
| 35 Years and over | 0 (0.0%) | 0 (0.0%) |
| Total | 48 (66.7%) | 24 (33.3%) |
Educational Attainment by Field of Study in Washington Park
Liberal arts & history (56 | 23.5%), education (38 | 16.0%), business (25 | 10.5%), science & technology (21 | 8.8%), and bio, nature & agricultural (15 | 6.3%) are the most common fields of study among 238 individuals in Washington Park who have obtained a bachelor's degree or higher.
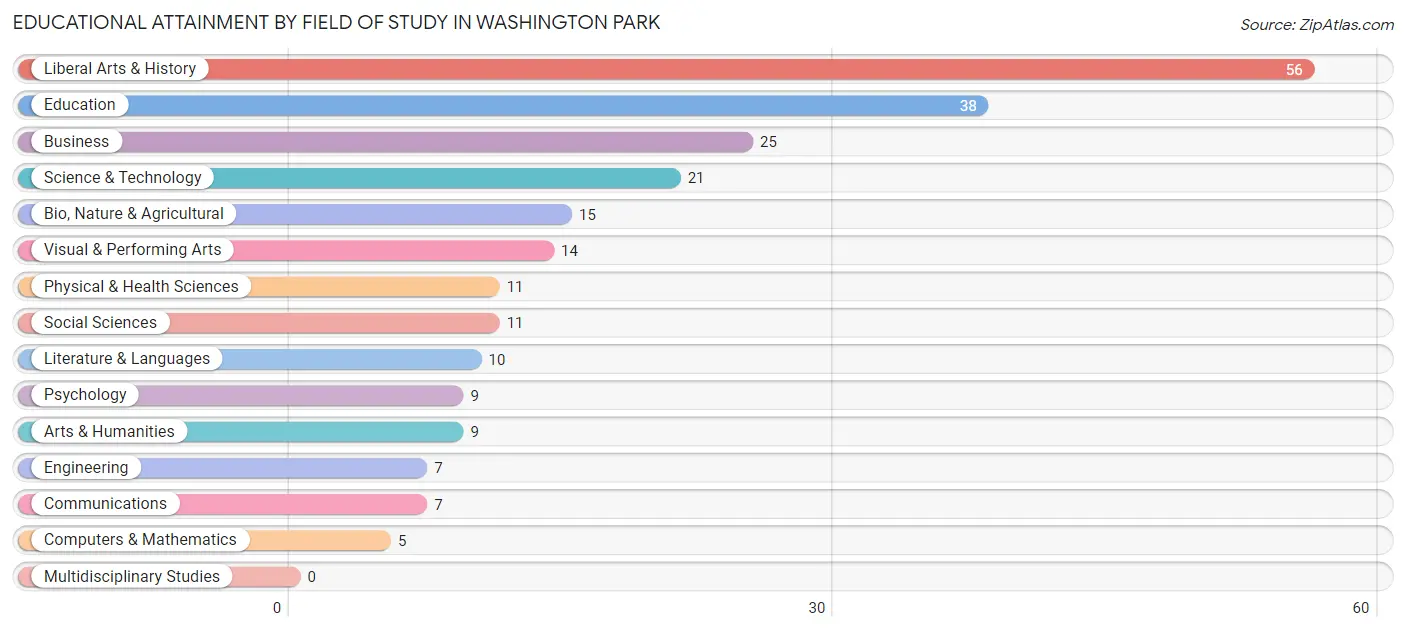
| Field of Study | # Graduates | % Graduates |
| Computers & Mathematics | 5 | 2.1% |
| Bio, Nature & Agricultural | 15 | 6.3% |
| Physical & Health Sciences | 11 | 4.6% |
| Psychology | 9 | 3.8% |
| Social Sciences | 11 | 4.6% |
| Engineering | 7 | 2.9% |
| Multidisciplinary Studies | 0 | 0.0% |
| Science & Technology | 21 | 8.8% |
| Business | 25 | 10.5% |
| Education | 38 | 16.0% |
| Literature & Languages | 10 | 4.2% |
| Liberal Arts & History | 56 | 23.5% |
| Visual & Performing Arts | 14 | 5.9% |
| Communications | 7 | 2.9% |
| Arts & Humanities | 9 | 3.8% |
| Total | 238 | 100.0% |
Transportation & Commute in Washington Park
Vehicle Availability by Sex in Washington Park
The most prevalent vehicle ownership categories in Washington Park are males with 2 vehicles (28, accounting for 41.2%) and females with 2 vehicles (42, making up 25.0%).
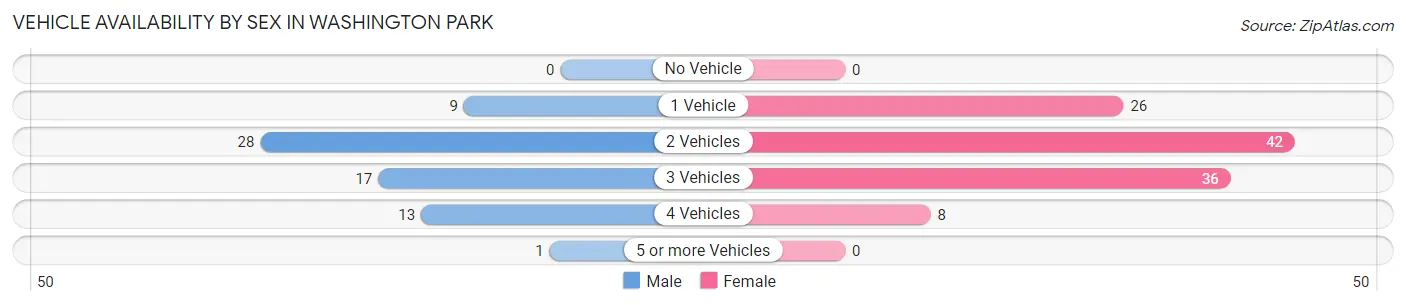
| Vehicles Available | Male | Female |
| No Vehicle | 0 (0.0%) | 0 (0.0%) |
| 1 Vehicle | 9 (13.2%) | 26 (23.2%) |
| 2 Vehicles | 28 (41.2%) | 42 (37.5%) |
| 3 Vehicles | 17 (25.0%) | 36 (32.1%) |
| 4 Vehicles | 13 (19.1%) | 8 (7.1%) |
| 5 or more Vehicles | 1 (1.5%) | 0 (0.0%) |
| Total | 68 (100.0%) | 112 (100.0%) |
Commute Time in Washington Park
The most frequently occuring commute durations in Washington Park are 10 to 14 minutes (44 commuters, 25.9%), 45 to 59 minutes (33 commuters, 19.4%), and 15 to 19 minutes (19 commuters, 11.2%).
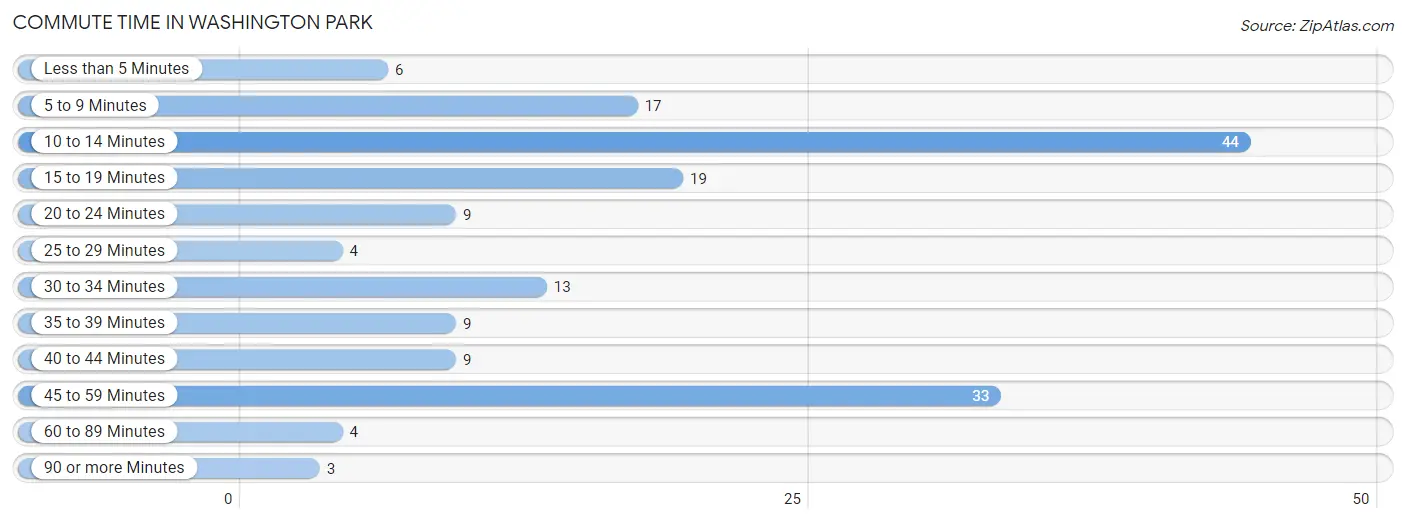
| Commute Time | # Commuters | % Commuters |
| Less than 5 Minutes | 6 | 3.5% |
| 5 to 9 Minutes | 17 | 10.0% |
| 10 to 14 Minutes | 44 | 25.9% |
| 15 to 19 Minutes | 19 | 11.2% |
| 20 to 24 Minutes | 9 | 5.3% |
| 25 to 29 Minutes | 4 | 2.4% |
| 30 to 34 Minutes | 13 | 7.6% |
| 35 to 39 Minutes | 9 | 5.3% |
| 40 to 44 Minutes | 9 | 5.3% |
| 45 to 59 Minutes | 33 | 19.4% |
| 60 to 89 Minutes | 4 | 2.4% |
| 90 or more Minutes | 3 | 1.8% |
Commute Time by Sex in Washington Park
The most common commute times in Washington Park are 10 to 14 minutes (20 commuters, 32.8%) for males and 45 to 59 minutes (29 commuters, 26.6%) for females.
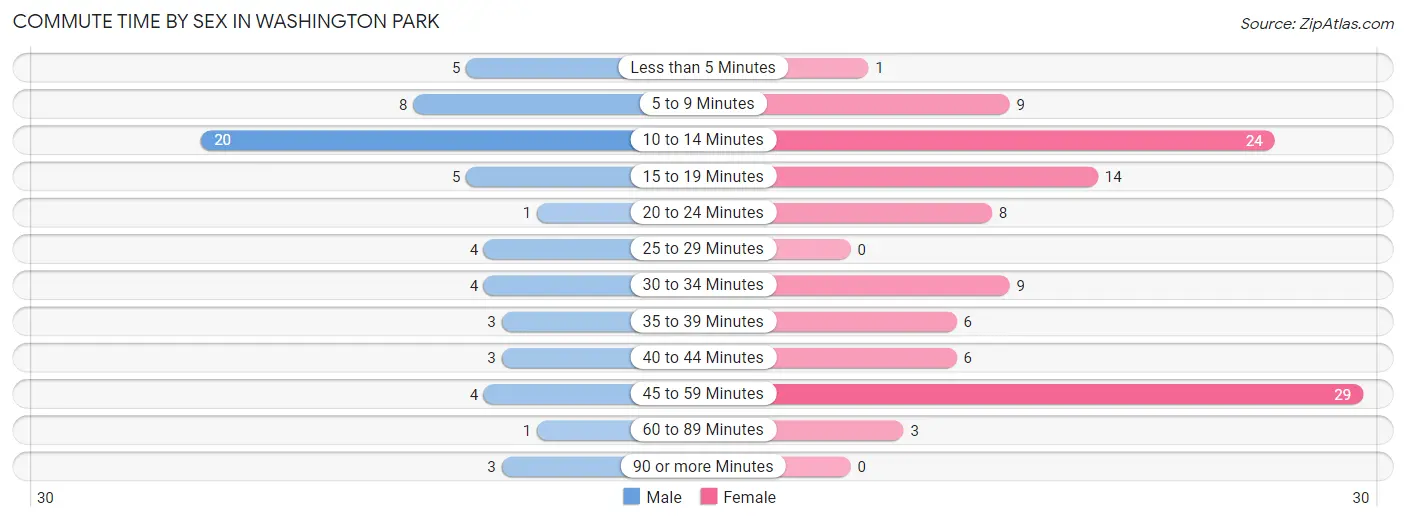
| Commute Time | Male | Female |
| Less than 5 Minutes | 5 (8.2%) | 1 (0.9%) |
| 5 to 9 Minutes | 8 (13.1%) | 9 (8.3%) |
| 10 to 14 Minutes | 20 (32.8%) | 24 (22.0%) |
| 15 to 19 Minutes | 5 (8.2%) | 14 (12.8%) |
| 20 to 24 Minutes | 1 (1.6%) | 8 (7.3%) |
| 25 to 29 Minutes | 4 (6.6%) | 0 (0.0%) |
| 30 to 34 Minutes | 4 (6.6%) | 9 (8.3%) |
| 35 to 39 Minutes | 3 (4.9%) | 6 (5.5%) |
| 40 to 44 Minutes | 3 (4.9%) | 6 (5.5%) |
| 45 to 59 Minutes | 4 (6.6%) | 29 (26.6%) |
| 60 to 89 Minutes | 1 (1.6%) | 3 (2.8%) |
| 90 or more Minutes | 3 (4.9%) | 0 (0.0%) |
Time of Departure to Work by Sex in Washington Park
The most frequent times of departure to work in Washington Park are 7:30 AM to 7:59 AM (16, 26.2%) for males and 7:00 AM to 7:29 AM (34, 31.2%) for females.
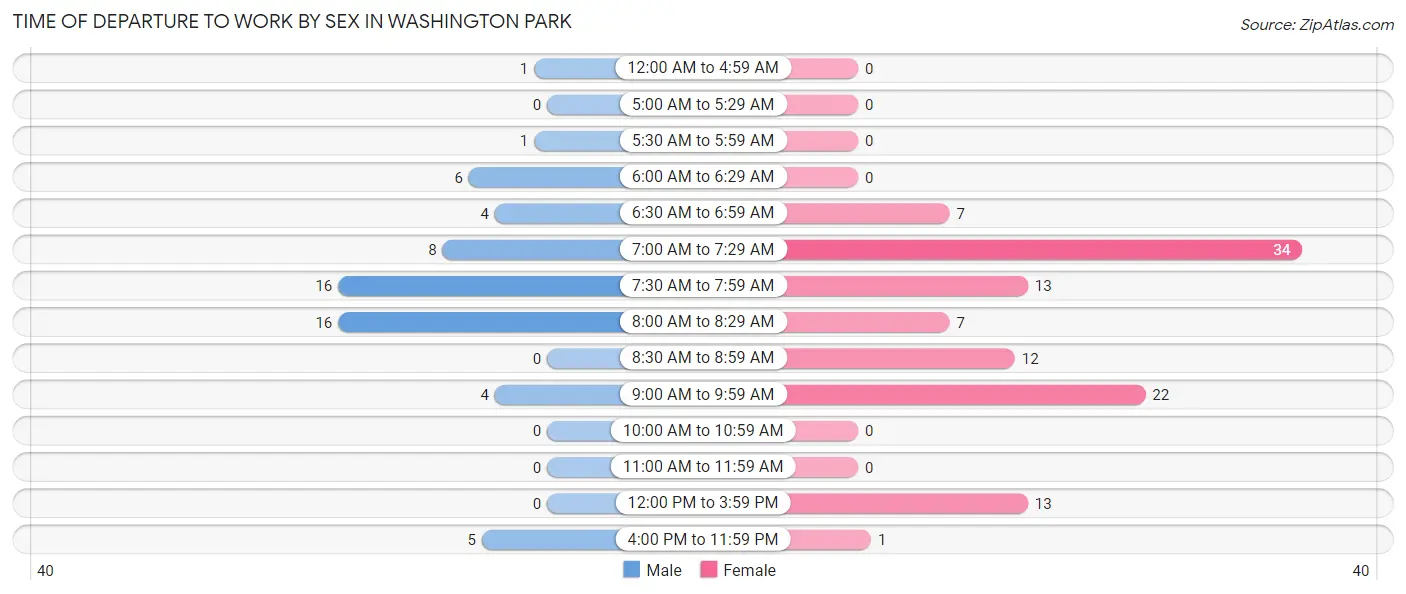
| Time of Departure | Male | Female |
| 12:00 AM to 4:59 AM | 1 (1.6%) | 0 (0.0%) |
| 5:00 AM to 5:29 AM | 0 (0.0%) | 0 (0.0%) |
| 5:30 AM to 5:59 AM | 1 (1.6%) | 0 (0.0%) |
| 6:00 AM to 6:29 AM | 6 (9.8%) | 0 (0.0%) |
| 6:30 AM to 6:59 AM | 4 (6.6%) | 7 (6.4%) |
| 7:00 AM to 7:29 AM | 8 (13.1%) | 34 (31.2%) |
| 7:30 AM to 7:59 AM | 16 (26.2%) | 13 (11.9%) |
| 8:00 AM to 8:29 AM | 16 (26.2%) | 7 (6.4%) |
| 8:30 AM to 8:59 AM | 0 (0.0%) | 12 (11.0%) |
| 9:00 AM to 9:59 AM | 4 (6.6%) | 22 (20.2%) |
| 10:00 AM to 10:59 AM | 0 (0.0%) | 0 (0.0%) |
| 11:00 AM to 11:59 AM | 0 (0.0%) | 0 (0.0%) |
| 12:00 PM to 3:59 PM | 0 (0.0%) | 13 (11.9%) |
| 4:00 PM to 11:59 PM | 5 (8.2%) | 1 (0.9%) |
| Total | 61 (100.0%) | 109 (100.0%) |
Housing Occupancy in Washington Park
Occupancy by Ownership in Washington Park
Of the total 235 dwellings in Washington Park, owner-occupied units account for 214 (91.1%), while renter-occupied units make up 21 (8.9%).
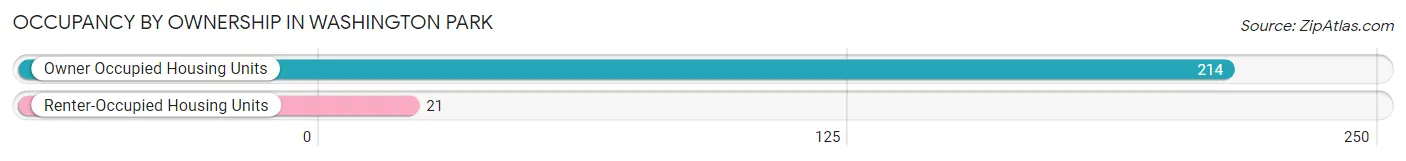
| Occupancy | # Housing Units | % Housing Units |
| Owner Occupied Housing Units | 214 | 91.1% |
| Renter-Occupied Housing Units | 21 | 8.9% |
| Total Occupied Housing Units | 235 | 100.0% |
Occupancy by Household Size in Washington Park
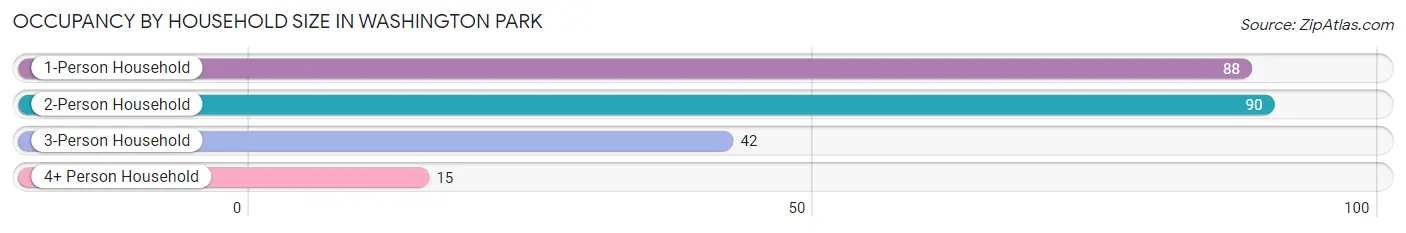
| Household Size | # Housing Units | % Housing Units |
| 1-Person Household | 88 | 37.4% |
| 2-Person Household | 90 | 38.3% |
| 3-Person Household | 42 | 17.9% |
| 4+ Person Household | 15 | 6.4% |
| Total Housing Units | 235 | 100.0% |
Occupancy by Ownership by Household Size in Washington Park
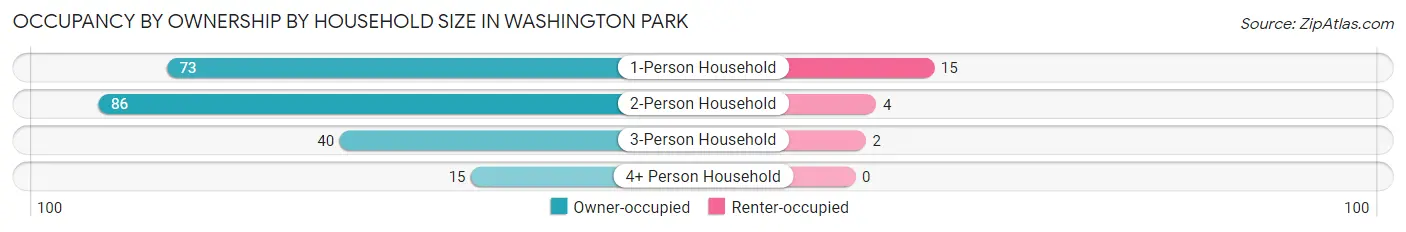
| Household Size | Owner-occupied | Renter-occupied |
| 1-Person Household | 73 (83.0%) | 15 (17.1%) |
| 2-Person Household | 86 (95.6%) | 4 (4.4%) |
| 3-Person Household | 40 (95.2%) | 2 (4.8%) |
| 4+ Person Household | 15 (100.0%) | 0 (0.0%) |
| Total Housing Units | 214 (91.1%) | 21 (8.9%) |
Occupancy by Educational Attainment in Washington Park
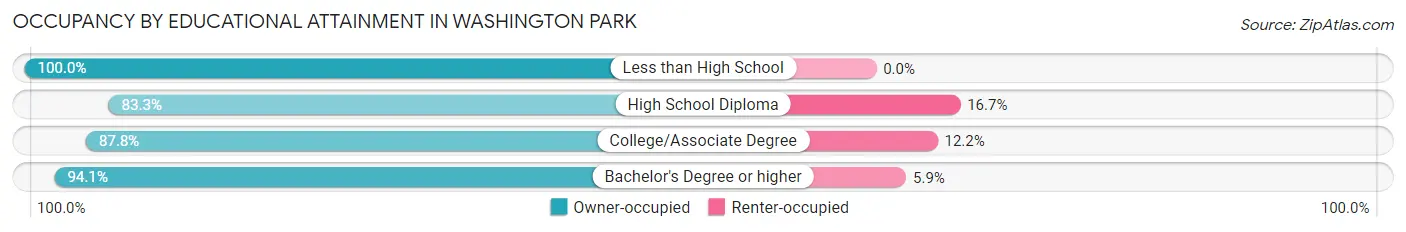
| Household Size | Owner-occupied | Renter-occupied |
| Less than High School | 2 (100.0%) | 0 (0.0%) |
| High School Diploma | 20 (83.3%) | 4 (16.7%) |
| College/Associate Degree | 65 (87.8%) | 9 (12.2%) |
| Bachelor's Degree or higher | 127 (94.1%) | 8 (5.9%) |
Occupancy by Age of Householder in Washington Park
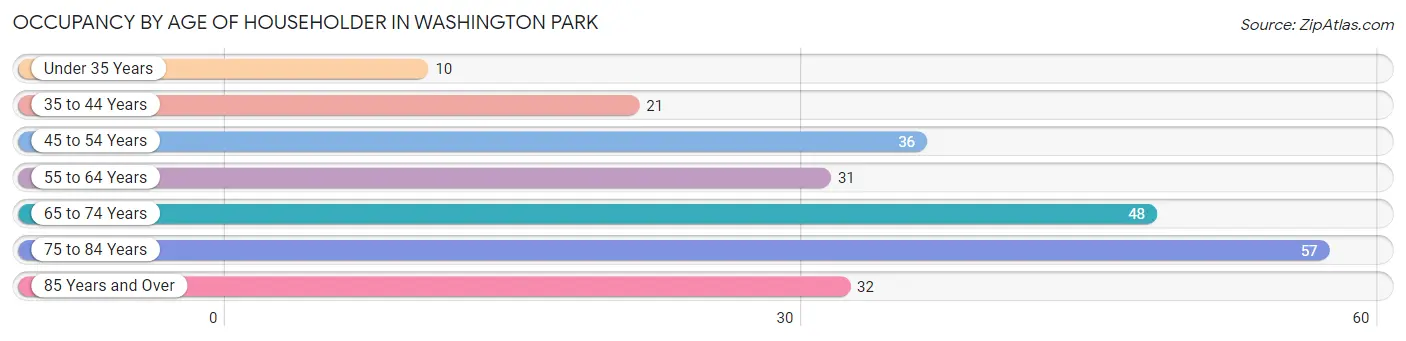
| Age Bracket | # Households | % Households |
| Under 35 Years | 10 | 4.3% |
| 35 to 44 Years | 21 | 8.9% |
| 45 to 54 Years | 36 | 15.3% |
| 55 to 64 Years | 31 | 13.2% |
| 65 to 74 Years | 48 | 20.4% |
| 75 to 84 Years | 57 | 24.3% |
| 85 Years and Over | 32 | 13.6% |
| Total | 235 | 100.0% |
Housing Finances in Washington Park
Median Income by Occupancy in Washington Park
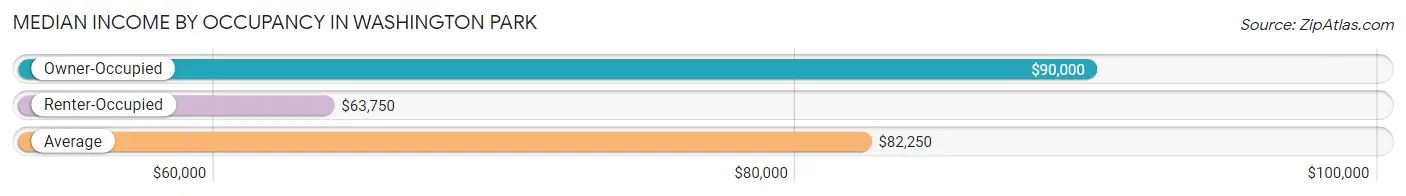
| Occupancy Type | # Households | Median Income |
| Owner-Occupied | 214 (91.1%) | $90,000 |
| Renter-Occupied | 21 (8.9%) | $63,750 |
| Average | 235 (100.0%) | $82,250 |
Occupancy by Householder Income Bracket in Washington Park
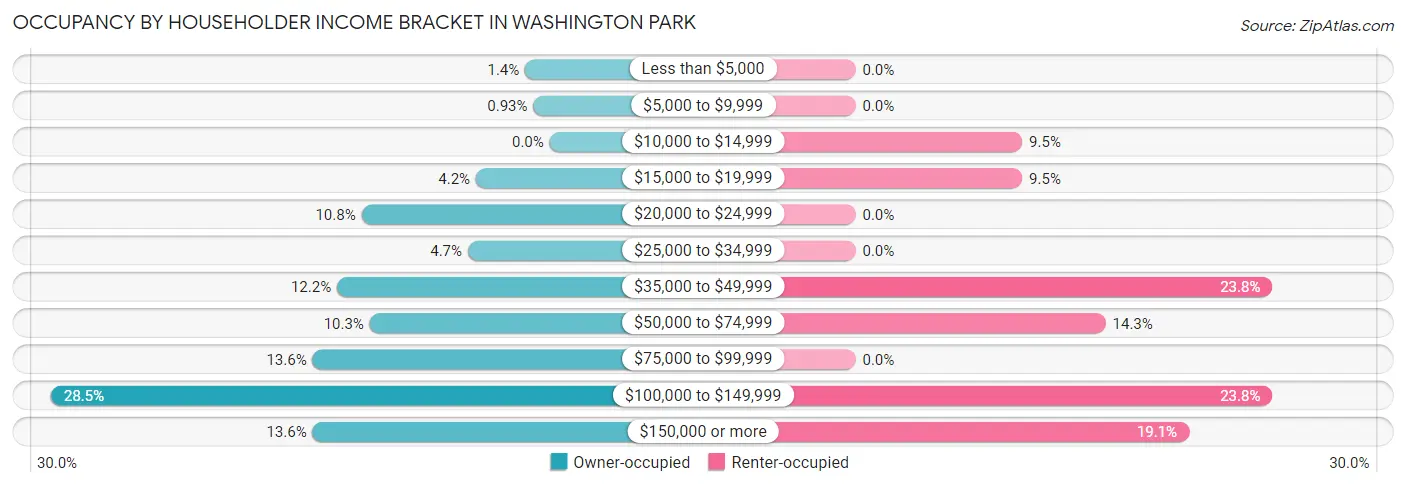
| Income Bracket | Owner-occupied | Renter-occupied |
| Less than $5,000 | 3 (1.4%) | 0 (0.0%) |
| $5,000 to $9,999 | 2 (0.9%) | 0 (0.0%) |
| $10,000 to $14,999 | 0 (0.0%) | 2 (9.5%) |
| $15,000 to $19,999 | 9 (4.2%) | 2 (9.5%) |
| $20,000 to $24,999 | 23 (10.7%) | 0 (0.0%) |
| $25,000 to $34,999 | 10 (4.7%) | 0 (0.0%) |
| $35,000 to $49,999 | 26 (12.1%) | 5 (23.8%) |
| $50,000 to $74,999 | 22 (10.3%) | 3 (14.3%) |
| $75,000 to $99,999 | 29 (13.6%) | 0 (0.0%) |
| $100,000 to $149,999 | 61 (28.5%) | 5 (23.8%) |
| $150,000 or more | 29 (13.6%) | 4 (19.1%) |
| Total | 214 (100.0%) | 21 (100.0%) |
Monthly Housing Cost Tiers in Washington Park
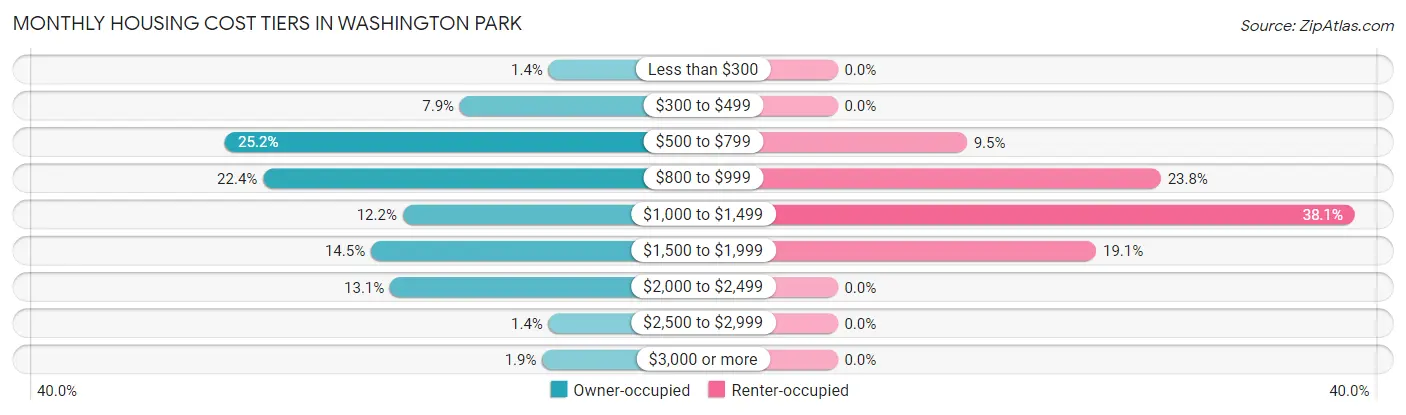
| Monthly Cost | Owner-occupied | Renter-occupied |
| Less than $300 | 3 (1.4%) | 0 (0.0%) |
| $300 to $499 | 17 (7.9%) | 0 (0.0%) |
| $500 to $799 | 54 (25.2%) | 2 (9.5%) |
| $800 to $999 | 48 (22.4%) | 5 (23.8%) |
| $1,000 to $1,499 | 26 (12.1%) | 8 (38.1%) |
| $1,500 to $1,999 | 31 (14.5%) | 4 (19.1%) |
| $2,000 to $2,499 | 28 (13.1%) | 0 (0.0%) |
| $2,500 to $2,999 | 3 (1.4%) | 0 (0.0%) |
| $3,000 or more | 4 (1.9%) | 0 (0.0%) |
| Total | 214 (100.0%) | 21 (100.0%) |
Physical Housing Characteristics in Washington Park
Housing Structures in Washington Park
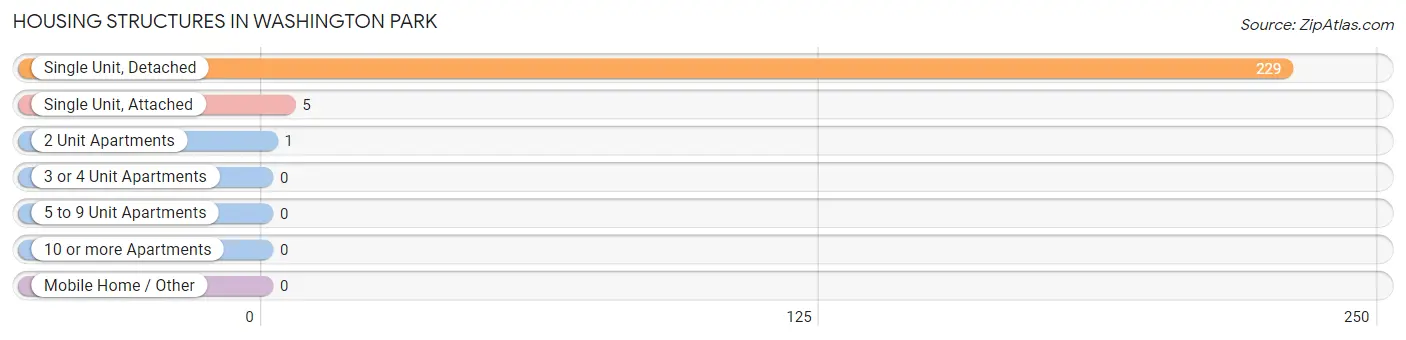
| Structure Type | # Housing Units | % Housing Units |
| Single Unit, Detached | 229 | 97.5% |
| Single Unit, Attached | 5 | 2.1% |
| 2 Unit Apartments | 1 | 0.4% |
| 3 or 4 Unit Apartments | 0 | 0.0% |
| 5 to 9 Unit Apartments | 0 | 0.0% |
| 10 or more Apartments | 0 | 0.0% |
| Mobile Home / Other | 0 | 0.0% |
| Total | 235 | 100.0% |
Housing Structures by Occupancy in Washington Park
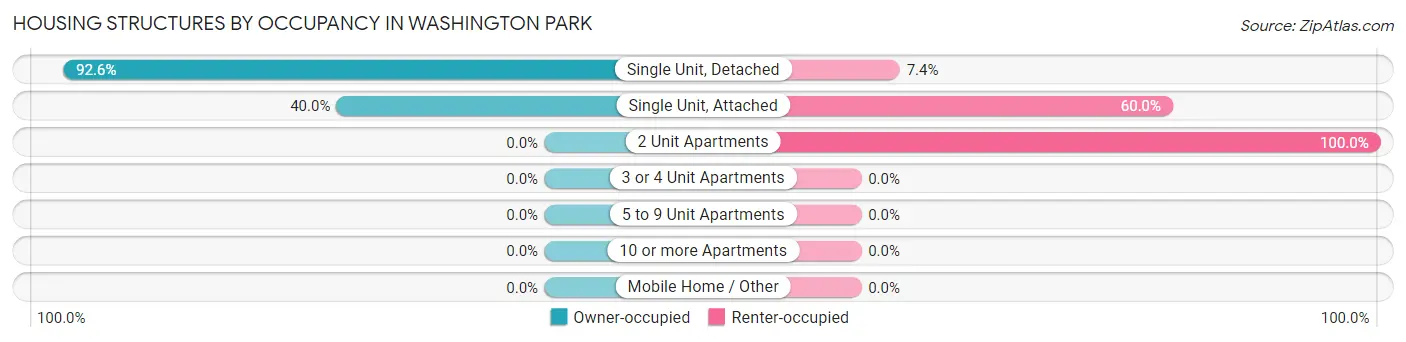
| Structure Type | Owner-occupied | Renter-occupied |
| Single Unit, Detached | 212 (92.6%) | 17 (7.4%) |
| Single Unit, Attached | 2 (40.0%) | 3 (60.0%) |
| 2 Unit Apartments | 0 (0.0%) | 1 (100.0%) |
| 3 or 4 Unit Apartments | 0 (0.0%) | 0 (0.0%) |
| 5 to 9 Unit Apartments | 0 (0.0%) | 0 (0.0%) |
| 10 or more Apartments | 0 (0.0%) | 0 (0.0%) |
| Mobile Home / Other | 0 (0.0%) | 0 (0.0%) |
| Total | 214 (91.1%) | 21 (8.9%) |
Housing Structures by Number of Rooms in Washington Park
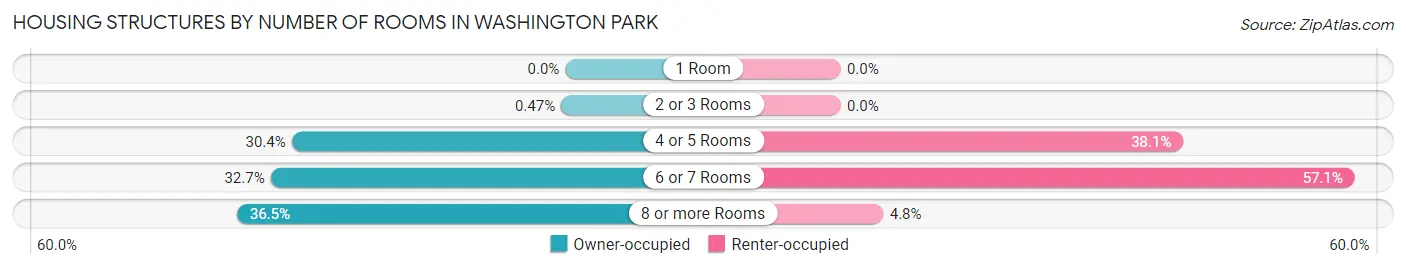
| Number of Rooms | Owner-occupied | Renter-occupied |
| 1 Room | 0 (0.0%) | 0 (0.0%) |
| 2 or 3 Rooms | 1 (0.5%) | 0 (0.0%) |
| 4 or 5 Rooms | 65 (30.4%) | 8 (38.1%) |
| 6 or 7 Rooms | 70 (32.7%) | 12 (57.1%) |
| 8 or more Rooms | 78 (36.4%) | 1 (4.8%) |
| Total | 214 (100.0%) | 21 (100.0%) |
Housing Structure by Heating Type in Washington Park
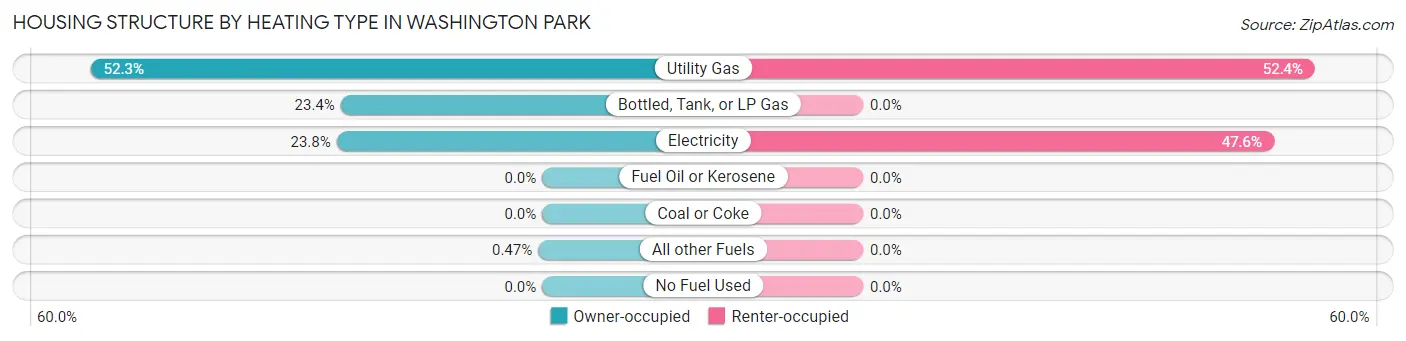
| Heating Type | Owner-occupied | Renter-occupied |
| Utility Gas | 112 (52.3%) | 11 (52.4%) |
| Bottled, Tank, or LP Gas | 50 (23.4%) | 0 (0.0%) |
| Electricity | 51 (23.8%) | 10 (47.6%) |
| Fuel Oil or Kerosene | 0 (0.0%) | 0 (0.0%) |
| Coal or Coke | 0 (0.0%) | 0 (0.0%) |
| All other Fuels | 1 (0.5%) | 0 (0.0%) |
| No Fuel Used | 0 (0.0%) | 0 (0.0%) |
| Total | 214 (100.0%) | 21 (100.0%) |
Household Vehicle Usage in Washington Park
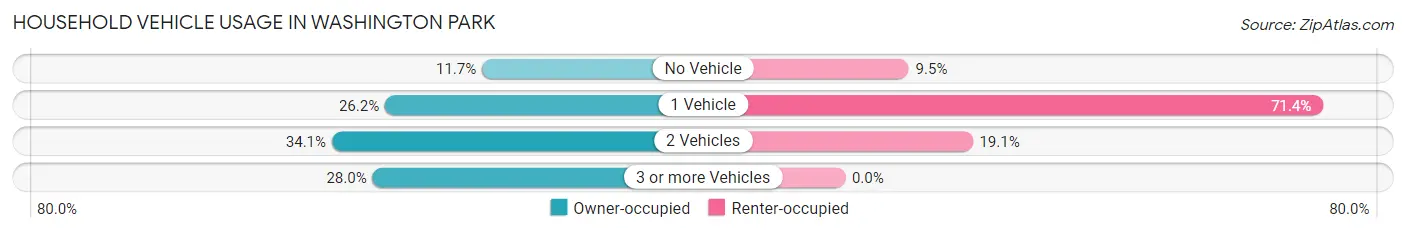
| Vehicles per Household | Owner-occupied | Renter-occupied |
| No Vehicle | 25 (11.7%) | 2 (9.5%) |
| 1 Vehicle | 56 (26.2%) | 15 (71.4%) |
| 2 Vehicles | 73 (34.1%) | 4 (19.1%) |
| 3 or more Vehicles | 60 (28.0%) | 0 (0.0%) |
| Total | 214 (100.0%) | 21 (100.0%) |
Real Estate & Mortgages in Washington Park
Real Estate and Mortgage Overview in Washington Park
| Characteristic | Without Mortgage | With Mortgage |
| Housing Units | 122 | 92 |
| Median Property Value | $314,700 | $265,800 |
| Median Household Income | $44,750 | $16 |
| Monthly Housing Costs | $790 | $4 |
| Real Estate Taxes | $2,462 | $1 |
Property Value by Mortgage Status in Washington Park
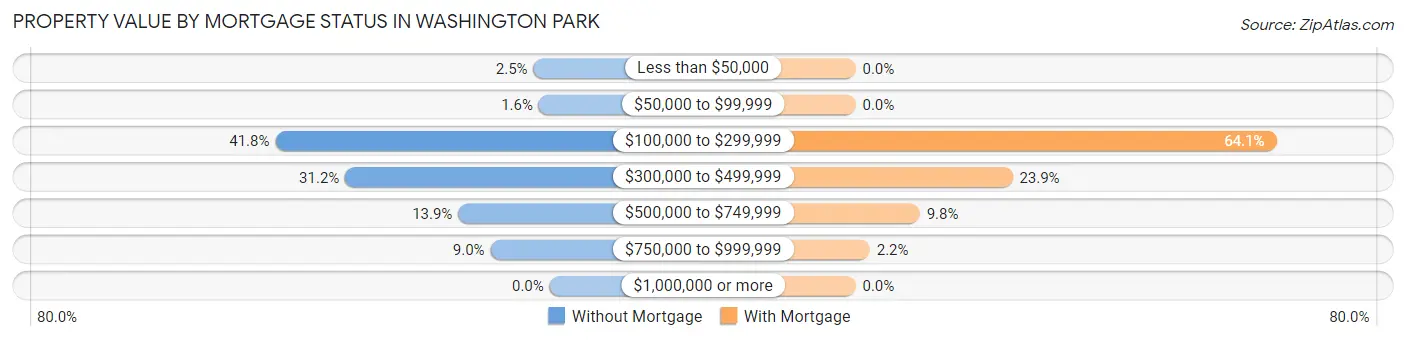
| Property Value | Without Mortgage | With Mortgage |
| Less than $50,000 | 3 (2.5%) | 0 (0.0%) |
| $50,000 to $99,999 | 2 (1.6%) | 0 (0.0%) |
| $100,000 to $299,999 | 51 (41.8%) | 59 (64.1%) |
| $300,000 to $499,999 | 38 (31.1%) | 22 (23.9%) |
| $500,000 to $749,999 | 17 (13.9%) | 9 (9.8%) |
| $750,000 to $999,999 | 11 (9.0%) | 2 (2.2%) |
| $1,000,000 or more | 0 (0.0%) | 0 (0.0%) |
| Total | 122 (100.0%) | 92 (100.0%) |
Household Income by Mortgage Status in Washington Park
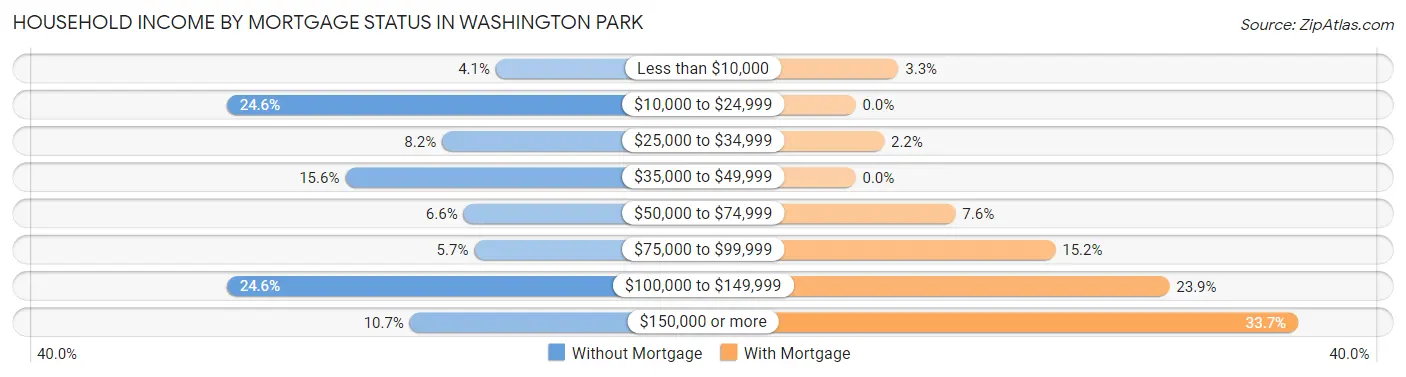
| Household Income | Without Mortgage | With Mortgage |
| Less than $10,000 | 5 (4.1%) | 3 (3.3%) |
| $10,000 to $24,999 | 30 (24.6%) | 0 (0.0%) |
| $25,000 to $34,999 | 10 (8.2%) | 2 (2.2%) |
| $35,000 to $49,999 | 19 (15.6%) | 0 (0.0%) |
| $50,000 to $74,999 | 8 (6.6%) | 7 (7.6%) |
| $75,000 to $99,999 | 7 (5.7%) | 14 (15.2%) |
| $100,000 to $149,999 | 30 (24.6%) | 22 (23.9%) |
| $150,000 or more | 13 (10.7%) | 31 (33.7%) |
| Total | 122 (100.0%) | 92 (100.0%) |
Property Value to Household Income Ratio in Washington Park
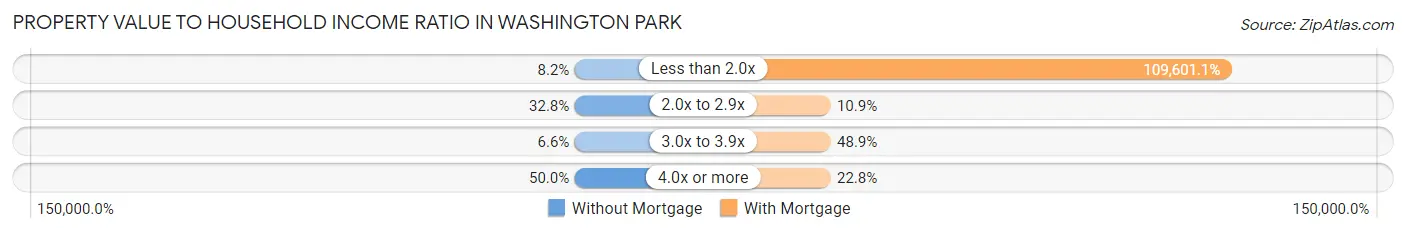
| Value-to-Income Ratio | Without Mortgage | With Mortgage |
| Less than 2.0x | 10 (8.2%) | 100,833 (109,601.1%) |
| 2.0x to 2.9x | 40 (32.8%) | 10 (10.9%) |
| 3.0x to 3.9x | 8 (6.6%) | 45 (48.9%) |
| 4.0x or more | 61 (50.0%) | 21 (22.8%) |
| Total | 122 (100.0%) | 92 (100.0%) |
Real Estate Taxes by Mortgage Status in Washington Park
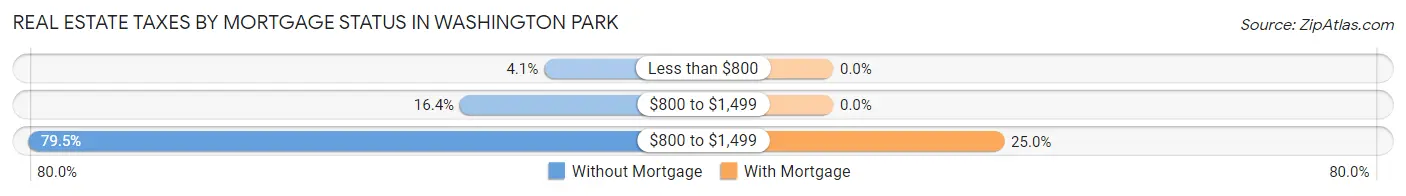
| Property Taxes | Without Mortgage | With Mortgage |
| Less than $800 | 5 (4.1%) | 0 (0.0%) |
| $800 to $1,499 | 20 (16.4%) | 0 (0.0%) |
| $800 to $1,499 | 97 (79.5%) | 23 (25.0%) |
| Total | 122 (100.0%) | 92 (100.0%) |
Health & Disability in Washington Park
Health Insurance Coverage by Age in Washington Park
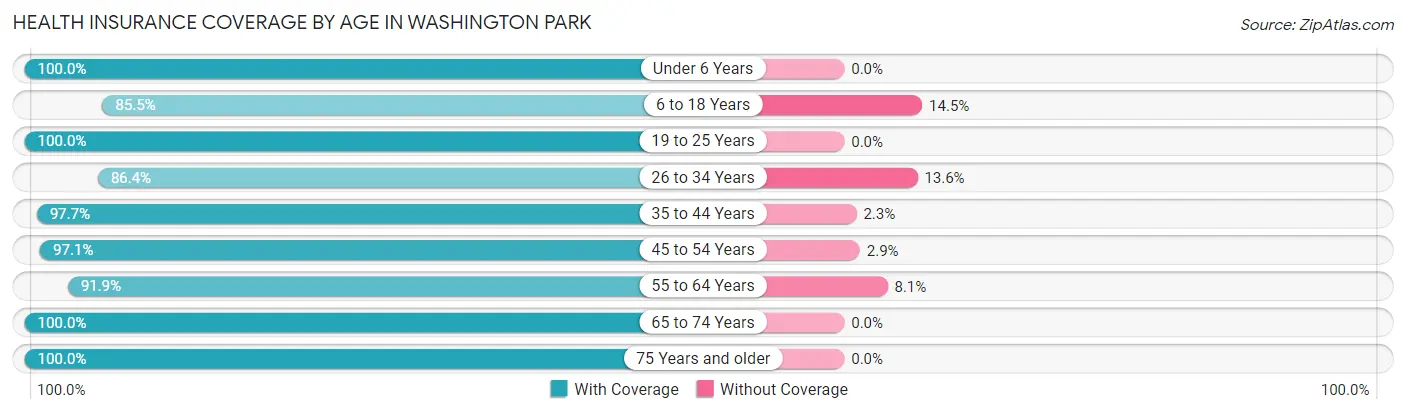
| Age Bracket | With Coverage | Without Coverage |
| Under 6 Years | 35 (100.0%) | 0 (0.0%) |
| 6 to 18 Years | 53 (85.5%) | 9 (14.5%) |
| 19 to 25 Years | 4 (100.0%) | 0 (0.0%) |
| 26 to 34 Years | 19 (86.4%) | 3 (13.6%) |
| 35 to 44 Years | 43 (97.7%) | 1 (2.3%) |
| 45 to 54 Years | 67 (97.1%) | 2 (2.9%) |
| 55 to 64 Years | 57 (91.9%) | 5 (8.1%) |
| 65 to 74 Years | 60 (100.0%) | 0 (0.0%) |
| 75 Years and older | 117 (100.0%) | 0 (0.0%) |
| Total | 455 (95.8%) | 20 (4.2%) |
Health Insurance Coverage by Citizenship Status in Washington Park
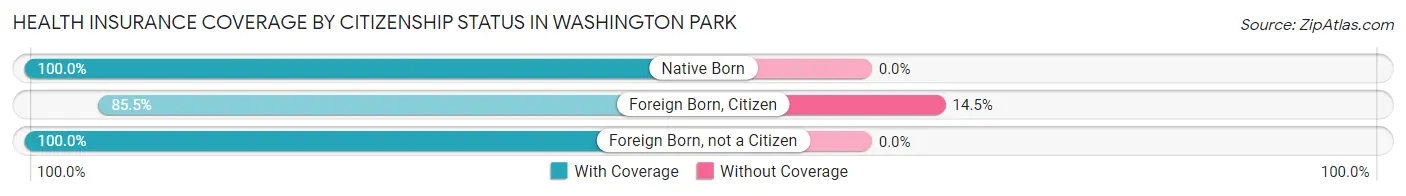
| Citizenship Status | With Coverage | Without Coverage |
| Native Born | 35 (100.0%) | 0 (0.0%) |
| Foreign Born, Citizen | 53 (85.5%) | 9 (14.5%) |
| Foreign Born, not a Citizen | 4 (100.0%) | 0 (0.0%) |
Health Insurance Coverage by Household Income in Washington Park
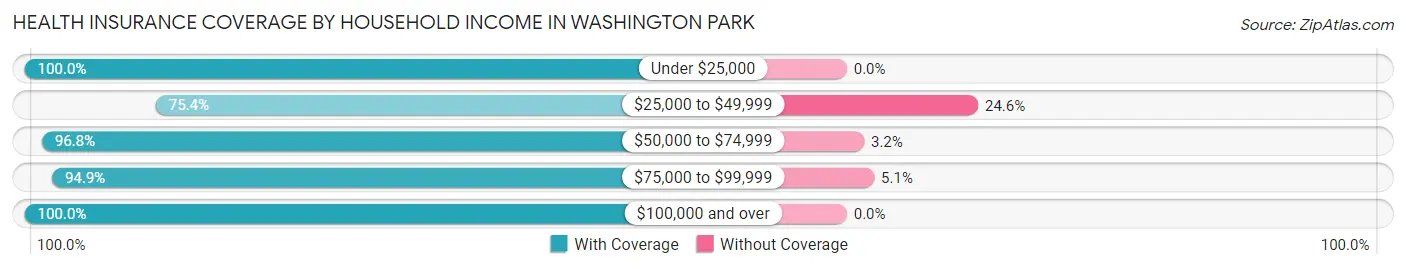
| Household Income | With Coverage | Without Coverage |
| Under $25,000 | 56 (100.0%) | 0 (0.0%) |
| $25,000 to $49,999 | 46 (75.4%) | 15 (24.6%) |
| $50,000 to $74,999 | 30 (96.8%) | 1 (3.2%) |
| $75,000 to $99,999 | 74 (94.9%) | 4 (5.1%) |
| $100,000 and over | 249 (100.0%) | 0 (0.0%) |
Public vs Private Health Insurance Coverage by Age in Washington Park
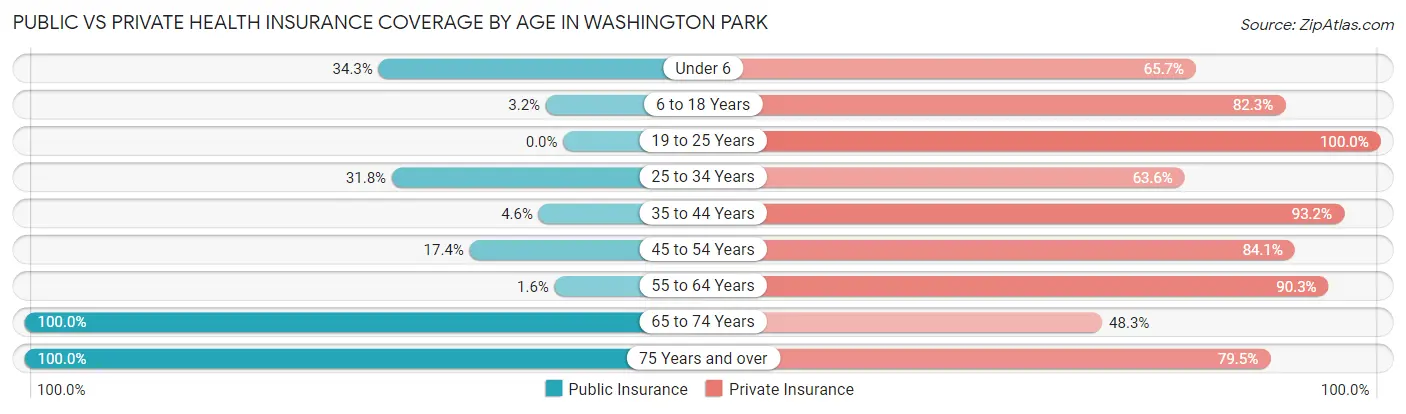
| Age Bracket | Public Insurance | Private Insurance |
| Under 6 | 12 (34.3%) | 23 (65.7%) |
| 6 to 18 Years | 2 (3.2%) | 51 (82.3%) |
| 19 to 25 Years | 0 (0.0%) | 4 (100.0%) |
| 25 to 34 Years | 7 (31.8%) | 14 (63.6%) |
| 35 to 44 Years | 2 (4.5%) | 41 (93.2%) |
| 45 to 54 Years | 12 (17.4%) | 58 (84.1%) |
| 55 to 64 Years | 1 (1.6%) | 56 (90.3%) |
| 65 to 74 Years | 60 (100.0%) | 29 (48.3%) |
| 75 Years and over | 117 (100.0%) | 93 (79.5%) |
| Total | 213 (44.8%) | 369 (77.7%) |
Disability Status by Sex by Age in Washington Park
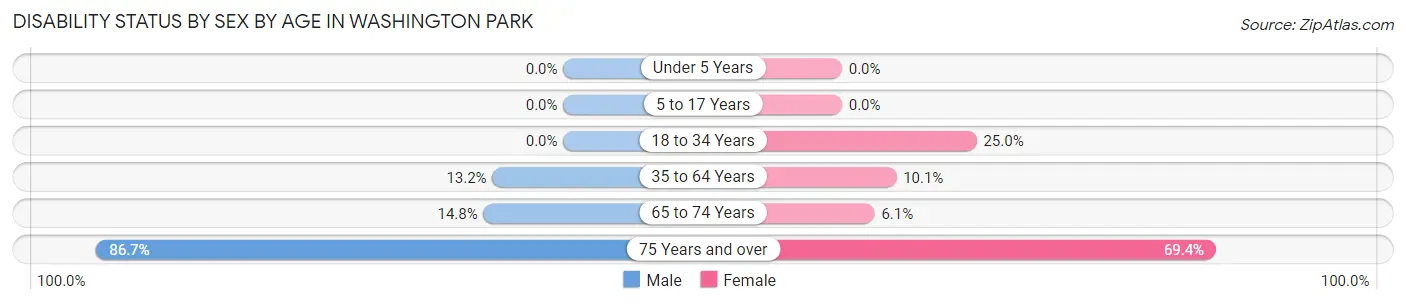
| Age Bracket | Male | Female |
| Under 5 Years | 0 (0.0%) | 0 (0.0%) |
| 5 to 17 Years | 0 (0.0%) | 0 (0.0%) |
| 18 to 34 Years | 0 (0.0%) | 4 (25.0%) |
| 35 to 64 Years | 10 (13.2%) | 10 (10.1%) |
| 65 to 74 Years | 4 (14.8%) | 2 (6.1%) |
| 75 Years and over | 39 (86.7%) | 50 (69.4%) |
Disability Class by Sex by Age in Washington Park
Disability Class: Hearing Difficulty
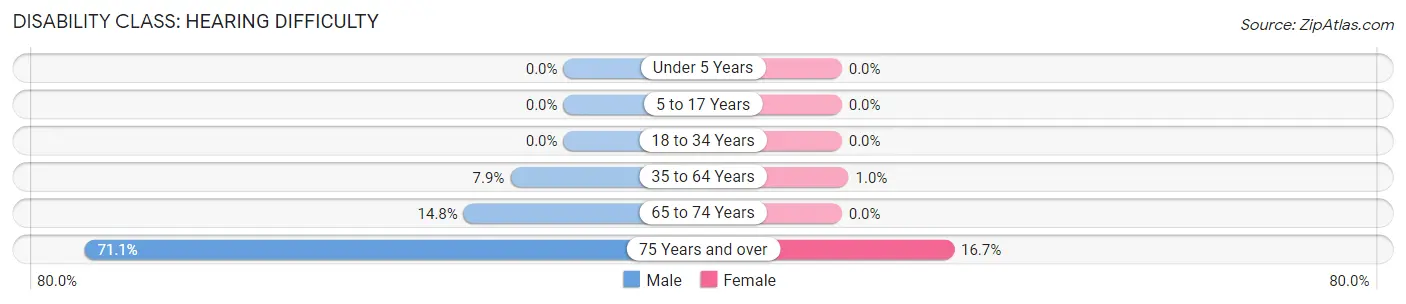
| Age Bracket | Male | Female |
| Under 5 Years | 0 (0.0%) | 0 (0.0%) |
| 5 to 17 Years | 0 (0.0%) | 0 (0.0%) |
| 18 to 34 Years | 0 (0.0%) | 0 (0.0%) |
| 35 to 64 Years | 6 (7.9%) | 1 (1.0%) |
| 65 to 74 Years | 4 (14.8%) | 0 (0.0%) |
| 75 Years and over | 32 (71.1%) | 12 (16.7%) |
Disability Class: Vision Difficulty
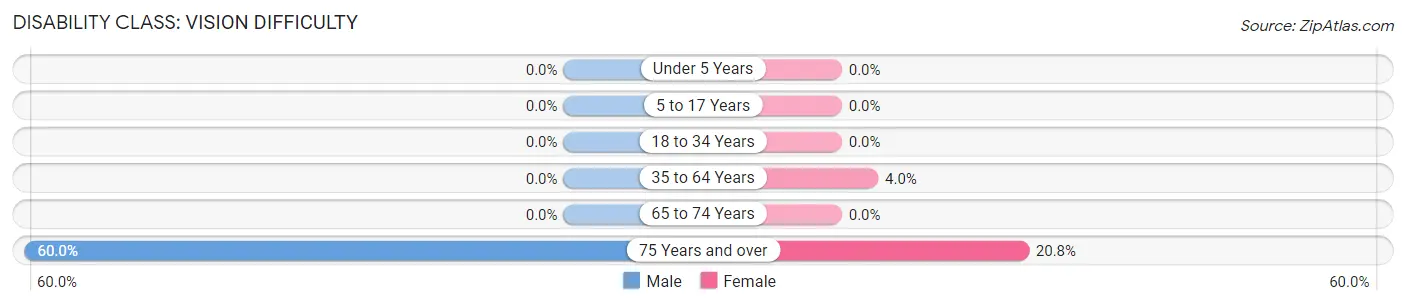
| Age Bracket | Male | Female |
| Under 5 Years | 0 (0.0%) | 0 (0.0%) |
| 5 to 17 Years | 0 (0.0%) | 0 (0.0%) |
| 18 to 34 Years | 0 (0.0%) | 0 (0.0%) |
| 35 to 64 Years | 0 (0.0%) | 4 (4.0%) |
| 65 to 74 Years | 0 (0.0%) | 0 (0.0%) |
| 75 Years and over | 27 (60.0%) | 15 (20.8%) |
Disability Class: Cognitive Difficulty
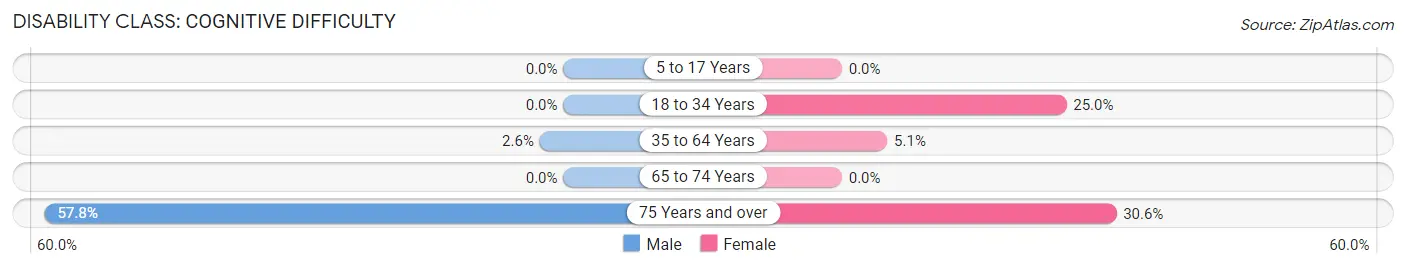
| Age Bracket | Male | Female |
| 5 to 17 Years | 0 (0.0%) | 0 (0.0%) |
| 18 to 34 Years | 0 (0.0%) | 4 (25.0%) |
| 35 to 64 Years | 2 (2.6%) | 5 (5.1%) |
| 65 to 74 Years | 0 (0.0%) | 0 (0.0%) |
| 75 Years and over | 26 (57.8%) | 22 (30.6%) |
Disability Class: Ambulatory Difficulty
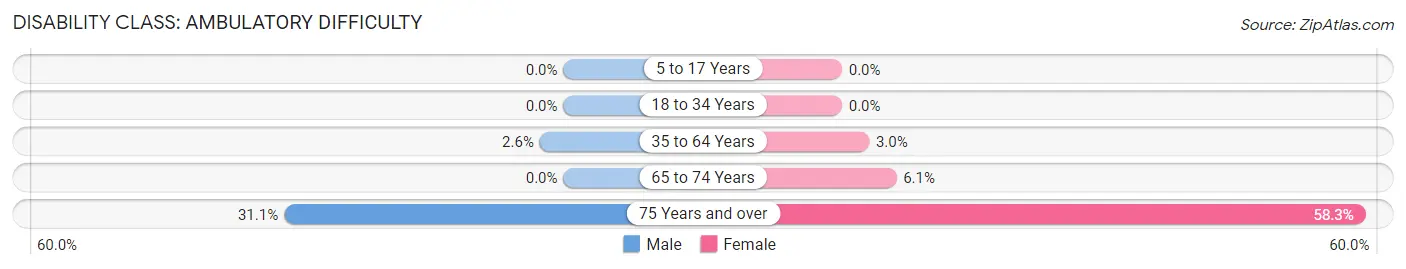
| Age Bracket | Male | Female |
| 5 to 17 Years | 0 (0.0%) | 0 (0.0%) |
| 18 to 34 Years | 0 (0.0%) | 0 (0.0%) |
| 35 to 64 Years | 2 (2.6%) | 3 (3.0%) |
| 65 to 74 Years | 0 (0.0%) | 2 (6.1%) |
| 75 Years and over | 14 (31.1%) | 42 (58.3%) |
Disability Class: Self-Care Difficulty
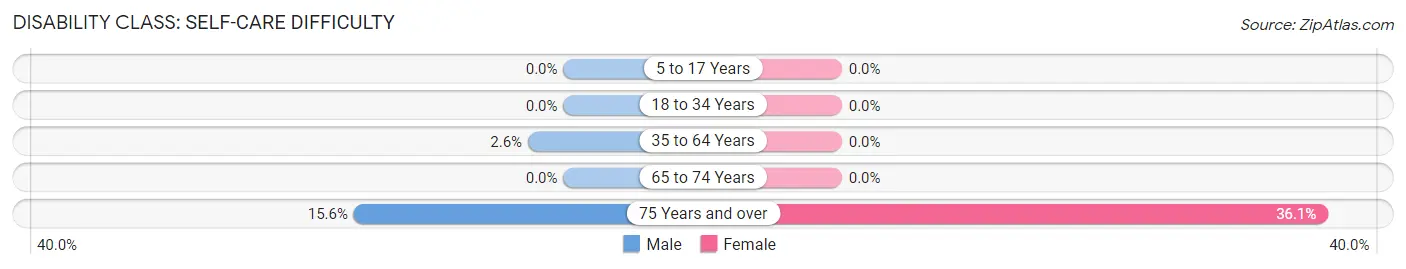
| Age Bracket | Male | Female |
| 5 to 17 Years | 0 (0.0%) | 0 (0.0%) |
| 18 to 34 Years | 0 (0.0%) | 0 (0.0%) |
| 35 to 64 Years | 2 (2.6%) | 0 (0.0%) |
| 65 to 74 Years | 0 (0.0%) | 0 (0.0%) |
| 75 Years and over | 7 (15.6%) | 26 (36.1%) |
Technology Access in Washington Park
Computing Device Access in Washington Park
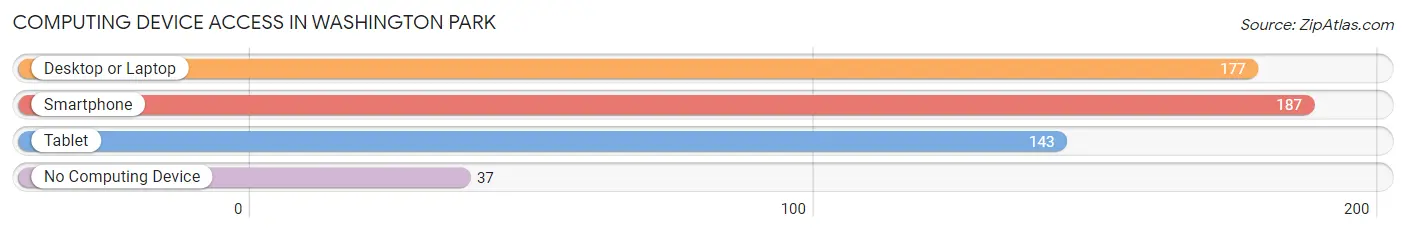
| Device Type | # Households | % Households |
| Desktop or Laptop | 177 | 75.3% |
| Smartphone | 187 | 79.6% |
| Tablet | 143 | 60.9% |
| No Computing Device | 37 | 15.7% |
| Total | 235 | 100.0% |
Internet Access in Washington Park
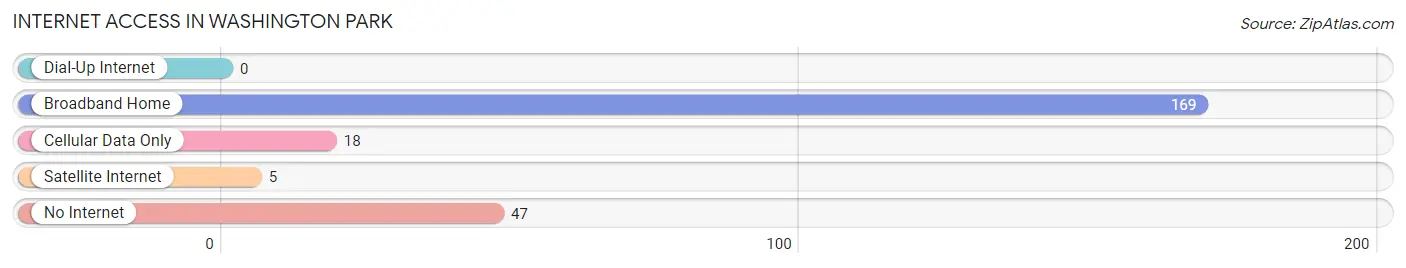
| Internet Type | # Households | % Households |
| Dial-Up Internet | 0 | 0.0% |
| Broadband Home | 169 | 71.9% |
| Cellular Data Only | 18 | 7.7% |
| Satellite Internet | 5 | 2.1% |
| No Internet | 47 | 20.0% |
| Total | 235 | 100.0% |
Washington Park Summary
Washington Park is a small unincorporated community located in the western part of North Carolina, in the foothills of the Blue Ridge Mountains. It is situated in the county of Wilkes, and is part of the North Wilkesboro Micropolitan Statistical Area. The population of Washington Park was estimated to be around 1,000 in 2020.
History
Washington Park was founded in the late 19th century by a group of settlers from the nearby town of Wilkesboro. The settlers were looking for a place to settle and farm, and they chose the area around Washington Park because of its fertile soil and abundant natural resources. The town was named after George Washington, the first president of the United States.
The town grew slowly but steadily, and by the early 20th century, it had become a thriving community. The town was home to several businesses, including a general store, a blacksmith shop, a sawmill, and a gristmill. The town also had a post office, a school, and a church.
In the early 1900s, the town was connected to the outside world by a railroad line. This allowed the town to become a popular destination for tourists, who came to enjoy the scenic beauty of the area. The town also became a popular spot for hunters and fishermen, who came to take advantage of the abundant wildlife in the area.
Geography
Washington Park is located in the foothills of the Blue Ridge Mountains, in the western part of North Carolina. The town is situated in Wilkes County, and is part of the North Wilkesboro Micropolitan Statistical Area. The town is located at an elevation of 1,400 feet above sea level.
The town is surrounded by rolling hills and lush forests. The nearby Blue Ridge Mountains provide a stunning backdrop to the town. The town is also located near several rivers and streams, including the Yadkin River, the Catawba River, and the New River.
Economy
The economy of Washington Park is largely based on agriculture and tourism. The town is home to several farms, which produce a variety of crops, including corn, soybeans, wheat, and hay. The town is also home to several wineries, which produce a variety of wines.
Tourism is also an important part of the local economy. The town is a popular destination for hikers, campers, and other outdoor enthusiasts. The town is also home to several historic sites, including the Washington Park Historic District, which is listed on the National Register of Historic Places.
Demographics
The population of Washington Park was estimated to be around 1,000 in 2020. The town is predominantly white, with around 95% of the population identifying as white. The remaining 5% of the population is made up of African Americans, Hispanics, and other ethnicities.
The median household income in Washington Park is around $35,000, which is slightly lower than the national average. The town has a poverty rate of around 15%, which is slightly higher than the national average. The town also has a high rate of unemployment, with around 10% of the population being unemployed.
Conclusion
Washington Park is a small unincorporated community located in the western part of North Carolina, in the foothills of the Blue Ridge Mountains. The town was founded in the late 19th century by a group of settlers from the nearby town of Wilkesboro. The town is surrounded by rolling hills and lush forests, and is home to several farms and wineries. The economy of Washington Park is largely based on agriculture and tourism, and the population of the town was estimated to be around 1,000 in 2020. The town is predominantly white, with around 95% of the population identifying as white. The median household income in Washington Park is around $35,000, and the town has a poverty rate of around 15%.
Common Questions
What is Per Capita Income in Washington Park?
Per Capita income in Washington Park is $45,534.
What is the Median Family Income in Washington Park?
Median Family Income in Washington Park is $104,236.
What is the Median Household income in Washington Park?
Median Household Income in Washington Park is $82,250.
What is Income or Wage Gap in Washington Park?
Income or Wage Gap in Washington Park is 11.0%.
Women in Washington Park earn 89.0 cents for every dollar earned by a man.
What is Inequality or Gini Index in Washington Park?
Inequality or Gini Index in Washington Park is 0.41.
What is the Total Population of Washington Park?
Total Population of Washington Park is 475.
What is the Total Male Population of Washington Park?
Total Male Population of Washington Park is 196.
What is the Total Female Population of Washington Park?
Total Female Population of Washington Park is 279.
What is the Ratio of Males per 100 Females in Washington Park?
There are 70.25 Males per 100 Females in Washington Park.
What is the Ratio of Females per 100 Males in Washington Park?
There are 142.35 Females per 100 Males in Washington Park.
What is the Median Population Age in Washington Park?
Median Population Age in Washington Park is 55.4 Years.
What is the Average Family Size in Washington Park
Average Family Size in Washington Park is 2.6 People.
What is the Average Household Size in Washington Park
Average Household Size in Washington Park is 2.0 People.
How Large is the Labor Force in Washington Park?
There are 207 People in the Labor Forcein in Washington Park.
What is the Percentage of People in the Labor Force in Washington Park?
51.1% of People are in the Labor Force in Washington Park.
What is the Unemployment Rate in Washington Park?
Unemployment Rate in Washington Park is 12.6%.